1. Introduction
The A large number of infections are caused by
Salmonella worldwide. The most frequent Serotypes associated with invasive disease are
S. Typhi,
S. Typhimurium and
S. Enteritidis [
1,
2]. Prevalence of insidious non-typhoidal Salmonella (iNTS) disease is as high as 227 per 100,000 cases every year. Salmonella enteric serotype Typhi (
S. Typhi), gram negative bacteria (only cause disease in man) is the predominant causative agent of Typhoid fever. Cases of 12% to 30% of untreated illness end up in the form of death. Reversion of fever can occur in about 10% of untreated people. Typhoid fever is most common in poor and undeveloped (low or middle-income) countries with rates greater than 100 per 100,000 persons per year in parts of Asia and Africa. US suffer outbreaks every year [
3]. The global burden of typhoid fever disease as estimated by WHO is 11-20 million cases annually, consequential casualties about 1,28,000-1,61,000 per year (
www.who.int/news-room/fact-sheets/detail/typhoid). The S. typhi colonized gallbladder showed an asymptomatic chronic infection. It is a fact that a typhoid toxin with a carcinogenic potential is produced by
S. typhi, that induces DNA damage and cell cycle alterations in intoxicated cells [
4]. This is also a reason to work on this bacterium as the subject of the study.
Most of the
Salmonella infections originate from contaminated water and food in hospitals. The situation has been aggravated due to increased incidents of drug resistance of
Salmonella strains towards a broad range of antibiotics.
Salmonella is resistant to a number of antibiotics viz, ampicillin, ciprofloxacin, Streptomycin, furazolidone, sulfonamides, tetracyclines and fluoroquinolones [
5,
6]. Although, two FDA approved vaccines are also available but with limited functionality. Children less than two years of age cannot be treated with these vaccines [
3], which makes children at the highest risk. Therefore, it is imperative to search for new drugs and their profound targets in bacteria which would have minimum homology and are functionally unrelated to human proteins.
One of the major components of virulence factors produced during
salmonella infection is lipopolysaccharide (LPS). LPS layer around outer membrane confers a first line of barrier to prevent entry of harmful substances like antibiotics and other small molecules into the cell [
7]. Three parts of LPS are an outermost immunodominant and highly variable repeating oligosaccharide known as the [O-antigen] which is linked to the [core oligosaccharide domain] which, in turn is anchored to outer membrane through glucosamine containing phosphorylated lipid i.e., [Lipid A]. Apart from its function as a hydrophobic membrane anchor of LPS, Lipid A is a strong human immuno-modulator bacterial endotoxin [
8]. Takayama and colleagues in 1983 elucidated the first complete chemical structure of lipid A from salmonella typhimurium [
9]. It has been observed that E.coli mutants lacking lipid A, either do not survive or are highly sensitive to antibiotics [
10]. Lipid A biosynthesis involves nine conserved enzymes and all are needed for the viability of the bacterium cell. Regulation of Lipid A biosynthetic pathway occurs at second step, catalyzed by UDP-3-O-acyl-N-acetylglucosamine deacetylase (LpxC) [
10]. LpxC is a Zn
2+ dependent metalloamidase which catalyzes the release of acetyl group from UDP-(3-O-(R-3-hydroxymyristoyl)-N-acetylglucosamine (myr- UDP- GlcN) to form UDP-(3-O-(R-3-hydroxymyristoyl))-N-glucosamine and acetate. LpxC catalyzed reaction is irreversible and therefore is a committed step in lipid A synthesis [
10,
11,
12,
13]. Consequently, LpxC has been considered significant as a drug target. Structure elucidation of LpxC from
Escherichia Coli,
Aquifex Aeolicus,
Pseudomonas Aeruginosa and
Yersinia Enterocolitica has provided the substantial understanding of catalytic site topology and catalytic mechanism of the enzyme. Structural studies have prepared the ground for designing novel inhibitors against the enzyme [
14,
15,
16,
17]. A number of LpxC small molecule inhibitors with hydroxamate moiety have been synthesized. One such hydroxamate based L-161,240 inhibitor which inhibits LpxC from
E.coli has been shown inactive against LpxC from
Pseudomonas aeruginosa. This kind of differential inhibition can be attributed to subtle structural differences of the LpxC enzymes from the two organisms [
18]. In case of
E.coli LpxC, βa-βb loop is positioned away from the catalytic site resulting in enlarged catalytic site as compared to that of
AaLpxC and
PaLpxC. Consequently, inhibitor molecule BB-78485 with bulky naphthalene groups can be accommodated in
E.coli LpxC catalytic site but not in
AaLpxC and
PaLpxC [
19]. The differences in inhibitor binding to the orthologs of LpxC in response to slight variations in their catalytic sites, necessitates structural characterization of more number of LpxC orthologs. Further, systematic Screening of library database for inhibitors and elucidation of underlying mechanism of inhibition would further enhance inhibitor design.
2. Materials and Methods
Protein preparation and structure based PLIF generation
Protein preparation and pocket finding of receptor StLpxC. The homology model of
StLpxC (which was previously prepared by us only) [
20]. was prepared using Quickprep option of MOE. This option cleans the protein, repairs any breaks or clashes and minimize the protein for further use. The binding pocket of
StLpxC was found using pocket finder option of MOE.
Known Ligand retrieval and docking with StLpxC. Compounds binding to LpxC protein are obtained from Binding database. More than 1500 compounds were obtained which are subjected to washing process to clean the geometry and rotameric conformations of these compounds. Duplicates and broken molecules were rejected. Out of all these 829 compounds having a recorded IC50 value were opt-out in a separate MOE based database with .mdp file format. 5 2D-descriptors (TPSA, SLogP, SMR, a-acc, and don-acc) were then calculated for these compounds. pIC50 (-logIC50) value was also calculated from IC50 value for better statistical distribution of activity data.
Active site identification and grid generation. Ligand binding is a crucial step to work on for the treatment of various diseases. Non-specific ligand binding may show several artifects in the body with higher toxic possibilities. The binding of ligand depends on several features such as H-bond donors and acceptors, hydro-phobic or -philic interaction, ionization, chelation of zinc atom, etc. Although LpxC is highly stable and conserved protein, in the study, we used MOE pocket finder tool to find the binding site of our homology modelled protein. The best pocket found falls with-in the agreement of the active site of the protein based on available structural data. Receptor grid was generated after selection of the active site of protein.
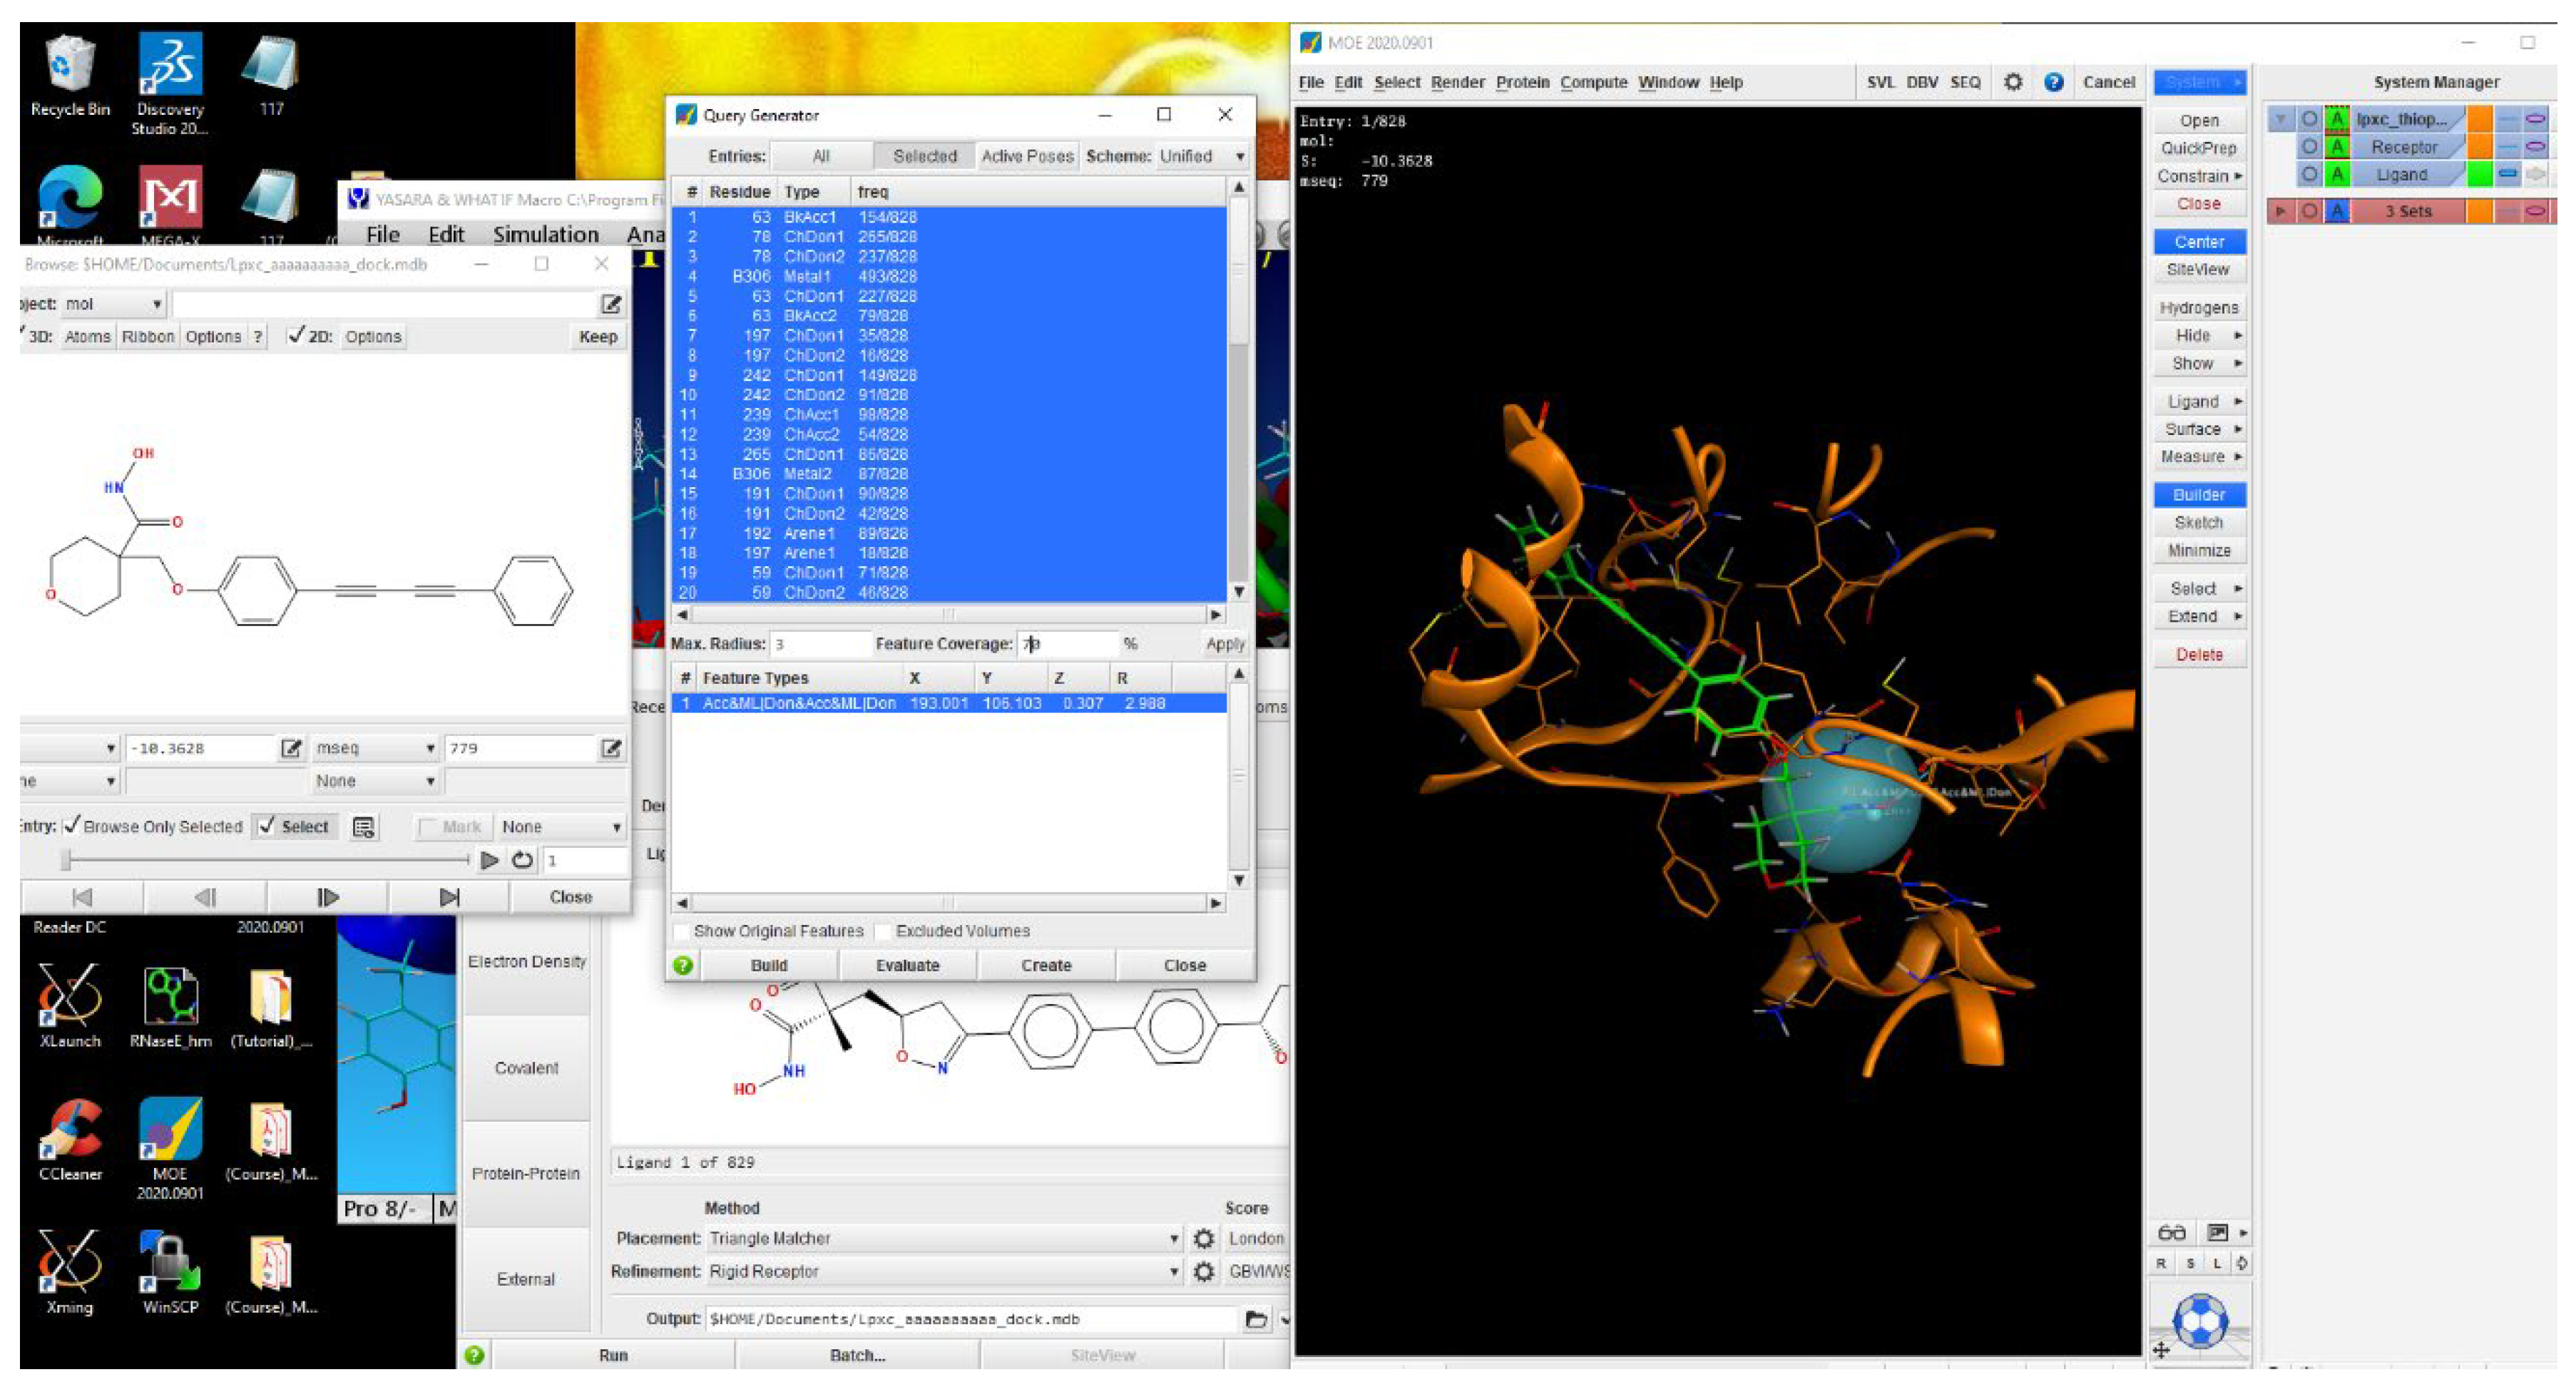
Molecular docking of known inhibitors with receptor StLpxC. Obtained 829 compounds were docked with StLpxC protein and simultaneous interaction fingerprints were generated using PLIF (protein ligand interaction fingerprints) protocol in MOE. This helped in understanding the interaction profiling of all compounds with the protein of interest. This interaction fingerprint profile was used to further develop the structure and ligand guided Pharmacophore models.
Structure and ligand guided Pharmacophore modeling and Virtual Screening
Pharmacophore modeling. Three different model schemes were prepared using PLIF profiles as obtained in previous step. Pharmacophore query generator was used to generate the pharmacophore features collectively obtained from the PLIF profile. These features were then edited in pharmacophore editor panel to add or subtract features based on our specific needs. This led to the generation of 3 different pharmacophore models to be used to virtually screen the big dataset of 693480 compounds (
Figure 1).
Dataset Generation and Pharmacophore based virtual screening. Various public drug databases are available online for free. For our study we downloaded Asinex database [
21], Natural products library from ZINC database [
22], Thiophene analogues from Pubchem [
23] and 20 compounds from the literature [
24] to make in total of 693480 compounds. This dataset is washed through MOE [
25] as the previous dataset and 3D conformers are prepared to be docked with
StLpxC. Physical and chemical properties such as 2D and 3D structure determination. Molecular weight, crystal structure, and biological application information can be also obtained of the desired compound. In the case of the desired compound, the compound having the most similar features matches the required pharmacophore features and can easily interact with our target protein. It has been chosen the possible hit compounds whose maximum features were matched to query pharmacophore. This database is used as an input file to be screened directly from the Pharmacophore search window (with drug-like or lead-like applied filters). New MOE databases of each model with each filter (total 6 databases) were formed to be analyzed later.
ADMET studies
In-built MOE toxicity prediction tool and PROTOX-II webserver [
26,
27] is used to carry forward the ADME and toxicity studies for all 103 molecules obtained after pharmacophore model assessment and validation.
Molecular Dynamics Simulations
Eight protein-ligand complexes which contained compounds passing all ADME and toxicity tests were subjected to MD simulation studies. MD simulations were performed using YASARA, version 15.10.18 [
28,
29], with the AMBER03 force field [
30]. The protein-ligand complex was placed in a water box that is 10 Å larger than each side of the protein. Hydrogen atoms were added to the protein structure at the appropriate ionizable groups according to the computed pKa in relation to the simulation pH, thus a hydrogen atom will be added if the computed pKa is higher than the pH. The pKa is computed for each residue according to the Ewald method [
31,
32]. The structure was then minimized using steepest-descent method followed by simulated annealing. The simulation was performed at pH 7.0 in a 0.9% NaCl solution at 300K temperature for 100 ns. A cut-off of 7.86 Å was used for van der Waals forces while Particle Mesh Ewald algorithm [
33] was used for electrostatic forces. A multiple time step of 1.25 and 2.5 fs was used for intra-molecular and inter-molecular forces respectively. All calculations were carried out on an Intel Core i5 2.50 GHz with 4 GB of RAM.
3. Results
Protein preparation and PLIF profile generation
LpxC binding compound database retrieval. Compounds binding to LpxC protein are obtained from Binding database (
https://www.bindingdb.org/bind/index.jsp). This includes all compounds experimentally solved with three dimensional molecular structures of LpxC proteins as recorded in PDB database [
34,
35,
36]. More than 1500 compounds were obtained which are subjected to washing process to clean the geometry and rotameric conformations of all the compounds for proper 3D-structural information. Duplicates and broken molecules were rejected. Out of all these, 829 compounds having a recorded IC50 value were opt-out in a separate MOE database with .mdp file format. Five 2D-descriptors (TPSA, SLogP, SMR, a-acc, and don-acc) were also calculated for these compounds. pIC50 (-logIC50) value was also calculated from IC50 value for better statistical distribution of activity data.
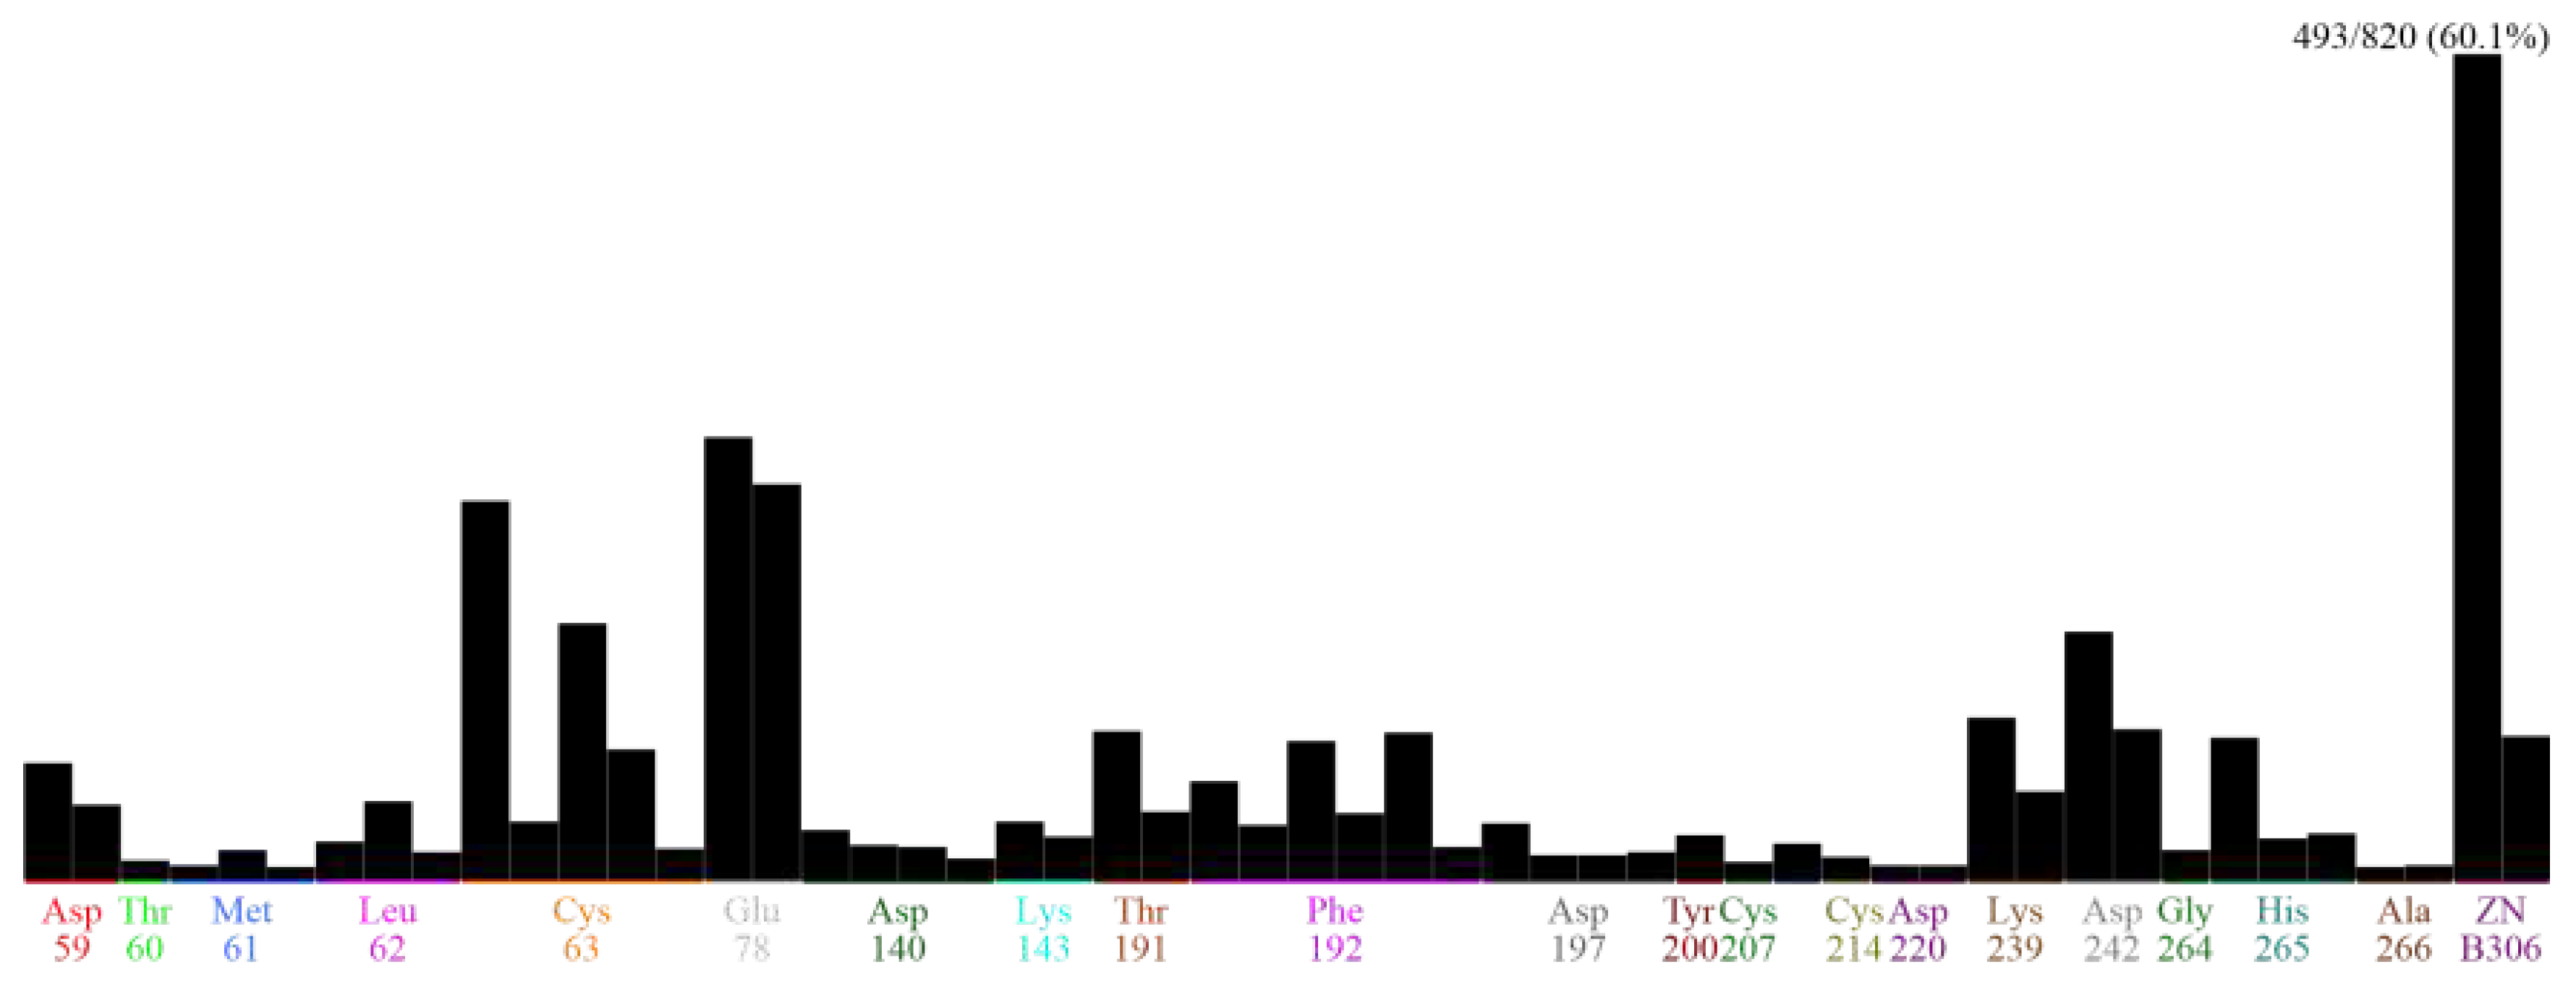
PLIF profile generation. Obtained 829 compounds were docked with StLpxC protein and simultaneous interaction fingerprints were generated using PLIF (protein ligand interaction fingerprints) protocol in MOE. Protein ligand interaction fingerprints (PLIF) profile (
Figure 2) provides the information regarding the residues of protein taking part in the interaction with various bound ligands. This profile provides overall interaction database of sites which are highly important for protein function, and which can be targeted. Apart that other sites which could also be possibly important and may be used for designing better inhibitors and lead molecules to check the protein activity. After PLIF profiling, the preparation of pharmacophore query has been performed and 3 manually curated pharmacophore models has been created.
Pharmacophore modeling and validation
Pharmacophore model Generation: Utilizing this high number of inhibitor information various features were determined by the query generation which composed of hydrophobic, hydrophilic, metal binding, ionizable groups along-with donor and acceptor features. After manual curation, 3 pharmacophore models were generated. Model 1 has total of 7 features including 1 metal binding donor-acceptor, 2 atomic features, 1 H-bond donor, 2 H-bond acceptor, and 1 aromatic ring features. Model 2 has a total of 5 features including 1 metal binding donor-acceptor, 1 atomic feature, 1 H-bond donor, 1 H-bond acceptor and 1 aromatic ring features. Model 3 has total of 4 features including 1 metal binding donor-acceptor, 1 atomic feature, 1 H-bond donor, and 1 H-bond acceptor features. Specifically, Zn metal ion binding feature is the common feature in all of them. Along-with these features 66 exclusion volume features are also present in all the 3 models. Obtained pharmacophore features generated from the protein–ligand complex is depicted that metal ion binding and hydrophobic interactions are predominantly formed with the amino acid residues of the selected protein (
Figure 3).
Pharmacophore model validation: Pharmacophore model validation substantially increased the chance of screening and developing potent molecules of high performance. Overall industry of drug design has the utmost requirement of 3D protein structure and current technology can produce high quality homology models (if experimental structures are not present). StLpxC is also a comparative homology modeled protein which composed of all the conserved qualities and energetically stable conformation. Therefore, molecular docking approach of known inhibitors (most of which are experimentally solved with crystal structures) with modeled StLpxC has performed to get the PLIF profile and the Pharmacophore models. This also provides us enough validation of activity and validation of made models (as known ligands with known IC50 values are utilized).
Dataset Generation and Pharmacophore based virtual screening. Database generation is the main part of the whole process of identification of the best lead molecule during the screening process. For this purpose Asinex database [
21], Natural products library from ZINC database [
22], Thiophene analogues from Pubchem [
23] and 20 compounds from the literature [
24] to make in total of 693480 compounds were retrieved to make the whole dataset. All three pharmacophore models were applied as guided method for the screening with lead-like and drug-like filters used to get separate files for further analysis. A total of 6 such database files were obtained after the application of all 3 models on the input dataset of compounds. These screenings were run from the pharmacophore query panel itself. We got 7 compounds with drug-like filter from Model 1, only 2 compounds with lead-like filter from Model 1, 394 compounds (using drug-like filter) from model 2, 180 compounds (using lead-like filter) from Model 2, 10990 compounds (using drug-like filter) from model 3, and 4978 compounds (using lead-like filter) from model 3. Out of all the screened compounds 103 compounds (Supplementary Table S1) with highest binding affinity were tabulated.
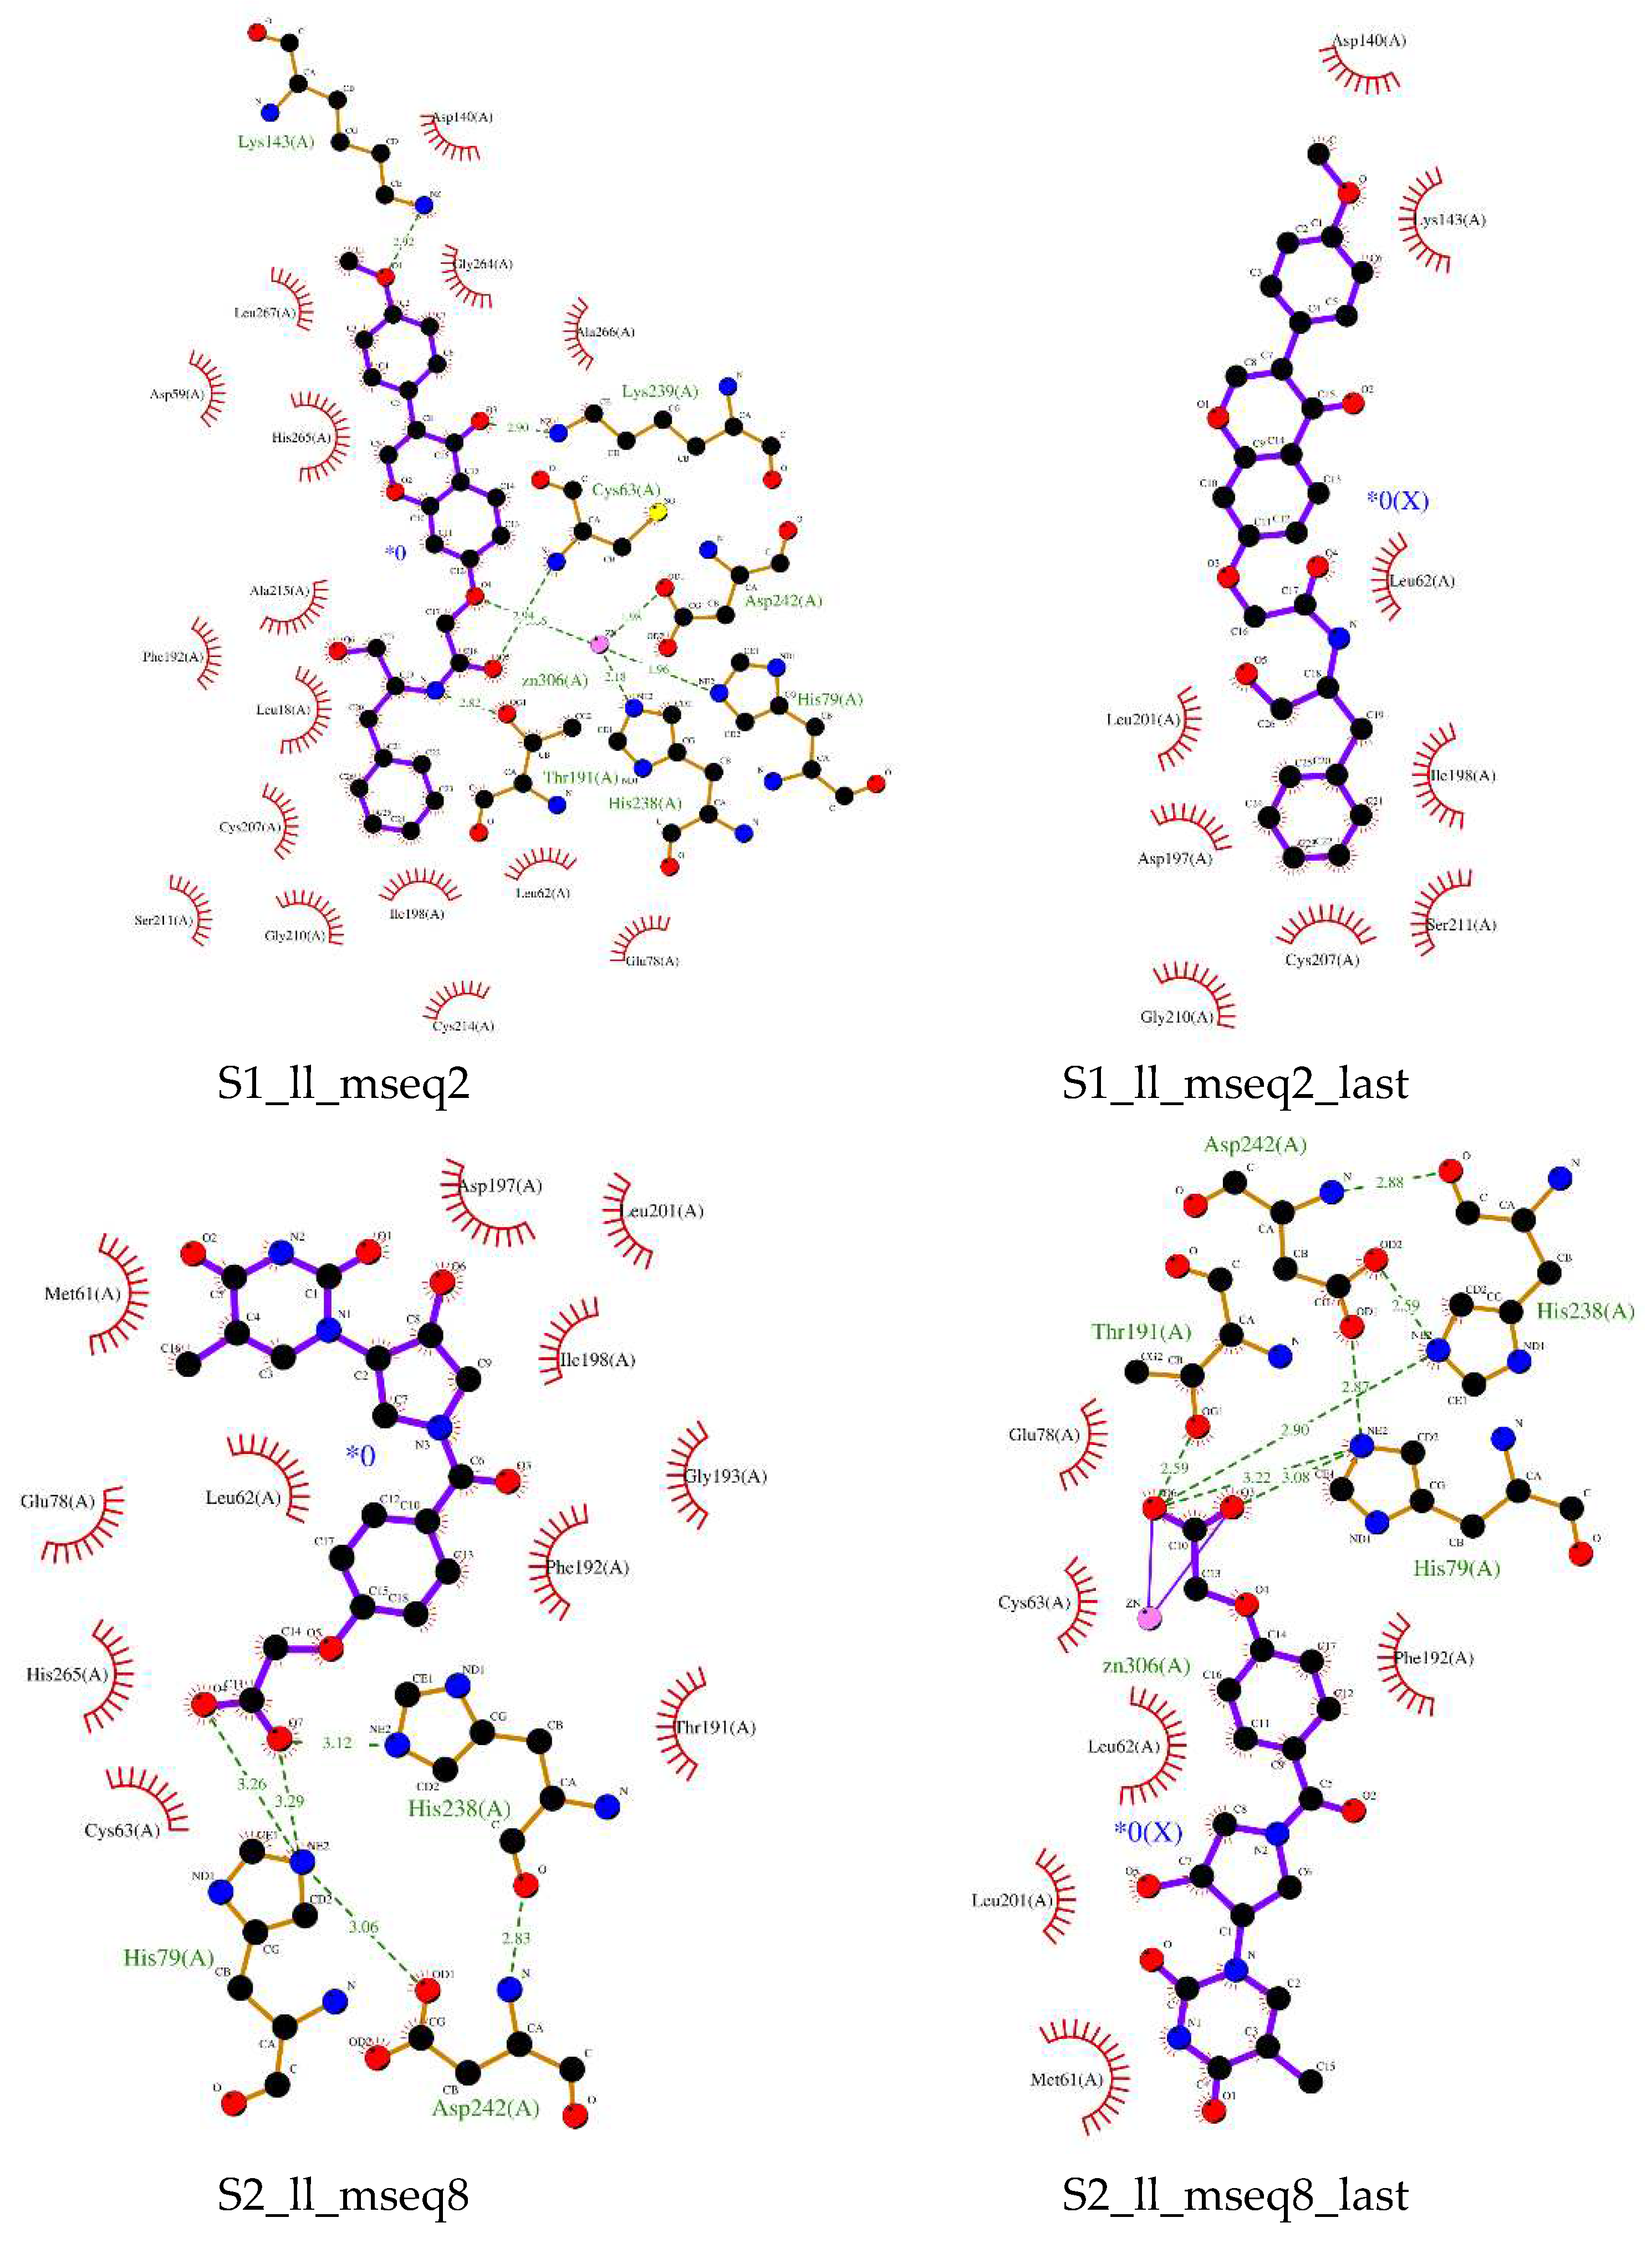
Pharmacophore based virtual screening and ADMET studies provides us 8 compounds which are non-toxic and having highest binding affinity. Compound s1_dl_mseq2 (
Figure 4 upper left) showed good binding within the active pocket of the enzyme. Apart from zinc ion it is making contacts with His265, Thr191, Phe192, Val218 and several other important residues. His163 and Zn-ion is playing role In Hydrogen bonding with the ligand. Investigation of interaction profile of LpxC and compound s1_ll_mseq2 (
Figure 4 middle left) demonstrated the active participation of Zinc ion, Thr191, Cys63, Lys239, and Lys143 in making H-bonds with the ligand. Residues like Leu18, Phe192, Ala215, His265, Gly264, Leu267, Asp140, and many more form a well-defined non-bonding network with the s1_ll_mseq2 ligand. In the case of s2_ll_mseq8 (
Figure 4 below left), His79 play a crucial role in forming two H-bonds with the ligand and His238 is forming one H-bond with a bond length of 3.12Å. Non-bonding interaction network consists of residues like His265, Glu78, Leu62, Phe192, Ile198, Asp197, Met61, Cys63, and some more. Rest protein-ligand interaction profiles can be observed in Supplementary Figures S1–S5.
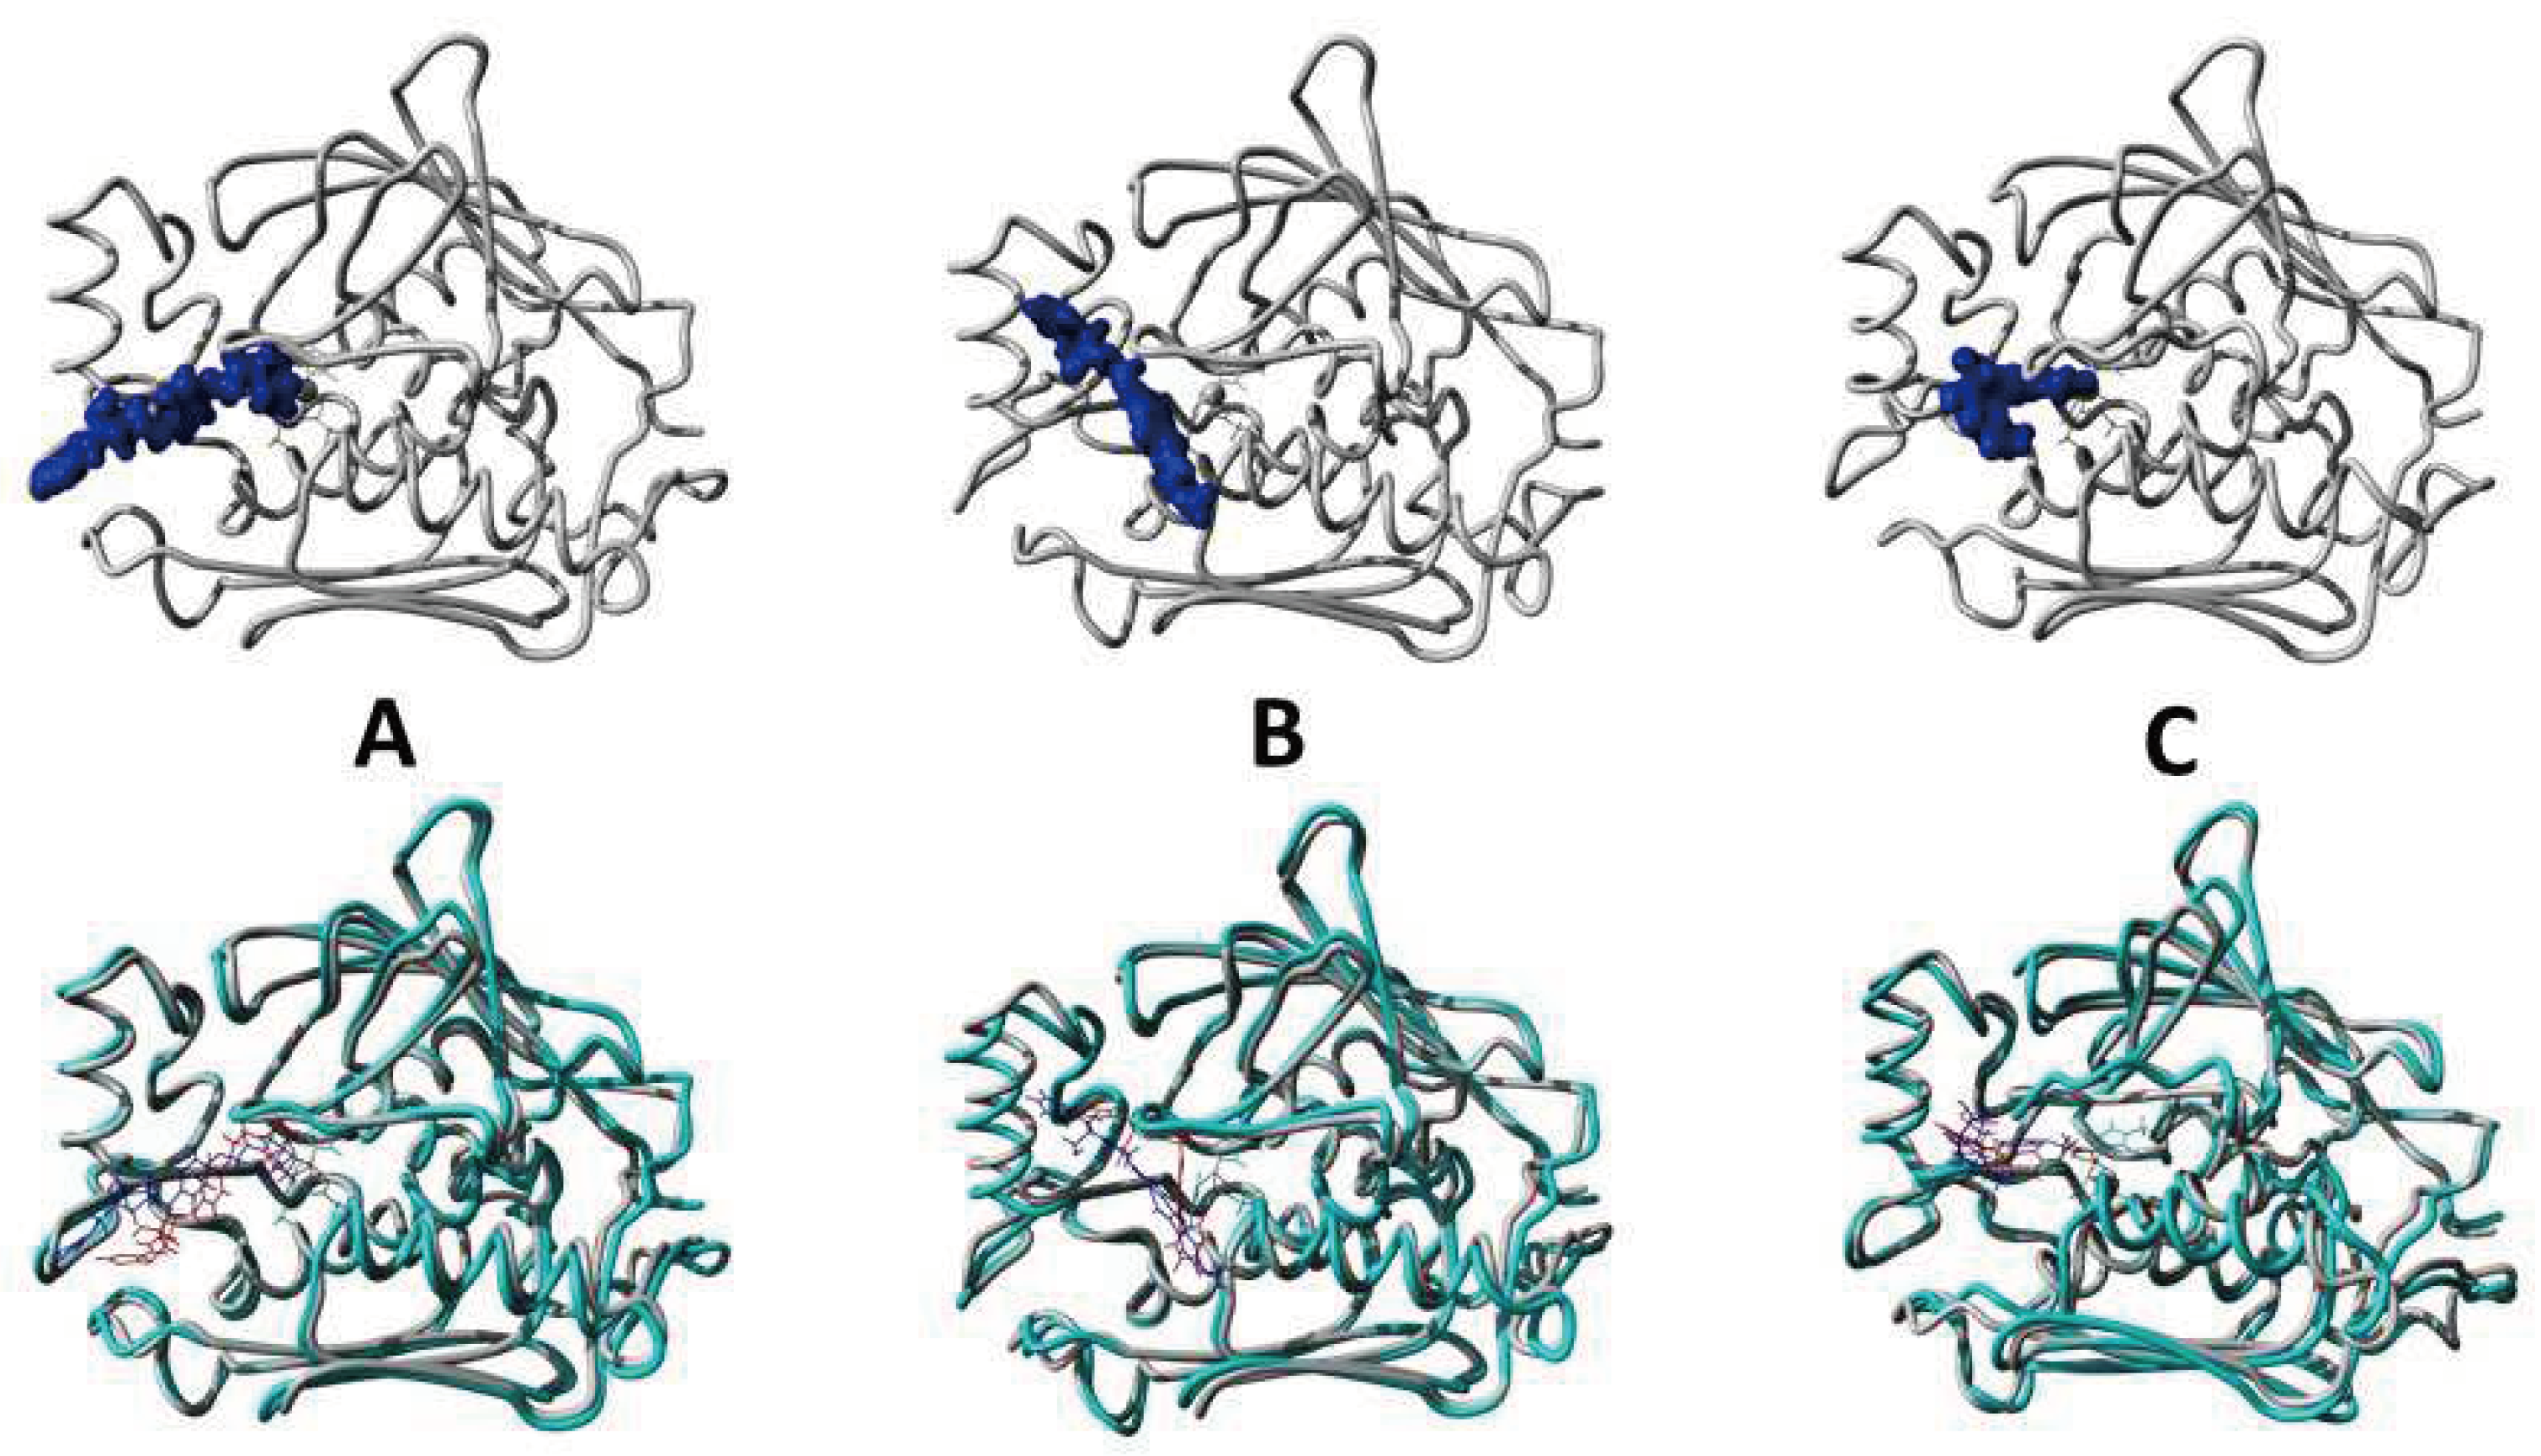
Overall findings suggested that all the selected ligands are binding in the active site of the protein but ligand s1_ll_mseq2 found to attain the position (after MD simulation) in which it is penetrating the hydrophobic channel which acts as the entry point for the substrate (
Figure 4 middle right). Attaining this position, it actually blocked the whole entry to exit path. Although it lost the polar connections with Zinc and any other atom (in present functional groups conformation), non-bonding interactions like pi-cation, pi-alkyl, amide-pi stacked and Vander wall interactions (Lys143, Gly210, Ile198, Cys63, Cys207, Ala266, Thr191, His265, Leu201, Ser211, Gly264, Leu62, etc.) make good network to stabilize the molecule within the rigid secondary structural elements of the protein. Rest other molecules largely cover the exit point of the substrate as shown in
Figure 12 and Supplementary Figure S6.
Absorption, distribution, metabolism and excretion (ADME) and toxicity test Analysis of ADME properties. After administration of the drug through any route to the human body or in the animal model, it undergoes the absorption, distribution, metabolism, excretion resulting active or passive transport to the target site [
37,
38,
39]. Interaction with the target biological macromolecules might produce desirable or undesirable pharmacological effect. Drug design is a step-by-step evaluation process and lack of this evaluation factor may become the reason for rejection of the drug, which is costly for any drug manufacturing company. The bioavailability of a drug depends on the safety and efficacy, lack of safety and efficacy are the main causes of drug failure, which are mainly, depend on the ADME properties. MOE has inbuilt ligand property calculator which provides us information about the toxicity and other water solubility and lipophilicity related information.
Out of all 103 compounds selected from pharmacophore modeling based guided screening, only 23 compounds were subjected for ADMET calculations. These 23 compounds were screened applying drug-like and lead-like filters, they are quite robust compounds having all those properties (Table 1). Computational based in-silico toxicity measurement has been widely used due to their accuracy, rapidity, accessibility, which can provide information about any synthesis or natural origin compounds. Apart that, to identify the toxicity and adverse effect of the selected compounds (if any exists) ProTox-II server [
26,
27] has also been used for further confirmation. Each software was used to evaluate several toxicological parameters such as acute toxicity, hepatotoxicity, cytotoxicity, carcinogenicity, mutagenicity, immunotoxicity, and the result was achieved based on predicted median lethal dose (LD50) in mg/kg weight (Supplementary Table S2). According to the ProTox-II server all the 8 complexes having molecules (as shown in
Figure 5) that have not shown any sort of toxicity at all are subjected for MD simulation studies.
Molecular Dynamics simulation
Out of 23 compounds subjected to ADMET calculations, only 8 compounds were able to pass all the filters and these 8 compounds were subjected to flexible and dynamical simulation studies providing the opportunity to understand the induced fit ligand interaction with the protein in due course of time. The results composed of various factors like RMSD, RMSF, SASA, Rg, etc. which support the dynamical properties of the protein-ligand complexes during the MD simulation studies. RMSD graph
Figure 6-(left) shows that most of the trajectories reached the equilibration state except for s1_dl_mseq3 and s2_dl_mseq34, which shows little fluctuations especially after 70ns simulation run. RMSF graph
Figure 6-(right) shows residue wise fluctuations during simulation run. More fluctuation suggests the important involvement of the residue maybe in ligand binding or some other structural important event.
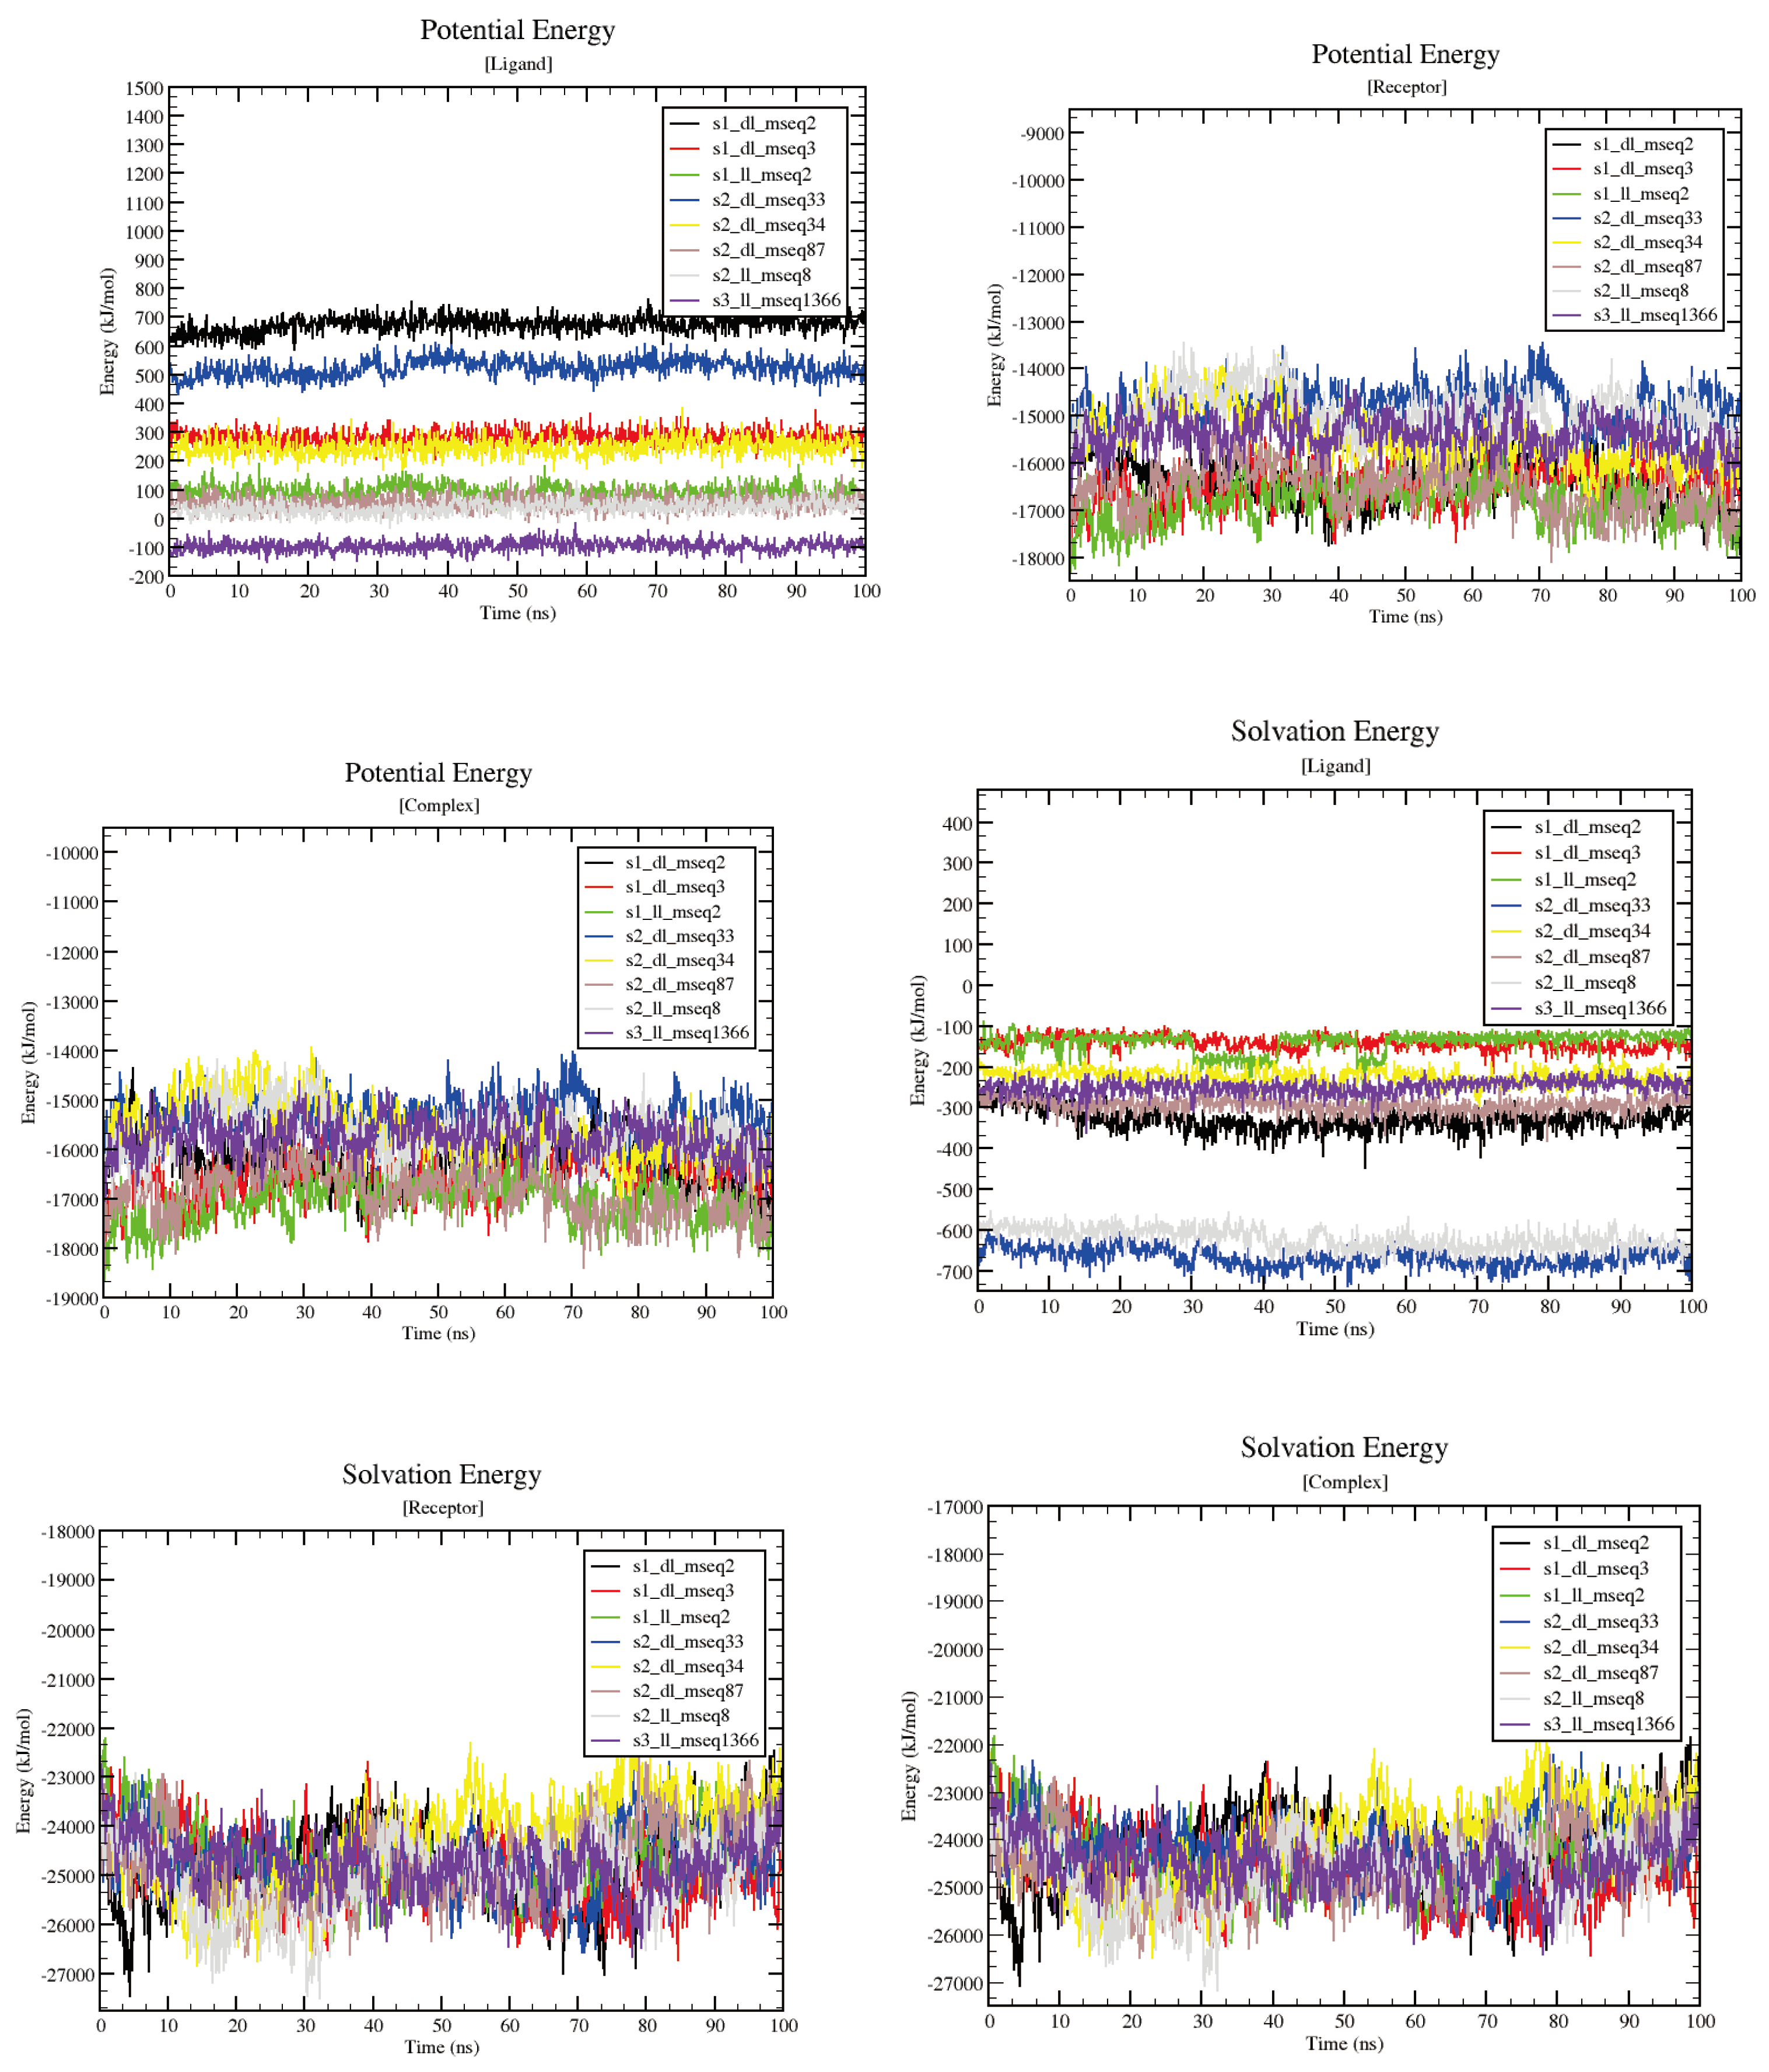
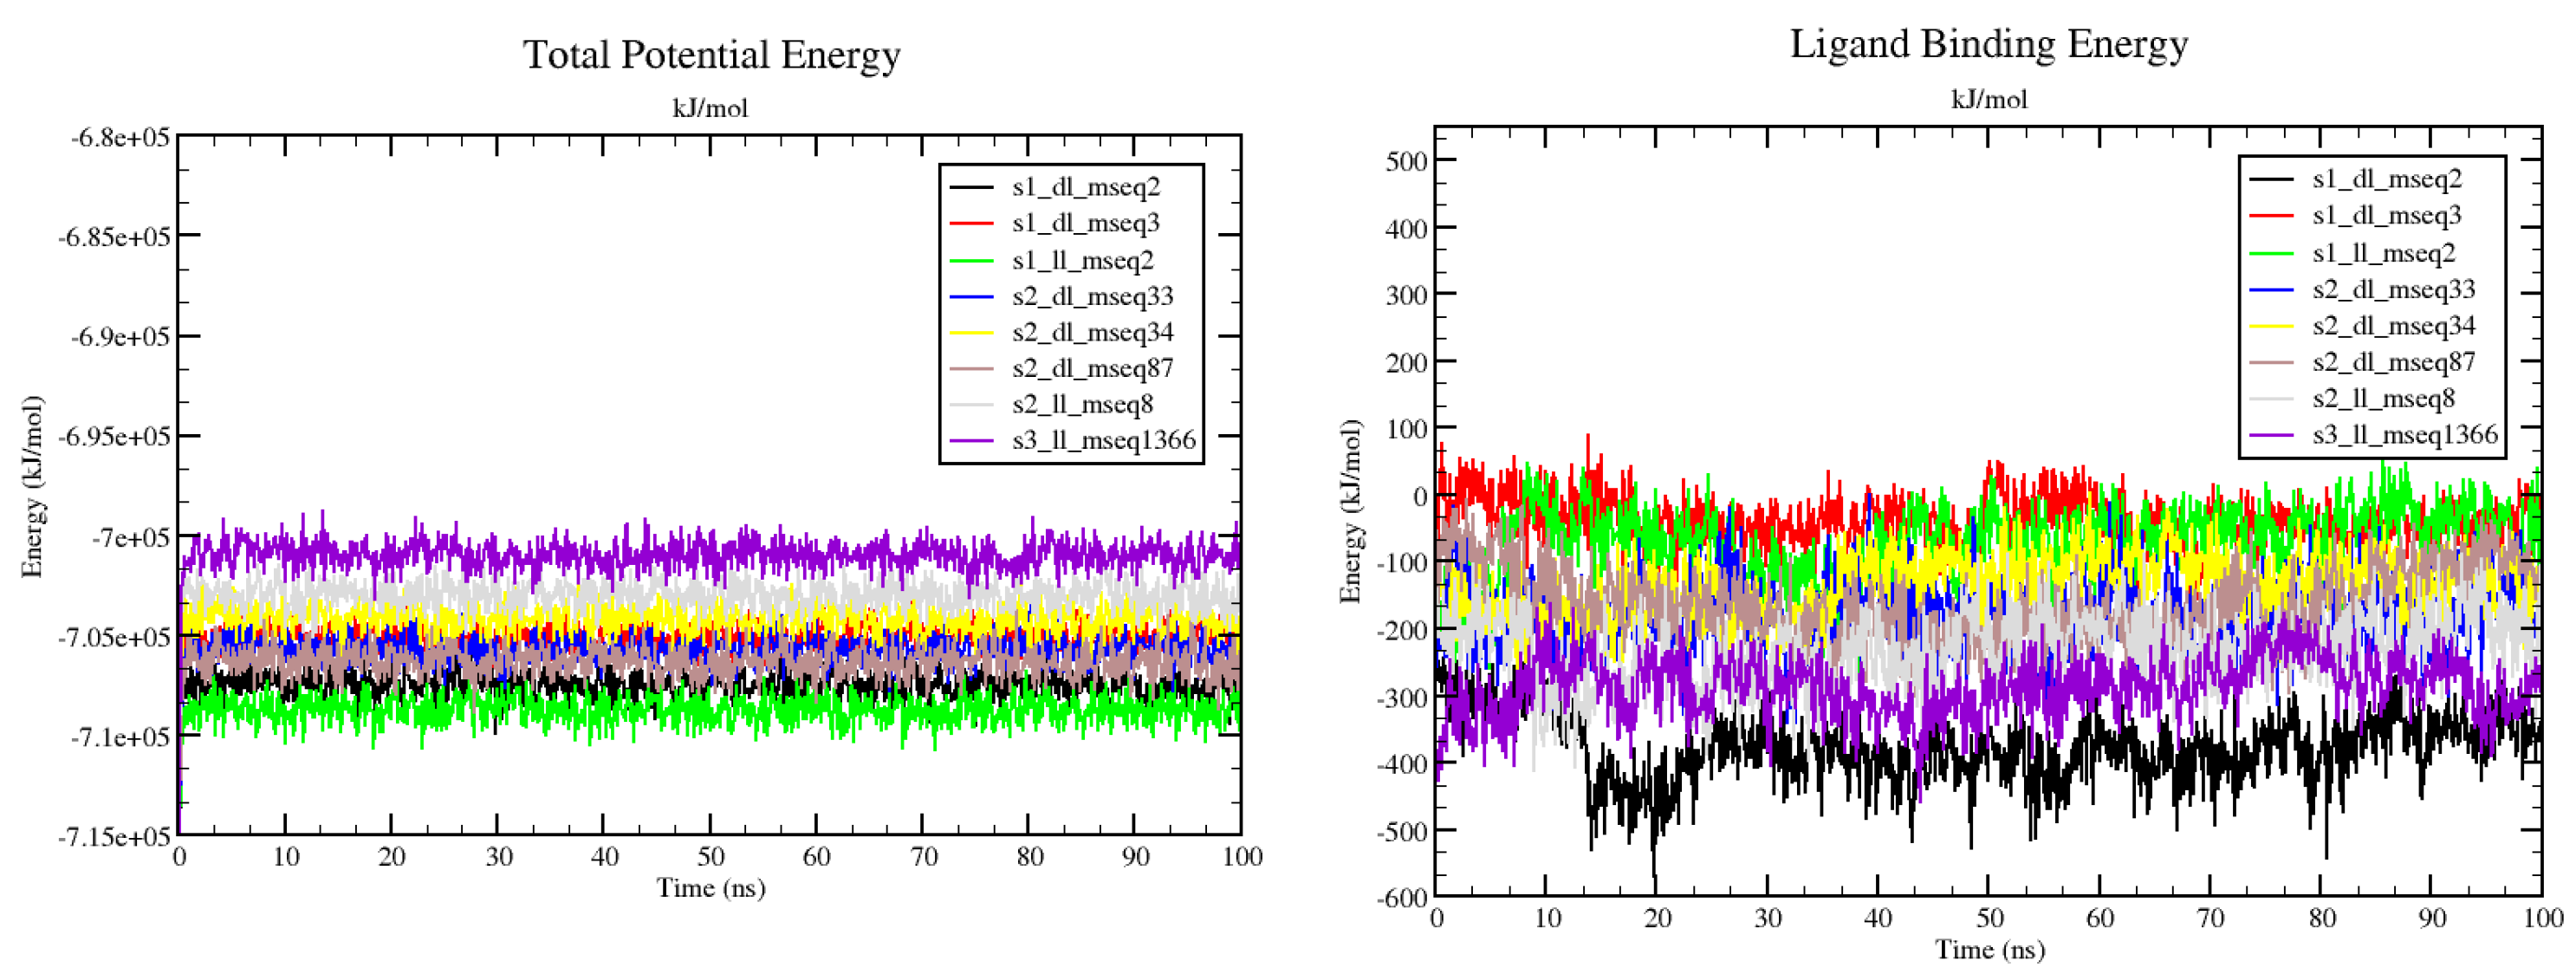
The MD simulation results based on total potential energy (which forms by combining different energy contributors like Bond, Angle, Dihedral, Planarity, Coulomb, VdW to make up the total potential energy) for all the 8 complexes suggested that upon ligand binding no significant deviations or conformational changes were taken place in the protein structure (
Figure 7-(left)). Ligand binding energy shows the affinity with ligand binds to the protein (
Figure 7-(right)). The least static ligand binding energy for the whole 100ns simulation run was demonstrated dramatically by s1_dl_mseq2 and s3_ll_mseq1366 complexes (~-400 and ~-300 kJ/mol respectively). This maybe the results of the higher potential and salvation energy components of the ligand. But if we check the overall energy comparison of potential, salvation and overall bonding energy, it is clear that s2_ll_mseq8 ligand shows optimum binding affinity throughout the simulation run which if monitored closely, suggests that it is the optimum ligand to be worked on for futuristic drug development research work.
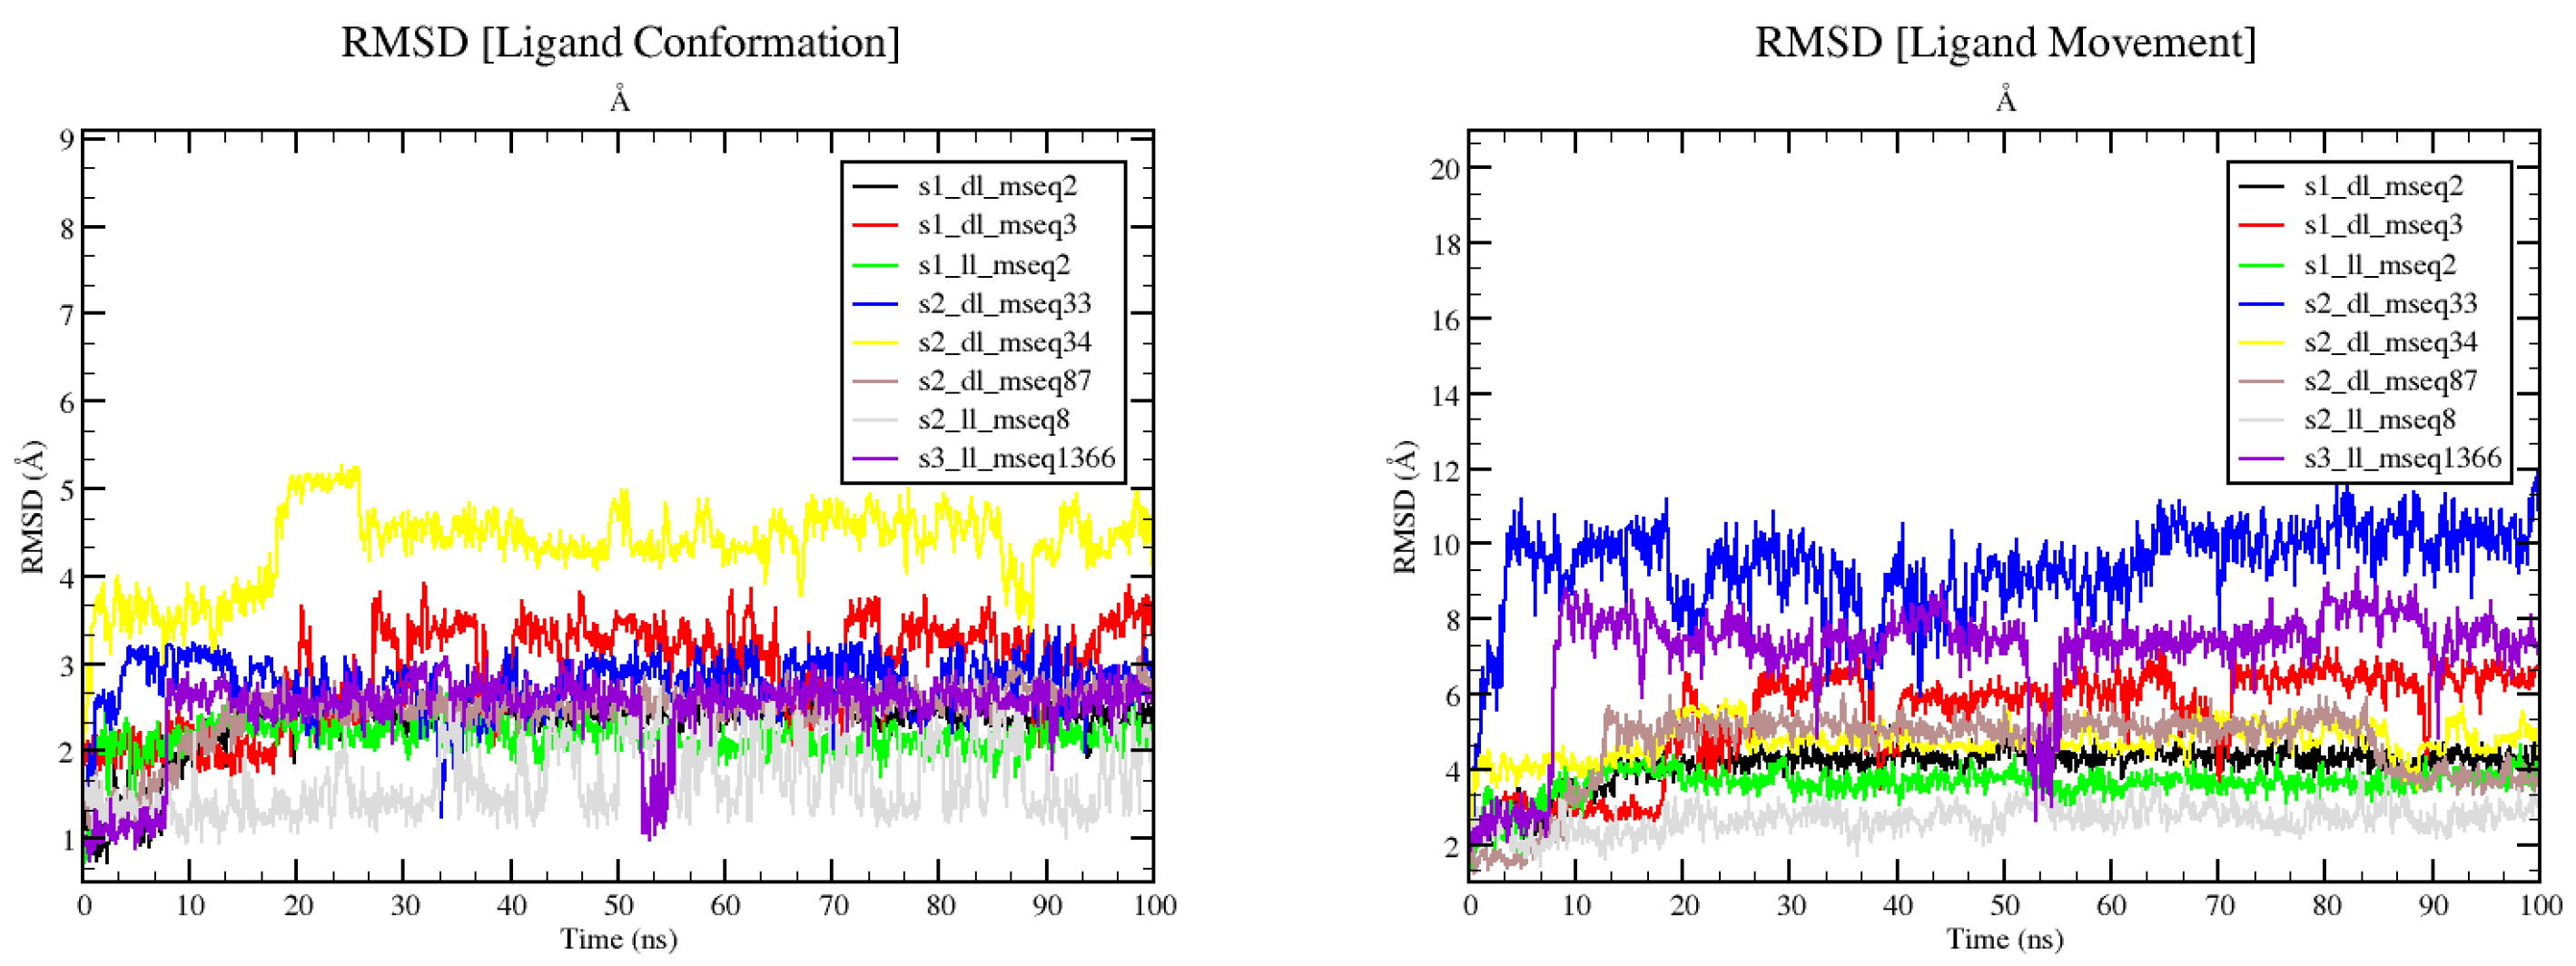
The RMSD of ligand conformation and movement, Rg fluctuations, and SASA values in their respective complexes during the period of simulation (100 ns) are presented in
Figure 8 and
Figure 9.
Figure 8 (left and right) shows the conformation and movement of ligand from its actual docked position and pose during simulation of 100ns. In the left graph ligand conformation RMSD shows s2_ll_mseq8 remains in good and static conformation without more deviation from its initial structural framework whereas s2_dl_mseq34 changed its conformation most out of all 8 compounds. As per the graph shown in right, s2_ll_mseq8, s1_dl_mseq2, and s1_ll_mseq2 ligands deviated least from their initial position and remained bounded with the protein maintaining their position within the active site. Rest other ligands are found to be outside the recommended bounded distance of 4Å suggesting lesser potent molecules. Although the conformational and movement RMSD of s1_ll_mseq2 found to be very prominent, its binding energy with the protein is weak which needs to be addressed if we choose this ligand for further drug development.
Left graph demonstrating the conformational positioning of the ligand while in contact with the protein residues, it is clear that s2_ll_mseq8, s1_ll_mseq2, and s1_dl_mseq2 are maintaining their initial pose without deviating from their mean position and conformational shape. This often suggests that binding of ligand in that particular pose is most favourable in making connections with the surrounding residues. Right graph defines the overall movement of the ligand during the course of 100ns simulation run from its initial placement. Ligands s2_ll_mseq8 along-with s1_ll_mseq2, s1_dl_mseq2 and s2_dl_mseq34 remained to be within the suggested and favoured 4Å range of active pocket residues. S1_dl_mseq3 tried to be in its original place but later moved little away from its partnering residues. Rest ligands are treated to be moved out of the binding pocket (maybe) because of less optimum binding environment.
S2_dl_mseq33 and s3_ll_mseq1366 shows unrest and making a movement outside the active cum binding pocket of
StLpxC. Rest of the ligands shows static and stable binding in the active site of the
StLpxC protein, ligands s1_dl_mseq2, s1_ll_mseq2, and s2_ll_mseq8 demonstrates their high potency to be developed into lead potent inhibitors of LpxC which may pass the clinical trials too.
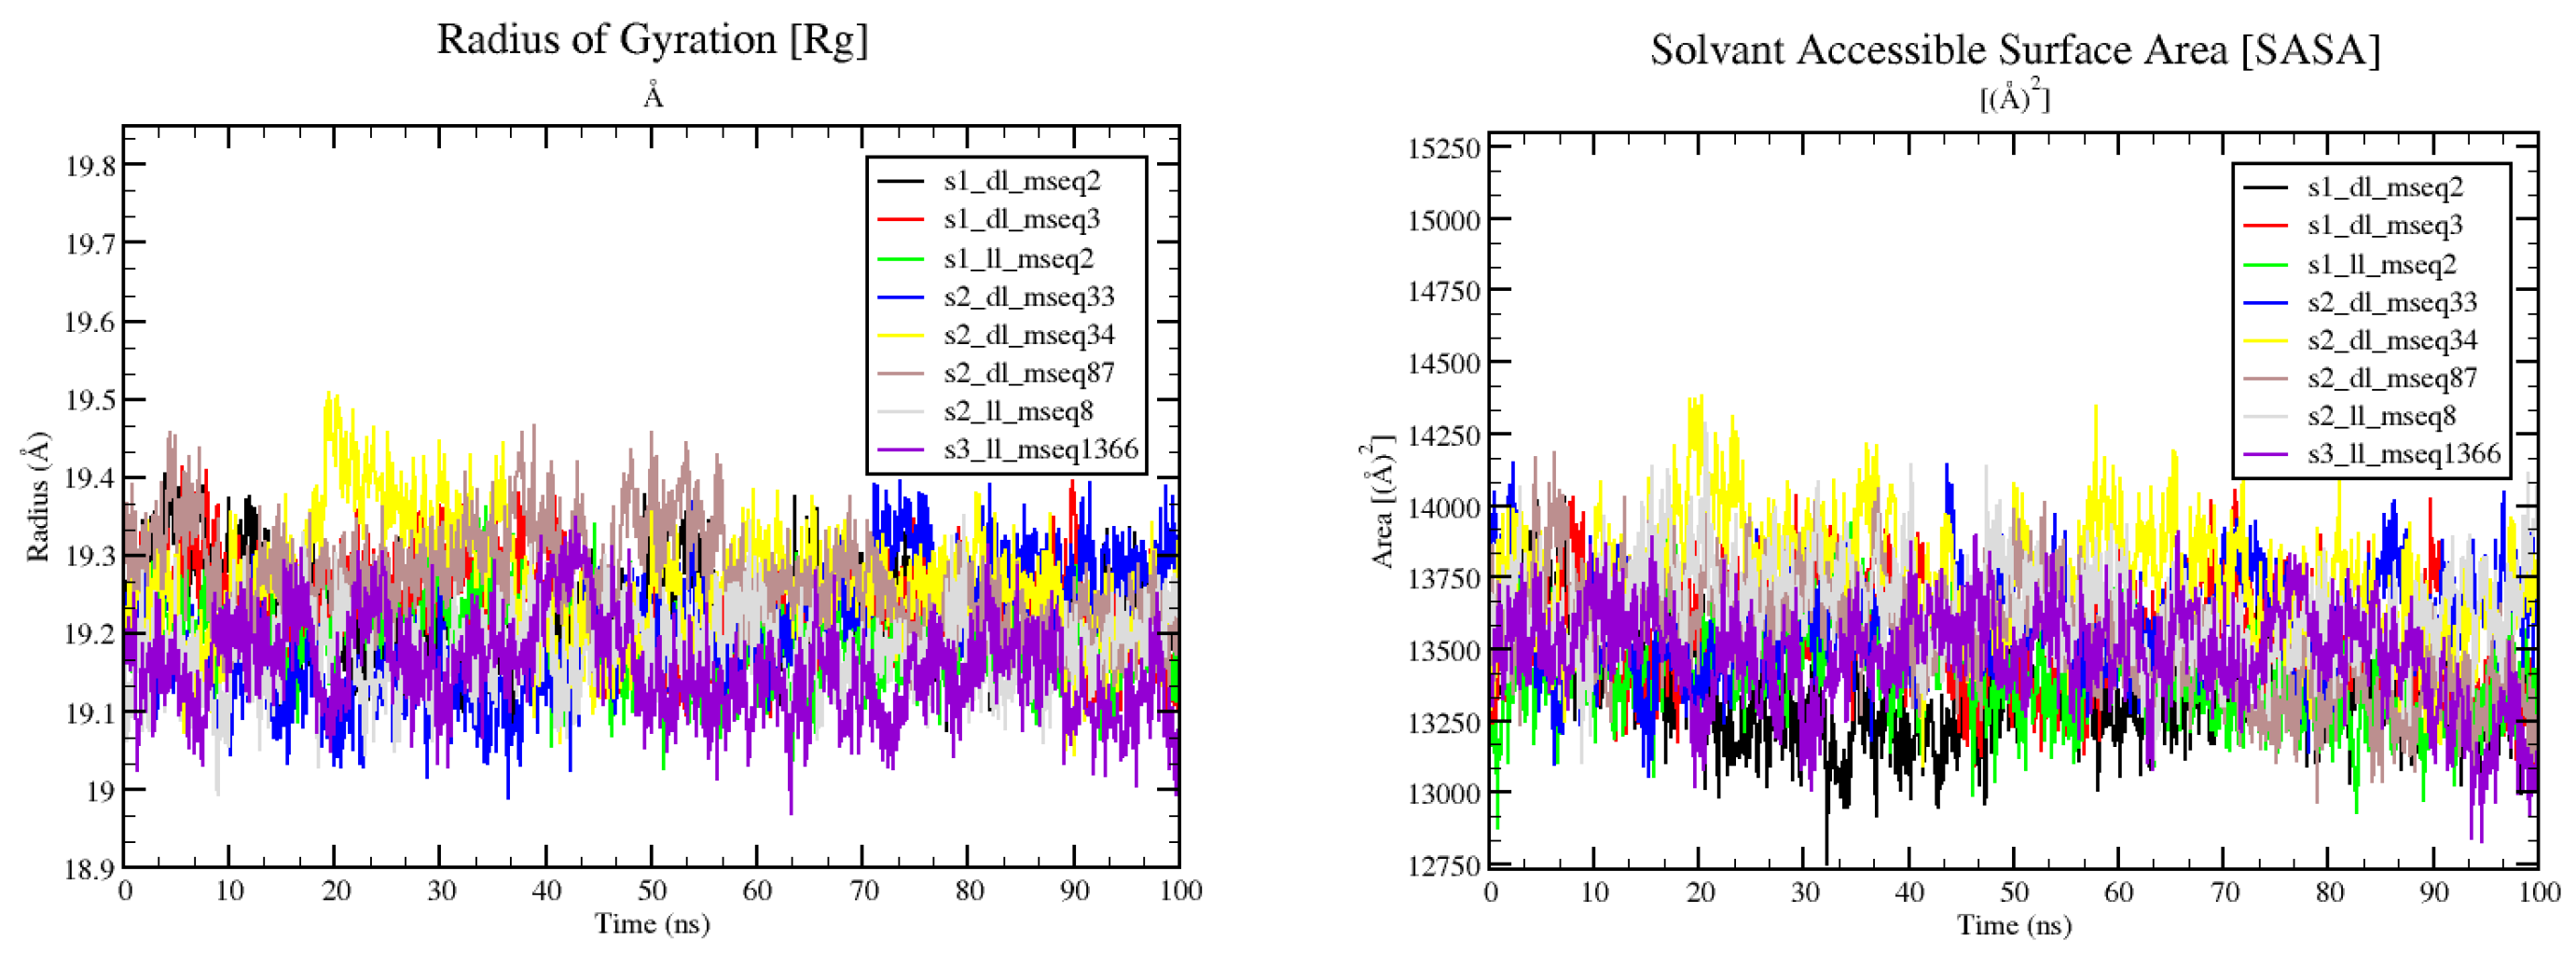
Figure 9 (left panel) shows the values for radius of gyration (Rg) of the selected protein-ligand complexes. Rg denotes the degree of compactness and rigidness of the protein. Greater Rg value indicates higher flexibility and conformation of the protein whereas lower Rg value denotes more rigidity [
40]. We can easily observe that all complexes have Rg values with-in the narrow window of 19-19.5 Å, depicting the conformational stability and rigidity. On top of that the solvent accessible surface area (SASA) plot (
Figure 9 right panel) also demonstrates the closed conformation of the protein with conserved and defined packing (even after ligand binding).
Figure 9.
Rg plot (left) and SASA plot (right) for all 8 complexes.
Figure 9.
Rg plot (left) and SASA plot (right) for all 8 complexes.
Number of H-bonds in the solute (protein-ligand complex) is the overall summation of all the possible H-bonding interactions took place inra- and inter-molecular way during the whole simulation run can be observed in
Figure 10-(left). Minimum number of H-bonds formed was found to be ~90 and maximum numbers of H-bonds formed were found to be ~266 during the whole 50ns simulation run. Similarly, in
Figure 10-(right), total number of H-bonds formed between protein-ligand complex (solute) and surrounding water and ionic cofactors (solute) were calculated. ~492 to ~585 H-bonds were found to be formed between the two.
Compound s1_dl_mseq2 (
Figure 4 upper right) showed good binding within the active pocket of the enzyme. Apart from electrostatic interaction with zinc ion it is making polar contacts with Cys63 and Asp197. His265, Thr191, Phe192, Phe194 and several other important residues interact with the ligand non-bindingly. In the case of s2_ll_mseq8 (
Figure 4 below right), most of the polar interactions lost with time. His79 played a crucial role in forming two H-bonds with the ligand as before. Especially Zinc ion interacted with the ligand via two strong electrostatic bondings. Non-bonding interaction network consisted of residues like Leu62, Phe192, Met61, Cys63, Glu78, and Leu201.
Potential energy and solvation energy graphs (which contribute to the ligand binding energy)
Figure 11 for all 8 protein-ligand complexes. Individual ligand, receptor and complex graphs were constructed for both potential and solvation energy parameters. This provides us clear idea of how individual components of the system contribute to stabilizing or destabilizing the whole system in presence and absence of ligands.
Figure 11.
Potential energy and salvation energy graphs for all 8 protein-ligand complexes. Individual ligand, receptor and complex graphs were constructed for both potential and salvation energy parameters.
Figure 11.
Potential energy and salvation energy graphs for all 8 protein-ligand complexes. Individual ligand, receptor and complex graphs were constructed for both potential and salvation energy parameters.
Figure 12.
[Upper panel] Results obtained after 100ns simulation run in the form of finally attained conformational poses of protein-ligand complexes S1_dl_mseq2 (A), S1_ll_mseq2 (B), and S2_ll_mseq8 (C). [Below panel] Pictures of aligned superimposed conformational poses obtained before and after the simulation.
As we overlay the docked and simulated poses of our selected protein-ligand complexes, we found that the Cα RMSD for both poses are in good overall stable conformations defining that protein-ligand complex and the protein itself is very stable in nature. The structural alignment between docked pose of s1_dl_mseq2 and simulated pose of s1_dl_mseq2 has a Cα RMSD of 0.859 Å. With a similar fashion, the structural alignment between docked s1_ll_mseq2 and simulated s1_ll_mseq2 has a Cα RMSD of 1.084 Å. This little hike in RMSD is because of the straightened conformation of ligand which allows it to cover the entry point hydrophobic channel of the LpxC protein. The structural alignment between docked s2_ll_mseq8 and simulated s2_ll_mseq8 has a Cα RMSD of 1.146 Å. In this case the conformation of ligand changed a lot within the exit point hydrophobic patch of the enzyme.
