
Submitted:
18 December 2023
Posted:
19 December 2023
You are already at the latest version
Abstract
Alzheimer's disease (AD) is characterized by abnormal amyloid beta (Aβ) plaques and hyperphosphorylated tau in the brain. Aβ plaques precede cognitive impairments and can be detected through amyloid-PET or in cerebrospinal fluid (CSF). Assessing the plasma Aβ42/Aβ40 ratio seems promising for non-invasive and cost-effective detection of brain Aβ accumulation. This approach involves some challenges, including the accuracy of blood-based biomarker measurements and the establishment of clear, standardized thresholds to categorize the risk of developing brain amyloid pathology. Plasma Aβ42/Aβ40 ratio was measured in 277 volunteers without dementia, 70 AD patients and 18 non-AD patients using single-molecule array. Patients (n=88) and some volunteers (n=66) were subject to evaluation of amyloid status by CSF Aβ quantification or PET analysis. Thresholds of plasma Aβ42/Aβ40 ratio were determined based on a Gaussian mixture model, a decision tree, and the Youden index. The 0.0472 threshold, the one with the highest sensitivity, was retained for general population without dementia screening, and the 0.0450 threshold was retained for research and clinical trials recruitment, aiming to minimize the need for CSF or PET analyses to identify amyloid-positive individuals. These findings offer a promising step towards a cost-effective method for identifying individuals at risk of developing AD.
Keywords:
Alzheimer’s disease 1
; plasma amyloid 2
; SIMOA 3
; plasma Aβ42/Aβ40 ratio 4
; amyloid prediction 5
; biomarkers 6
; Alzheimer’s disease screening 7
1. Introduction
Alzheimer’s disease (AD) is the most common cause of dementia [1]. AD is characterized by the abnormal accumulation of amyloid beta (Aβ) peptides in the brain, and the aggregation of hyperphosphorylated tau deposits in neurons, forming neurofibrillary tangles. Aβ peptides are naturally released in the brain by the proteolytic cleavage of the amyloid-β precursor protein (APP) [2]. In AD, there is an imbalance between production and clearance of Aβ which leads to abnormal levels of long Aβ forms (e.g. Aβ42), which aggregate to form plaques in the brain [3]. This aggregation process results in decreased Aβ42 concentrations in cerebrospinal fluid (CSF) [4]. The shorter and more abundant Aβ40 form, also produced from APP cleavage, is less prone to aggregation, and its concentration is assumed to distinguish high and low β-amyloid producers. The CSF Aβ42/Aβ40 ratio decreases in AD, and the ratio may be more relevant to the diagnosis of AD than Aβ42 or Aβ40 levels alone [5], because it normalizes the Aβ42 concentration to intra-individual Aβ production reflected by Aβ40 concentration.
Positron emission tomography (PET) imaging studies showed that Aβ plaques precede the formation of tau neurofibrillary tangles and cognitive decline [6]. Individuals with abnormal amyloid deposits and no cognitive impairment can be characterized as having preclinical AD [7]. These clinically normal individuals with abnormal amyloid deposits have a higher risk to develop cognitive decline than individuals without amyloid deposition [8]. Determining amyloid status in clinically normal individuals thus allows identification of a population at risk to develop AD. Amyloid status (positive or negative) is currently determined by measuring Aβ42 in the CSF or by PET-based radiotracers detecting amyloid deposits in the brain parenchyma. However, they widespread use is restricted because they are invasive (CSF sampling) or expensive (PET).
Blood biomarkers including Aβ measurement have recently been developed [9], thanks to novel technologies allowing protein detection in the femtomolar range, typically around or below 1 pg/ml. Indeed, concentrations of Aβ are 50–100 times lower in the plasma than in the CSF [10]. These low concentrations of plasma Aβ can now be measured with single-molecular array (SIMOA) [11,12] designed for multiplex Aβ42 - Aβ40 measurement. Because Aβ deposition in the brain is the earliest pathological signature of AD, measuring the Aβ42/Aβ40 ratio appears promising to detect AD [13], even at preclinical stages. Blood measurement of Aβ has the advantage of being minimally invasive compared to lumbar puncture, and less expensive than PET-imaging. Several studies have already shown that a decrease in the plasma Aβ42/Aβ40 ratio was an indicator of brain amyloidosis [14,15,16,17] and could predict cognitive decline [18,19]. Existing tools include mass spectrometry and SIMOA assays (Quanterix®), with SIMOA being easier to implement in clinical research settings.
Even though accurate measurement of the plasma Aβ42/Aβ40 ratio has been reported as a promising tool for the detection of early AD stages, no cut-off value of this ratio has been clearly established in the literature to define amyloid status (positive or negative). The aim of our study was to determine a threshold of the plasma Aβ42/Aβ40 ratio measured by SIMOA in order to use this plasmatic measure as a screening tool for amyloid pathology, and to identify individuals at risk to develop AD before dementia. Individuals with plasma Aβ42/Aβ40 ratios within the normal range would be characterized as free of amyloid pathology, and individuals with abnormal biomarker values would be recommended toward further confirmatory examination, including CSF biomarker assessments or PET imaging. This screening tool also holds promise for potential utilization in forthcoming treatments for AD, such as Lecanemab or Donanemab, both of which have demonstrated improved efficacy in mitigating cognitive decline in patients with prodromal AD or mild AD dementia [20,21]. The plasma Aβ42/Aβ40 ratio could be used to measure the effects of these treatments.
2. Materials and Methods
2.1. Participants
We recruited 277 volunteers in Belgium, all aged over 50 years and without known cognitive impairment, through local advertisements. In order to validate the absence of cognitive impairment, volunteers completed the Mini-Mental State Examination (MMSE) [22]. All volunteers had a MMSE ≥ 24/30 and were thus without dementia. We also enrolled 88 patients from the Memory Clinic at Saint-Luc University Hospital, all of whom had reported memory complaints during a prior consultation. Patients had been clinically diagnosed with AD (n=70) or non-AD (n=18) neurodegenerative diseases. The non-AD pathologies included: frontotemporal lobar degeneration, normal pressure hydrocephalus, microvascular disease, corticobasal degeneration, Lewy body dementia, or primary progressive aphasia.
The study was conducted in accordance with the Declaration of Helsinki and approved by the institution’s Ethical Committee. All participants provided written informed consent (UCL-2022-473; UCL-2016-121; UCL-2018-119).
All participants (volunteers and patients) undertook a blood test in which DNA and plasma were extracted. The plasma Aβ42/Aβ40 ratio was measured using SIMOA (Neurology 3 plex A, Quanterix). The genetic risk for AD was estimated by genotyping the apolipoprotein E gene (APOE).
The cohort of 88 patients, along with a subset of volunteers (n=73), also underwent CSF analysis or an amyloid PET scan for validation of their amyloid status. The final analysis included only individuals with a maximum time delay of 2 years between the blood test and PET/CSF amyloid status measurement. The blood test could have been performed before or after the PET/CSF amyloid status measurement. Participants were excluded if more than 2 years had elapsed between the two exams, unless the PET/CSF amyloid measurement was done before the blood test and gave an amyloid positive result (n=21). Since none of the individuals in our cohort received anti-amyloid therapy, those who were previously identified as amyloid-positive will continue to retain their amyloid-positive status [23]. Six individuals were excluded who had a negative CSF/PET amyloid measurement done more than 2 years before the blood test, and four were excluded who had a blood test done more than 2 years before the CSF/PET amyloid status measurement. The final sample comprised 66 volunteers, 69 AD patients, and 16 non-AD patients.
Individuals were classified as amyloid positive (Aβ+) when the CSF amyloid measurement was lower than 438 pg/ml [24], or when the amyloid PET Centiloid score was higher than 26 [25]. Otherwise, they were categorized as amyloid-negative (Aβ-). Both volunteers and patients underwent an MMSE evaluation on the same day as the blood test. They were classified as having dementia when their MMSE was below 24/30, and without dementia when MMSE was higher or equal to 24/30.
2.2. Blood drawing and plasma prepatation
A standard venipuncture procedure was performed using a 21 g needle and blood was collected in EDTA polypropylene K2 tubes (K2E K2EDTA, Vacuette Tube, REF:455045). Immediately after collection, the tube was placed on ice and plasma isolation was performed within 2h. Blood was centrifuged at 2000 × g for 10 min at 4°C, and plasma was aliquoted by 500µl in cryotubes and stored at -80°C until further analysis.
2.3. APOE genotyping
DNA was extracted from blood samples. Participants were analyzed for APOE polymorphisms rs429358 (which is a [T/C] substitution on chr19:44908684 (GRCh38.p14) of the sequence GCTGGGCGCGGACATGGAGGACGTG[T/C]GCGGCCGCCTGGTGCAGTACCGCGG), and rs7412 (which is a [C/T] substitution on chr19:44908822 of the sequence CCGCGATGCCGATGACCTGCAGAAG[C/T]GCCTGGCAGTGTACAGGCCGGGGC). Based on two single-nucleotide polymorphisms, alleles were assigned as ε2, ε3, or ε4. The APOE ε4 allele represents a major risk factor of AD [26,27,28]. We classified participants into two groups: “ε4 carriers” (ε3ε4, ε4ε4, and ε2ε4) and “ε4 noncarriers” (ε2ε2, ε2ε3 and ε3ε3); ε4 carriers have a higher risk of developing AD compared to ε4 noncarriers.
2.4. Quantification of plasma Aβ40 and Aβ42
Quantification of soluble Aβ40 and Aβ42 was performed using the Neurology Plex A kit from Quanterix (Neurology 3 Plex A, REF:101995) in strict accordance with the manufacturer’s protocol. Each plasma sample was thawed to room temperature for 1h before processing for SIMOA. The same experimenter and same duration of experiment were used for all assay runs.
2.5. CSF analysis
Aβ42 measurements in CSF were done with Lumipulse® (G β-Amyloid 1-42, REF: 230336) in the Biology Lab of the Saint-Luc University Hospital, Brussels, Belgium. Participants were classified as Aβ+ when CSF Aβ42 was below 438 pg/ml, and Aβ- otherwise [24].
2.6. Amyloid PET-CT acquisition and computing
Two amyloid PET-radiotracers were used in this study: [18F]flutemetamol and [11C]Pittsburg Compound B ([11C]PiB). An anatomical 3D-T1 MRI was acquired for each participant on a 3T MRI (GE Signa Premier).
For both radiotracers, semi-quantitative PET data were computed using PNEURO software (v4.1) (PMOD LLC Technologies, Zurich, Switzerland) following the previously developed Centiloid pipeline [25] to return a Centiloid value for each participant. A threshold of Centiloid = 26 was used to discriminate participants considered Aβ+ (Centiloid > 26) and Aβ- (Centiloid <=26). This threshold was previously shown to be the most useful for classifying patients that would progress to dementia from those who would remain clinically stable six years after PET imaging [25].
2.6.1. [18F]flutemetamol PET-CT
Ninety minutes after [18F]flutemetamol (GE Healthcare, Chicago IL) intravenous injection (target activity 185 ± 5 MBq), a 30-min list-mode PET/CT acquisition was performed on a Philips Gemini TF (Philips Healthcare, Amsterdam Netherlands). The images were reconstructed as a dynamic scan of 6 × 5 minutes frames with 2 mm isometric voxels including attenuation, scatter and decay corrections, and time-of-flight information using the manufacturer’s standard reconstruction algorithm. No partial volume correction was applied to the data.
2.6.2. [11C]PiB PET-CT
Forty minutes after [11C]PiB intravenous injection (target activity 500MBq), a 20 min list-mode PET/CT acquisition was performed on a Philips Vereos digital PET (Philips Healthcare, Amsterdam, Netherlands). Images were reconstructed in 4 x 5 minutes frames with 2 mm isometric voxels using the manufacturer’s reconstruction algorithm which includes attenuation, scatter, and decay corrections, and time-of- flight information.
2.7. Basic characteristics
2.7.1. Characteristics of volunteers and patients
Baseline characteristics were compared between volunteers and patients, using Chi-square tests for gender and APOE ε4 status, and ANOVA for age and MMSE, with posthoc t-tests and Holms correction for multiple testing where appropriate.
2.7.2. Characteristics of participants with amyloid measured through CSF or PET analysis
A subgroup of volunteers (n=66) and patients (n=85) benefited from an amyloid measurement through either amyloid PET or CSF analysis, and were classified as Aβ+ or Aβ-. The subgroup of volunteers to whom we proposed PET or CSF analysis was enriched in APOE ε4 carriers, matching the frequency of ε4 carriage observed in AD patients. We compared characteristics of Aβ+ and Aβ- individuals, using t-tests for age and MMSE, and Chi-squared tests for APOE ε4 status and gender repartition.
2.8. Statistical analysis
The threshold for plasma Aβ42/Aβ40 ratio, to classify individuals as plasmatic Aβ+ or Aβ-, was determined using three methods: an unsupervised learning method (Gaussian mixture model, GMM), a supervised learning method (decision tree), and the Youden’s index calculated on the Receiver Operating Characteristic (ROC) curve. The unsupervised method was applied to all participants, including those with no amyloid measure done using CSF or PET. The supervised method included only participants with a known amyloid status using CSF or PET. The ROC curve was estimated on individuals with a known amyloid status and without dementia. Youden’s index was calculated to maximize the sum of sensitivity and specificity. Finally, we computed the posttest probabilities resulting in a positive or negative result of the plasma measurement, with the cutoffs giving the best sensitivity or specificity for clinically normal adults aged 60 or 80.
2.8.1. Gaussian mixture model (GMM)
A GMM was applied on the distribution of the plasma Aβ42/Aβ40 ratio of all participants (277 volunteers, 70 AD patients, and 18 non-AD patients) to approximate the distribution as two gaussians. The GMM analysis was implemented in R (version 4.2.1) using the mclust package (version 6.0.0) [29]. First, outliers were removed from the plasma Aβ42/Aβ40 distribution of all participants (n=8, 2.2%). Outliers were defined according to the interquartile range (IQR) criterion; values were excluded if they fell above q0.75 + 1.5 IQR, or below q0.25 - 1.5 IQR, where q0.75 and q0.25 corresponded to first and third quartile respectively, and IQR was the difference between the third and first quartile.
The plasma Aβ42/Aβ40 distribution, without outliers, was then modeled using a two-component GMM with unequal variance, as our aim was to classify the participants into two groups (plasmatic Aβ+ or Aβ-). The threshold value of the Aβ42/Aβ40 ratio, used to categorize participants, corresponds to the point of intersection between the two Gaussian distributions. Participants with plasma Aβ42/Aβ40 ratio below the threshold were considered plasmatic Aβ+ and those with a ratio above the threshold were considered plasmatic Aβ-.
The plasmatic amyloid classification of participants was then compared across clinical diagnoses (AD, non-AD, and volunteers). Among the volunteers, plasmatic amyloid classification was also compared between ε4-carriers and noncarriers using a Chi-squared test.
We also evaluated the sensitivity and specificity of the plasma test using the 151 participants (66 volunteers, 69 AD patients, and 16 non-AD patients) for whom amyloid status was determined by PET or CSF analysis. Finally, as we were specifically interested in the ability of the plasmatic measure to determine the amyloid status of individuals before dementia, we evaluated the sensitivity and specificity of the test based only on participants without dementia (n=126) with a known amyloid status.
2.8.2. Decision tree
The 151 participants with a known amyloid status were classified by a supervised algorithm. A decision tree was trained in MATLAB using the Classification Learner app, with a maximum of one split to classify individuals as plasmatic Aβ+ or plasmatic Aβ- based on one feature: the plasma Aβ42/Aβ40 ratio. We trained the model using all data. The decision tree split nodes were based on the Gini diversity index. This decision tree provided a classification threshold. The sensitivity and specificity of this method were estimated.
Finally, sensitivity and specificity of the test were evaluated based only on individuals without dementia with a known amyloid status.
2.8.3. ROC curve
We generated the ROC curve for the 126 non-demented individuals with confirmed amyloid status. In this analysis, we exclusively considered individuals without dementia to assess the plasma Aβ42/Aβ40 ratio capability to accurately discriminate amyloid status as a screening tool among individuals before dementia. We computed the area under the curve (AUC) and its 95% confidence interval (CI). We determined the Youden’s index. We evaluated the sensitivity and specificity of test at this cutoff value.
2.8.4. Posttest probabilities
Posttest probabilities were computed at two different ages 60 and 80 years, with the likelihood ratio for two cutoff values, one giving the best sensitivity and one giving the best specificity. The prevalence of amyloid pathology in the clinically normal population at these two ages (15.8% at 60, 32.6% at 80) were used to estimate the pretest probabilities [30].
The likelihood ratio for a positive test result (LR+) was defined as the sensitivity divided by one minus the specificity (LH+ = Sn/(1-Sp)), and the likelihood ratio for a negative test result (LR-) as one minus the sensitivity divided by the specificity (LH- = (1-Sn)/Sp). Then, the pretest odds were calculated as the pretest probability divided by one minus the pretest probability. Posttest odds were obtained by multiplying the pretest odds by the likelihood ratio. Finally, posttest odds were converted into the posttest probability.
3. Results
3.1. Participants
Demographic characteristics of the participants are presented in Table 1. AD patients were significantly older than volunteers (p<0.0001) and non-AD patients (p=0.017). Age was not different between volunteers and non-AD patients. As expected, MMSE scores were higher among volunteers than AD (p<0.0001) and non-AD patients (p<0.0001); MMSE scores were also higher among non-AD patients compared to AD patients (p=0.0011). As expected, there were more ε4 carriers among AD patients than volunteers (p<0.0001), and among AD than non-AD patients (p=0.0006). Indeed, the ε4 allele of the APOE gene increases the risk to develop AD [26,27,28]. The APOE ε4 status was not different between non-AD patients and volunteers. The gender repartition was not different between groups. Among AD patients, 23 individuals had dementia; among non-AD patients, 2 individuals had dementia.
3.2. Amyloid status
Amyloid PET or CSF analysis classified 74 participants as Aβ+ and 77 participants as Aβ- (Table 2). Aβ+ individuals were significantly older than Aβ-. Gender repartition did not differ between these two groups. As expected, MMSE scores were significantly lower for Aβ+ participants than Aβ-, and there were more ε4 carriers among Aβ+ participants than Aβ-. Table 2 also shows the clinical diagnosis of participants (volunteers, AD, or non-AD patients), and the way that amyloid was measured (CSF, [18F]flutemetamol PET, or [11C]PiB).
3.3. GMM-based classification of plasma Aβ
All participants (volunteers, AD, and non-AD patients) were included in the GMM analysis, except for 8 individuals (2.2%) whose plasma Aβ42/Aβ40 values were outliers. The GMM was modeled with two components (Figure 1). The intersection of the two gaussians was localized at 0.0472; participants with a plasma Aβ42/Aβ40 ratio ≤0.0472 were classified as plasmatic Aβ+, and those with a ratio >0.0472 were classified as plasmatic Aβ-.
Using this threshold, 95.7% of AD patients were accurately categorized as plasmatic Aβ+ (Table 3), suggesting the presence of amyloid pathology. This specific threshold aligns with the 95th percentile of AD patients. Conversely, 44.4% of non-AD patients were appropriately classified as plasmatic Aβ-, suggesting the absence of amyloid pathology. Finally, 58.5 % of the volunteers were classified as plasmatic Aβ-, suggesting the absence of amyloid pathology. The true amyloid status of volunteers remains unknown, but it is possible that some volunteers would have amyloid brain deposits, corresponding to individuals with preclinical AD.
Among the volunteers who were ε4-carriers, 49.4% (41/83) were classified as plasmatic Aβ+; among the volunteers who were ε4-noncarriers 38.5% (74/192) were classified as plasmatic Aβ+. The difference in the proportion of plasmatic Aβ+ and plasmatic Aβ- volunteers was not significantly different between ε4-carriers and noncarriers (p = 0.12).
Sensitivity and specificity of the plasma Aβ42/Aβ40 ratio were evaluated using a subgroup of participants with known amyloid status. Table 4 shows the number of participants classified as plasmatic Aβ+ or plasmatic Aβ- according to their CSF or PET amyloid status, using the 0.0472 threshold, determined by GMM. Sensitivity was 87.8% and specificity was 55.8%.
Since our focus lies in ascertaining the amyloid status of individuals without documented cognitive impairment, we conducted an evaluation of the test's sensitivity and specificity for classifying participants without dementia (Table 5), using the same threshold value of 0.0472. The sensitivity was 83%, and the specificity was 57.5%.
3.4. Decision tree
A second independent method was used to determine the threshold on the plasma Aβ42/Aβ40 ratio. A decision tree with one split was trained on one feature, the plasma Aβ42/Aβ40 ratio. The threshold determined by the decision tree was 0.0465 (Figure 2) and yielded a sensitivity of 86.5% and specificity of 58.4% (Table 6).
Subsequently, individuals without dementia were analyzed to determine whether those classified as plasmatic Aβ+ were indeed Aβ+ and those classified plasmatic Aβ- were indeed Aβ- (Table 7). For participants without dementia, the threshold value of 0.0465 yielded a sensitivity of 81.1% and a specificity of 60.3%.
3.5. ROC curve
We plotted a ROC curve using only individuals without dementia for whom the amyloid status was defined by CSF or PET examination (Figure 3). The AUC was 0.728 (CI: 0.642 – 0.815). Youden’s index was calculated and corresponded to a cutoff value of 0.0450. At the Youden’s index, sensitivity was 75.4% and specificity 67.1%, for individuals without dementia.
3.6. Posttest probabilities
Two cutoff values were retained: the one giving the best sensitivity (0.0472) and the one giving the best specificity (0.0450). The posttest probabilities of having brain amyloidosis were calculated according to the plasma Aβ42/Aβ40 ratio at these two cutoff values, at two different ages (60 and 80). The prevalence of amyloid pathology among the clinically normal population was 15.8% at 60 [30], corresponding to pretest odds of 0.187. The prevalence of amyloid pathology among the clinically normal population at 80 was 32.6% [30], corresponding to pretest odds of 0.484.
The threshold determined by GMM (0.0472) gave the best sensitivity. At this threshold, among the population without dementia, the sensitivity was 83.0%, specificity was 57.5%, LH+ was 1.95, and LH- was 0.29. At 60, if the plasmatic test gave a positive result, the posttest odds was 0.365, corresponding to a posttest probability of 26.8%; if the plasmatic test gave a negative result, the posttest odds was 0.055, corresponding to a posttest probability of 5.2%. At this same threshold, at 80, a positive plasmatic test gave a posttest probability of brain amyloidosis of 48.6%, and a negative plasmatic test gave a posttest probability of 12.5%.
The Youden’s index (0.0450) gave a specificity of 67.1%, a sensitivity of 75.4%, LH+ of 2.30, and LH- of 0.36. With this threshold, at 60, if the plasmatic test gave a positive result, the posttest probability of having brain amyloidosis was 30.0%; if the plasmatic test gave a negative result, the posttest probability was 6.4%. At this same threshold, at 80, a positive plasmatic test gave a probability of brain amyloidosis of 52.6%, and a negative plasmatic test of 15.0%.
4. Discussion
The present study confirmed that plasmatic measures of Aβ are useful for predicting cerebral Aβ deposition [12,15,17,31,32], as measured using either CSF or PET analysis. SIMOA is a promising technique, easier to implement and with a better throughput for measurement over a wider sample range than mass spectrometry. However, biomarker concentration values alone are of limited use for classifying individuals in a cohort and predicting their clinical status, as no clear threshold was available in the literature. The aim of this work was to determine a threshold to classify participants as amyloid positive or negative based on the plasma Aβ42/Aβ40 ratio obtained by SIMOA [14]. We determined two different thresholds, according to the context in which the plasmatic test would be used. The first threshold, which minimizes false negatives, is intended to be used as an AD exclusion tool; the second, which maximizes accuracy, is intended to be used to improve research enrollment in AD studies.
In this study, a threshold of 0.0472 was used for the plasma Aβ42/Aβ40 ratio measured by SIMOA, with the specific aim of applying it as a screening test to exclude an AD diagnosis in clinical practice. This threshold yielded the best sensitivity (83.0%), and a specificity of 57.5%, when tested on adults without dementia. This threshold corresponds to the 95th percentile among AD patients. In clinical conditions, the selection of a cutoff value should prioritize sensitivity because missing any diagnosis is undesirable. The blood test would be the first examination performed, and more specific examinations would be ordered only if necessary. A sensitivity of 83.0% would reassure individuals with a negative plasma test that they are not at risk for developing AD. This threshold allows to decrease the probability of having brain amyloid deposit in case of negative result to 5% at 60, and to 12% at 80. Therefore, in case of negative blood test result, individuals can be reassured in the sixties, and quite reassured in the eighties. Conversely, the low specificity means that specific assessments, such as amyloid-PET scans or CSF analysis, will be necessary follow-up for positive cases.
The threshold of 0.0450, obtained by the Youden’s index, improved specificity to 67.1% but reduced sensitivity to 75.4%. It gave the best accuracy. A threshold with higher specificity could be useful for research applications, especially for enrollment in AD studies. It could be used to classify a large cohort of individuals without requiring PET imaging or CSF analysis. It could also be a helpful inclusion criterion in clinical trials studying amyloid in early stages of AD. Such prescreening for clinical trials recruitment would reduce the cost of clinical studies. To include one amyloid-positive individual aged 60 years old, an average of 6.3 amyloid-PET scans or CSF analyses are required given the known prevalence of amyloid positivity at this age in the general population (15.8%) [30]. In practice, using PET-scan for screening is not recommended. With the availability of a prescreening blood test, the frequency of amyloid-PET scans or CSF analyses could be substantially reduced by limiting the use of these examinations to at-risk individuals. Adults aged 60 years old with a positive blood test defined by our criteria have a 26.8% probability of cerebral amyloid deposit. Therefore, if we aim to recruit one amyloid-positive individual aged 60 years old in a clinical trial, we need to realize 3.73 PET amyloid-PET scans (or CSF analyses) among individuals with a positive blood test, which is half the number required without blood test (6.3 PET/CSF analysis).
The present findings expanded previous results on plasma amyloid measurements [12,15,17,32], and defined thresholds for the plasma Aβ42/Aβ40 ratio measured by SIMOA. Other authors have reported correlation between PET or CSF amyloid status and the plasma Aβ42/Aβ40 ratio measured by SIMOA [12,14,33]. Verberk et al. showed that the plasma Aβ42/Aβ40 ratio could serve as a prescreening test of AD pathology, and that a lower plasma Aβ42/Aβ40 ratio was associated with an increased risk of clinical progression to mild cognitive impairment or dementia [12]. These studies found that the best cutoff values to predict amyloid status varied from 0.038 [33] to 0.056 [34], without consensus. They focused on clinically unimpaired individuals as in our study. However, participants’ mean age was higher than the present cohort in two of the studies (mean age: 77) [33,34] and younger than our cohort in one study (mean age: 61) [12]. Additional studies investigating the effect of age on plasma Aβ42/Aβ40 ratio should be carried out in the future. Our results confirmed a cutoff value between 0.038 and 0.056 on an independent cohort and extended it to a general population without dementia aged over 50. We retained a threshold of 0.0472 for exclusion of AD, and a threshold of 0.0450 for research applications.
A previous study evaluated plasma biomarkers measured by SIMOA against brain autopsy [35]. The plasma Aβ42/Aβ40 ratio decreased with brain amyloid deposits, but with only modest accuracy (AUC = 0.60). Immunoprecipitation followed by spectrometry analysis also allowed to measure the plasma Aβ42/Aβ40 ratio, and gave better sensitivity and specificity (AUC = 0.75–0.89) than immunoassays for plasma [13,15,31,33,36,37,38,39]. Although mass spectrometry could appear as future gold standard, some hurdles remain for its implementation as a routine technique in comparison to SIMOA.
The present study evaluated plasma Aβ42/Aβ40 ratio, but not other AD blood biomarkers such as total-tau or neurofilament light chains, as our aim was to have a measure the brain amyloidosis. Blood-based biomarkers of phosphorylated tau (p-tau231, p-tau181, and p-tau217) have recently become available on SIMOA. P-tau181 and p-tau231 showed good accuracy for predicting AD-related neuropathological changes, but it may reflect different brain processes, such as soluble tau pathology, and/or neural damage [35]. Plasma p-tau231 has been shown to increase at early stages of AD but recent studies showed that p-tau217 better captures the earliest cerebral changes related to AD [40]. Prior studies have also shown a relationship between plasma p-tau181 and amyloid PET, even in clinically unimpaired participants [35,41,42]. Plasma p-tau181 could be an accurate predictor of AD [41]. However, only the Aβ42/Aβ40 ratio relates purely to brain amyloidosis without considering tau pathology. Given our objective to predict brain amyloidosis rather than brain tauopathy in AD, our focus was solely on quantifying plasma amyloid levels. The associations between Aβ and p-tau measured in plasma require further evaluation in future studies.
Not all plasma amyloid peptides come from the central nervous system, which could explain the limited ability of observing AD-related Aβ pathology in plasma. The key components of Aβ-processing pathways are expressed in diverse extracerebral tissues, including the pancreas, appendix, gastrointestinal tract, and both male and female reproductive organs [43]. This suggests a potential peripheral Aβ production. Furthermore, compelling evidence links Aβ with the vascular system: higher plasma levels of Aβ have been associated with cerebral white matter lesions, cerebral microbleeds, hypertension, diabetes, and ischemic heart disease [14]. Aβ is also synthesized by the skeletal muscles, platelets, and vascular walls [44]. In addition, plasma proteins such as immunoglobulins, albumin, and complement are known to bind to and mask Aβ peptides [45]. Plasma Aβ is excreted by the kidneys, meaning that its level will rise in cases of renal dysfunction [46]. All these parameters influencing amyloid in plasma could explain the challenges in achieving high specificity and sensitivity in blood-based amyloid tests.
One limitation of the present study is that the thresholds it defines were established in participants older than 50. Because amyloid pathology is rare before age 50 [47], we do not recommend to test individuals for plasmatic amyloid before this age. Furthermore, aging has been reported to increase plasma Aβ in both humans [46], and nonhuman primates [48]. Additional studies are needed to determine a threshold for the plasma amyloid level on a population younger than 50 years old, and to evaluate whether the threshold should be adapted according to age.
Another limitation is that amyloid status was confirmed using two different methods, PET and CSF analysis. Although it would have been more consistent to use a single reference technique, it would have restricted the number of participants eligible for the study. Finally, Aβ40 concentration was not measured in the CSF of our participants, in accordance with hospital protocols at the recruitment site. Given that the CSF Aβ42/Aβ40 ratio enhances the accuracy of AD diagnosis by adjusting Aβ42 values based on whether the patient is a high or low amyloid producer (with a high or low quantity of Aβ40) [5], the absence of this measurement in our study may contribute to the fact that some patients received a clinical diagnosis of AD while being classified as Aβ- in CSF assessments.
5. Conclusions
The present findings build upon and refine previous work on plasma amyloid measurements. More specifically, this study established two plasma Aβ42/Aβ40 ratio thresholds measured by SIMOA, evaluated on a population without dementia aged over 50. The first threshold was 0.0472, offering higher sensitivity to minimize the risk of missing AD cases. In cases with positive results, individuals would benefit from additional exams such as PET or CSF analysis to confirm their amyloid status. The second threshold, 0.0450, may be more suitable for research and clinical trial recruitment to streamline processes and reduce costs. The significance of this threshold lies in its potential to facilitate early detection of amyloid pathology. These findings offer a promising step towards more accessible and cost-effective methods for identifying individuals at risk of developing AD, with potential implications for early intervention and clinical trial recruitment.
Author Contributions
Conceptualization, L.C. and E.B.; methodology, L.C. and E.B.; software, L.C..; formal analysis, E.B., T.G., R.L. and K.S.; investigation, L.C., E.B., B.H., and A.I.; resources, B.H., P.K.C, and P.L.; data curation, L.C.; writing—original draft preparation, L.C. and E.B.; writing—review and editing, L.C., E.B., P.K.C, P.L., and B.H.; visualization, L.C. and E.B; supervision, B.H., P.K.C, and P.L.; funding acquisition, B.H. All authors have read and agreed to the published version of the manuscript.
Funding
L.C. was funded by Belgian Fund for Scientific Research (FNRS), grant number No. ASP40001844. B.H. was funded by FNRS, grant number CCL40010417, and by the FRFS-WELBIO, grant number 40010035. E.B was funded by Fondation Louvain and Fondation St Luc. P.K.C was funded by Queen Elisabeth Medical Foundation (FMRE AlzHex), F.R.S.-FNRS (FNRS J.0106.22), SAO-FRA Alzheimer Research Foundation (SAO-FRA 2018/0025) and UCLouvain Action de Recherche Concertée (ARC21/26-114).
Institutional Review Board Statement
The study was conducted in accordance with the Declaration of Helsinki, and approved by the Institutional Ethics Committee of Clinics Saint-Luc University Hospital (UCL-2022-473; UCL-2016-121; UCL-2018-119).
Informed Consent Statement
Informed consent was obtained from all subjects involved in the study.
Data Availability Statement
All data collected in the context of this study will be made available in an anonymized form upon the publication of the article.
Acknowledgments
We thank all participants and the Stichting Alzheimer Onderzoek for their help in our study. We thank Esther Paître and Daniela Savina for their technical supports.
Conflicts of Interest
The authors declare no conflict of interest.
References
- Hebert, L.E.; Weuve, J.; Scherr, P.A.; Evans, D.A. Alzheimer Disease in the United States (2010-2050) Estimated Using the 2010 Census. Neurology 2013, 80, 1778–1783. [Google Scholar] [CrossRef]
- Hardy, J.A.; Higgins, G.A. Alzheimer’s Disease: The Amyloid Cascade Hypothesis. Science 1992, 256, 184–185. [Google Scholar] [CrossRef]
- Mawuenyega, K.G.; Sigurdson, W.; Ovod, V.; Munsell, L.; Kasten, T.; Morris, J.C.; Yarasheski, K.E.; Bateman, R.J. Decreased Clearance of CNS β-Amyloid in Alzheimer’s Disease. Science 2010, 330, 1774. [Google Scholar] [CrossRef]
- Andreasen, N.; Hesse, C.; Davidsson, P.; Minthon, L.; Wallin, A.; Winblad, B.; Vanderstichele, H.; Vanmechelen, E.; Blennow, K. Cerebrospinal Fluid 2-Amyloid(1-42) in Alzheimer Disease: Differences Between Early- and Late-Onset Alzheimer Disease and Stability During the Course of Disease. ARCH NEUROL 1999, 56. [Google Scholar] [CrossRef] [PubMed]
- Wiltfang, J.; Esselmann, H.; Bibl, M.; Hüll, M.; Hampel, H.; Kessler, H.; Frölich, L.; Schröder, J.; Peters, O.; Jessen, F.; et al. Amyloid β Peptide Ratio 42/40 but Not Aβ42 Correlates with phospho-Tau in Patients with Low- and high-CSF Aβ40 Load. Journal of Neurochemistry 2007, 101, 1053–1059. [Google Scholar] [CrossRef] [PubMed]
- Hanseeuw, B.J.; Betensky, R.A.; Jacobs, H.I.L.; Schultz, A.P.; Sepulcre, J.; Becker, J.A.; Cosio, D.M.O.; Farrell, M.; Quiroz, Y.T.; Mormino, E.C.; et al. Association of Amyloid and Tau With Cognition in Preclinical Alzheimer Disease: A Longitudinal Study. JAMA Neurol 2019, 76, 915. [Google Scholar] [CrossRef] [PubMed]
- Jack, C.R.; Bennett, D.A.; Blennow, K.; Carrillo, M.C.; Dunn, B.; Haeberlein, S.B.; Holtzman, D.M.; Jagust, W.; Jessen, F.; Karlawish, J.; et al. NIA-AA Research Framework: Toward a Biological Definition of Alzheimer’s Disease. Alzheimer’s & Dementia 2018, 14, 535–562. [Google Scholar] [CrossRef] [PubMed]
- Donohue, M.C.; Sperling, R.A.; Petersen, R.; Sun, C.-K.; Weiner, M.W.; Aisen, P.S. for the Alzheimer’s Disease Neuroimaging Initiative Association Between Elevated Brain Amyloid and Subsequent Cognitive Decline Among Cognitively Normal Persons. JAMA 2017, 317, 2305. [Google Scholar] [CrossRef]
- Park, S.A.; Jang, Y.J.; Kim, M.K.; Lee, S.M.; Moon, S.Y. Promising Blood Biomarkers for Clinical Use in Alzheimer’s Disease: A Focused Update. J Clin Neurol 2022, 18, 401. [Google Scholar] [CrossRef]
- Bateman, R.J.; Munsell, L.Y.; Morris, J.C.; Swarm, R.; Yarasheski, K.E.; Holtzman, D.M. Human Amyloid-β Synthesis and Clearance Rates as Measured in Cerebrospinal Fluid in Vivo. Nat Med 2006, 12, 856–861. [Google Scholar] [CrossRef]
- Rissin, D.M.; Kan, C.W.; Campbell, T.G.; Howes, S.C.; Fournier, D.R.; Song, L.; Piech, T.; Patel, P.P.; Chang, L.; Rivnak, A.J.; et al. Single-Molecule Enzyme-Linked Immunosorbent Assay Detects Serum Proteins at Subfemtomolar Concentrations. Nat Biotechnol 2010, 28, 595–599. [Google Scholar] [CrossRef]
- Verberk, I.M.W.; Slot, R.E.; Verfaillie, S.C.J.; Heijst, H.; Prins, N.D.; van Berckel, B.N.M.; Scheltens, P.; Teunissen, C.E.; van der Flier, W.M. Plasma Amyloid as Prescreener for the Earliest A Lzheimer Pathological Changes. Ann Neurol. 2018, 84, 648–658. [Google Scholar] [CrossRef] [PubMed]
- Cheng, L.; Li, W.; Chen, Y.; Lin, Y.; Wang, B.; Guo, Q.; Miao, Y. Plasma Aβ as a Biomarker for Predicting Aβ-PET Status in Alzheimer’s Disease: a Systematic Review with Meta-Analysis. J Neurol Neurosurg Psychiatry 2022, 93, 513–520. [Google Scholar] [CrossRef]
- Janelidze, S.; Stomrud, E.; Palmqvist, S.; Zetterberg, H.; van Westen, D.; Jeromin, A.; Song, L.; Hanlon, D.; Tan Hehir, C.A.; Baker, D.; et al. Plasma β-Amyloid in Alzheimer’s Disease and Vascular Disease. Sci Rep 2016, 6, 26801. [Google Scholar] [CrossRef] [PubMed]
- Nakamura, A.; Kaneko, N.; Villemagne, V.L.; Kato, T.; Doecke, J.; Doré, V.; Fowler, C.; Li, Q.-X.; Martins, R.; Rowe, C.; et al. High Performance Plasma Amyloid-β Biomarkers for Alzheimer’s Disease. Nature 2018, 554, 249–254. [Google Scholar] [CrossRef] [PubMed]
- Ovod, V.; Ramsey, K.N.; Mawuenyega, K.G.; Bollinger, J.G.; Hicks, T.; Schneider, T.; Sullivan, M.; Paumier, K.; Holtzman, D.M.; Morris, J.C.; et al. Amyloid β Concentrations and Stable Isotope Labeling Kinetics of Human Plasma Specific to Central Nervous System Amyloidosis. Alzheimer’s & Dementia 2017, 13, 841–849. [Google Scholar] [CrossRef]
- Schindler, S.E.; Bollinger, J.G.; Ovod, V.; Mawuenyega, K.G.; Li, Y.; Gordon, B.A.; Holtzman, D.M.; Morris, J.C.; Benzinger, T.L.S.; Xiong, C.; et al. High-Precision Plasma β-Amyloid 42/40 Predicts Current and Future Brain Amyloidosis. Neurology 2019, 93, e1647–e1659. [Google Scholar] [CrossRef] [PubMed]
- Giudici, K.V.; De Souto Barreto, P.; Guyonnet, S.; Li, Y.; Bateman, R.J.; Vellas, B. MAPT/DSA Group Assessment of Plasma Amyloid-β 42/40 and Cognitive Decline Among Community-Dwelling Older Adults. JAMA Netw Open 2020, 3, e2028634. [Google Scholar] [CrossRef] [PubMed]
- Verberk, I.M.W.; Hendriksen, H.M.A.; Van Harten, A.C.; Wesselman, L.M.P.; Verfaillie, S.C.J.; Van Den Bosch, K.A.; Slot, R.E.R.; Prins, N.D.; Scheltens, P.; Teunissen, C.E.; et al. Plasma Amyloid Is Associated with the Rate of Cognitive Decline in Cognitively Normal Elderly: The SCIENCe Project. Neurobiology of Aging 2020, 89, 99–107. [Google Scholar] [CrossRef]
- Sims, J.R.; Zimmer, J.A.; Evans, C.D.; Lu, M.; Ardayfio, P.; Sparks, J.; Wessels, A.M.; Shcherbinin, S.; Wang, H.; Monkul Nery, E.S.; et al. Donanemab in Early Symptomatic Alzheimer Disease: The TRAILBLAZER-ALZ 2 Randomized Clinical Trial. JAMA 2023, 330, 512. [Google Scholar] [CrossRef]
- Van Dyck, C.H.; Swanson, C.J.; Aisen, P.; Bateman, R.J.; Chen, C.; Gee, M.; Kanekiyo, M.; Li, D.; Reyderman, L.; Cohen, S.; et al. Lecanemab in Early Alzheimer’s Disease. N Engl J Med 2023, 388, 9–21. [Google Scholar] [CrossRef]
- Folstein, M.F.; Folstein, S.E.; McHugh, P.R. Mini-Mental State. Journal of Psychiatric Research 1975, 12, 189–198. [Google Scholar] [CrossRef]
- Villemagne, V.L.; Burnham, S.; Bourgeat, P.; Brown, B.; Ellis, K.A.; Salvado, O.; Szoeke, C.; Macaulay, S.L.; Martins, R.; Maruff, P.; et al. Amyloid β Deposition, Neurodegeneration, and Cognitive Decline in Sporadic Alzheimer’s Disease: A Prospective Cohort Study. The Lancet Neurology 2013, 12, 357–367. [Google Scholar] [CrossRef] [PubMed]
- Bayart, J.-L.; Hanseeuw, B.; Ivanoiu, A.; Van Pesch, V. Analytical and Clinical Performances of the Automated Lumipulse Cerebrospinal Fluid Aβ42 and T-Tau Assays for Alzheimer’s Disease Diagnosis. J Neurol 2019, 266, 2304–2311. [Google Scholar] [CrossRef]
- Hanseeuw, B.J.; Malotaux, V.; Dricot, L.; Quenon, L.; Sznajer, Y.; Cerman, J.; Woodard, J.L.; Buckley, C.; Farrar, G.; Ivanoiu, A.; et al. Defining a Centiloid Scale Threshold Predicting Long-Term Progression to Dementia in Patients Attending the Memory Clinic: An [18F] Flutemetamol Amyloid PET Study. Eur J Nucl Med Mol Imaging 2021, 48, 302–310. [Google Scholar] [CrossRef]
- Corder, E.H.; Saunders, A.M.; Strittmatter, W.J.; Schmechel, D.E.; Gaskell, P.C.; Small, G.W.; Roses, A.D.; Haines, J.L.; Pericak-Vance, M.A. Gene Dose of Apolipoprotein E Type 4 Allele and the Risk of Alzheimer’s Disease in Late Onset Families. Science 1993, 261, 921–923. [Google Scholar] [CrossRef]
- Farrer, L.A. Effects of Age, Sex, and Ethnicity on the Association Between Apolipoprotein E Genotype and Alzheimer Disease: A Meta-Analysis. JAMA 1997, 278, 1349. [Google Scholar] [CrossRef] [PubMed]
- Roses, A.D. APOLIPOPROTEIN E ALLELES AS RISK FACTORS IN ALZHEIMER’S DISEASE. Annu. Rev. Med. 1996, 47, 387–400. [Google Scholar] [CrossRef] [PubMed]
- Fraley, C.; Raftery, A.; Scrucca, L.; Brendan Murphy, T.; Fop, M. Gaussian Mixture Modelling for Model-Based Clustering, Classification, and Density Estimation 2022.
- Jansen, W.J.; Ossenkoppele, R.; Knol, D.L.; Tijms, B.M.; Scheltens, P.; Verhey, F.R.J.; Visser, P.J.; Aalten, P.; Aarsland, D.; Alcolea, D.; et al. Prevalence of Cerebral Amyloid Pathology in Persons Without Dementia: A Meta-Analysis. JAMA 2015, 313, 1924. [Google Scholar] [CrossRef]
- Brand, A.L.; Lawler, P.E.; Bollinger, J.G.; Li, Y.; Schindler, S.E.; Li, M.; Lopez, S.; Ovod, V.; Nakamura, A.; Shaw, L.M.; et al. The Performance of Plasma Amyloid Beta Measurements in Identifying Amyloid Plaques in Alzheimer’s Disease: A Literature Review. Alz Res Therapy 2022, 14, 195. [Google Scholar] [CrossRef]
- Palmqvist, S.; Janelidze, S.; Stomrud, E.; Zetterberg, H.; Karl, J.; Zink, K.; Bittner, T.; Mattsson, N.; Eichenlaub, U.; Blennow, K.; et al. Performance of Fully Automated Plasma Assays as Screening Tests for Alzheimer Disease–Related β-Amyloid Status. JAMA Neurol 2019, 76, 1060. [Google Scholar] [CrossRef]
- Udeh-Momoh, C.; Zheng, B.; Sandebring-Matton, A.; Novak, G.; Kivipelto, M.; Jönsson, L.; Middleton, L. Blood Derived Amyloid Biomarkers for Alzheimer’s Disease Prevention. J Prev Alz Dis 2021, 1–10. [Google Scholar] [CrossRef] [PubMed]
- Vergallo, A.; Mégret, L.; Lista, S.; Cavedo, E.; Zetterberg, H.; Blennow, K.; Vanmechelen, E.; De Vos, A.; Habert, M.; Potier, M.; et al. Plasma Amyloid β 40/42 Ratio Predicts Cerebral Amyloidosis in Cognitively Normal Individuals at Risk for Alzheimer’s Disease. Alzheimer’s & Dementia 2019, 15, 764–775. [Google Scholar] [CrossRef]
- Smirnov, D.S.; Ashton, N.J.; Blennow, K.; Zetterberg, H.; Simrén, J.; Lantero-Rodriguez, J.; Karikari, T.K.; Hiniker, A.; Rissman, R.A.; Salmon, D.P.; et al. Plasma Biomarkers for Alzheimer’s Disease in Relation to Neuropathology and Cognitive Change. Acta Neuropathol 2022, 143, 487–503. [Google Scholar] [CrossRef] [PubMed]
- Janelidze, S.; Palmqvist, S.; Leuzy, A.; Stomrud, E.; Verberk, I.M.W.; Zetterberg, H.; Ashton, N.J.; Pesini, P.; Sarasa, L.; Allué, J.A.; et al. Detecting Amyloid Positivity in Early Alzheimer’s Disease Using Combinations of Plasma Aβ42/Aβ40 and P-tau. Alzheimer’s & Dementia 2022, 18, 283–293. [Google Scholar] [CrossRef] [PubMed]
- Keshavan, A.; Pannee, J.; Karikari, T.K.; Lantero-Rodriguez, J.; Ashton, N.J.; Nicholas, J.M.; Cash, D.M.; Coath, W.; Lane, C.A.; Parker, T.D.; et al. Population-Based Blood Screening for Preclinical Alzheimer’s Disease in a British Birth Cohort at Age 70. Brain 2021, 144, 434–449. [Google Scholar] [CrossRef]
- Li, Y.; Schindler, S.E.; Bollinger, J.G.; Ovod, V.; Mawuenyega, K.G.; Weiner, M.W.; Shaw, L.M.; Masters, C.L.; Fowler, C.J.; Trojanowski, J.Q.; et al. Validation of Plasma Amyloid-β 42/40 for Detecting Alzheimer Disease Amyloid Plaques. Neurology 2022, 98, e688–e699. [Google Scholar] [CrossRef] [PubMed]
- Zicha, S.; Bateman, R.J.; Shaw, L.M.; Zetterberg, H.; Bannon, A.W.; Horton, W.A.; Baratta, M.; Kolb, H.C.; Dobler, I.; Mordashova, Y.; et al. Comparative Analytical Performance of Multiple Plasma Aβ42 and Aβ40 Assays and Their Ability to Predict Positron Emission Tomography Amyloid Positivity. Alzheimer’s & Dementia 2023, 19, 956–966. [Google Scholar] [CrossRef]
- Milà-Alomà, M.; Ashton, N.J.; Shekari, M.; Salvadó, G.; Ortiz-Romero, P.; Montoliu-Gaya, L.; Benedet, A.L.; Karikari, T.K.; Lantero-Rodriguez, J.; Vanmechelen, E.; et al. Plasma P-Tau231 and p-Tau217 as State Markers of Amyloid-β Pathology in Preclinical Alzheimer’s Disease. Nat Med 2022. [Google Scholar] [CrossRef]
- Karikari, T.K.; Pascoal, T.A.; Ashton, N.J.; Janelidze, S.; Benedet, A.L.; Rodriguez, J.L.; Chamoun, M.; Savard, M.; Kang, M.S.; Therriault, J.; et al. Blood Phosphorylated Tau 181 as a Biomarker for Alzheimer’s Disease: A Diagnostic Performance and Prediction Modelling Study Using Data from Four Prospective Cohorts. The Lancet Neurology 2020, 19, 422–433. [Google Scholar] [CrossRef]
- Mielke, M.M.; Frank, R.D.; Dage, J.L.; Jeromin, A.; Ashton, N.J.; Blennow, K.; Karikari, T.K.; Vanmechelen, E.; Zetterberg, H.; Algeciras-Schimnich, A.; et al. Comparison of Plasma Phosphorylated Tau Species With Amyloid and Tau Positron Emission Tomography, Neurodegeneration, Vascular Pathology, and Cognitive Outcomes. JAMA Neurol 2021, 78, 1108. [Google Scholar] [CrossRef] [PubMed]
- Kent, S.A.; Spires-Jones, T.L.; Durrant, C.S. The Physiological Roles of Tau and Aβ: Implications for Alzheimer’s Disease Pathology and Therapeutics. Acta Neuropathol 2020, 140, 417–447. [Google Scholar] [CrossRef] [PubMed]
- Kuo, Y.-M.; Kokjohn, T.A.; Watson, M.D.; Woods, A.S.; Cotter, R.J.; Sue, L.I.; Kalback, W.M.; Emmerling, M.R.; Beach, T.G.; Roher, A.E. Elevated Aβ42 in Skeletal Muscle of Alzheimer Disease Patients Suggests Peripheral Alterations of AβPP Metabolism. The American Journal of Pathology 2000, 156, 797–805. [Google Scholar] [CrossRef] [PubMed]
- Kuo, Y.-M.; Kokjohn, T.A.; Kalback, W.; Luehrs, D.; Galasko, D.R.; Chevallier, N.; Koo, E.H.; Emmerling, M.R.; Roher, A.E. Amyloid-β Peptides Interact with Plasma Proteins and Erythrocytes: Implications for Their Quantitation in Plasma. Biochemical and Biophysical Research Communications 2000, 268, 750–756. [Google Scholar] [CrossRef]
- Lopez, O.L.; Kuller, L.H.; Mehta, P.D.; Becker, J.T.; Gach, H.M.; Sweet, R.A.; Chang, Y.F.; Tracy, R.; DeKosky, S.T. Plasma Amyloid Levels and the Risk of AD in Normal Subjects in the Cardiovascular Health Study. Neurology 2008, 70, 1664–1671. [Google Scholar] [CrossRef]
- Braak, H.; Braak, E. Frequency of Stages of Alzheimer-Related Lesions in Different Age Categories. Neurobiology of Aging 1997, 18, 351–357. [Google Scholar] [CrossRef]
- Roy, M.; Cardoso, C.; Dorieux, O.; Malgorn, C.; Epelbaum, S.; Petit, F.; Kraska, A.; Brouillet, E.; Delatour, B.; Perret, M.; et al. Age-Associated Evolution of Plasmatic Amyloid in Mouse Lemur Primates: Relationship with Intracellular Amyloid Deposition. Neurobiology of Aging 2015, 36, 149–156. [Google Scholar] [CrossRef]
Figure 1.
The full distribution of the plasma Aβ42/Aβ40 ratio is shown in black. This distribution was then approximated as two gaussians, represented in red (plasmatic Aβ+) and green (plasmatic Aβ-). Each tick on the x-axis represents one individual. The threshold at the intersection of the two gaussians is 0.0472.
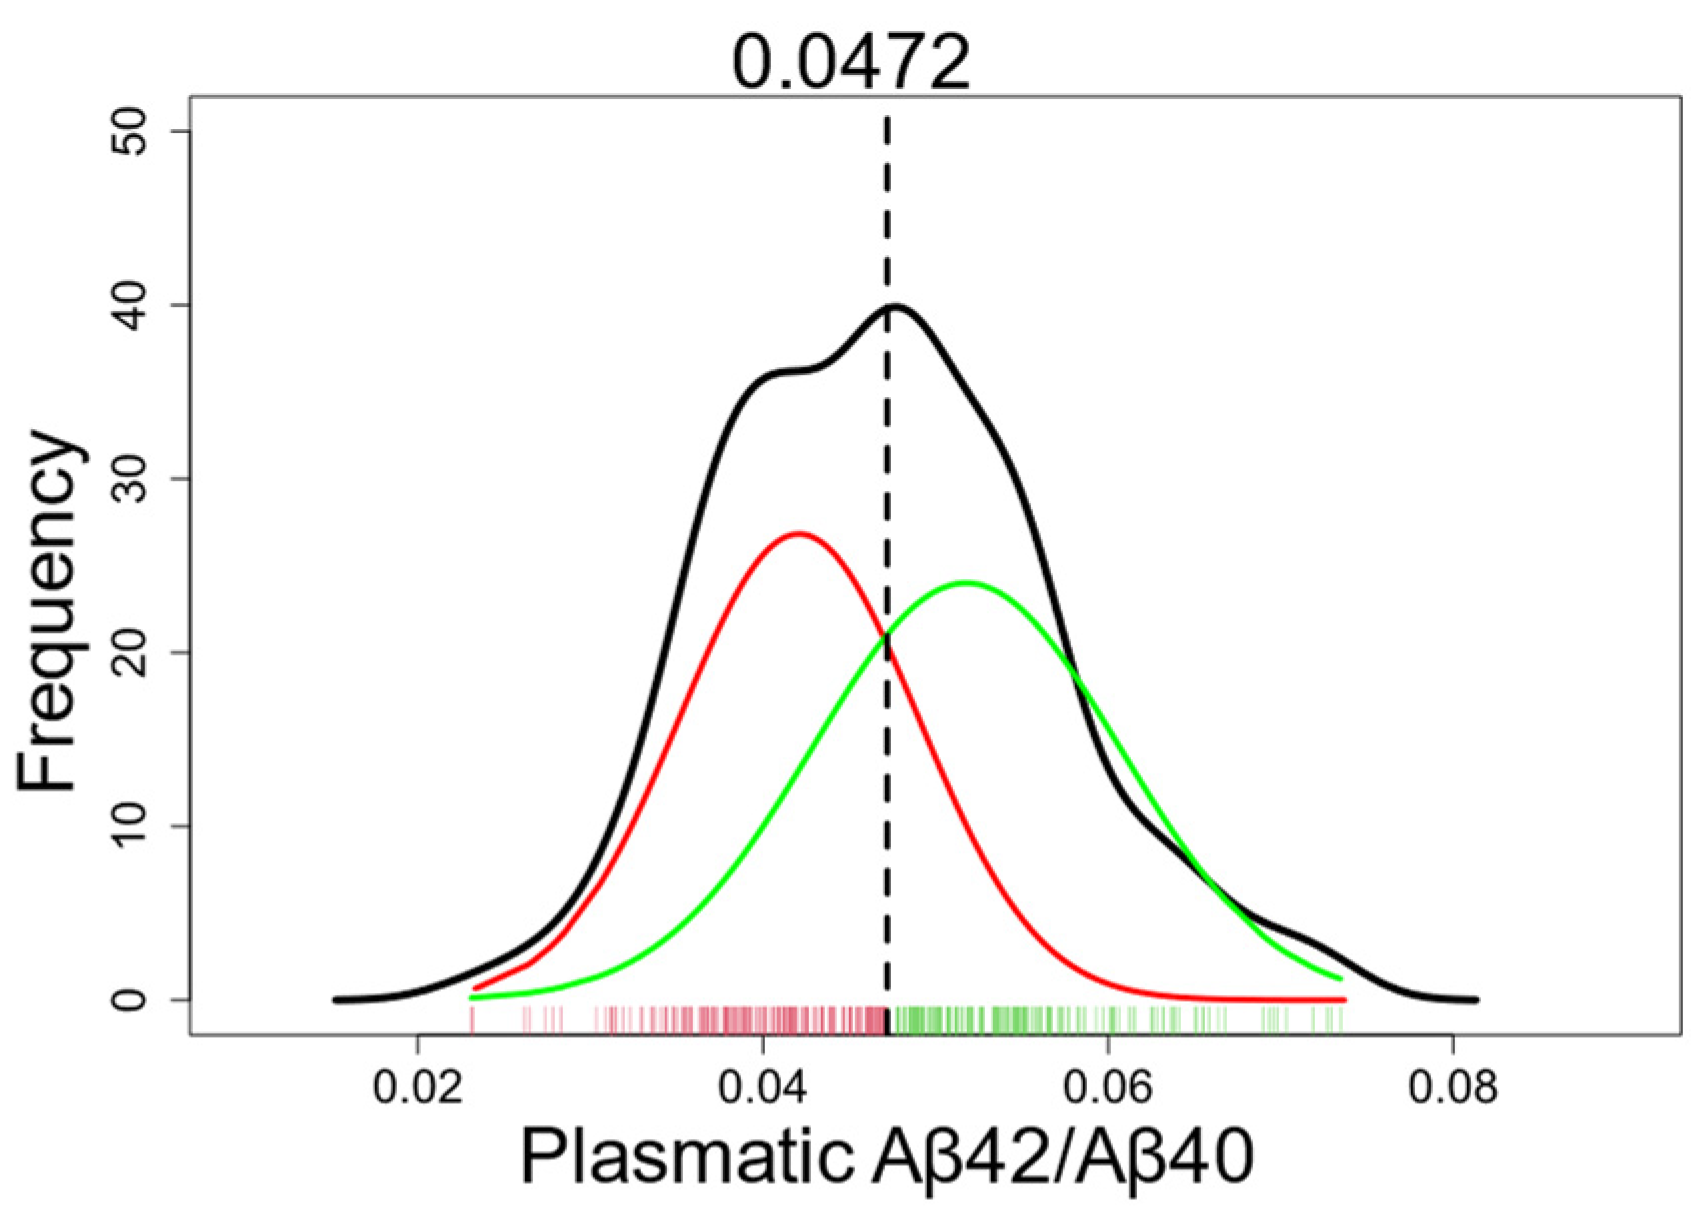
Figure 2.
Result of the decision tree. Participants were classified as plasmatic Aβ+ if their plasma Aβ42/Aβ40 ratio was ≤0.0465, and as plasmatic Aβ- otherwise.
Figure 2.
Result of the decision tree. Participants were classified as plasmatic Aβ+ if their plasma Aβ42/Aβ40 ratio was ≤0.0465, and as plasmatic Aβ- otherwise.
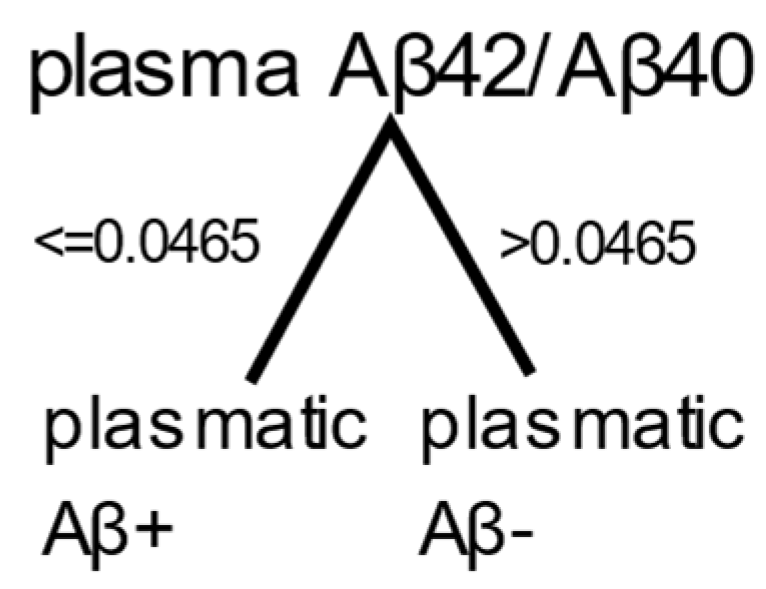
Figure 3.
ROC curve representing the sensitivity and specificity of the plasma Aβ42/Aβ40 ratio for different cutoff values, calculated on participants without dementia. The cutoff values obtained by GMM (0.0472) and decision tree (0.0465) are indicated on the curve, as well as the Youden’s index (0.0450).
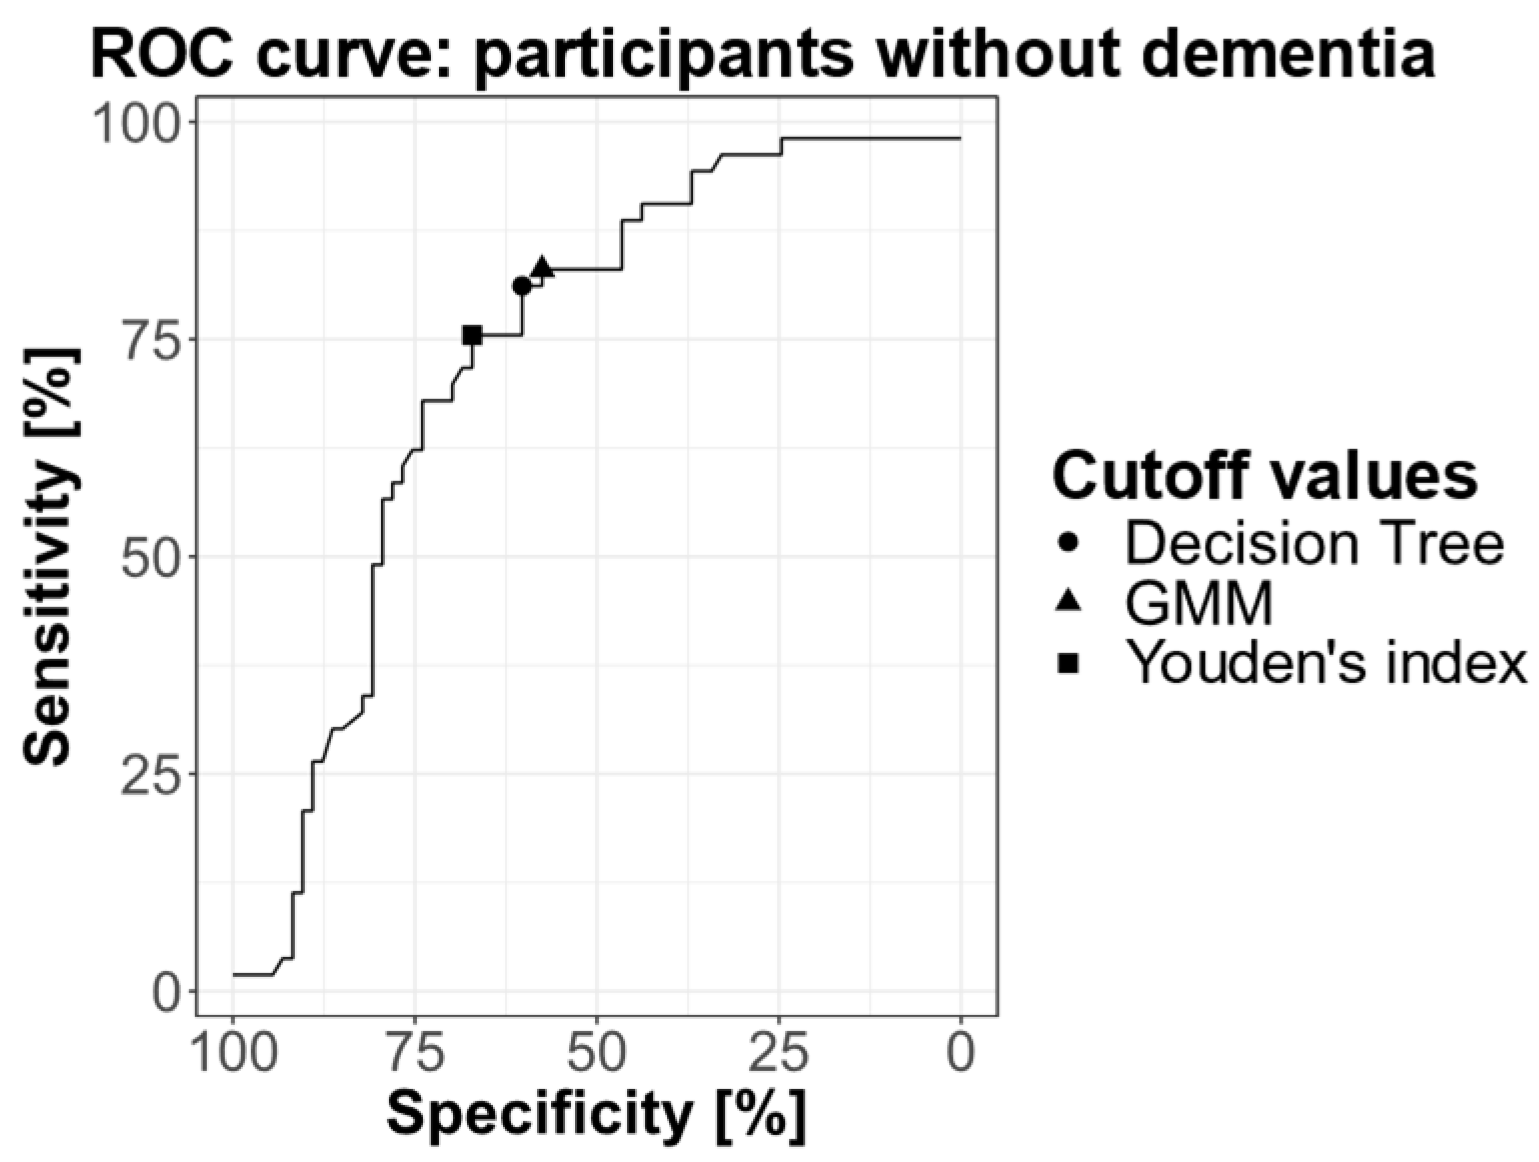

Table 1.
Demographic characteristics of volunteers and patients. SD: standard deviation.
| Volunteers | AD patients | Non-AD patients | p-value | |
|---|---|---|---|---|
| n | 277 | 70 | 18 | |
| Age: mean (SD) | 66.5 (7.78) | 71.1 (8.05) | 65.6 (9.55) | 0.00044a |
| MMSE: mean (SD) | 28.5 (1.27) | 24.1 (4.59) | 26.4 (2.12) | 10-9a |
| APOE*: n ε4-/nε4+ (% ε4-/%ε4+) | 192/83 (70%/30%) |
21/40 (34%/66%) |
14/2 (87.5%/12.5%) | 10-7b |
| Gender: male/female | 98/179 | 32/38 | 7/11 | 0.28b |
aANOVA. bChi-squared test. *APOE: 2 missing among volunteers, 9 missing among AD patients, 2 missing among non-AD patients; ε4- = non-carriers, ε4+ = carriers.
Table 2.
Characteristics of participants with confirmed amyloid status. SD: standard deviation.
| CSF/PET Aβ+ | CSF/PET Aβ- | p-value | |
|---|---|---|---|
| n | 74 | 77 | |
| Age: mean (SD) | 70.8 (8.11) | 67.8 (8.67) | 0.03a |
| MMSE: mean (SD) | 24.6 (4.57) | 27.8 (2.15) | 10-7a |
| APOE*: n ε4- / nε4+ (% ε4-/%ε4+) | 20/47 (30%/70%) | 49/23 (68%/32%) | 10-5b |
| Gender: male/female | 33/41 | 35/42 | 0.99b |
| Non-demented/demented | 53/21 | 73/4 | |
|
Volunteers AD patients Non-AD patients |
13 | 53 | |
| 60 | 9 | ||
| 1 | 15 | ||
| Measure of amyloid: | |||
| CSF | 54 | 24 | |
| [18F]flutemetamol PET | 17 | 51 | |
| [11C]PIB PET | 3 | 2 |
at-test, bChi-squared test. *APOE: 7 missing among Aβ+, 5 missing among Aβ-; ε4- = non-carriers, ε4+ = carriers.
Table 3.
Number of volunteers, AD, and non-AD patients classified as plasmatic Aβ+ or plasmatic Aβ- using the threshold of 0.0472, determined by GMM.
Table 3.
Number of volunteers, AD, and non-AD patients classified as plasmatic Aβ+ or plasmatic Aβ- using the threshold of 0.0472, determined by GMM.
| Volunteers | AD | Non-AD | |
|---|---|---|---|
| Plasmatic Aβ+ | 115 | 67 | 10 |
| Plasmatic Aβ- | 162 | 3 | 8 |
Table 4.
Number of participants classified as plasmatic Aβ+ or plasmatic Aβ- based on the plasma Aβ42/Aβ40 ratio, using the 0.0472 threshold determined by GMM, and according to their amyloid status determined by PET or CSF analysis.
Table 4.
Number of participants classified as plasmatic Aβ+ or plasmatic Aβ- based on the plasma Aβ42/Aβ40 ratio, using the 0.0472 threshold determined by GMM, and according to their amyloid status determined by PET or CSF analysis.
| All individuals | CSF/PET Aβ+ | CSF/PET Aβ- |
|---|---|---|
| Plasmatic Aβ+ | 65 | 34 |
| Plasmatic Aβ- | 9 | 43 |
Table 5.
Number of participants without dementia classified as plasmatic Aβ+ or plasmatic Aβ- based on the plasma Aβ42/Aβ40 ratio, using the 0.0472 threshold determined by GMM, and according to their amyloid status determined by PET or CSF analysis.
Table 5.
Number of participants without dementia classified as plasmatic Aβ+ or plasmatic Aβ- based on the plasma Aβ42/Aβ40 ratio, using the 0.0472 threshold determined by GMM, and according to their amyloid status determined by PET or CSF analysis.
| Non-demented individuals | CSF/PET Aβ+ | CSF/PET Aβ- |
|---|---|---|
| Plasmatic Aβ+ | 44 | 31 |
| Plasmatic Aβ- | 9 | 42 |
Table 6.
Number of participants classified as plasmatic Aβ+ or plasmatic Aβ- based on the plasma Aβ42/Aβ40 ratio, using a threshold of 0.0465, as determined by decision tree, and according to their amyloid status determined by PET or CSF analysis.
Table 6.
Number of participants classified as plasmatic Aβ+ or plasmatic Aβ- based on the plasma Aβ42/Aβ40 ratio, using a threshold of 0.0465, as determined by decision tree, and according to their amyloid status determined by PET or CSF analysis.
| All individuals | CSF/PET Aβ+ | CSF/PET Aβ- |
|---|---|---|
| Plasmatic Aβ+ | 64 | 32 |
| Plasmatic Aβ- | 10 | 45 |
Table 7.
Number of participants without dementia classified as plasmatic Aβ+ or plasmatic Aβ- based on the plasma Aβ42/Aβ40 ratio, using a threshold of 0.0465 as determined by decision tree, and according to their amyloid status determined by PET or CSF analysis.
Table 7.
Number of participants without dementia classified as plasmatic Aβ+ or plasmatic Aβ- based on the plasma Aβ42/Aβ40 ratio, using a threshold of 0.0465 as determined by decision tree, and according to their amyloid status determined by PET or CSF analysis.
| Non-demented individuals | CSF/PET Aβ+ | CSF/PET Aβ- |
|---|---|---|
| Plasmatic Aβ+ | 43 | 29 |
| Plasmatic Aβ- | 10 | 44 |
Disclaimer/Publisher’s Note: The statements, opinions and data contained in all publications are solely those of the individual author(s) and contributor(s) and not of MDPI and/or the editor(s). MDPI and/or the editor(s) disclaim responsibility for any injury to people or property resulting from any ideas, methods, instructions or products referred to in the content. |
© 2023 by the authors. Licensee MDPI, Basel, Switzerland. This article is an open access article distributed under the terms and conditions of the Creative Commons Attribution (CC BY) license (http://creativecommons.org/licenses/by/4.0/).
Copyright: This open access article is published under a Creative Commons CC BY 4.0 license, which permit the free download, distribution, and reuse, provided that the author and preprint are cited in any reuse.


