Submitted:
18 December 2023
Posted:
19 December 2023
You are already at the latest version
Abstract
Keywords:
1. Introduction
2. Methodology
3. Panorama of COVID-19 in Mexico
4. Mexican National Electric System (SEN)
5. Results
5.1. Installed Capacity
5.2. Generation
5.3. Consumption
5.3. Demand
6. Discussion and Conclusion
Author Contributions
Acknowledgments
Conflicts of Interest
References
- Daemi, Hakimeh Baghaei, et al. Progression and trends in virus from influenza A to COVID-19: an overview of recent studies. J. J. Viruses 2021, 13, 1145. [CrossRef] [PubMed]
- Yezli, Saber, and Anas Khan. COVID-19 social distancing in the Kingdom of Saudi Arabia: Bold measures in the face of political, economic, social and religious challenges. Travel Med Infect Dis. 2020, 37, 101692. [Google Scholar] [CrossRef]
- Acuña-Zegarra, Manuel Adrian, Mario Santana-Cibrian, and Jorge X. Velasco-Hernandez. Modeling behavioral change and COVID-19 containment in Mexico: A trade-off between lockdown and compliance. Math. Biosci. 2020, 325, 108370. [Google Scholar] [CrossRef]
- 4. Fana, Marta, et al. The COVID confinement measures and EU labour markets. Luxembourg: Publications office of the European Union, 2020.
- Sun, Kai Sing, et al. Effectiveness of different types and levels of social distancing measures: a scoping review of global evidence from earlier stage of COVID-19 pandemic. BMJ open 2022, 12, e053938. [CrossRef]
- Maliszewska, Maryla, Aaditya Mattoo, and Dominique Van Der Mensbrugghe. The potential impact of COVID-19 on GDP and trade: A preliminary assessment. World Bank policy res. Work. 2020, 9211.
- Wang, Bowen, et al. Crises and opportunities in terms of energy and AI technologies during the COVID-19 pandemic. Energy and AI 2020, 1, 100013. [Google Scholar] [CrossRef]
- Basak, Palash, et al. A global study on the correlates of gross domestic product (GDP) and COVID-19 vaccine distribution. Vaccines 2022, 10, 266. [CrossRef]
- Baldwin, Richard E., and Eiichi Tomiura. Thinking ahead about the trade impact of COVID-19. 2020.
- Barbero, Javier, Juan José de Lucio, and Ernesto Rodríguez-Crespo. Effects of COVID-19 on trade flows: Measuring their impact through government policy responses. PloS one 2021, 16, e0258356.
- Kooli, Chokri. COVID-19: Challenges and opportunities. Avicenna Editorial 2021, 1, 10-5339. [CrossRef]
- Palomino, Juan C., Juan G. Rodríguez, and Raquel Sebastian. The COVID-19 shock on the labour market: Poverty and inequality effects across Spanish regions. Reg. Stud. 2023, 57, 814–828. [CrossRef]
- Sonfield, Adam, et al. COVID-19 job losses threaten insurance coverage and access to reproductive health care for millions. Health Affairs Forefront 2020.
- Ahmed, Faheem, et al. Why inequality could spread COVID-19. The Lancet Public Health 2020, 5, e240. [CrossRef]
- Wiwad, Dylan, et al. Recognizing the impact of COVID-19 on the poor alters attitudes towards poverty and inequality. J. Exp. Soc. Psychol. 2021, 93, 104083. [Google Scholar] [CrossRef]
- Gollakota, Anjani RK, and Chi-Min Shu. COVID-19 and energy sector: Unique opportunity for switching to clean energy. Gondwana Res. 2023, 114, 93–116. [Google Scholar] [CrossRef]
- Elavarasan, Rajvikram Madurai, et al. COVID-19: Impact analysis and recommendations for power sector operation. Appl. energy 2020, 279, 115739. [CrossRef]
- Zhong, Haiwang, et al. Implications of COVID-19 for the electricity industry: A comprehensive review. CSEE J. Power and Energy Syst. 2020, 6, 489–495. [CrossRef]
- Saadat, Saeida, Deepak Rawtani, and Chaudhery Mustansar Hussain. Environmental perspective of COVID-19. Sci. of the Total Environment 2020, 728, 138870. [Google Scholar] [CrossRef] [PubMed]
- Sikarwar, Vineet Singh, et al. COVID-19 pandemic and global carbon dioxide emissions: A first assessment. Sci. of the Total Environment 2021, 794, 148770. [Google Scholar] [CrossRef] [PubMed]
- Mastoi, Muhammad Shahid, et al. A critical analysis of the impact of pandemic on China’s electricity usage patterns and the global development of renewable energy. IJERPH 2022, 19, 4608. [CrossRef]
- Wang, Qiang, Shuyu Li, and Feng Jiang. Uncovering the impact of the COVID-19 pandemic on energy consumption: New insight from difference between pandemic-free scenario and actual electricity consumption in China. J. Clean. Prod. 2021, 313, 127897. [CrossRef] [PubMed]
- Bhattacharya, Subhadip, et al. Analysing the impact of lockdown due to the COVID-19 pandemic on the Indian electricity sector. Int. J. Electric. Power Energy Syst. 2022, 141, 108097. [Google Scholar] [CrossRef]
- World Energy Primary Production https://yearbook.enerdata.net/total-energy/world-energy-production.html (accessed on 28 June 2023). (accessed on 28 June 2023).
- Abu-Rayash, Azzam, and Ibrahim Dincer. Analysis of the electricity demand trends amidst the COVID-19 coronavirus pandemic. ERSS 68 (2020) 101682. [CrossRef]
- Alasali, Feras, et al. Impact of the COVID-19 pandemic on electricity demand and load forecasting. Sustainability 2021, 13, 1435. [CrossRef]
- Narajewski, Michał, and Florian Ziel. Changes in electricity demand pattern in Europe due to COVID-19 shutdowns. arXiv, 2020; arXiv:2004.14864.
- Agdas, Duzgun, and Prabir Barooah. Impact of the COVID-19 pandemic on the US electricity demand and supply: An early view from data. Ieee Access 2020, 8, 151523–151534. [CrossRef] [PubMed]
- Wu, Jinran, et al. An evaluation of the impact of COVID-19 lockdowns on electricity demand. Electr. Power Syst. Res. 2023, 216, 109015. [CrossRef]
- Aktar, Most Asikha, Md Mahmudul Alam, and Abul Quasem Al-Amin. Global economic crisis, energy use, CO2 emissions, and policy roadmap amid COVID-19. Sustain. Prod. Consum. 2021, 26, 770–781. [CrossRef] [PubMed]
- López-Sosa, Luis Bernardo, et al. COVID-19 pandemic effect on energy consumption in state universities: Michoacan, Mexico case study. Energies, 2021; 14, 7642. [CrossRef]
- Escudero, Xavier, et al. The SARS-CoV-2 (COVID-19) coronavirus pandemic: Current situation and implications for Mexico. Archivos de cardiología de México 2020, 90, 7–14. [CrossRef] [PubMed]
- Public Media Service https://www.capital21.cdmx.gob.mx/noticias/?p=12574 (accessed on 16 March, 2023).
- IBERO 2020 Breve cronología de la pandemia 2020 https://revistas.ibero.mx/ibero/uploads/volumenes/55/pdf/breve-cronologia-de-la-pandemia.pdf (accessed on 16 March 2023). (accessed on 16 March 2023).
- COVID-19 Timeline in Mexico -INAI https://micrositios.inai.org.mx/conferenciascovid-19tp/?page_id=8432 (accessed on 16 March 2023). (accessed on 16 March 2023).
- Timeline – Coronavirus Contingency -CVOED -IMSS https://cvoed.imss.gob.mx/cronologia-contingencia-por-coronavirus/ (accessed on 18 March 2023). (accessed on 18 March 2023).
- Sistema Electrico Nacional, SEN https://www.cenace.gob.mx/Paginas/SIM/OperacionSEN.aspx#:~:text=El%20SEN%20est%C3%A1%20integrado%20por,la%20RNT%20o%20a%20las%20RGD (accessed on March 21, 2023).
- CENACE https://www.cenace.gob.mx/CENACE.aspx (accessed on March 21, 2023).
- Vásquez, P. K. Vásquez, P. K., et al. Diagnóstico Situacional para la implementación de un proceso de Gestión de Conocimiento en el Operador Nacional de Electricidad CENACE. Revista Técnica energía 2017, 13, 222–232. [Google Scholar] [CrossRef]
- National Program for Sustainable Use https://dof.gob.mx/nota detalle.php?codigo=5679748&fecha=16/02/2023 (accessed on March 21, 2023).
- Zenón, Eric, and Juan Rosellón. Optimal transmission planning under the Mexican new electricity market. Energy Policy 2017, 104, 349–360. [Google Scholar] [CrossRef]
- National Energy Balance 2018-2025. https://sie.energia.gob.mx/bdiController.do?action=cuadro&cvecua=DIPS SE C33 ESP (Accessed on April 4, 2023).
- Energetic Reform 2017 https://www.asf.gob.mx/uploads/61 Publicacionestecnicas/16 Reforma energetica 2017.pdf (accessed on May 8, 2023).
- Sector program derived from the National Development Plan 2019-2024 https://www.dof.gob.mx/nota detalle.php?codigo=5596374&fecha=08/07/2020 (accessed on May 24th, 2023).
- Progress in Clean Energies 2017 https://www.gob.mx/cms/uploads/attachment/file/354379/Reporte_de_Avance_de_Energ_as_Limpias_Cierre_2017.pdf (Accessed on May 8, 2023).
- Energías alternativas, retos y oportunidades en México https://realestatemarket.com.mx/articulos/infraestructura-y-construccion/27581-energias-alternativas-retos-y-oportunidades-en-mexico\#:~:text=El\%202018%20fue%20el%20mayor,capacidad%20instalada%20respecto%20a%202017 (Accessed on May 8, 2023).
- PRODESEN 2018-2032 https://www.cenace.gob.mx/Docs/16\_MARCO\\REGULATORIO/Prodecen//08%202018-2032%20Cap%C3%ADtulos%201%20al%206.pdf (Accessed on May 15, 2023).
- Annual Report 2019 CFE https://www.cfe.mx/finanzas/reportes-financieros/Informe%20Anual%20Documentos/Informe%20Anual%202019%20V12%20a%20portal.pdf (Accessed on May 15, 2023).
- CENACE, fallas del Sistema Nacional https://www.cenace.gob.mx/Docs/16\_MARCOREGULATORIO/SENyMEM/(Acuerdo%202020-05-01%20CENACE)%20Acuerdo%20para%20garantizar%20la%20eficiencia,%20Calidad,%20Confiabilidad,%20Continuidad%20y%20seguridad.pdf (Accessed on May 8, 2023).
- CENACE, Report of the energy generated by type https://www.cenace.gob.mx/Paginas/SIM/Reportes/EnergiaGeneradaTipoTec.aspx (Accessed on June 17, 2023).
- Secretaria de Energía, Informe pormenorizado sobre el desempeño y las tendencias de la industria eléctrica nacional 2017 Informe sobre la participación de las energías renovables en la generación de electricidad en México, al 31 de diciembre de 2013 (www.gob.mx) (Accessed on June 14, 2023).
- PRODESEN 2019-2033 https://www.cenace.gob.mx/Docs/16_MARCOREGULATORIO/Prodecen//10%202019-2033%20Cap%C3%ADtulos%201%20al%206.pdf (Accessed on June 12, 2023).
- PRODESEN 2020-2034 https://www.cenace.gob.mx/Docs/16_MARCOREGULATORIO/Prodecen//12%202020-2034%20Cap%C3%ADitulos%201%20al%206.pdf (Accessed on June 12, 2023).
- PRODESEN 2021-2035 https://www.cenace.gob.mx/Docs/16\_MARCOREGULATORIO/Prodecen//14%202021-2035%20Cap%C3%ADtulos%201%20al%206.pdf (Accessed on June 12, 2023).
- PRODESEN 2022-2036 https://www.cenace.gob.mx/Docs/16_MARCOREGULATORIO/Prodecen//15%202022-2036%20Cap%C3%ADtulos%207%20al%209%20y%20Anexos.pdf (Accessed on June 12, 2023).
- Instituto Mexicano de la Competitividad https://imco.org.mx/wp-content/uploads/2023/02/Situacion-del-agua-en-Mexico (Accessed on June 19, 2023).
- Public Policy Research Center IMCO 2022a https://imco.org.mx/wp-content/uploads/2022/09/La-energia-que-queremos\_Documento.pdf (Accessed on July 11, 2023).
- Statistical Yearbook 2023 ENERDATA https://datos.enerdata.net/electricidad/datos-consumo-electricidad-hogar.html (Accessed on July 11, 2023).
- Public Policy Research Center IMCO https://imco.org.mx/prodesen-refleja-una-falta-de-compromiso-del-estado-mexicano-con-el-medio-ambiente/ (Accessed on July 7, 2023).
- Mexican Institute of Competitiveness https://imco.org.mx/wp-content/uploads/2022/06/Nota-informativa\_Prodesen\_22010603.pdf (Accessed on July 7, 2023).
- Public Policy Research Center IMCO 2022 https://imco.org.mx/prodesen-refleja-una-falta-de-compromiso-del-estado-mexicano-con-el-medio-ambiente/ (Accessed on July 11, 2023).
- Prodesen 2023-2037 https://imco.org.mx/el-prodesen-2023-2037-incrementa-artificialmente-las-cifras-de-generacion-de-energia-limpia-en-mexico/ (Accessed on July 11, 2023).

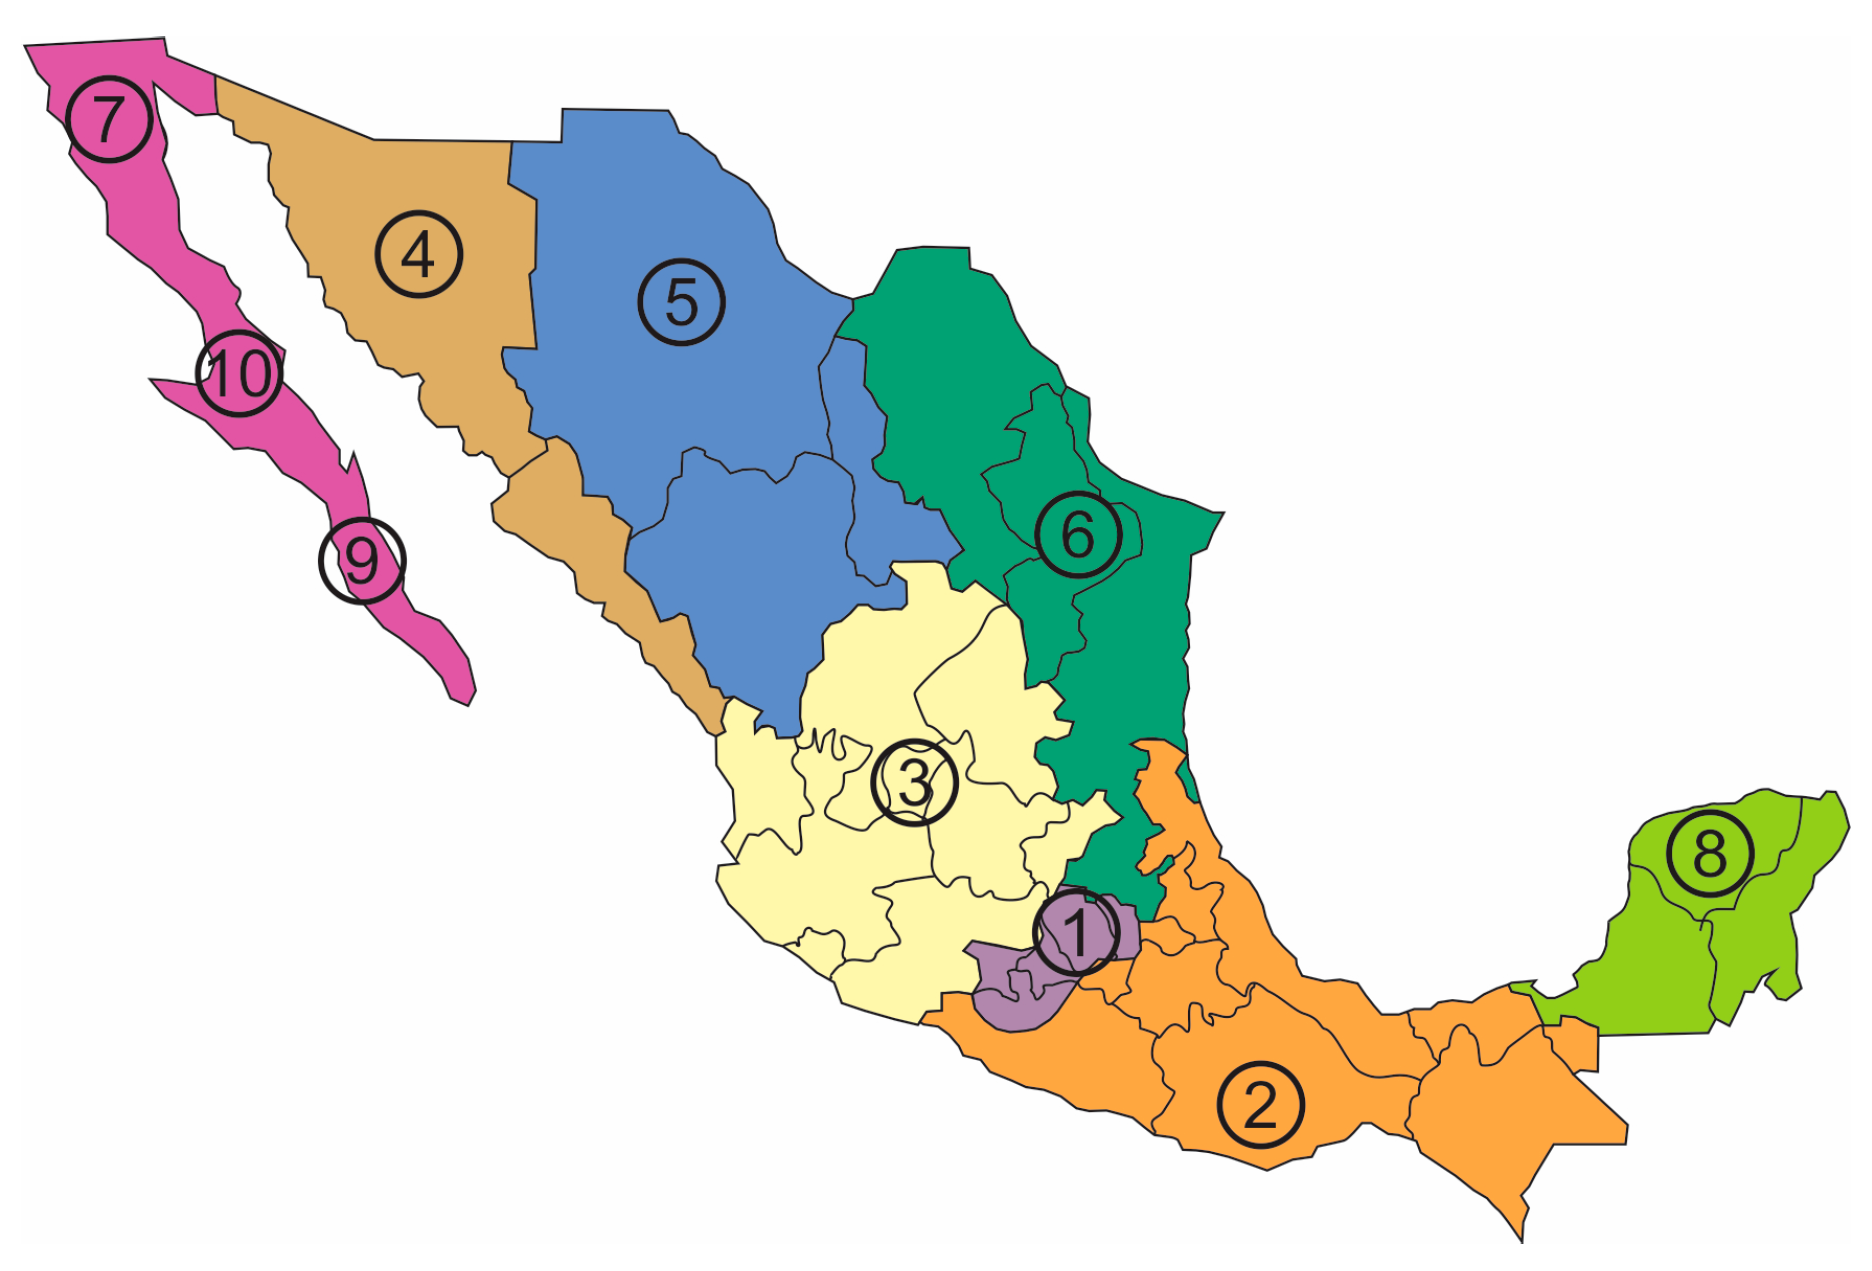
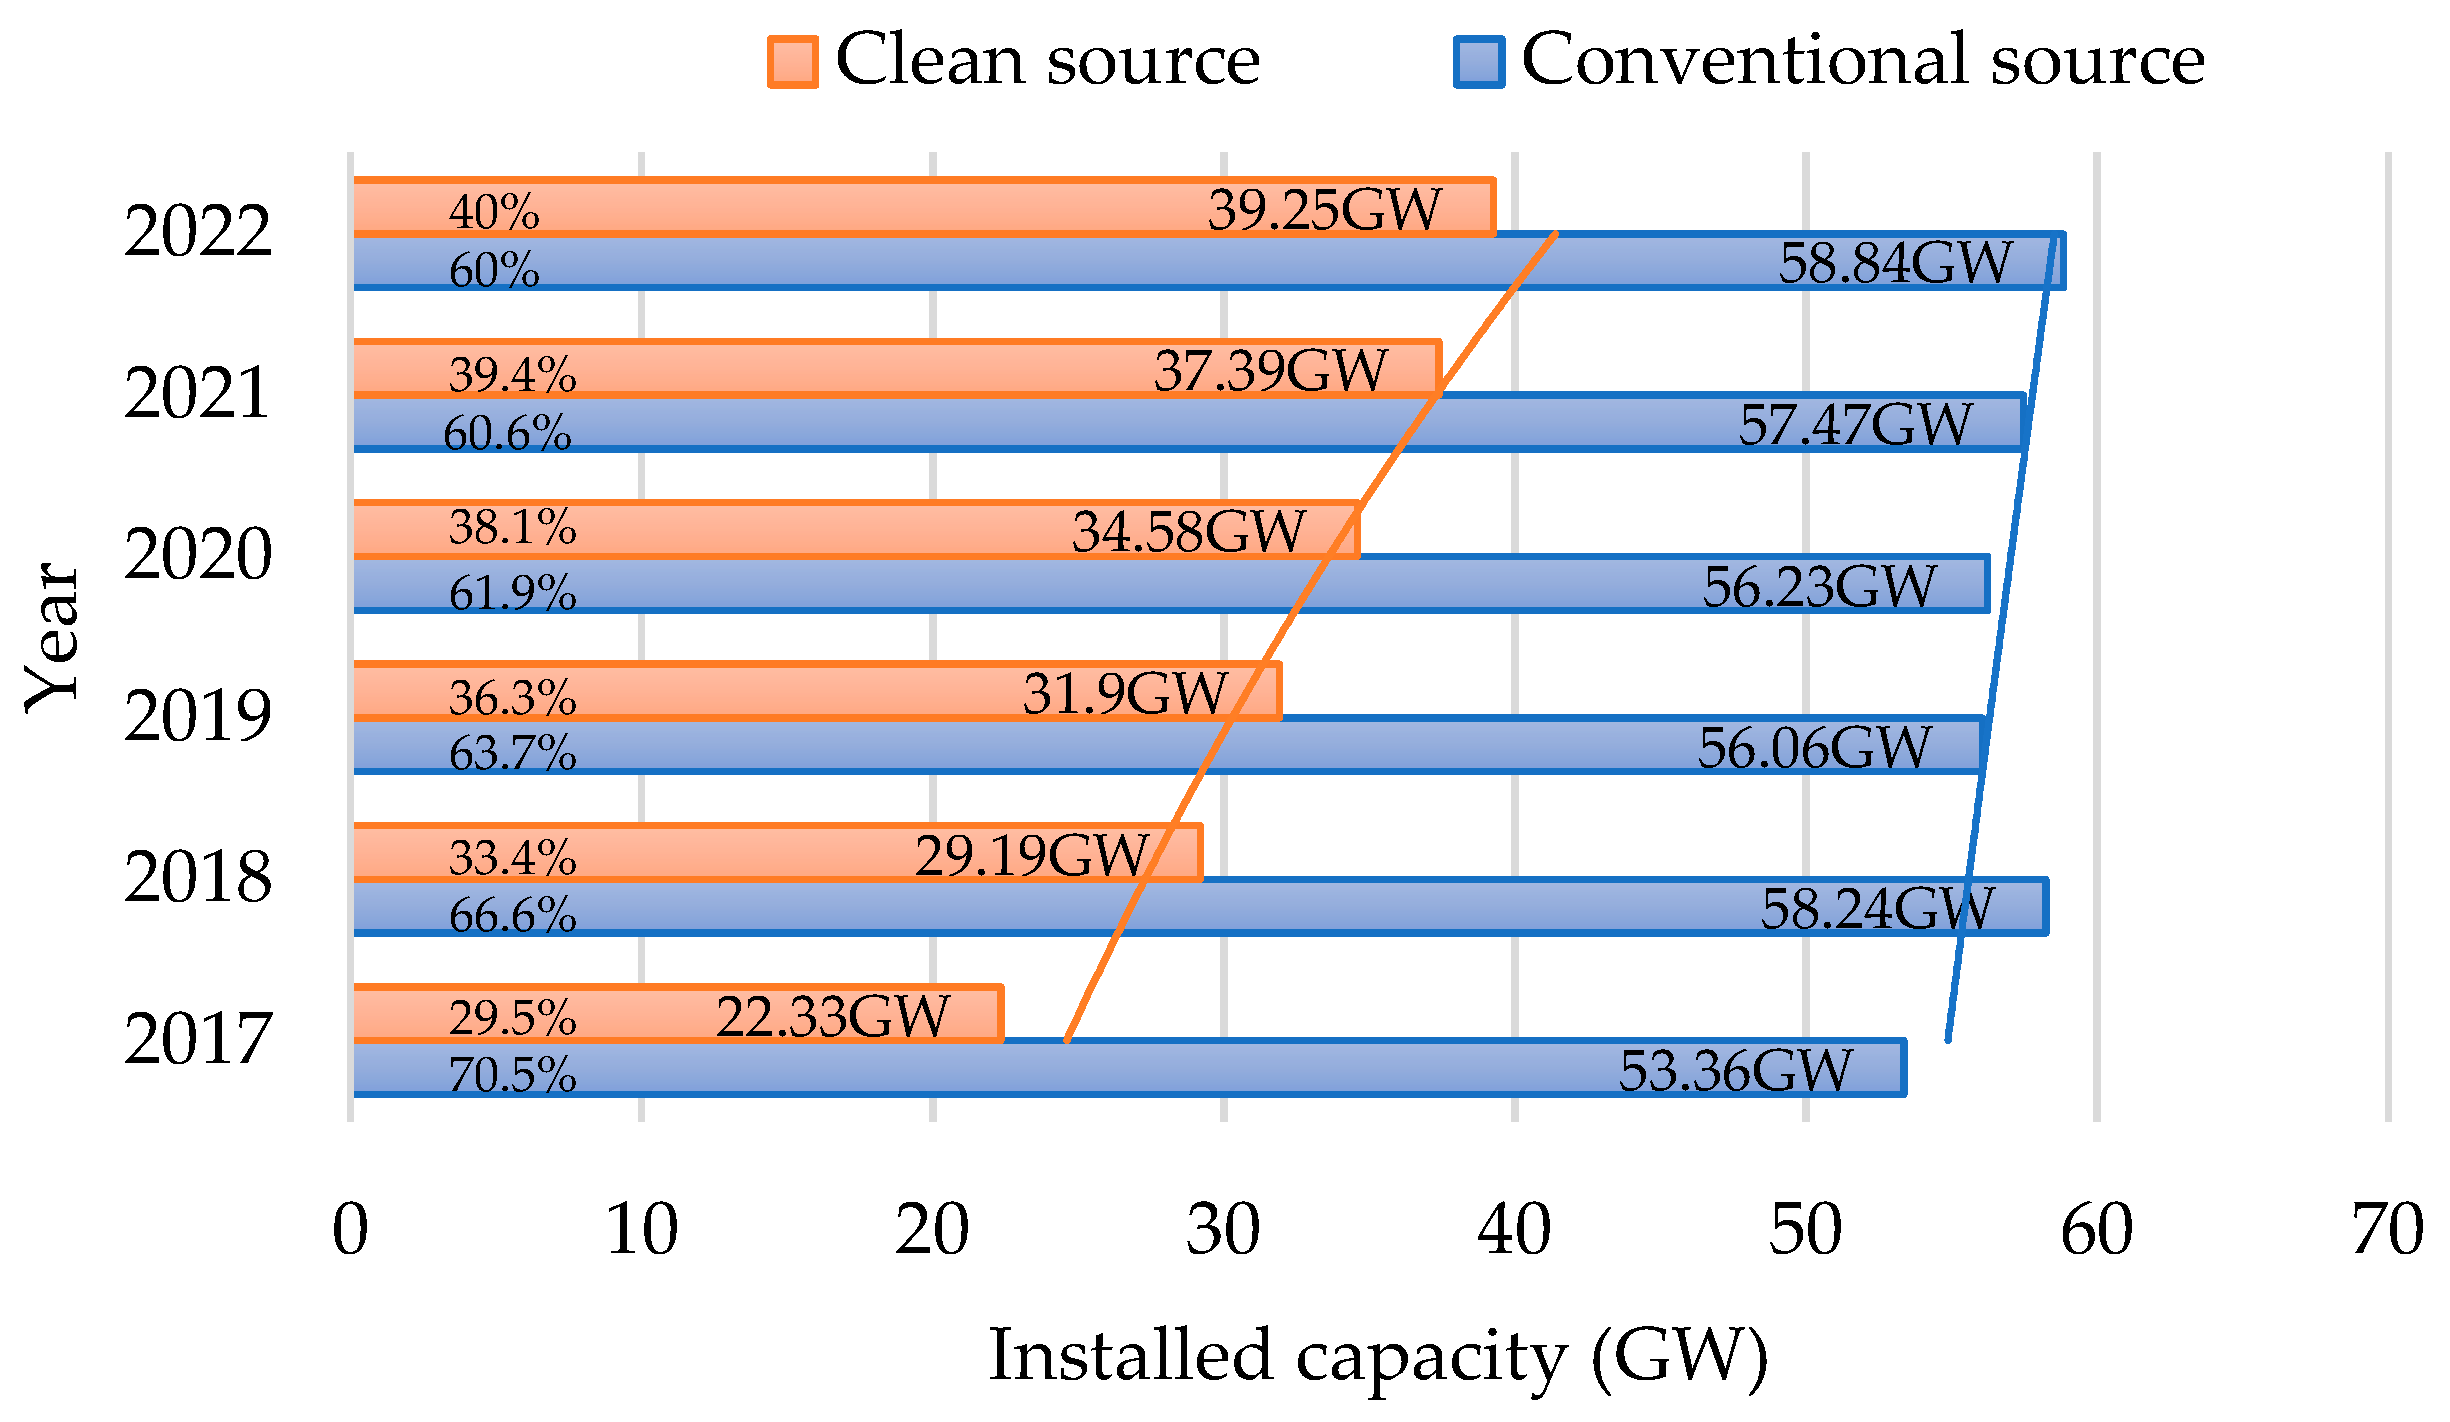
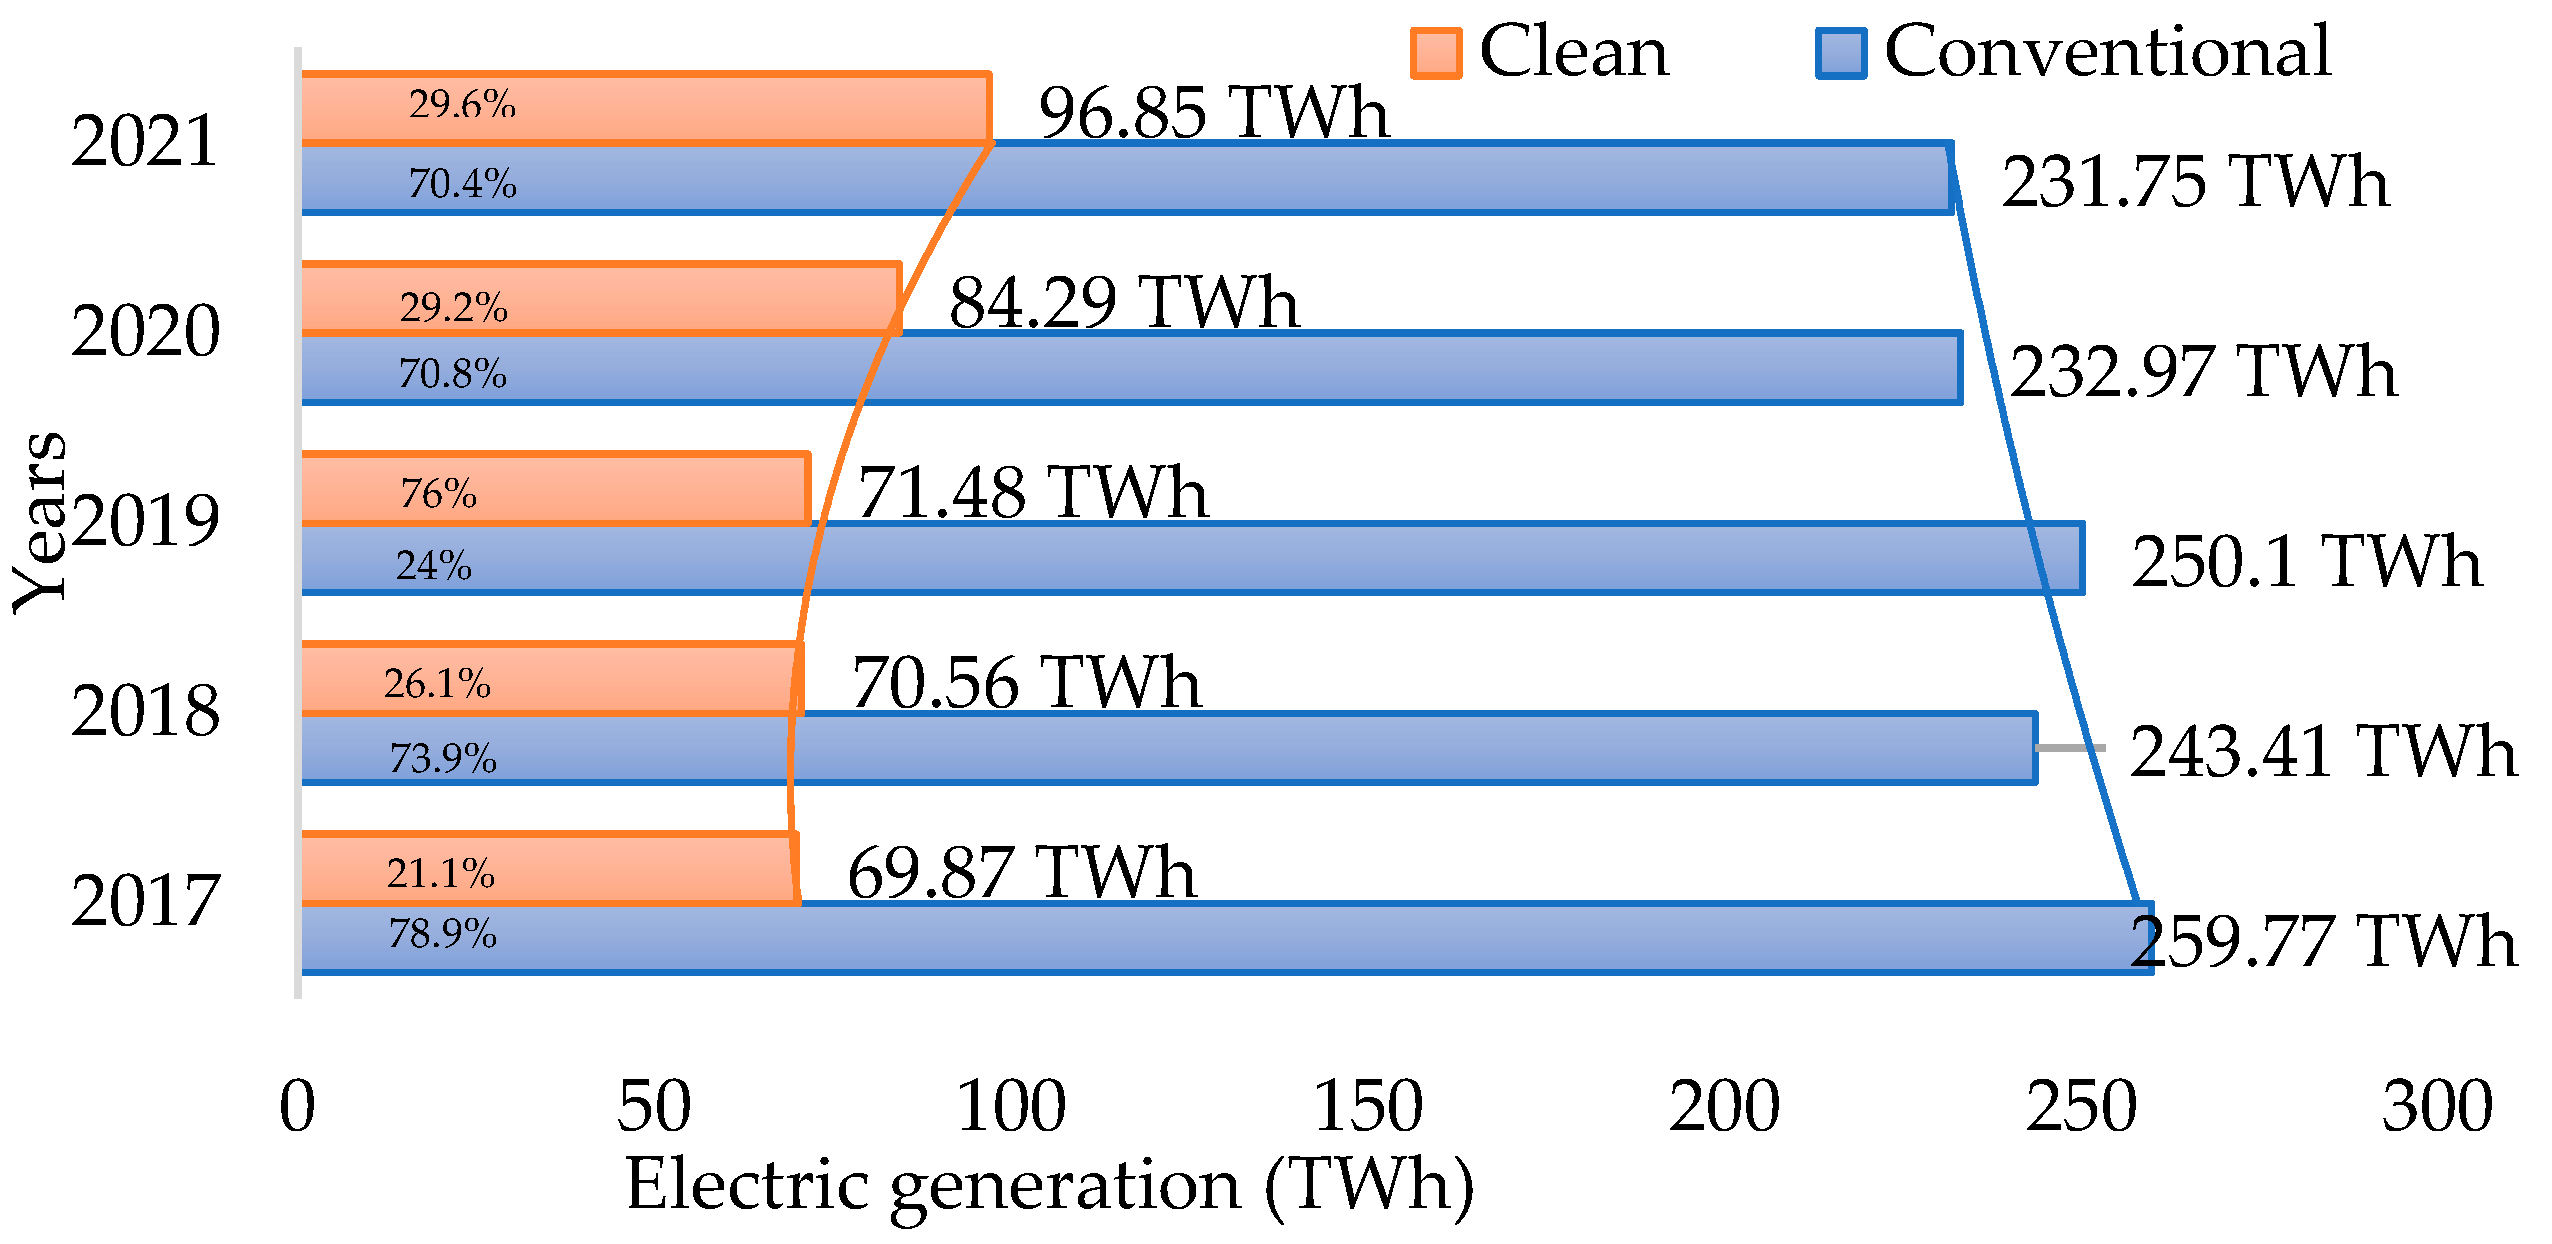
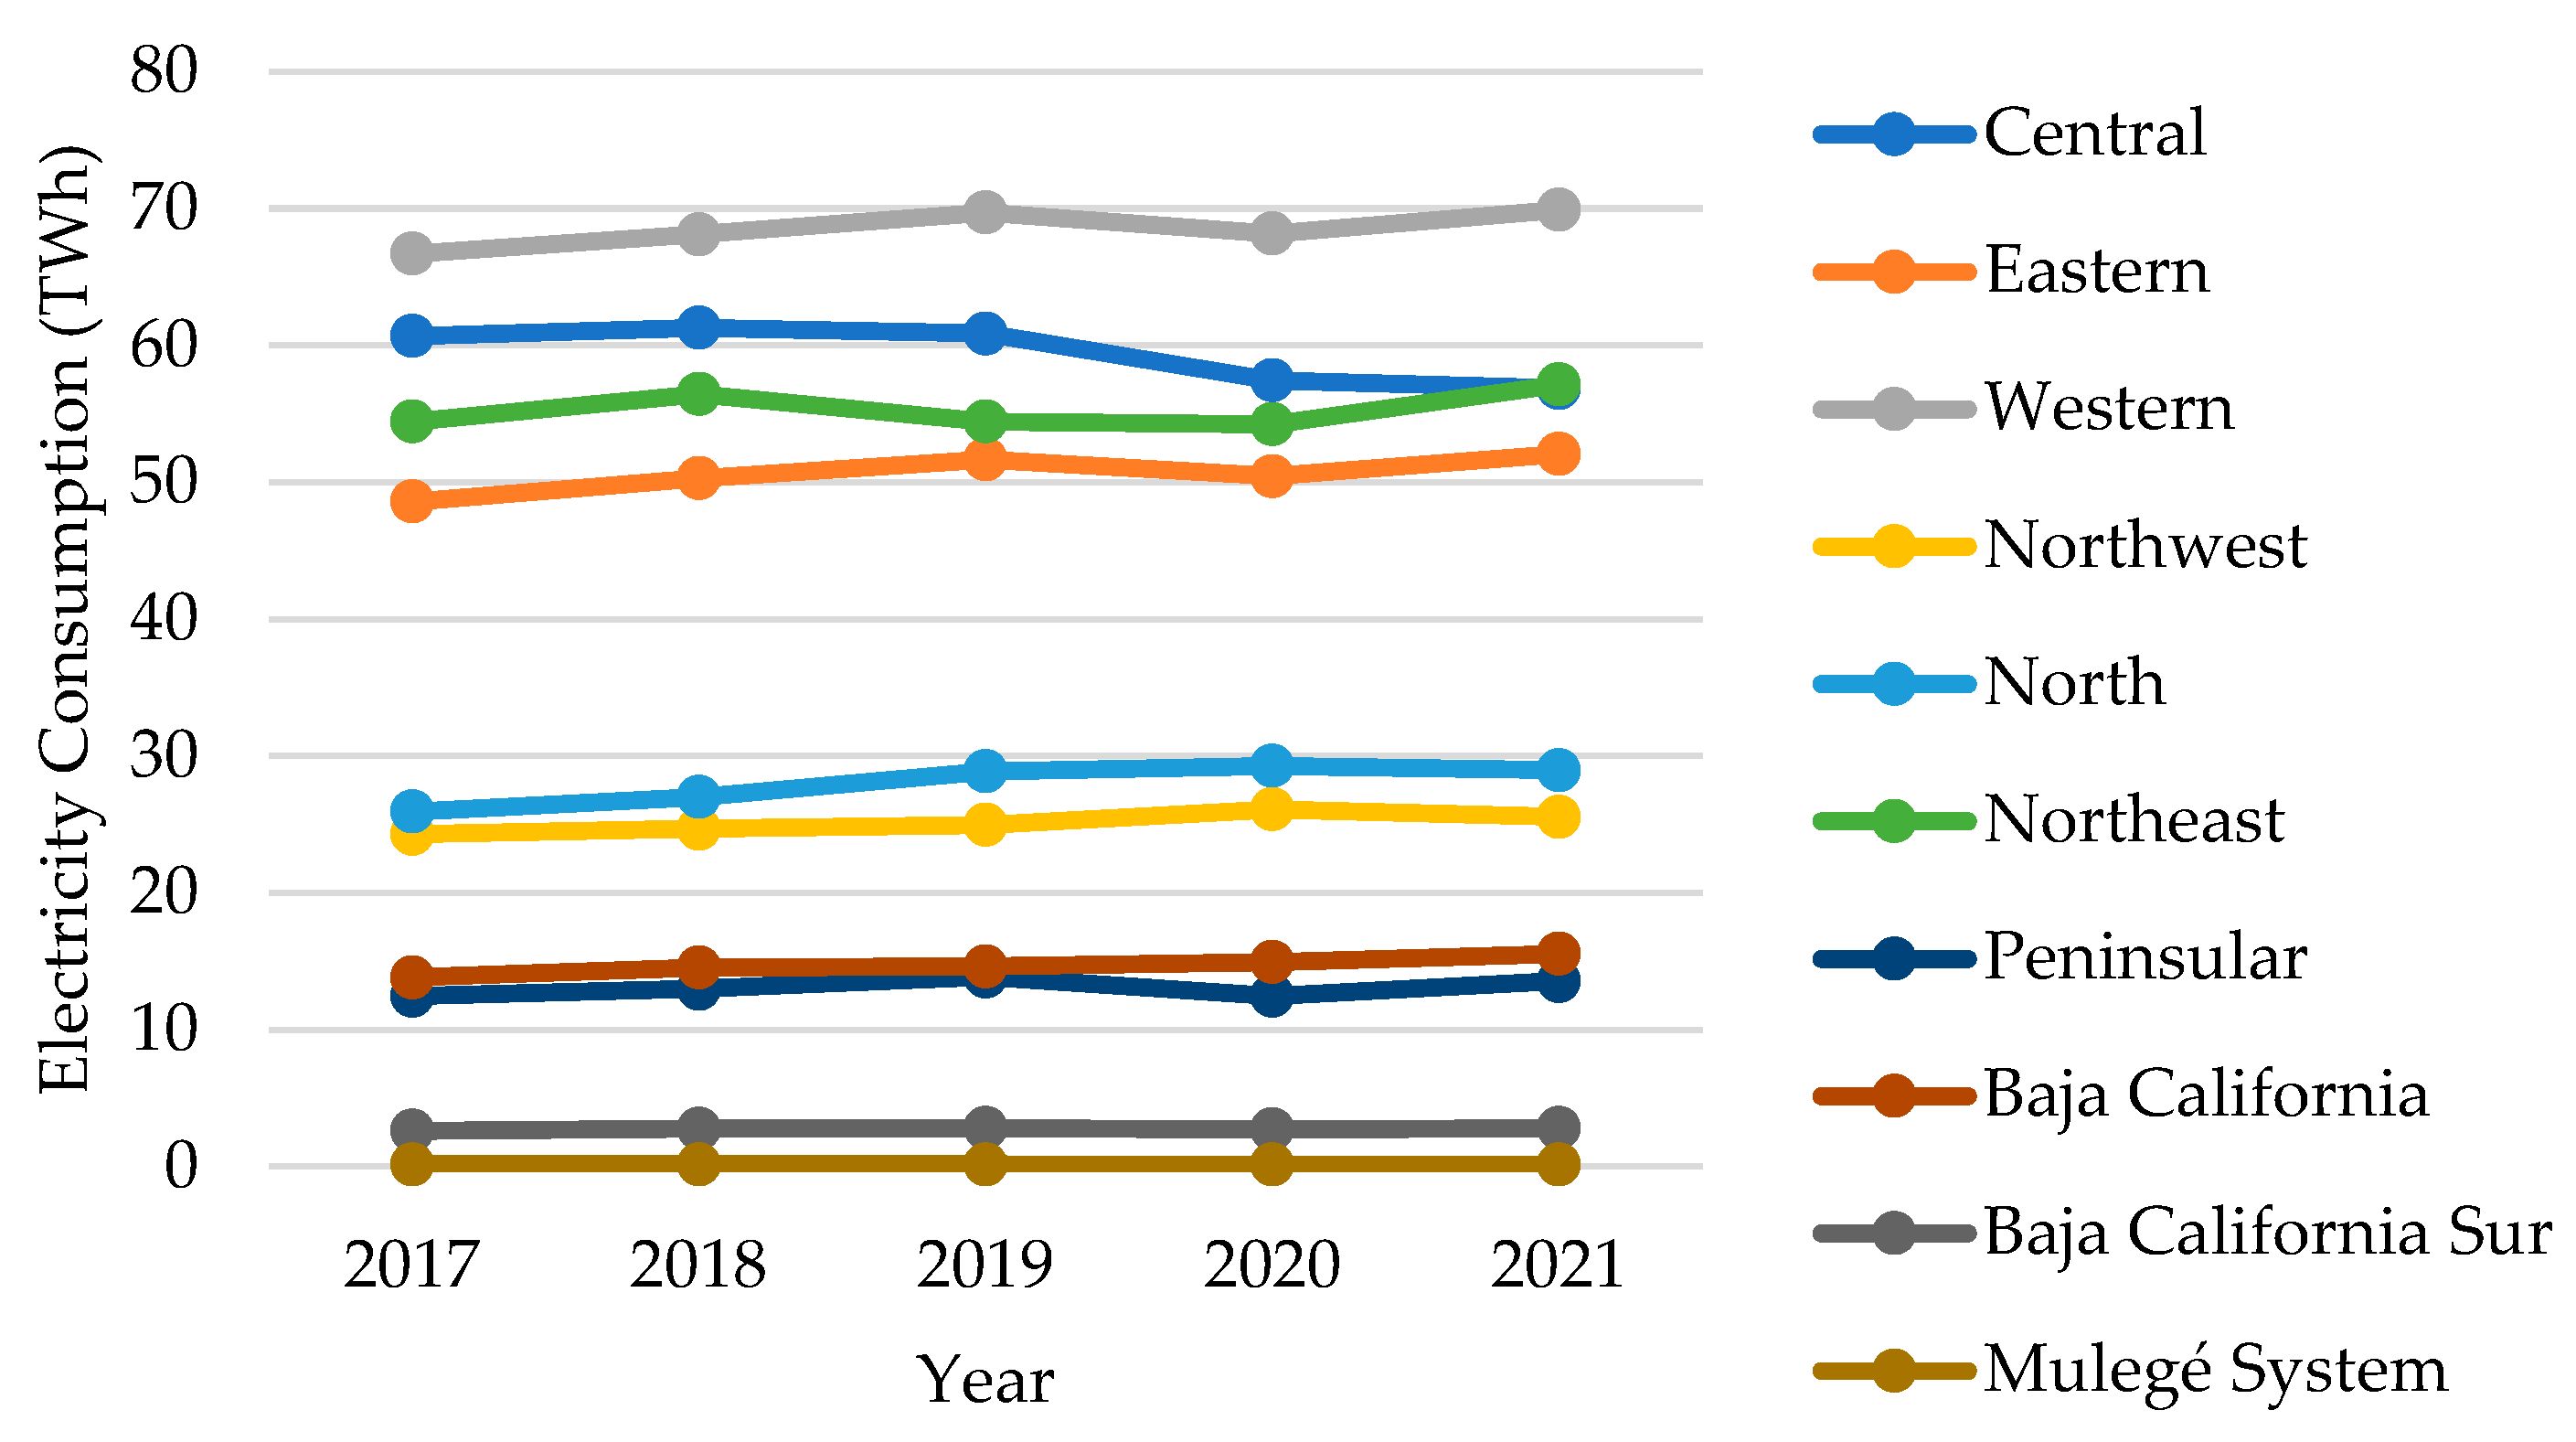
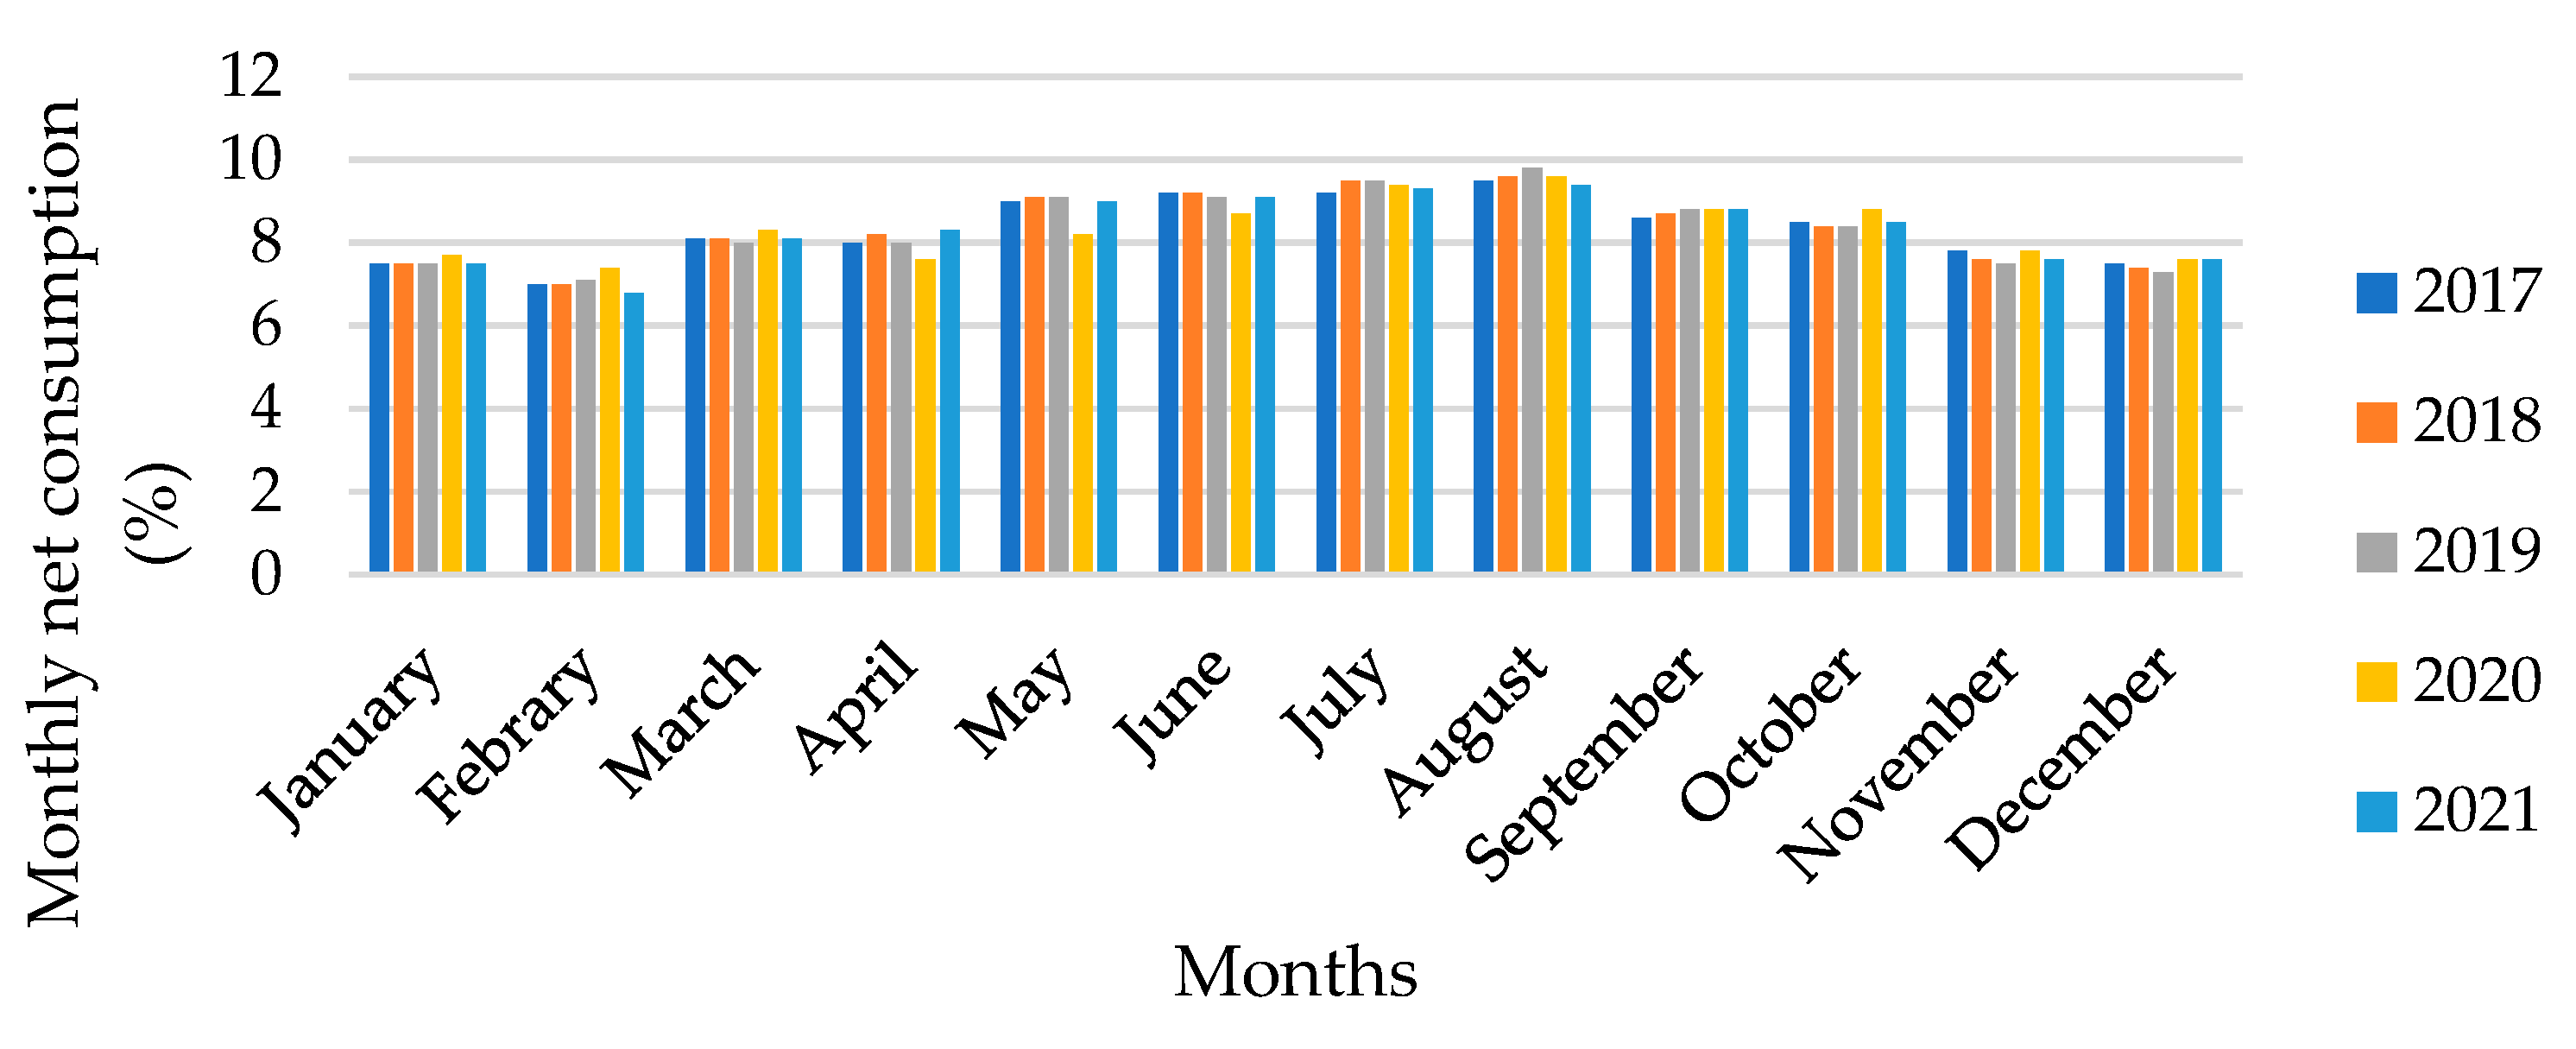
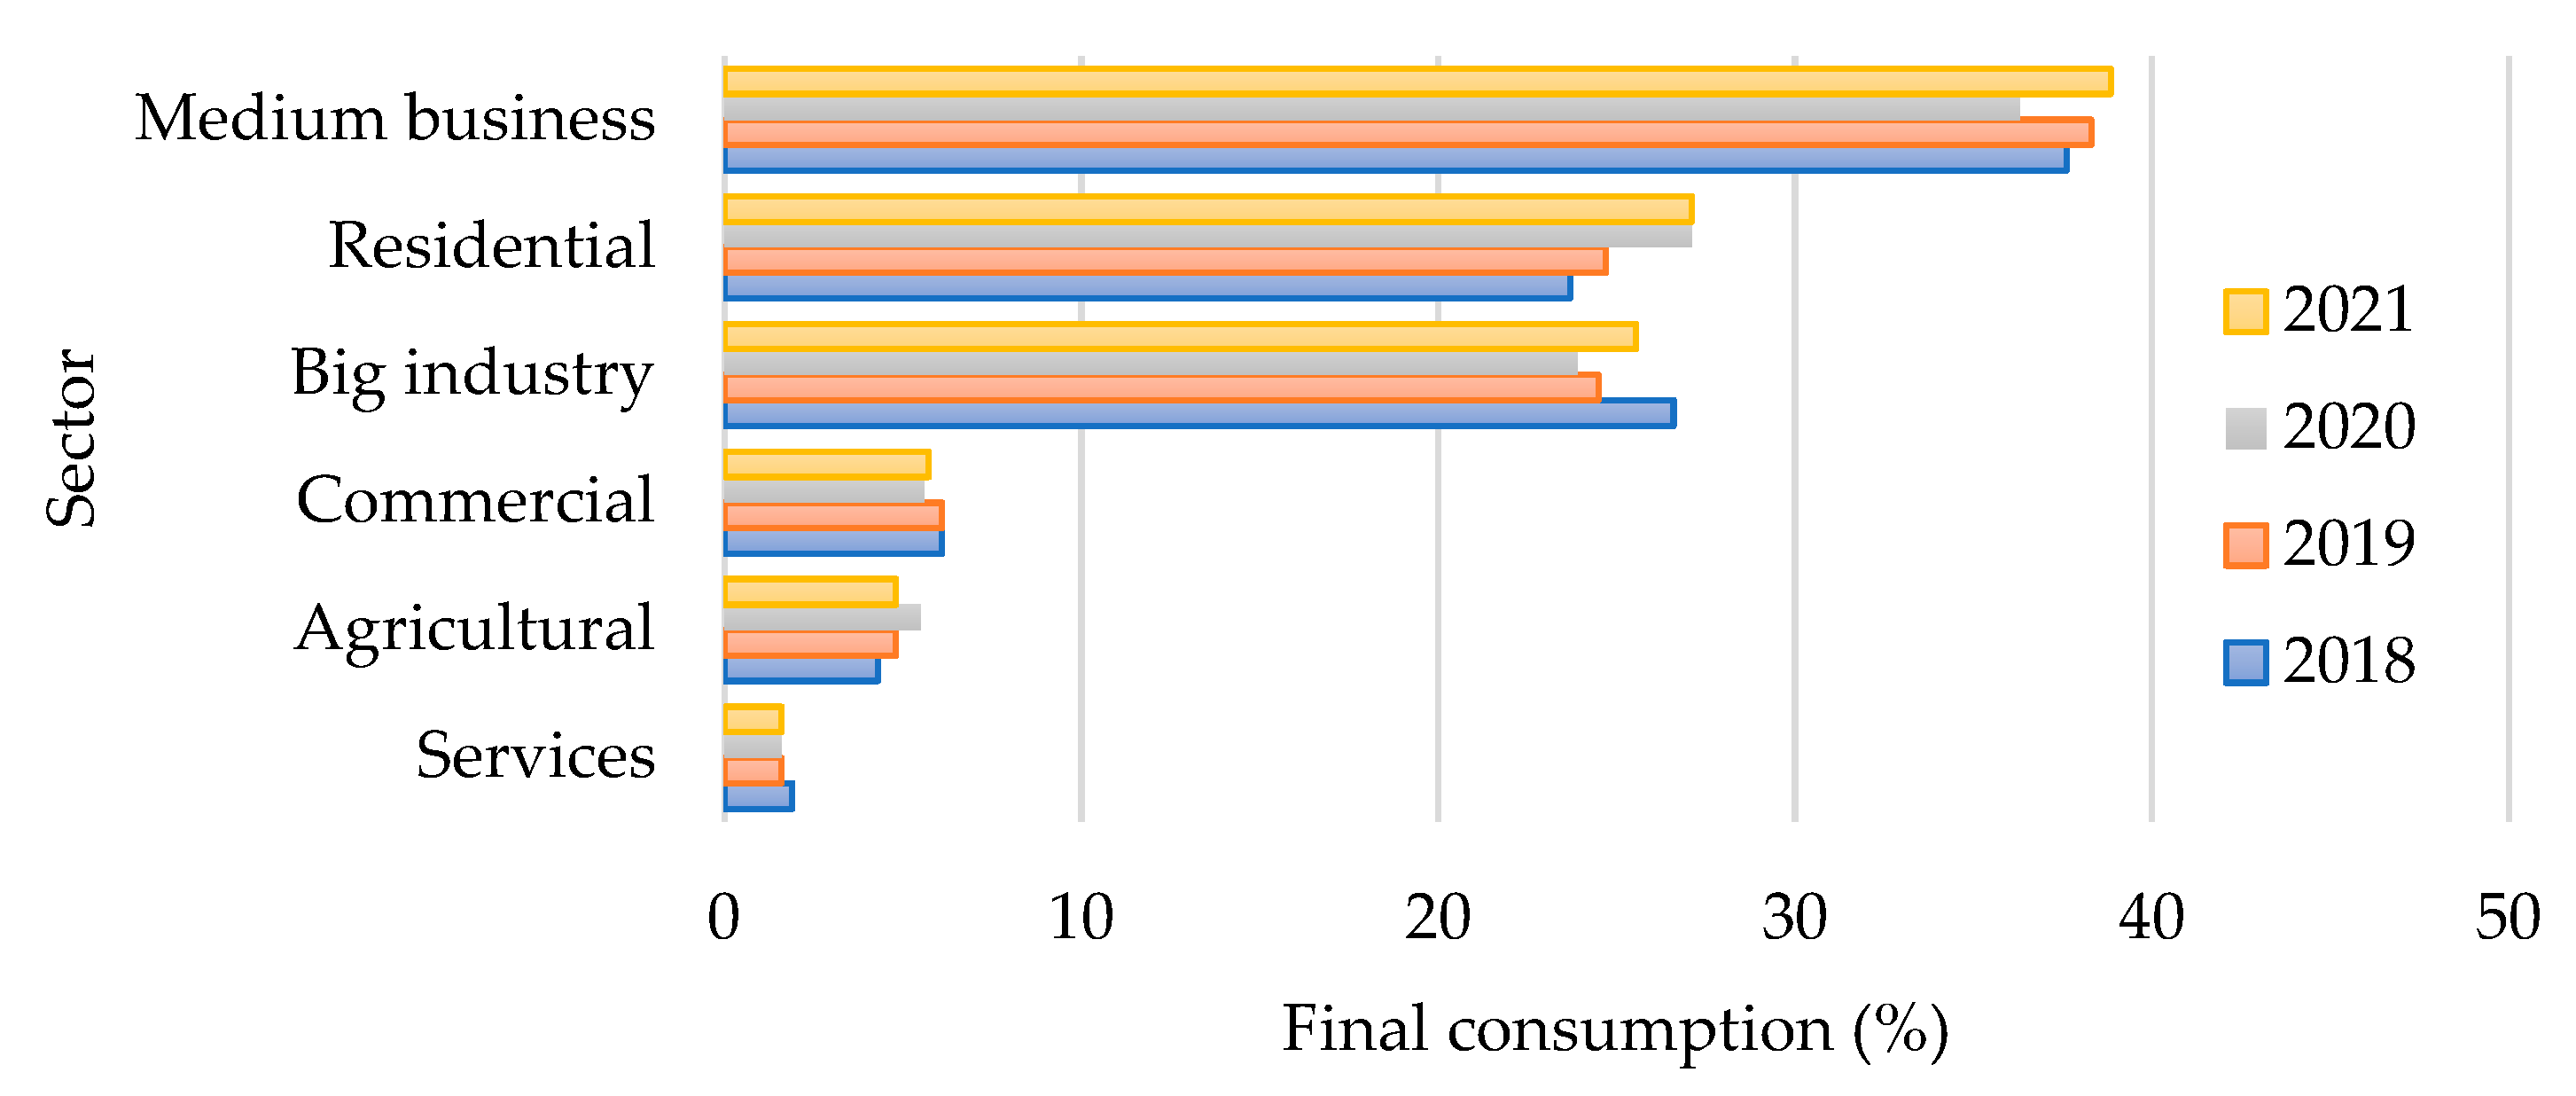
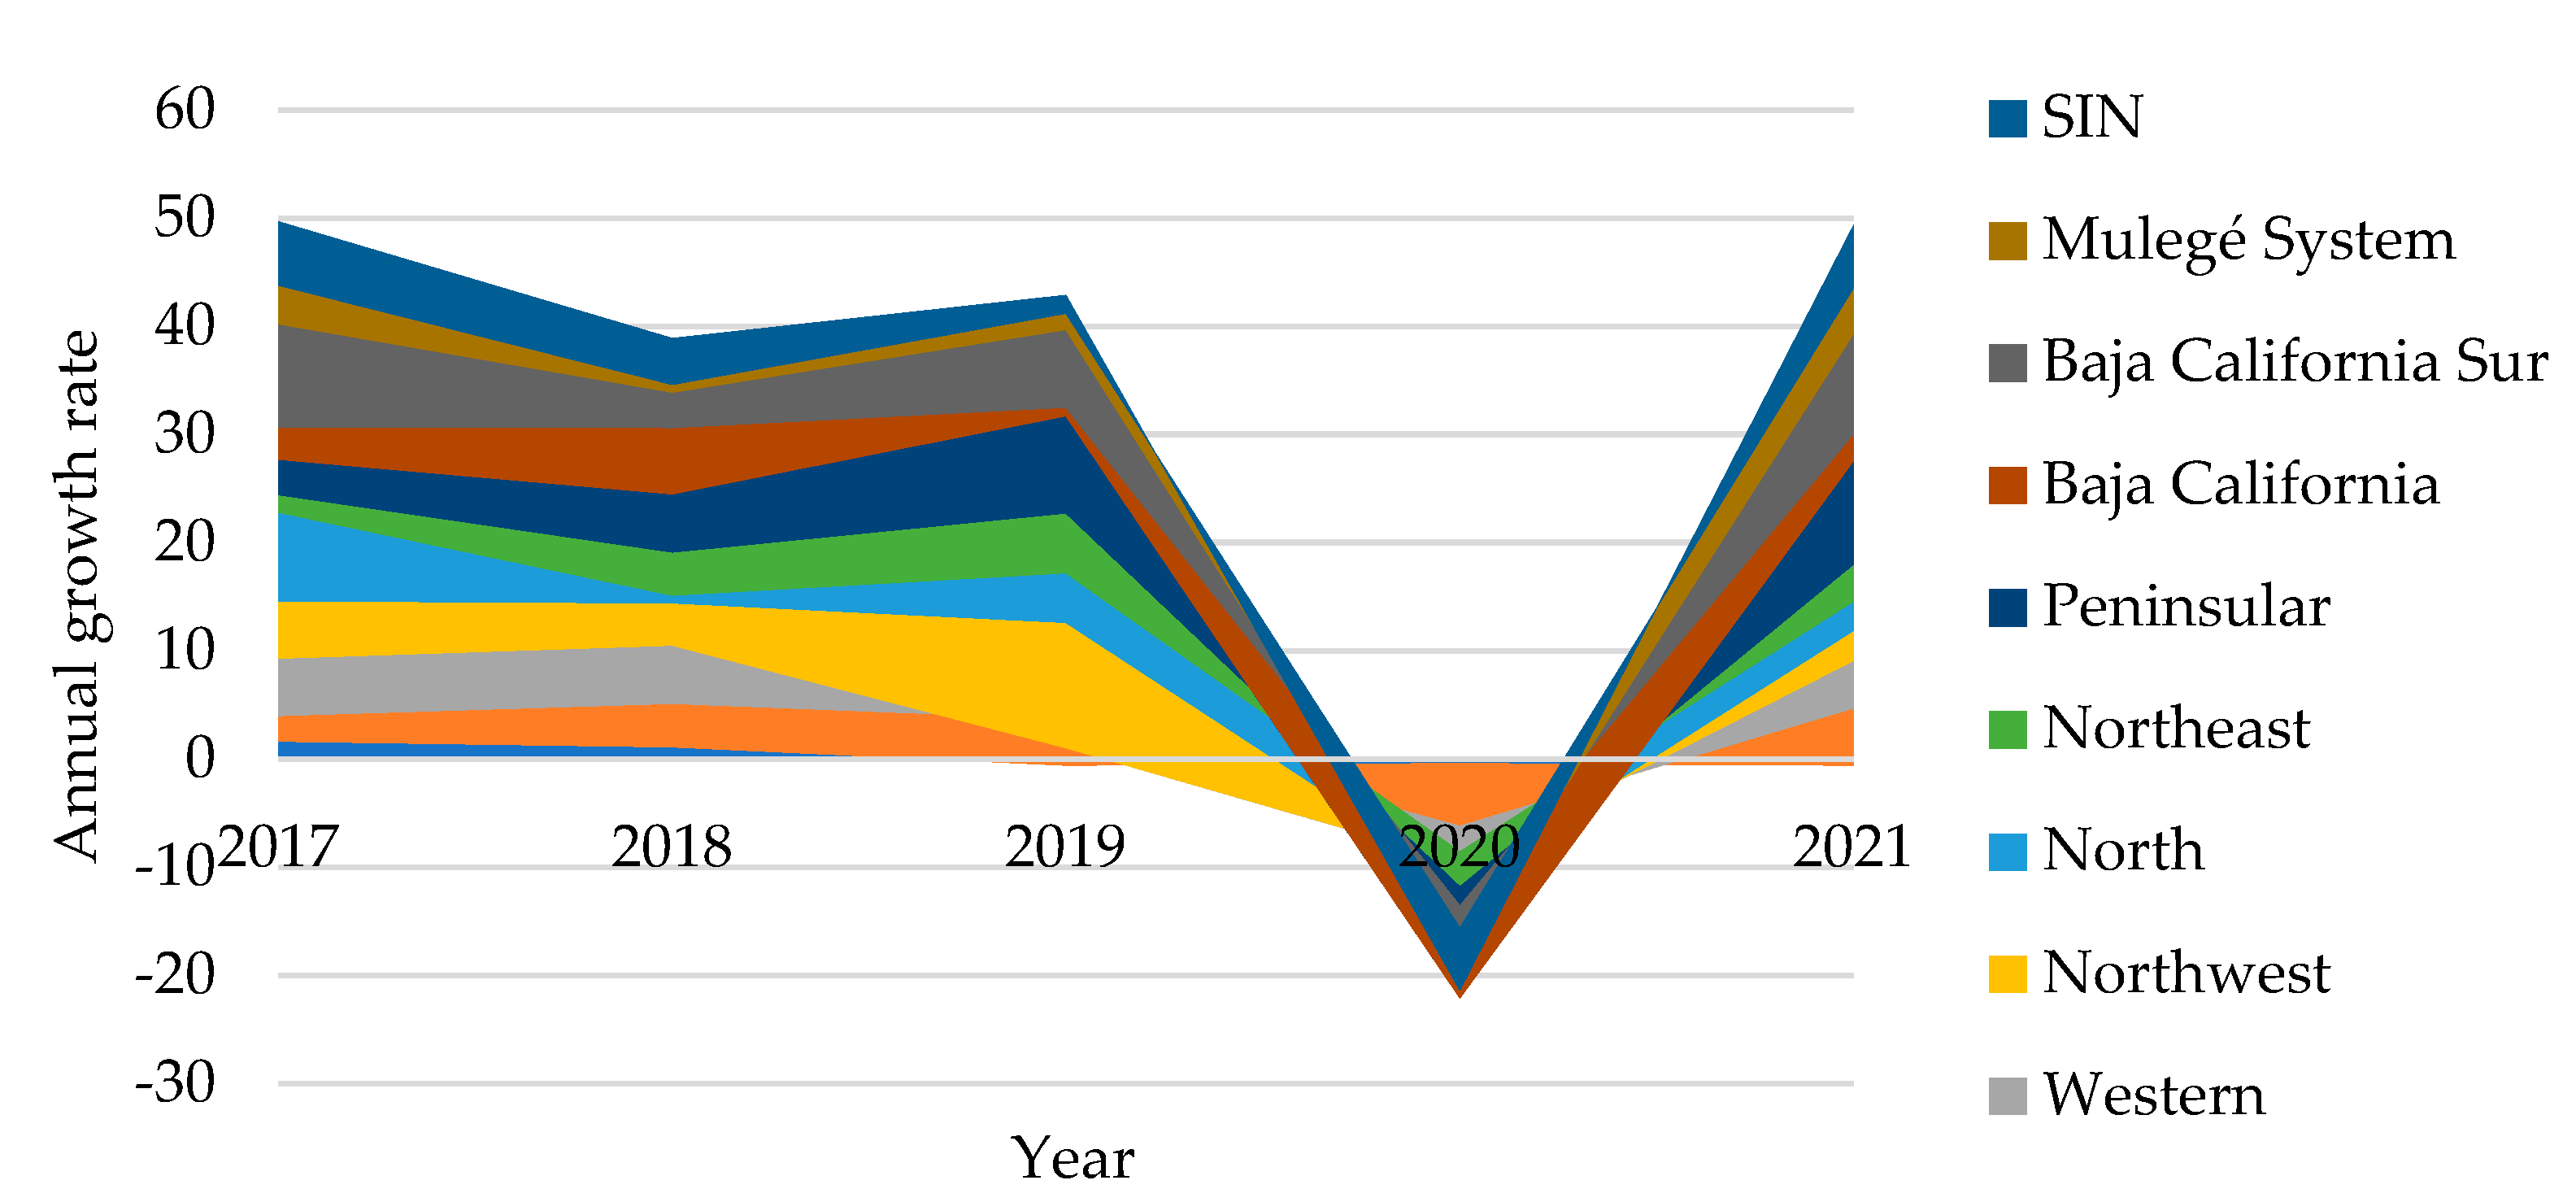
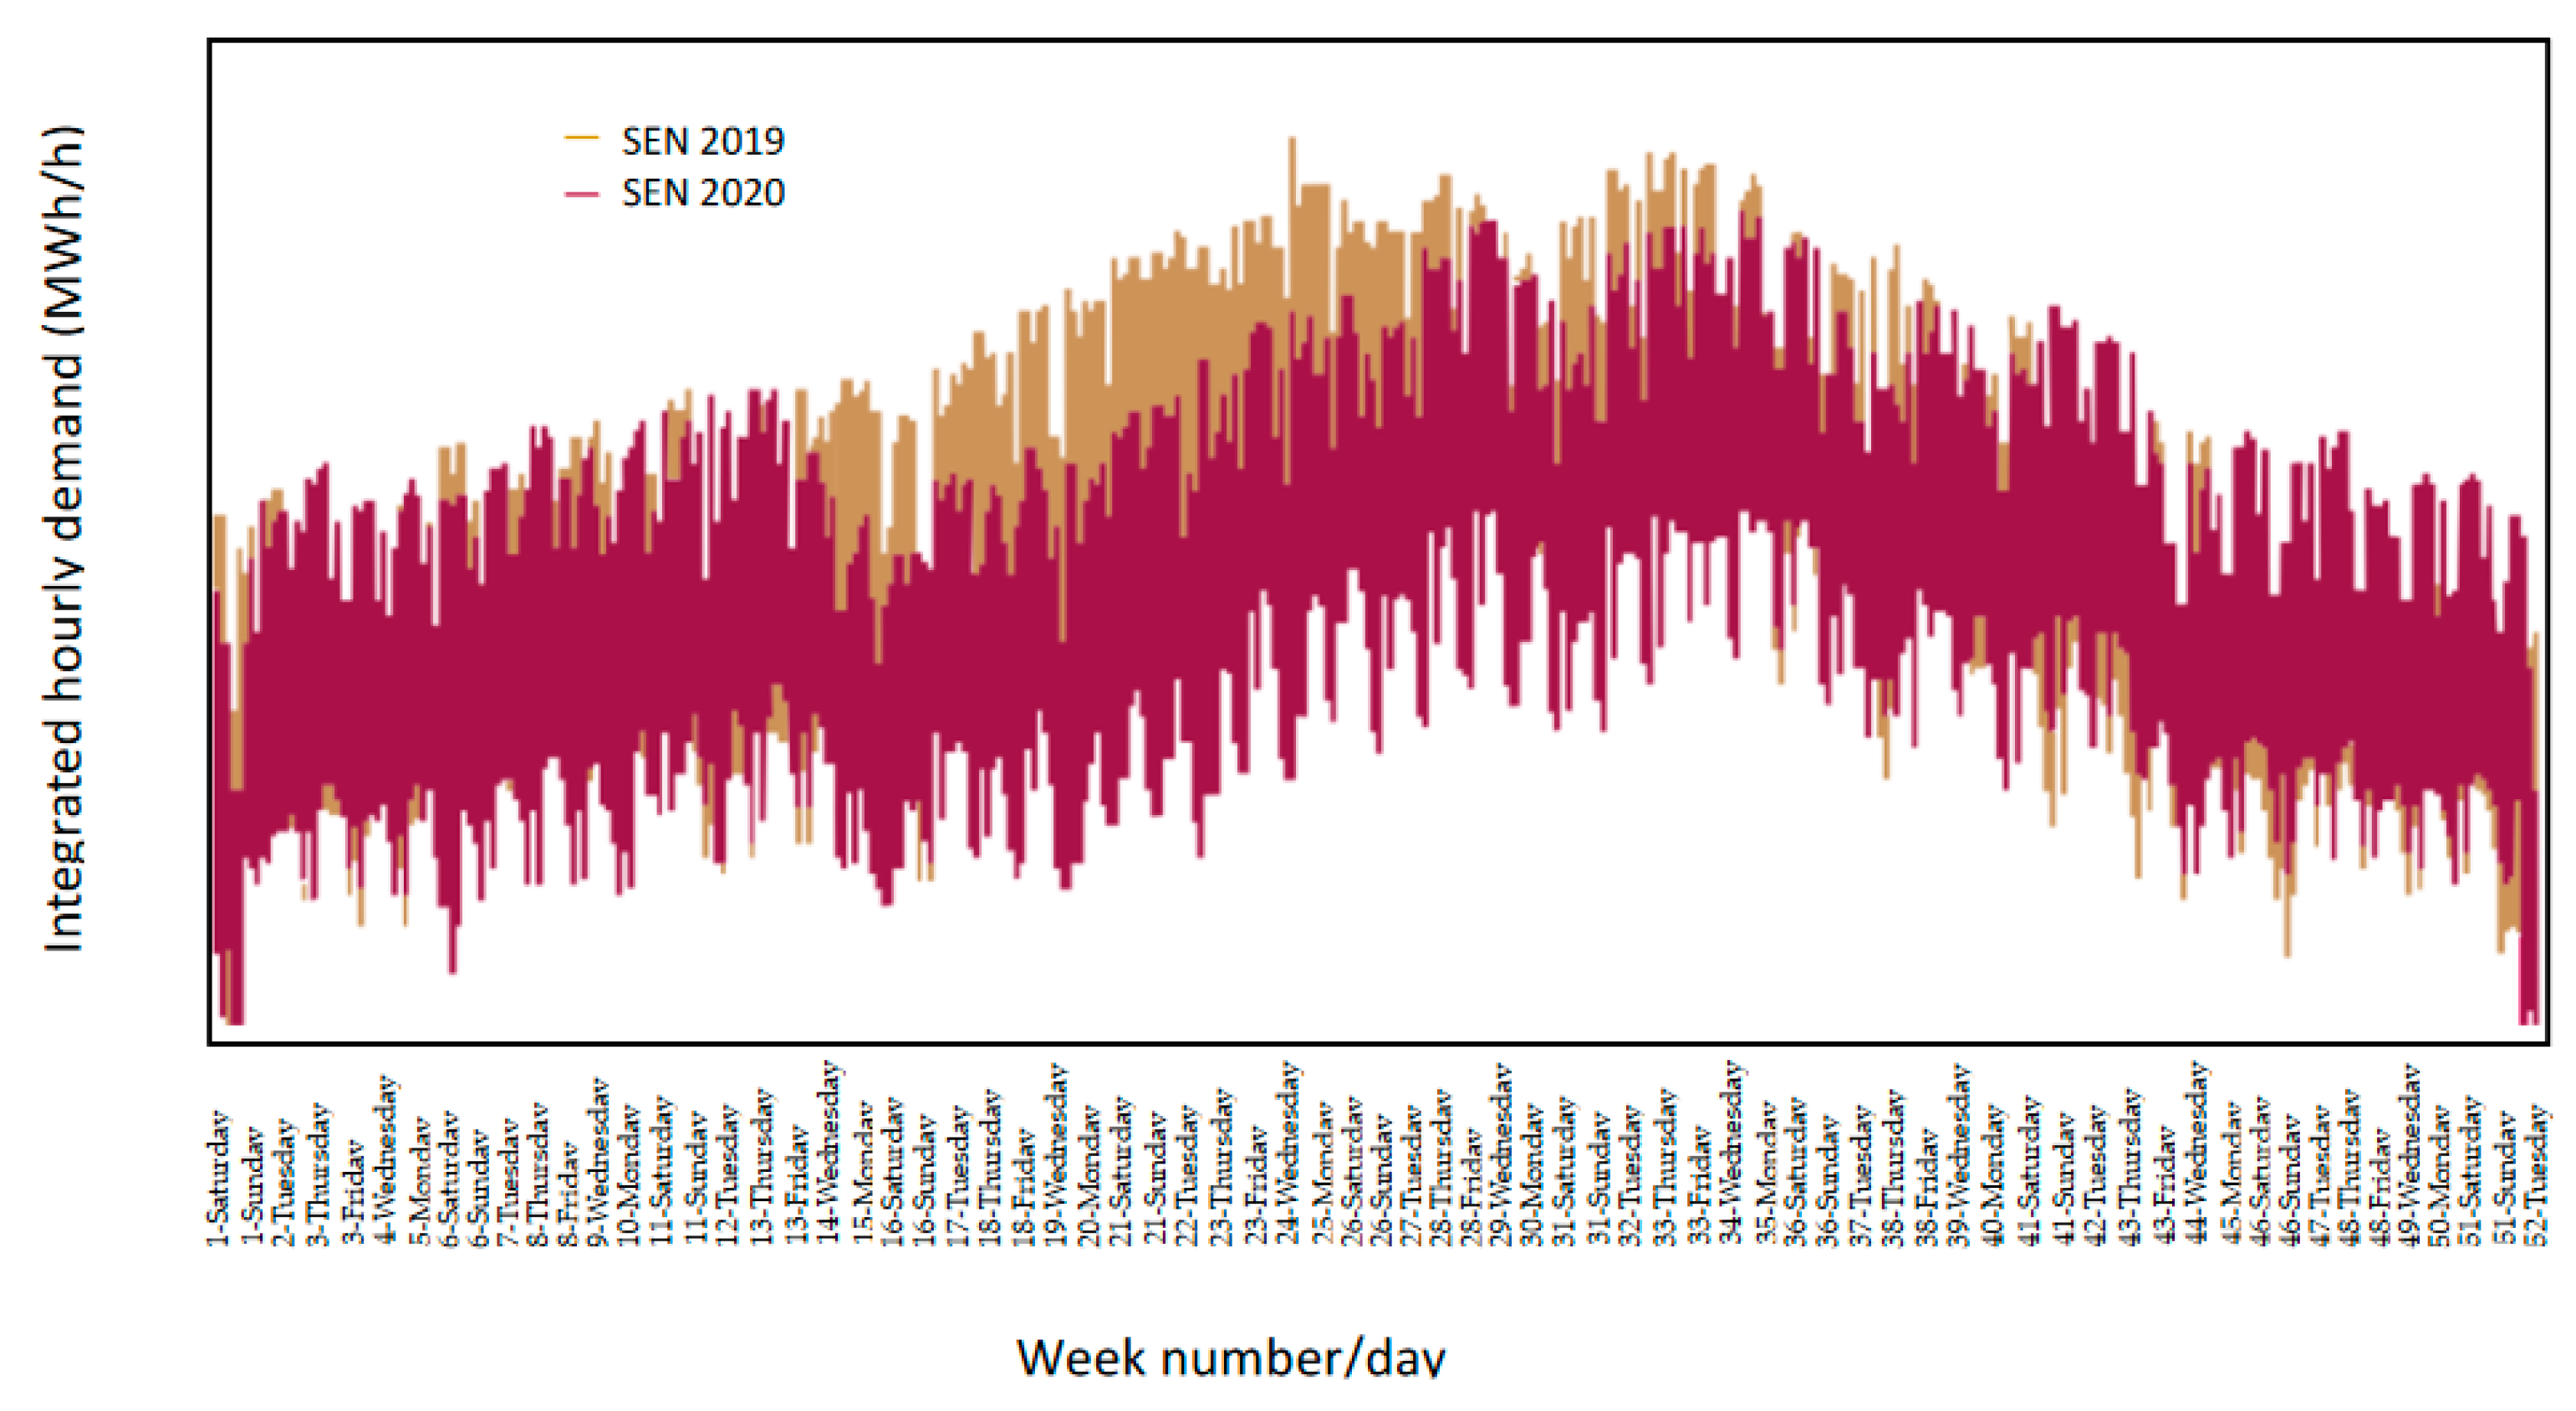
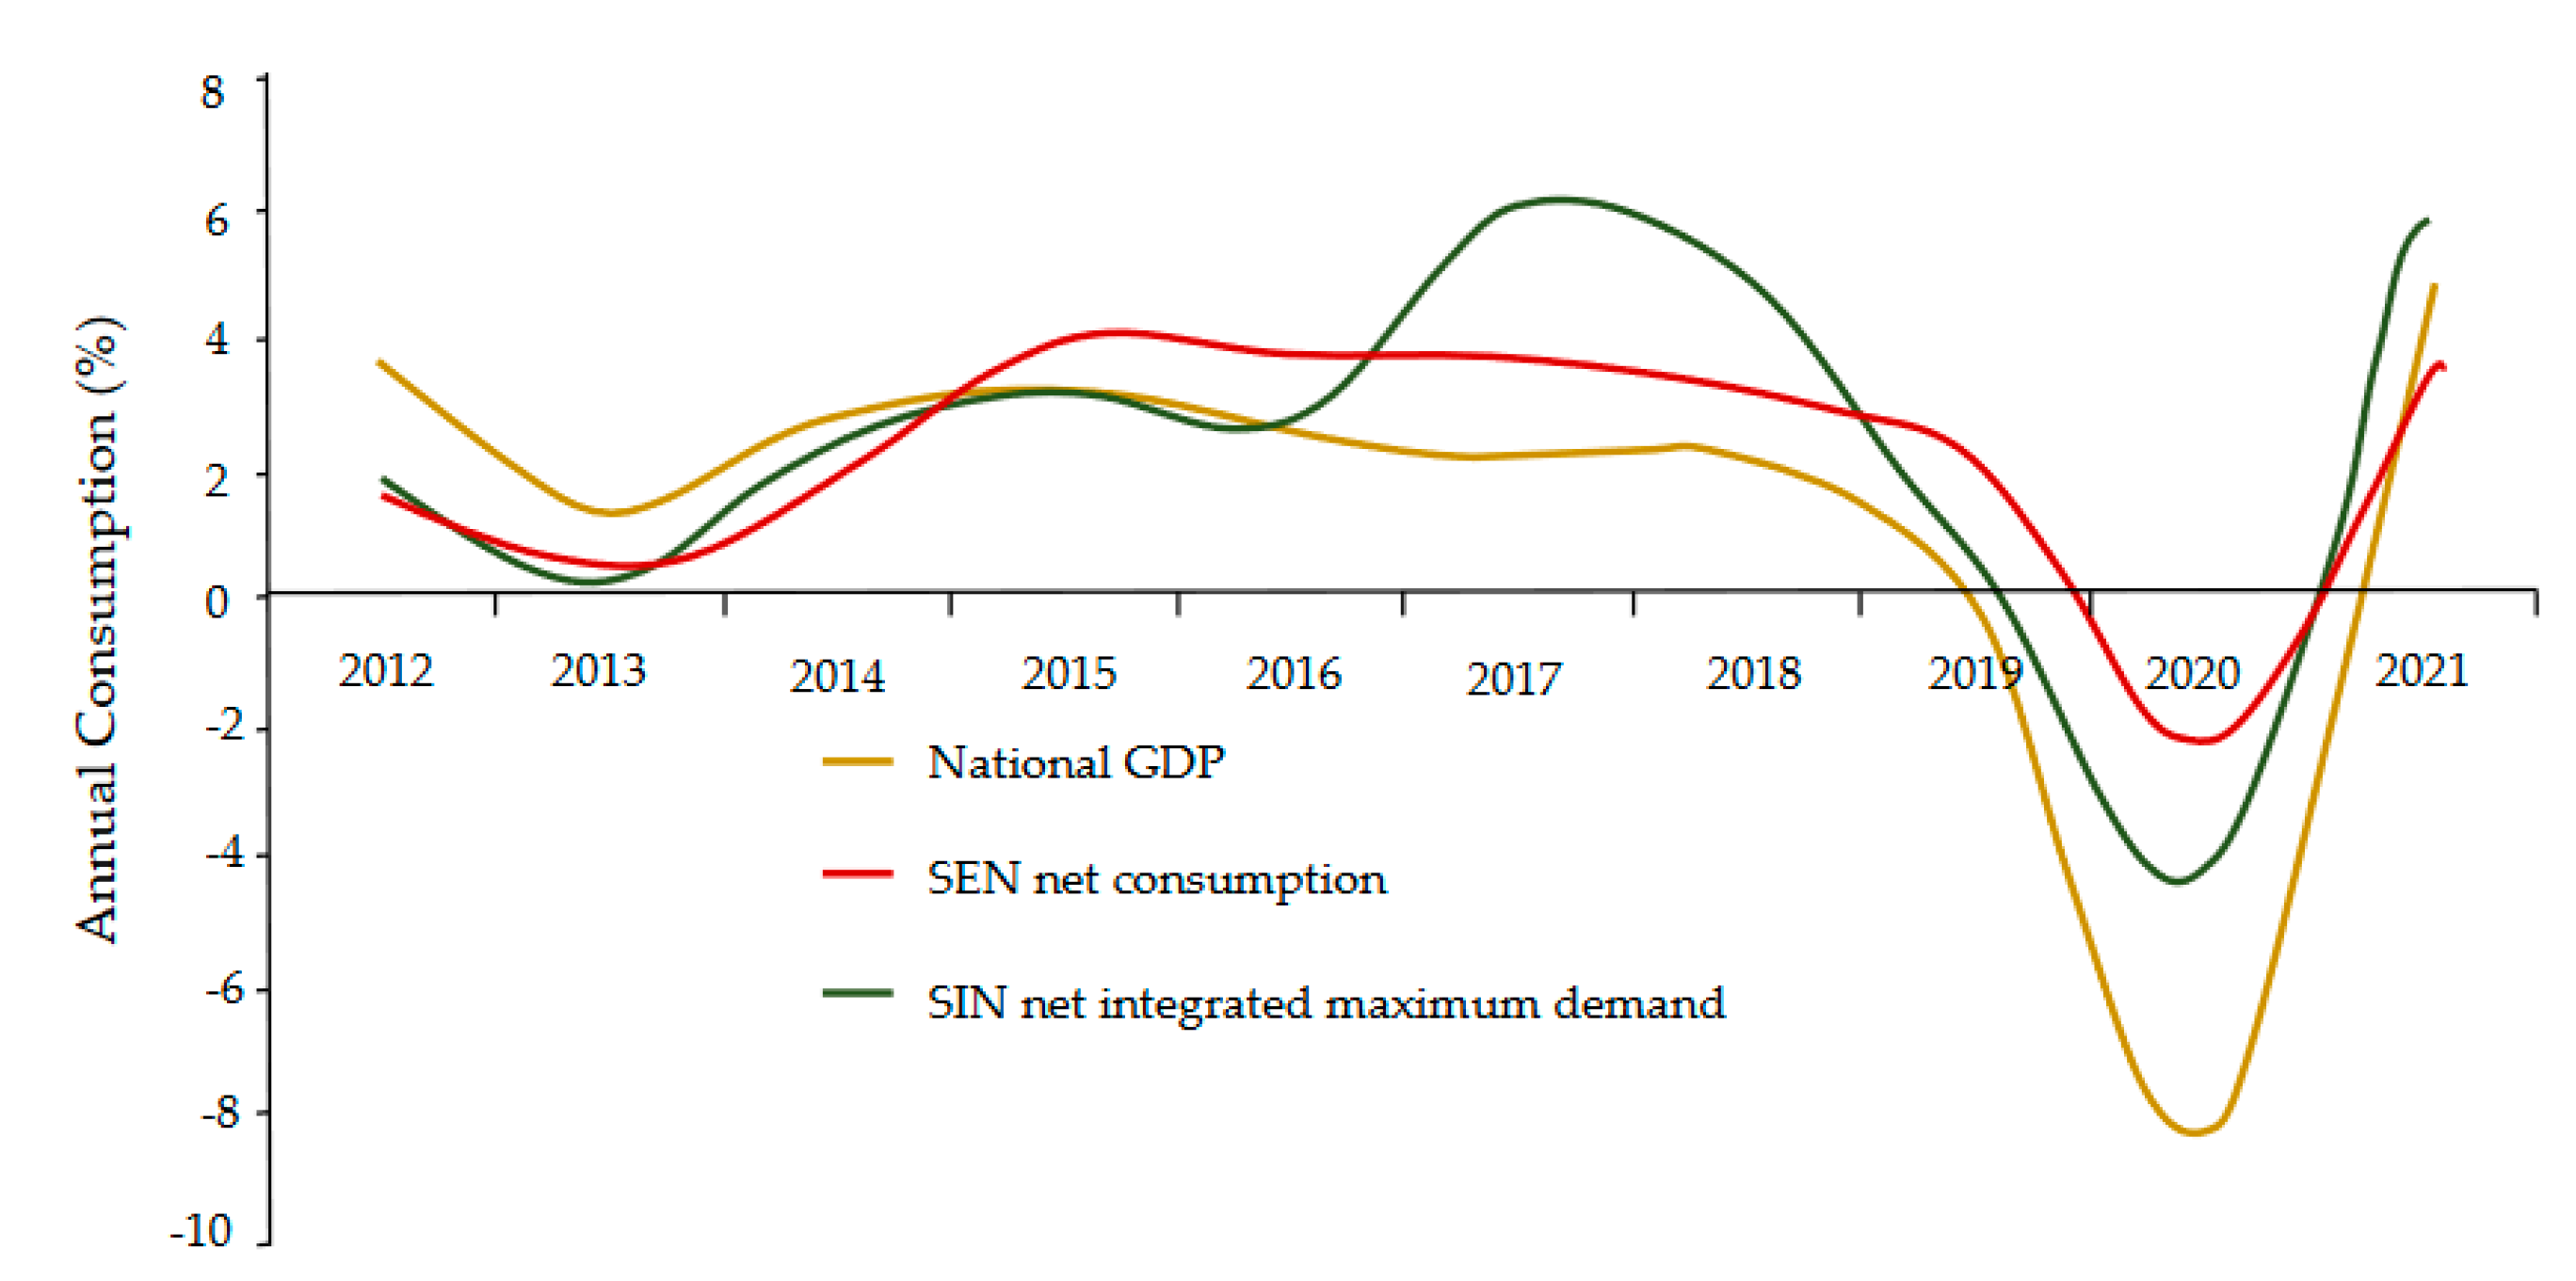
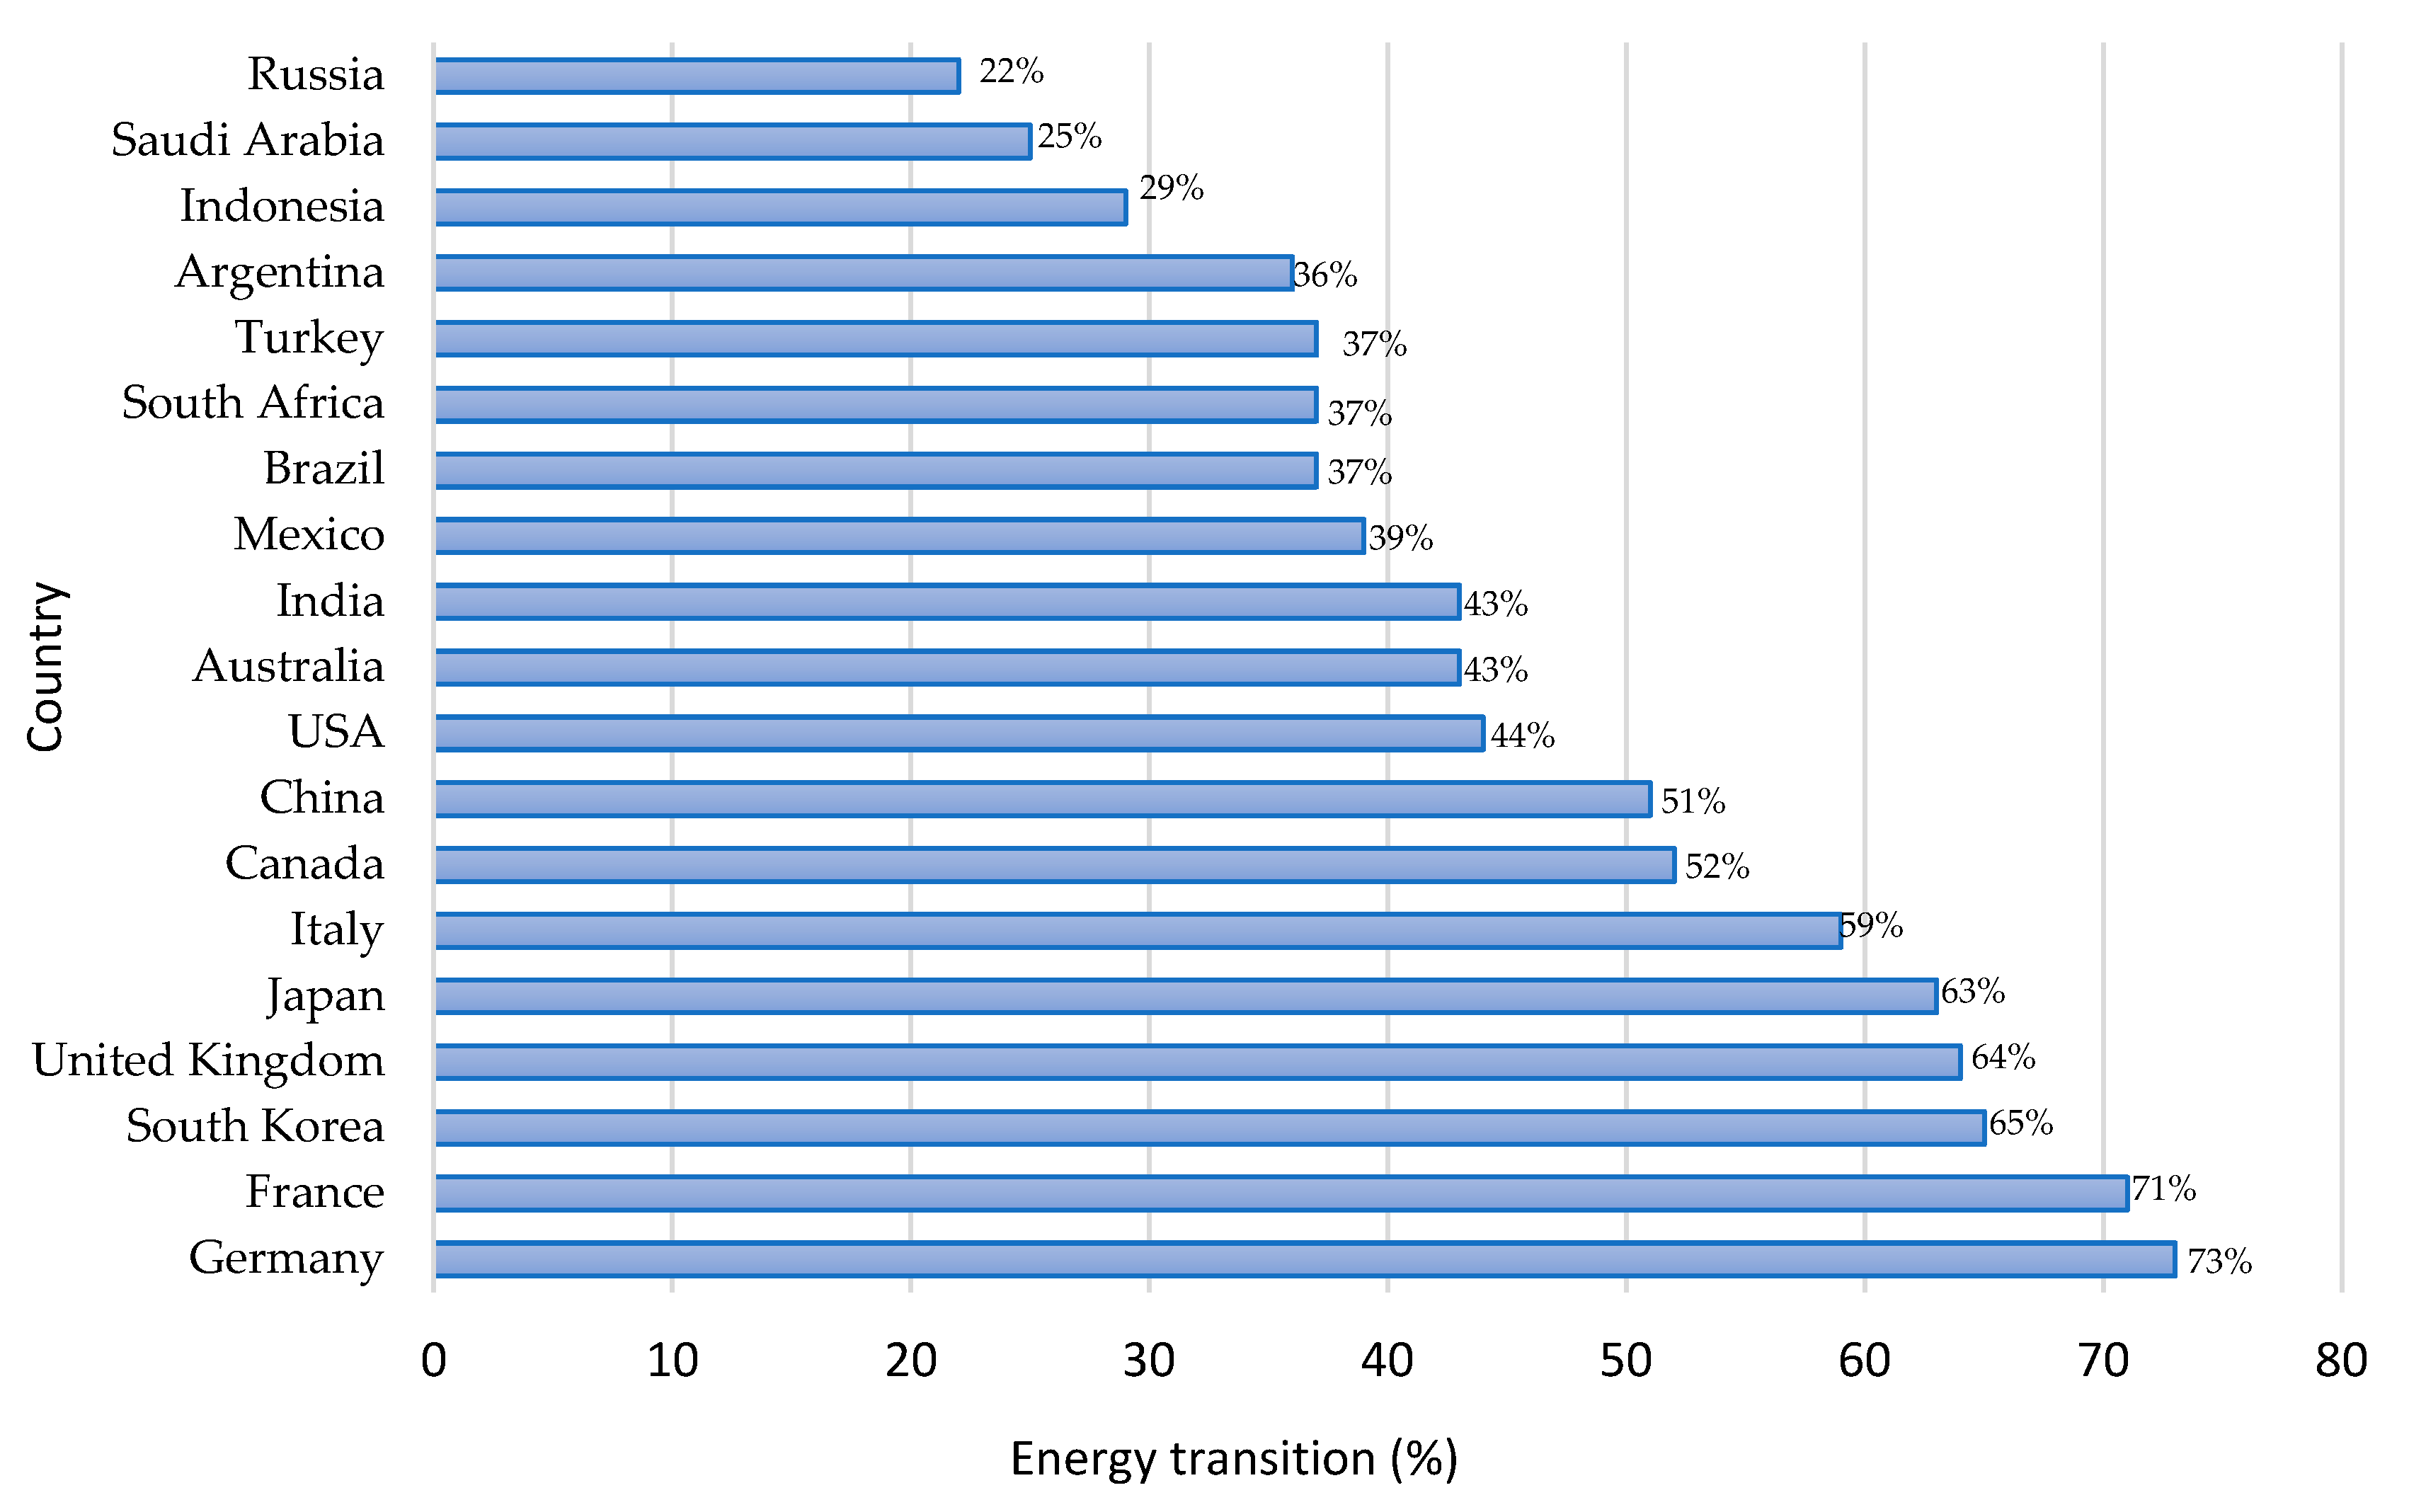
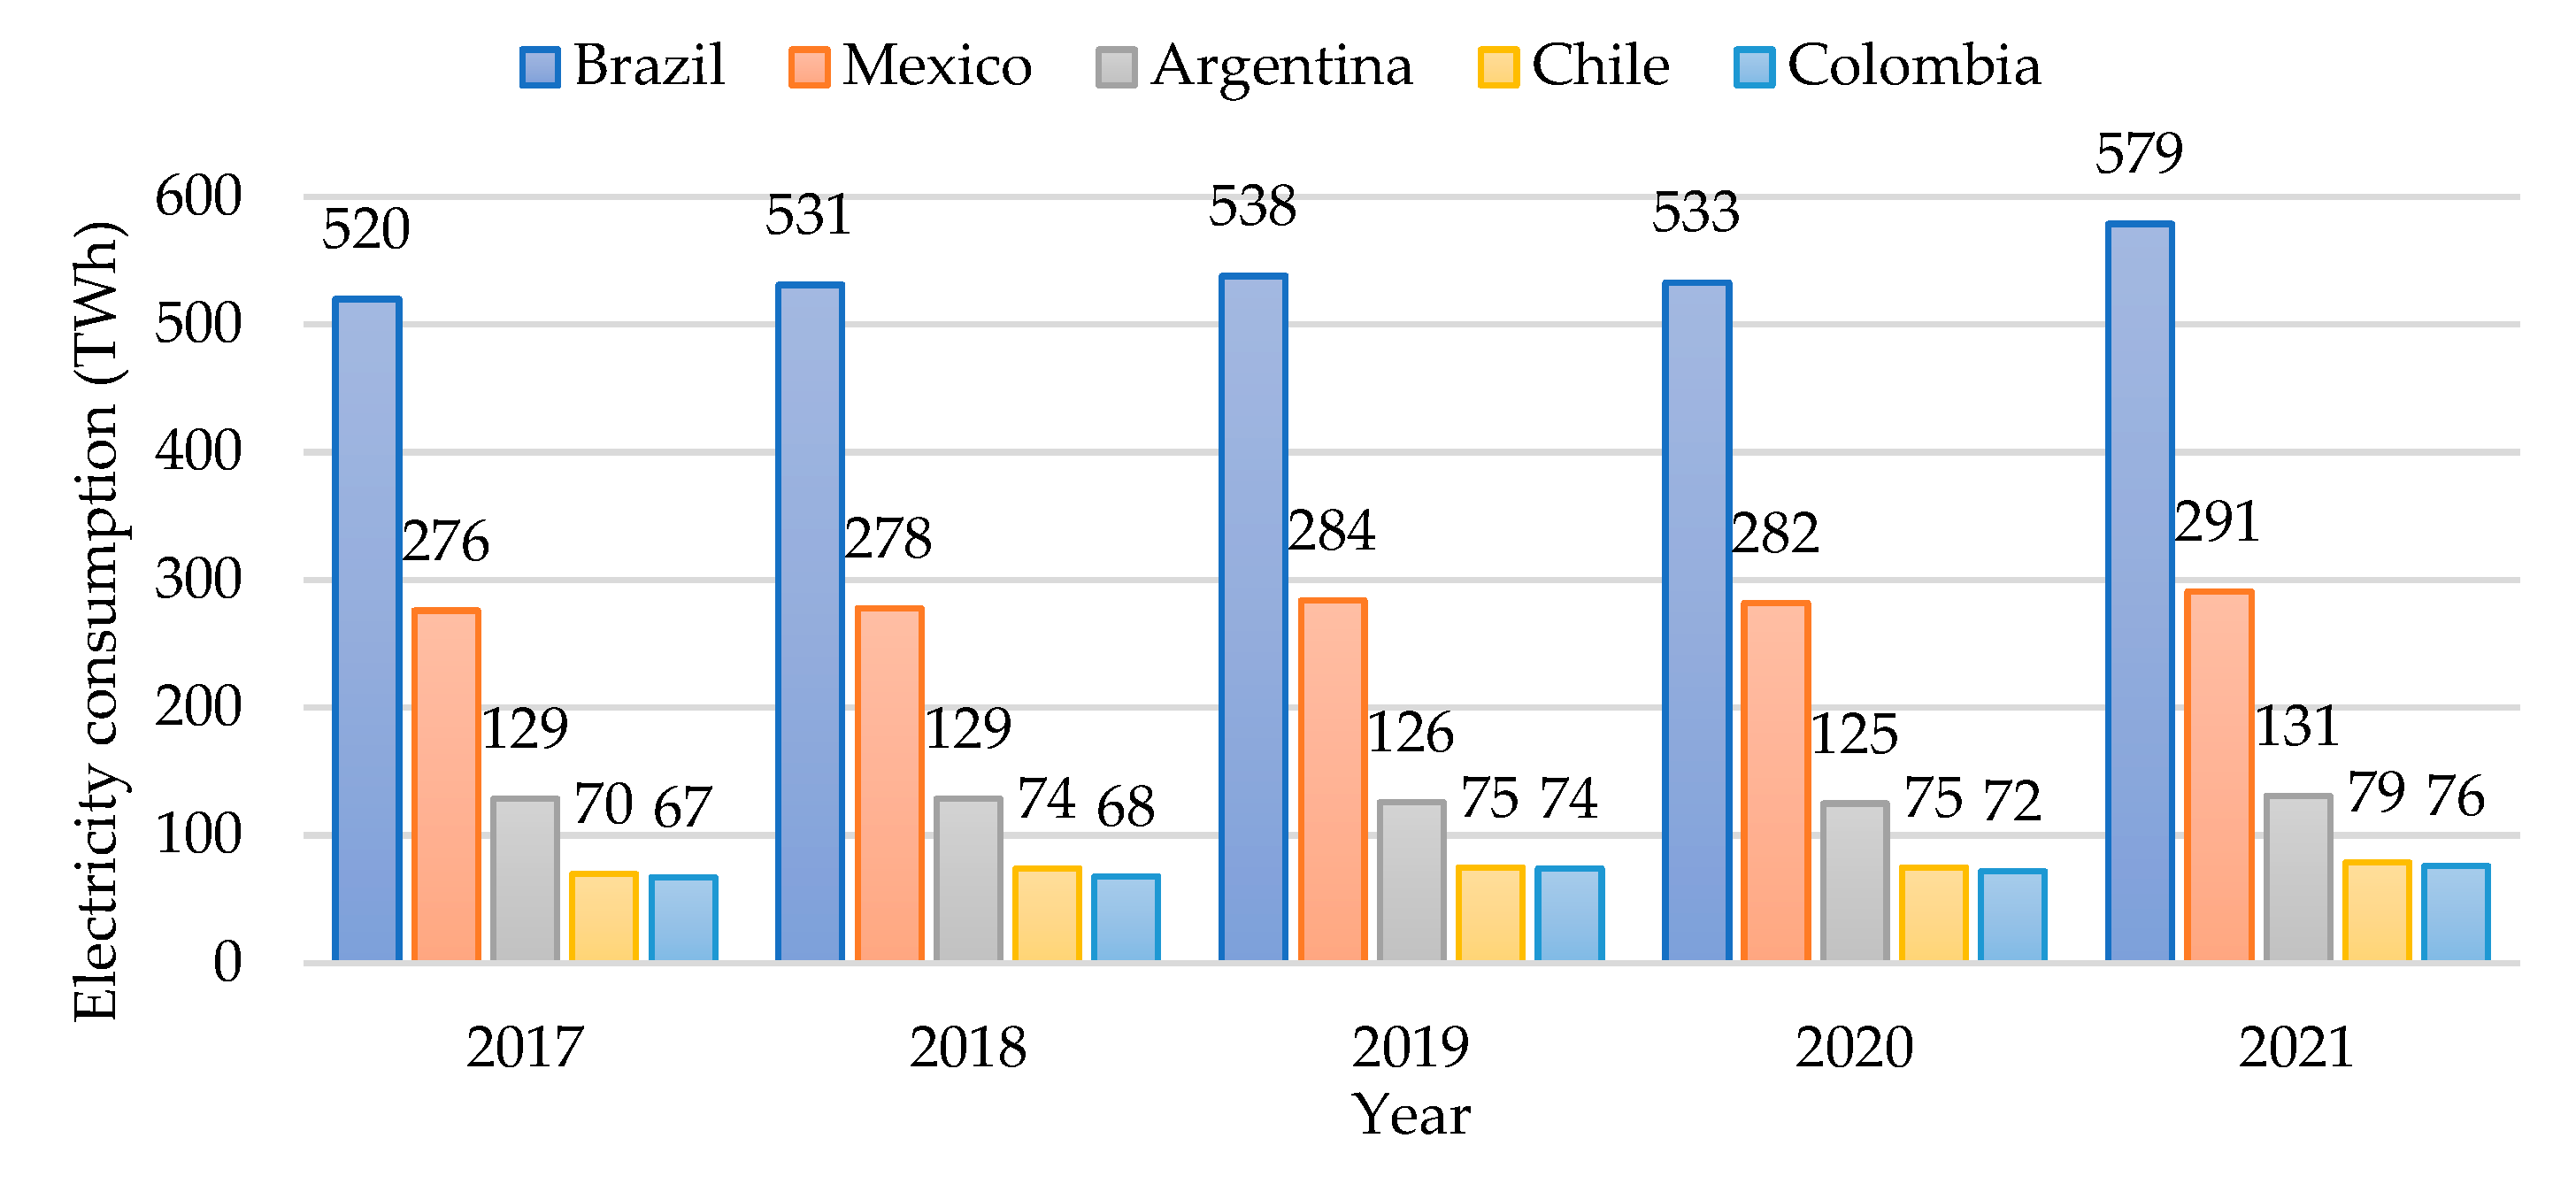
| Acronyms | Description (Spanish) | Description (English) |
|---|---|---|
| CENACE | Centro Nacional de Control de Energía | National Centre of Energy Control |
| CFE | Comisión Federal de Electricidad | Federal Electricity Commission |
| DACG | Disposiciones administrativas generales | General Administrative Provisions |
| GSP | Producto Interno Bruto | Gross Domestic Product |
| IMCO | Centro de Investigación de Políticas Públicas | Public Policy Research Center |
| MEM | Mercado Eléctrico Mayorista | Wholesale Electricity Market |
| PEMEX | Petróleos Mexicanos | Mexican oil |
| PRODESEN | Programa para el Desarrollo del Sistema Eléctrico Nacional | Development of the National Electric System |
| SEN | Sistema Eléctrico Nacional | National Electric System |
| SENER | Secretaría de Energía | Mexican Ministry of Energy |
| SIN | Sistema Interconectado Nacional | National Interconnected System |
| TEM | Transición Energética Mexicana | Mexican Energy Transition |
| WHO | Organización Mundial de la Salud | World Health Organisation |
| Technology | Pre-COVID-19 | COVID-19 | Post-COVID-19 | |||
|---|---|---|---|---|---|---|
| Year | 2017 | 2018 | 2019 | 2020 | 2021 | 2022 |
| Combined cycle | 28.08 | 33.72 | 34.28 | 35.15 | 36.87 | 40.59 |
| Thermoelectric | 12.59 | 11.71 | 8.23 | 7.48 | 7.16 | 5.12 |
| Coal-fired | 5.38 | 5.51 | 5.51 | 5.51 | 5.51 | 5.51 |
| Turbogas | 5.14 | 5.06 | 5.75 | 5.75 | 5.66 | 5.31 |
| Internal combustion | 1.63 | 1.66 | 1.66 | 1.77 | 1.69 | 1.74 |
| Fluidized bed | 0.58 | 0.58 | 0.58 | 0.58 | 0.58 | 0.58 |
| Hydroelectric | 12.64 | 12.67 | 12.67 | 12.67 | 12.67 | 12.67 |
| Wind | 4.19 | 6.59 | 8.13 | 8.86 | 11.23 | 12.42 |
| Geothermal | 0.93 | 0.94 | 0.91 | 0.89 | 0.89 | 0.89 |
| Solar Photovoltaic | 0.21 | 4.43 | 5.63 | 7.55 | 7.75 | 8.05 |
| Nucleoelectric | 1.61 | 1.61 | 1.61 | 1.61 | 1.61 | 1.61 |
| Bioenergy | 1.01 | 1.01 | 1.01 | 1.05 | 1.29 | 1.58 |
| Efficient cogeneration | 1.23 | 1.93 | 1.93 | 1.93 | 1.93 | 2.01 |
| Regenerative brakes | 0.007 | 0.007 | 0.07 | 0.07 | 0.07 | 0.07 |
| Total (GW) | 75.7 | 87.44 | 87.97 | 90.82 | 94.87 | 98.1 |
| Technology | Pre-COVID-19 | COVID-19 | Post-COVID-19 | ||
|---|---|---|---|---|---|
| Year | 2017 | 2018 | 2019 | 2020 | 2021 |
| Combined cycle | 165.25 | 163.88 | 175.51 | 185.64 | 186.72 |
| Thermoelectric | 42.78 | 39.34 | 38.02 | 22.41 | 22.19 |
| Coal-fired | 30.55 | 27.35 | 21.61 | 12.53 | 8.70 |
| Turbogas | 12.85 | 9.51 | 10.90 | 8.66 | 11.15 |
| Internal combustion | 4.01 | 2.59 | 3.19 | 2.84 | 2.12 |
| Hydroelectric | 31.85 | 32.23 | 23.20 | 26.82 | 34.72 |
| Wind | 10.62 | 12.44 | 16.73 | 19.70 | 21.07 |
| Geothermal | 6.04 | 5.06 | 5.06 | 4.57 | 4.24 |
| Solar Photovoltaic | 0.344 | 3.211 | 9.96 | 15.84 | 20.19 |
| Bioenergy | 1.88 | 1.99 | 1.87 | 2.21 | 1.59 |
| Nucleoelectric | 10.88 | 13.2 | 10.88 | 10.86 | 11.61 |
| Efficient cogeneration | 6.93 | 2.42 | 3.38 | 4.29 | 3.42 |
| Regenerative brakes | 0.004 | 0.004 | 0.004 | 0.004 | 0.004 |
| Total (TWh) | 329.16 | 313.98 | 321.58 | 317.27 | 328.59 |
| Technology | Pre-COVID-19 | COVID-19 | Post-COVID-19 | ||
|---|---|---|---|---|---|
| 2017 | 2018 | 2019 | 2020 | 2021 | |
| Central 1 | 60.68 | 61.29 | 60.85 | 57.43 | 56.87 |
| Eastern | 48.58 | 50.28 | 51.66 | 50.44 | 52.07 |
| Western | 66.69 | 68.11 | 69.69 | 68.15 | 69.89 |
| Northwest | 24.29 | 24.68 | 24.97 | 26.1 | 25.55 |
| North | 25.95 | 27 | 28.87 | 29.29 | 28.95 |
| Northeast | 54.42 | 56.43 | 54.42 | 54.24 | 57.15 |
| Peninsular | 12.49 | 12.98 | 13.87 | 12.49 | 13.55 |
| SIN | 282.66 | 300.79 | 307.33 | 298.15 | 304.02 |
| Baja California | 13.83 | 14.54 | 14.62 | 14.94 | 15.54 |
| Baja California Sur | 2.62 | 2.76 | 2.82 | 2.72 | 2.83 |
| Mulegé System | 0.152 | 0.155 | 0.155 | 0.159 | 0.15 |
| SEN (TWh) | 309.73 | 318.24 | 324.93 | 315.97 | 322.54 |
| Technology | Pre-COVID-19 | COVID-19 | Post-COVID-19 | ||
|---|---|---|---|---|---|
| Year | 2017 | 2018 | 2019 | 2020 | 2021 |
| Central | 8.71 | 8.81 | 8.75 | 8.72 | 8.29 |
| Eastern | 7.29 | 7.59 | 7.92 | 7.45 | 7.74 |
| Western | 9.84 | 10.37 | 10.09 | 9.76 | 10.17 |
| Northwest | 4.58 | 4.76 | 5.31 | 5.31 | 5.31 |
| North | 4.61 | 4.64 | 4.85 | 4.98 | 4.98 |
| Northeast | 8.85 | 9.2 | 9.71 | 9.39 | 9.53 |
| Peninsular | 1.96 | 2.06 | 2.25 | 2.01 | 2.19 |
| Baja California | 2.69 | 2.86 | 2.89 | 3.12 | 3.15 |
| Baja California Sur | 0.48 | 0.5 | 0.54 | 0.51 | 0.54 |
| Mulegé System | 0.03 | 0.03 | 0.03 | 0.03 | 0.03 |
| SIN (TWh) | 43.32 | 45.17 | 45.95 | 43.27 | 45.24 |
Disclaimer/Publisher’s Note: The statements, opinions and data contained in all publications are solely those of the individual author(s) and contributor(s) and not of MDPI and/or the editor(s). MDPI and/or the editor(s) disclaim responsibility for any injury to people or property resulting from any ideas, methods, instructions or products referred to in the content. |
© 2023 by the authors. Licensee MDPI, Basel, Switzerland. This article is an open access article distributed under the terms and conditions of the Creative Commons Attribution (CC BY) license (http://creativecommons.org/licenses/by/4.0/).


