Preprint
Article

Changes in Cortisol and in Oxidative/Nitrosative Stress Indicators after ADHD Treatment

Altmetrics

Downloads

142

Views

55

Comments

0

A peer-reviewed article of this preprint also exists.

Submitted:

18 December 2023

Posted:

19 December 2023

You are already at the latest version

Alerts
Abstract
ADHD, one of the most prevalent diseases during childhood, we still do not know its precisely origin, although oxidative/nitrosative stress and the hypothalamic-pituitary-adrenal axis are suggested contributors. Methylphenidate, among others, is the main drug used in these patients, but its effects on relevant markers and structures remain unclear. This study, involving 59 patients diagnosed with ADHD according to DSM-5 criteria, aimed to assess changes in cortisol levels (using cortisol awakening response, CAR) and oxidative/nitrosative status with the treatment. Blood samples before and 3 months after treatment with methylphenidate were used to measure oxidative and inflammatory markers, and the endogenous antioxidant activity, while saliva samples tracked cortisol awakening response (CAR). The results show a treatment-related improvement in the redox profile, with the reduction of advanced oxidation protein products (AOPP), lipid peroxidation (LPO), and nitrite plus nitrate (NOx) levels, and the increase of the enzymatic activities of glutathione reductase (GRd) and catalase (CAT). Moreover, the area under the curve (AUC) of CAR increased significantly, indicating increased reactivity of the HPA axis. These result support by the first time the involvement of the endogenous antioxidant system in the pathophysiology of ADHD.
Keywords: 
Subject: Medicine and Pharmacology  -   Pediatrics, Perinatology and Child Health

1. Introduction

Attention Deficit Hyperactivity Disorder (ADHD) is a neurodevelopmental disease whose main symptoms are inattention, hyperactivity, and impulsivity [1] .ADHD is one of the most common childhood disorders, with a prevalence of around 5-8% of the children population [2]. During school years, ADHD is diagnosed more frequently in males (4 boys/1 girl) with a predominance of hyperactive-impulsive presentation, while in adolescence and young adulthood the ratio changes to 1 man/2 women and predominance of inattentive presentation. It is estimated that two thirds of affected children will continue with symptomatology into adulthood, which translates into a prevalence setting at 2-3% of the adult population [3,4]. Another important feature of ADHD is its high comorbidity: about 85% of patients have other associated diseases, making it a disease with an important impact on public health system [5].
The etiology of ADHD is not well known, although it appears to be a multifactorial disease, where genetic inheritance plus environmental interaction, is suggested. Many studies justify the hereditary condition of ADHD, estimating a 76% of heritability [6]. Increasing evidence suggests that several biological stress-related systems including the hypothalamic-pituitary-adrenal (HPA) axis, play a key role in this disorder [7]. HPA participates in the regulation of neurotransmitters and stress response, and ADHD patients present a low reactivity of the HPA axis when they are exposed to stressful situations [8]. The endpoint of HPA axis activation is the release of cortisol [9]. The secretion of cortisol follows a diurnal cycle peaking at early morning and gradually decrease until midnight. In addition to this circadian variation, an acute increase in cortisol secretion occurs after awakening too, known as "Cortisol Awakening Response"(CAR). CAR is a specific increase in cortisol levels of approximately 50–75% that occurs within 30–45 min after awakening in the morning and has become the most appropriate measure of HPA activation [10,11]. Variations from the usual CAR pattern are assumed to mark maladaptive neuroendocrine processes [12] and reduced cortisol awakening responses have been reported in children with ADHD compared with healthy control children [13].
Additionally, the other stress-related system associated to ADHD comprise oxidative stress and neuroinflammation. Oxidative stress is defined as an imbalance between the generation of reactive oxygen species (ROS) and antioxidant defense capacity of the cell [14] .Oxidative stress leads to protein and lipid oxidation and damage to DNA structure, which, together with catecholaminergic dysregulation and other genetic and environmental factors, results in a potent neuroprotective and inflammatory response [15,16,17,18,19,20]. Recent studies report high level of oxidative damage with decreased activity of some antioxidant enzymes in ADHD patients, supporting the theory that oxidative stress could be considered as another pathophysiological factor in this disease [16,21].
Regarding ADHD therapies, an appropriate strategy consists of a multimodal treatment combining psychological and behavioral therapy with pharmacological measures, where the main protagonists are methylphenidate and lisdextroamfetamine (stimulants) and atomoxetine and guanfacine (non-stimulant drugs) [22,23]. However, how these therapies affect the HPA axis, and the redox system is yet unknown. For this reason, the main objective of the present study was to measure the levels of cortisol and different markers of oxidative stress to determine if clinically significant differences occurred after the usual treatment of ADHD. Additionally, we also evaluated whether, within our patients, there were differences between the prepuberal and puberal groups.

2. Materials and Methods

2.1. Patients

The study was carried out with a total of 59 participants, classified into prepuberal and puberal children, according to the Tanner scale [24]. The inclusion criteria in both groups were: diagnosis of ADHD, normal intellectual ability (Kauffman Brief Intelligence Test), absence of other pathologies (except for the comorbidities typical of these patients) and absence of pharmacological treatment. Exclusion criteria were absence of informed consent, intellectual disabilities, presence of other chronic diseases and patients on pharmacological treatment. The protocol was approved by the Hospital Universitario Clínico San Cecilio's Ethical Committee (no.0250-N-20).

2.2. Research design

The study was conducted between September 2020 and May 2023. It is a prospective, quasi-experimental, longitudinal follow-up study based on daily clinical practice. All participants provided written informed consent and were submitted to structured clinical interview and a blood and salivatest before starting the usual prescribed treatment and 3 months after. The VARS (Vanderbilt) scales were given to parents and teachers to be completed. Diagnosis was made based on the classification criteria of the Diagnostic and Statistical Manual of Mental Health, fifth edition (DSM-5) [1] and, in addition, the patients were subclassified into the different presentations of ADHD: Inattentive predominant presentation, hyperactive/impulsive predominant presentation or combined presentation. Patient demographic and clinical features are summarized in Table 1. The study included 59 participants divided into two groups. The prepuberal children group was constituted by 34 participants: 15 boys and 8 girls, with a mean age of 7,74 ± 1,29 years. 14 of children had ADHD inattentive presentation, another 14 of children had combined presentation and the rest of children (6) had hyperactive/impulsive ADHD presentation. The group of puberal children consisted of 25 participants: 14 boys and 11 girls, with an average age of 12.7 ± 1.03 years. 15 children had ADHD inattentive presentation ADHD, another 7 had the combined presentation, and the remaining children (3) had hyperactive/impulsive ADHD. All participants received methylphenidate as ADHD treatment.

2.3. Blood samples

Two blood extractions were performed: one before treatment (pre-treatment) and the other one three months after it (post-treatment). Blood samples were collected from the antecubital vein between 8:30 and 09:30 a.m., after a 12-h overnight fast. The samples were collected in vacutainer tubes with EDTA-K3 and centrifuged at 3500 rpm for 15 min at 4 ºC, and plasma samples were separated and erythrocytes were washed twice with cold saline. Plasma and erythrocytes were aliquoted and stored at -80 ºC until the assays were performed. On the day of the experiment, washed erythrocytes were thawed and hemolyzed in phosphate buffer (10 mM sodium phosphate, 1 mM EDTA-Na2, pH 6.25), deproteinized with ice-cold 10% trichloroacetic acid, and centrifuged at 20000 g for 15 minutes. Supernatants were then used for the measurements.

2.4. Salivary samples

For the assessment of the CAR, subjects were instructed to collect three saliva samples at home: immediately at awakening, 30 and 60 minutes thereafter. Salivary samples were collected using Salivette© devices (Sarstedt, Nümbrecht, Germany). The sampling times were filled in by the families immediately after completing saliva sampling. Subjects were instructed to not to eat and not to brush their teeth at least 30 min before completing saliva sampling, to avoid contamination of saliva. Participants were given a protocol with detailed sampling instructions. On the day of collection, patients came to the hospital for the blood analysis, where they gave their saliva samples to the nursing staff. The specimens were centrifuged at 3000 g for 10 min and then frozen at - 80ºC until the assays. As with the blood samples, saliva samples were also collected at the beginning of the study (before starting treatment) and three months later.

2.5. Measurement of advanced oxidation protein products (AOPP)

AOPP was measured in plasma by duplicate spectrophotometrically on a microplate reader (PowerWaveX; Bio-Tek Instruments, Inc.,Winoosky, VT, USA). A calibration curve was made with a chloramine T solution, that in the presence of potassium iodide and acetic acid formed a component that absorbs at 340 nm. Next, in each of the sample wells of the microplate 200 μL of plasma diluted in PBS, 10 μL of PBS and 20 μL of acetic acid were added. The absorbance of the reaction mixture was determined on a microplate reader against a blank. The AOPP concentration was expressed in nmol/mL of chloramine-T equivalents.

2.6. Measurement of products of lipid peroxidation (LPO)

Plasma samples were thawed and centrifugated at 5,000 g for 5 min and 200 μL of the supernatants were used for LPO measurements. LPO was determined by a commercial kit (KB03002, Bioquochem, Oviedo, Spain) which measured malondialdehydes (MDA) and 4-hydroxynonenal (HNE) concentrations as indicators of lipid peroxidation. The reaction produces a chromophore with a maximum absorbance at 586 nm, which was read by a plate reader. LPO concentrations were expressed in nmol/mL [25].

2.7. Nitrite + nitrate (NOx) measurement

Since nitric oxide (NO) is a very unstable molecule, direct measurement of its content is difficult, so an indirect method of greater stability, such as nitrite and nitrate determination (NOx), is often used. For this purpose, plasma samples were incubated at room temperature for 30 minutes with 6% sulfosalicylic acid to precipitate proteins. Then, they were centrifuged at 10,000×g for 15 minutes and 50 μL of the supernatant obtained was combined with 4 μL of 1.25% NaOH, 36 μL of 14 mM phosphate dehydrogenase, 750 μM glucose-6-phosphate, 30 mU nitrate reductase, and 10 μL of a 3 μM NADPH solution. This mixture was incubated for 60 minutes at room temperature. The concentration of NOx was determined using the Griess reaction, which transforms nitrite into a compound spectrophotometrically detected at 550 nm. Plasma NOx levels were reported in nmol/mL.

2.8. Measurement of glutathione peroxidase (GPx), glutathione reductase (GRd) and catalase (CAT)

GPx, GRd and CAT constitute the first line of antioxidant defense of our body. Their activities were determined in the erythrocyte fraction. To measure glutathione peroxidase activity, 10 µL of each supernatant were added to 240 µL of working solution containing buffer A plus 4 mM sodium azide, 60 mM glutathione, 20 mM reduced nicotinamide adenine dinucleotide phosphate and 0.5 U/L glutathione reductase. After incubation for 5 min at room temperature, the reaction was started by adding 10 µL of cumene hydroperoxide (0.3%) and the glutathione peroxidase activity was determined following the oxidation of the reduced nicotinamide adenine dinucleotide phosphate for 3 min at 340 nm in an UV spectrophotometer (Shimadzu Deutschland GmBH, Duisburg, Germany).
To measure glutathione reductase activity, 35 µL of each supernatant were added to 465 µL of working solution containing buffer A plus 2.5 mM disulfide glutathione. After incubation for 5 min at room temperature, the reaction was started by adding 8.5 µL of reduced nicotinamide adenine dinucleotide phosphate 12 mM and the glutathione reductase activity was spectrophotometrically determined for 3 min at 340 nm. Glutathione peroxidase and reductase activities are expressed as µmol/min/g Hb. In both cases, non-enzymatic reduced nicotinamide adenine dinucleotide phosphate oxidation was subtracted from the overall rates.
CAT activity was measured by the rate of H2O2 decomposition, according to the method of Aebi [26]. The reaction mixture contained 50 mM potassium phosphate buffer (pH 7.0) and 10 mM H2O2. The reaction was run at 25°C for 2 min, after adding the enzyme extract. The difference in extinction per unit time is a measure of the catalase activity [27]. All enzyme activity were expressed as µmol/min/g Hb. Hemoglobin concentration was spectrophotometrically determined by the Drabkin’s method [28].

2.9. Measurement of α-Klotho

The α-Klotho plasma levels was measured by solid phase sandwich ELISA (Bionova Científica S.L, Madrid, Spain). The ELISA method relies on two specific antigen-antibody reactions and semiquantitative measurement by spectrophotometry. The ELISA plate contains 96 wells, each well containing an anti-human (IgG) soluble α-Klotho monoclonal antibody. To carry out the reaction, the samples and standard are first added to the wells and incubated at 23 ºC for 60 minutes for the first reaction to occur. Next, a wash is performed to remove the fraction of sample unbound to the mobilized antibody, an HRP-conjugated secondary antibody is added. It is incubated for another 30 minutes for the second reaction to take place. After washing again, a solution of tetra methyl benzidine (TMB) and sulfuric acid is added to each well, causing a color change that is measured spectrophotometrically at 450 nm. Results were expressed in pg/mL.

2.10. Salivary cortisol

Measurement of salivary cortisol is a good surrogate for plasma cortisol because it correlates well with free serum cortisol and is relatively stable even at room temperature. Salivary cortisol was be measured by liquid chromatography tandem-mass spectrometry (LC-MS/MS). This method is considered as the reference technology for measuring salivary cortisol, among other reasons, because of its high sensitivity and specificity, its standardization and because it avoids cross-reactivity problems with other steroids. Measurement of salivary cortisol was done with the commercial kit MassChrom® Cortisol (Chromsystems Instruments & Chemicals GmbH, Gräfelfing, Germany). Saliva samples were prepared following the manufacturer's instructions and 15 μL of each sample was injected into the instrument at a flow rate of 0.5 mL/min. The quantification was carried out on a NexeraXR LC- 20A liquid chromatog-raphy instrument (Shimadzu, Japan) coupled with a 4500 QTRAP MS/MS4500 mass spectrometer (AB Sciex, Framinham, USA). Chromatographic separation was achieved by means of a Chromsystems analytical column (MassChrom® Cortisol) using the gradient elution profile. Results were expressed in μg/L.

2.11. Statistical analysis

All data are expressed as mean ± SEM. Data were analyzed by unpaired one-way analysis of variance (ANOVA) followed by a Student’s test to identify significant differences between each variable. A two-way ANOVA was also used to identify the influence of puberal state and treatment on the results. The statistical software GraphPad Prism version 8.0 for Windows (GraphPad Software Inc., La Jolla, CA, USA) was used for all analyses. A p value of < 0.05 was considered statistically significant.

3. Results

3.1. Oxidative and inflammatory status in the patients before and after treatment

The characterization of oxidative/nitrosative status from ADHD patients was determined by analyzing plasma AOPP, LPO and NOx levels. After three months of treatment, we observed a markedly decreased of LPO levels (p < 0.001), AOPP (p < 0.05), and NOx levels (p < 0.05) (Figure 1A-C). CAT, and the enzymes of the glutation cycle, GPx and GRd, were intracellularly measured in erythrocytes. The enzymatic activity of GRd and CAT increased after treatment (p < 0.05, Figure 1E, F), whereas GPx activity did not change (Figure 1D). Regarding alpha klotho levels, these decreased after treatment but not significantly (Figure 1G).

3.2. Assessment of oxidative and inflammatory status as a function of maturational stage: prepuberal vs. puberal children’s groups

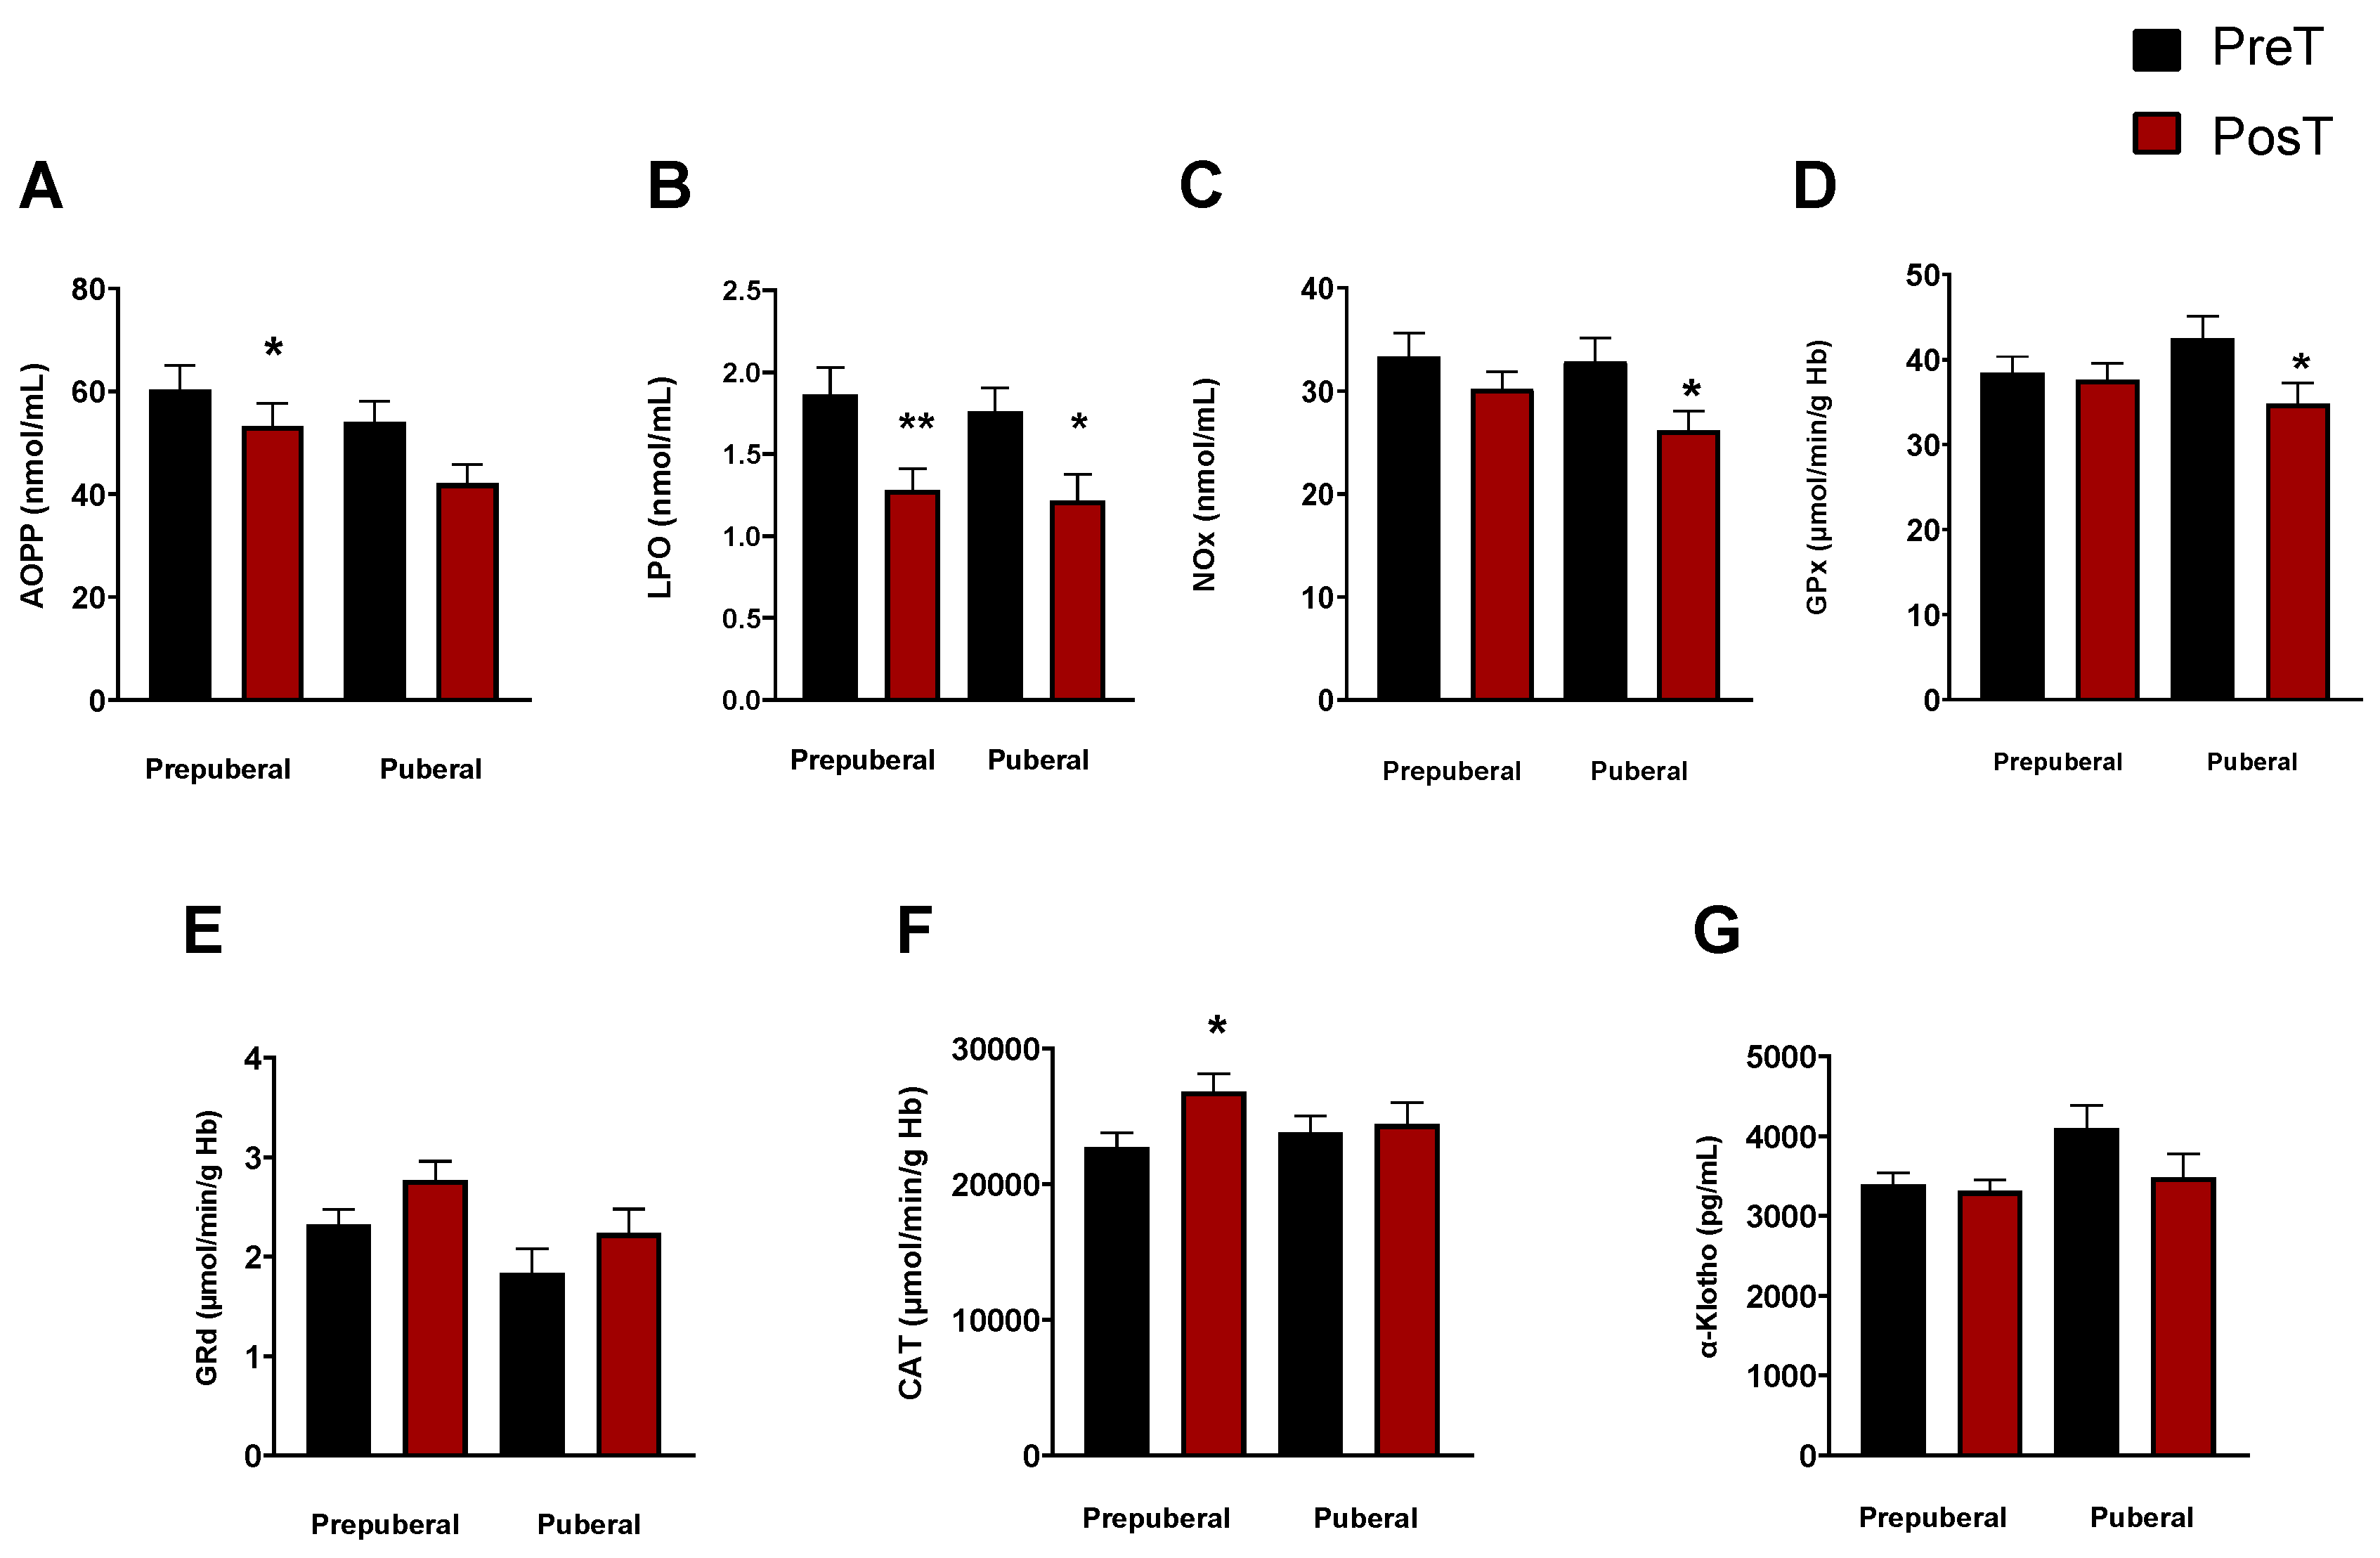
To explore if the stage of pubertal development had any influence on the oxidative and inflammatory status elsewhere measured, we categorized ADHD patients into different maturational stages (I-IV), according to the Tanner scale. Patients classified as stage I formed the prepuberal children group (n=33) while stages II-IV constituted the group of puberal children (n=25). With this classification, we observed in both prepuberal and puberal children, a significant decrease in the levels of LPO in prepuberal (p < 0.001) and puberal (p < 0.05) patients after treatment (Figure 2B), and only in prepuberal AOPP decreased with treatment (p < 0.05, Figure 2A). NOx concentrations also decreased in puberal but not in prepuberal subjects after treatment (p < 0.05, Figure 2C). Regarding the enzyme activities, we found a significant decrease in GPx in treated puberal subjects (p < 0.05, Figure 2D) and an increase in CAT in treated prepuberal patients (p < 0.05, Figure 2F). No changes were found in GRd activity in any group (Figure 2E) and neither in α- klotho levels (Figure 2G).

3.3. Salivary cortisol levels

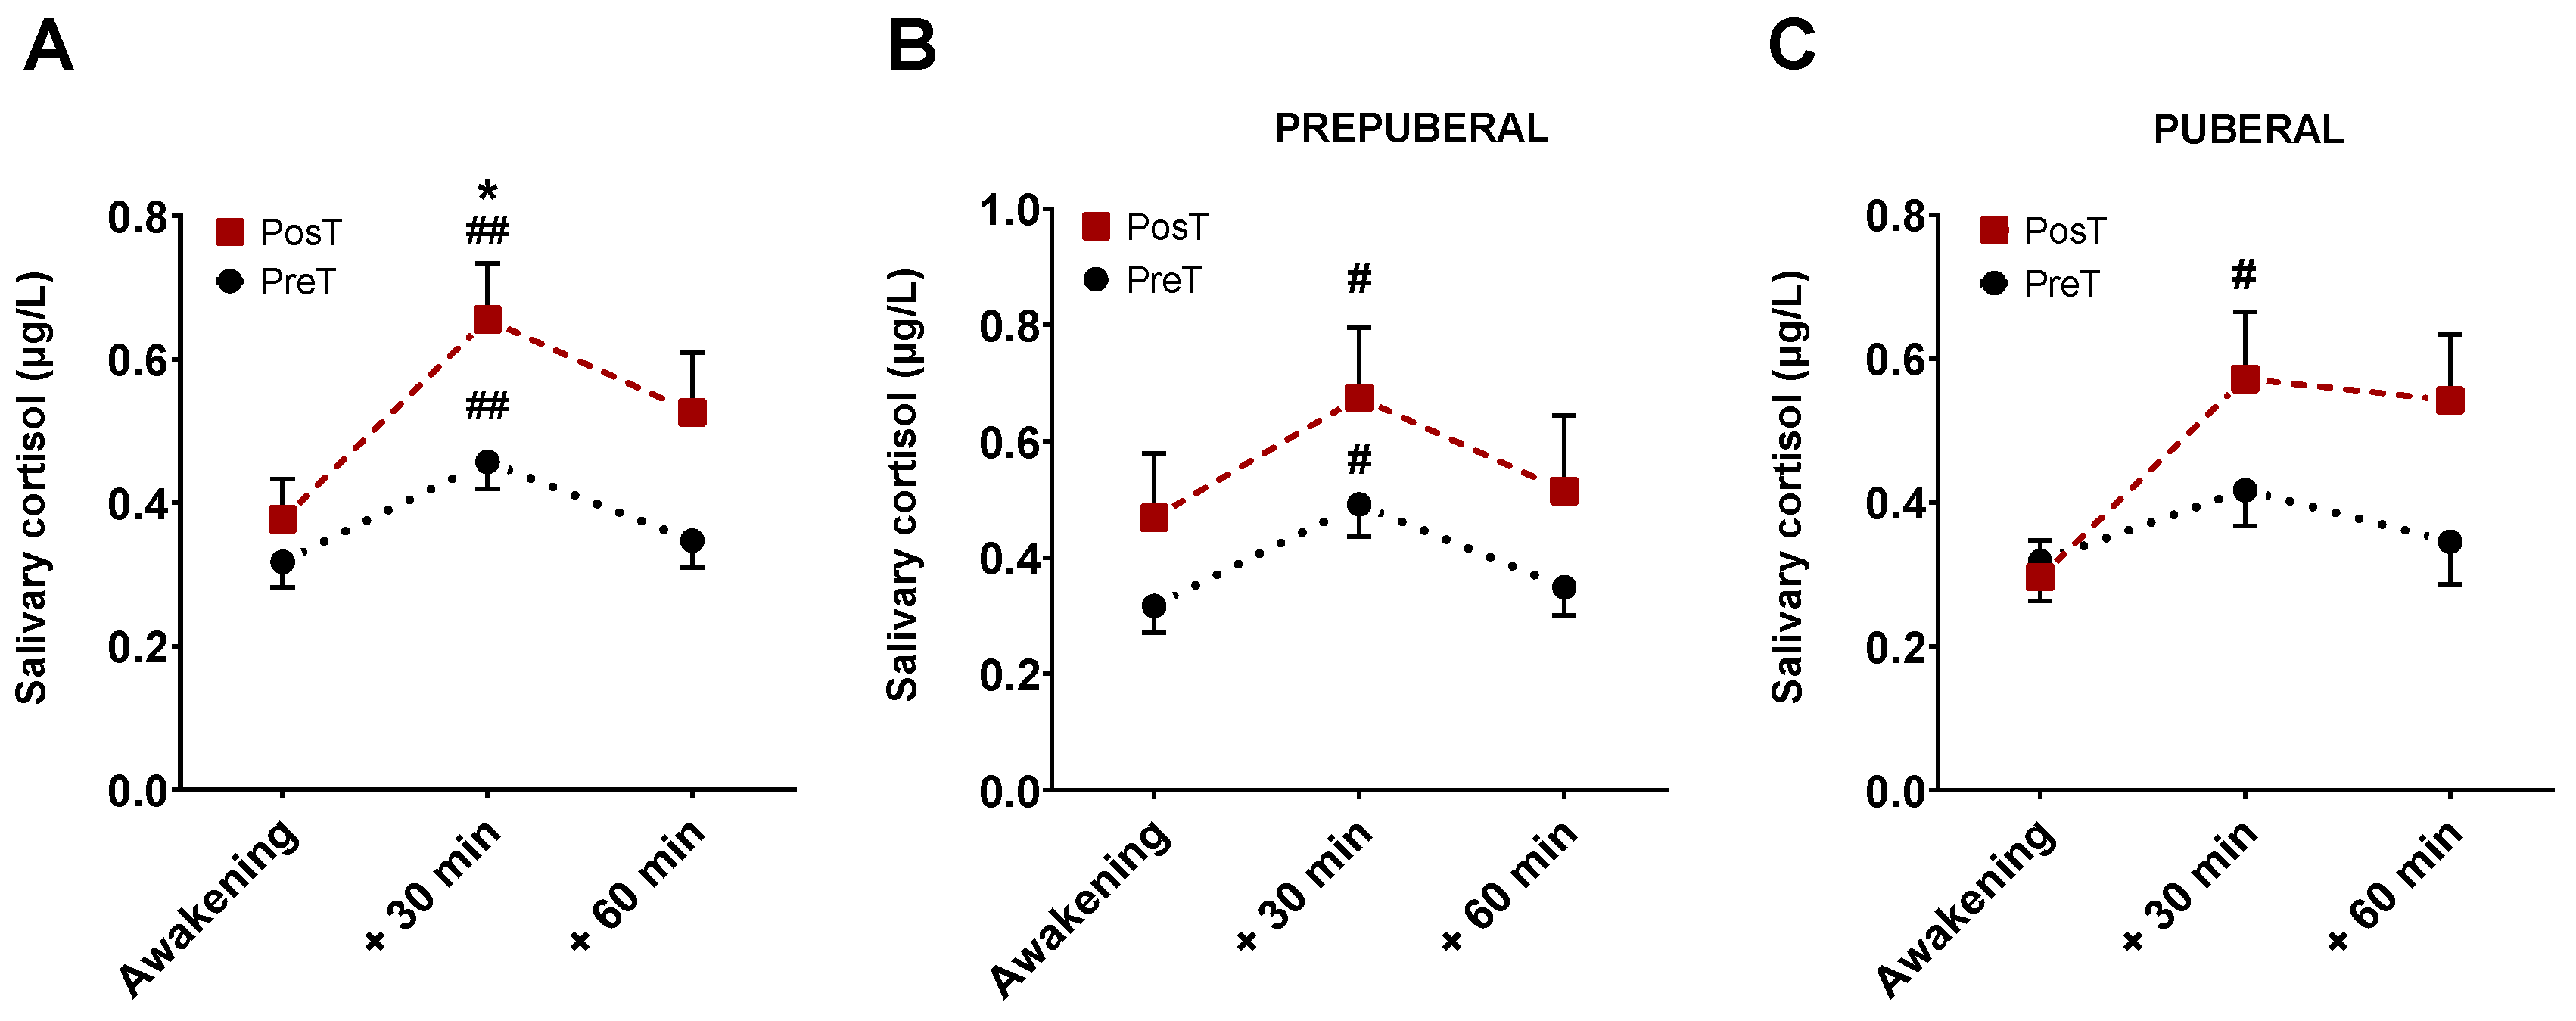
A total of 354 saliva samples (59 participants x 3 samples x 2 collections) were received in the laboratory. Of all of these, 27 were excluded from analyses due to missing some data points, contamination with blood or blue coloration, which would indicate a very probable contamination due to tooth brushing, among other causes. Mean cortisol levels for all sampling points, in prepuberal and puberal children group, before and after treatment are displayed in Figure 3.
There were not differences in cortisol levels just upon waking up, neither before nor after receiving pharmacological treatment. At 30 min, however, the levels of cortisol were significantly higher after receiving the treatment compared with untreated (p < 0.05, Figure 3A). No differences were found at 60 min. In prepuberals (Figure 3B), cortisol levels at 30 min, but not at 60 min, were significantly higher than those corresponding to the moment of awakening both in treated and untreated patients (p < 0.01). Pubertal children only showed significant changes in cortisol at 30 min in treated group (p < 0.05, Figure 3C).
On the other hand, considering a positive CAR when the cortisol concentration at 30 minutes is 50% higher than when waking up [10,29], we observed that in the prepuberal group, the rate of positive CAR before treatment was 53.33%, increasing up to 58% after treatment In puberal children group, these differences increased, since the rate of positive CAR before treatment was 48% and 60% after treatment.
The area under the curve (AUC) was also calculated according to the Pruessner 's method. The mean cortisol concentration at each of the three time points draws a curve representing the CAR. Pruessner et al designed two formulas to calculate the area under the curve: one with respect to the ground (AUCG) and the other with respect to the increment (AUCI) [30] . Our results showed that AUCG after treatment was higher than AUCG before it (AUCG posT= 33.52 vs. AUCG preT = 23.50; p < 0.05). The same happened for AUCI (AUCI posT= 10.98 vs. AUCI preT = 4.43; p < 0.05). In addition, AUCI also was significantly higher after treatment in the puberal children group (AUCI posT= 12.33 vs. AUCI preT= 3.35; p < 0.05).

4. Discussion

Despite the high prevalence and comorbidity of ADHD, we still do not know the exact neurobiological basis of the disorder, although it seems to be related to genetic, environmental and anatomical factors. [5,31]. We show here by the first time that the oxidative and inflammatory status of children diagnosed with ADHD, as well as the function of the hypothalamus-pituitary-adrenal axis, improved after the pharmacological treatment with the psychostimulant methylphenidate. Thus, our data further support that stress and inflammation, which seems to play key role in several psychiatric diseases, also are involved in the pathophysiology of ADHD [32,33].
Some data point to the presence of high level of stress and oxidative damage in ADHD patients and a decrease in the activity of various endogenous antioxidant enzymes, although great discrepancy exists in the literature [16,21,34,35,36,37,38]. In fact, a 2017 meta-analysis found an association between ADHD and oxidative damage but failed to demonstrate alterations of the antioxidant systems [39]. These divergences, together with the fact that oxidative stress may not be a causal agent of the disease but just another consequence of it, highlight the need for further research evaluating biomarkers modifications before and after pharmacological treatment of ADHD patients to gain a deeper understanding of the disease [21]. The few existing studies on the effects of psychostimulants on oxidative stress show inconsistent results, and they are based on animal models and measurements in different specimens and brain structures [40]. In rats, it was observed that the effect of methylphenidate varied according to age and type of exposure to the drug, and so, young rats showed a reduction in LPO after acute treatment, whereas chronic treatment increased oxidative damage in young and decreased it in adult rats [41]. Another study showed that the effect of the treatment varied according to brain region; in some areas such as cerebellum and striatum, ROS were reduced and antioxidant enzymes activity enhanced, while in prefrontal cortex worsening of oxidative stress was observed [42]. Similarly, chronic use of methylphenidate in rats had different effects depending on the clinical context: under therapeutic conditions, i.e., rats with ADHD, methylphenidate showed benefits by increasing antioxidant capacity and reducing LPO in the hippocampus and prefrontal cortex, whereas under non-therapeutic conditions, i.e., healthy rats, methylphenidate had detrimental consequences, in terms of oxidative and nitrosative stress, astrocytic reactivity and antioxidant capacity [43]. Comparable results were observed in other study on rats where methylphenidate treatment improved the proinflammatory profile in the ADHD model while in control conditions it induced a proinflammatory state [44].
Our results show that three months of treatment significantly improved oxidative status in terms of reducing protein oxidative damage (AOPP), lipid oxidative damage (LPO), reducing inflammation measured by the NOx levels. These results agree with other authors who also observed an improvement of oxidative status and mitochondrial membrane potential in human SH-SY5Y neuroblastoma cells [45,46]. Even more, our findings also demonstrated that methylphenidate treatment enhanced the protective action of the endogenous antioxidant system with the increase of CAT and GRd. Overall, our data further support the results in ADHD children and adolescents [40], as well as in patients suffering from depression, where treatment with psychotropic drugs resulted in a normalization of some parameters related to oxidative stress [47].
To explain the changes in oxidative status here reported, several hypotheses have been proposed. Some studies suggest that the increase in dopamine induced by methylphenidate could have an antioxidant effect since dopamine can scavenge free radicals [45,48]. Other studies indicate that methylphenidate would have protective properties by sequestering toxins and toxic metabolites of dopamine through the redistribution of the vesicular monoamine transporter type 2 (VMAT2) [49,50,51,52]. Alternatively, the beneficial effect of methylphenidate would be exerted by protecting cells against neurotoxic metabolites [53] or by increasing the activity of superoxide dismutase (SOD) and CAT. These mechanisms may underly the amelioration of oxidative stress here reported.
Regarding the participation of the HPA axis in the pathophysiology of ADHD, several studies suggest that its symptoms may be linked to arousal deficits or to an inability to maintain an adequate levels of it [54]. A widely recognized way to assess axis function is the CAR [55].Although their measurement is relatively straightforward, there is no consensus on which formulas to use or which parameters to measure to accurately assess the CAR pattern [10,56,57,58]. In 2009, Pruessner et al. developed two formulas derived from the trapezoid method to measure cortisol secretion after awakening: AUCG and AUCI [30]. These formulas, although similar, differ in their approach since, while AUCG encompasses the entire area under the curve with respect to the ground and represents the total hormone production from a certain point in time, and AUCI includes only the area under the curve with respect to the first measurement and focuses on changes over time. Our study is the first one in evaluating the effect of ADHD treatment on CAR. Previous studies have only investigated the effect of treatment on basal cortisol levels and their results are sparse and inconsistent: some of them report an increase in cortisol with methylphenidate and atomoxetine [59] other ones report an initial increase followed by a gradual decrease [60], and others detect differences in dehydroepiandrosterone sulfate but not in cortisol levels [61]. In our results we considered particularly relevant the lack of significant differences in basal cortisol levels (just at awakening) before and after receiving pharmacological treatment. Cortisol levels 30 minutes after awakening were, however, significantly higher in the treated group compared with untreated, thus reflecting a variation in the CAR. Moreover, the levels of cortisol at 30 minutes were significantly higher compared to levels just upon awakening in both groups of patients. Thus, although ADHD may affect the reactivity of the HPA axis, it responds with an increase in cortisol levels even in absence of treatment [10,62]. To determine whether there was a significant change in the CAR after receiving treatment, we carried out different strategies already described and elsewhere used by other authors. Considering that CAR is present when the cortisol concentration at 30 min is 50% higher than that just awakening, our data assess CAR was present in 50.9% of patients and, after 3 months of therapy, it increased to 59.25%. Although it is still lower than that observed in the healthy population, it increased by almost 10% with methylphenidate [62]. On the other hand, if we calculate the area under the curve of cortisol data at each time point (just at awakening, 30 min, and 60 min later) and using the formulas proposed by Pruessner et al [30], we observed that there was a statistically significant increase in both AUCG and AUCI after treatment. Thus, we can infer that, after treatment, patients diagnosed with ADHD presented a better response to cortisol awakening since there was a significant increase in both total cortisol production during this period (AUCG) and an adequate increase in the levels of this hormone (AUCI). Given that cortisol is the hormone of the day, related to stress and activity, and methylphenidate is a stimulating drug that increases daytime performance, it seems rea-sonable to consider that the significant increase in cortisol after treatment reflects its positive clinical effect.
The maturational development did indeed exert a significant influence on some parameters such as AOPP, NOx, and GRd. In the puberal children group, AOPP levels (a marker indicative of oxidative stress and inflammation) and NOx levels (a marker of inflammation) were lower than those in the prepuberal group. To our knowledge, there is no other study in the literature related to the impact of maturational development on oxidative status and inflammation in ADHD patients. These findings may point to the hypothesis that during the different maturational stages that conform puberty, the antioxidant defense systems could decrease and this would be reflected in a significant increase in AOPP and in NOx. The lack of changes in klotho among pre and puberal groups here reported suggest that this pathway is not involved in the changes here reported in ADHD patients. Nevertheless, further studies should be done to confirm this hypothesis and to establish a more solid conclusions between the different etiologic factors involved in ADHD and the complex relationship between maturational development and oxidative and inflammatory markers and their clinical implications.

5. Conclusions

Our data support an improvement of the redox status, inflammatory profile, as well as the response of the HPA axis after three months of treatment. Because our study was done in patients and most of the data reported in the literature were done in animal models, we believe that the results here shown represent a more reliable profile of the evolution of the ADHD subjects treated with the first-line drug for this pathology.

Author Contributions

Conceptualization, L.G.-M. and D.A-C.; methodology, L.G.-M.; patient diagnosis, clinical follow-up and clinical data, R.G.V., A.M.-C. and M.L.-F-L.; writing original draft preparation, L.G.-M., D.A-C and G.E..; writing review and editing, L.G.-M. and D.A-C.; funding acquisition, T.H. and D.A-C. All authors have read and agreed to the published version of the manuscript.

Funding

This study was partially supported by grants from the Instituto de Salud Carlos III through the project CB/10/00238 (Co-funded by European Regional Development Fund/European Social Fund "Investing in your future"); the Consejería de Economía, Innovación, Ciencia y Empleo, Junta de Andalucía (CTS-101), Spain, and the UGC de Laboratorios Clínicos, Hospital Universitario San Cecilio, Granada, Spain.

Institutional Review Board Statement

The study was conducted according to the guidelines of the Declaration of Helsinki and approved by the Granada´s Ethical Committee of Hospital Universtario Clínico San Cecilio (no.0250-N-20) and was approval on 18/05/2021.

Informed Consent Statement

Informed consent was obtained from all subjects involved in the study. Written informed consent has been obtained from the patient(s) to publish this paper.

Data Availability Statement

The data presented in this study are available on request from the corresponding author.

Acknowledgments

We are thankful to Ana Guerra-Librero Rite and Huda Khaldy (Granada University, Spain) for their technical support.

Conflicts of Interest

The authors declare no conflict of interest.

References

  1. American Psychiatric Association Diagnostic and Statistical Manual of Mental Disorders: DSM-5; 5th ed.; Arlington, VA, USA, 2013.
  2. Luo, Y.; Weibman, D.; Halperin, J.M.; Li, X. A Review of Heterogeneity in Attention Deficit/Hyperactivity Disorder (ADHD). Front Hum Neurosci 2019, 13. [Google Scholar] [CrossRef] [PubMed]
  3. Collantes, R. González.; Cascajo, A.R.-Sacristán.; García, J.Sánchez. Epidemiología Del TDAH. Revista española de pediatría: clínica e investigación. 2015, 71, 58–61. [Google Scholar]
  4. Vicario, M.H.; Santos, L.S. Trastorno Por Déficit de Atención e Hiperactividad. Manifestaciones Clínicas y Evolución. Diagnóstico Desde La Evidencia Científica. Pediatría Integral 2014, 18, 609–623. [Google Scholar]
  5. Catalá-López, F.; Peiró, S.; Ridao, M.; Sanfélix-Gimeno, G.; Gènova-Maleras, R.; Catalá, M.A. Prevalence of Attention Deficit Hyperactivity Disorder among Children and Adolescents in Spain: A Systematic Review and Meta-Analysis of Epidemiological Studies. BMC Psychiatry 2012, 12, 1–13. [Google Scholar] [CrossRef]
  6. Thapar, A.; Langley, K.; Owen, M.J.; O’Donovan, M.C. Advances in Genetic Findings on Attention Deficit Hyperactivity Disorder. Psychol Med 2007, 37, 1681–1692. [Google Scholar] [CrossRef]
  7. Anesiadou, S.; Makris, G.; Michou, M.; Bali, P.; Papassotiriou, I.; Apostolakou, F.; Korkoliakou, P.; Papageorgiou, C.; Chrousos, G.; Pervanidou, P. Salivary Cortisol and Alpha-Amylase Daily Profiles and Stress Responses to an Academic Performance Test and a Moral Cognition Task in Children with Neurodevelopmental Disorders. Stress and Health 2021, 37, 45–59. [Google Scholar] [CrossRef]
  8. Van West, D.; Claes, S.; Deboutte, D. Differences in Hypothalamic–Pituitary–Adrenal Axis Functioning among Children with ADHD Predominantly Inattentive and Combined Types. Eur Child Adolesc Psychiatry 2009, 18, 543–553. [Google Scholar] [CrossRef] [PubMed]
  9. Jessop, D.S.; Turner-Cobb, J.M. Measurement and Meaning of Salivary Cortisol: A Focus on Health and Disease in Children. Stress 2008, 11, 1–14. [Google Scholar] [CrossRef]
  10. Ramos-Quiroga, J.A.; Corominas-Roso, M.; Palomar, G.; Ferrer, R.; Valero, S.; Corrales, M.; Richarte, V.; Casas, M. Cortisol Awakening Response in Adults with Attention Deficit Hyperactivity Disorder: Subtype Differences and Association with the Emotional Lability. European Neuropsychopharmacology 2016, 26, 1140–1149. [Google Scholar] [CrossRef]
  11. Shibuya, I.; Nagamitsu, S.; Okamura, H.; Ozono, S.; Chiba, H.; Ohya, T.; Yamashita, Y.; Matsuishi, T. High Correlation between Salivary Cortisol Awakening Response and the Psychometric Profiles of Healthy Children. Biopsychosoc Med 2014, 8, 1–4. [Google Scholar] [CrossRef]
  12. Stalder, T.; Kirschbaum, C.; Kudielka, B.M.; Adam, E.K.; Pruessner, J.C.; Wüst, S.; Dockray, S.; Smyth, N.; Evans, P.; Hellhammer, D.H.; et al. Assessment of the Cortisol Awakening Response: Expert Consensus Guidelines. Psychoneuroendocrinology 2016, 63, 414–432. [Google Scholar] [CrossRef] [PubMed]
  13. Blomqvist, M.; Holmberg, K.; Lindblad, F.; Fernell, E.; Ek, U.; Dahllöf, G. Salivary Cortisol Levels and Dental Anxiety in Children with Attention Deficit Hyperactivity Disorder. Eur J Oral Sci 2007, 115, 1–6. [Google Scholar] [CrossRef] [PubMed]
  14. Shankar, K.; Mehendale, H.M. Oxidative Stress. Encyclopedia of Toxicology: Third Edition 2014, 735–737. [Google Scholar] [CrossRef]
  15. Checa-Ros, A.; Jeréz-Calero, A.; Molina-Carballo, A.; Campoy, C.; Muñoz-Hoyos, A. Current Evidence on the Role of the Gut Microbiome in ADHD Pathophysiology and Therapeutic Implications. Nutrients 2021, 13, 249. [Google Scholar] [CrossRef] [PubMed]
  16. Alvarez-Arellano, L.; González-García, N.; Salazar-García, M.; Corona, J.C. Antioxidants as a Potential Target against Inflammation and Oxidative Stress in Attention-Deficit/Hyperactivity Disorder. Antioxidants 2020, 9, 176. [Google Scholar] [CrossRef] [PubMed]
  17. de Araújo Boleti, A.P.; de Oliveira Flores, T.M.; Moreno, S.E.; Dos Anjos, L.; Mortari, M.R.; Migliolo, L. Neuroinflammation: An Overview of Neurodegenerative and Metabolic Diseases and of Biotechnological Studies. Neurochem Int 2020, 136, 104714. [Google Scholar] [CrossRef] [PubMed]
  18. Dunn, G.A.; Nigg, J.T.; Sullivan, E.L. Neuroinflammation as a Risk Factor for Attention Deficit Hyperactivity Disorder. Pharmacol Biochem Behav 2019, 182, 22–34. [Google Scholar] [CrossRef]
  19. Solleiro-Villavicencio, H.; Rivas-Arancibia, S. Effect of Chronic Oxidative Stress on Neuroinflammatory Response Mediated by CD4+ T Cells in Neurodegenerative Diseases. Front Cell Neurosci 2018, 12, 114. [Google Scholar] [CrossRef]
  20. Leffa, D.T.; Torres, I.L.S.; Rohde, L.A. A Review on the Role of Inflammation in Attention-Deficit/Hyperactivity Disorder. Neuroimmunomodulation 2019, 25, 328–333. [Google Scholar] [CrossRef]
  21. Verlaet, A.A.J.; Breynaert, A.; Ceulemans, B.; De Bruyne, T.; Fransen, E.; Pieters, L.; Savelkoul, H.F.J.; Hermans, N. Oxidative Stress and Immune Aberrancies in Attention-Deficit/Hyperactivity Disorder (ADHD): A Case–Control Comparison. Eur Child Adolesc Psychiatry 2019, 28, 719–729. [Google Scholar] [CrossRef]
  22. Fernández-Mayoralas, D.M.; Fernández-Perrone, A.L.; Muñoz-Jareño, N.; Fernández-Jaén, A. Actualización En El Tratamiento Farmacológico Del Trastorno Por Déficit de Atención/Hiperactividad: Lisdexanfetamina y Guanfacina de Liberación Retardada. Rev Neurol 2017, 64, S1–S8. [Google Scholar] [CrossRef]
  23. García Campayo, J.; Santed Germán, M.Á.; Cerdán Lanero, C.; Alda Díez, M. Tratamiento Del Trastorno Por Déficit de Atención. Aten Primaria 2007, 39, 671–674. [Google Scholar] [CrossRef] [PubMed]
  24. Marshall, W.A.; Tanner, J.M. Variations in the Pattern of Pubertal Changes in Boys. Arch Dis Child 1970, 45, 13–23. [Google Scholar] [CrossRef]
  25. Esterbauer, H.; Cheeseman, K.H. [42] Determination of Aldehydic Lipid Peroxidation Products: Malonaldehyde and 4-Hydroxynonenal. In Methods in enzymology; Elsevier, 1990; Vol. 186, pp. 407–421.
  26. Aebi, H. Catalase in Vitro. Methods Enzymol 1984, 105, 121–126. [Google Scholar] [CrossRef]
  27. Choudhary, R.; Eesha Saroha, A.; Swarnkar, P.L. Effect of Abscisic Acid and Hydrogen Peroxide on Antioxidant Enzymes in Syzygium Cumini Plant. J Food Sci Technol 2012, 49, 649–652. [Google Scholar] [CrossRef] [PubMed]
  28. Balasubramaniam, P.; Malathi, A. Comparative Study of Hemoglobin Estimated by Drabkin’s and Sahli’s Methods. J Postgrad Med 1992, 38, 8. [Google Scholar]
  29. Fries, E.; Dettenborn, L.; Kirschbaum, C. The Cortisol Awakening Response (CAR): Facts and Future Directions. International journal of Psychophysiology 2009, 72, 67–73. [Google Scholar] [CrossRef] [PubMed]
  30. Pruessner, J.C.; Kirschbaum, C.; Meinlschmid, G.; Hellhammer, D.H. Two Formulas for Computation of the Area under the Curve Represent Measures of Total Hormone Concentration versus Time-Dependent Change. Psychoneuroendocrinology 2003, 28, 916–931. [Google Scholar] [CrossRef]
  31. Spencer, T.J.; Biederman, J.; Mick, E. Attention-Deficit/Hyperactivity Disorder: Diagnosis, Lifespan, Comorbidities, and Neurobiology. J Pediatr Psychol 2007, 32, 631–642. [Google Scholar] [CrossRef]
  32. Ng, F.; Berk, M.; Dean, O.; Bush, A.I. Oxidative Stress in Psychiatric Disorders : Evidence Base and Therapeutic Implications. International Journal of Neuropsychopharmacology 2008, 11, 851–876. [Google Scholar] [CrossRef]
  33. Jiménez-Fernández, S.; Gurpegui, M.; Garrote-Rojas, D.; Gutiérrez-Rojas, L.; Carretero, M.D.; Correll, C.U. Oxidative Stress Parameters and Antioxidants in Patients with Bipolar Disorder: Results from a Meta-Analysis Comparing Patients, Including Stratification by Polarity and Euthymic Status, with Healthy Controls. Bipolar Disord 2021, 23, 117–129. [Google Scholar] [CrossRef]
  34. Lopresti, A.L. Oxidative and Nitrosative Stress in ADHD: Possible Causes and the Potential of Antioxidant-Targeted Therapies. ADHD Attention Deficit and Hyperactivity Disorders 2015, 7, 237–247. [Google Scholar] [CrossRef] [PubMed]
  35. Kul, M.; Unal, F.; Kandemir, H.; Sarkarati, B.; Kilinc, K.; Kandemir, S.B. Evaluation of Oxidative Metabolism in Child and Adolescent Patients with Attention Deficit Hyperactivity Disorder. Psychiatry Investig 2015, 12, 361. [Google Scholar] [CrossRef]
  36. Selek, S.; Savas, H.A.; Serdar Gergerlioglu, H.; Bulut, M.; Ramazan Yilmaz, H. Oxidative Imbalance in Adult Attention Deficit/Hyperactivity Disorder §. Biol Psychol 2008, 79, 256–259. [Google Scholar] [CrossRef]
  37. Ceylan, M.; Sener, S.; Cavunt Bayraktar, A.; Kavutcu, M. Oxidative Imbalance in Child and Adolescent Patients with Attention-Deficit/ Hyperactivity Disorder. Prog Neuropsychopharmacol Biol Psychiatry 2010, 34, 1491–1494. [Google Scholar] [CrossRef] [PubMed]
  38. Bulut, M.; Selek, S.; Gergerlioglu, H.S.; Savas, H.A.; Yilmaz, H.R.; Yuce, M.; Ekici, G. Malondialdehyde Levels in Adult Attention-Deficit Hyperactivity Disorder. Journal of Psychiatry and Neuroscience 2007, 32, 435–438. [Google Scholar] [PubMed]
  39. Joseph, N.; Zhang-James, Y.; Perl, A.; Faraone, S. V. Oxidative Stress and ADHD: A Meta-Analysis. J Atten Disord 2015, 19, 915. [Google Scholar] [CrossRef]
  40. Guney, E.; Cetin, F.H.; Alisik, M.; Tunca, H.; Torun, Y.T.; Iseri, E.; Taner, Y.I.; Cayci, B.; Erel, O. Attention Deficit Hyperactivity Disorder and Oxidative Stress: A Short Term Follow up Study. Psychiatry Res 2015, 229, 310–317. [Google Scholar] [CrossRef]
  41. Martins, M.R.; Reinke, A.; Petronilho, F.C.; Gomes, K.M.; Dal-Pizzol, F.; Quevedo, J. Methylphenidate Treatment Induces Oxidative Stress in Young Rat Brain. Brain Res 2006, 1078, 189–197. [Google Scholar] [CrossRef]
  42. Schmitz, F.; Scherer, E.B.S.; Machado, F.R.; da Cunha, A.A.; Tagliari, B.; Netto, C.A.; Wyse, A.T.S. Methylphenidate Induces Lipid and Protein Damage in Prefrontal Cortex, but Not in Cerebellum, Striatum and Hippocampus of Juvenile Rats. Metab Brain Dis 2012, 27, 605–612. [Google Scholar] [CrossRef]
  43. Carvalho Muga, M. Methylphenidate-Induced Alterations in Astrocytes: A Comprehensive Characterization, Universidad de Coimbra: Coimbra, 2020.
  44. Sanches, E.S.; Boia, R.; Leitão, R.A.; Madeira, M.H.; Fontes-Ribeiro, C.A.; Ambrósio, A.F.; Fernandes, R.; Silva, A.P. Attention-Deficit/Hyperactivity Disorder Animal Model Presents Retinal Alterations and Methylphenidate Has a Differential Effect in ADHD versus Control Conditions. Antioxidants 2023, 12, 937. [Google Scholar] [CrossRef] [PubMed]
  45. Zhu, M.; Tian, Y.; Zhang, H.; Ma, X.; Shang, B.; Zhang, J.; Jiao, Y.; Zhang, Y.; Hu, J.; Wang, Y. Methylphenidate Ameliorates Hypoxia-Induced Mitochondrial Damage in Human Neuroblastoma SH-SY5Y Cells through Inhibition of Oxidative Stress. Life Sci 2018, 197, 40–45. [Google Scholar] [CrossRef] [PubMed]
  46. Schmidt, A.J.; Clement, H.-W.; Gebhardt, S.; Hemmeter, U.M.; Schulz, E.; Krieg, J.-C.; Kircher, T.; Heiser, P. Impact of Psychostimulants and Atomoxetine on the Expression of 8-Hydroxyguanine Glycosylase 1 in Human Cells. J Neural Transm 2010, 117, 793–797. [Google Scholar] [CrossRef] [PubMed]
  47. Jimenez-Fernandez, S.; Gurpegui, M.; Diaz-Atienza, F.; Pérez-Costillas, L.; Gerstenberg, M.; Correll, C.U. Oxidative Stress and Antioxidant Parameters in Patients with Major Depressive Disorder Compared to Healthy Controls before and after Antidepressant Treatment: Results from a Meta-Analysis. J Clin Psychiatry 2015, 76, 13705. [Google Scholar] [CrossRef] [PubMed]
  48. Yen, G.-C.; Hsieh, C.-L. Antioxidant Effects of Dopamine and Related Compounds. Biosci Biotechnol Biochem 1997, 61, 1646–1649. [Google Scholar] [CrossRef] [PubMed]
  49. Calvi, J.P.Q.; Cornejo, G.S.E. Metilfenidato: Propiedades, Aplicaciones y Controversias. Revista de Psicología 2022, 12, 189–203. [Google Scholar] [CrossRef]
  50. Sandoval, V.; Riddle, E.L.; Hanson, G.R.; Fleckenstein, A.E. Methylphenidate Redistributes Vesicular Monoamine Transporter-2: Role of Dopamine Receptors. Journal of Neuroscience 2002, 22, 8705–8710. [Google Scholar] [CrossRef] [PubMed]
  51. Lorenzo Sanz, G.; Sánchez Herranz, A. Implicación Del Transportador Vesicular de Monoaminas En El Trastorno Por Déficit de Atención/Hiperactividad. Rev. neurol.(Ed. impr.) 2011, 103–108. [CrossRef]
  52. Hanson, G.R.; Sandoval, V.; Riddle, E.; Fleckenstein, A.E. Psychostimulants and Vesicle Trafficking: A Novel Mechanism and Therapeutic Implications. Ann N Y Acad Sci 2004, 1025, 146–150. [Google Scholar] [CrossRef] [PubMed]
  53. Ludolph, A.G.; Schaz, U.; Storch, A.; Liebau, S.; Fegert, J.M.; Boeckers, T.M. Methylphenidate Exerts No Neurotoxic, but Neuroprotective Effects in Vitro. J Neural Transm 2006, 113, 1927–1934. [Google Scholar] [CrossRef]
  54. Sonuga-Barke, E.J.S.; Wiersema, J.R.; van der Meere, J.J.; Roeyers, H. Context-Dependent Dynamic Processes in Attention Deficit/Hyperactivity Disorder: Differentiating Common and Unique Effects of State Regulation Deficits and Delay Aversion. Neuropsychol Rev 2010, 20, 86–102. [Google Scholar] [CrossRef]
  55. Thorn, L.; Hucklebridge, F.; Evans, P.; Clow, A. The Cortisol Awakening Response, Seasonality, Stress and Arousal: A Study of Trait and State Influences. Psychoneuroendocrinology 2009, 34, 299–306. [Google Scholar] [CrossRef] [PubMed]
  56. Freitag, C.M.; Hänig, S.; Palmason, H.; Meyer, J.; Wüst, S.; Seitz, C. Cortisol Awakening Response in Healthy Children and Children with ADHD: Impact of Comorbid Disorders and Psychosocial Risk Factors. 2009, 34, 1019–1028. [CrossRef]
  57. Ozgocer, T.; Ucar, C.; Yildiz, S. Daily Cortisol Awakening Response and Menstrual Symptoms in Young Females. Stress and Health 2022, 38, 57–68. [Google Scholar] [CrossRef] [PubMed]
  58. Adams, G.C.; Wrath, A.J.; von Dewitz, B.; Marciniuk, K.; Roesler, A.; Napper, S. Attachment Impacts Cortisol Awakening Response in Chronically Depressed Individuals. Psychoneuroendocrinology 2020, 120, 104778. [Google Scholar] [CrossRef] [PubMed]
  59. Chen, Y.-H.; Lin, X.-X.; Chen, H.; Liu, Y.-Y.; Lin, G.-X.; Wei, L.-X.; Hong, Y.-L. The Change of the Cortisol Levels in Children with ADHD Treated by Methylphenidate or Atomoxetine. J Psychiatr Res 2012, 46, 415–416. [Google Scholar] [CrossRef] [PubMed]
  60. Wang, L.-J.; Huang, Y.-S.; Hsiao, C.-C.; Chen, C.-K. The Trend in Morning Levels of Salivary Cortisol in Children with ADHD during 6 Months of Methylphenidate Treatment. J Atten Disord 2017, 21, 254–261. [Google Scholar] [CrossRef] [PubMed]
  61. Lee, M.-S.; Yang, J.-W.; Ko, Y.-H.; Han, C.; Kim, S.-H.; Lee, M.-S.; Joe, S.-H.; Jung, I.-K. Effects of Methylphenidate and Bupropion on DHEA-S and Cortisol Plasma Levels in Attention-Deficit Hyperactivity Disorder. Child Psychiatry Hum Dev 2008, 39, 201–209. [Google Scholar] [CrossRef]
  62. Wust, S.; Wolf, J.; Hellhammer, D.H.; Federenko, I.; Schommer, N.; Kirschbaum, C. The Cortisol Awakening Response Normal Values and Confounds. Noise Health 2000, 2, 79. [Google Scholar]
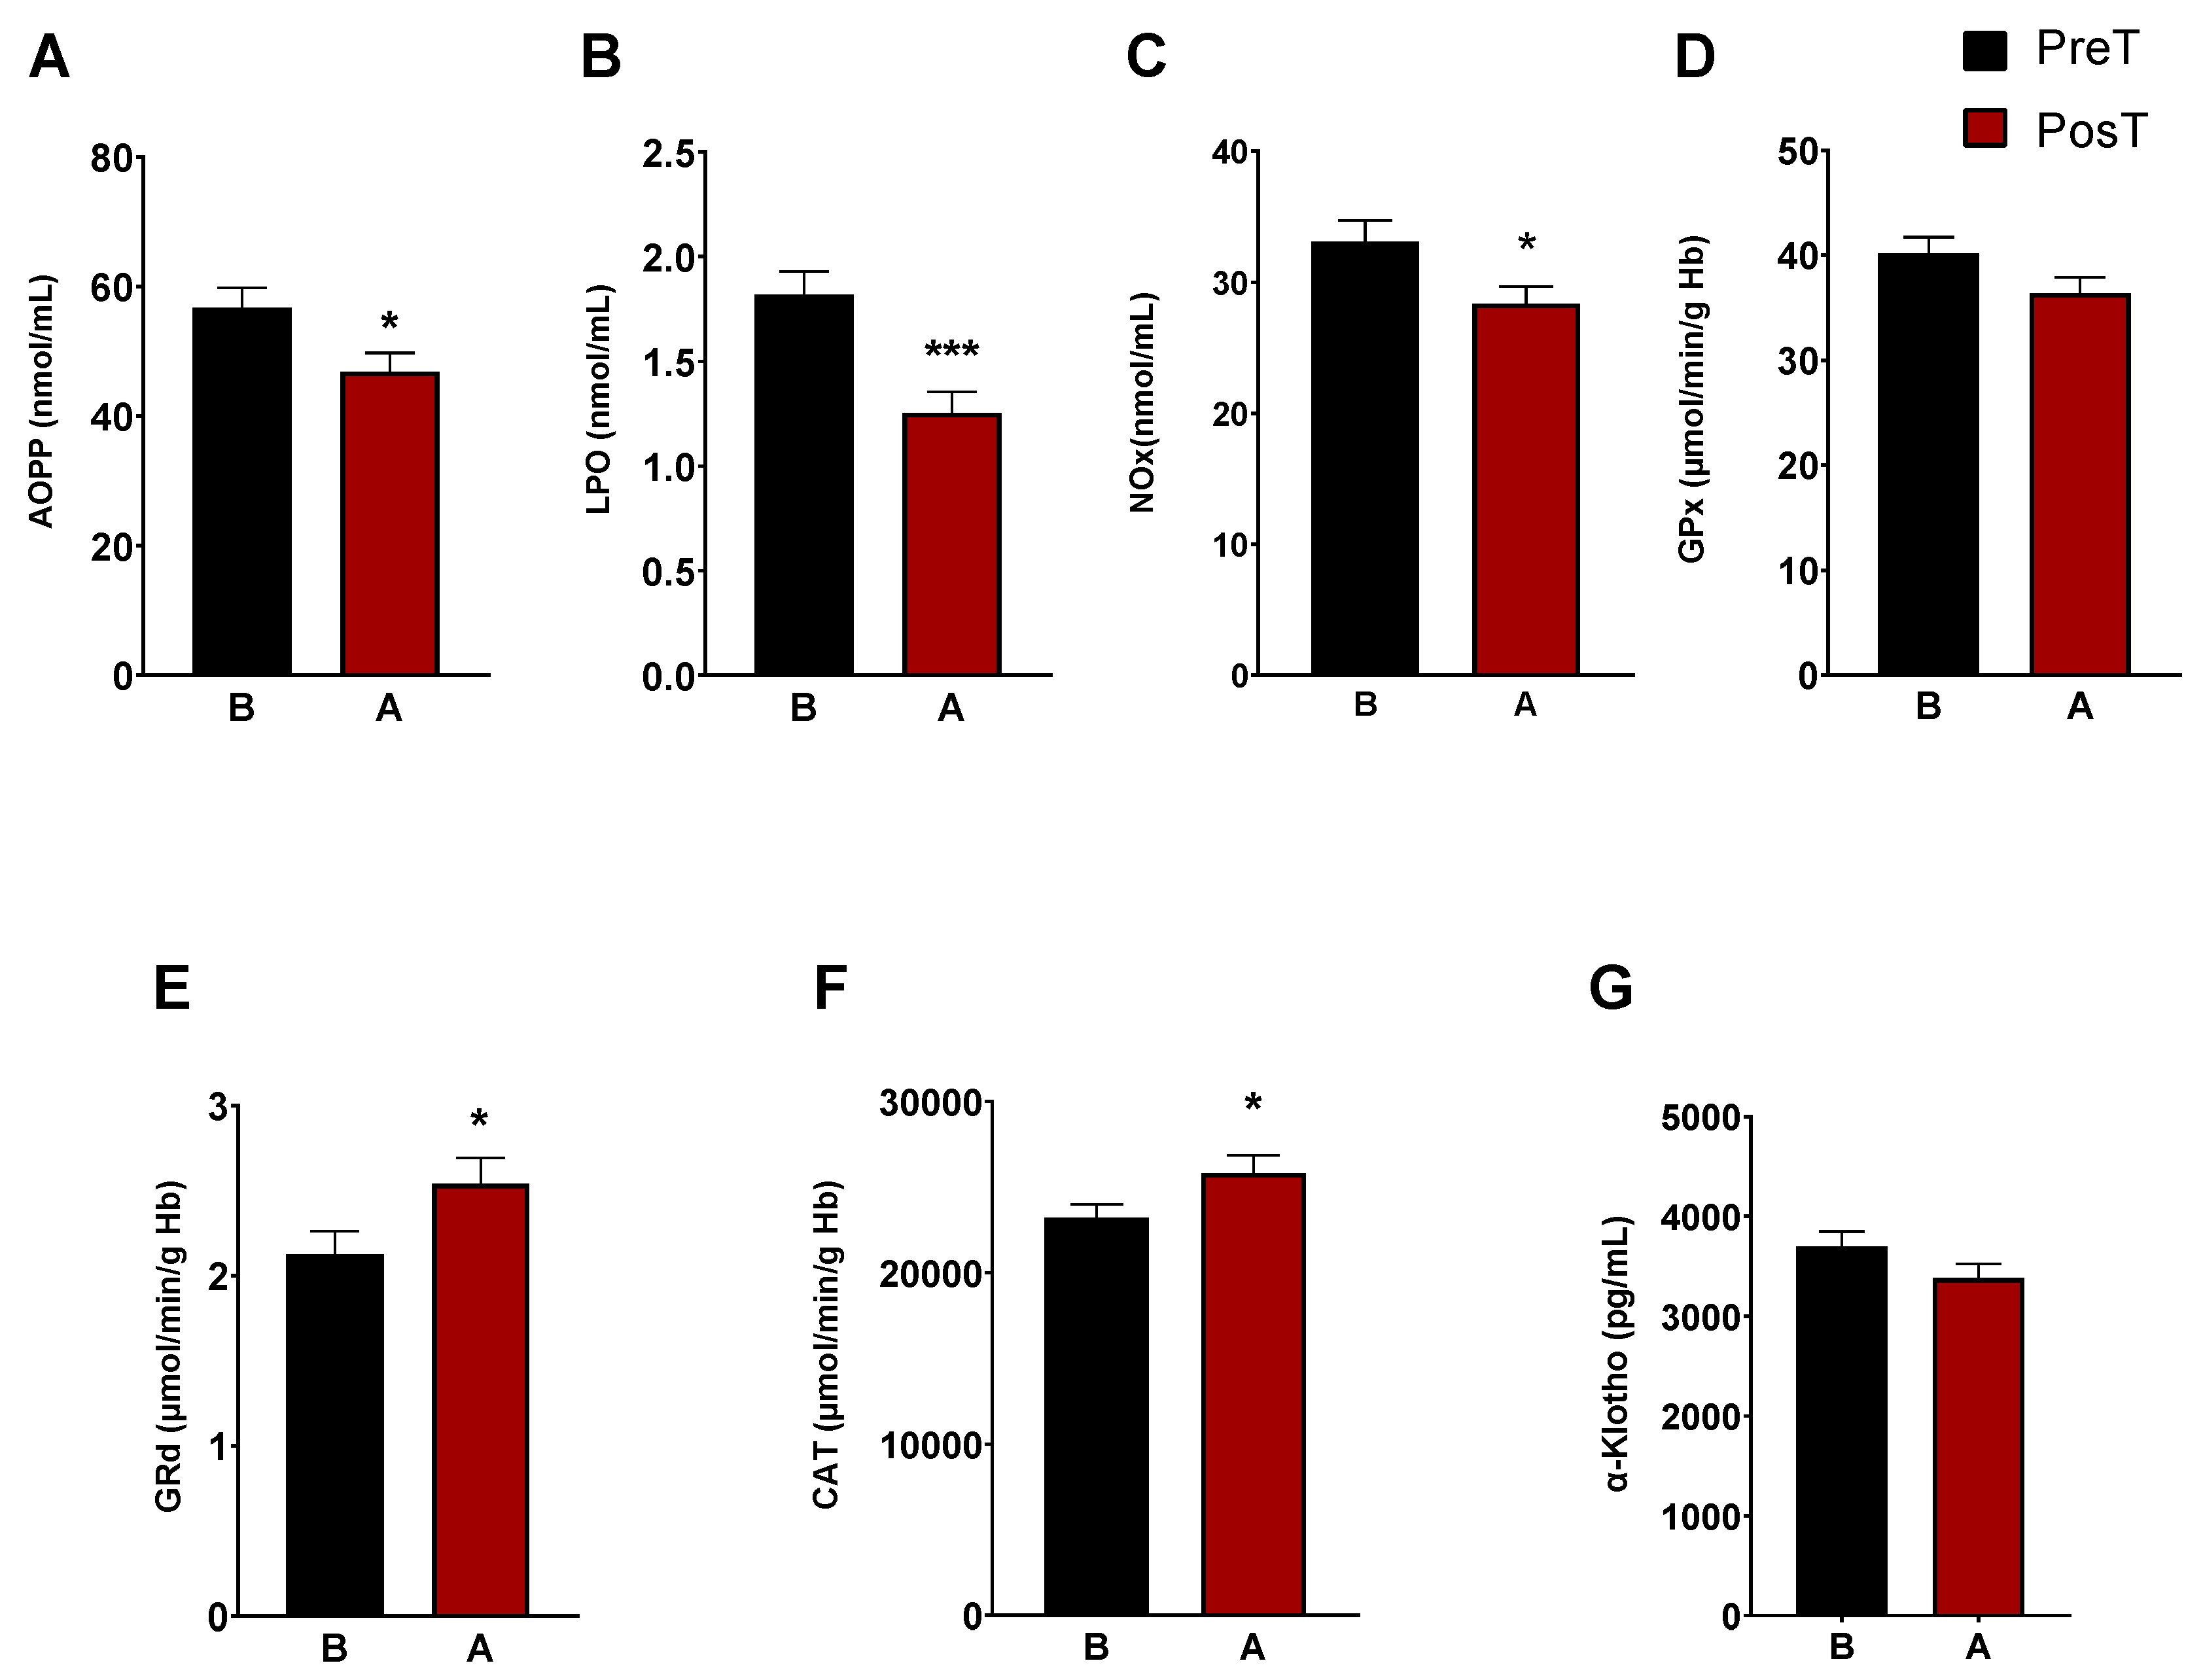
Figure 1. Analysis of plasmatic and erythrocyte oxidative stress parameters in ADHD patients. The following oxidative stress levels are represented: (A) advanced oxidation protein products plasma levels (AOPP); (B) Products of lipid peroxidation (LPO); (C) Nitrite plus nitrate levels (NOx); (D) glutathione peroxidase activity (GPx); (E) glutathione reductase activity (GRd); (F) catalase activity (CAT);(G) α-klotho. Data are presented as mean ± SEM. PreT, pretreatment; PosT, posttreatment. * p < 0.05; ** p < 0.01, and *** p < 0.001 vs. PreT.
Preprints 93661 g001
Figure 2. Analysis of plasmatic and erythrocyte oxidative stress parameters in ADHD patients. In each graph, the two columns on the left represent the prepuberal children group and the two columns on the right represent the puberal children group. The following oxidative stress levels are represented: (A) advanced oxidation protein products plasma levels (AOPP); (B) Products of lipid peroxidation (LPO); (C) Nitrite plus nitrate levels (NOx); (D) glutathione peroxidase activity (GPx); (E) glutathione reductase activity (GRd); (F) catalase activity (CAT); (G) α-klotho. Data are presented as mean ± SEM. PreT, pretreatment, PosT, posttreatment. * p < 0.05; ** p < 0.01, and *** p < 0.001 vs. PreT.
Preprints 93661 g002
Figure 3. Representation of mean cortisol levels and SEM at three time points, before and after treatment. The first graph represents cortisol levels without distinguishing between pre-puberty and puberty. The second graph corresponds to the cortisol levels in the group of prepuberal children and the third with those of the group of puberal children. *p < 0.05 vs. 30 min PosT; # p < 0.05, and ## p < 0.001 vs. awakening time for each group.
Preprints 93661 g003
Table 1. Demographic characteristics of different groups of participants included in the study.
Parameters Prepuberal group (n=34) Puberal group (n=25)
Age (years) 7,74 ± 1,29 12,7 ± 1,03
Gender (female/male) 8 female/26 male 11 female/14 male
ADHD presentation ADHD combined: 14 ADHD combined: 7
ADHD inattentive: 14 ADHD inattentive: 15
ADHD hyperactive-impulsive: 5 ADHD hyperactive-impulsive: 2
Unclassified:1 Unclassified:1
Treatment Methylphenidate Methylphenidate
Disclaimer/Publisher’s Note: The statements, opinions and data contained in all publications are solely those of the individual author(s) and contributor(s) and not of MDPI and/or the editor(s). MDPI and/or the editor(s) disclaim responsibility for any injury to people or property resulting from any ideas, methods, instructions or products referred to in the content.
Copyright: This open access article is published under a Creative Commons CC BY 4.0 license, which permit the free download, distribution, and reuse, provided that the author and preprint are cited in any reuse.
Prerpints.org logo

Preprints.org is a free preprint server supported by MDPI in Basel, Switzerland.

Subscribe

© 2024 MDPI (Basel, Switzerland) unless otherwise stated