Submitted:
15 December 2023
Posted:
18 December 2023
You are already at the latest version
Abstract
Keywords:
1. Introduction
2. Materials and Methods
2.1 Primers
2.2 Infection Study
| Name | Fragment | Sequence |
|---|---|---|
| ASFV-300-Fα | 01_F | AGGTGGTTTGGCCGTATTCT |
| ASFV-11927-Rα | 01_R | ATGCGTAGGCCTCCTGAAAG |
| ASFV-10819-Fα | 02_F | ATAGGAGCGGCTTGAAGGAC |
| ASFV-22803-Rα | 02_R | TGCGGCAACATATGTCCAAAC |
| ASFV-22129-Fα | 03_F | CAAAGATGCCGTACCTCCGA |
| ASFV-33909-Rα | 03_R | TTTACGGCTTGGGTCAGGAC |
| ASFV-33237-Fα | 04_F | GCTCCCTTCAACGCATAGGA |
| ASFV-44936-Rα | 04_R | TGCGGGTCTTGGATTAAAGGA |
| ASFV-43757-Fα | 05a_F | TGGACCCAAAAAGGGTGGTC |
| ASFV-56602-Rα | 05a_R | GCGGCATTGAAAAACACCCT |
| ASFV-55750-Fα | 05b_F | TGAGCTGTTCCCAGGATTCG |
| ASFV-68434-Rα | 05b_R | AGCGCGCGTATTTATCAACG |
| ASFV-67660-Fβ | 06_F | GGACTGCGACACGATCACAGAGTC |
| ASFV-78076-Rβ | 06_R | GTCCTACGACACCATGCGAACCAAG |
| ASFV-77808-Fβ | 07_F | CTATATTGGCAAACTGTTTCACGTC |
| ASFV-87981-Rθ | 07_R | CAATCACAACGGTTCTCCTGTTAAG |
| ASFV-87000-Fα | 08_F | GCATAATCAATGGCAATCCCCC |
| ASFV-97970-Rα | 08_R | TGGCCTTAATCATTACAGCGGT |
| ASFV-97345-Fβ | 09_F | GTTACGTAGATCACTGAGTTGCAATC |
| ASFV-107683-Rβ | 09_R | GGCGCCCTCCTATACGATGAG |
| ASFV-107531-Fβ | 10_F | GTGTCCTCCATCGGATATACTATAC |
| ASFV-117620-Rθ | 10_R | AGTGTGCTGACCTATATCACGGAAC |
| ASFV-117410-Fβ | 11_F | CATTTCTGAACTGCGAGAGTTCTAG |
| ASFV-127433-Rβ | 11_R | TCGCTGTGCGTAATTTATCCCAATC |
| ASFV-126429-Fα | 12_F | AACACCTAACCTCGTCGTGC |
| ASFV-137952-Rα | 12_R | ACAGGTAAGGTCCGACTCGT |
| ASFV-137097-Fβ | 14_F | GAGAACAGGTCTTAGAATTACTTCATG |
| ASFV-147178-Rβ | 14_R | ACGCATCCGAAGGTGTTACAAGGAC |
| ASFV-146744-Fθ | 15_F | CTCTGAATGCGCAGAGCATCTTAC |
| ASFV-156426-Rβ | 15_R | GAACATGGGAATACGTGTGTCCAG |
| ASFV-155654-Fα | 17_F | AGGAACTGGACATGCAAGCAG |
| ASFV-166805-Rα | 17_R | ATGAGCTCGCCCACATAACC |
| ASFV-166089-Fα | 18_F | TATTGCCCGAGCCTCTGTATTC |
| ASFV-177600-Rα | 18_R | GGGGGAATCAACTCTCGCTTAA |
| ASFV-6188-Fα | del-PCR_F | GCTTCTAACTCTCTGTACAACA |
| ASFV-17145-Rα | del-PCR_R | CGGCATATCATAAGTAGGTTGGT |
| ASFV-6708-Fα | noDel-PCR_F | AAGTGGCTGCTCGTCAACAA |
| ASFV-7668-Rα | noDel-PCR_R | AGCCGTAGCAATGTTGGTGA |
2.3 Preparation of Long PCR Products from Viral DNA
| Sample IDα | Sample name | Matrix | Ctβ |
|---|---|---|---|
| Spleen, 1/50 2. passage LPPAM 02-07-2019 | Inoc | Cell culture supernatant | 25.2 |
| CReSA_2020_pig_1_eut. | S1 | Serum | 20.2 |
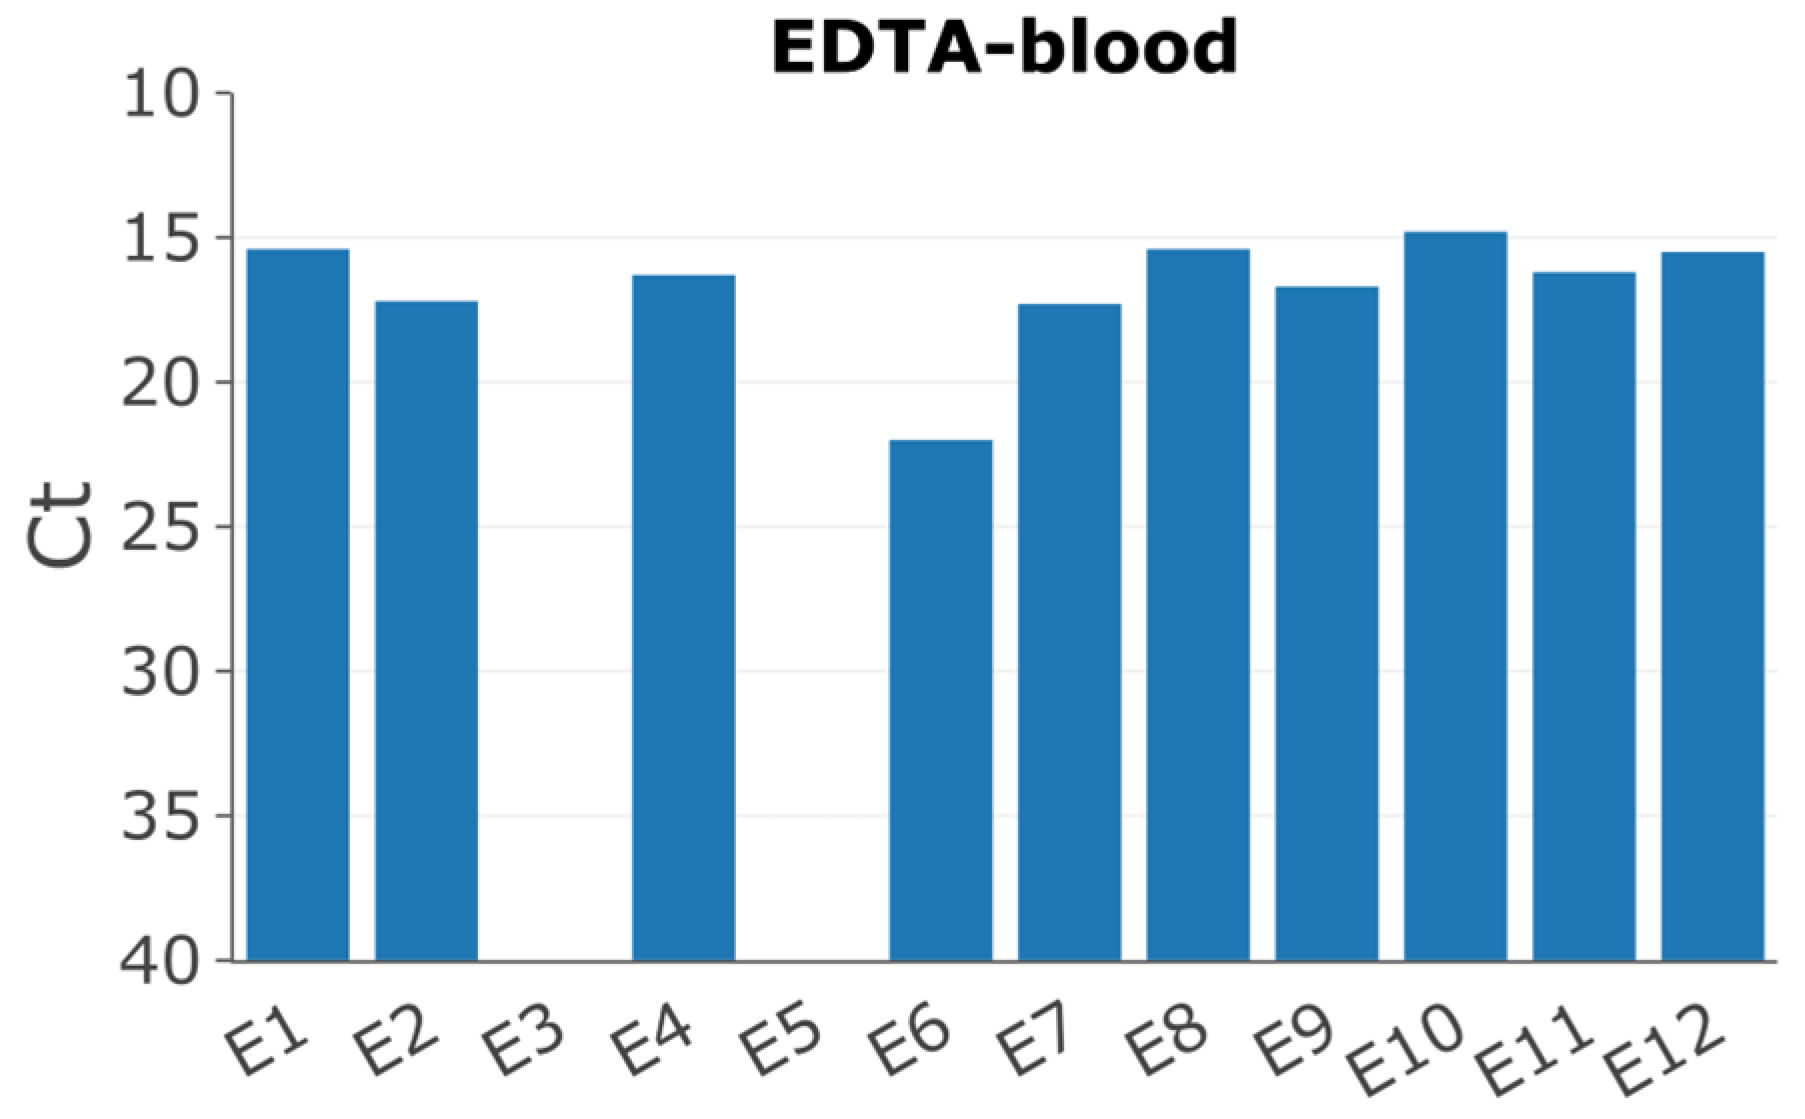
| CReSA_2020_pig_1_eut. | E1 | EDTA-blood | 15.4 |
| CReSA_2020_pig_1_eut. | B1 | Bone-marrowθ | 19.0 |
| CReSA_2020_pig_1_eut. | SP1 | Spleen θ | 15.6 |
| CReSA_2020_pig_2_eut. | S2 | Serum | 19.3 |
| CReSA_2020_pig_2_eut. | E2 | EDTA-blood | 17.2 |
| CReSA_2020_pig_2_eut. | B2 | Bone-marrow θ | 16.8 |
| CReSA_2020_pig_2_eut. | SP2 | Spleen θ | 15.7 |
| CReSA_2020_pig_3_eut. | S3 | Serum | No Ct |
| CReSA_2020_pig_3_eut. | E3 | EDTA-blood | No Ct |
| CReSA_2020_pig_3_eut. | B3 | Bone-marrow θ | 38.3 |
| CReSA_2020_pig_3_eut. | SP3 | Spleen θ | 39.5 |
| CReSA_2020_pig_4_eut. | S4 | Serum | 19.2 |
| CReSA_2020_pig_4_eut. | E4 | EDTA-blood | 16.3 |
| CReSA_2020_pig_4_eut. | B4 | Bone-marrow θ | 19.1 |
| CReSA_2020_pig_4_eut. | SP4 | Spleen θ | 16.2 |
| CReSA_2020_pig_5_eut. | S5 | Serum | No Ct |
| CReSA_2020_pig_5_eut. | E5 | EDTA-blood | No Ct |
| CReSA_2020_pig_5_eut. | B5 | Bone-marrow θ | No Ct |
| CReSA_2020_pig_5_eut. | SP5 | Spleen θ | 39.8 |
| CReSA_2020_pig_6_eut. | S6 | Serum | 29.0 |
| CReSA_2020_pig_6_eut. | E6 | EDTA-blood | 22.0 |
| CReSA_2020_pig_6_eut. | B6 | Bone-marrow θ | 22.3 |
| CReSA_2020_pig_6_eut. | SP6 | Spleen θ | 16.5 |
| CReSA_2020_pig_7_eut. | S7 | Serum | 20.5 |
| CReSA_2020_pig_7_eut. | E7 | EDTA-blood | 17.3 |
| CReSA_2020_pig_7_eut. | B7 | Bone-marrow θ | 19.3 |
| CReSA_2020_pig_7_eut. | SP7 | Spleen θ | 16.5 |
| CReSA_2020_pig_8_eut. | S8 | Serum | 19.4 |
| CReSA_2020_pig_8_eut. | E8 | EDTA-blood | 15.4 |
| CReSA_2020_pig_8_eut. | B8 | Bone-marrow θ | 19.1 |
| CReSA_2020_pig_8_eut. | SP8 | Spleen θ | 15.8 |
| CReSA_2020_pig_9_eut. | S9 | Serum | 19.7 |
| CReSA_2020_pig_9_eut. | E9 | EDTA-blood | 16.7 |
| CReSA_2020_pig_9_eut. | B9 | Bone-marrow θ | 19.2 |
| CReSA_2020_pig_9_eut. | SP9 | Spleen θ | 17.3 |
| CReSA_2020_pig_10_eut. | S10 | Serum | 19.3 |
| CReSA_2020_pig_10_eut. | E10 | EDTA-blood | 14.8 |
| CReSA_2020_pig_10_eut. | B10 | Bone-marrow θ | 18.2 |
| CReSA_2020_pig_10_eut. | SP10 | Spleen θ | 15.5 |
| CReSA_2020_pig_11_eut. | S11 | Serum | 18.6 |
| CReSA_2020_pig_11_eut. | E11 | EDTA-blood | 16.2 |
| CReSA_2020_pig_11_eut. | B11 | Bone-marrow θ | 18.8 |
| CReSA_2020_pig_11_eut. | SP11 | Spleen θ | 17.0 |
| CReSA_2020_pig_12_eut. | S12 | Serum | 19.1 |
| CReSA_2020_pig_12_eut. | E12 | EDTA-blood | 15.5 |
| CReSA_2020_pig_12_eut. | B12 | Bone-marrow θ | 17.4 |
| CReSA_2020_pig_12_eut. | SP12 | Spleen θ | 15.8 |
| Spleen, 1st passage LPPAM 13-05-2019 1/50 | 1p19 | Cell culture supernatant | 27.2 |
2.4 Next Generation Sequencing (NGS)
2.5 PCR Deletion Screening and Sanger Sequencing
2.6 Variant and Indel Calling
3. Results
3.1 Infection Study
3.2 Overlapping long PCRs
3.3 Identification of a Large Deletion Event in the ASFV Genomes within Pig 8
3.4 SNP Analysis of EDTA-Blood Samples
3.5 Samples from Pig 2
3.6 Indel Analysis of EDTA Blood Samples
3.7 Samples from Pig 2
4. Discussion
Supplementary Materials
Author Contributions
Funding
Institutional Review Board Statement
Informed Consent Statement
Data Availability Statement
Acknowledgments
Conflicts of Interest
References
- Costard, S.; Jones, B.A.; Martínez-López, B.; Mur, L.; de la Torre, A.; Martínez, M.; Sánchez-Vizcaíno, F.; Sánchez-Vizcaíno, J.M.; Pfeiffer, D.U.; Wieland, B. Introduction of African Swine Fever into the European Union through Illegal Importation of Pork and Pork Products. PLoS ONE 2013, 8, e61104. [Google Scholar] [CrossRef] [PubMed]
- Dixon, L.K.; Sun, H.; Roberts, H. African Swine Fever. Antiviral Res. 2019, 165, 34–41. [Google Scholar] [CrossRef] [PubMed]
- Dixon, L.K.; Stahl, K.; Jori, F.; Vial, L.; Pfeiffer, D.U. African Swine Fever Epidemiology and Control. Annu. Rev. Anim. Biosci. 2020, 8, 221–246. [Google Scholar] [CrossRef] [PubMed]
- Sánchez-Cordón, P.J.P.J.; Montoya, M.; Reis, A.L.; Dixon, L.K.L.K. African Swine Fever: A Re-Emerging Viral Disease Threatening the Global Pig Industry. Vet. J. 2018, 233, 41–48. [Google Scholar] [CrossRef]
- Yáñez, R.J.; Rodrı́guez, J.M.; Nogal, M.L.; Yuste, L.; Enrı́quez, C.; Rodriguez, J.F.; Viñuela, E. Analysis of the Complete Nucleotide Sequence of African Swine Fever Virus. Virology 1995, 208, 249–278. [Google Scholar] [CrossRef]
- Alonso, C.; Borca, M. V.; Dixon, L.K.; Revilla, Y.; Rodríguez, F.; Escribano, J.M. ICTV Virus Taxonomy Profile: Asfarviridae. J. Gen. Virol. 2018, 99, 613–614. [Google Scholar] [CrossRef]
- Forth, J.H.; Forth, L.F.; Blome, S.; Höper, D.; Beer, M. African Swine Fever Whole-Genome Sequencing—Quantity Wanted but Quality Needed. PLOS Pathog. 2020, 16, e1008779. [Google Scholar] [CrossRef]
- Bastos, A.D.S.; Penrith, M.L.; Crucière, C.; Edrich, J.L.; Hutchings, G.; Roger, F.; Couacy-Hymann, E.; R. Thomson, G. Genotyping Field Strains of African Swine Fever Virus by Partial P72 Gene Characterisation. Arch. Virol. 2003, 148, 693–706. [Google Scholar] [CrossRef]
- Rowlands, R.J.; Michaud, V.; Heath, L.; Hutchings, G.; Oura, C.A.L.; Vosloo, W.; Dwarka, R.; Onashvili, T.; Albina, E.; Dixon, L.K. African Swine Fever Virus Isolate, Georgia, 2007. Emerg. Infect. Dis. 2008, 14, 1870–1874. [Google Scholar] [CrossRef]
- Forth, J.H.; Tignon, M.; Cay, A.B.; Forth, L.F.; Höper, D.; Blome, S.; Beer, M. Comparative Analysis of Whole-Genome Sequence of African Swine Fever Virus Belgium 2018/1. Emerg. Infect. Dis. 2019, 25, 1249–1252. [Google Scholar] [CrossRef]
- Gallardo, C.; Fernández-Pinero, J.; Pelayo, V.; Gazaev, I.; Markowska-Daniel, I.; Pridotkas, G.; Nieto, R.; Fernández-Pacheco, P.; Bokhan, S.; Nevolko, O.; et al. Genetic Variation among African Swine Fever Genotype II Viruses, Eastern and Central Europe. Emerg. Infect. Dis. 2014, 20, 1544–1547. [Google Scholar] [CrossRef]
- Achenbach, J.E.; Gallardo, C.; Nieto-Pelegrín, E.; Rivera-Arroyo, B.; Degefa-Negi, T.; Arias, M.; Jenberie, S.; Mulisa, D.D.; Gizaw, D.; Gelaye, E.; et al. Identification of a New Genotype of African Swine Fever Virus in Domestic Pigs from Ethiopia. Transbound. Emerg. Dis. 2017, 64, 1393–1404. [Google Scholar] [CrossRef]
- Boshoff, C.I.; Bastos, A.D.S.; Gerber, L.J.; Vosloo, W. Genetic Characterisation of African Swine Fever Viruses from Outbreaks in Southern Africa (1973–1999). Vet. Microbiol. 2007, 121, 45–55. [Google Scholar] [CrossRef]
- Domingo, E.; García-Crespo, C.; Perales, C. Historical Perspective on the Discovery of the Quasispecies Concept. Annu. Rev. Virol. 2021, 8, 51–72. [Google Scholar] [CrossRef]
- Sanjuán, R.; Domingo-Calap, P. Genetic Diversity and Evolution of Viral Populations. Encycl. Virol. 2021, 53–61. [Google Scholar] [CrossRef]
- Sanjuán, R.; Pereira-Gómez, M.; Risso, J. Genome Instability in DNA Viruses. In Genome Stability; Elsevier, 2016; pp. 37–47.
- Sanjuán, R.; Nebot, M.R.; Chirico, N.; Mansky, L.M.; Belshaw, R. Viral Mutation Rates. J. Virol. 2010, 84, 9733–9748. [Google Scholar] [CrossRef] [PubMed]
- Sanjuán, R.; Domingo-Calap, P. Mechanisms of Viral Mutation. Cell. Mol. Life Sci. 2016, 73, 4433–4448. [Google Scholar] [CrossRef] [PubMed]
- Michaud, V.; Randriamparany, T.; Albina, E. Comprehensive Phylogenetic Reconstructions of African Swine Fever Virus: Proposal for a New Classification and Molecular Dating of the Virus. PLoS ONE 2013, 8, e69662. [Google Scholar] [CrossRef] [PubMed]
- Lamarche, B.J.; Kumar, S.; Tsai, M.-D. ASFV DNA Polymerase X Is Extremely Error-Prone under Diverse Assay Conditions and within Multiple DNA Sequence Contexts. Biochemistry 2006, 45, 14826–14833. [Google Scholar] [CrossRef] [PubMed]
- García-Escudero, R.; Garcı́a-Dı́az, M.; Salas, M.L.; Blanco, L.; Salas, J. DNA Polymerase X of African Swine Fever Virus: Insertion Fidelity on Gapped DNA Substrates and AP Lyase Activity Support a Role in Base Excision Repair of Viral DNA. J. Mol. Biol. 2003, 326, 1403–1412. [Google Scholar] [CrossRef] [PubMed]
- Nguyen, V.T.; Cho, K.; Mai, N.T.A.; Park, J.-Y.; Trinh, T.B.N.; Jang, M.-K.; Nguyen, T.T.H.; Vu, X.D.; Nguyen, T.L.; Nguyen, V.D.; et al. Multiple Variants of African Swine Fever Virus Circulating in Vietnam. Arch. Virol. 2022, 167, 1137–1140. [Google Scholar] [CrossRef]
- Gallardo, C.; Casado, N.; Soler, A.; Djadjovski, I.; Krivko, L.; Madueño, E.; Nieto, R.; Perez, C.; Simon, A.; Ivanova, E.; et al. A Multi Gene-Approach Genotyping Method Identifies 24 Genetic Clusters within the Genotype II-European African Swine Fever Viruses Circulating from 2007 to 2022. Front. Vet. Sci. 2023, 10. [Google Scholar] [CrossRef]
- Mazur-Panasiuk, N.; Walczak, M.; Juszkiewicz, M.; Woźniakowski, G. The Spillover of African Swine Fever in Western Poland Revealed Its Estimated Origin on the Basis of O174L, K145R, MGF 505-5R and IGR I73R/I329L Genomic Sequences. Viruses 2020, 12, 1094. [Google Scholar] [CrossRef] [PubMed]
- Forth, J.H.; Forth, L.F.; King, J.; Groza, O.; Hübner, A.; Olesen, A.S.; Höper, D.; Dixon, L.K.; Netherton, C.L.; Rasmussen, T.B.; et al. A Deep-Sequencing Workflow for the Fast and Efficient Generation of High-Quality African Swine Fever Virus Whole-Genome Sequences. Viruses 2019, 11, 846. [Google Scholar] [CrossRef] [PubMed]
- Olesen, A.S.; Lohse, L.; Dalgaard, M.D.; Woźniakowski, G.; Belsham, G.J.; Bøtner, A.; Rasmussen, T.B. Complete Genome Sequence of an African Swine Fever Virus (ASFV POL/2015/Podlaskie) Determined Directly from Pig Erythrocyte-Associated Nucleic Acid. J. Virol. Methods 2018, 261, 14–16. [Google Scholar] [CrossRef] [PubMed]
- Olesen, A.S.; Lohse, L.; Accensi, F.; Goldswain, H.; Belsham, G.J.; Bøtner, A.; Netherton, C.L.; Dixon, L.K.; Portugal, R. Inefficient Transmission of African Swine Fever Virus to Sentinel Pigs from Environmental Contamination under Experimental Conditions. Transbound. Emerg. Dis. (in press), preprint available at. [CrossRef]
- Olesen, A.S.; Kodama, M.; Lohse, L.; Accensi, F.; Rasmussen, T.B.; Lazov, C.; Limborg, M.T.; Gilbert, M.T.P.; Bøtner, A.; Belsham, G.J. Identification of African Swine Fever Virus Transcription within Peripheral Blood Mononuclear Cells of Acutely Infected Pigs. Viruses 2021, 13, 2333. [Google Scholar] [CrossRef] [PubMed]
- Portugal, R.; Coelho, J.; Höper, D.; Little, N.S.; Smithson, C.; Upton, C.; Martins, C.; Leitão, A.; Keil, G.M. Related Strains of African Swine Fever Virus with Different Virulence: Genome Comparison and Analysis. J. Gen. Virol. 2015, 96, 408–419. [Google Scholar] [CrossRef] [PubMed]
- Tignon, M.; Gallardo, C.; Iscaro, C.; Hutet, E.; Van der Stede, Y.; Kolbasov, D.; De Mia, G.M.; Le Potier, M.-F.; Bishop, R.P.; Arias, M.; et al. Development and Inter-Laboratory Validation Study of an Improved New Real-Time PCR Assay with Internal Control for Detection and Laboratory Diagnosis of African Swine Fever Virus. J. Virol. Methods 2011, 178, 161–170. [Google Scholar] [CrossRef]
- Rasmussen, T.B.; Reimann, I.; Uttenthal, Å.; Leifer, I.; Depner, K.; Schirrmeier, H.; Beer, M. Generation of Recombinant Pestiviruses Using a Full-Genome Amplification Strategy. Vet. Microbiol. 2010, 142, 13–17. [Google Scholar] [CrossRef]
- Olesen, A.S.; Lohse, L.; Hansen, M.F.; Boklund, A.; Halasa, T.H.B.; Belsham, G.J.; Rasmussen, T.B.; Bøtner, A.; Bødker, R. Infection of Pigs with African Swine Fever Virus via Ingestion of Stable Flies (Stomoxys Calcitrans). Transbound. Emerg. Dis. 2018, 65, 1152–1157. [Google Scholar] [CrossRef]
- Schubert, M.; Lindgreen, S.; Orlando, L. AdapterRemoval v2: Rapid Adapter Trimming, Identification, and Read Merging. BMC Res. Notes 2016, 9, 88. [Google Scholar] [CrossRef]
- Li, H. Aligning Sequence Reads, Clone Sequences and Assembly Contigs with BWA-MEM. 2013.
- Danecek, P.; Bonfield, J.K.; Liddle, J.; Marshall, J.; Ohan, V.; Pollard, M.O.; Whitwham, A.; Keane, T.; McCarthy, S.A.; Davies, R.M.; et al. Twelve Years of SAMtools and BCFtools. Gigascience 2021, 10. [Google Scholar] [CrossRef]
- Wilm, A.; Aw, P.P.K.; Bertrand, D.; Yeo, G.H.T.; Ong, S.H.; Wong, C.H.; Khor, C.C.; Petric, R.; Hibberd, M.L.; Nagarajan, N. LoFreq: A Sequence-Quality Aware, Ultra-Sensitive Variant Caller for Uncovering Cell-Population Heterogeneity from High-Throughput Sequencing Datasets. Nucleic Acids Res. 2012, 40, 11189–11201. [Google Scholar] [CrossRef]
- Cingolani, P.; Platts, A.; Wang, L.L.; Coon, M.; Nguyen, T.; Wang, L.; Land, S.J.; Lu, X.; Ruden, D.M. A Program for Annotating and Predicting the Effects of Single Nucleotide Polymorphisms, SnpEff: SNPs in the Genome of Drosophila Melanogaster Strain W1118; Iso-2; Iso-3. Fly (Austin). 2012, 6, 80–92. [Google Scholar] [CrossRef]
- Johnston, C.M.; Fahnøe, U.; Lohse, L.; Bukh, J.; Belsham, G.J.; Rasmussen, T.B. Analysis of Virus Population Profiles within Pigs Infected with Virulent Classical Swine Fever Viruses: Evidence for Bottlenecks in Transmission but Absence of Tissue-Specific Virus Variants. J. Virol. 2020, 94, 1–20. [Google Scholar] [CrossRef]
- Li, H. Minimap2: Pairwise Alignment for Nucleotide Sequences. Bioinformatics 2018, 34, 3094–3100. [Google Scholar] [CrossRef]
- Li, H.; Handsaker, B.; Wysoker, A.; Fennell, T.; Ruan, J.; Homer, N.; Marth, G.; Abecasis, G.; Durbin, R. The Sequence Alignment/Map Format and SAMtools. Bioinformatics 2009, 25, 2078–2079. [Google Scholar] [CrossRef]
- Olesen, A.S.; Lohse, L.; Johnston, C.M.; Rasmussen, T.B.; Bøtner, A.; Belsham, G.J. Increased Presence of Circulating Cell-Free, Fragmented, Host DNA in Pigs Infected with Virulent African Swine Fever Virus. Viruses 2023, 15, 2133. [Google Scholar] [CrossRef] [PubMed]
- Zani, L.; Forth, J.H.; Forth, L.F.; Nurmoja, I.; Leidenberger, S.; Henke, J.; Carlson, J.; Breidenstein, C.; Viltrop, A.; Höper, D.; et al. Deletion at the 5’-End of Estonian ASFV Strains Associated with an Attenuated Phenotype. Sci. Rep. 2018, 8, 6510. [Google Scholar] [CrossRef] [PubMed]
- Ramirez-Medina, E.; Vuono, E.A.; Rai, A.; Pruitt, S.; Silva, E.; Velazquez-Salinas, L.; Zhu, J.; Gladue, D.P.; Borca, M. V. Evaluation in Swine of a Recombinant African Swine Fever Virus Lacking the MGF-360-1L Gene. Viruses 2020, 12, 1193. [Google Scholar] [CrossRef] [PubMed]
- Ramirez-Medina, E.; Vuono, E.; Pruitt, S.; Rai, A.; Silva, E.; Espinoza, N.; Zhu, J.; Velazquez-Salinas, L.; Borca, M. V.; Gladue, D.P. Development and In Vivo Evaluation of a MGF110-1L Deletion Mutant in African Swine Fever Strain Georgia. Viruses 2021, 13, 286. [Google Scholar] [CrossRef]
- Vuono, E.A.; Ramirez-Medina, E.; Pruitt, S.; Rai, A.; Espinoza, N.; Velazquez-Salinas, L.; Gladue, D.P.; Borca, M. V. Evaluation of the Function of the ASFV KP177R Gene, Encoding for Structural Protein P22, in the Process of Virus Replication and in Swine Virulence. Viruses 2021, 13, 986. [Google Scholar] [CrossRef] [PubMed]
- Borca, M. V.; O’Donnell, V.; Holinka, L.G.; Ramírez-Medina, E.; Clark, B.A.; Vuono, E.A.; Berggren, K.; Alfano, M.; Carey, L.B.; Richt, J.A.; et al. The L83L ORF of African Swine Fever Virus Strain Georgia Encodes for a Non-Essential Gene That Interacts with the Host Protein IL-1β. Virus Res. 2018, 249, 116–123. [Google Scholar] [CrossRef]
- Cheng, M.; Kanyema, M.M.; Sun, Y.; Zhao, W.; Lu, Y.; Wang, J.; Li, X.; Shi, C.; Wang, J.; Wang, N.; et al. African Swine Fever Virus L83L Negatively Regulates the CGAS-STING-Mediated IFN-I Pathway by Recruiting Tollip To Promote STING Autophagic Degradation. J. Virol. 2023, 97. [Google Scholar] [CrossRef] [PubMed]
- Yang, J.; Zhu, R.; Zhang, Y.; Fan, J.; Zhou, X.; Yue, H.; Li, Q.; Miao, F.; Chen, T.; Mi, L.; et al. SY18ΔL60L: A New Recombinant Live Attenuated African Swine Fever Virus with Protection against Homologous Challenge. Front. Microbiol. 2023, 14. [Google Scholar] [CrossRef] [PubMed]
- Ramirez-Medina, E.; Vuono, E.; Silva, E.; Rai, A.; Valladares, A.; Pruitt, S.; Espinoza, N.; Velazquez-Salinas, L.; Borca, M. V.; Gladue, D.P. Evaluation of the Deletion of MGF110-5L-6L on Swine Virulence from the Pandemic Strain of African Swine Fever Virus and Use as a DIVA Marker in Vaccine Candidate ASFV-G-ΔI177L. J. Virol. 2022, 96. [Google Scholar] [CrossRef]
- Li, D.; Liu, Y.; Qi, X.; Wen, Y.; Li, P.; Ma, Z.; Liu, Y.; Zheng, H.; Liu, Z. African Swine Fever Virus MGF-110-9L-Deficient Mutant Has Attenuated Virulence in Pigs. Virol. Sin. 2021, 36, 187–195. [Google Scholar] [CrossRef]
- Zhong, H.; Fan, S.; Du, Y.; Zhang, Y.; Zhang, A.; Jiang, D.; Han, S.; Wan, B.; Zhang, G. African Swine Fever Virus MGF110-7L Induces Host Cell Translation Suppression and Stress Granule Formation by Activating the PERK/PKR-EIF2α Pathway. Microbiol. Spectr. 2022, 10. [Google Scholar] [CrossRef]
- Burrage, T.G.; Lu, Z.; Neilan, J.G.; Rock, D.L.; Zsak, L. African Swine Fever Virus Multigene Family 360 Genes Affect Virus Replication and Generalization of Infection in Ornithodoros Porcinus Ticks. J. Virol. 2004, 78, 2445–2453. [Google Scholar] [CrossRef]
- Zsak, L.; Lu, Z.; Burrage, T.G.; Neilan, J.G.; Kutish, G.F.; Moore, D.M.; Rock, D.L. African Swine Fever Virus Multigene Family 360 and 530 Genes Are Novel Macrophage Host Range Determinants. J. Virol. 2001, 75, 3066–3076. [Google Scholar] [CrossRef]
- Neilan, J.G.; Zsak, L.; Lu, Z.; Kutish, G.F.; Afonso, C.L.; Rock, D.L. Novel Swine Virulence Determinant in the Left Variable Region of the African Swine Fever Virus Genome. J. Virol. 2002, 76, 3095–3104. [Google Scholar] [CrossRef] [PubMed]
- Reis, A.L.; Abrams, C.C.; Goatley, L.C.; Netherton, C.; Chapman, D.G.; Sanchez-Cordon, P.; Dixon, L.K. Deletion of African Swine Fever Virus Interferon Inhibitors from the Genome of a Virulent Isolate Reduces Virulence in Domestic Pigs and Induces a Protective Response. Vaccine 2016, 34, 4698–4705. [Google Scholar] [CrossRef] [PubMed]
- Golding, J.P.; Goatley, L.; Goodbourn, S.; Dixon, L.K.; Taylor, G.; Netherton, C.L. Sensitivity of African Swine Fever Virus to Type I Interferon Is Linked to Genes within Multigene Families 360 and 505. Virology 2016, 493, 154–161. [Google Scholar] [CrossRef] [PubMed]
- O’Donnell, V.; Holinka, L.G.; Gladue, D.P.; Sanford, B.; Krug, P.W.; Lu, X.; Arzt, J.; Reese, B.; Carrillo, C.; Risatti, G.R.; et al. African Swine Fever Virus Georgia Isolate Harboring Deletions of MGF360 and MGF505 Genes Is Attenuated in Swine and Confers Protection against Challenge with Virulent Parental Virus. J. Virol. 2015, 89, 6048–6056. [Google Scholar] [CrossRef]
- O’Donnell, V.; Holinka, L.G.; Sanford, B.; Krug, P.W.; Carlson, J.; Pacheco, J.M.; Reese, B.; Risatti, G.R.; Gladue, D.P.; Borca, M. V. African Swine Fever Virus Georgia Isolate Harboring Deletions of 9GL and MGF360/505 Genes Is Highly Attenuated in Swine but Does Not Confer Protection against Parental Virus Challenge. Virus Res. 2016, 221, 8–14. [Google Scholar] [CrossRef]
- Lunter, G.; Goodson, M. Stampy: A Statistical Algorithm for Sensitive and Fast Mapping of Illumina Sequence Reads. Genome Res. 2011, 21, 936–939. [Google Scholar] [CrossRef]
- Brandt, D.Y.C.; Aguiar, V.R.C.; Bitarello, B.D.; Nunes, K.; Goudet, J.; Meyer, D. Mapping Bias Overestimates Reference Allele Frequencies at the HLA Genes in the 1000 Genomes Project Phase I Data. G3 Genes|Genomes|Genetics 2015, 5, 931–941. [Google Scholar] [CrossRef]
- Rang, F.J.; Kloosterman, W.P.; de Ridder, J. From Squiggle to Basepair: Computational Approaches for Improving Nanopore Sequencing Read Accuracy. Genome Biol. 2018, 19, 90. [Google Scholar] [CrossRef]
- Delahaye, C.; Nicolas, J. Sequencing DNA with Nanopores: Troubles and Biases. PLoS ONE 2021, 16, e0257521. [Google Scholar] [CrossRef]
- Ni, Y.; Liu, X.; Simeneh, Z.M.; Yang, M.; Li, R. Benchmarking of Nanopore R10.4 and R9.4.1 Flow Cells in Single-Cell Whole-Genome Amplification and Whole-Genome Shotgun Sequencing. Comput. Struct. Biotechnol. J. 2023, 21, 2352–2364. [Google Scholar] [CrossRef]
- Kieleczawa, J. Fundamentals of Sequencing of Difficult Templates--an Overview. J. Biomol. Tech. 2006, 17, 207–217. [Google Scholar] [PubMed]
- Zeng, F.; Jiang, R.; Chen, T. PyroHMMsnp: An SNP Caller for Ion Torrent and 454 Sequencing Data. Nucleic Acids Res. 2013, 41, e136. [Google Scholar] [CrossRef] [PubMed]
- Fuller, C.W.; Middendorf, L.R.; Benner, S.A.; Church, G.M.; Harris, T.; Huang, X.; Jovanovich, S.B.; Nelson, J.R.; Schloss, J.A.; Schwartz, D.C.; et al. The Challenges of Sequencing by Synthesis. Nat. Biotechnol. 2009, 27, 1013–1023. [Google Scholar] [CrossRef] [PubMed]
- Pfeiffer, F.; Gröber, C.; Blank, M.; Händler, K.; Beyer, M.; Schultze, J.L.; Mayer, G. Systematic Evaluation of Error Rates and Causes in Short Samples in Next-Generation Sequencing. Sci. Rep. 2018, 8, 10950. [Google Scholar] [CrossRef]

| Matrix | 1xα | 10xα | 100xα |
|---|---|---|---|
| EDTA-blood | +++ | ++ | + |
| Bone-marrow | - | ++ | + |
| Spleen | - | ++ | + |
| Serum | + | - | - |
Disclaimer/Publisher’s Note: The statements, opinions and data contained in all publications are solely those of the individual author(s) and contributor(s) and not of MDPI and/or the editor(s). MDPI and/or the editor(s) disclaim responsibility for any injury to people or property resulting from any ideas, methods, instructions or products referred to in the content. |
© 2023 by the authors. Licensee MDPI, Basel, Switzerland. This article is an open access article distributed under the terms and conditions of the Creative Commons Attribution (CC BY) license (http://creativecommons.org/licenses/by/4.0/).


