Submitted:
15 December 2023
Posted:
15 December 2023
You are already at the latest version
Abstract
Predicting and evaluating the vitality level of public spaces of urban design is crucial before new construction and renewal, especially for developing countries, to avoid failures like "ghost neighborhood" and reduce resource waste. However, existing assessment methods for the urban vitality are either static and ignore changes in the time dimension, or rely on historical big data and are unable to predict unbuilt projects. This study combines previous methods and crowds’ characteristics observation in public space, puts forward the crowd-frequency hypothesis and constructs an algorithm, and establishes a time-dimensional urban vitality dynamic prediction model. Taking the Rundle Mall neighborhood in Adelaide, Australia, as an example, the effec-tiveness of the prediction model was proved through on-site observation sampling comparative verification method. In addition, the decision tree model was used to conduct machine learning on the case data, and a set of algorithm programs were obtained that can directly input some basic information to obtain the urban vitality level (high-medium-low) in a certain period. It can be used as a tool to support the design and decision-making processes of urban planners and government officials, providing a low-cost way to achieve sustainable urban vitality construction of late-developing cities directly.
Keywords:
Urban vitality 1
; Algorithm 2
; Crowd-frequency 3
1. Research Background & Introduction
Since the 1990s, emerging economies have built many new cities [1]. As of 2016, China has planned 3,500 new cities that are expected to accommodate a population of 3.4 billion [2], and the remaining 40+ developing countries have invested in the construction of 150+ new cities to accommodate a population of more than 50 million [3]. However, some new towns are "ghost town”, such as Forest City in Malaysia [4] and Lingang New Town in Shanghai China [5], and the phenomenon of "ghost neighborhood" has appeared in many blocks, such as neighborhoods in China Yantai, Qingdao and other cities [5]. The "ghost" zones whose actual usage rate is far lower than the expected load [6] not only causes a waste of resources, but also slows down the progress of the originally planned development. Improving the vitality of these zones often requires redevelopment, requires more investment and time, and may fail again. To make matters worse, many successfully developed large cities in the United States, China, Europe, and Japan have faced the problem of shrinking in the past thirty years [7,8]and need to be revitalized. Therefore, it is valuable to put out an algorithm that can directly and accurately predict and evaluate urban vitality based on design plans, to manage risks before actual construction and development and achieve sustainable development.
“Urban vitality” as a kind of “intensity of people’s concentration” [9] is often seen as a goal of good urban public space design [10]. "Urban vitality" has multiple definition methods can be summarized as evaluating the ability of the built environment to promote activity or the density of people in the space [11], and even some composite definition method [12]; but in general research at the meso-micro level, it is still defined by the amount of active people in public urban space [13]. In the previous research, Chen et. al [14] and Guo et. al [15] etc. proved that urban vitality changes with separate times of the day, and changes are different between working days and rest days (weekends). Given that urban vitality is heterogeneous in both temporal and spatial dimensions, it is necessary to find a method that can accurately assess and predict urban vitality in different periods of space.
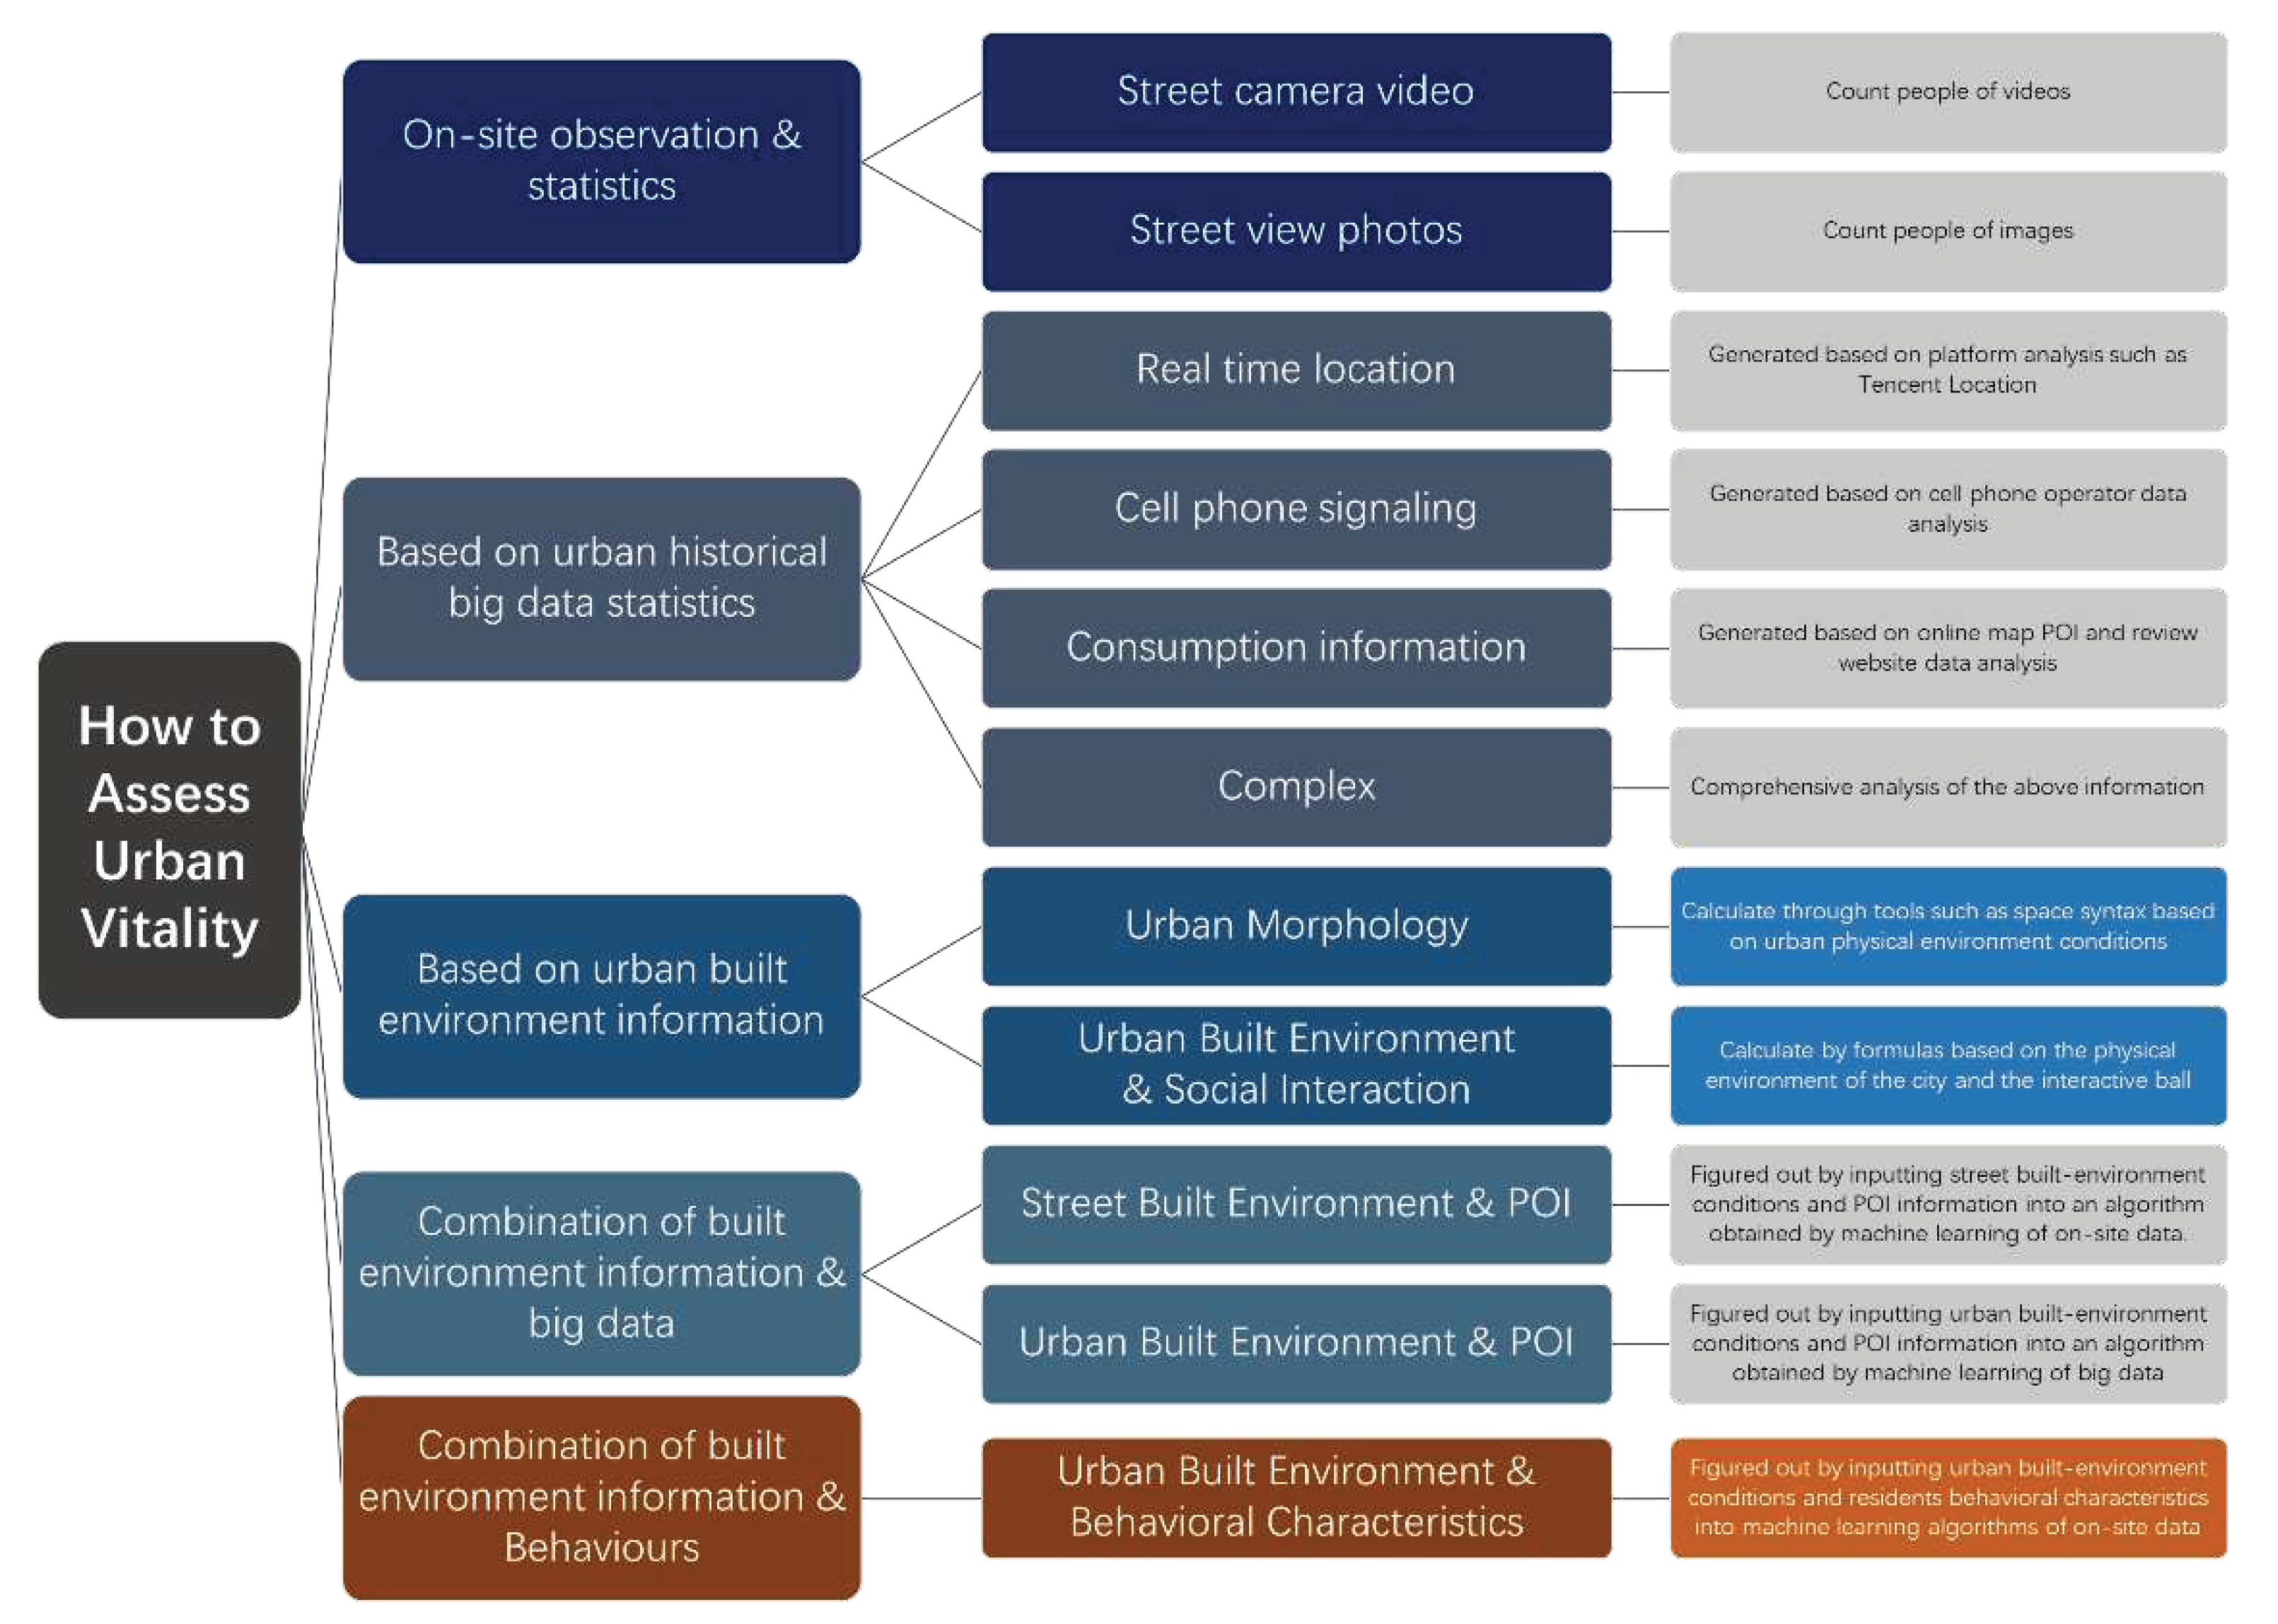
Existing methods for quantitatively assessing urban vitality have their own strengths and weaknesses. The on-site observational statistics method [13,16] collects data directly, but the operation is cumbersome and can only evaluate the temporal urban vitality of points collected on site. Methods based on urban big data statistical analysis directly such as mobile phone signal data [14], Tencent location information [17], online map POI information [18] and so on to evaluate urban vitality, which can present rich statistical results and accurately assesses the urban vitality of a certain region at a specific time. However, considering the lag, fragmentation, imbalance, limitations, and factors such as privacy and ethics of big data, the obtained vitality analysis results are often one-sided. Moreover, most evaluation methods based on big data do not distinguish whether people are in urban public spaces or inside buildings. For example, the streets in a sleep-town are empty at night, but there are many people in buildings and the mobile phone signaling signal is strong, which will cause ambiguity if this situation is also defined as active. In addition, its biggest limitation is that it must be based on historical statistical data, and it does not have ability to predict urban plans that have not yet been implemented. Even the results analyzed by data of a urban areas people started to live in less than 5 years will be much lower than the stable state [5]. The method of assessing the vitality of urban public spaces based on urban physical built environment information is not affected by whether the project is completed and completed and has good predictive capabilities. For example, Ye & Nes [19] proposed a method to calculate urban vitality based on urban morphology by Space Syntax and Space Matrix tools and Mixed Use Index; Guo et al. [20] proposed a method to calculate urban vitality by the information of urban public space and its immediate buildings, and interaction ball (tool to quantify the level of social interaction). However, this type of method ignores the laws of human subjective behavior, so that ignores the behavioral differences caused by user characteristics in specific spaces and the differences of human behaviors in different time dimensions. For one set of physical urban built environment, only a set of static and general vitality prediction can be made, fails to obtain accurate spatial-temporal vitality results divided by time periods [13]. The method of algorithms, which are generated by machine learning of the results of the actual measurement methods with urban information have the advantage of simple operations. However, when used, these algorithms not only require inputting the information of urban physical built environment but also POIs of online maps, which do not completely get rid of dependence on big data.
Therefore, it is necessary to find a new research path for more accurate evaluation and prediction of urban spatial vitality in various time periods. This study refers to the above research methods and introduces time variables to establish a new index system for evaluating urban vitality. By analyzing the behavioral characteristics of each group in urban spaces, their typical schedules were obtained to comprehensively consider the impact of users on urban vitality, and establish an analysis framework for crowd-frequency over time. The effectiveness of the new method was verified, taking the Rundle Mall neighborhood in Adelaide, one of Australia's major cities, as a case study. In addition, in order to facilitate use and better understand the evaluation results, machine learning was performed on the case data through the decision tree model, and an algorithm was obtained that can directly predict the vitality level (high-medium-low) of a public space in a certain period, by entering urban and space information.
Figure 1.
Review of urban vitality assessment methods and contribution of this study.
2. Theory of time dimension dynamic based on crowd-frequency.
The above-mentioned existing methods for predicting spatial vitality are all static and have low accuracy in the time dimension. Although these methods can improve accuracy by machine learning to find patterns between measured real-time data and static prediction values of many cases. In view of the complex relationship between time and vitality, the threshold for data collection will be very high, and the principles of changes in urban vitality in the time dimension are still not explored clearly.
Therefore, this study attempts to clarify the laws of temporal changes in urban vitality. Past research has found that there are significant differences in the vitality of urban public spaces between day and night, weekdays and weekends [14]. These spatiotemporal changes are cyclical and periodicity [14], as well as related to human activities [18]. Hypotheses of the relationship of urban temporal vitality and crowds’ activity was proposed by observing urban life. Based on the review of past methods and hypotheses framework, the parameters and algorithm construction of the dynamic vitality assessment method were completed. Finally, by comparing the predicted values of public space vitality in the case urban area with the measured values, the hypothesis were verified.
2.1. Hypothesis
- H 01: The users of the space in a certain period are related to crowd preferences.
The main users of different functional spaces are usually not uniform. For example, children and parents are often seen in the children's entertainment facilities area, as well as children are rarely seen in nightclubs. The main users of the same space at separate times will also be different. For example, in a cafe, the main activity in the early morning on weekdays is office workers buying breakfast, but at noon on weekends, it will be frequented by family gatherings.
- H 02: A specific crowd’s use of urban space generally follows a specific schedule.
Crowds in the same age range and employment situation have roughly regular schedules. Although every individual at the micro level may not necessarily comply with the schedule every day, from the scale of the city block population, it will follow the law of crowd. For example, a full-time employee in Adelaide usually arrives at the office between 8-10 am local time during the working day, has a lunch break between 12 noon and 2 pm, and leaves work between 4-6 pm in the evening. This means that there is a high probability that they will not show up to eat at a restaurant at 3pm on a weekday. For another example, although high school students like to play basketball, they usually do not appear at the neighborhood basketball court during class time.
Therefore, whether a certain crowd will appear in a specific place during a certain period can be judged through the crowd preference and schedule.
2.2. Specific parameters
- Crowds
Age and occupational characteristics will directly affect people’s social interaction behavior patterns by time in urban space. For example, during working hours on weekdays, full-time employees with fixed positions usually need to work in the office all the time; while those who engage in activities in outdoor public spaces such as squares are mostly people do not need to work at that time. For another case, young children rarely appear on the street at night because they usually get sleep early.
For crowd grouping method, people in urban public spaces usually can be classified according to the factors of age and employment status and group rates can be calculated based on local data statistics. Seven representative general city images can be extracted: young children, teenage students, unemployed people (including stay-at-home parents), full-time / part-time workers, people employed but away from work, and retired people (Table 1). This classification can also be further adjusted and refined according to specific circumstances if there is any need. For example, residents of a certain city always keep dogs, and the urban area under study has a dog park, then the indicator of dog-raising should be superimposed to refine the classification of crowds.
- Frequency
The most important feature of functional space used by different groups of people is frequency. This can be inferred from the typical schedule of a particular crowd. Take the average full-time employee in Adelaide as an example. They generally work in the office from 9 am to 6 pm on weekdays, have meal and rest time at noon, need transportation time to and from get off work, have weekends off, and are willing to go to public spaces for activities. Based on this assumption, a 24-hour space appearance map was established and drawn on weekdays and weekends (Table 2).
Specific to a certain public space, according to the appearance schedule, the activity frequency map of a certain type of crowd can be drawn. If a certain crowd is likely to be active in a certain space at a certain time, its probability of occurrence is set to "1"; otherwise, it is set to "0". Then, the frequency of a certain crowd appearing in the space at that period can be quantitatively recorded. By weighting the frequency of all crowds appearing according to the population proportion, the frequency of overall urban residents appearing in there can be estimated.
3. Algorithm construction
3.1. Indicators
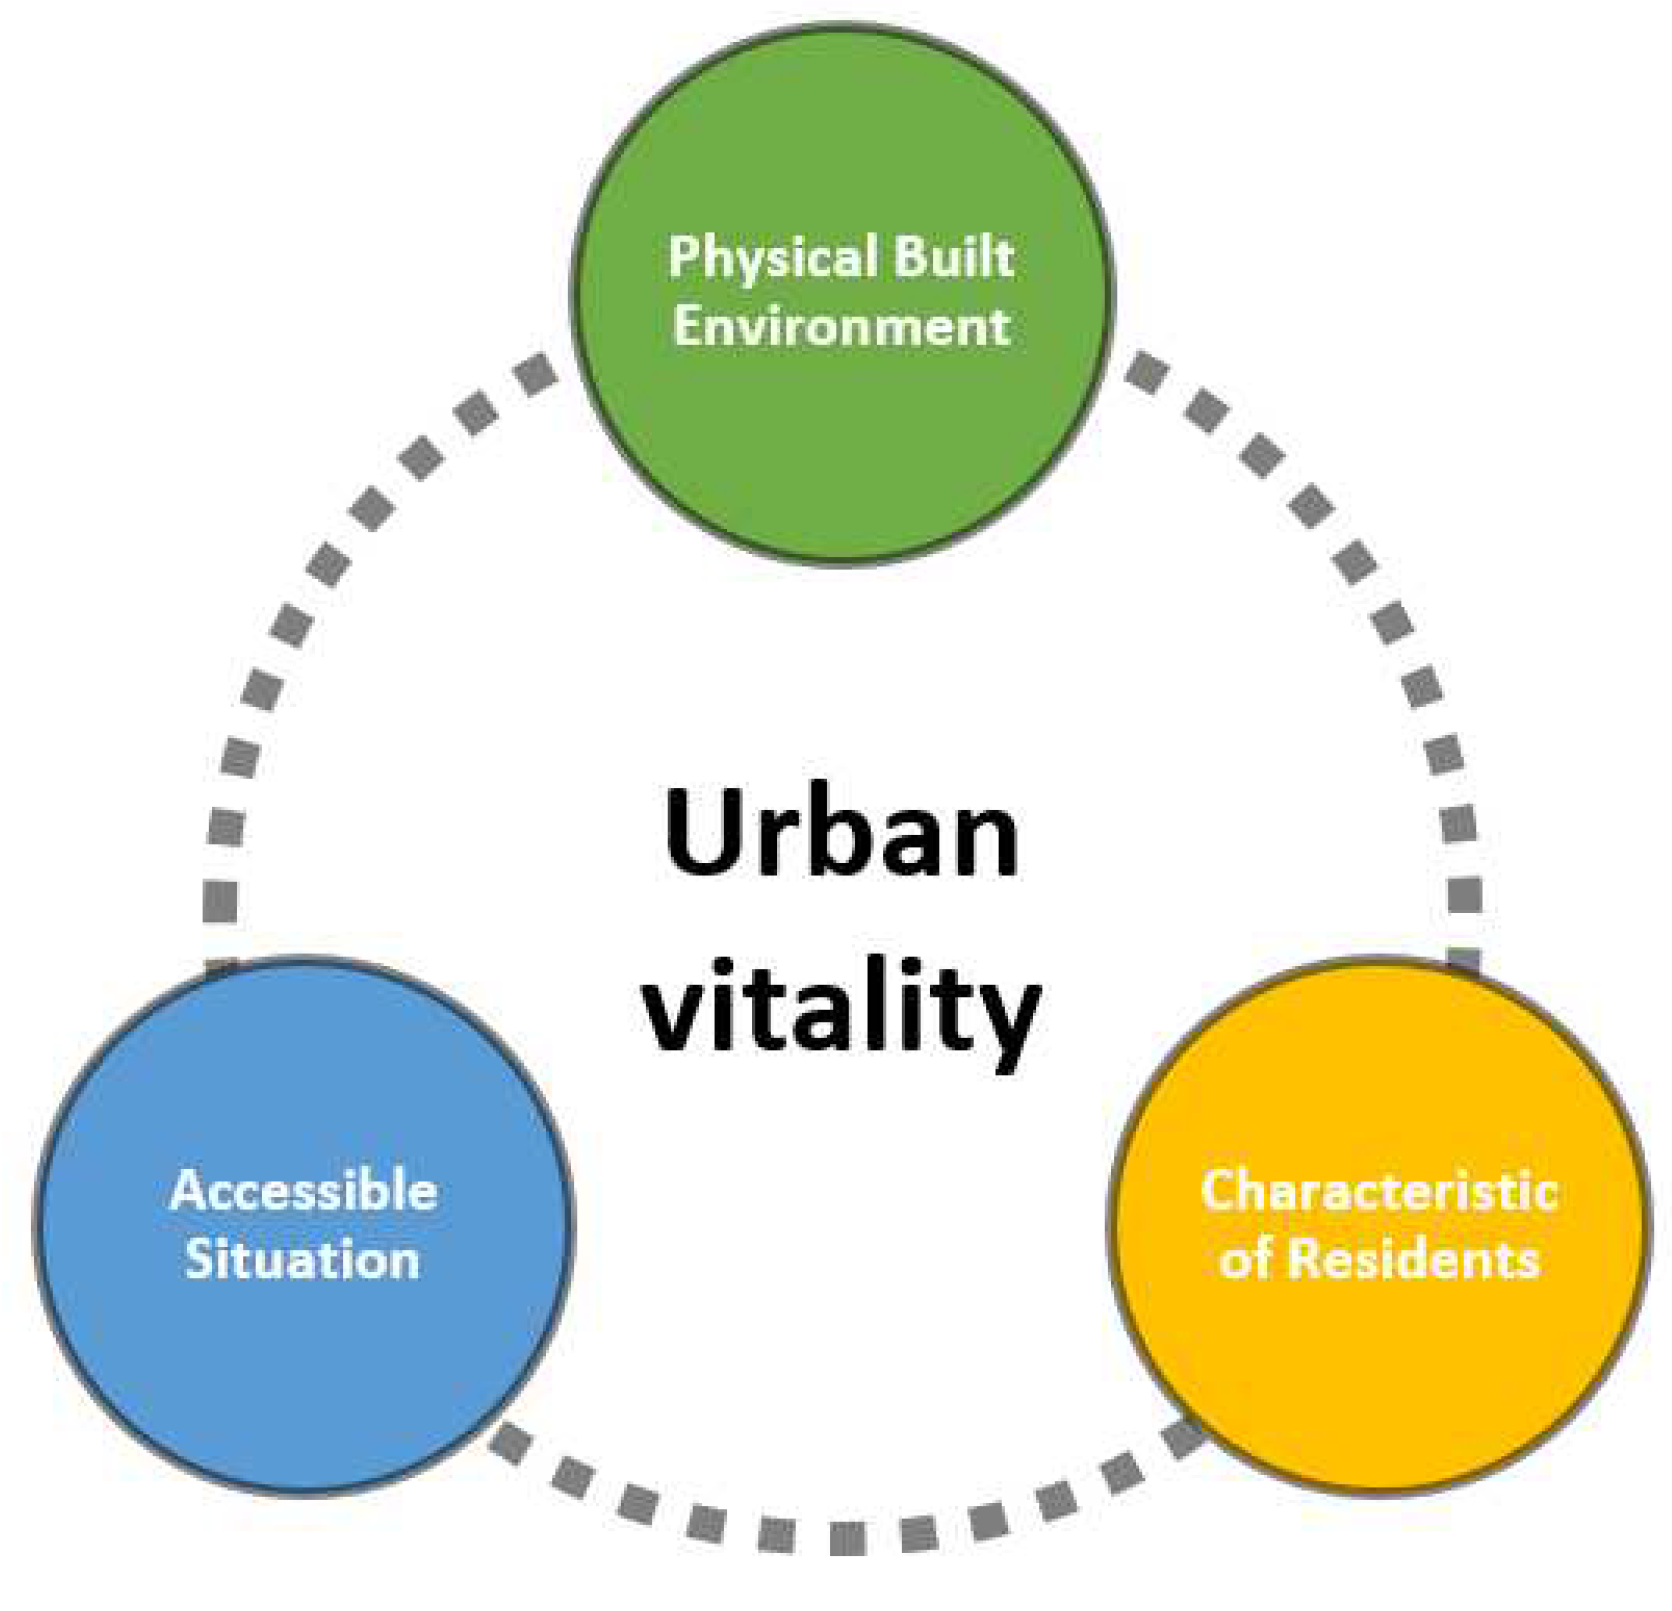
Physical built environment of the place, surrounding accessible situation, and the characteristics of residents affect the urban vitality of a place at a certain time. New indicator system of the dynamic time algorithm of urban public space vitality were proposed based on a review of previous indicator systems as well as the crowd-frequency framework.
Figure 2.
Factors influence urban vitality.
3.1.1. Indicator system of past studies
The above table reviews five urban vitality studies’ indicator systems. There is a lot of duplication and overlap between different indicator systems. In terms of physical built environment, these methods generally include information on space use, openness, landscape (greening) level, urban form, surrounding building functions and openness, etc. In terms of accessible situation, vehicle accessibility, bus accessibility, and walking accessibility are generally concerned. In terms of the characteristics of surrounding residents, they basically only focus on the population situation.
3.1.2. New Indicator system
The new indicator system refers to the above reviews and crowds-frequency hypothesis framework. In terms of indicator selection, this system tried to screen out possible overlapping parameters, and choose the simplest and lowest acquisition cost one among indicators expresses similar characteristic. In addition to the compilation and use of common indicators from previous generations, new factors such as crowds, frequency, and space for access were also included.

Table 4.
The indicator system of dynamic prediction algorithm of urban public space vitality.
| Factor type | Indicators | |
|---|---|---|
| Physical built environment | Urban public space | Spatial social interaction coefficient (depends on function) |
| Attractiveness of outdoor landscape and facility | ||
| Building next to the public urban space | Area of ground floor indoor space open to public | |
| Spatial social interaction coefficient (depends on function) | ||
| Openness of buildings | ||
| Negative factors | Trash can | |
| Homeless | ||
| Others | ||
| Accessible situation | Vehicle accessibility | Reachable by car |
| Distance to parking lot | ||
| Public transport system accessibility | ||
| Walking accessibility | ||
| Access factor, conditions for the urban space entry | ||
| Characteristics of residents | Crowds | Age |
| Occupation and employment status | ||
| Frequency schedule of residents | ||
3.2. Algorithm & Formula
This algorithm model first calculates each parameter of the three types of factors separately.
Physical built environment factors:
in the formula, -- the factor of physical built environment at a certain time.
Areain -- area of indoor space.
INTERACTin -- interaction coefficient of building space next to the place, depends on mean function and measured according to the interaction ball.
OPENNESS-- openness coefficient for different functions in indoor buildings, values 0, 0.5, and 1 correspond to closed, semi-open, and fully open respectively.
INTERACTout -- outdoor interaction coefficient, depends on mean function and measured according to the interaction ball.
ATTRACTION -- comprehensive attraction level of greening and public activity facilities in outdoor spaces takes an integer from 0 to 2.
NEG -- Internal and external negative factors.
Accessible situation factors:
in the formula, -- the factor of accessible situation at a certain time.
Accessibilityauto -- accessibility factor of the vehicle of the place.
Accessibilitywalk -- walking accessibility factor of the place.
Accessfactor -- space access factor, whether there are conditions for space entry (such as membership or consumption); completely free is 4, quasi-free is 3, has potential consumption requirement is 2, fully charged / membership is 1.
Residents’ characteristics factors:
in the formula, -- the factor of residents’ characteristics at a certain time.
GroupRatem -- the proportion of crowd m in the regional population, calculated based on the local population age structure and employment situation.
Frequencym -- the frequency of space usage of crowd m at a certain time, determined by the schedule of the typical image of crowd m. If crowd m can be active, the frequency value is "1", if not, the frequency value is "0".
Then, the factors of the physical built environment, accessible situation, and residents’ characteristics are multiplied to obtain the urban vitality dynamic model prediction results λ. After multiplying all numerical products, the calculation result is taken as a logarithm to make the result more concise.
in the formula, λ -- the predicted value of social spatial interaction of a space at a certain time.
The sorted algorithm formula of dynamic prediction of urban public space vitality is as follows:
Among the parameters, GroupRate, Frequency, Accessibilityauto, Accessfactor, OPENNESS, and NEG will change with time. At different times, according to the calculation formula of the urban vitality dynamic predict model, different corresponding λ values will be generated. The granularity of prediction in the time dimension is improved based on the old research methods.
This study not only established a new dynamic algorithm model but also optimized data processing. Since each element in the model has different dimensions, the actual measured values obtained vary greatly. In order to better organize and calculate data, after the numerical statistics of each element are completed, data processing and integration need to be carried out. Since the statistical data for specific points in this study may have outliers, to keep the useful information in the outliers and make the data less sensitive to outliers, the Z-Score normalization method was used to simplify and improve the accuracy of the model. The processed data conforms to the standard normal distribution, with a mean of 0 and a standard deviation of 1. To prevent negative numbers from making the data difficult to understand, the simplified data will be collectively added by 2 and the interval will be shifted. The calculation formula for data standardization is as follows:
in the formula,
-- Standardized results.
-- original values in different dimensions.
-- the mean of the original data.
-- the standard deviation (std) of the original data.
This normalization will only be applied to parameters with large mean and variance such as area. Since "0" and "1" in "frequency" represent whether an activity is being performed, there is no need to standardize the "frequency" element. In addition, the values assigned to the factors of openness and influence are integers within 4, and there is no need for standardization.
4. Case Study Verification
The process of case verification is to first select several blocks of a venue and use the new social interaction dynamic model to predict the results of each period on weekdays and weekends. Then collect the number of people at these points by period on site. Finally, the reliability of the algorithm prediction model can be verified by evaluating and comparing the two sets of data.
4.1. Selection of case for experimental verification
4.1.1. Adelaide Roundel Mall Block
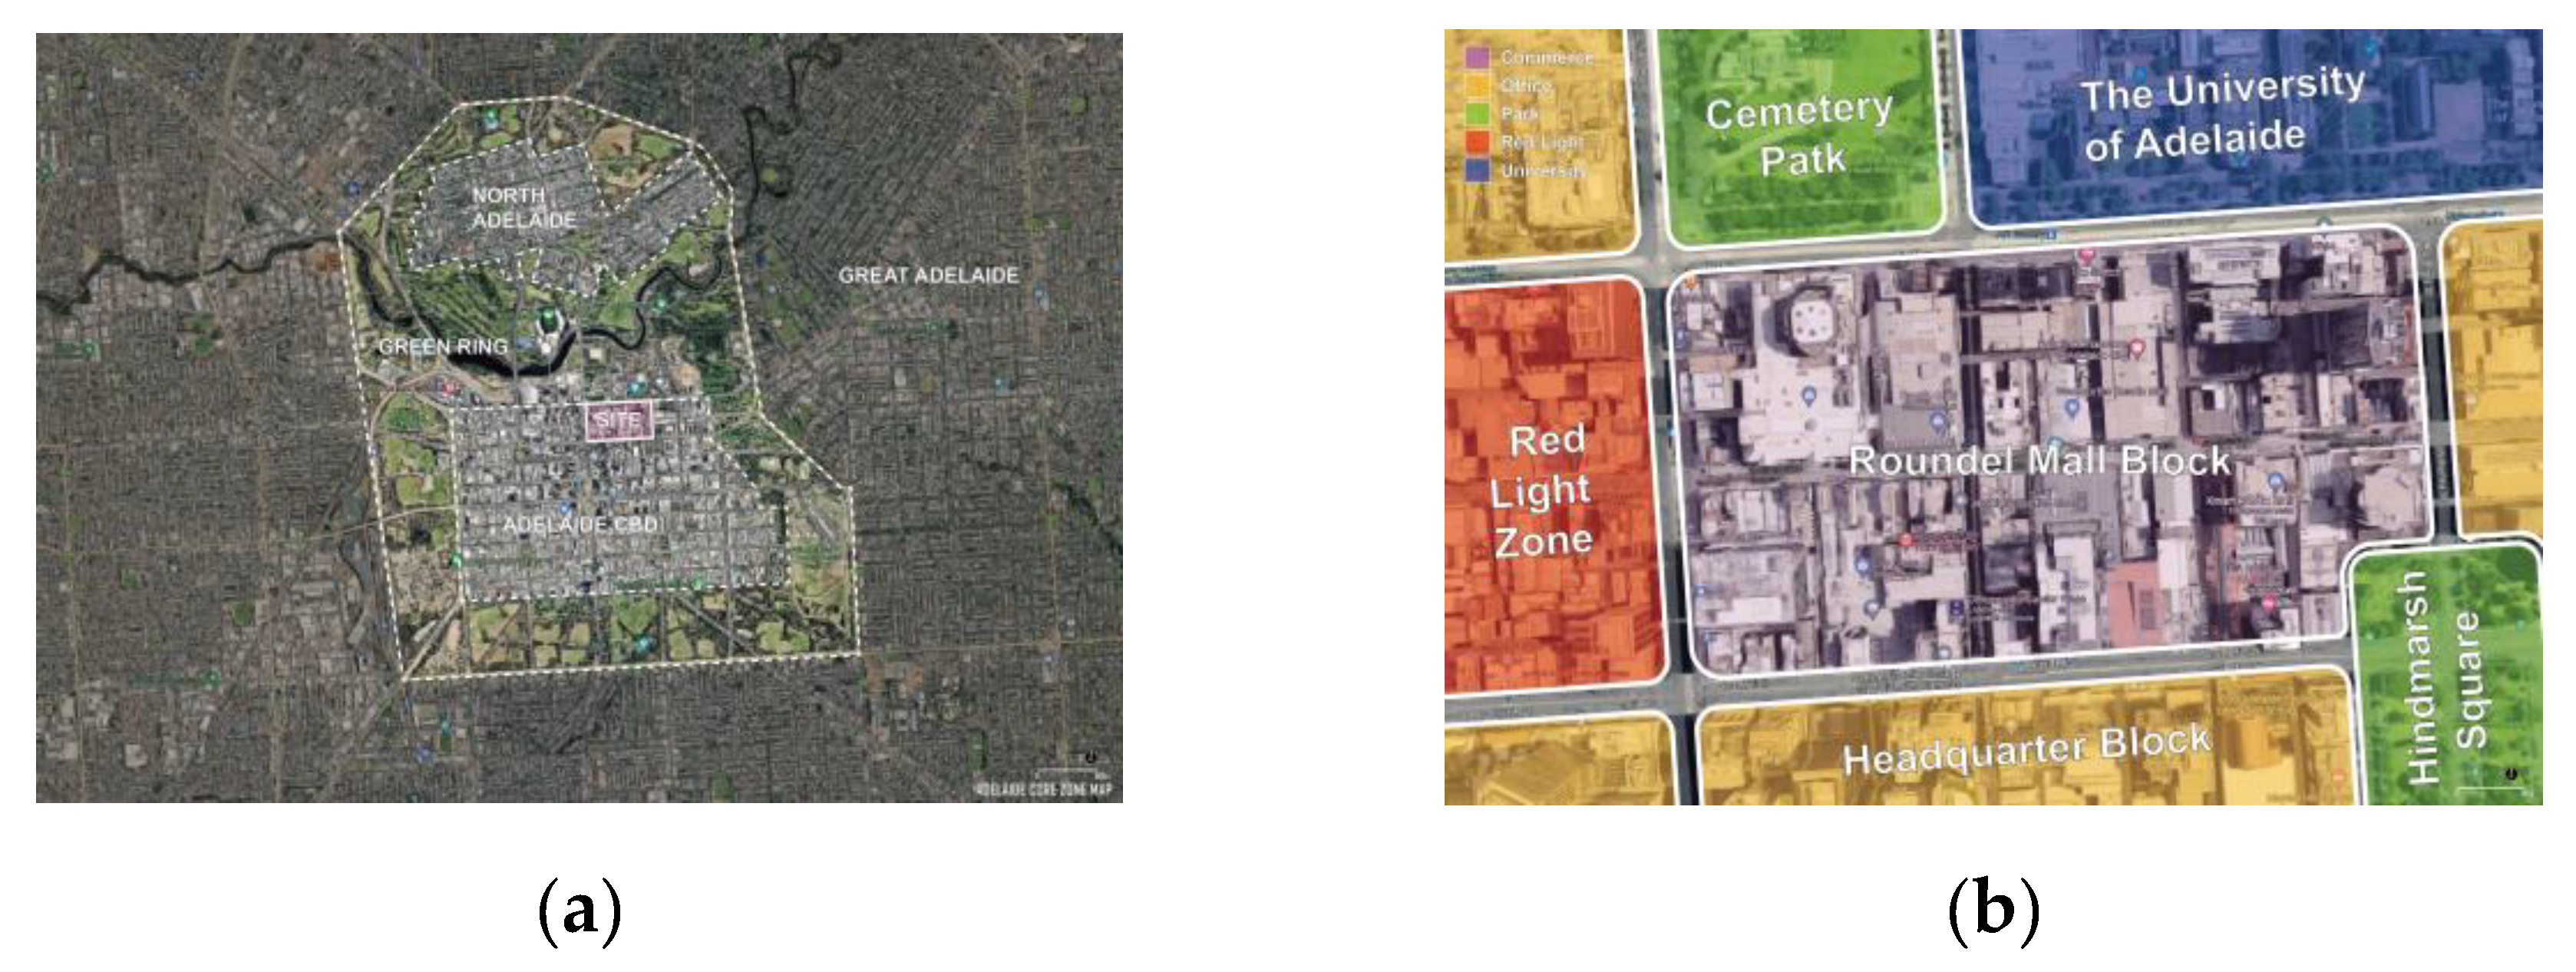
Adelaide is the capital of South Australia, the fourth largest city in Australia, and has been awarded "the most livable city in Australia" for many times [23]. The central urban area of Adelaide is composed of Adelaide CBD, Green Ring, and north Adelaide. The core zone and surrounding areas are referred to as Great Adelaide. Roundel Mall Block is located in the northeast of Adelaide CBD, which is a representative zone of an Australian urban block. Roundel Mall is adjacent to Adelaide University in the north, headquarters business block in the south, red light zone in the west and Hindmarsh Square in the southeast, which is one of the most popular places in South Australia.
Figure 3.
Location of Adelaide Rundle Mall Block: (a) Adelaide Core Zone Map; (b) Rundle Mall Block study area.
Figure 3.
Location of Adelaide Rundle Mall Block: (a) Adelaide Core Zone Map; (b) Rundle Mall Block study area.
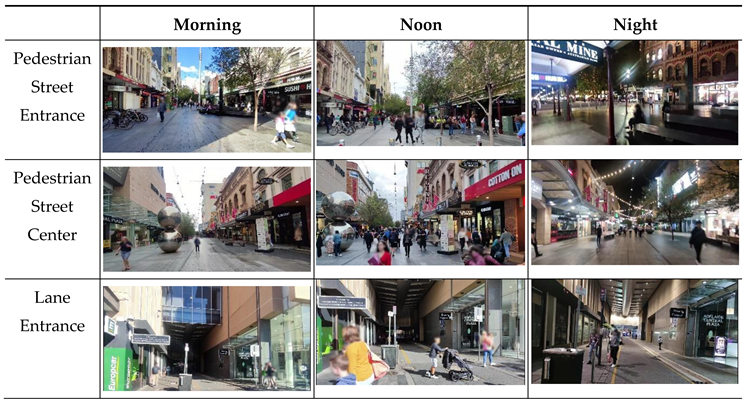
In the field trip, it can be found that the overall urban vitality of the entire block is relatively high, however, vitality of each area shows a uneven distribution of time and space. People flow between day and night and between different spaces changes significantly, but the change amplitude of each is not completely synchronized. There are fewer people in the early morning and at night, but more people at noon and afternoon; more people on the inside pedestrian during leisure time, and more people on the outside walking path during traffic time. On weekends and holidays, when shops are open for business, the Roundel Mall neighborhood maintains high spatial vitality, but the vitality of different spaces will vary greatly depending on the location. From lunch break to evening, the pedestrian street is crowded with people, but it is relatively quiet outside. Overall,the situation of this block is suitable for verification of dynamic algorithm models.
Table 5.
Uneven spatial and temporal distribution of spatial vitality in Adelaide Roundel Mall.
 |
4.1.2. Sute Division & Numbering
The public urban space in Roundel Mall Block was divided into 98 small blocks based on the physical environment boundaries and the functional attributes of adjacent buildings. To improve verification efficiency and reduce the cost of field data collection, this study comprehensively considered spatial attributes and distribution locations, and selected 10 of them for further specific research.
Figure 4.
Site Division of Adelaide Roundel Mall.

Figure 5.
Selection of study area.
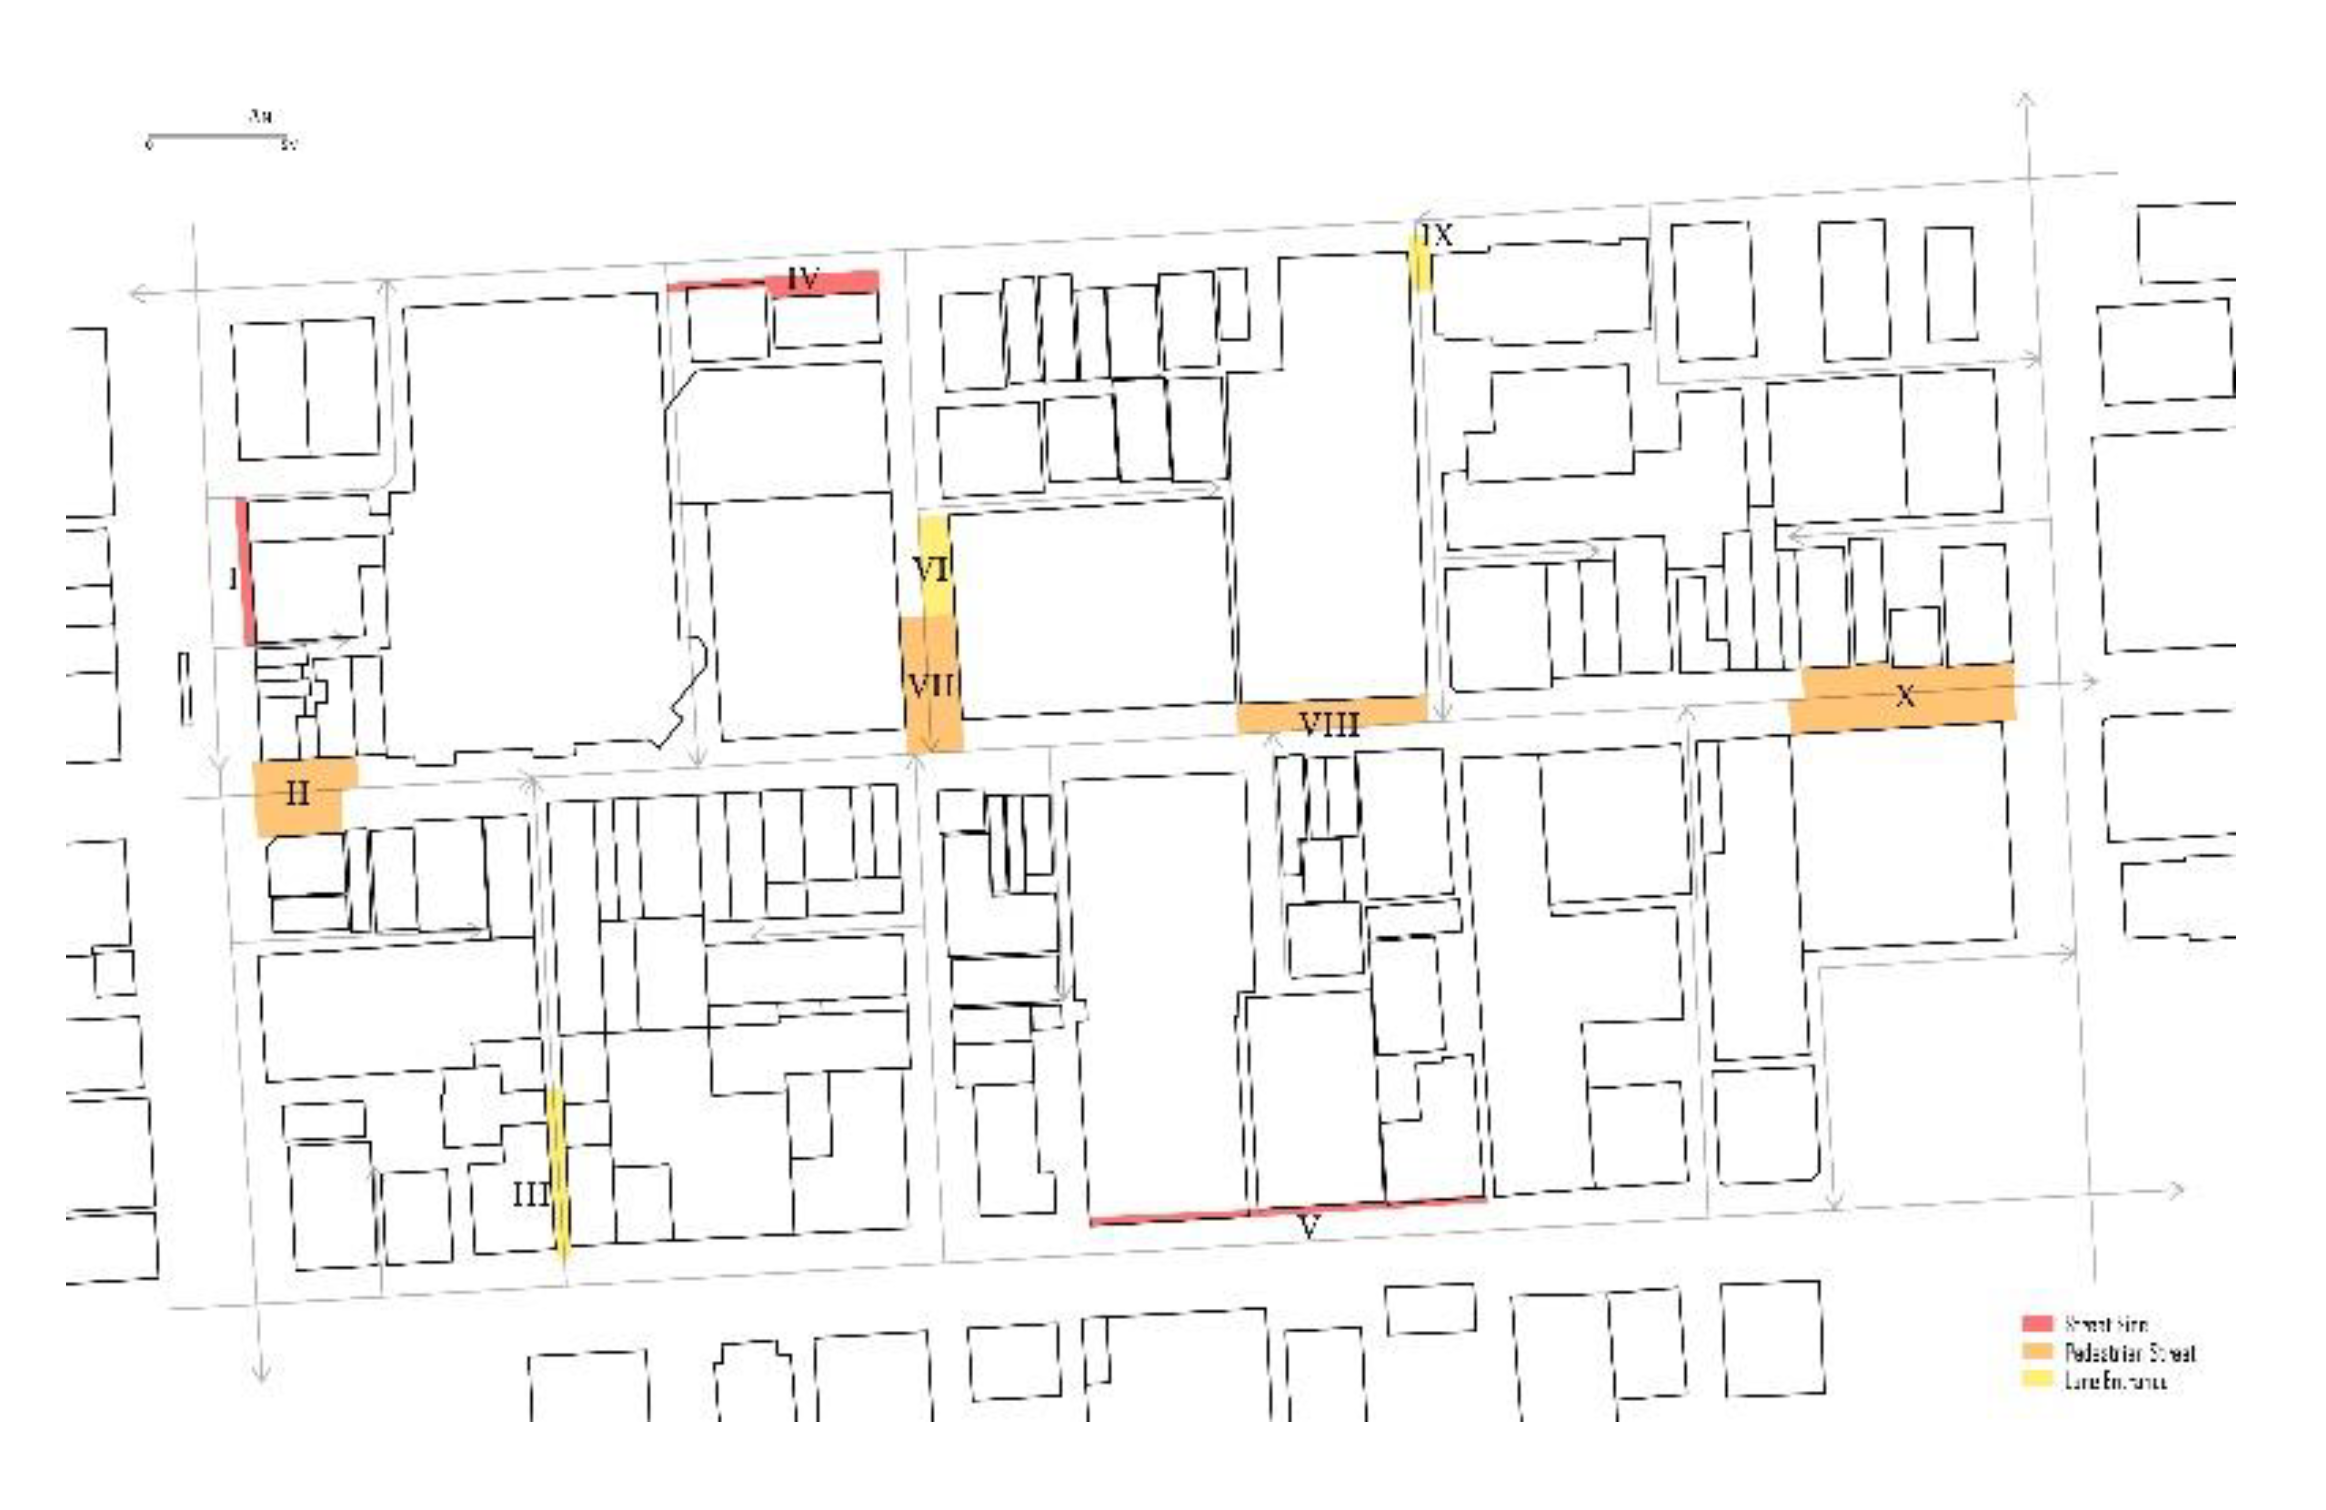
Table 6.
Selected block Situation.
| Block Num | Location | Nearby building Function |
|---|---|---|
| I | Street Side | Bank |
| II | Pedestrian Street Entrance | Retail |
| III | Lane Entrance | Retail |
| IV | Street Side | Apartment & Club |
| V | Street Side | shopping mall |
| VI | Rest in Lane | Retail |
| VII | Pedestrian Street Node | Retail |
| VIII | Pedestrian Street | shopping mall |
| IX | Lane Entrance | shopping mall |
| X | Pedestrian Street Entrance | Retail |
4.2. Obtain and Calculate of Each Parameter in the Prediction Model.
4.2.1. Crowds and frequency analysis
According to the new framework of the spatial social interaction dynamic model, first need to analyze and obtain the proportion of representative crowds that will appear in the area. Since this area belongs to the core of the entire city, users are not limited to the Adelaide CBD residents, but come from the whole Great Adelaide. The population data used in this study were collected from Great Adelaide's 2021 Census All persons QuickStats (Australian Bureau of Statistics, 2023) released by the Australian Bureau of Statistics. Based on information such as age and employment status (Figure 6), the final statistical result of crowds’ ratio is obtained (Table 7). Combining the population data and the basic functional planning of the area, the following conclusions can be drawn: 1) The age range of the main users of the area is very comprehensive. 2) On weekdays, it is expected that there will be mostly office workers and surrounding students, and on weekends, there will be mostly families, leisure, meeting friends and shopping.
Based on the functional attributes, crowd behavioral characteristics and proportion of each urban space, the frequency of each block in different time periods is estimated. The following table takes Block II as an example to show the specific frequency estimation results based on crowd proportions and "0" and "1" probability methods.
4.2.2. Collection of other parameters in the prediction model
- Values are obtained in the following ways:
- Area -- functional area. The results are obtained by counting the building area and site area in each spatial unit.
- Space access coefficient - assigned based on the openness of each functional space inside and outside the space unit. Completely free is 4, quasi-free opening requirement is 3, potential consumption requirement is 2, fully charged is 1.
- Interaction coefficient - mainly determined based on the land use properties of the space unit, combined with the functional characteristics of indoor and outdoor spaces to assist judgment, and finally determined based on the interactive sphere model.
- Attraction coefficient -- determined by the type and level of landscape/activities in the space. According to the location and scale of the attraction point, assign values from 0 to 3, respectively. The higher the value, the greater the influence.
- Auto accessibility - Comprehensive calculation based on the distance to public transportation stops. There are 9 bus stations, 3 train stations around the research plot.
- Walking accessibility - Comprehensive calculation of walkable area.
- NEG - spatial external negative factors. First, conduct on-site research to determine the number of negative impact points in the site and make statistics. A large trash can is worth 1, a small trash can is worth 0.5, and a homeless person is worth 1. Then the negative records of each spatial unit are accumulated and obtained.
4.3. Field observation verification data collection
At the selected points, on-site observations were conducted for four consecutive days from 4.27 to 4.28 (working days) and 4.29 to 4.30 (weekends) in 2023. Every 2 hours from 8 a.m. to 8 p.m., sampling is done by taking photos to record the number of people in the circled location. The data were sorted into two groups, working days and rest days, and the average values were taken. Then the logarithms of these results are taken as the observed value of urban vitality at that location during that period.
4.4. Data comparison verification
1. First disable the dynamic parameters of the time dimension introduced by the crowd-frequency hypothesis. Compare the calculated results with cumulative data from field observations throughout the day. The verification is in good condition, and it is confirmed that the static model part expect crowd-frequency hypothesis was successfully built.
2. Comparison of results at each point by period
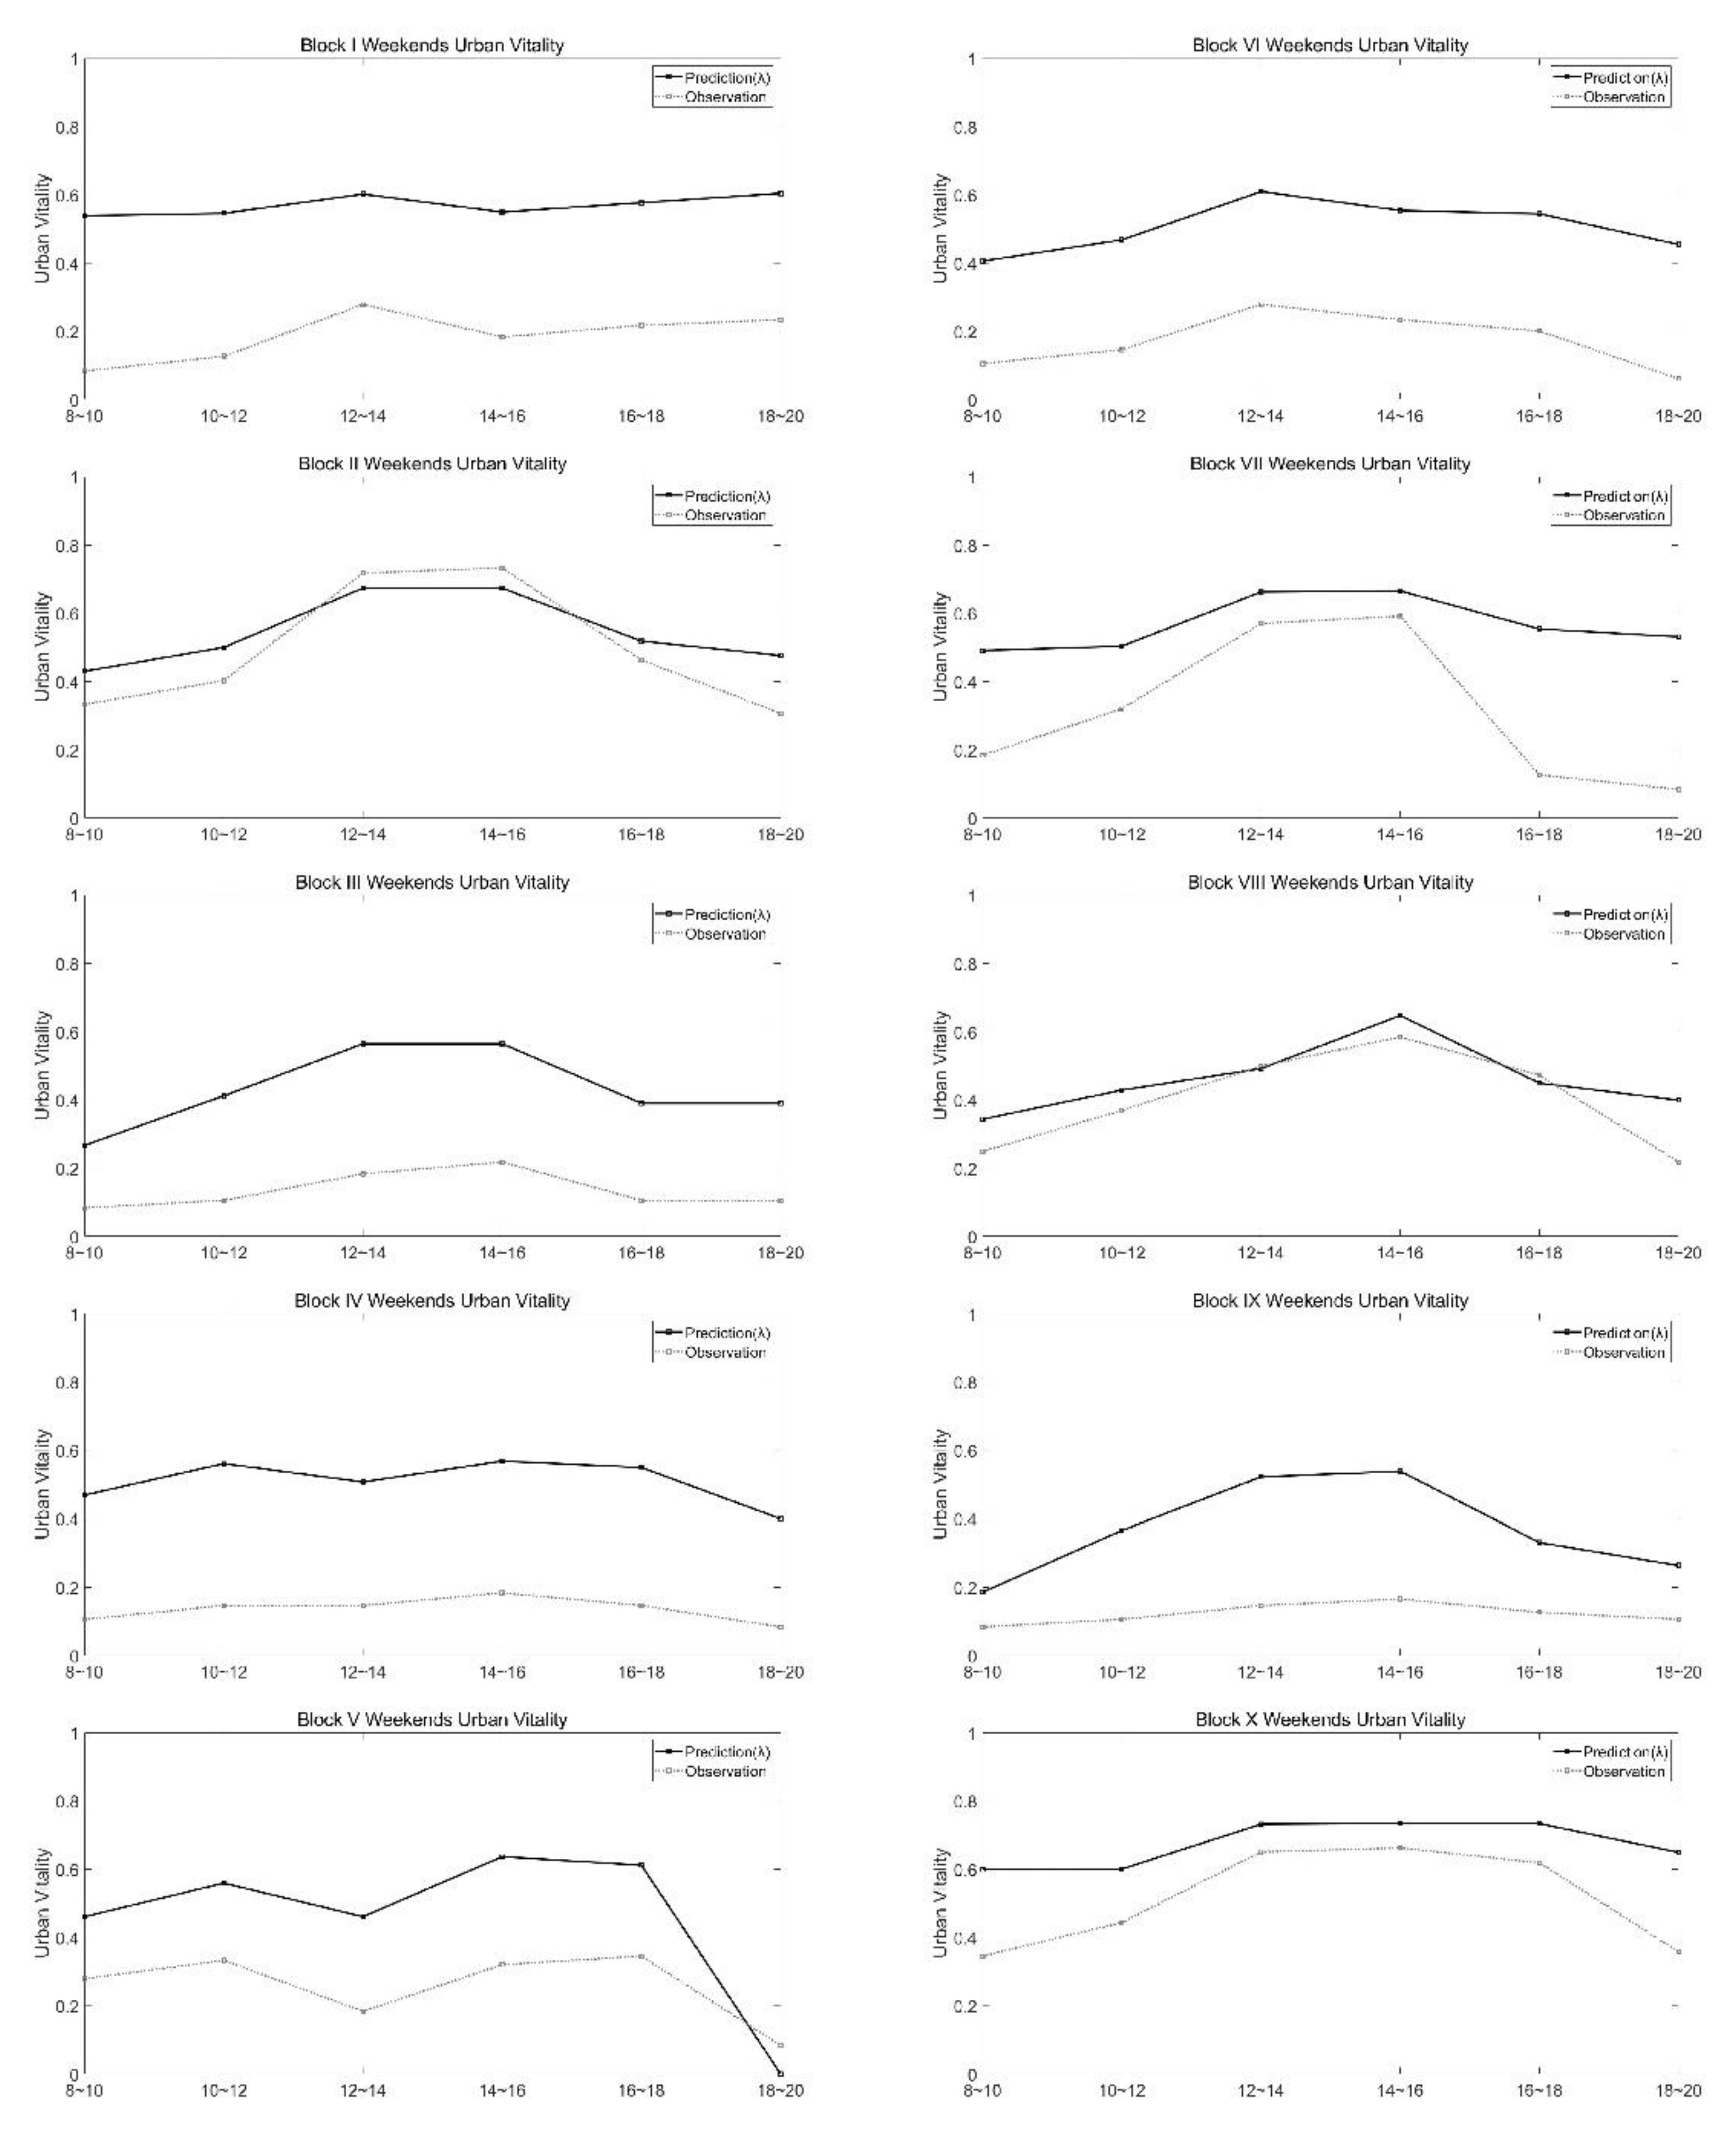
Comparison of observations and estimates for specific time periods at 10 small blocks with distinctive characteristics.
Figure 8.
Comparison of Dynamic model prediction results & Field observation results in weekdays
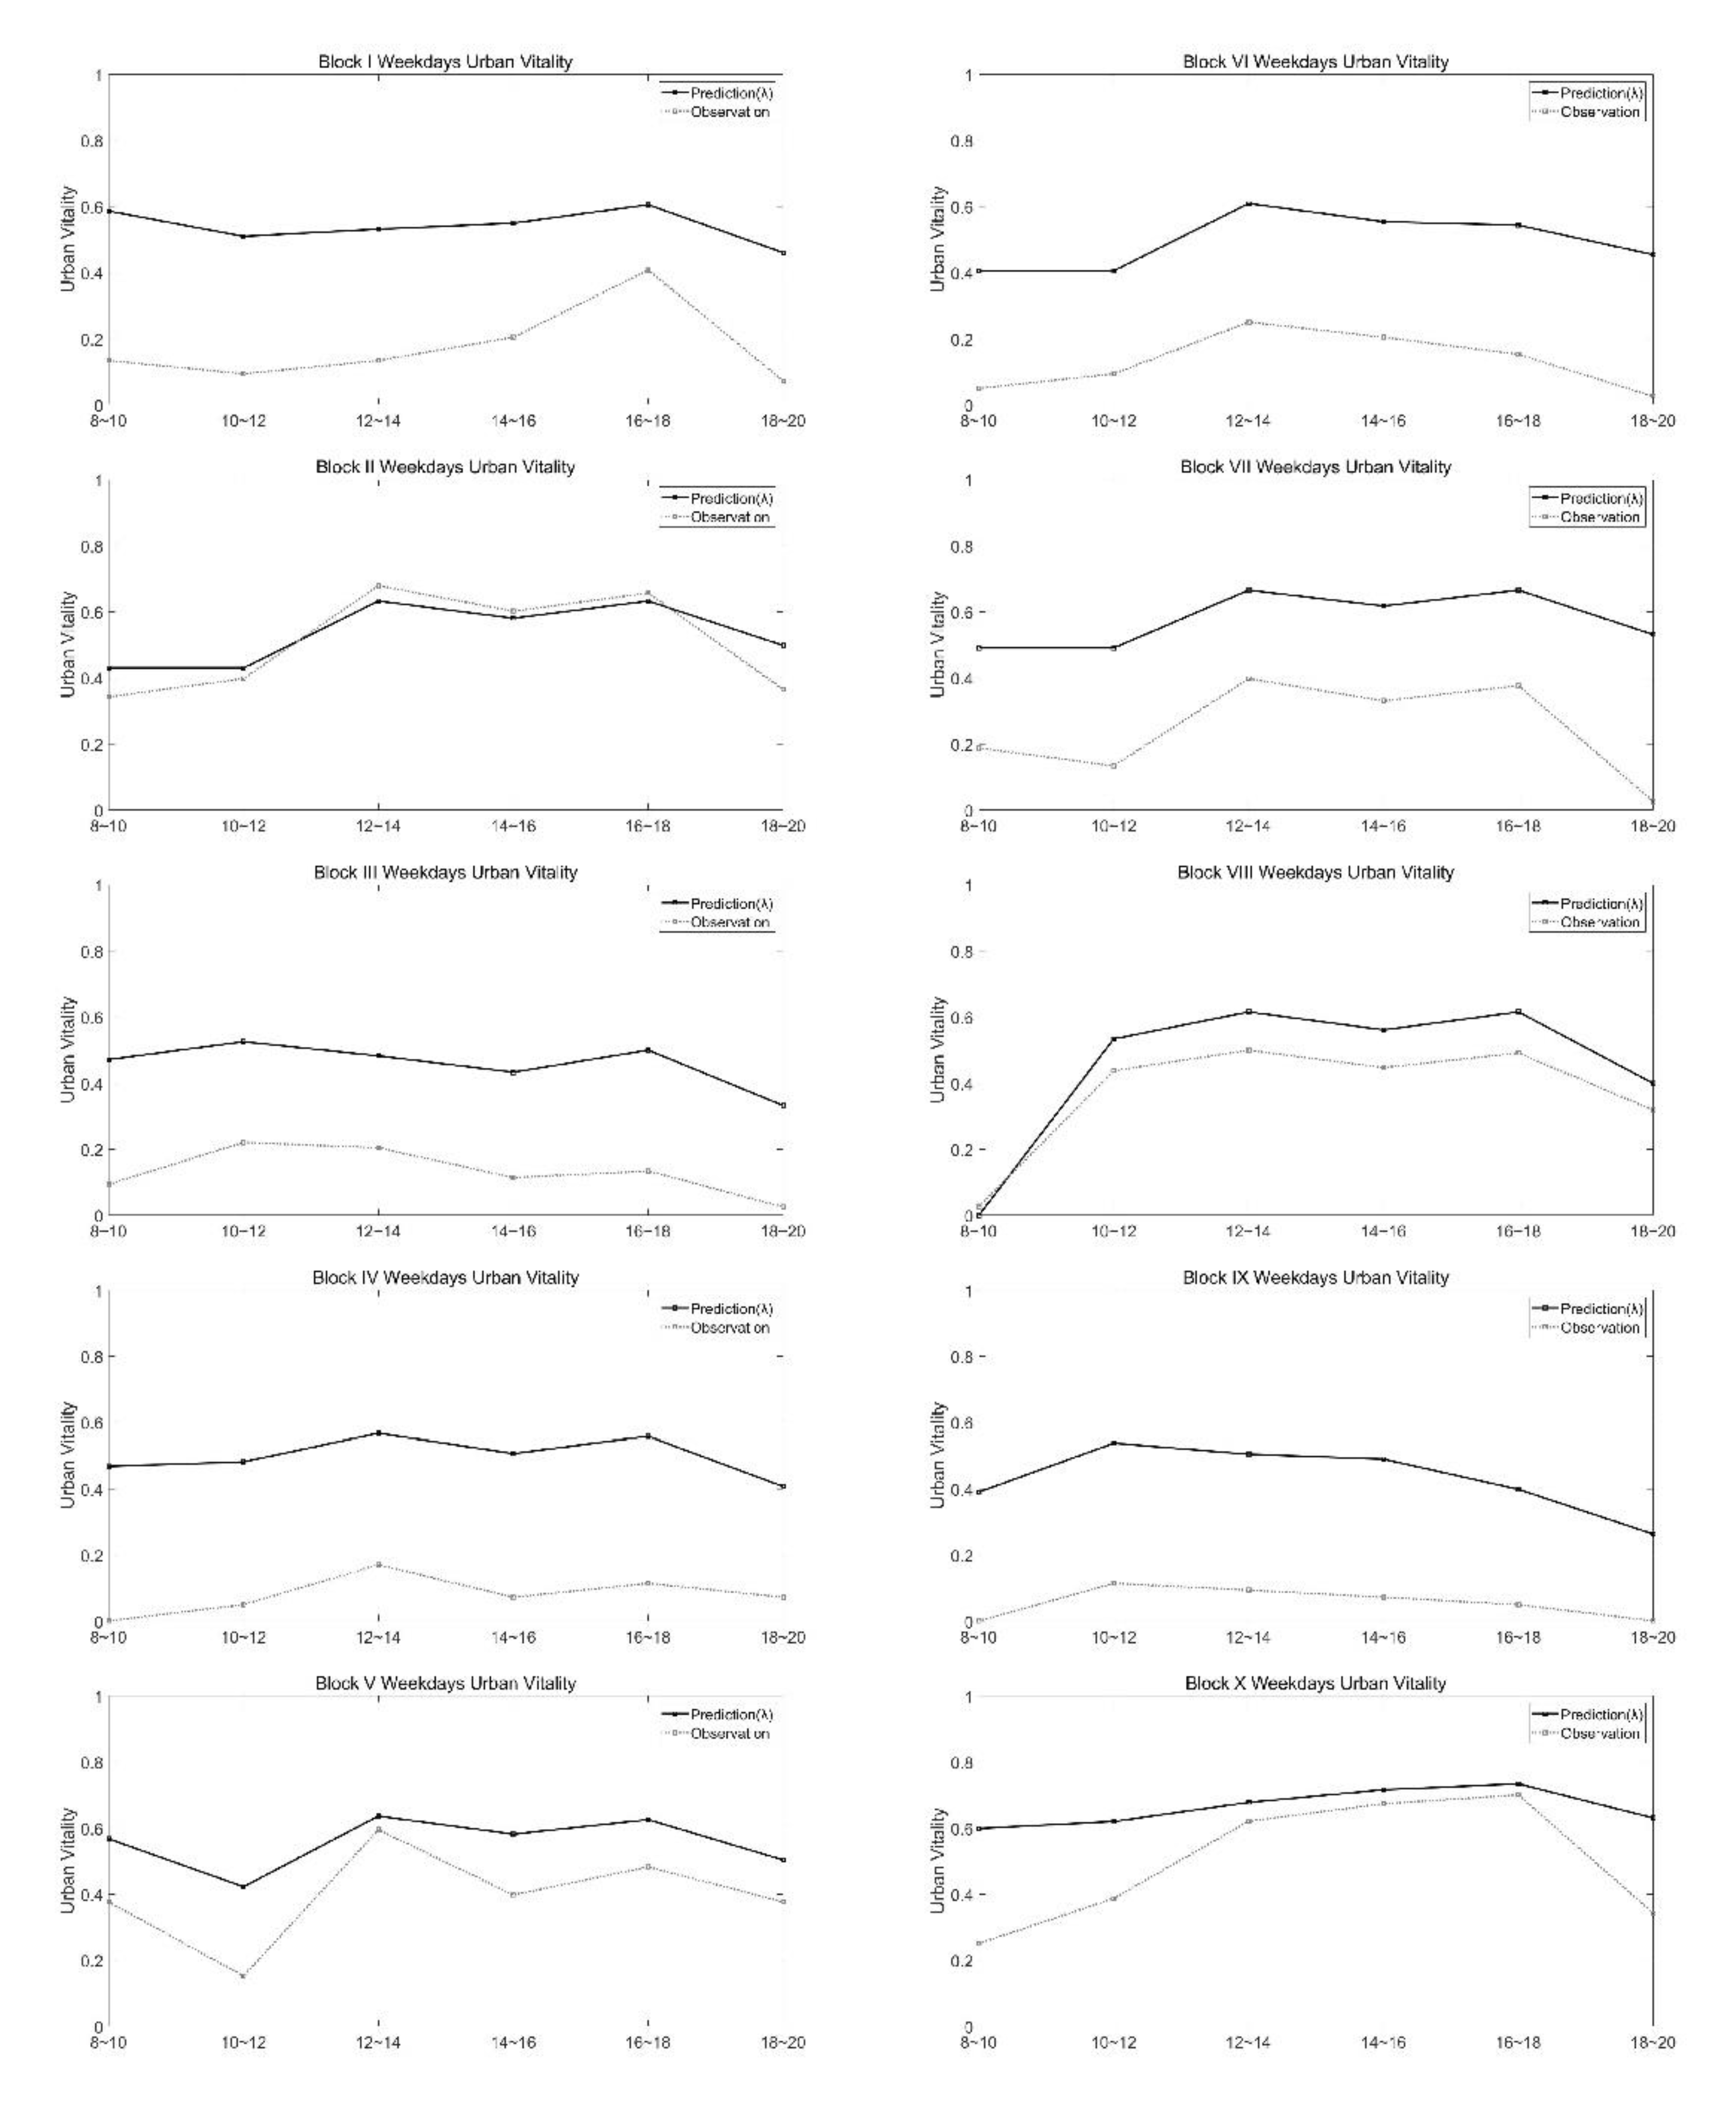
Figure 9.
Comparison of dynamic model prediction results & Field observation results in weekends
4.5. A Vitality Level Prediction Program Based on Decision Tree Model
The above data comparison and verification line chart shows that the prediction model is very accurate in predicting the trend of vitality changes, but the specific values are different, and the amplitude of the differences is uneven. Given that the purpose of predicting the vitality of urban public spaces is to know the level rather than specific values. The current expression of results may cause confusion among users, as to what value above means high spatial vitality, and what value below means low spatial vitality.
This study used a decision tree model to perform machine learning on the above data results, and obtained an algorithm program that can predict the level of urban vitality by inputting basic information and time conditions of a certain space. The program divides the independent variables into three groups, sets the natural break point c=3 for the predicted value, simulates test_size=0.3, and obtains the algorithm's F1_micro=0.840909 (>0.7 is reliable). The output results of this algorithm are integers of 1, 2, and 3, which correspond to the low, middle, and high levels of urban vitality respectively.
5. Discussion & Conclusions
1. The dynamic Prediction framework for Urban Public Space Vitality was successfully verified in Adelaide CBD.
2. The hypothesis about the time-varying effects of crowds and frequency in urban public space is verified.
3. The behavior of different Crowds in urban public spaces is closely related to time. The frequency of space usage by different crowds can be calculated through the "0" and "1" probabilities. The frequency at which the total space is used can be obtained by weighting the average of the frequencies of each crowd.
4. The simulation prediction of a new model based on crowd frequency that introduces the time dimension has a high degree of fit with the overall trend of actual observations, and the model construction results. However, there are still differences in the degree of fit in separate locations. This is probably because the observations only lasted four days and the population data used were biased. Use the population data of great Adelaide to predict and calculate the flow of people in public spaces in Rundle Mall, which is equivalent to the average value of the greater area and estimates the special values of small areas. Perhaps the population data should be further refined and revised. Moreover, the grouping of the population is relatively complicated at this stage, and the 0/1 judgment is relatively absolute. Perhaps further regression correction and refinement would be more reasonable.
5. The algorithm generated by the machine learning decision tree can provide designers with predictions of the urban vitality level of the design scheme. Only the time conditions (period, working days/rest days), crowd-frequency (FC) and physical environment and the product of arrival situations (FB*FA) can be used. These input data are simple and easy to obtain. It provides a low-cost and efficient method to optimize the vitality of design and urban planning solutions, thereby reducing waste and achieving the goal of high-vitality sustainable development.
Author Contributions
For research articles with several authors, a short paragraph specifying their individual contributions must be provided. The following statements should be used “Conceptualization, Y. Liu and X. Guo; methodology, Y. Liu and X. Guo; Data collection & algorithm model built, Y. Liu; writing—original draft preparation, Y. Liu; writing—review and editing, X. Guo. All authors have read and agreed to the published version of the manuscript.
Funding
This research was funded by Later Funded Projects of National Philosophy and Social Science Foundation of China, grant number No. 19FXWB026.
Acknowledgments
Higher Education Research and Reform Project of Guangdong Province (No. HITSZERP19001); General Project of Stabilization Support Program of Shenzhen Universities (No. GXWD20201230155427003-20200822174038001); Key Laboratory of Cognitive and Personality, Ministry of Education, Chongqing, 400715; Shenzhen Education Science “14th Five-Year Plan” 2022 Annual Topic (No.: cgpy22018).
Conflicts of Interest
The authors declare no conflict of interest.
References
- Su, Xing. 2023. ‘Building New Cities in the Global South: Neoliberal Planning and Its Adverse Consequences’. Urban Governance 3 (1): 67–75. [CrossRef]
- Xinhua (2016). 3,500 new towns are planned with space for 3.4 billion, who will live there? (in Chinese). http://www.xinhuanet.com//politics/2016-07/13/c_1119214482.htm. [Accessed September 1, 2021].
- Moser, Sarah, and Laurence Côté-Roy. 2021. ‘New Cities: Power, Profit, and Prestige’. Geography Compass 15 (1): e12549. [CrossRef]
- Moser, S. (2018). Forest city, Malaysia, and Chinese expansionism. Urban Geography, 39, 935 - 943.
- Shi, Lifeng, Michael Wurm, Xianjin Huang, Taiyang Zhong, Tobias Leichtle, and Hannes Taubenböck. 2020. ‘Urbanization That Hides in the Dark – Spotting China’s “Ghost Neighborhoods” from Space’. Landscape and Urban Planning 200 (August): 103822. [CrossRef]
- Chen, Kai. 2017. ‘Ghost Cities of China. The Story of Cities Without People in the World’s Most Populated Country’. Europe-Asia Studies 69 (6): 998–99. [CrossRef]
- Wang, Jian, Zhuqing Yang, and Xuepeng Qian. 2020. ‘Driving Factors of Urban Shrinkage: Examining the Role of Local Industrial Diversity’. Cities 99 (April): 102646. [CrossRef]
- Yang, Zhenshan, and Yinghao Pan. 2020. ‘Are Cities Losing Their Vitality? Exploring Human Capital in Chinese Cities’. Habitat International 96 (February): 102104. [CrossRef]
- Jacobs, J. (1992). The death and life of great American cities. 1961. New York: Vintage, 321-325.
- Montgomery, John. 1998. ‘Making a City: Urbanity, Vitality and Urban Design’. Journal of Urban Design 3 (1): 93–116. [CrossRef]
- Chen, Wangyang, Abraham Noah Wu, and Filip Biljecki. 2021. ‘Classification of Urban Morphology with Deep Learning: Application on Urban Vitality’. Computers, Environment and Urban Systems 90 (November): 101706. [CrossRef]
- Liu, Haimeng, Peng Gou, and Jieyang Xiong. 2022. ‘Vital Triangle: A New Concept to Evaluate Urban Vitality’. Computers, Environment and Urban Systems 98 (December): 101886. [CrossRef]
- Xu, Yajie, and Xiangsheng Chen. 2021. ‘Quantitative Analysis of Spatial Vitality and Spatial Characteristics of Urban Underground Space (UUS) in Metro Area’. Tunnelling and Underground Space Technology 111 (May): 103875. [CrossRef]
- Chen, Yang, Bingjie Yu, Bo Shu, Linchuan Yang, and Ruoyu Wang. 2023. ‘Exploring the Spatiotemporal Patterns and Correlates of Urban Vitality: Temporal and Spatial Heterogeneity’. Sustainable Cities and Society 91 (April): 104440. [CrossRef]
- Guo, Xin, Hongfei Chen, and Xiping Yang. 2021. ‘An Evaluation of Street Dynamic Vitality and Its Influential Factors Based on Multi-Source Big Data’. ISPRS International Journal of Geo-Information 10 (3): 143. [CrossRef]
- Li, Yunqin, Nobuyoshi Yabuki, and Tomohiro Fukuda. 2022. ‘Exploring the Association between Street Built Environment and Street Vitality Using Deep Learning Methods’. Sustainable Cities and Society 79 (April): 103656. [CrossRef]
- Lin, Jinyao, Yaye Zhuang, Yang Zhao, Hua Li, Xiaoyu He, and Siyan Lu. 2022. ‘Measuring the Non-Linear Relationship between Three-Dimensional Built Environment and Urban Vitality Based on a Random Forest Model’. International Journal of Environmental Research and Public Health 20 (1): 734. [CrossRef]
- Liu, Shaojun, Ling Zhang, Yi Long, Yao Long, and Mianhao Xu. 2020. ‘A New Urban Vitality Analysis and Evaluation Framework Based on Human Activity Modeling Using Multi-Source Big Data’. ISPRS International Journal of Geo-Information 9 (11): 617. [CrossRef]
- Ye, Yu, and Akkelies Van Nes Nes. 2014. ‘Quantitative Tools in Urban Morphology: Combining Space Syntax, Spacematrix and Mixed-Use Index in a GIS Framework’. Urban Morphology 18 (2): 97–118. [CrossRef]
- Guo, Xiangmin, Yanwen Yang, Ziyuan Cheng, Qi Wu, Chenjing Li, Tiantian Lo, and Fukai Chen. 2022. ‘Spatial Social Interaction: An Explanatory Framework of Urban Space Vitality and Its Preliminary Verification’. Cities 121 (February): 103487. [CrossRef]
- Li, Xin, Yuan Li, Tao Jia, Lin Zhou, and Ihab Hamzi Hijazi. 2022. ‘The Six Dimensions of Built Environment on Urban Vitality: Fusion Evidence from Multi-Source Data’. Cities 121 (February): 103482. [CrossRef]
- Lu, Shiwei, Chaoyang Shi, and Xiping Yang. 2019. ‘Impacts of Built Environment on Urban Vitality: Regression Analyses of Beijing and Chengdu, China’. International Journal of Environmental Research and Public Health 16 (23): 4592. [CrossRef]
- City of Adelaide, 2021, ‘Australia's Most Liveable City’. https://www.cityofadelaide.com.au/media-centre/australias-most-liveable-city/.
- Australian Bureau of Statistics, 2021, ‘Methods - Four Pillars of Labour Statistics: Household Surveys: Census of Population and Housing’. https://www.abs.gov.au/statistics/detailed-methodology-information/concepts-sources-methods/labour-statistics-concepts-sources-and-methods/2021/methods-four-pillars-labour-statistics/household-surveys/census-population-and-housing.
Figure 6.
Population Data of Adelaide [24].
Figure 6.
Population Data of Adelaide [24].
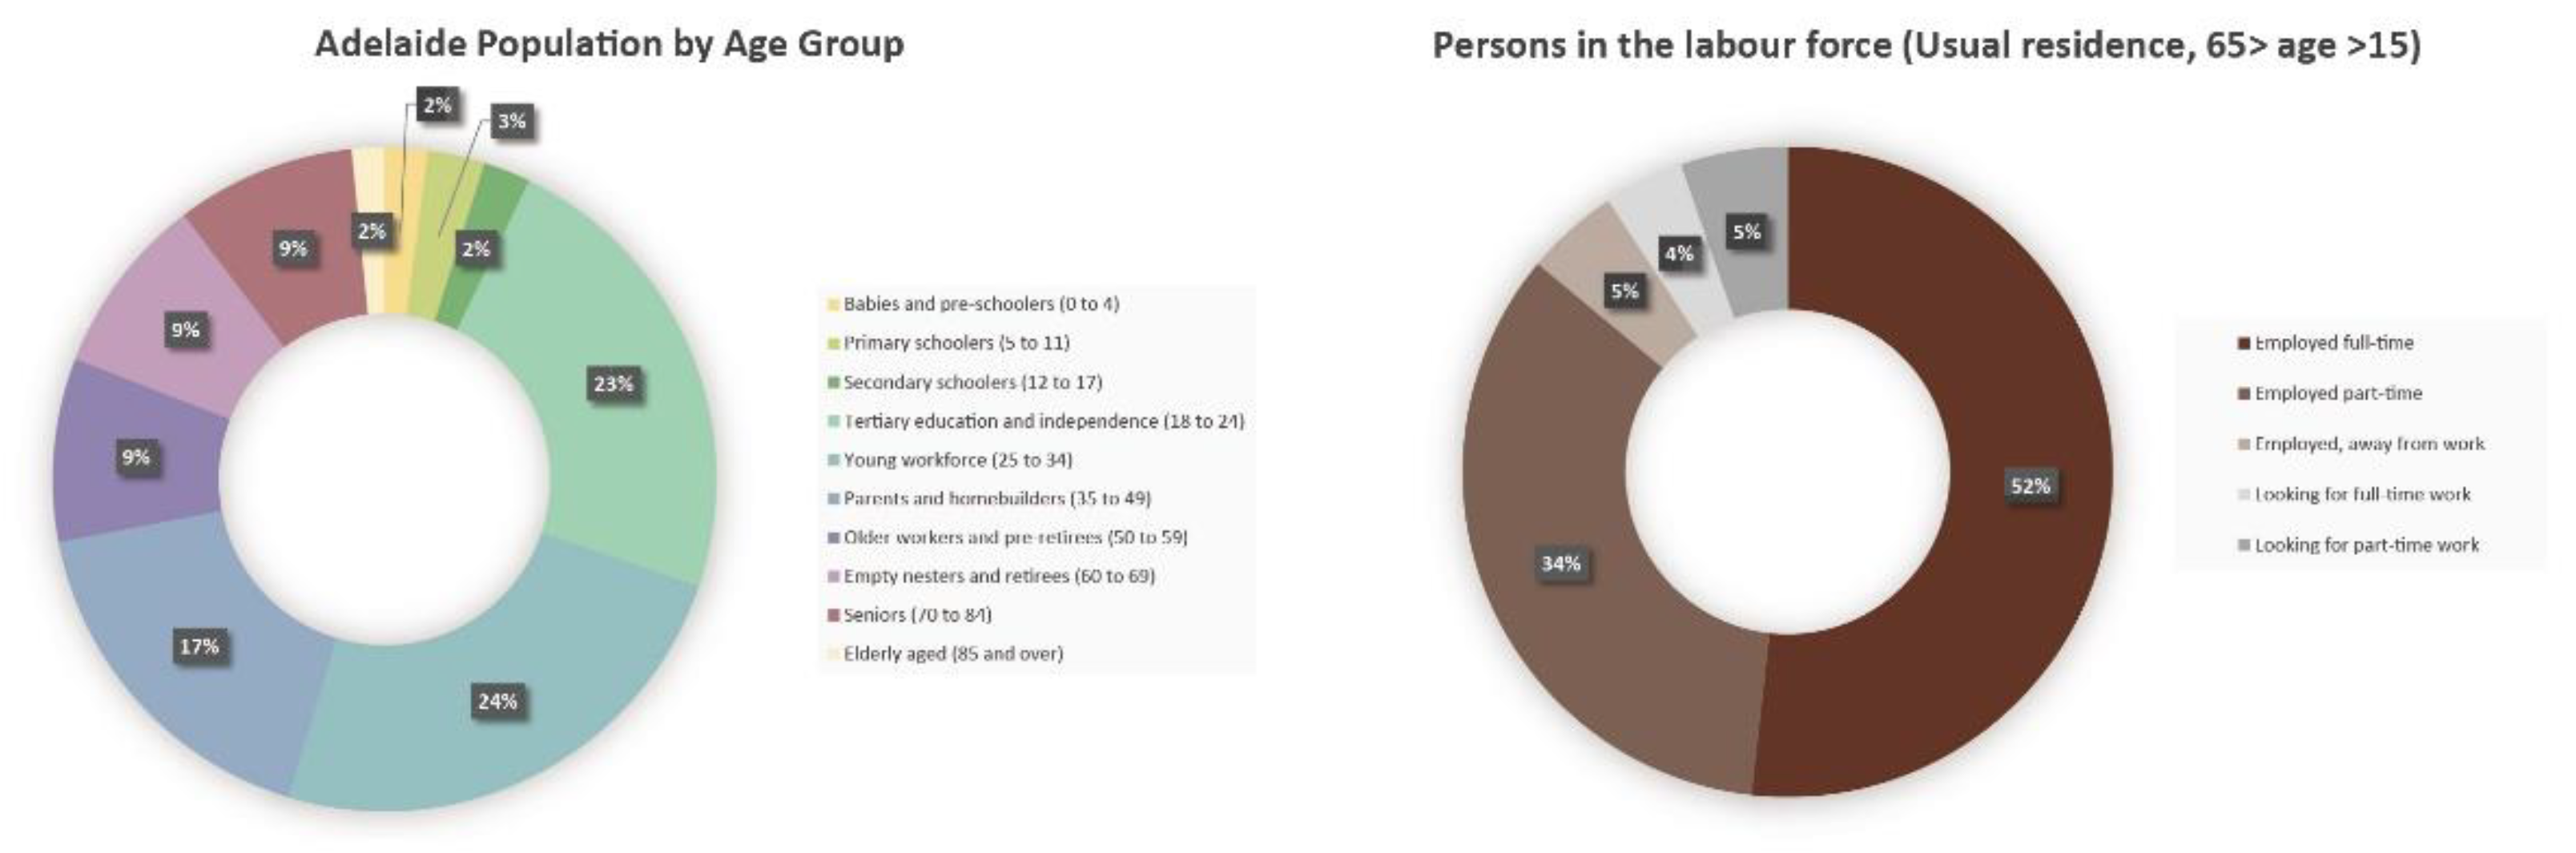
Figure 7.
Comparison of Original static model & Field observation.
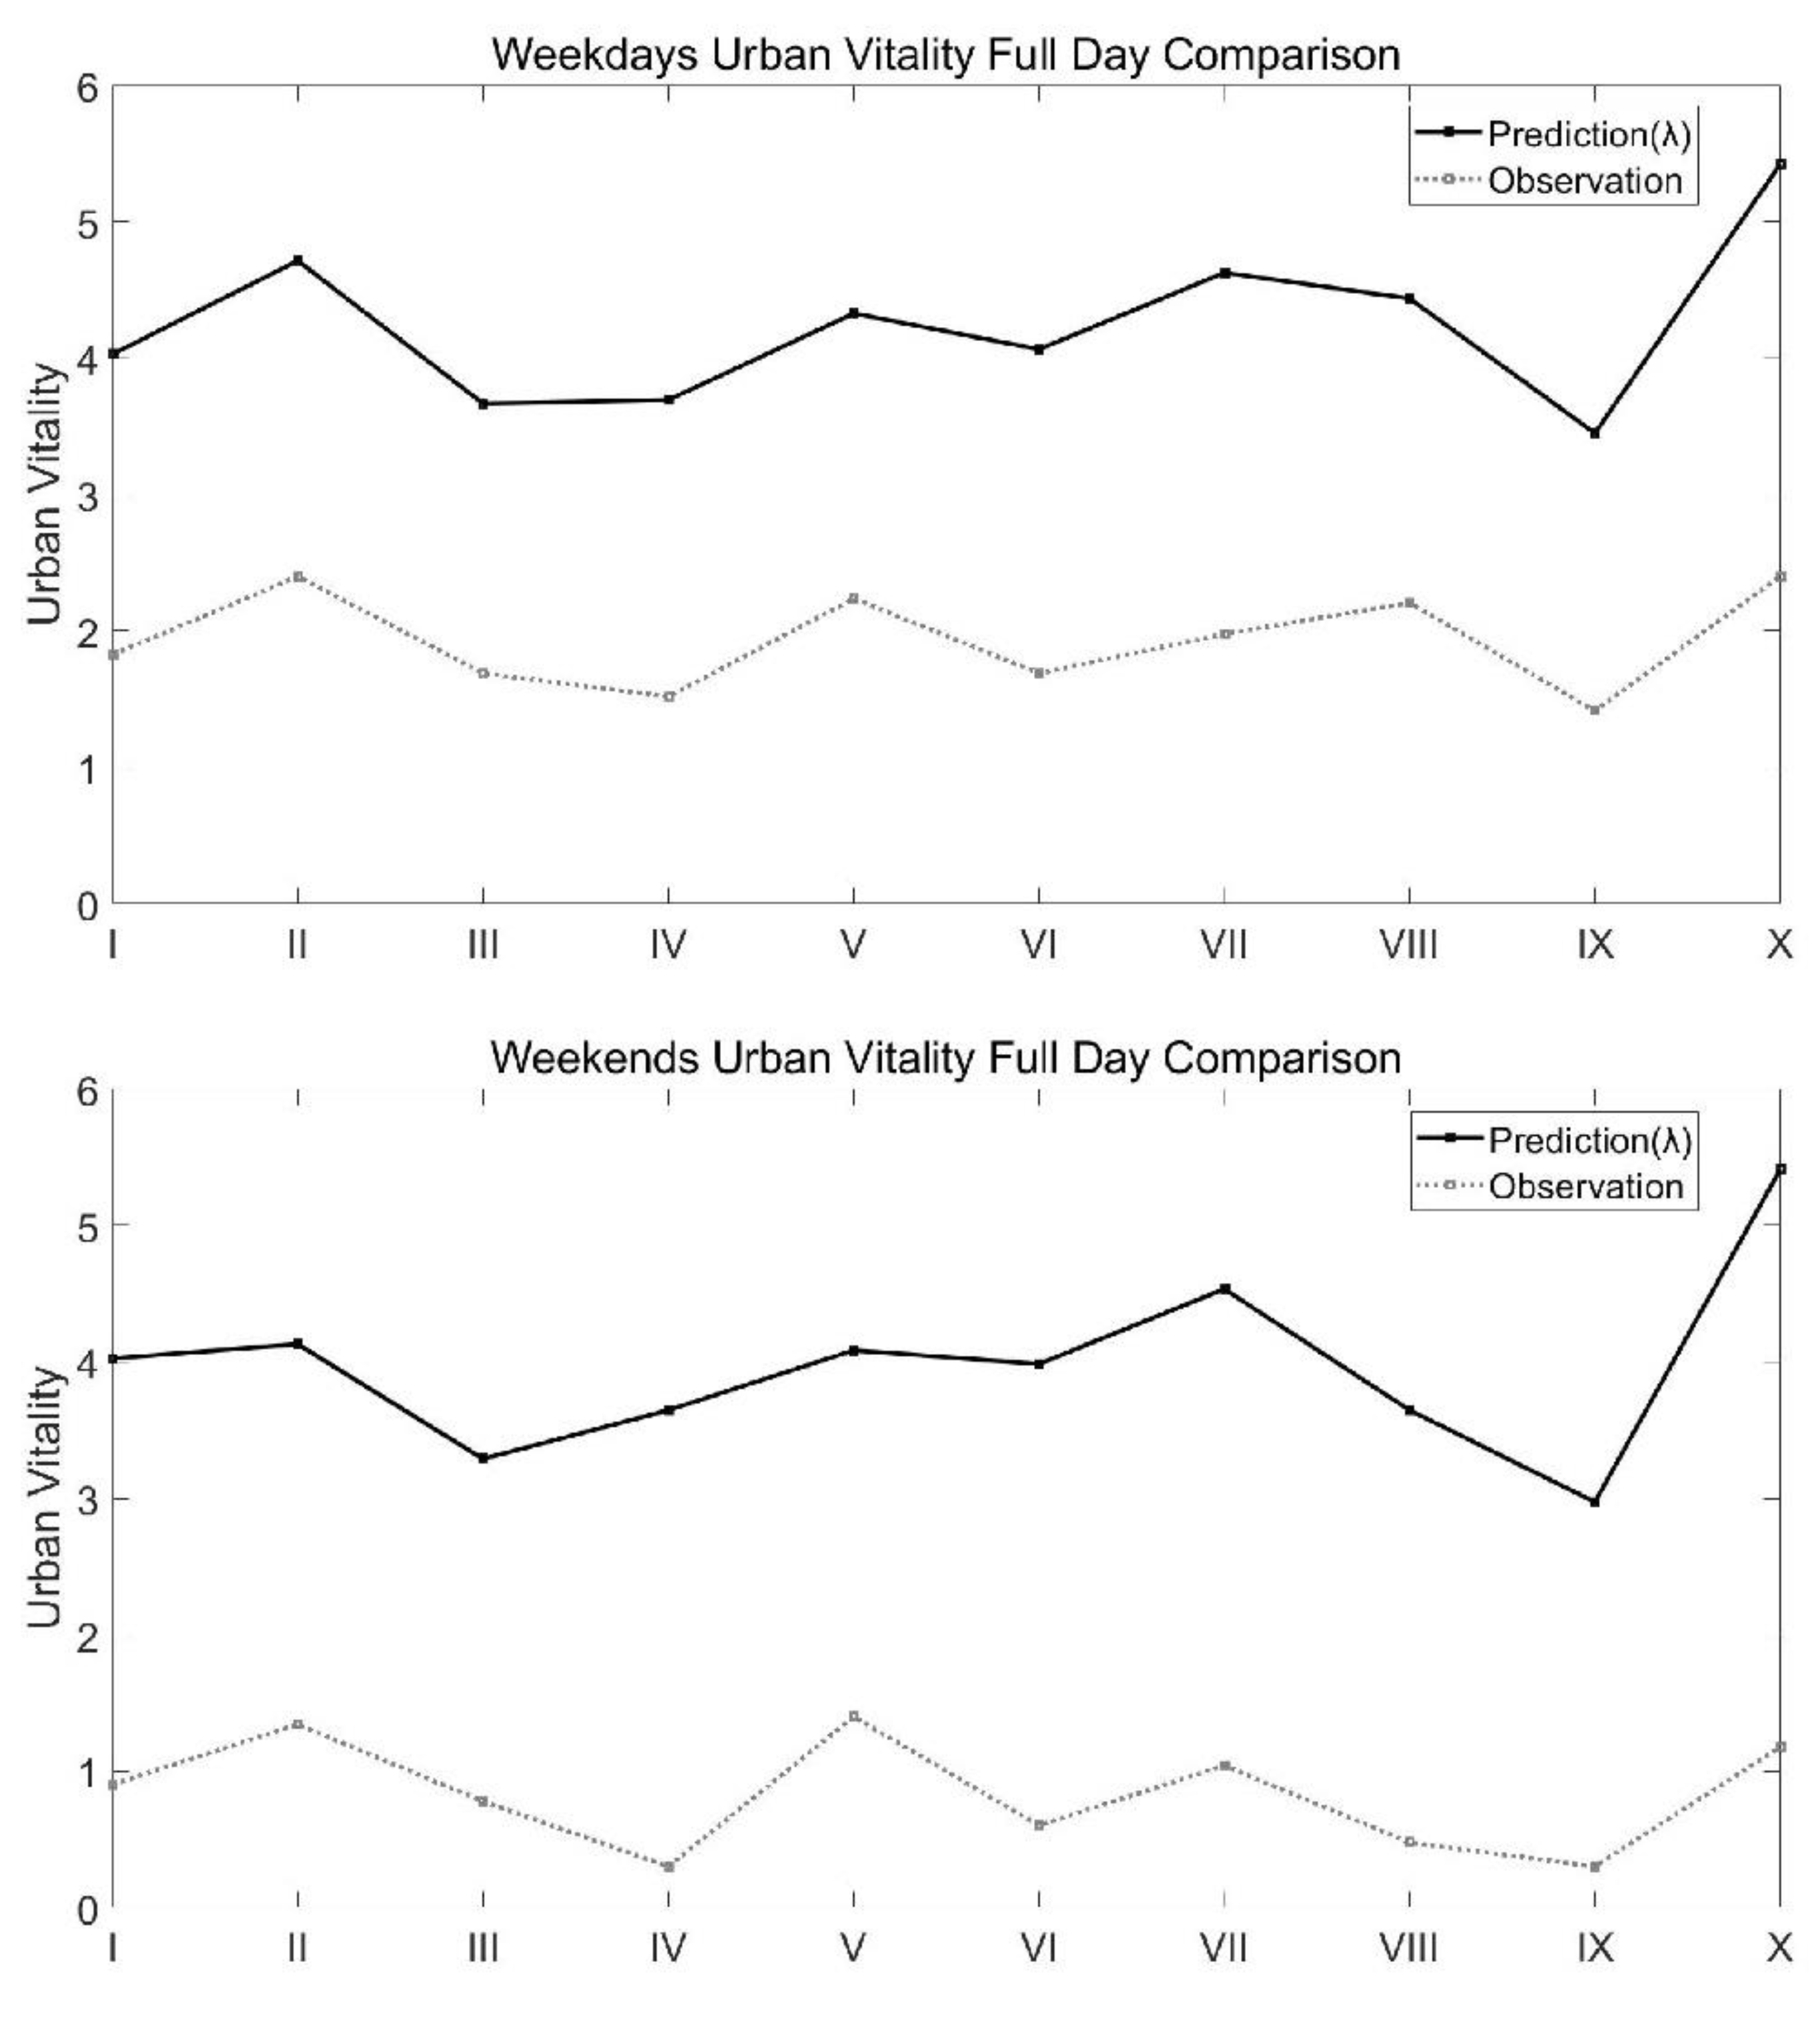
Table 1.
Common list of crowds’ categories for urban public space.
| Crowd | Normal Age Range | Available time in public spaces |
|---|---|---|
| Retirees | > local retirement age | Any time, but limited by energy |
| Employed but away from work | legal working age ~ retirement age | Available any time |
| Employed full-time | legal working age ~ retirement age | Available except standard working hours. |
| Employed part-time | legal working age ~ retirement age | Available outside working hours |
| Unemployed | legal working age ~ retirement age | Available any time |
| Teenager students | 5 ~ legal working age | Available except during school hours |
| Young children | 0 ~ 4 | Near noon to afternoon |
Table 2.
Diagram of how often a typical space is used during the week of full-time workers in Adelaide.
Table 2.
Diagram of how often a typical space is used during the week of full-time workers in Adelaide.
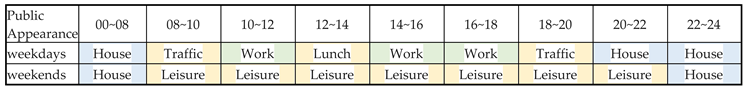 |
Table 3.
Review of Indicator system of past research.
| Name & Date | Indicators | Tools | |
|---|---|---|---|
| Ye & Nes, 2014 [19] | Street-network configuration | Space syntax | |
| Building density & types | Space matrix | ||
| Functional mixture | Mixed use index (mxi) | ||
| Other features | |||
| Li, et. al, 2022 [16] | Street width | GIS analysis of road data | |
| Greenery & openness & transparency | Semantic segmentation of SVI | ||
| Commercial density | GIS analysis of POI | ||
| Li et. al, 2022 [21] | neighborhood attributes | Population density | official statistics |
| Community age | kriging method | ||
| Housing price | kriging method | ||
| Urban form | Floor-area ration | ||
| Open space | |||
| Intersection | |||
| Road density | |||
| Sidewalk percentage | |||
| Streetlights | |||
| Facilities and land use | Food | POI data | |
| Life service | POI data | ||
| Shopping | POI data | ||
| Lodging (HOT) | POI data | ||
| Transit stops (Bus) | POI data | ||
| Leisure | POI data | ||
| Tourist Attraction | POI data | ||
| Workplace | POI data | ||
| Land use mix | residential proportion | ||
| Location | Distance to river | GIS | |
| Distance to commercial | GIS | ||
| Distance to park | GIS | ||
| Distance to bus-stop | GIS | ||
| Distance to subway | GIS | ||
| Distance to leisure | GIS | ||
| Distance to plaza | GIS | ||
| Landscape | NDVI | Landsat images | |
| Accessibility | Integration | SPACE SYNTAX | |
| Guo et. al, 2022 [20] | Indoor space next to the place | Spatial Social interaction coefficient (depends on function) | interaction ball |
| area of indoor space | |||
| openness of buildings | |||
| Accessibility | Public Traffic | GIS | |
| Walkability | GIS | ||
| Outdoor public space | Spatial Social Interaction coefficient (depends on function) | interaction ball | |
| Outdoor attraction points | |||
| Negative factors | Trash can | ||
| Others | |||
| Lu et. al, 2019 [22] | Social-economic data | Population | |
| House price | |||
| Compactness | Area | ||
| Richardson compactness index | |||
| POI mixed use | Entropy | ||
| Accessibility | density of bus stations | ||
| Density | floor area ratio | ||
| building density index | |||
| road density index | |||
| Landscape | Green Coverage Index | ||
Table 7.
Crowds’ data & Block II Frequency Estimation Results.
| Frequency of Block II | |||||||
|---|---|---|---|---|---|---|---|
| Days | weekdays | ||||||
| Crowds | Proportion | 8~10 | 10~12 | 12~14 | 14~16 | 16~18 | 18~20 |
| Retirees | 16% | 0 | 0 | 1 | 1 | 1 | 0 |
| Employed but away from work | 4% | 1 | 1 | 1 | 1 | 1 | 0 |
| Employed full-time | 40% | 0 | 0 | 1 | 0 | 1 | 0 |
| Employed part-time | 27% | 1 | 0 | 1 | 1 | 1 | 0 |
| Unemployed | 7% | 0 | 0 | 1 | 1 | 1 | 1 |
| Teenager students | 4% | 0 | 0 | 1 | 1 | 1 | 0 |
| Young children | 2% | 0 | 0 | 1 | 1 | 1 | 0 |
| Overall | 100% | 0.036 | 0.036 | 0.998 | 0.328 | 0.998 | 0.073 |
| Days | weekends | ||||||
| Crowds | Proportion | 8~10 | 10~12 | 12~14 | 14~16 | 16~18 | 18~20 |
| Retirees | 16% | 0 | 0 | 1 | 1 | 0 | 0 |
| Employed but away from work | 4% | 1 | 1 | 1 | 1 | 1 | 0 |
| Employed full-time | 40% | 0 | 0 | 1 | 1 | 0 | 0 |
| Employed part-time | 27% | 0 | 0 | 1 | 1 | 0 | 0 |
| Unemployed | 7% | 0 | 0 | 1 | 1 | 1 | 1 |
| Teenager students | 4% | 0 | 1 | 1 | 1 | 1 | 0 |
| Young children | 2% | 0 | 0 | 1 | 1 | 0 | 0 |
| Overall | 100% | 0.036 | 0.074 | 0.998 | 0.998 | 0.147 | 0.007 |
Disclaimer/Publisher’s Note: The statements, opinions and data contained in all publications are solely those of the individual author(s) and contributor(s) and not of MDPI and/or the editor(s). MDPI and/or the editor(s) disclaim responsibility for any injury to people or property resulting from any ideas, methods, instructions or products referred to in the content. |
© 2023 by the authors. Licensee MDPI, Basel, Switzerland. This article is an open access article distributed under the terms and conditions of the Creative Commons Attribution (CC BY) license (http://creativecommons.org/licenses/by/4.0/).
Copyright: This open access article is published under a Creative Commons CC BY 4.0 license, which permit the free download, distribution, and reuse, provided that the author and preprint are cited in any reuse.


