1. Introduction
With the development of the economy and the advancement of science and technology, human demands for the comfort of building environments are gradually increasing. Thermal comfort has always been an important indicator for evaluating indoor environments and is also one of the most basic needs for human survival. The indicators used to evaluate environmental thermal comfort include the effective temperature index ET, the standard effective temperature index SET *, and the PMV index for predicting thermal comfort [
1]. Among them, PMV is the most representative indicator for predicting thermal comfort, which includes many factors related to human thermal comfort, including four environmental factors: dry bulb temperature of air, partial pressure of water vapor, air flow rate, and radiation temperature of indoor objects and walls; Two factors related to individuals themselves: metabolic rate and clothing thermal resistance[
2]. Due to the complexity of the PMV thermal comfort model establishment process and the impact of individual differences and adaptability of experimenters on subjective judgments, it can become a source of bias in predicting environmental thermal comfort. One of the future research directions is to introduce more objective evaluation indicators into the PMV thermal comfort model or establish a thermal comfort model that is less subjective to human perception.
The human body has a self-regulation function towards various thermal environments, and it adapts to new environments through a series of complex physiological activities. In response to these findings, thermal physiological models have been developed. The most influential multi node model for human thermal physiology is the 25 node temperature regulation model developed by Stolwijk [
3]. This model was developed for NASA during the Apollo program to create a mathematical model that can predict the thermal response of astronauts during space activities outside the spacecraft. The thermophysiological model includes two parts: passive system and active system. Passive systems simulate the physical state of the human body, simulate heat transfer between internal structures and between the human body and the environment [
4], and perform internal heat transfer and body heat transfer calculations. The thermal characteristics of blood, muscles, fat, and bones are key parameters [
5]. The heat generated by the body exchanges heat with the environment through conduction, convection, radiation, and evaporation[
6]. The passive system is controlled by the human body’s active system to maintain a constant body temperature in changing environmental parameters. The active system simulates the regulation of blood vessel contraction, vasodilation, tremor, and sweating in the human body, and regulates blood vessel contraction and expansion through changes in brain temperature signals[
7], thereby completing body heat regulation.
The main differences between the human thermal physiological model and the PMV-PPD thermal comfort model are as follows: Firstly, the PMV-PPD model is a mathematical regression model based on a single node, suitable for steady-state and uniform thermal environments, and cannot evaluate local thermal comfort of the human body. The second is that the multi node human thermal physiological model can be considered as a comprehensive application of the single node PMV-PPD model in various parts of the human body. Therefore, the human thermal physiological model can analyze and study non-uniform thermal environments, dynamic, and local thermal effects. Thirdly, it is based on a mathematical model of thermophysiology and implemented using computer simulation technology, which to some extent corrects the subjective evaluation of human thermal comfort by the PMV-PPD model.
In the field of applied research on human thermal physiological models, L Schellen [
8] discussed the use of thermophysiological models to evaluate thermal sensation in building environments. Researchers used CFD software to analyze the thermal environment conditions around the human body, and the results confirmed that when local effects (local skin temperature and thermal sensation) have a significant impact, PMV cannot predict systemic thermal sensation. Van Hoof et al. [
9] conducted an extensive literature review on the effectiveness of PMV/PPD models. They compared the relationship between the PMV/PPD model and the actual percentage of dissatisfaction. Indicating that for more complex thermal environmental conditions (such as transient or non-uniform), empirical models (such as PMV index) may become less suitable. In this case, a dynamic temperature regulation model is needed to simulate skin and core temperatures and predict thermal sensation based on this.
This study utilizes the 57 node human thermal physiological effect model integrated with STAR CCM+to study the heating effect of convective heating radiators. The research mainly focuses on the following three aspects:
1) Using a multi node human thermal physiological model for evaluating the heating effect of convection radiators, coupling human metabolic factors and heating environmental factors for simulation calculation. This is completely different from the current approach of using subjective voting to study environmental thermal comfort. This study provides a direct quantitative evaluation path for the local thermal comfort of the human body under different heating methods based on objective calculations.
2) By using a human thermal physiological model, this study investigates the effects of floor radiation heating and convective radiator heating on local thermal comfort of the human body, analyzes the key factors that affect human thermal comfort in these two forms, and proposes improvements to the heating method of convective radiators (air supply form, temperature, air supply speed, etc.).
3) The CFD method can obtain practical and reliable predictions of heat transfer between the human body and the environment, which can be directly fed back to the human thermal regulation model, thereby accurately evaluating the thermal sensation and comfort of various parts. This requires further research on the coupling of the two to promote the widespread use of this method.
2. Research Methods
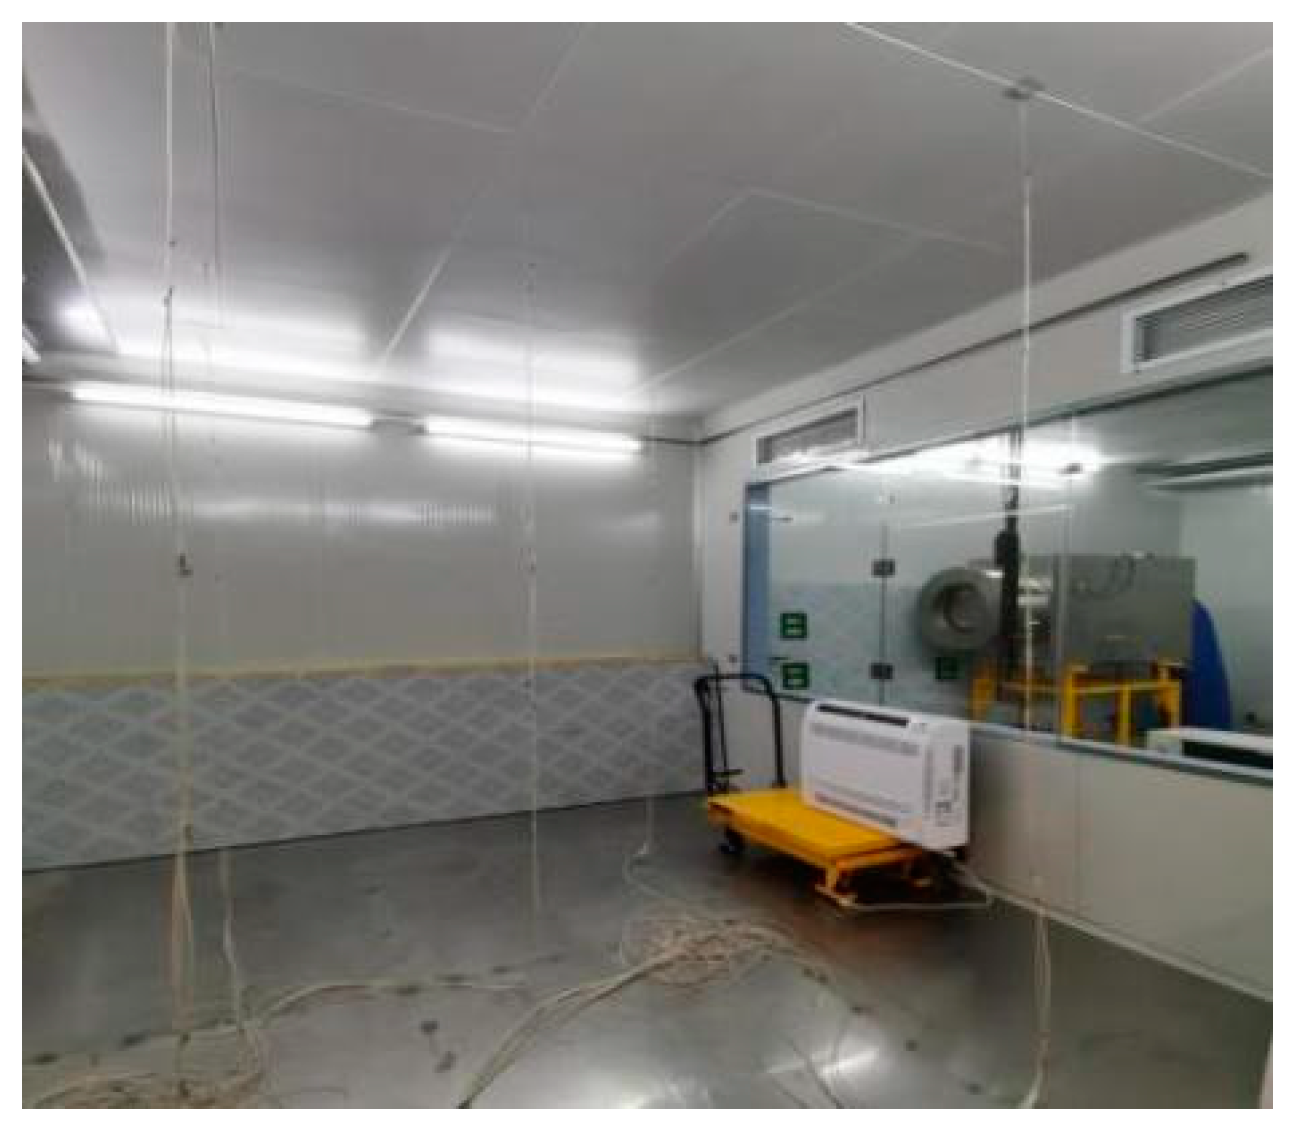
This article applies a multi node human thermal physiological model to evaluate the heating effect of convective radiators. This article establishes a thermal physiological parameter calculation model for radiator heating based on the human body thermal physiological model. Researchers refer to the climate laboratory shown in
Figure 1 to establish a research model. There are two sets of air conditioning systems installed on the indoor and outdoor sides of the laboratory. The outdoor side is a low-temperature air-conditioned room, simulating a low-temperature outdoor environment. The size of the middle window in the laboratory is 3mx1.5m, using single-layer tempered glass with a heat transfer coefficient less than 3 W/m
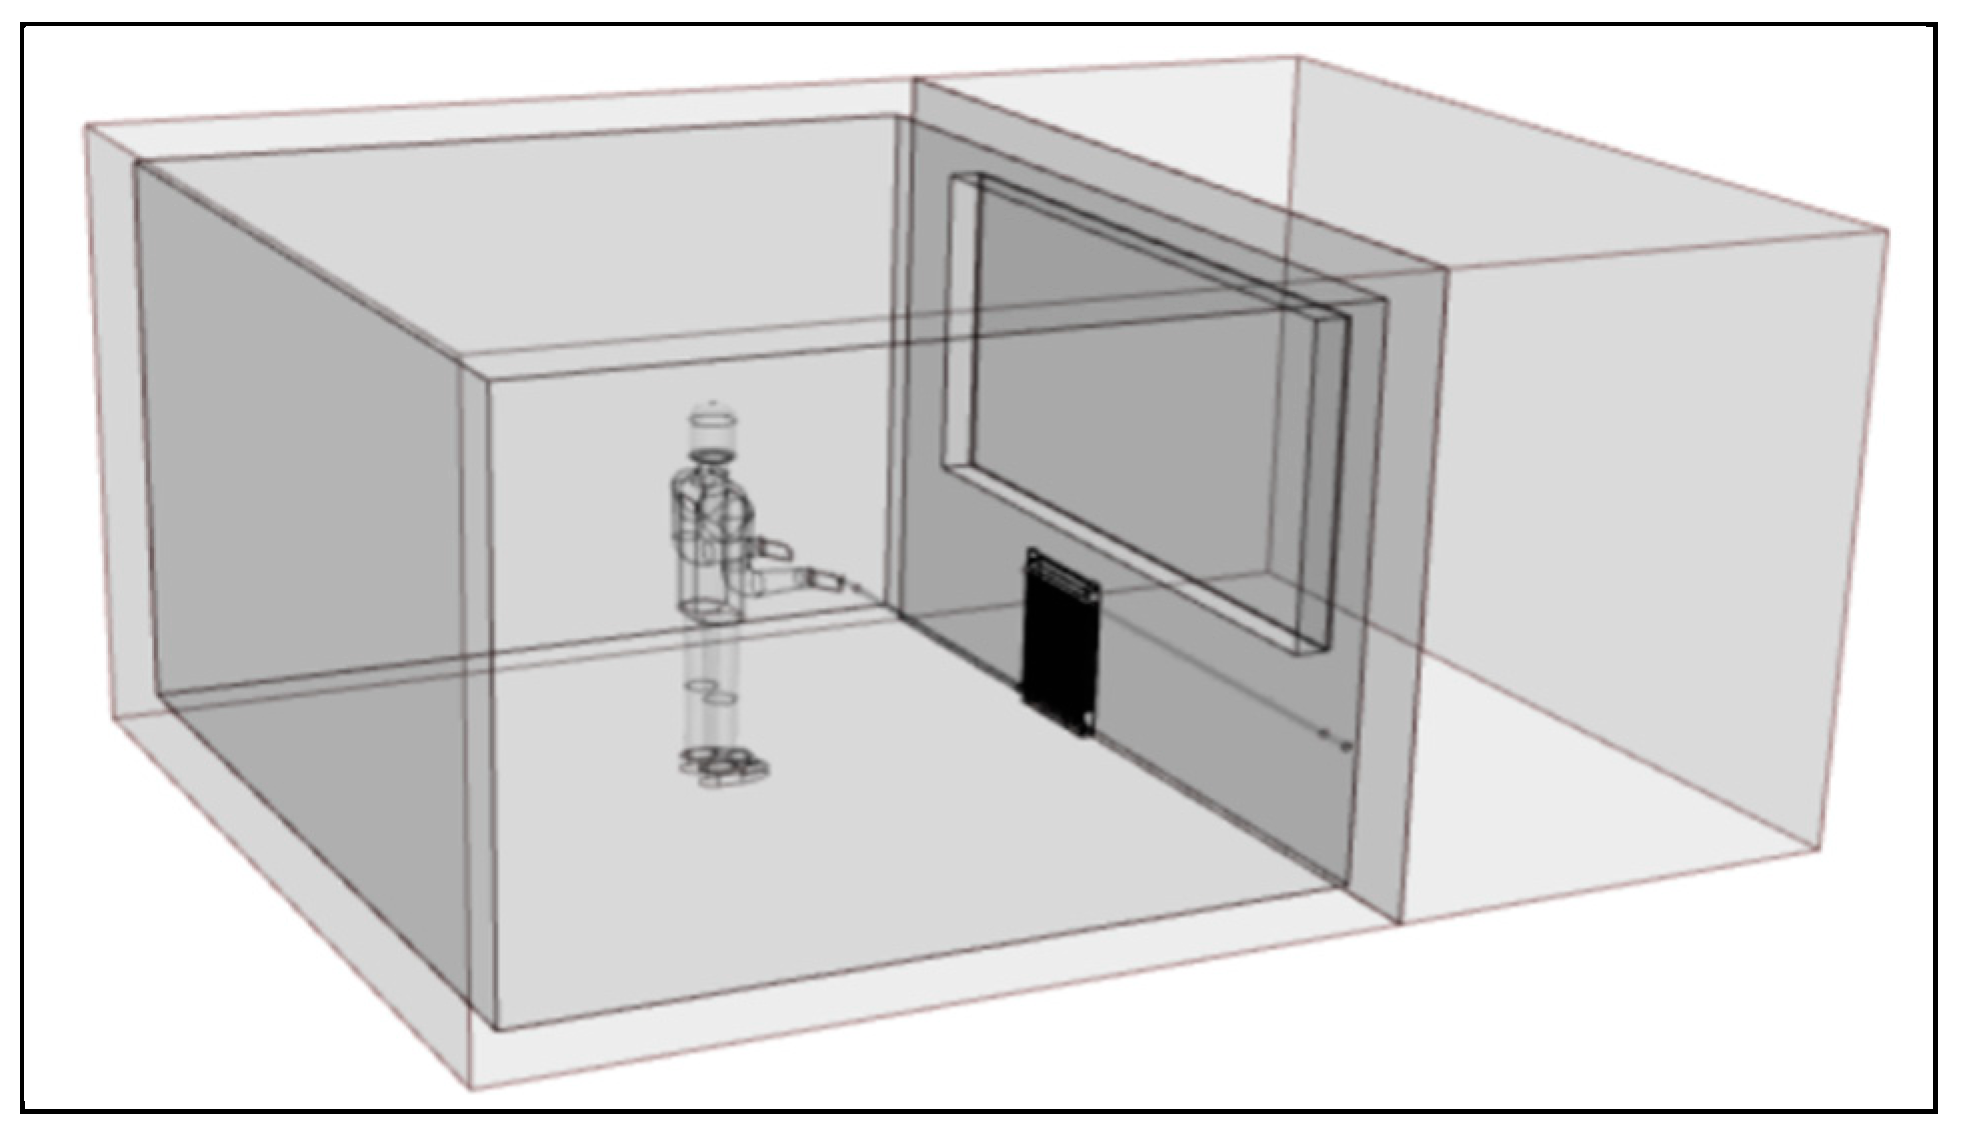
2K. Based on the characteristic parameters of the above laboratory, a CFD calculation model for the climate laboratory was established as shown in
Figure 2. The indoor side has a spatial size of 3400mm (length) × 4000mm (width) × 2800mm high; Outdoor side: 3400mm (length) × 2000mm (width) × 2800mm high. The indoor floor is made of polyurethane sandwich panels with a thickness of 200mm, while the remaining panels are made of polyurethane sandwich panels with a thickness of 150mm; The thickness of the partition wall separated from the outdoor side space is 150mm, and a glass window is set in the middle, with dimensions of 3000mm in length and 1500mm in height; The glass thickness is 10mm. The vertical three sided enclosure structure on the outdoor side is an adiabatic boundary condition, and the top is a velocity boundary condition. The air supply temperature is set according to the working conditions; The bottom is the outlet boundary condition, and the air supply speed is 0.5m/s. The purpose of setting up outdoor side rooms is to create an outdoor environment with a certain temperature, and to consider the convective heat transfer characteristics of air supply, glass, and partition walls.
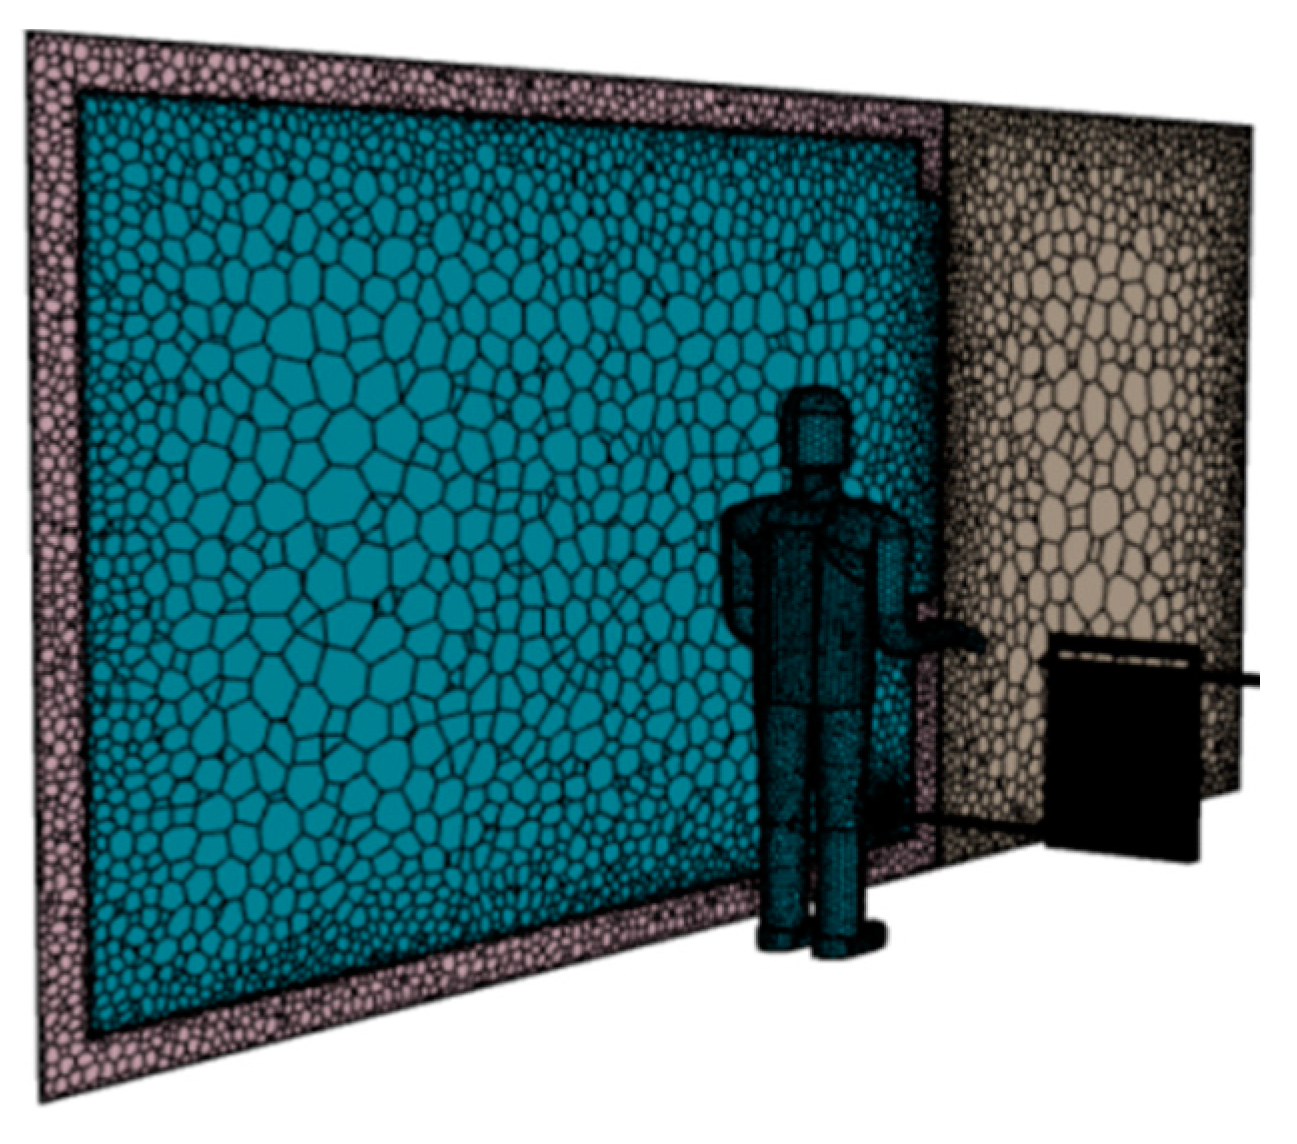
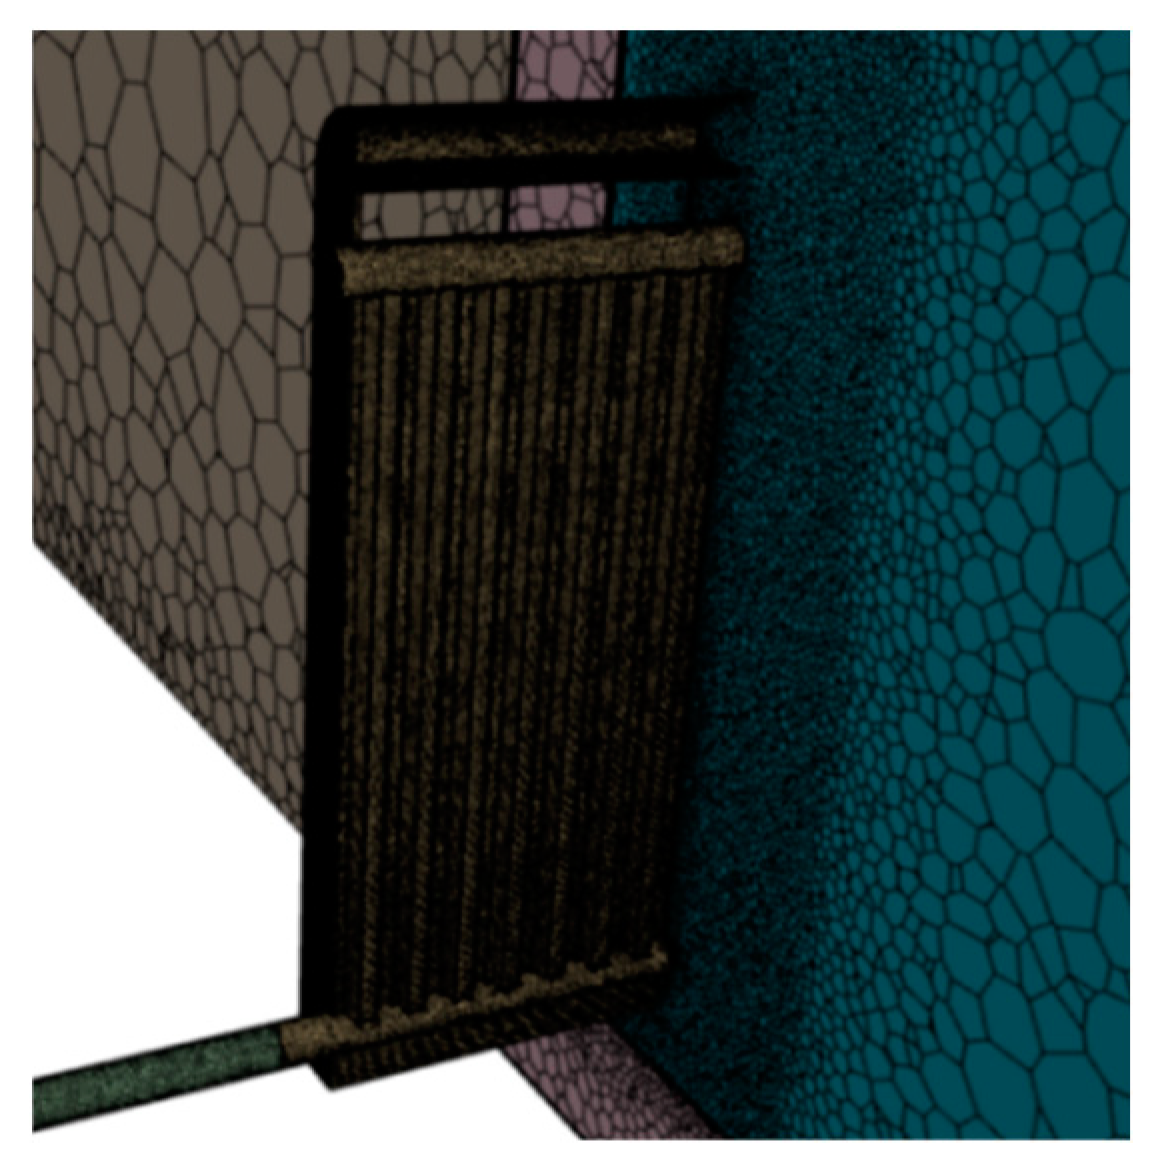
Figure 3 and
Figure 4 show the grid details of the CFD computational model.
The details of the computational model established in this article are as follows:
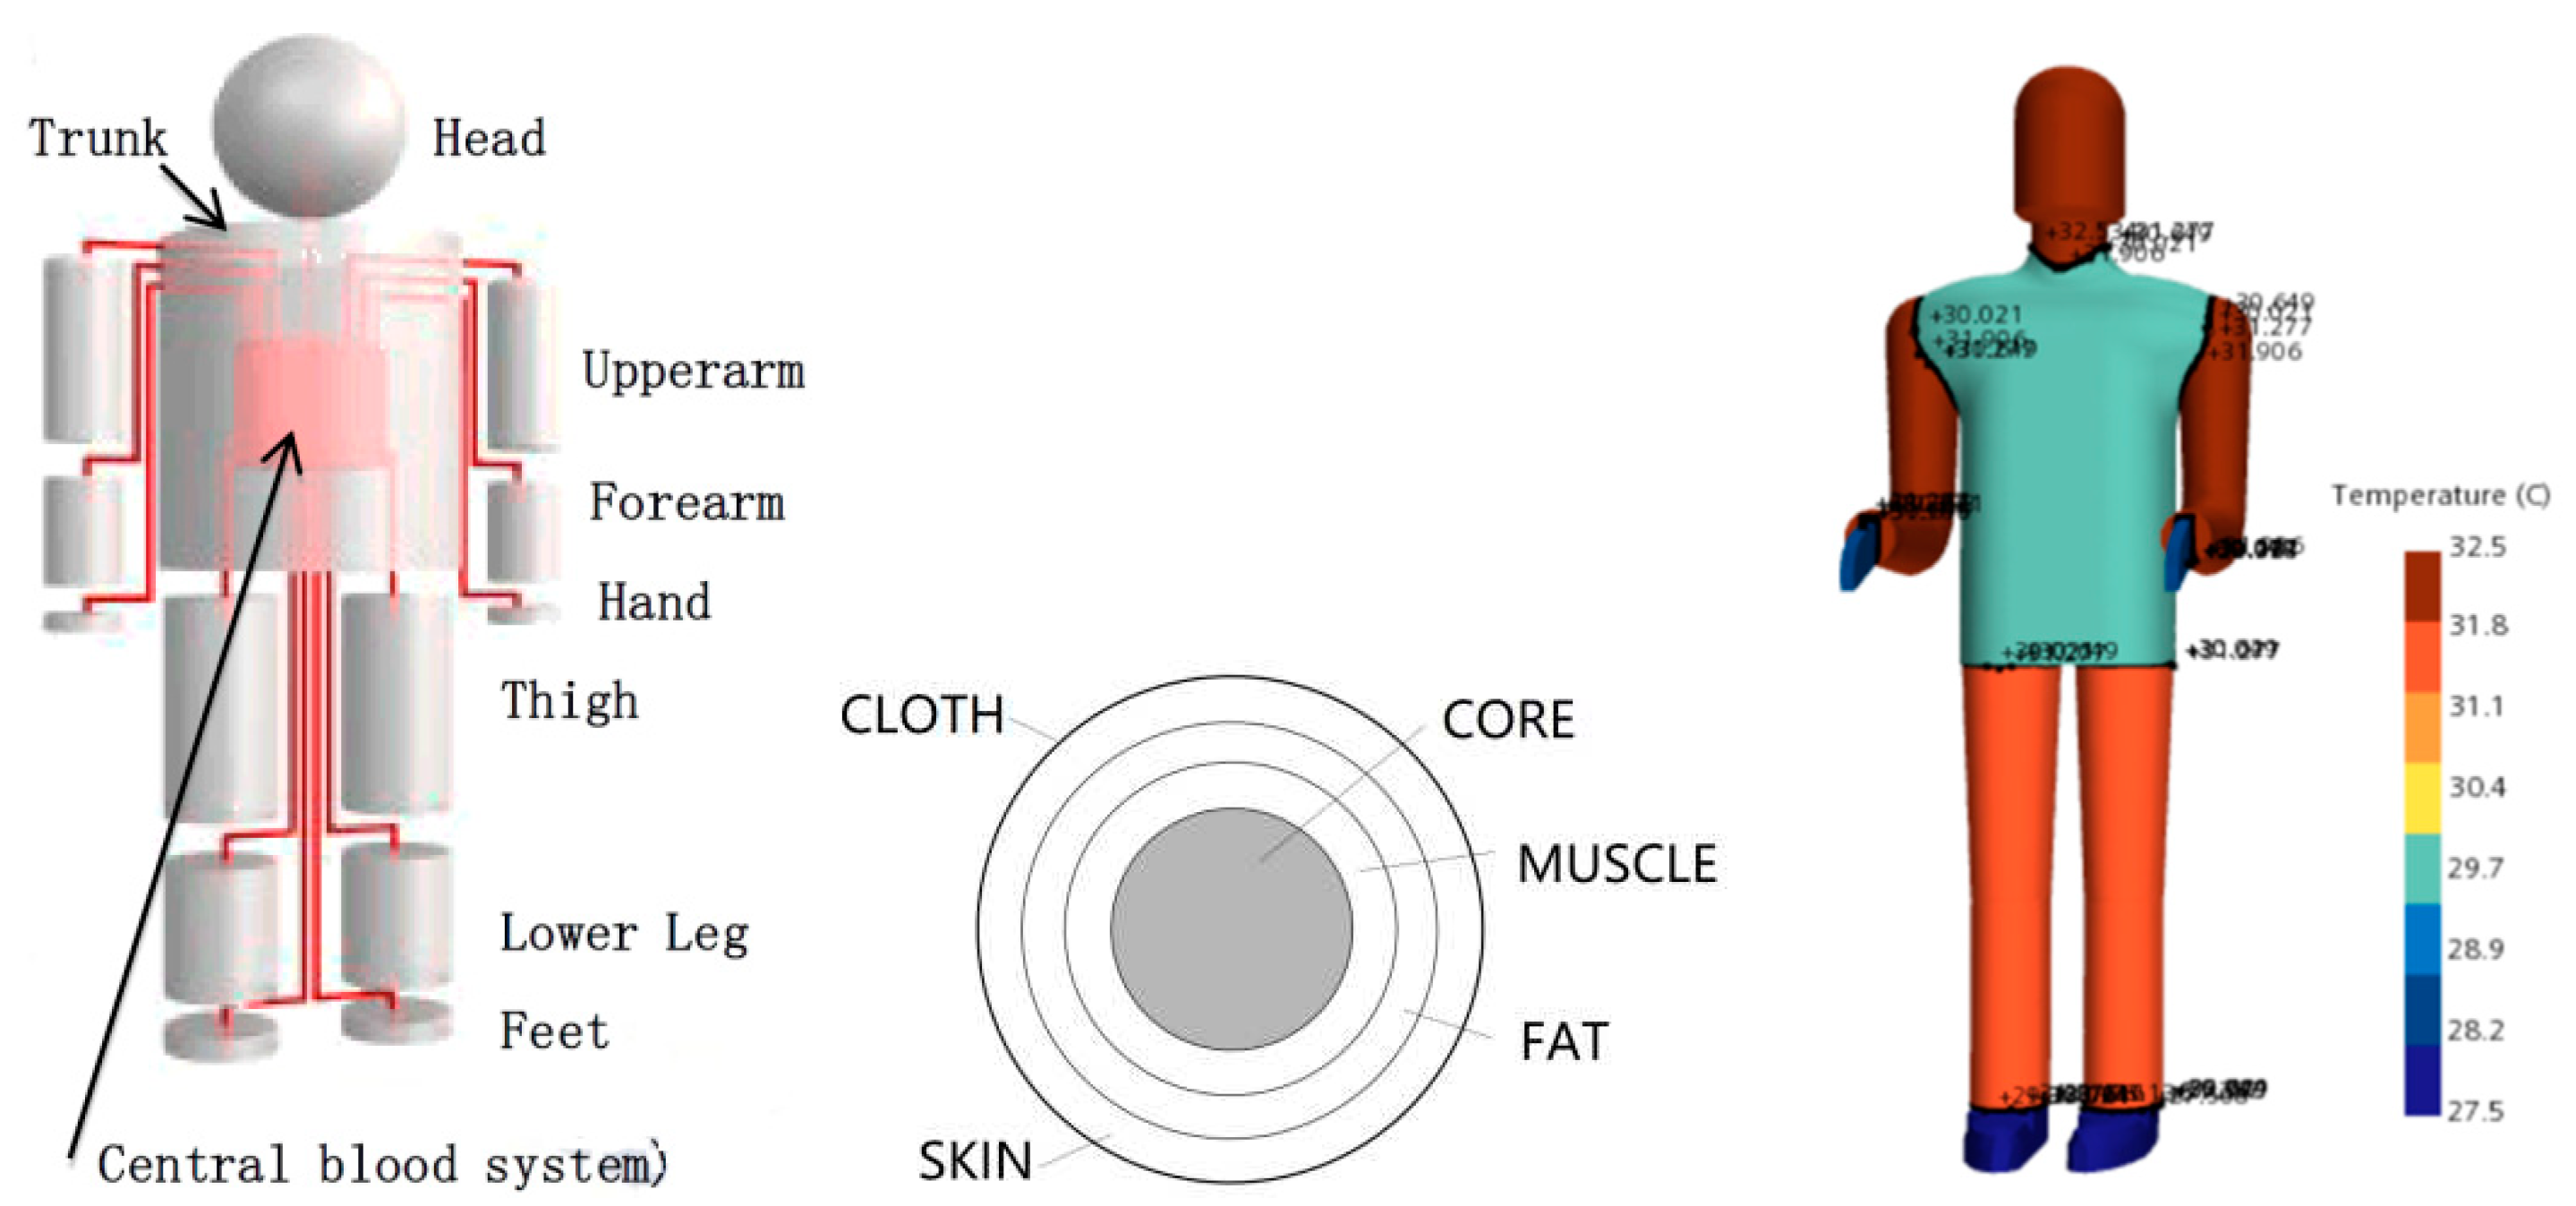
This article uses the thermal comfort calculation module of the STAR CCM+ platform to establish a dynamic human thermal physiological model, which can calculate the thermal physiological parameters of 14 components of the human body. Each component is divided into 4 layers and includes a central blood system, with a total of 57 nodes in the simulation model. This provides research ideas and tools for studying the heating non-uniformity of heating end devices, the impact of temperature gradients on thermal comfort, and the comprehensive effects of flow and radiation on human thermal comfort. The division of human body and the simulation model are shown in
Figure 5.
The indicators used in this article to describe the model are: j is the body component number (from 1 to 14); I is the node number (from 1 to 4).
2.1. Main Components of Passive System
Passive systems describe the internal and external heat transfer mechanisms of the human body, mainly including the following systems:
2.1.1. Thermal Storage System
For a constant specific heat capacity c
p, the stored body heat flux Q
ST is directly proportional to the temperature gradient, and the central vascular system’s stored body heat flux Q
STCVS is calculated by the following equation. References [
10] and [
11] provide specific heat capacities for the same tissue type.
2.1.2. Thermal Balance Model
The difference between Q
MET and W is related to metabolic heat production, and this heat balance can be established at all stages. The overall heat balance of the human body is generally:
For each body component:
In addition to these heat balance equations, the central cardiovascular system must also be considered:
In each body component, all elements are coupled through the central cardiovascular system. The central blood temperature is a function of all body temperatures and blood volume flow rates. There are a total of 57 differential equations that need to be solved. When the element temperature no longer changes and the stored body heat flux is zero during the calculation process, an equilibrium state is reached.
2.1.3. Internal Heat Transfer Model
The heat conduction between two elements i and i+1 in node j is:
is the thermal conductivity coefficient between different nodes.
2.1.4. External Heat Transfer Model
1) The calculation method for convective heat transfer is as follows:
Q
CONVj is the convective heat transfer corresponding to node j skin,
T4,j is the temperature corresponding to node j skin, and
TAIRj is the ambient air temperature. The radiative heat transfer between a person and the surrounding surface can be expressed as:
is the skin emissivity of component segment j, σ Is the Stephen Boltzmann constant; Aj is the skin area of the jth component segment; TENVj is the ambient temperature of component segment j.
2.2. Active System Compositions
The active system describes the thermal physiological regulation process of the human body. The central controller calculates the control variables of the entire body based on temperature signals. The skin temperature of all body parts and the center temperature of the head are physical quantities that need to be input into the controller. The control deviation is composed of the difference between the corresponding body part temperature and the target value (referred to as the reference temperature
TREF), calculated as follows.
These control deviations are the basis for calculating the global controlled variable. For skin temperature, it is possible to distinguish whether the control deviation is a warm signal or a cold signal. Positive deviation corresponds to warm signal, negative deviation corresponds to cold signal:
The element signals are combined to a total signal. When calculating this total signal, the distribution of the thermal receptors on the skin (cold and warm spots) are taken into account. The values are obtained through multiplication of the number of cold and warm spots of a skin element with the corresponding area fraction of the entire body surface [
12]. The total signal of skin elements for both hot and cold signals is written as:
2.2.1. Evaporative Heat Dissipation Model
The global control variable transpiration calculation is:
This global control variable and the coefficients used are based on the experiments described in reference [
13], represented as follows:
2.2.2. Vasodilation Model
Vascular vasoconstriction causes the human body to respond to heat or cold loads:
When the skin temperature drops by 10 ℃, it can lead to an increase in resistance in blood vessels [
14]. This effect is considered through factor
. The blood volume flux of the skin is composed of the following:
The global controller constants are:
In the calculation of vascular contraction control variable signals, a multiplication method is used, and the controller constant is as follow:
2.2.3. Thermoregulatory Heat Production
When the body temperature drops, skeletal muscles are activated. This process is called shivering, which is used to maintain body temperature. The global control variables for trembling are:
Similar to other temperature regulation control variables, the shivering global control signal is transmitted to the local controller and multiplied by the controller constant to obtain the locally generated heat:
According to the measurements in references [
15] and [
16], there is a multiplication connection between the control variable and the local controller constant. According to the experiment, the global controller constant is:
The heat production distribution of L
MUSC、SHIV in each muscle unit is shown in the table below. In addition, the distribution of heat generated through muscle work in each muscle element L
MUSC, WORK are listed in
Table 1.
The volumetric flux of blood through the muscle elements is given by:
3. Verification of CFD model
Skin temperature is one of the important physiological indicators of the human body, which is closely related to human thermal sensation and can reflect the thermal balance and thermal sensation state of the human body. Compared to other physiological parameters, human skin temperature is not only relatively simple to measure, but also has relatively high accuracy, making it a widely used physiological parameter in human thermal comfort research. In addition, many factors related to human thermal comfort affect the thermal balance of the human body by affecting the heat exchange between the skin surface and the environment, thereby affecting the thermal sensation of the human body. Zhou Hao and others from Xi’an Jianzhu University conducted tests on human skin temperature in different environments [
17], with a total of 56 participants. The designed environmental temperatures were divided into four working conditions: 23 ℃, 28 ℃, 33 ℃, and 38 ℃. The basic clothing was long pants, a sports top, and sports shoes, with a clothing thermal resistance of 1.1 clo. The author used the regression analysis method of SPSS statistical software to conduct regression analysis on the skin temperatures of various parts of the collected clothing, and obtained regression equations for local skin temperature and average skin temperature with environmental temperature under different clothing thermal resistances. Regression equation between human skin temperature and environmental temperature are listed in
Table 2.
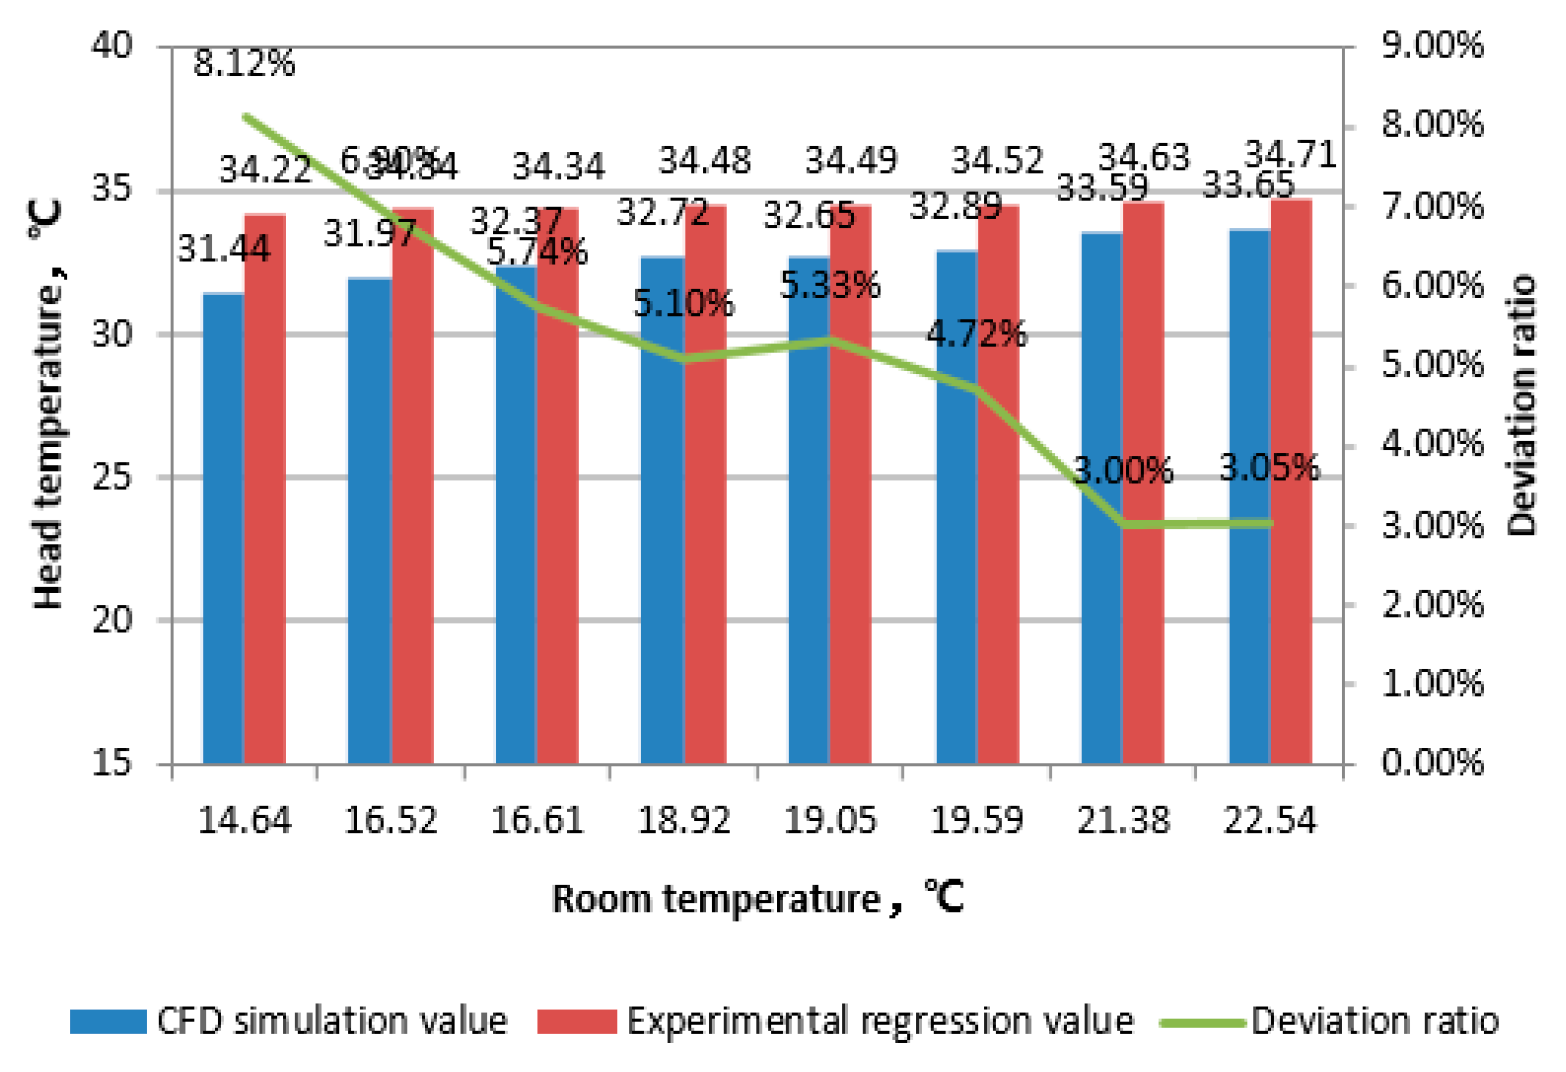
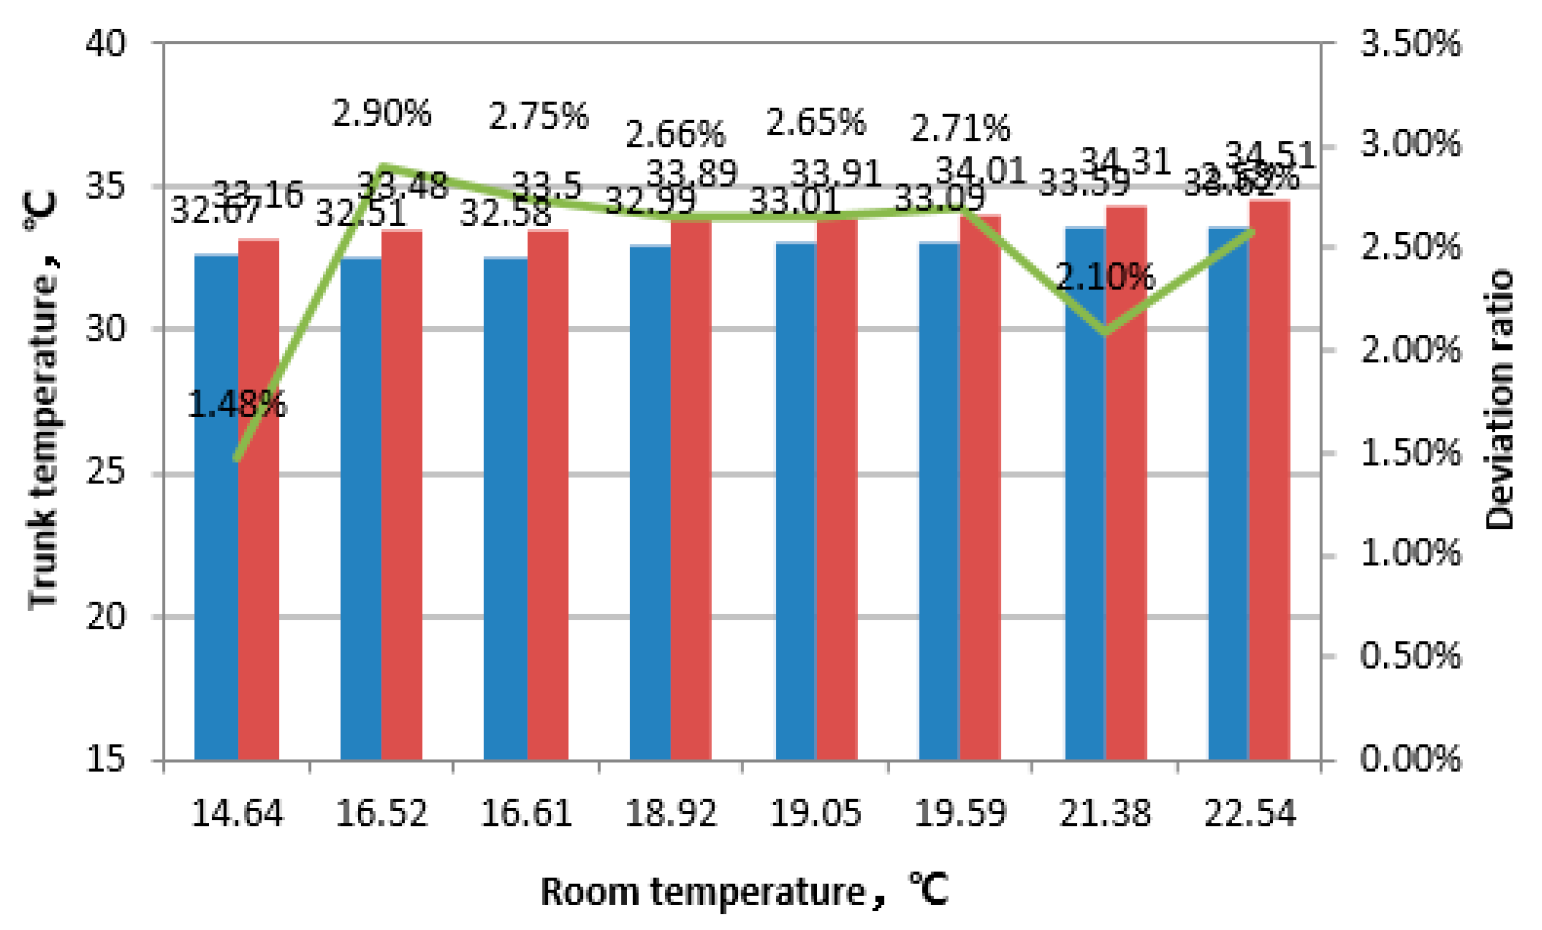
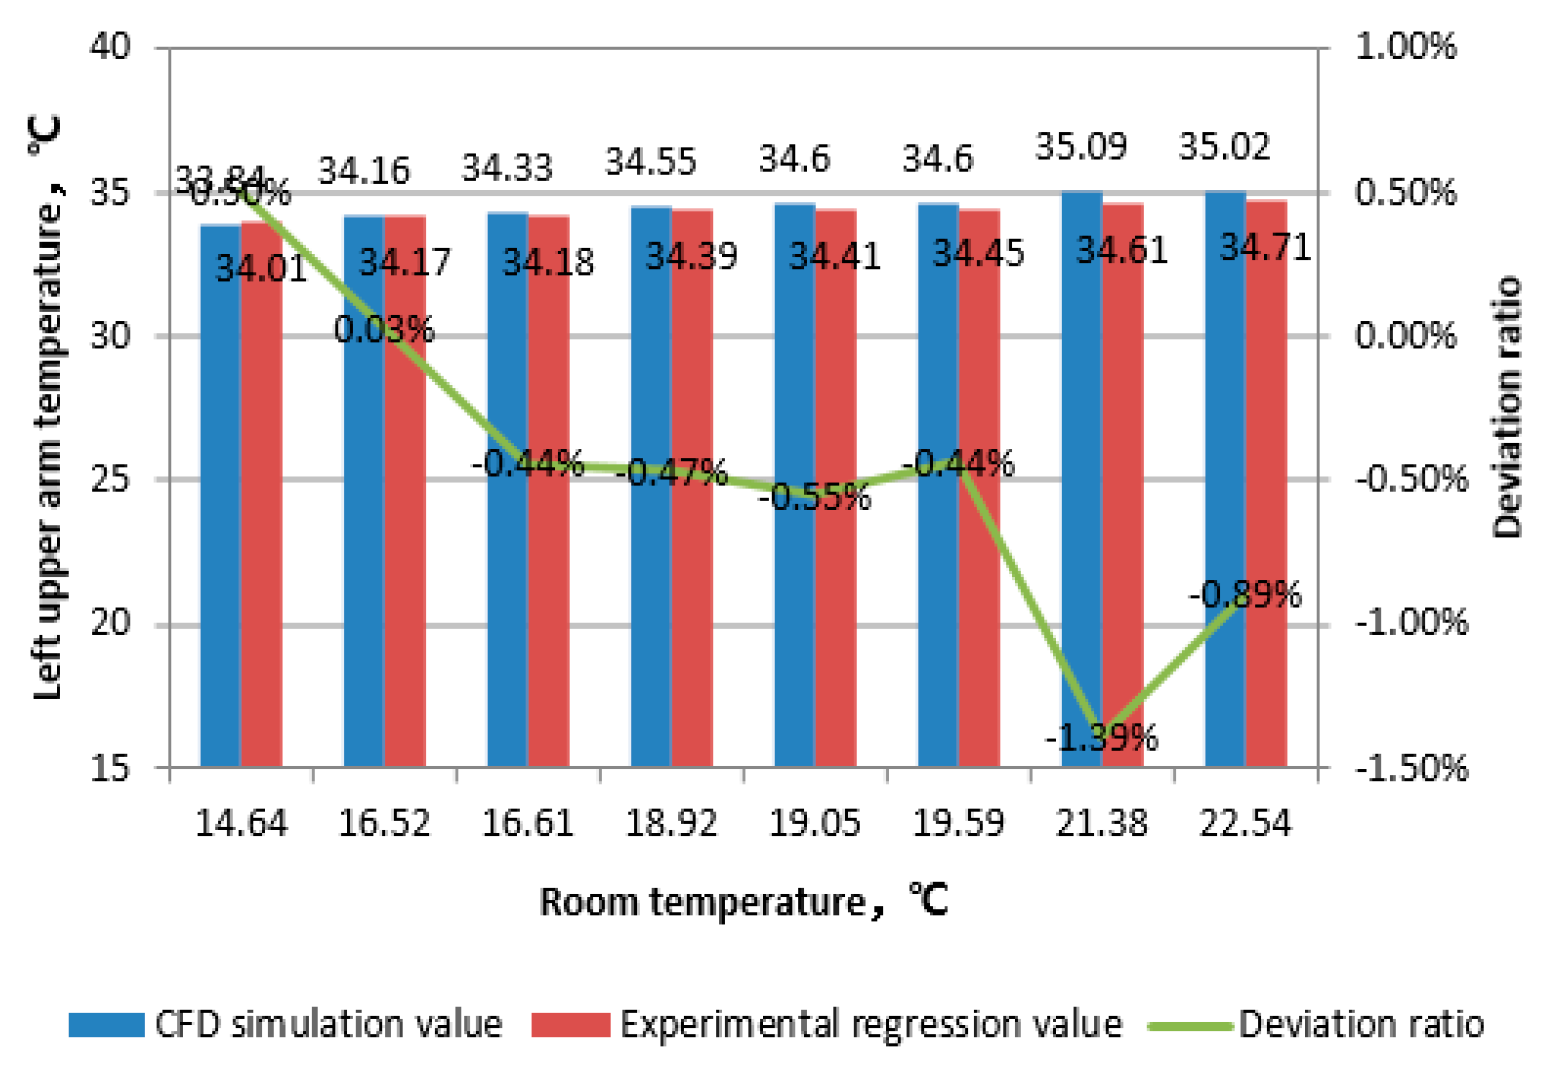
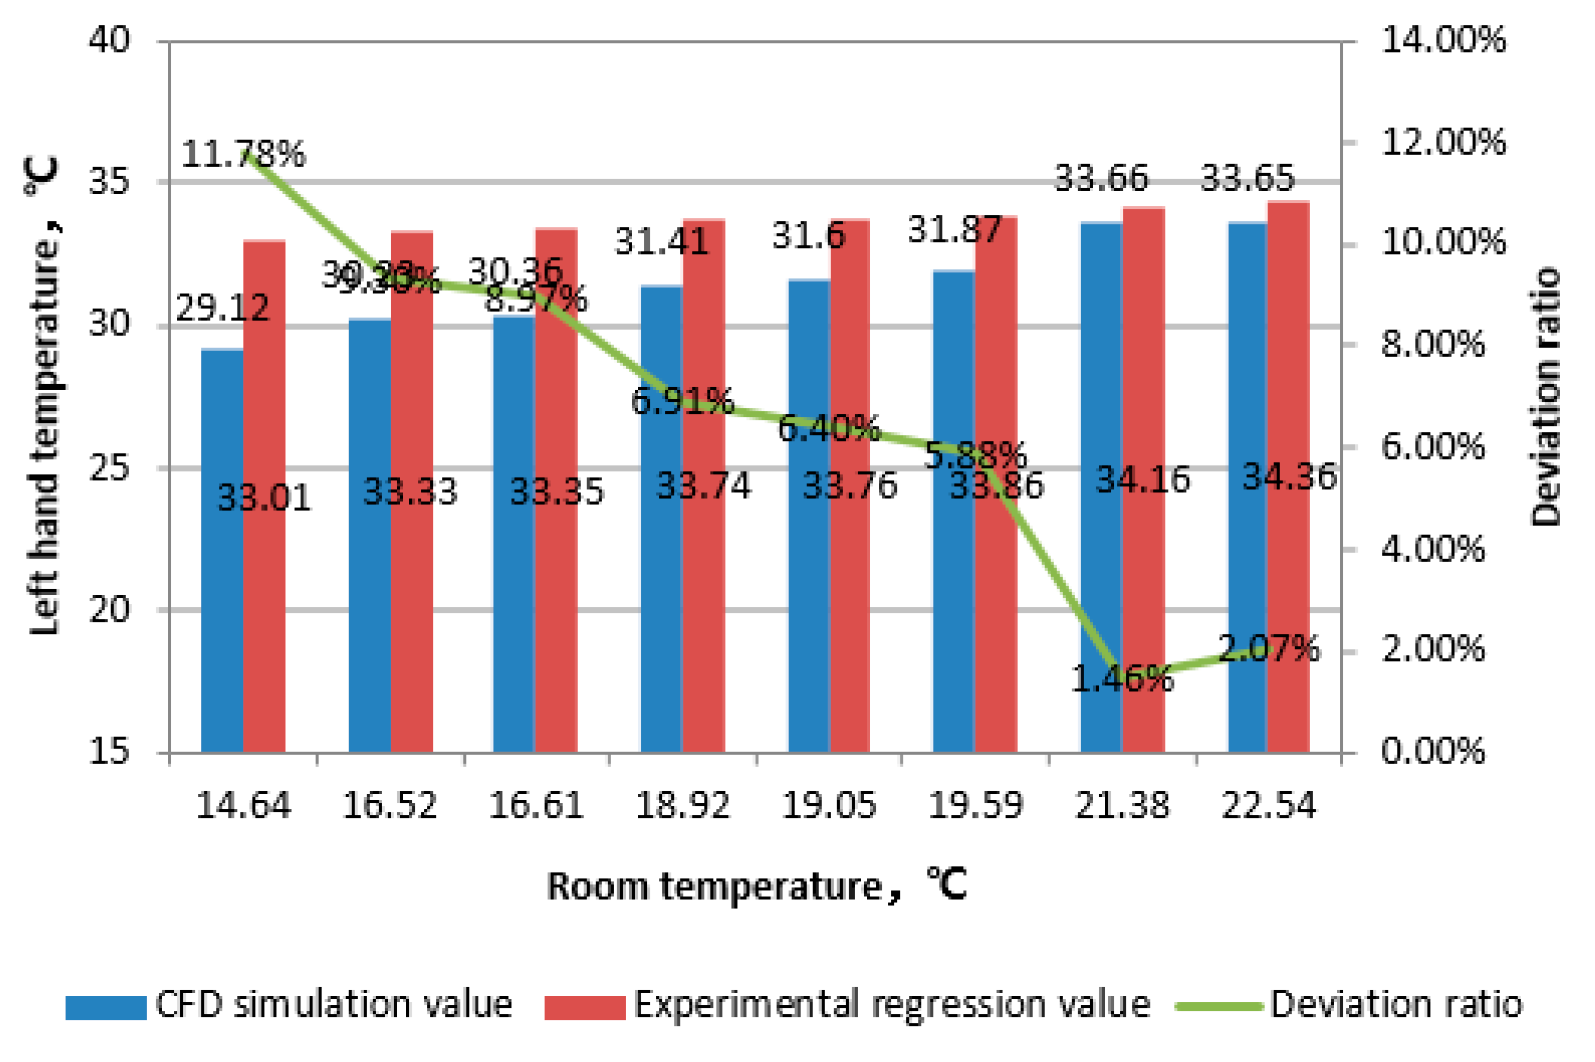
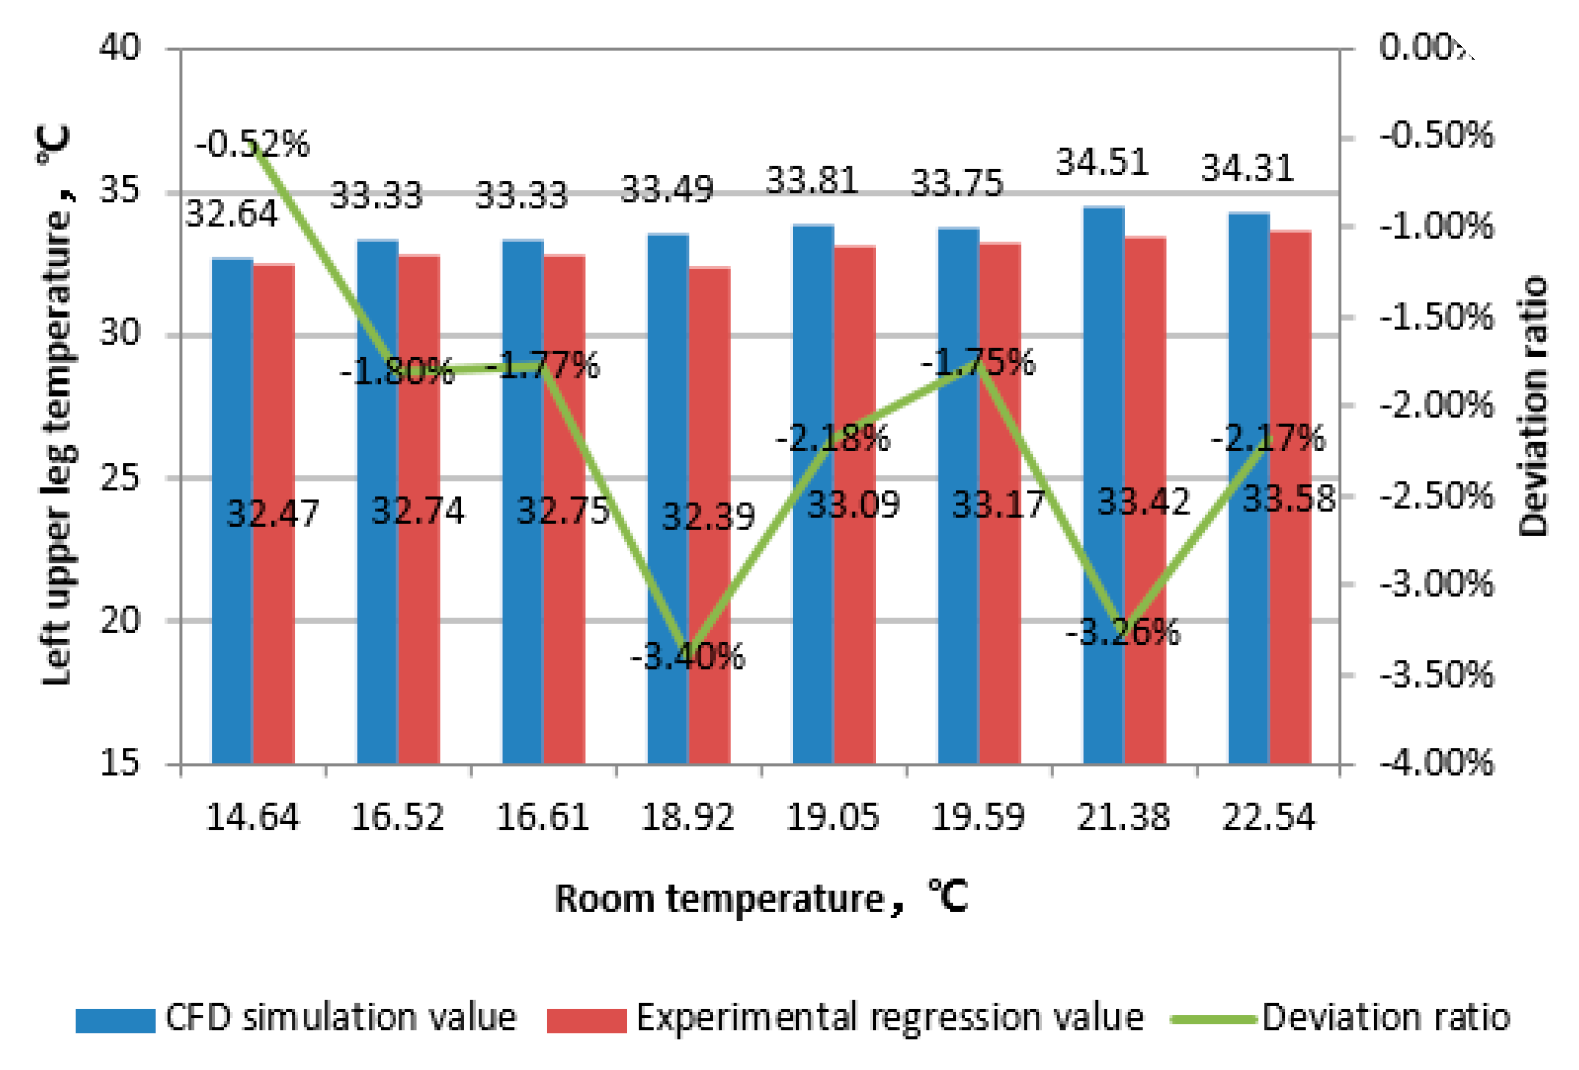
When calculating CFD, set the thermal resistance of the clothing to 1.1 clo. Only the hands and head are the exposed parts, while the rest of the body takes into account the thermal resistance of the clothing. Select the head, torso, left upper arm, left thigh, left hand, and left foot as the research subjects. Calculate the difference between the regression values obtained from laboratory testing at different ambient temperatures and the values calculated by this CFD model.
Figure 6,
Figure 7,
Figure 8,
Figure 9,
Figure 10 and
Figure 11 show the comparison of experimental regression and simulation data, as well as their deviations.
From the above data, it can be seen that the deviation between simulated values and experimental regression values of various parts of the body decreases with the increase of room temperature. The data deviation of the head decreases from 8% to 3% with the increase of temperature, and the data deviation of the hands decreases from 11% to 2% with the increase of temperature; The overall deviation of body data is stable below 3%; The overall deviation of data for the left upper arm and left thigh remains stable below 2%; The overall deviation of left foot data remains stable below 5%. Comparing the ambient temperatures of 21.38 ℃ and 25.28 ℃ (experimental simulation conditions range from 23 to 38 ℃), the deviation between the calculated values and the regression values decreases when approaching or staying between the experimental regression conditions. This indicates that the CFD human body thermophysiological model has strong temperature adaptability and reliability in predicting human surface temperature. Meanwhile, for exposed areas such as the head and hands, as the ambient temperature increases, the deviation between the experimental regression values and the calculated values of the human thermal physiological model decreases significantly. When the indoor ambient temperature rises to above 21 ℃, the calculated values of the human thermal physiological model are highly consistent with the experimental regression values. Therefore, it can be considered that the human surface temperature calculated using the human thermal physiological analysis model in the STAR CCM+platform can objectively reflect the actual physiological characteristics of the human body.
4. Results and Discussion
As a traditional heating terminal equipment, the operating conditions of radiators are constantly changing with the changes in the form of heating sources and the reduction of building heat load. In the context of the increasingly widespread application of low-temperature heat sources, improving the thermal performance of radiators under low-temperature conditions is also a hot research topic both domestically and internationally. Adnan Ploskić etc. studied the overall performance of forced convection heat sinks[
18]. Research has shown that the use of forced convection radiators in residential buildings can meet the heating requirements of buildings with lower water supply temperatures. The importance of airflow rate and convection plate design on the operational performance of heating radiators equipped with forced convection devices has been explored. Under the condition of supply and return water temperatures of 45 ℃/35 ℃, the radiator can increase the temperature of the incoming airflow from -5 ℃ to 26 ℃ at a flow rate of 10L/s. Ploskic and Holmberg [
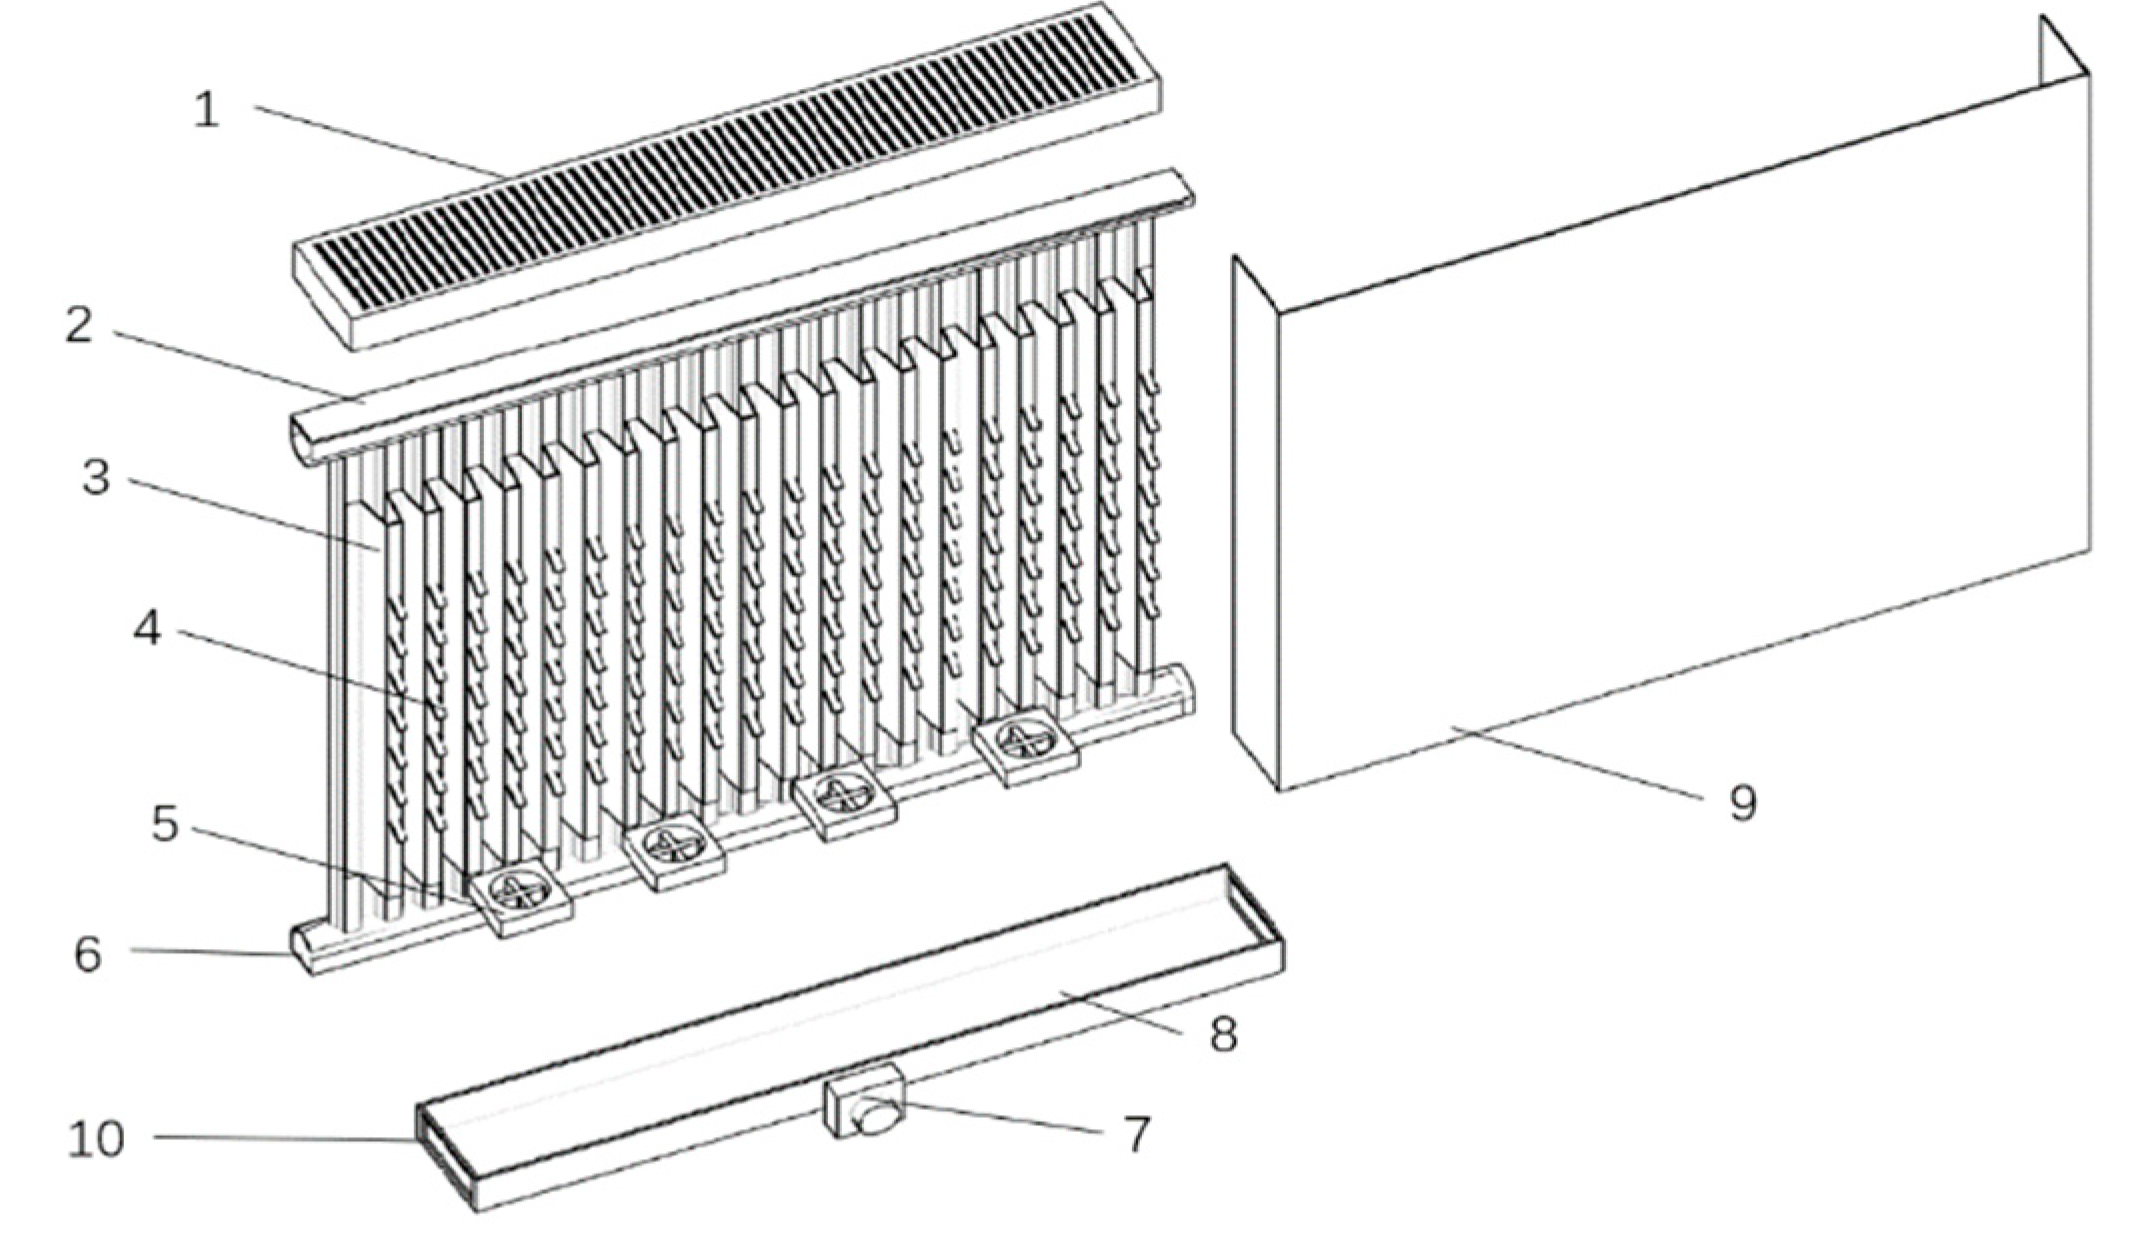
19] used theoretical methods to analyze the application effect of skirting ventilation type radiators in offices. The heat generated by a ventilated radiator system is 2.1 times that of a traditional radiator (with a supply air velocity of 7.0 L/s and an intake air temperature of -6.0 ℃). Research has shown that gradually increasing the forced convection intensity of the radiator will compensate for the decrease in heat dissipation caused by gradually decreasing the water supply temperature of the radiator. Based on this principle, a new type of radiator product suitable for lower water supply temperatures is proposed by optimizing the shape of the air flow channel and adding a turbulence fan on the basis of the original structure of the plate radiator to improve its heat dissipation. This type of forced convection radiator differs significantly from ordinary natural convection radiators in terms of heat transfer mechanism and the effect on indoor thermal comfort. This article uses a human thermal physiological model as an analysis tool to analyze and study the heating effect of this heating equipment, in order to improve the application technical conditions of this equipment and provide technical support for the evolution of plate radiators to low-temperature convection heating radiators. The basic structure of the radiator studied in this article is shown in
Figure 12.
This article establishes a human thermal physiological parameter calculation model for radiator heating based on the CFD calculation platform. After considering the comprehensive effects of human metabolism factors and surrounding thermal environment factors, the local thermal physiological parameters of the human body are calculated. Realize the evaluation of the impact of convective radiator heating on human thermal physiological parameters through numerical simulation technology. The article adopts a comparative research method to demonstrate the feasibility of this plan.
4.1. Research on Air Flow Characteristics of Convective Radiators for Heating
This article sets the thermal resistance of clothing to 0 clo to study the direct interaction between indoor air supply flow field and human skin. Because clothing significantly reduces the comfort perception of the human body towards changes in indoor air flow velocity. The ambient temperature of the climate laboratory in the model is 16 ℃, with a convective heat transfer coefficient of 15.0 W/m
2K. The outdoor side is under low temperature conditions, and the top air inlet temperature is -20 ℃ with a wind speed of 0.5m/s. Part of the indoor heat is taken away through windows and partition walls. The inlet temperature of the radiator is 80 ℃, the inlet flow rate is 7g/s, and the outlet temperature of the radiator changes with different convective intensities. The temperature of the human body and the environment under different inlet wind speeds of radiators in the calculation area is as follows.
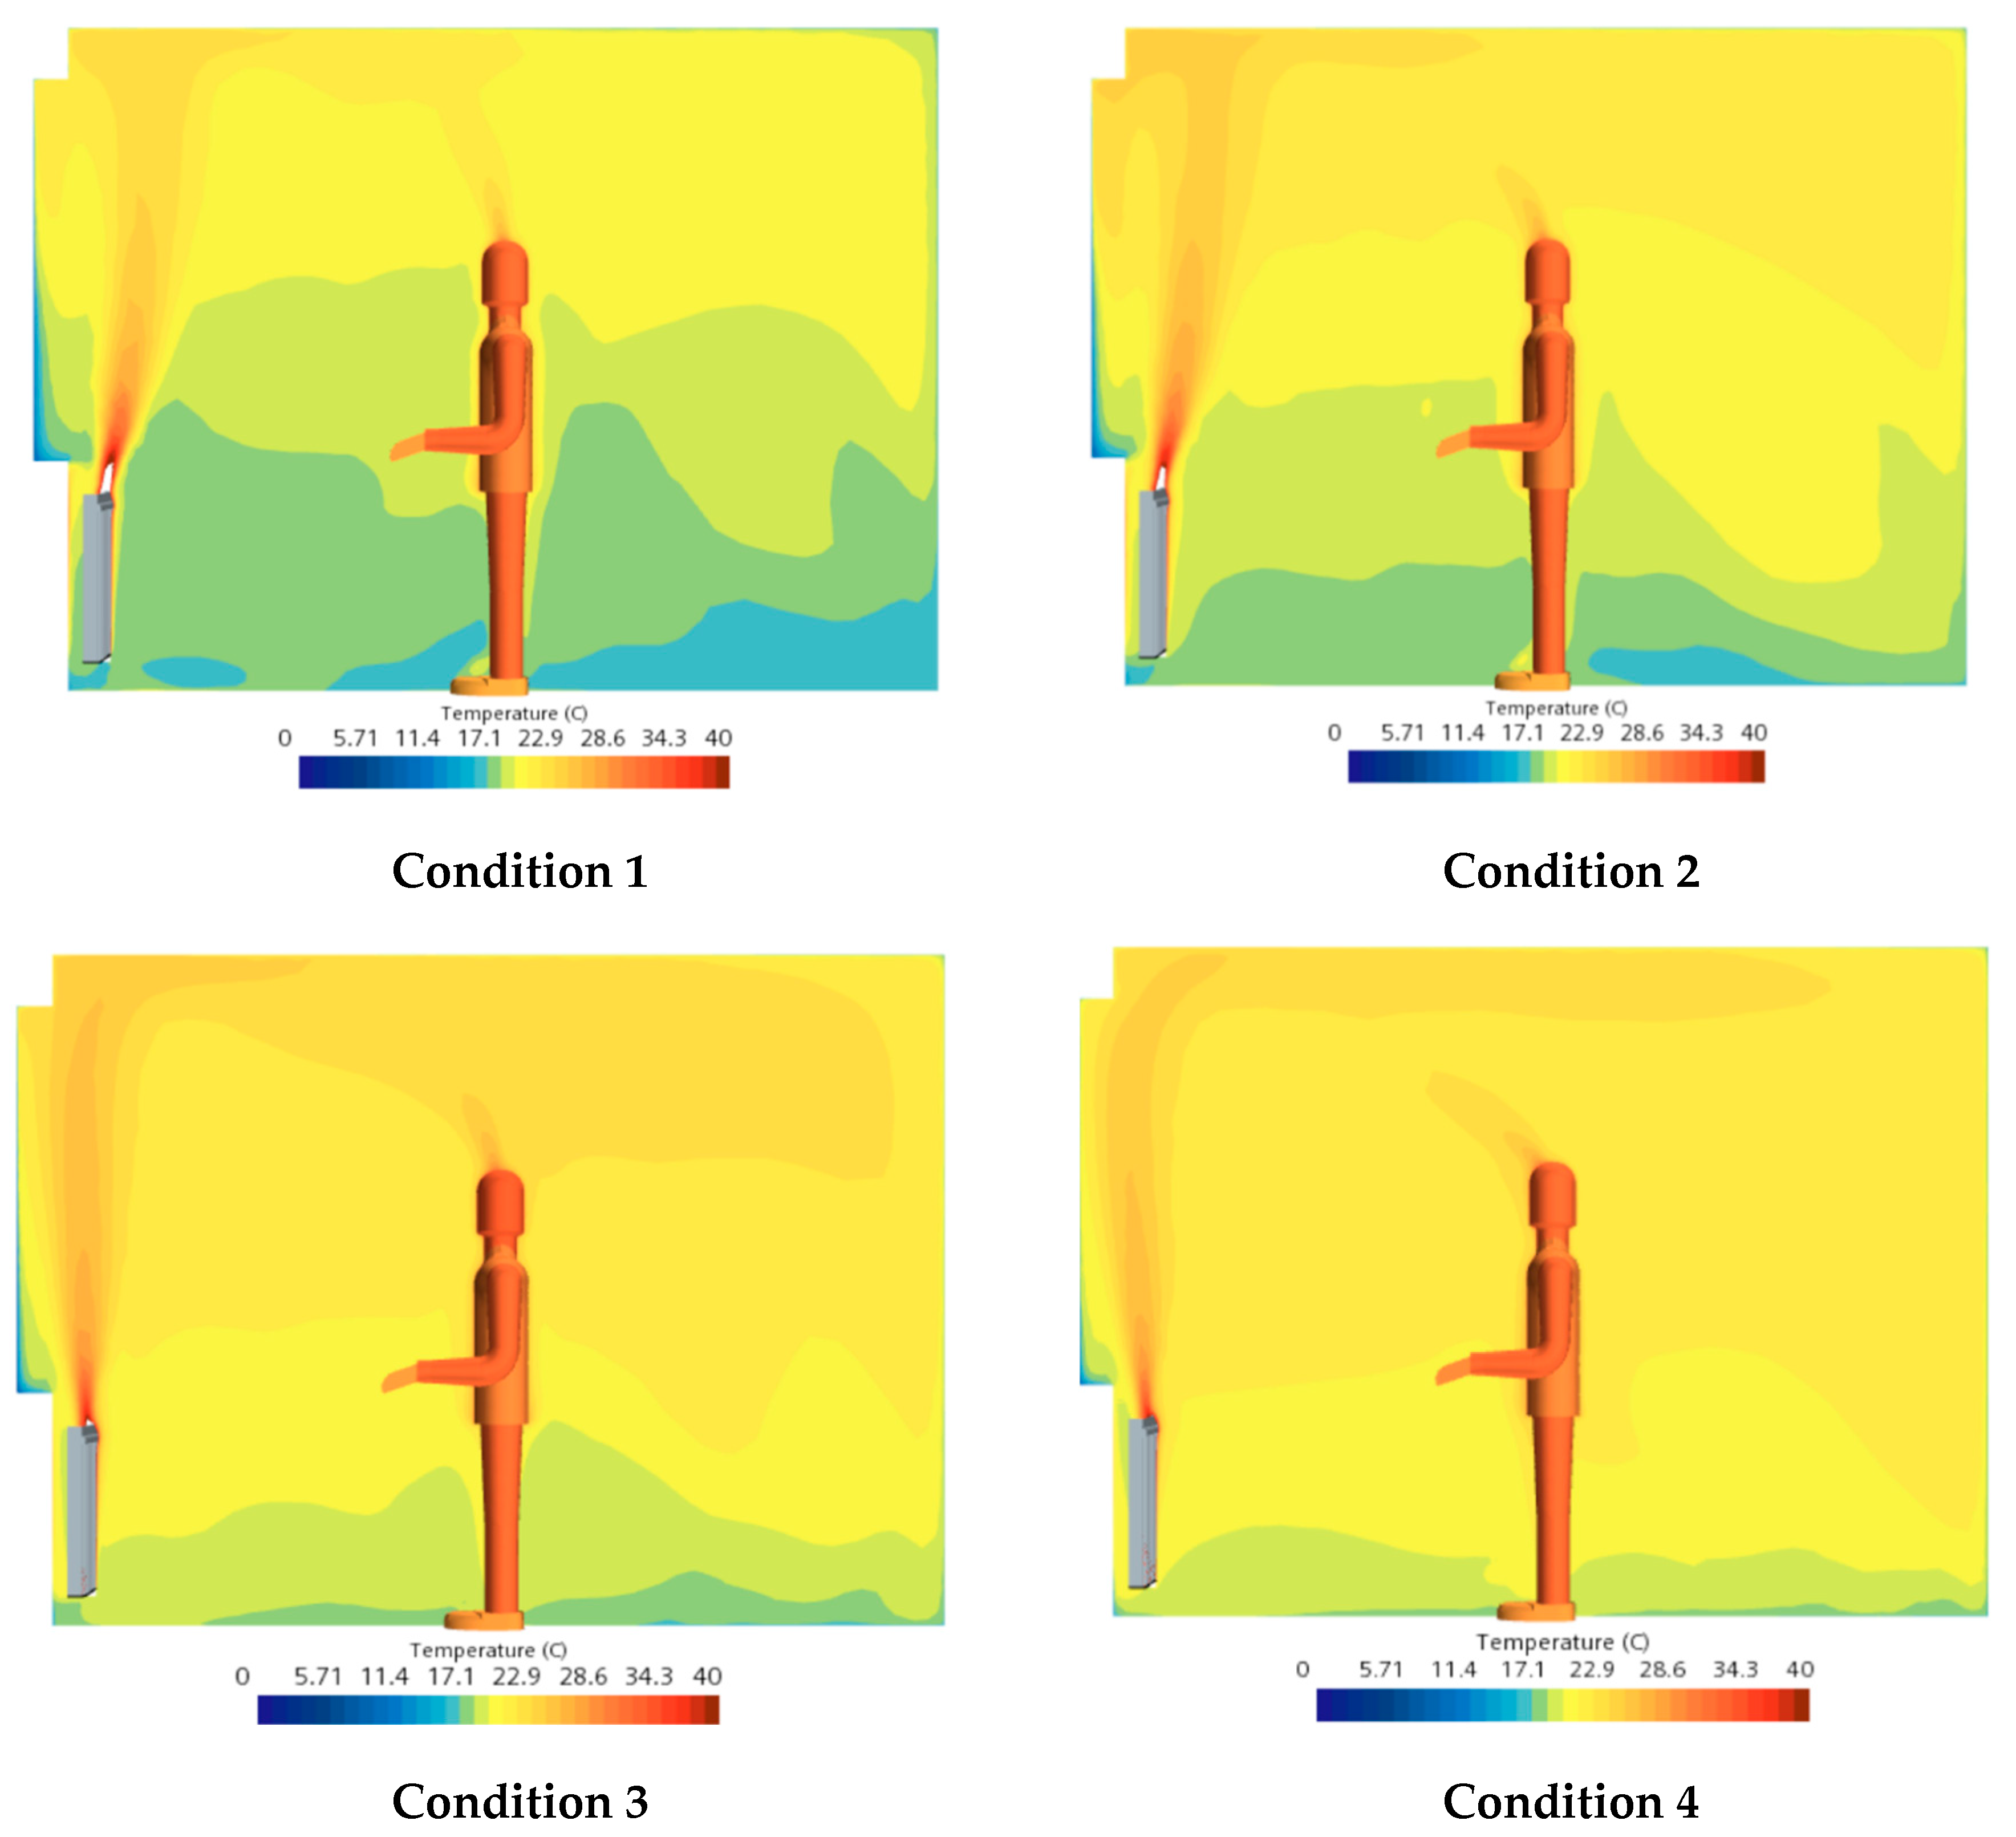
Table 3 lists four typical operating conditions, and
Figure 13 shows the indoor vertical section temperature distribution for the corresponding operating conditions.
The indoor air temperature distribution cloud map corresponding to the working conditions in the table above is as follows:
From the vertical section temperature distribution map, it can be seen that when the inlet wind speed of the convective radiator is relatively low, the temperature gradient is larger, and heat is concentrated above the heating area. Therefore, the area of the lower low-temperature area is larger. With the continuous increase of imported wind speed, firstly, the heat dissipation capacity gradually increases, and the heating capacity of the radiator improves. Secondly, the indoor airflow convection becomes more intense, expanding the area of high-temperature areas and reducing the area of low-temperature areas until the temperature of the entire space is basically uniform.
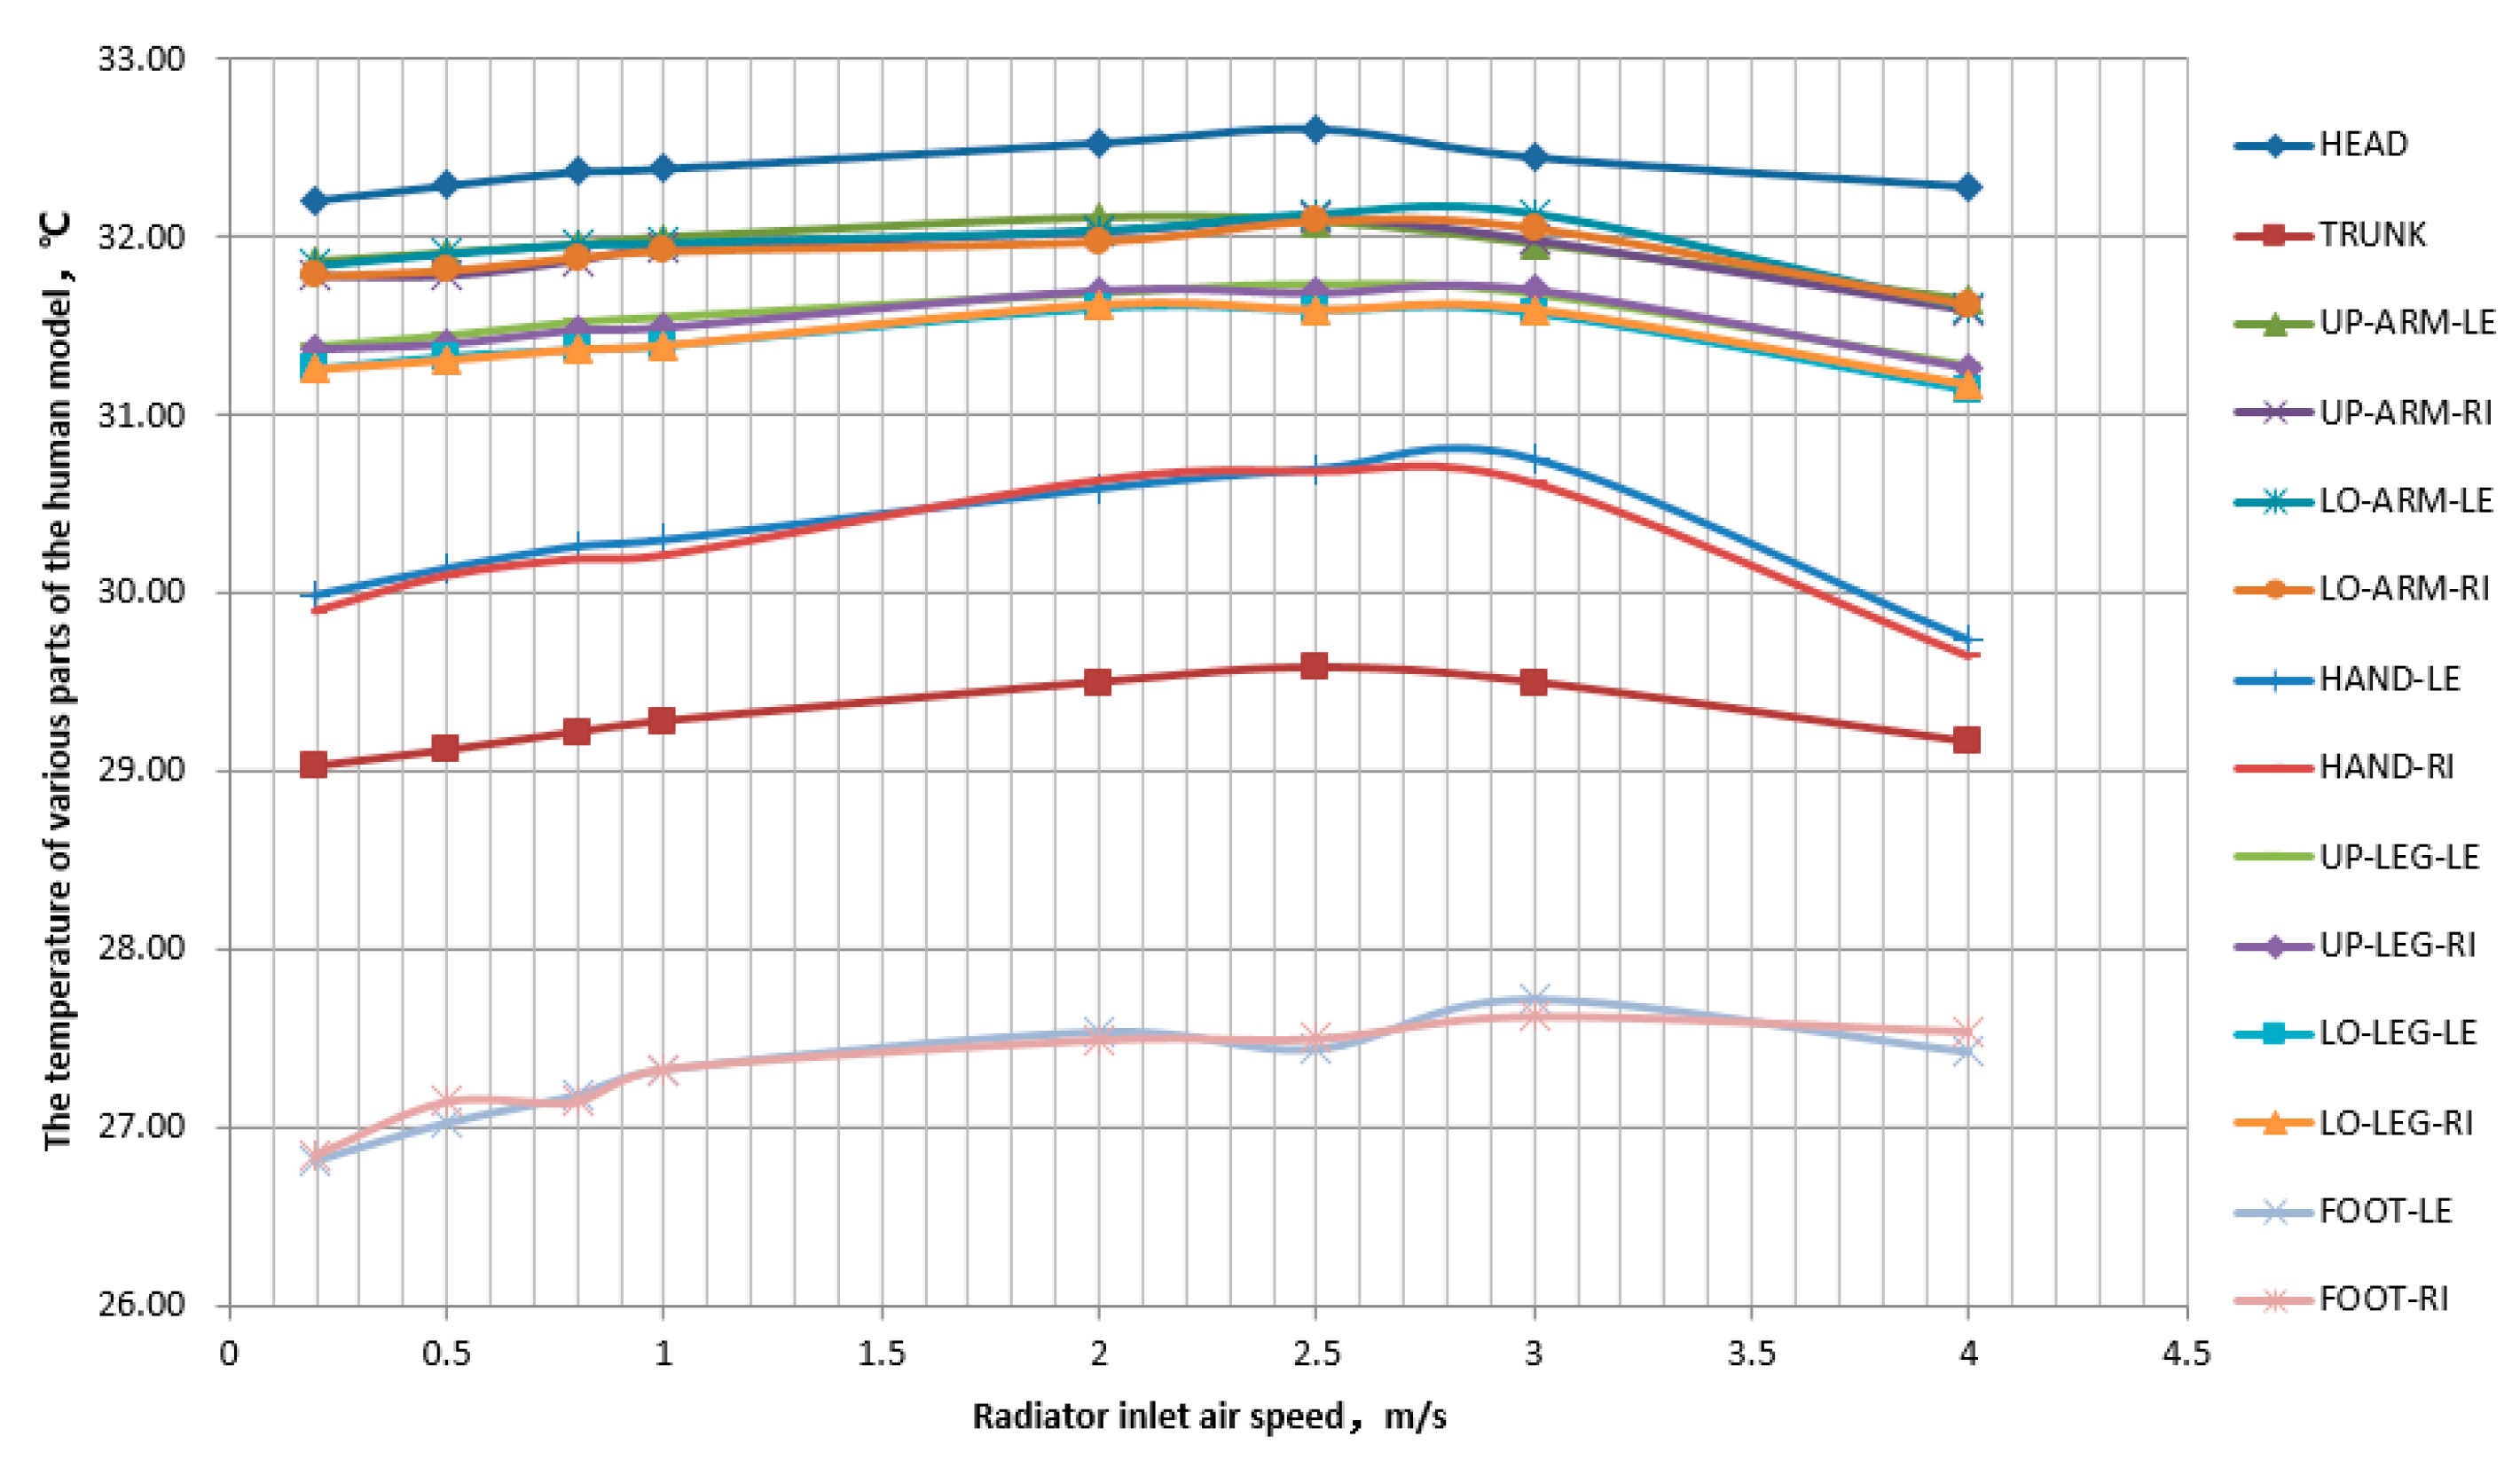
Figure 14 shows the variation of skin temperature in various parts of the human body with the variation of the inlet wind speed of the radiator. The skin temperature of various parts of the human body first increases and then decreases with the increase of inlet wind speed, and there is a significant fluctuation in hand temperature at a speed of 3m/s. This indicates that an increase in the inlet wind speed of a forced convection radiator can improve the heat dissipation of the radiator, but it can also lead to intensified indoor disturbances, improved heat transfer performance between the air and the human body surface, lower the temperature of the human body surface, and thus reduce the thermal comfort of the human body.
As shown in
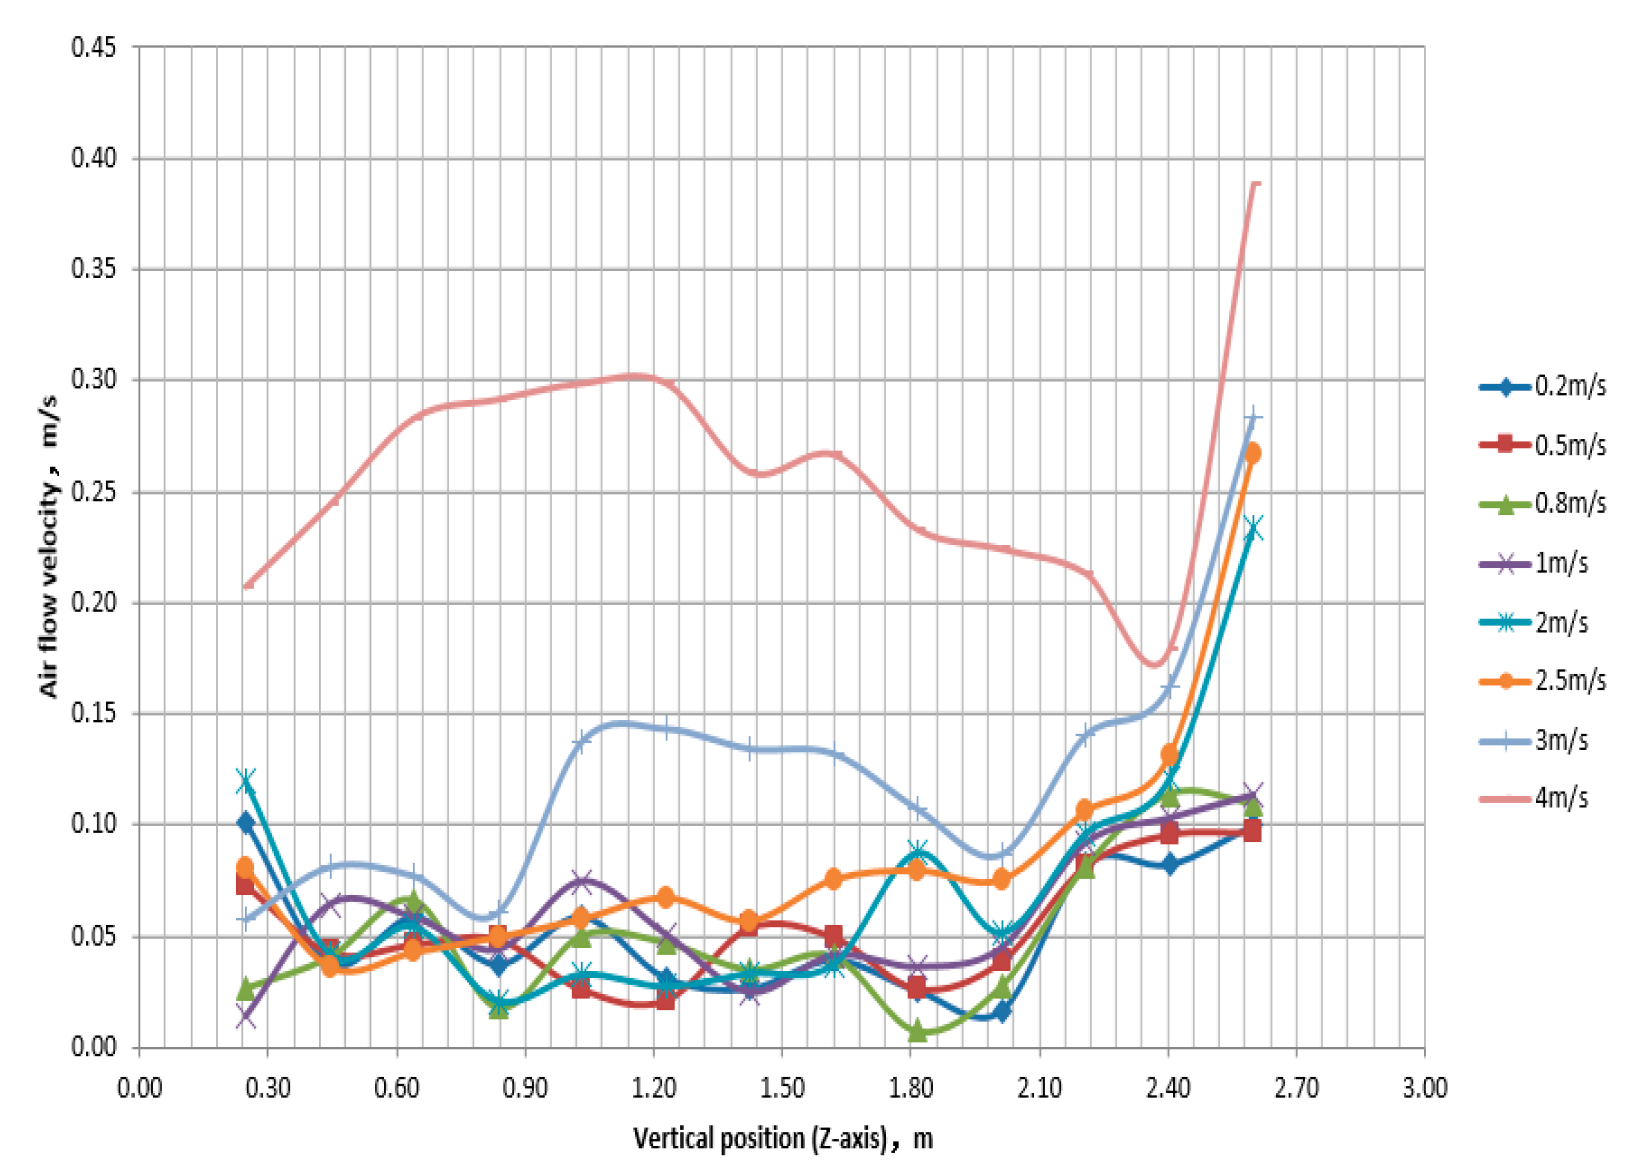
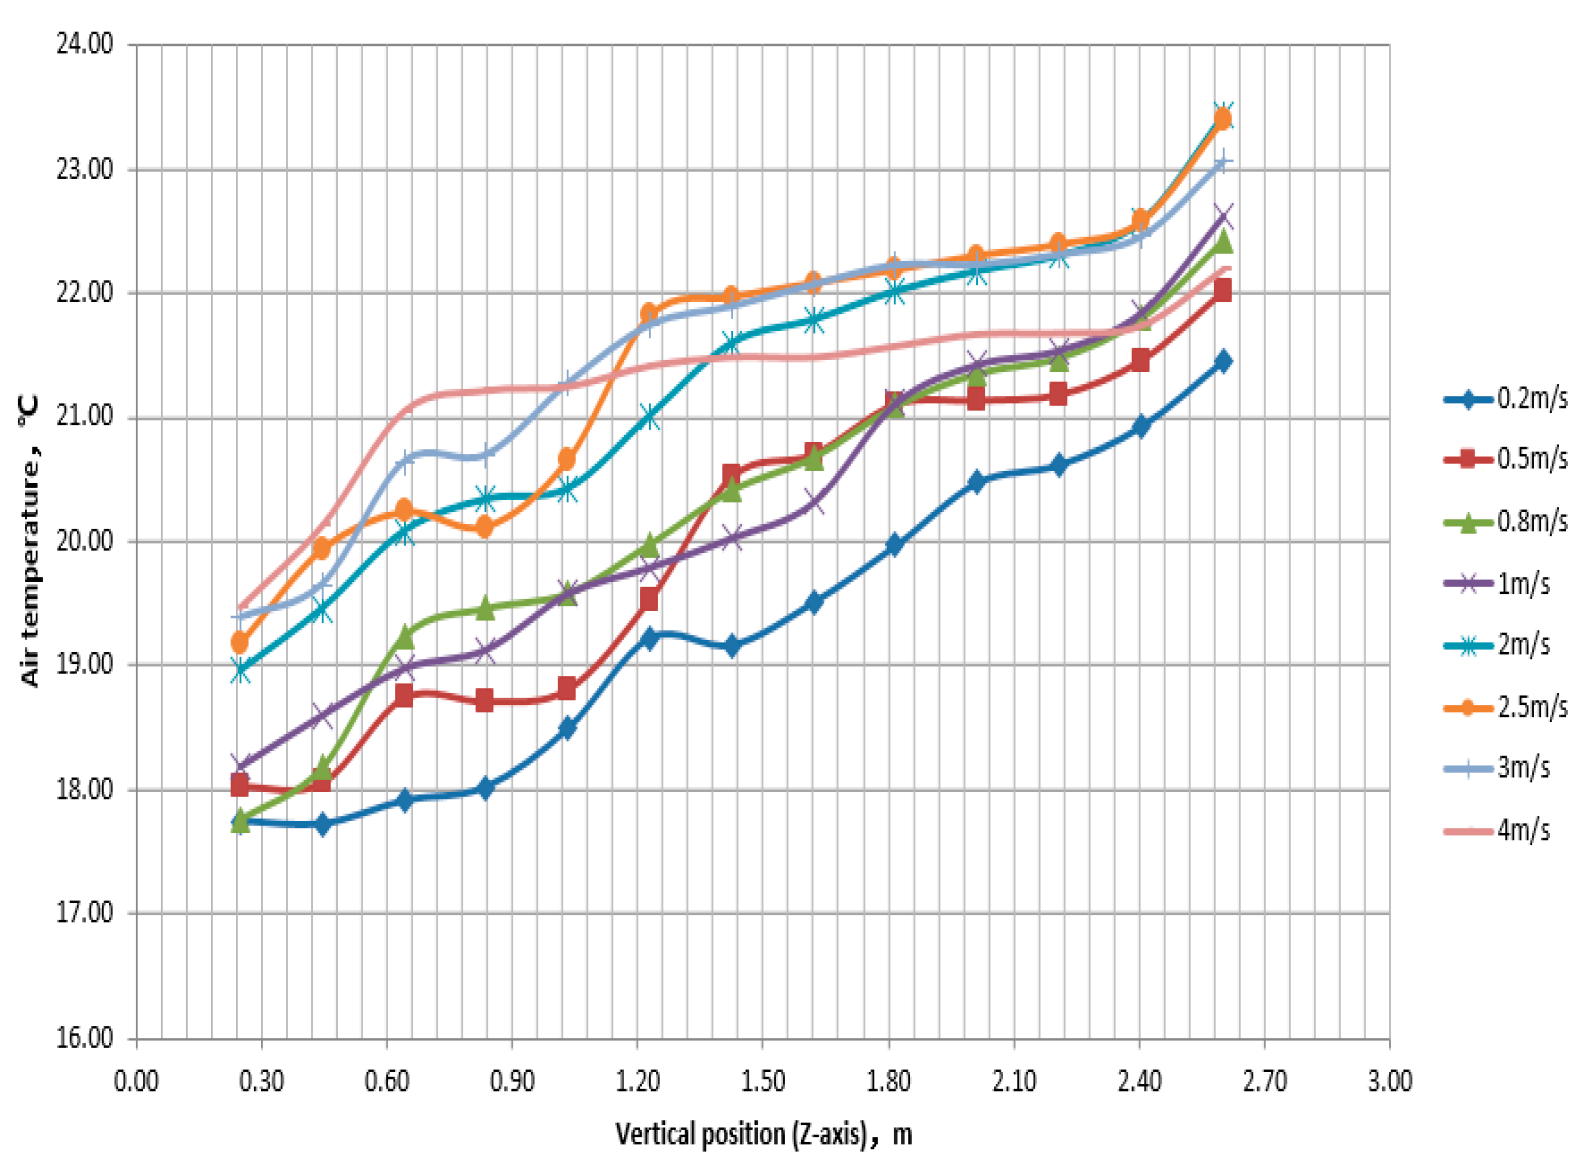
Figure 15, taking the air velocity data points in the vertical direction between the radiator and the human body, it can be seen that when the inlet velocity is below 3m/s, the velocity change at the same position is not significant. Although there are fluctuations in each position, the overall distribution of velocity values is concentrated. However, when reaching a certain speed, there is a significant increase in the velocity in the flow field, which is about 3m/s. This change will significantly change the air flow state, affect the heat transfer performance of the human body surface, and thus have a significant impact on the surface temperature of the human body. This is also one of the reasons why the surface temperature of the human body decreases when the inlet air velocity of the radiator increases to a certain extent in this example. As the inlet wind speed increases, the temperature gradient in the vertical direction changes from a basic linear to a step type. The range of similar temperatures in the vertical direction continues to expand, and finally gradually mixes evenly, forming a stable and uniform temperature space within a certain space. The temperature step phenomenon in
Figure 16 illustrates this viewpoint.
According to "Analytical determination and interpretation of thermal comfort using calculation of the PMV and PPD indices and local thermal comfort criteria" (ISO7730) [
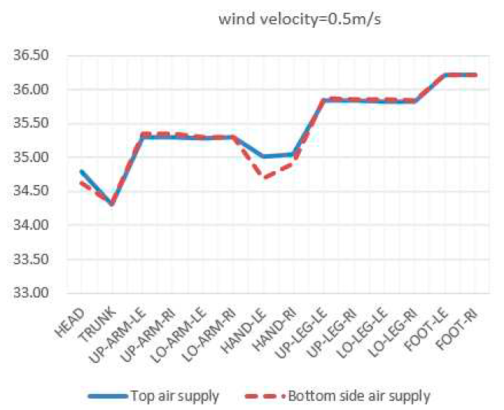
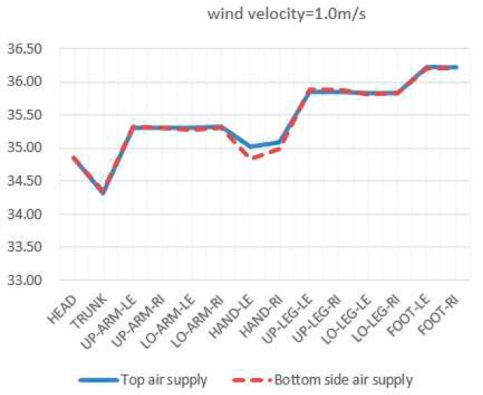
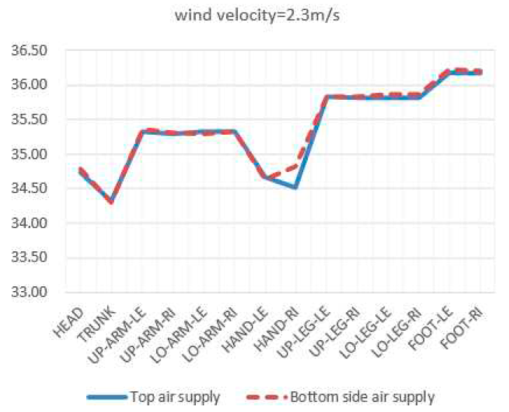
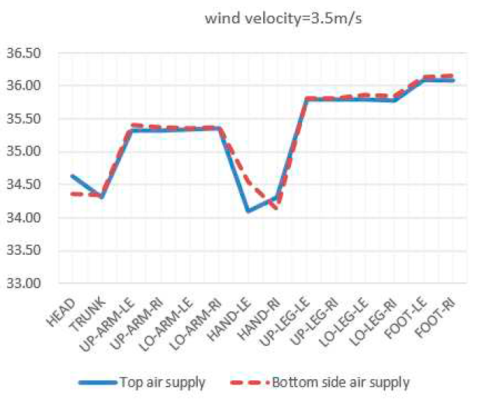
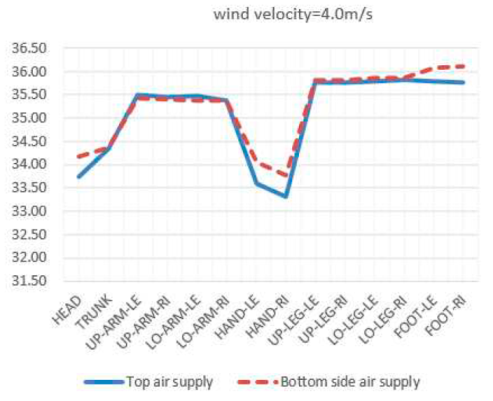
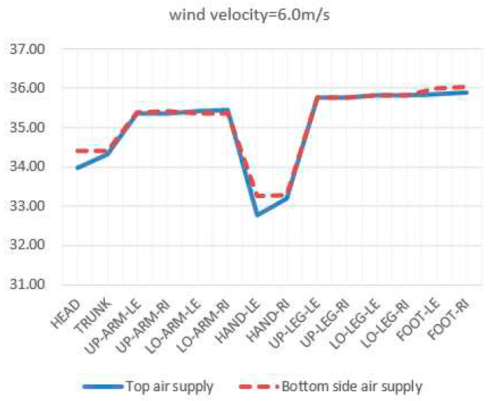
20], discomfort in the local thermal environment of the human body can affect overall thermal sensation. The most common cause of local discomfort is the feeling of blowing, and at the same time, the vertical deviation between the head and ankle is too high, and the asymmetric radiation temperature is too high, which can also cause local discomfort. On this basis, this article studied the local skin temperature distribution of the human body under the conditions of top air supply and side bottom air supply. The calculation results are listed in
Table 4.
It can be seen that this thermal comfort difference is mainly reflected in the head and hands. In the top air supply mode of the radiator, the temperature in the head area is higher when the wind speed is low due to the large temperature gradient in the environment. The skin temperature of the head decreases significantly at higher wind speeds (wind speeds greater than 3.5m/s). At low wind speeds, the skin temperature of the hands in the top air supply mode is hotter than that in the bottom horizontal air supply mode. At high speeds (wind speeds greater than 3.5m/s), the skin temperature of the hands in the top air supply mode is relatively lower. Using a vertical air supply system at the top of the radiator, when the wind speed is low, due to uneven mixing of indoor air flow, temperature stratification is obvious. The temperature in the area where the head is located is high, and the temperature of the head skin is consistently at 34.7±0.1℃. When the wind speed is less than 3.5m/s, the increase in wind speed has little effect on the skin temperature of the head. Due to the thermal resistance of clothing, the use of top air supply mode and side bottom air supply mode has little effect on local skin temperature indicators of the body (trunk, limbs, feet). The different air supply methods have a significant impact on the thermal comfort of the human head and hands, and using bottom side air supply is better than top air supply for thermal comfort.
4.2. Research on Low Temperature Heating Characteristics of Convective Radiators
This section adopts a comparative analysis method to study the heating effects under several operating conditions, including no heating, high-temperature natural convection heating, and low-temperature heating at different wind speeds.
Table 5 lists the various operating conditions analyzed. Scenario1 is base condition.
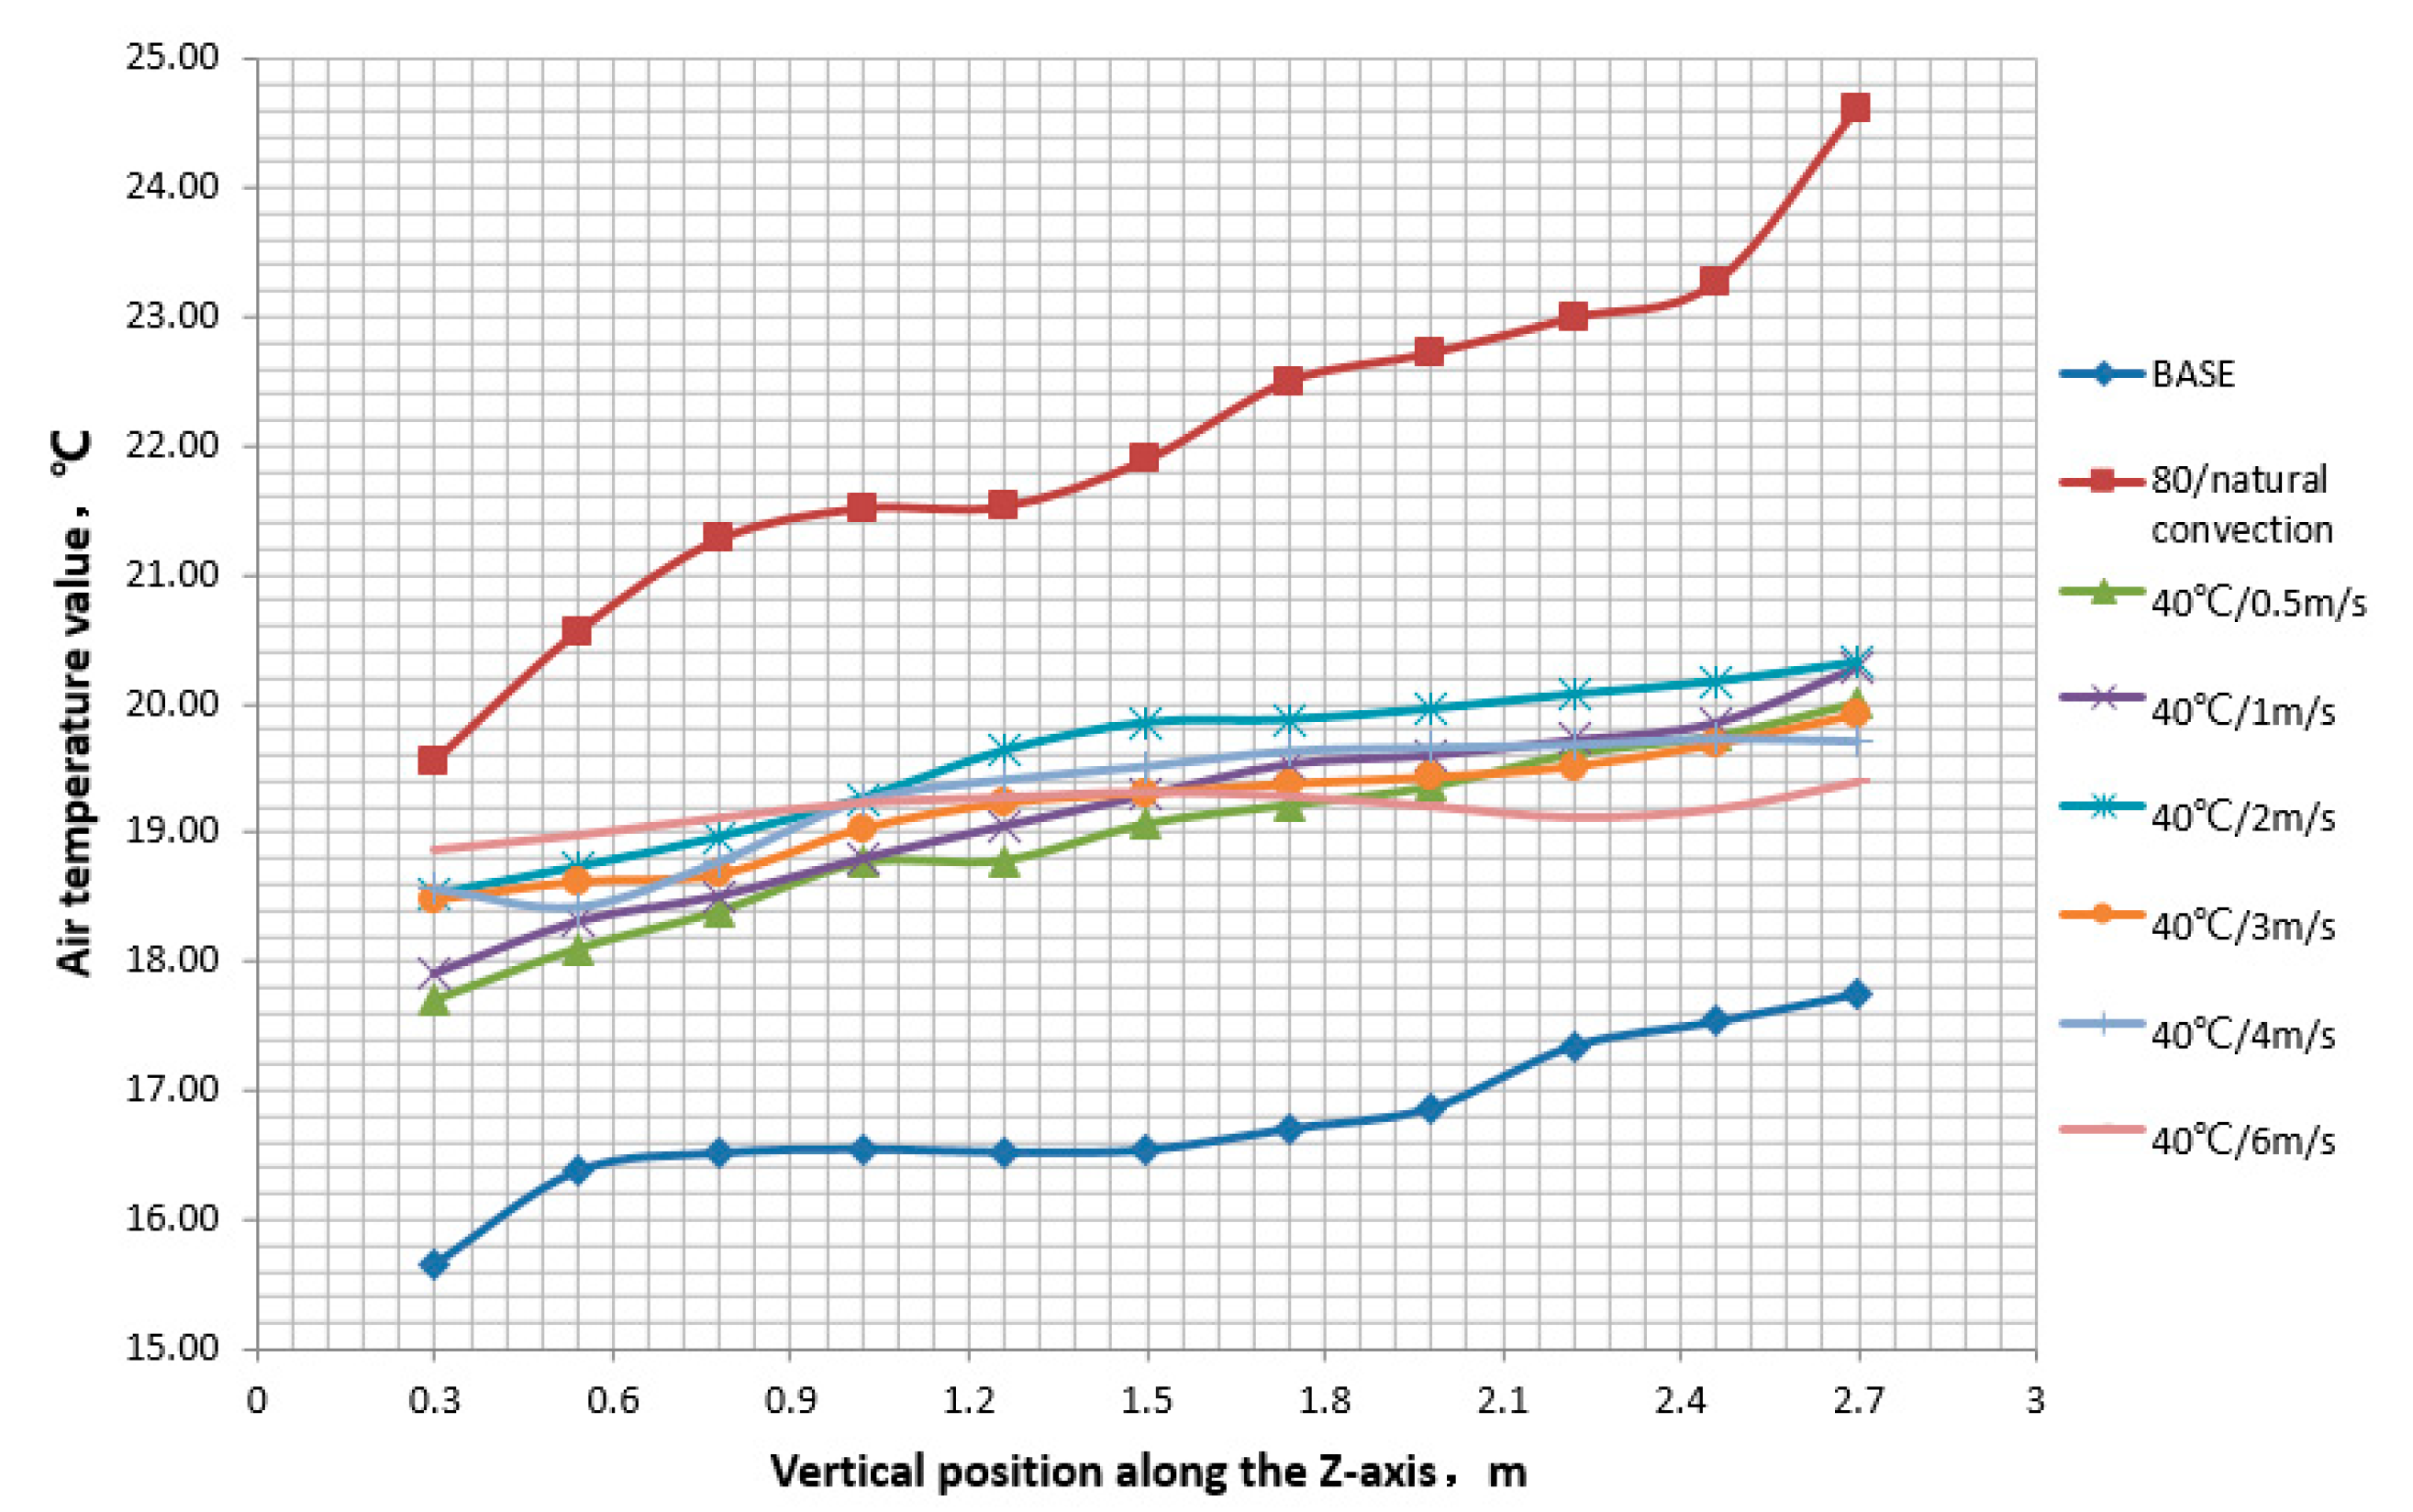
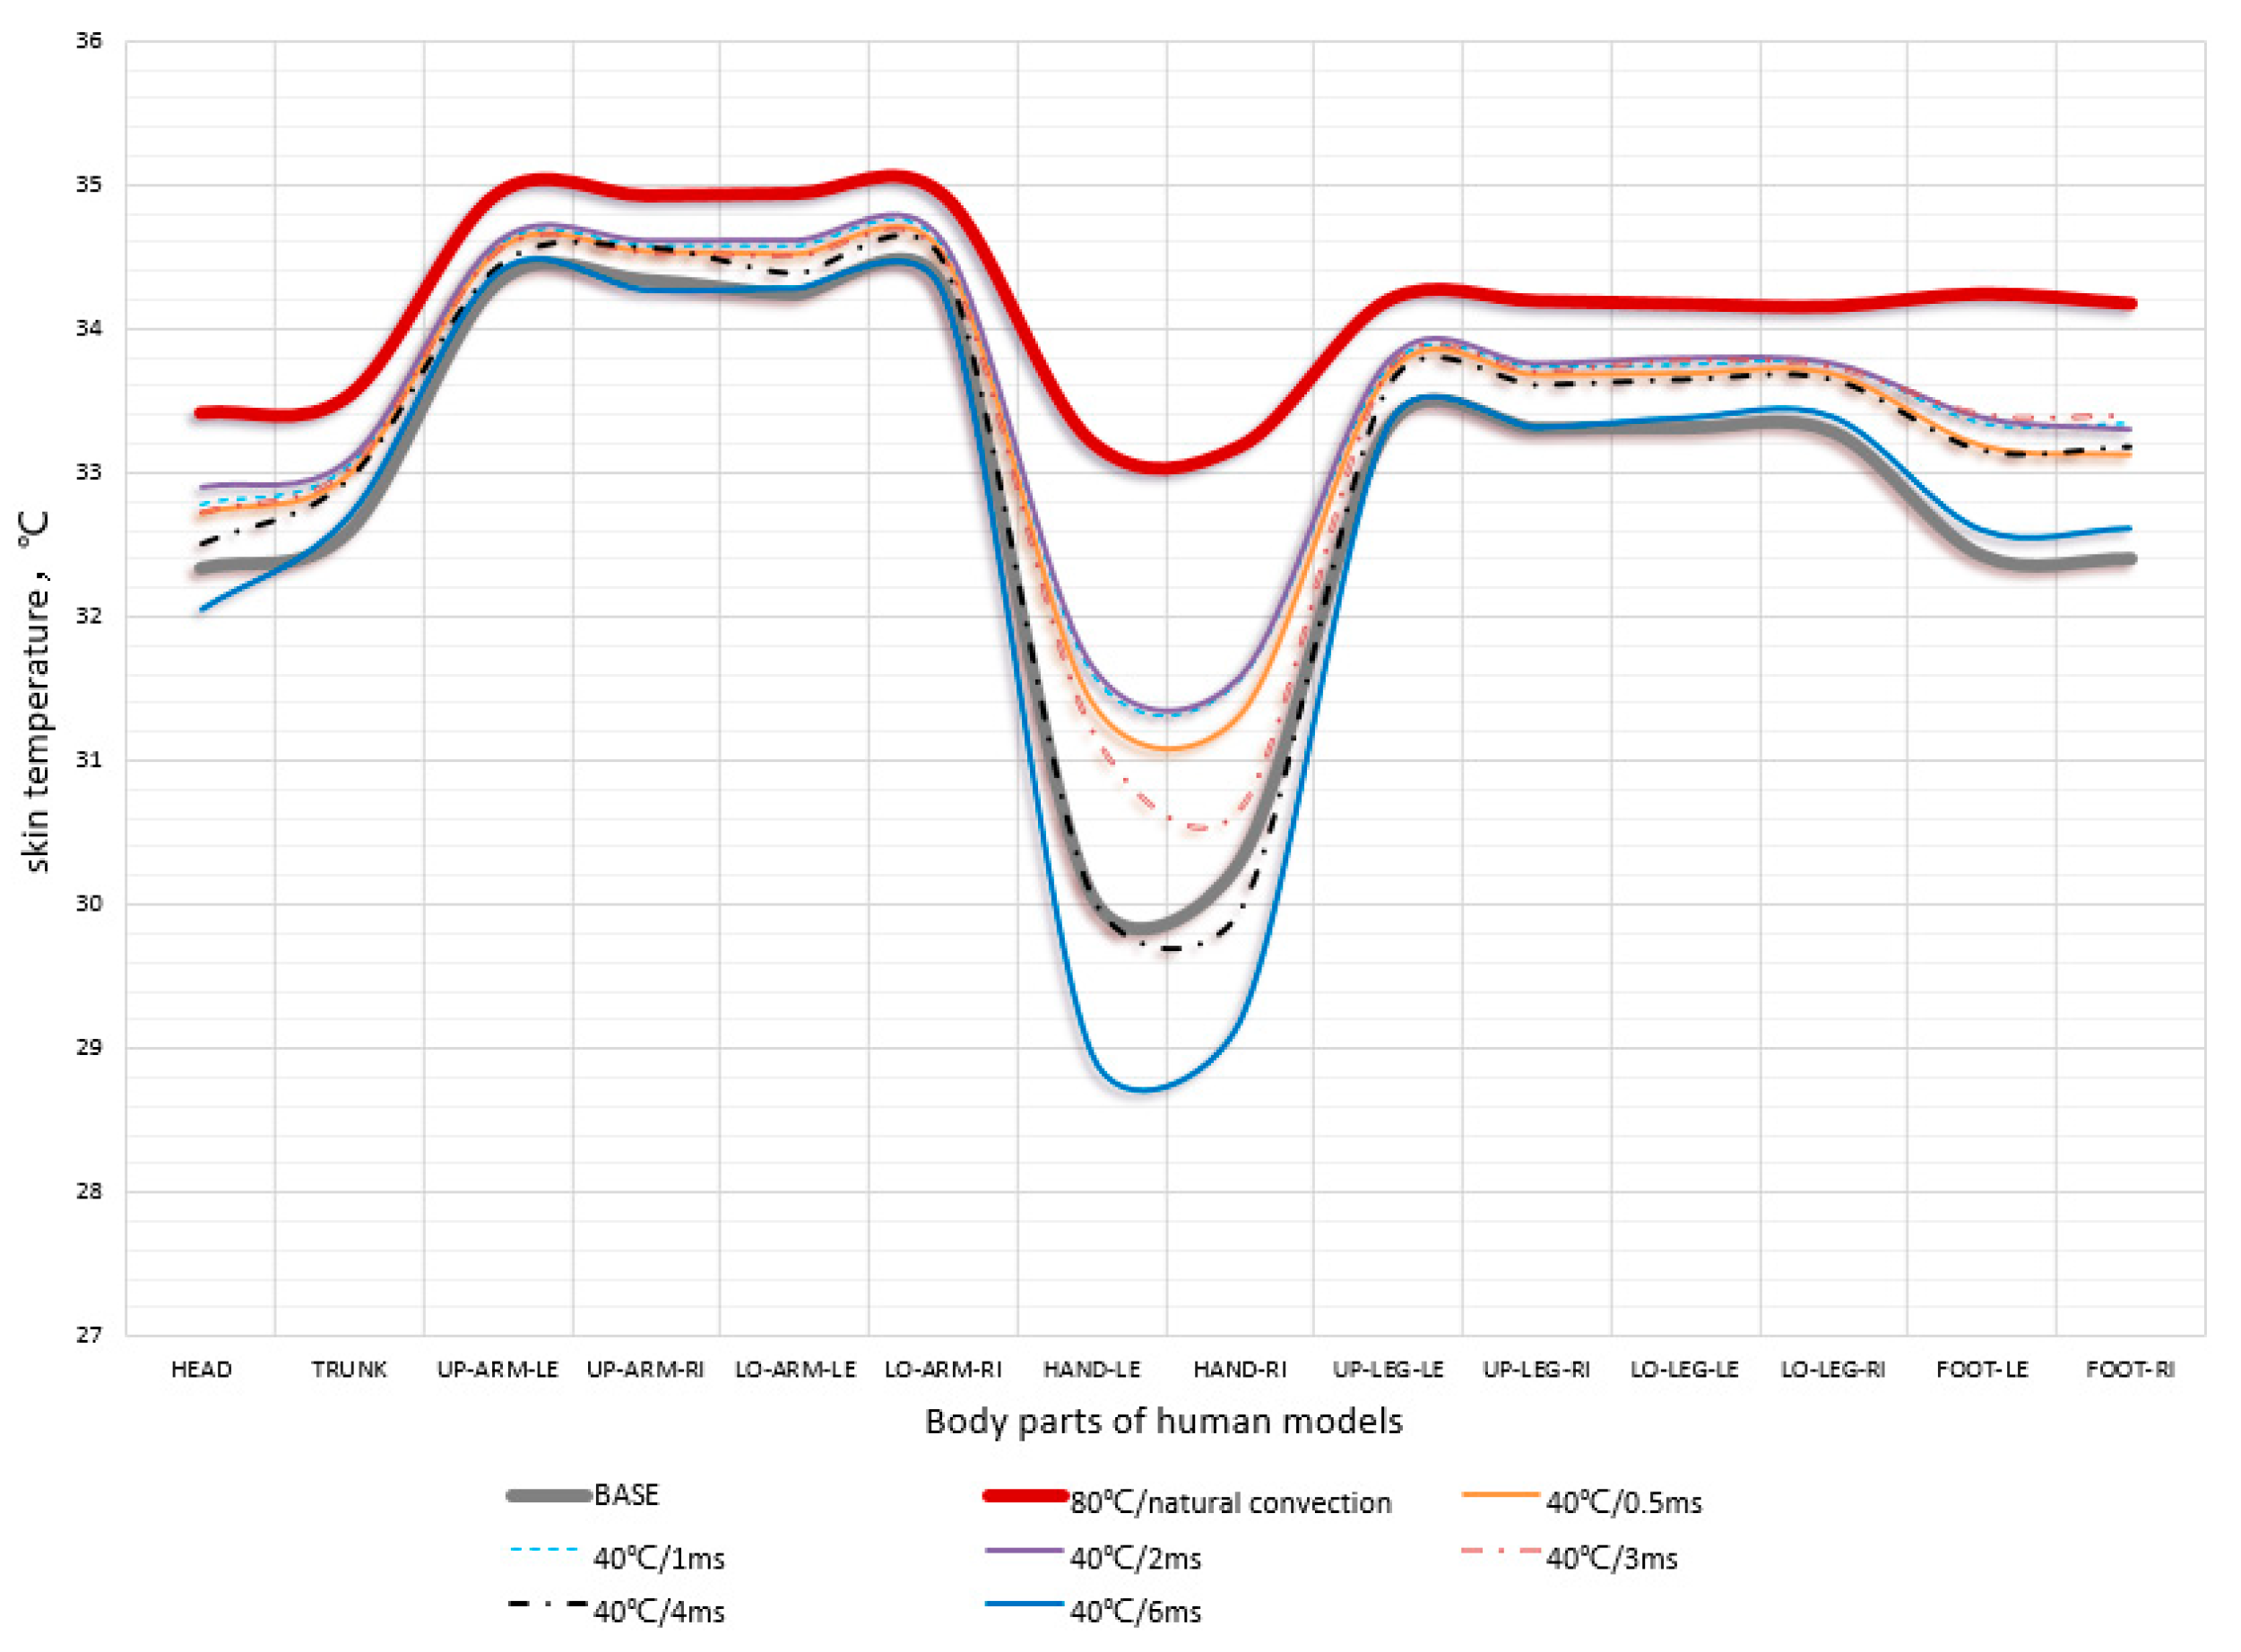
Figure 17 shows the temperature distribution in the vertical direction under 8 operating conditions. It can be seen that without heating, the average indoor temperature is 16.76 ℃. When the water supply temperature is 80 ℃, under natural convection conditions, the average indoor temperature can reach 22.04 ℃. When using a low-temperature water radiator for heating, the inlet temperature is 40 ℃, and the average indoor temperature can reach 18.98~19.58 ℃. In terms of temperature gradient, the vertical temperature gradient of high-temperature natural convection heating is the largest, and a large amount of heat is concentrated above the heating room. When using lower temperature heating, the temperature gradient is significantly reduced. As the inlet wind speed of the radiator increases, the vertical temperature gradient is further reduced, ultimately reaching a basically uniform state (temperature gradient close to 0.2 ℃/m). Increasing the inlet wind speed of the radiator, the heat dissipation of the radiator continues to increase, but the average indoor temperature does not maintain the same growth trend. It reaches its maximum value at 2m/s, and when the wind speed continues to increase, it shows a decreasing trend. There are two reasons: firstly, the increase in heat dissipation of the radiator is limited with the increase of wind speed; secondly, the indoor air flow intensifies, and the intensity of convective heat transfer between the indoor and wall surfaces strengthens, especially for the partition walls between low-temperature environments, which improve heat transfer capacity and lead to further increase in heat loss.
As shown in
Figure 18, when the water supply temperature of the radiator is 40 ℃, as the inlet wind speed increases, the surface temperature of the human body first increases and then decreases. At a speed of 3m/s, it basically reaches a high value. Continuing to increase the wind speed, as the indoor convection intensity further increases, the surface temperature of the human body will decrease. Among them, the hands without clothing coverage and the feet farthest from the heart position have larger fluctuations in average skin temperature with outdoor environmental changes. The temperature of the skin on the head and hands without clothing coverage is lower than that without heating when the wind speed is above 3m/s. This indicates that although forced convection measures can increase the heat dissipation of the radiator, their contribution to indoor human thermal comfort does not always have a positive effect. After the wind speed reaches a certain level, the heat dissipation of the radiator increases, but the skin temperature of the human body decreases, and the thermal comfort effect deteriorates.
4.3. Comparative Study on Low Temperature Heating Effects of Floor Radiation and Radiators
This article compares the effects of low-temperature heating with convection radiators and floor radiation heating, and studies the differences in the thermal physiological effects of the two heating methods on the human body. Compare heating conditions with indoor average temperatures close to each other. The main research conditions are listed in
Table 6.
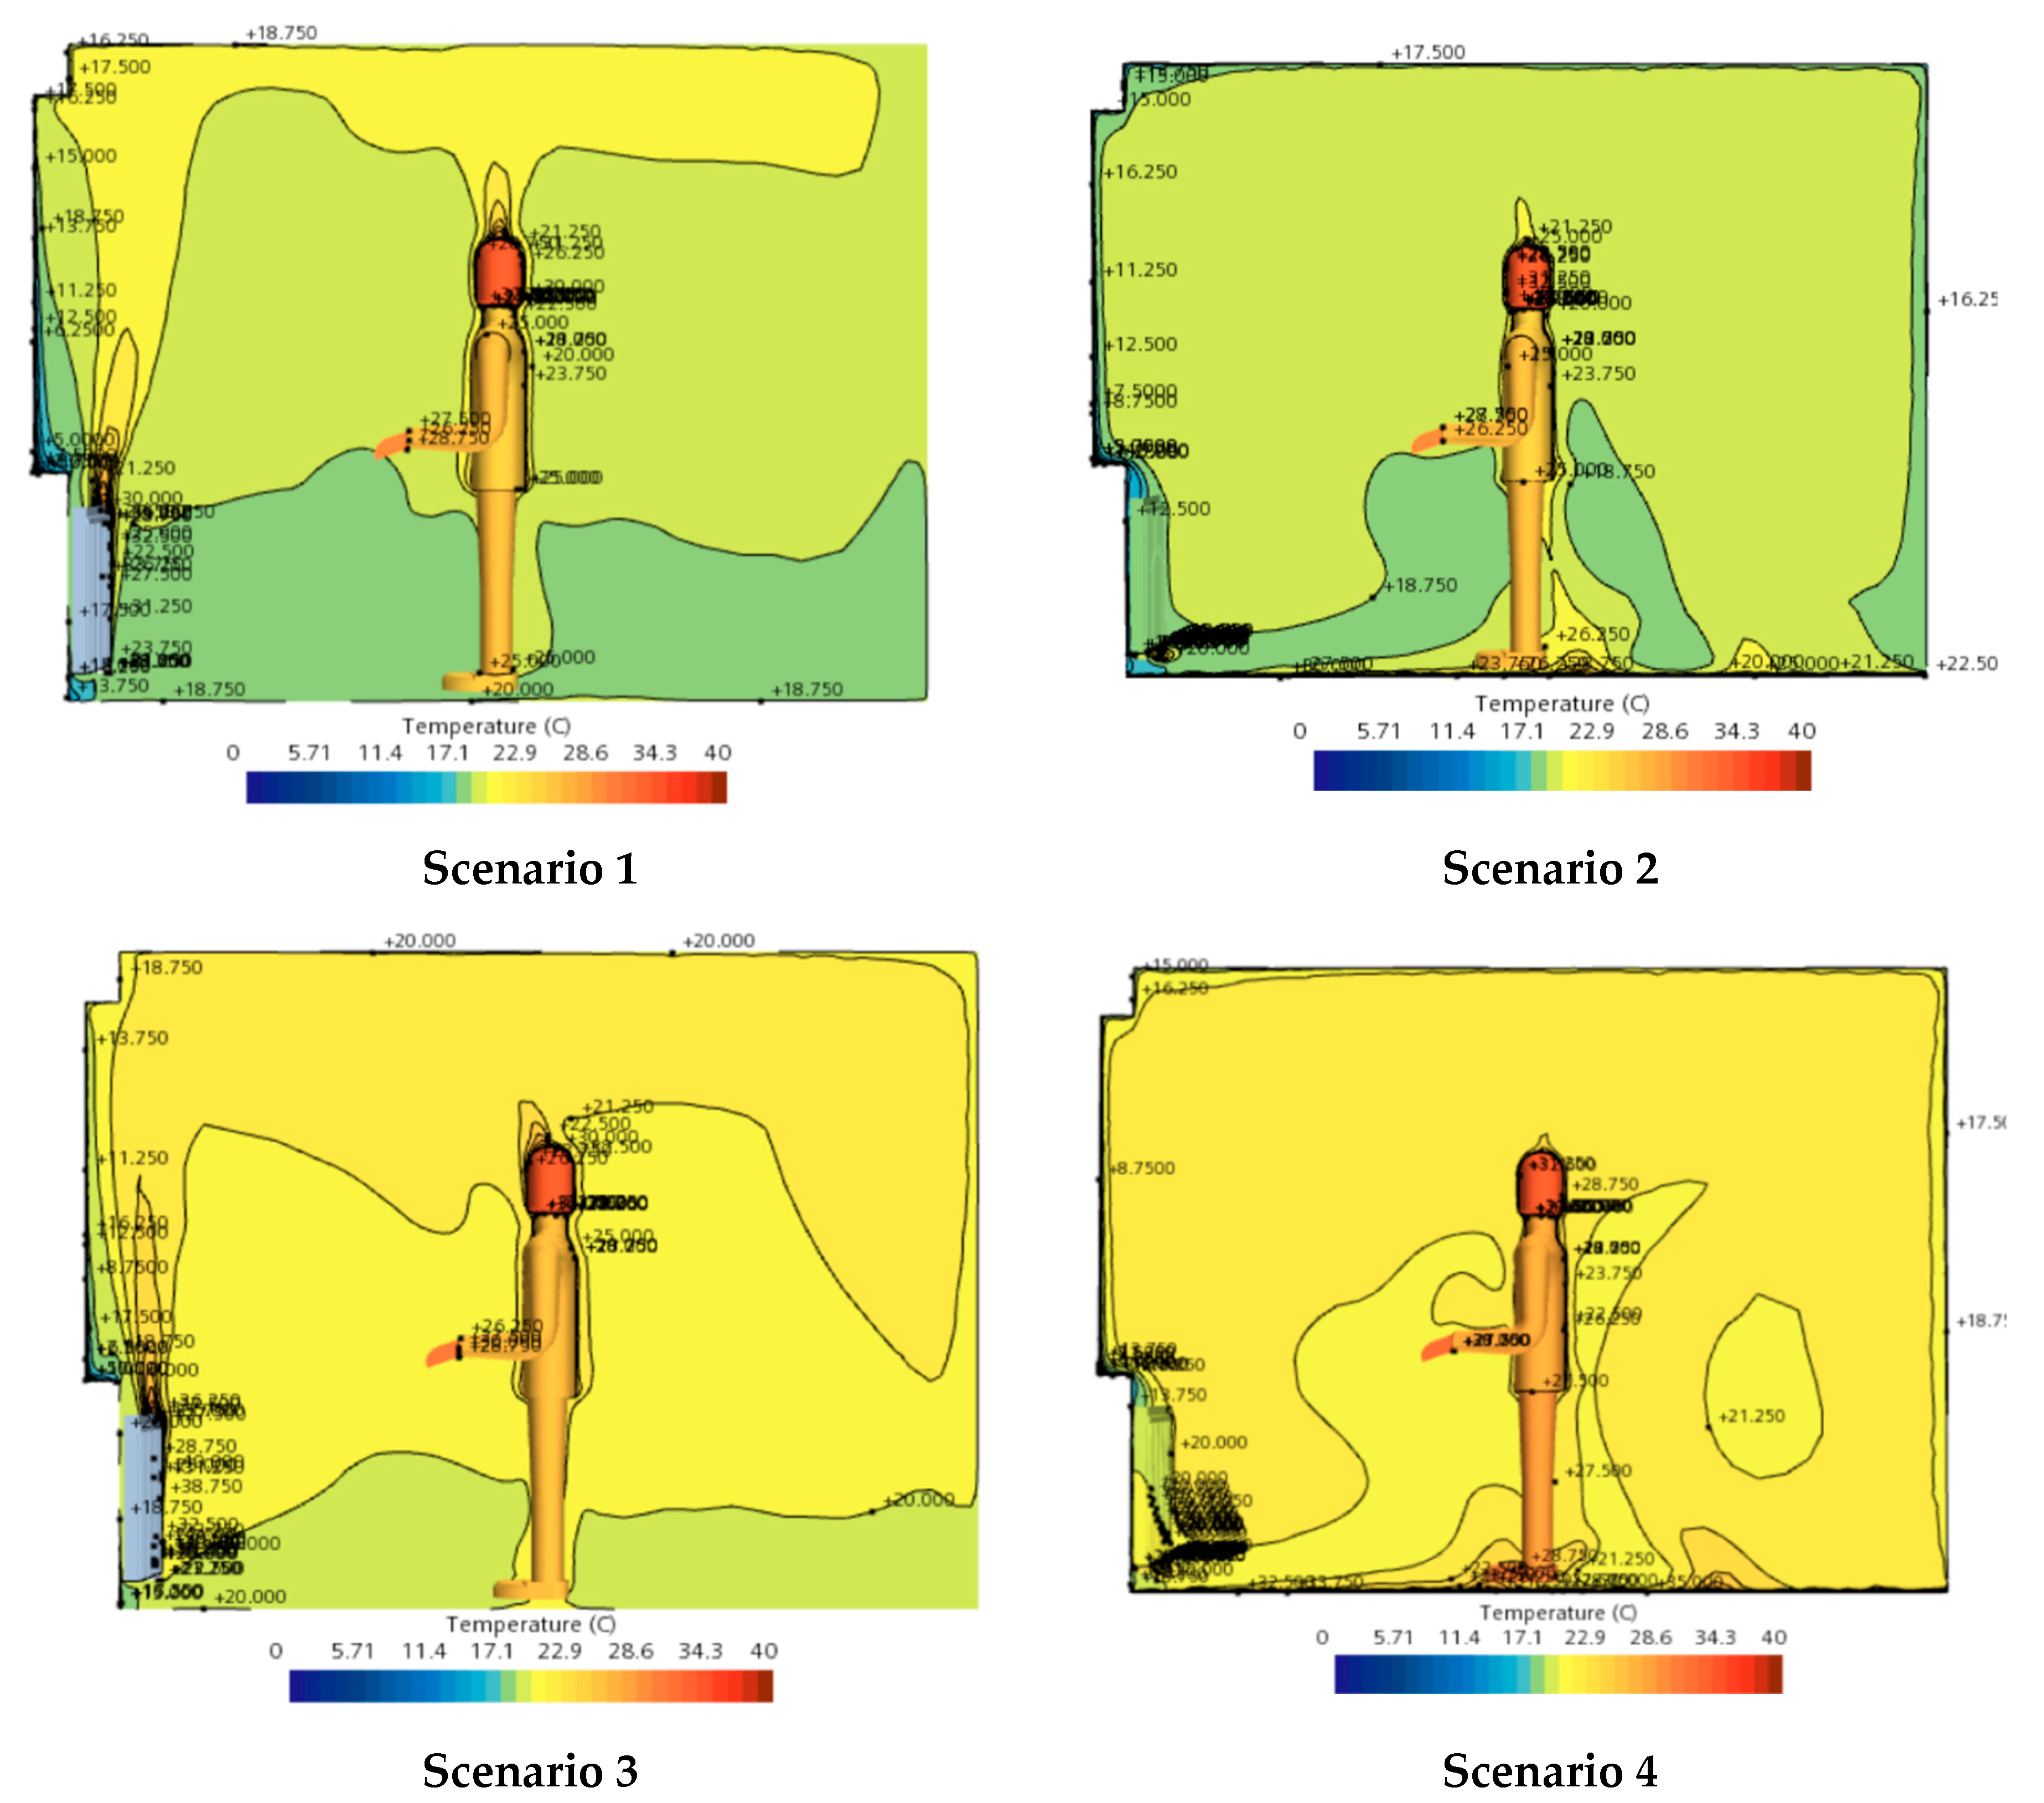
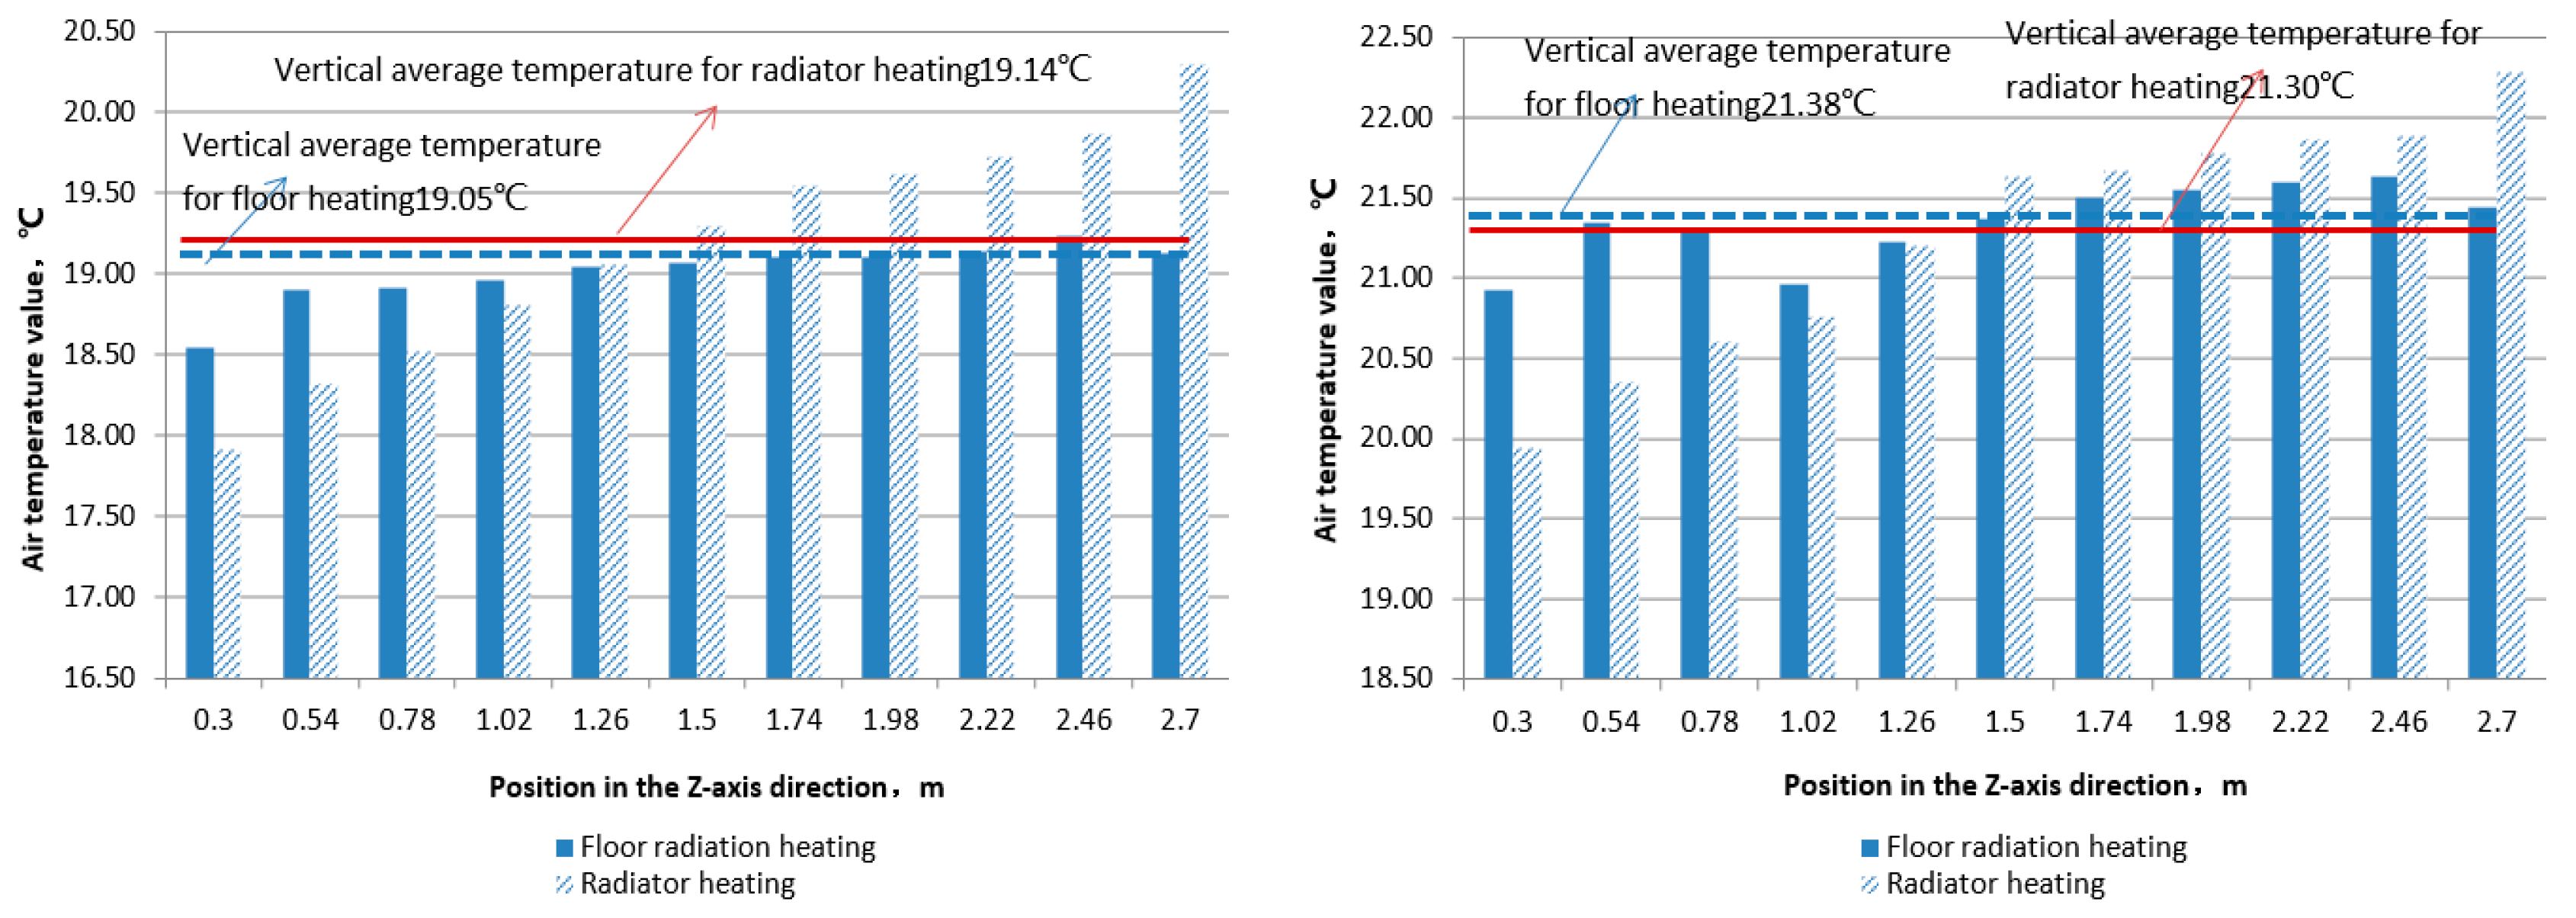
Figure 19 and
Figure 20 respectively present the temperature distribution of indoor vertical sections under four comparative operating conditions in the form of temperature cloud maps and data statistical graphs. Research has shown that there is a significant difference in indoor temperature gradient between radiator heating and floor radiation heating when the average indoor temperature is close. The top enrichment effect of hot air in radiator convection heating is significant, with an average vertical temperature gradient of 0.99 ℃/m and an average vertical temperature gradient of 0.243 ℃/m for floor radiation heating.
In the above two cases, the indoor reference point temperature is as follows:
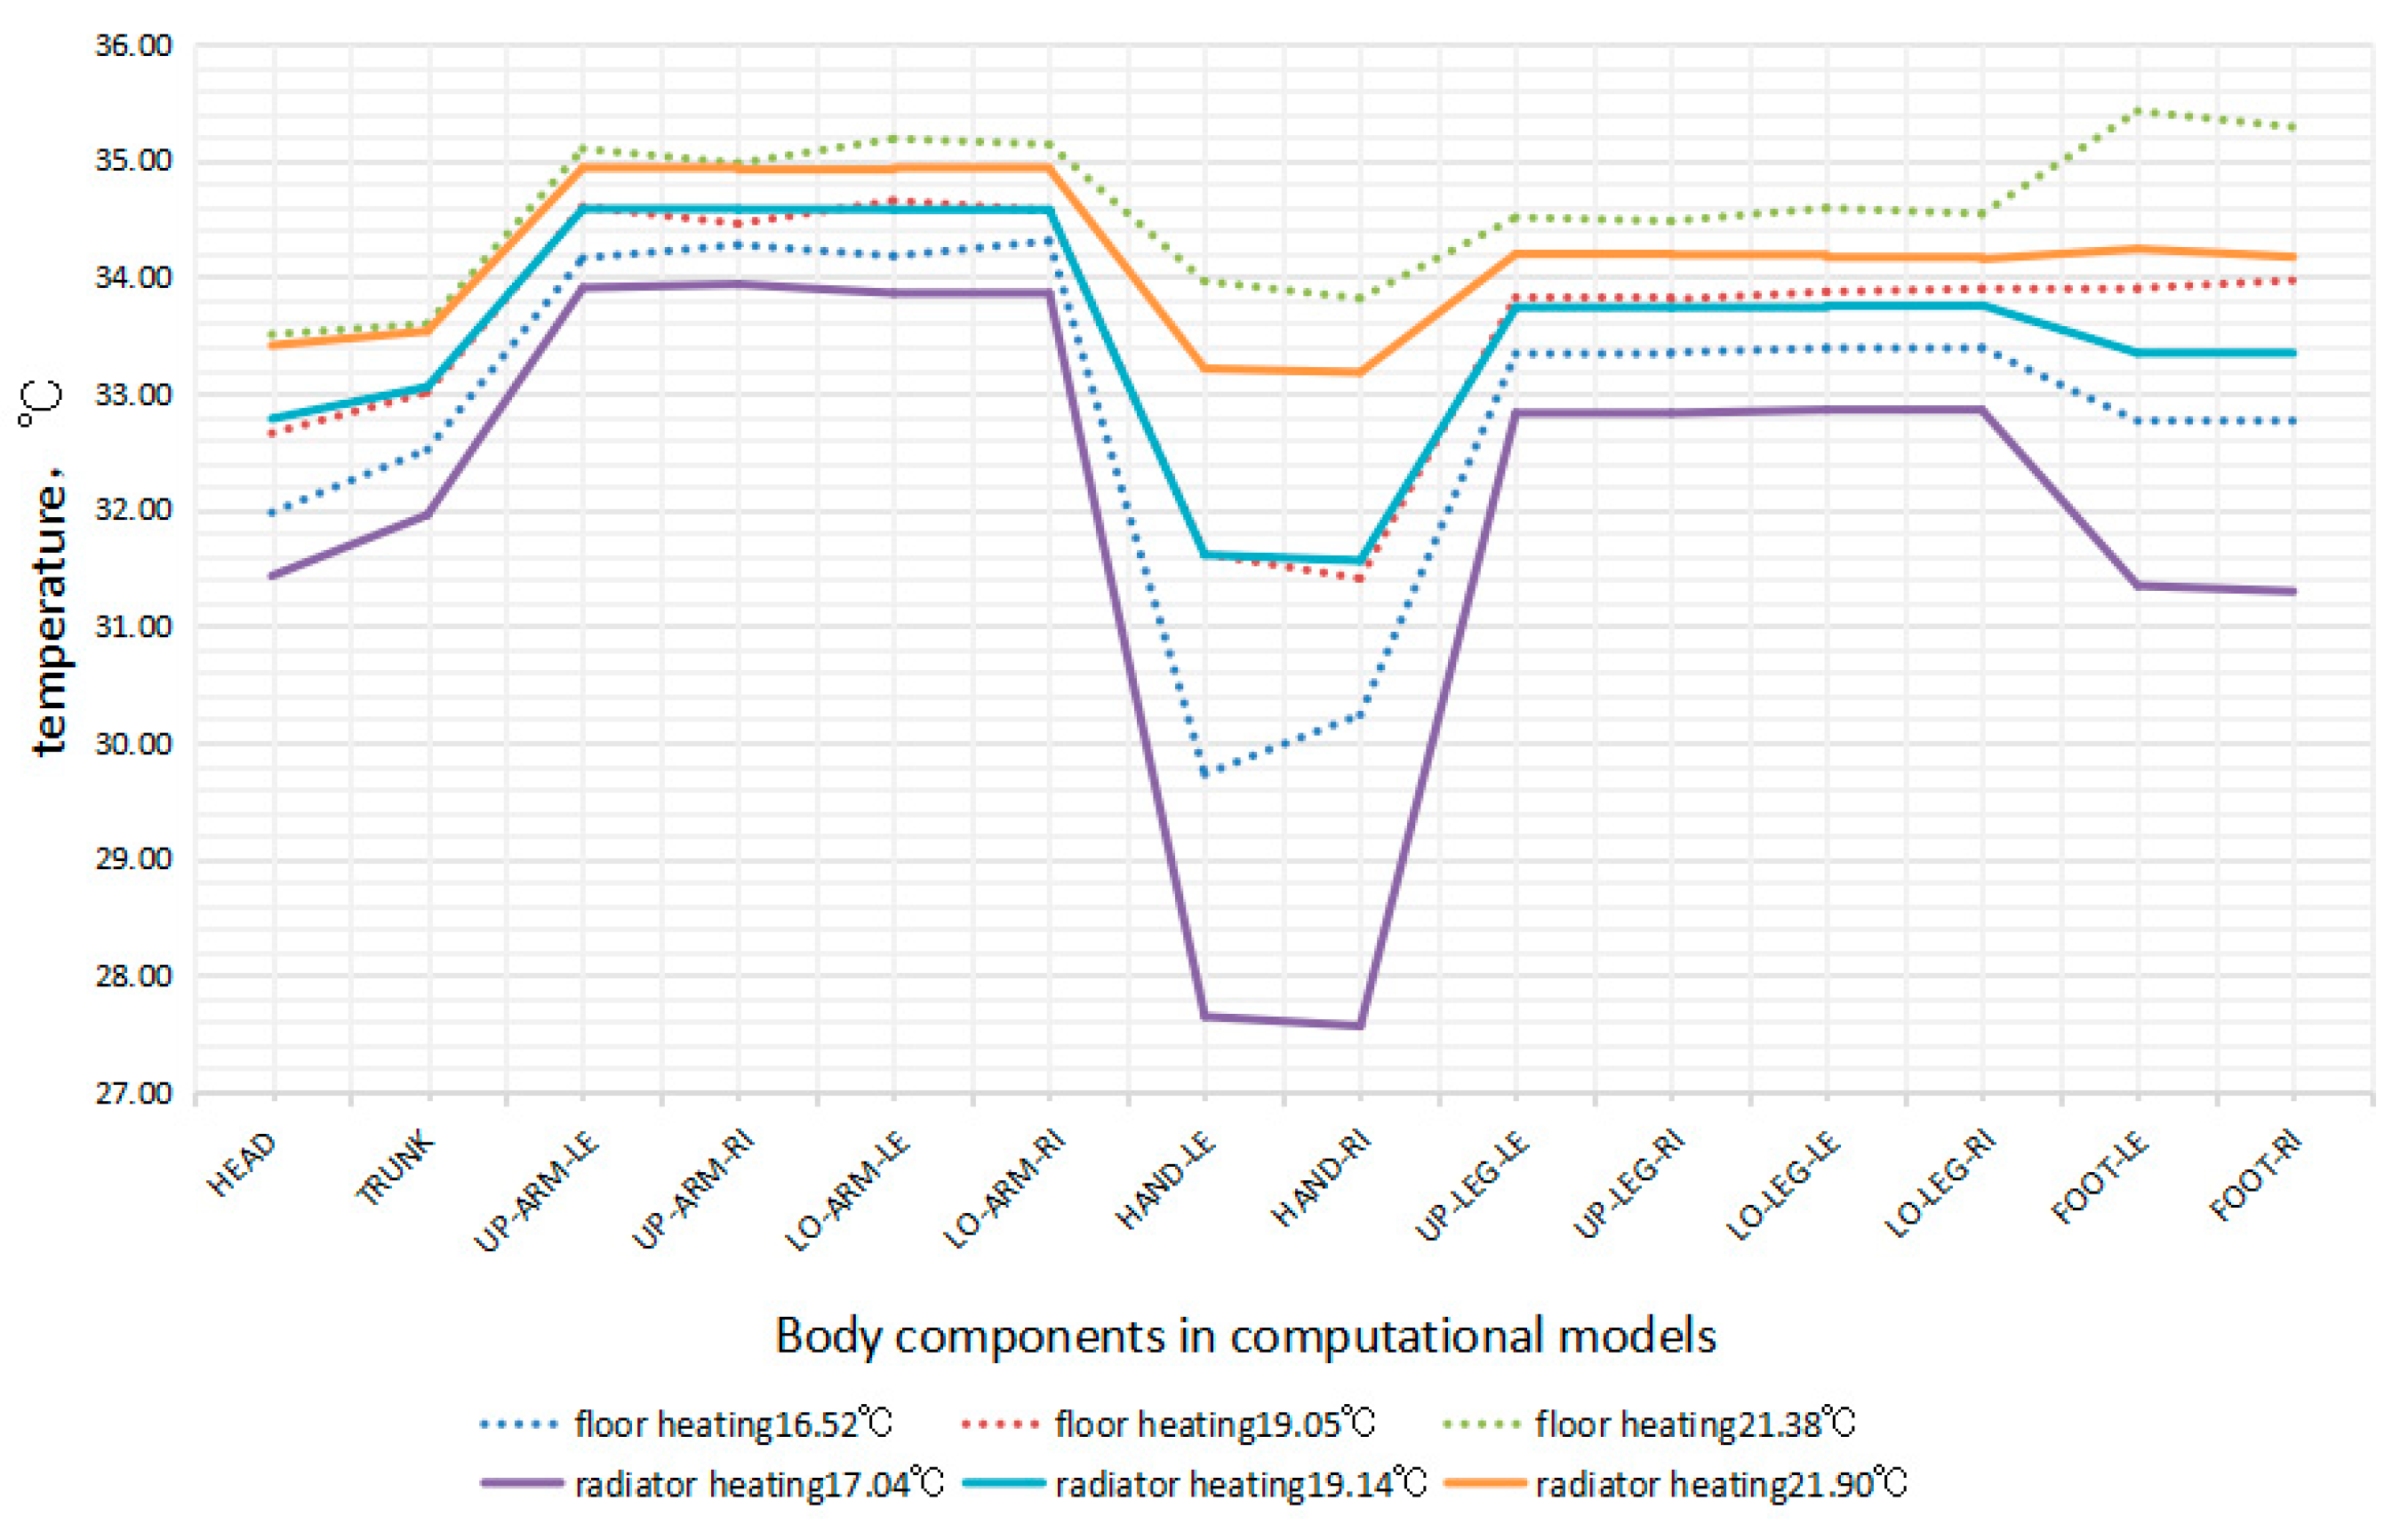
Figure 20 shows the comparison of skin temperatures in various parts of the human body using convective radiators and floor radiation heating under three conditions of average indoor temperature of about 17 ℃, 19 ℃, and 21 ℃. It can be seen that when the indoor temperature is below 18 ℃ and the average indoor temperature is close, the skin temperature of various parts of the human body under floor radiation heating is significantly higher than that under radiator heating. As the indoor temperature further increases, the temperature of the human skin gradually approaches. The difference in skin temperature of human hands is most significant between the two heating modes. As the indoor temperature increases, the skin temperature change of radiator heating is greater than that of floor radiation heating. This indicates that when the indoor temperature is lower, the heating effect of radiator is worse, and the skin temperature of the human body is lower. Overall, the skin temperature of floor radiation heating is higher than that of radiator heating. The sensitivity of different parts of the human body to the two technical solutions varies significantly, and the difference in skin temperature between the hands and feet best reflects the difference in the effects of these two technical solutions on human thermal comfort. When the indoor temperature exceeds 19 ℃, the difference in skin temperature between the two heating methods is not significant when the average indoor temperature is similar. The skin temperature of the human feet under floor radiation heating is significantly higher than that under radiator heating. Research has shown that after using forced convection measures to improve the low-temperature thermal performance of radiators, compared with floor radiation heating under similar indoor temperature conditions, when the indoor temperature is higher than 20 ℃, the two schemes have similar skin temperatures in various parts of the human body, and the overall thermal comfort is comparable.
5. Research Conclusions
This article couples human metabolic factors and heating environmental factors, and uses a 57 node human thermal physiological model based on STAR CCM+ platform to study the heating effect of radiators. This article evaluates the effectiveness of forced convection radiator heating from the perspective of local thermal comfort of the human body, and demonstrates the feasibility of this scheme by comparing it with floor radiation heating. It provides a way to objectively calculate and directly quantify the effect of heating equipment on human thermal physiological parameters.
The research results indicate that when the inlet air velocity speed is low, due to uneven mixing of indoor air distribution, there is a significant temperature stratification phenomenon. When the wind speed is less than 3.5m/s, the increase in wind speed has little effect on the thermal comfort index of the head. The different air supply methods have a significant impact on the thermal comfort of the human head and hands. The use of bottom side air supply provides better thermal comfort compared to top air supply.
As the wind speed increases, the surface temperature of the human body first increases and then decreases. At a speed of 3m/s, it basically reaches a high value. Continuing to increase the wind speed, as the indoor convection intensity further increases, the surface temperature of the human body will decrease, leading to a decrease in thermal comfort.
It can be seen from the indoor vertical temperature distribution map that the top enrichment effect of hot air in convection radiator heating is significant, and the temperature distribution of floor radiation heating is more uniform. After using forced convection measures to improve the low-temperature thermal performance of radiators, compared with floor radiation heating under similar indoor temperature conditions, when the indoor temperature is higher than 20 ℃, the two schemes have similar skin temperatures in various parts of the human body, and the overall thermal comfort is comparable.
The guidance for product design from this study includes the following aspects: the widely used plate radiator can be converted into a forced convection radiator by adding turbulence fans, with a recommended wind speed of 2.5m/s-3m/s. The heating effect of the equipment using the lower horizontal air outlet scheme is generally better than the upper vertical air outlet scheme. Due to the large temperature gradient in the heating room of the convection type low-temperature heating radiator, high-temperature air gathers at the top, so the suitable room height should not be too high. Due to the mixing effect of forced convection measures, the temperature gradient can be reduced for buildings with a floor height of less than 3.5 meters. Therefore, this type of radiator is suitable for use in residential buildings.
Author Contributions
Conceptualization, Z.L. and Z.L.; methodology, L.Z.; software, J.L.; validation, W.X..; investigation, Z.L.; resources, Z.L.; data curation, W.X.; writing—original draft preparation, Z.L.; writing—review and editing, J.L.; visualization, Z.L.; supervision, W.X.; project administration, L.Z.; funding acquisition, Z.L. All authors have read and agreed to the published version of the manuscript.
Funding
This research was financially supported by the National Key Technology R&D program in the 13th Five Year Plan of Research on Low-Cost Clean Energy Heating and Heat Storage Technology in Villages and Towns (No. 2018YFD1100700) (Subject name: Study on Solar Heating and Heat Storage Technology in Rural Area (2018YFD1100701)).
Data Availability Statement
No new data were created or analyzed in this study. Data sharing is not applicable to this article.
Conflicts of Interest
The authors declare no conflict of interest.
References
- ASHRAE. ANSI/ASHRAE Standard 55-2010:Thermal Environment Conditions for Human Occupancy[S] . Atlanta , GA ,American Society of Heating, Ventilating and Air Conditioning Engineers, Inc,2011.
- ASHRAE. ANSI/ASHRAE55-2004. ASHRAE standard:thermal environmental conditions for human occupancy[S] .Atlanta(USA):American Society of Heating, Refrigerating and Air conditioning Engineers Inc,2004.
- J. Stolwijk, A Mathematical Model of Physiological Temperature Regulation (NASA Contractor Report, New Haven, Connecticut 06510, 1971. http://ntrs.nasa.gov/archive/nasa/casi.ntrs.nasa.gov/19710023925.pdf.
- D. Fiala, G. Havenith, P. Brode, B. Kampmann, G. Jendritzky, UTCI-Fiala multi- € node model of human heat transfer and temperature regulation, Int. J. Biometeorol. 56 (2012) 429e441.
- K. Parsons, Human Thermal Environments:The Effects of Hot, Moderate and Cold Environments on Human Health, Comfort and Performance, second ed., Taylor&Francis, London & New York, 2003.
- M. Taleghani, M. Tenpierik, S. Kurvers, A. van den Dobbelsteen, A review into thermal comfort in buildings, Renew. Sustain. Energy Rev. 26 (2013) 201e215.
- D. Fiala, K.J. Lomas, M. Stohrer, Computer prediction of human thermoregulatory and temperature responses to a wide range of environmental conditions, Int. J. Biometeorol. 45 (2001) 143e159. http://www.ncbi.nlm.nih.gov/pubmed/11594634.
- Schellen, L., Loomans, M. G. L. C., Kingma, B. R. M., de Wit, M. H., Frijns, A. J. H., & van Marken Lichtenbelt, W. D. (2013). The use of a thermophysiological model in the built environment to predict thermal sensation: Coupling with the indoor environment and thermal sensation. Building and Environment, 59, 10–22. [CrossRef]
- van Hoof J, Mazej M, Hensen J. Thermal comfort: research and practice. Front Biosci 2010;15:765e88. [CrossRef]
- 10. Meeh, K. 1879. “Oberflächenmessung des menschlichen Korpers”, J. Biol., 15, pp. 428-458.
- 11. DuBois, D. and DuBois, E.F. 1915. “Clinical Calorimetry: Tenth paper, A formula to estimate the approximate surface area if height and weight be known”, Arch. Intern. Med., 17, pp. 863-871.
- Aschoff, J. and Wever, R. 1958. “Kern und Schale im Wärmehaushalt des Menschen”, Die Naturwissenschaften, 45, Nr. 20, pp. 477-485.
- Stolwijk, J.A.J. and Hardy, J.D. 1966. “Temperature regulation in man - A theoretical study”, Pflüger Arch., 307, pp. 129-162.
- Stolwijk, J.A.J. 1971. “A mathematical model of physiological temperature regulation in man”, NASA Contractor Report, NASA CR-1855.
- Benzinger, T.H., Kitzinger, C., and Pratt, A.W. 1963. “The Human Thermostat”, In: Temperature. Its Measurement and Control in Science and Industry, 3, Part 3, Biology and Medicine, Hardy, J.D. (Editor).
- Nadel, E.R. 1969. “The role of peripheral thermoreceptors in the integrated thermoregulatory response in resting and excercising man”, Dissertation, Univ. Calif., Santa Barbara.
- [Zhou Hao. Experimental Study on Factors Influencing Human Skin Temperature [D]. Xi’an University of Architecture and Technology, 2014.
- Ploskić, A., Wang, Q., & Sadrizadeh, S. (2019). A holistic performance evaluation of ventilation radiators – An assessment according to EN 442-2 using numerical simulations. Journal of Building Engineering, 25(May), 100818. [CrossRef]
- A. Ploskić, S. Holmberg, Low-temperature baseboard heaters with integrated air supply – An analytical and numerical investigation, Building and Environment. 46 (1) (2011) 176-186.
- "Ergonomics of the thermal environment - Analytical determination and interpretation of thermal comfort using calculation of the PMV and PPD indices and local thermal comfort criteria (ISO 7730:2005)".UNE-EN ISO 7730-2006.2006.
Figure 1.
View of climate laboratory.
Figure 1.
View of climate laboratory.
Figure 2.
CFD model based on climate laboratory.
Figure 2.
CFD model based on climate laboratory.
Figure 3.
Interior Side Grid Details.
Figure 3.
Interior Side Grid Details.
Figure 4.
Key Part Details of the Model.
Figure 4.
Key Part Details of the Model.
Figure 5.
Human multi node TCM model of STAR-CCM+ platform.
Figure 5.
Human multi node TCM model of STAR-CCM+ platform.
Figure 6.
Comparison of head temperature.
Figure 6.
Comparison of head temperature.
Figure 7.
Comparison of torso temperature.
Figure 7.
Comparison of torso temperature.
Figure 8.
Comparison of left upper arm temperature.
Figure 8.
Comparison of left upper arm temperature.
Figure 9.
Comparison of left hand temperature.
Figure 9.
Comparison of left hand temperature.
Figure 10.
Comparison of left upper leg temperature.
Figure 10.
Comparison of left upper leg temperature.
Figure 11.
Comparison of left foot temperature.
Figure 11.
Comparison of left foot temperature.
Figure 12.
Internal details of convective radiator. Main components: 1-Upper cover plate with strip seam air supply outlet; 2- Water supply manifold on radiator; 3- Heat dissipation fins longitudinally installed on the plate; 4-Eddy current generator;5- Disturbance fan; 6-Return water collection pipe; 7-Fresh air fan; 8-Lower cover plate with return air outlet; 9- Radiator metal convection cover; 10- Lower return air inlet of radiator.
Figure 13.
Temperature distribution of indoor air under different inlet wind speeds of radiators.
Figure 13.
Temperature distribution of indoor air under different inlet wind speeds of radiators.
Figure 14.
The effect of wind speed on human skin temperature.
Figure 14.
The effect of wind speed on human skin temperature.
Figure 15.
Air velocity distribution.
Figure 15.
Air velocity distribution.
Figure 16.
Temperature distribution.
Figure 16.
Temperature distribution.
Figure 17.
Indoor temperature gradient under different working conditions.
Figure 17.
Indoor temperature gradient under different working conditions.
Figure 18.
Comparison of human skin temperature under different working conditions.
Figure 18.
Comparison of human skin temperature under different working conditions.
Figure 19.
Temperature cloud map of floor radiation and convection radiator heating.
Figure 19.
Temperature cloud map of floor radiation and convection radiator heating.
Figure 20.
Vertical temperature distribution of floor radiation and radiator heating.
Figure 20.
Vertical temperature distribution of floor radiation and radiator heating.
Figure 21.
Distribution of local skin temperature in the human body under different working conditions.
Figure 21.
Distribution of local skin temperature in the human body under different working conditions.
Table 1.
Heat production benchmark for each muscle element.
Table 1.
Heat production benchmark for each muscle element.
| Segment |
LMUSC、SHIV
|
LMUSC, WORK
|
| Head |
2.0E-02 |
0.0 |
| Torso |
0.86 |
0.3 |
| Upper arm |
1.25E-02 |
2.0E-02 |
| Fore arm |
1.25E-02 |
2.0E-02 |
| Hand |
0.0 |
5.0E-03 |
| Thigh |
2.1E-02 |
0.18 |
| Lower leg |
1.4E-02 |
0.12 |
| Foot |
0.0 |
5.0E-03 |
Table 2.
Regression equation between human skin temperature and environmental temperature.
Table 2.
Regression equation between human skin temperature and environmental temperature.
| Head |
Upper arm |
Fore arm |
Hand |
Dorsum |
| y=0.06x+33.35 |
y=0.09x+32.69 |
y=0.11x+32.02 |
y=0.17x+30.53 |
y=0.20x+29.65 |
| Torso |
Abdomen |
Thigh |
Lower leg |
Foot |
| y=0.17x+30.68 |
y=0.05x+34.92 |
y=0.14x+30.43 |
y=0.13x+29.93 |
y=0.16x+31.19 |
| Average skin temperature:y=0.13x+31.35(Room average temperature:23℃、28℃、33℃、38℃) |
Table 3.
Four working conditions for analyzing indoor temperature distribution.
Table 3.
Four working conditions for analyzing indoor temperature distribution.
| Condition 1 |
The average skin temperature is 30.2 ℃, the heat dissipation of the radiator is 647.3W, and the inlet wind speed of the radiator is 0.2m/s. |
|
Condition2
|
The average skin temperature is 30.37 ℃, the heat dissipation of the radiator is 741.94W, and the inlet wind speed of the radiator is 0.8m/s |
|
Condition3
|
The average skin temperature is 30.6 ℃, and the heat dissipation of the radiator is 964.61W. The inlet wind speed of the radiator is 2.0m/s. |
|
Condition4
|
The average skin temperature is 30.61 ℃, and the heat dissipation of the radiator is 1097.74W. The inlet wind speed of the radiator is 3.0m/s. |
Table 4.
Comparison of human local skin temperature in different air supply modes.
Table 4.
Comparison of human local skin temperature in different air supply modes.
Table 5.
Analysis of low temperature heating scenarios for convective radiators.
Table 5.
Analysis of low temperature heating scenarios for convective radiators.
| Scenarios |
Condition Characteristics |
Scenario1
(BASE)
|
(Unheated) Inlet wind speed=0m/s, water inlet temperature=20 ℃, radiator flow rate=0g/s. |
| Scenario2 |
(High water supply temperature, natural convection) Inlet wind speed=0m/s, water inlet temperature=80 ℃, radiator flow rate=7g/s. |
| Scenario3 |
Inlet wind speed=0.5m/s, water inlet =40 ℃, radiator flow rate=7g/s. |
| Scenario4 |
Inlet wind speed=1m/s, water inlet =40 ℃, radiator flow rate=7g/s. |
| Scenario5 |
Inlet wind speed=2m/s, water inlet =40 ℃, radiator flow rate=7g/s. |
| Scenario6 |
Inlet wind speed=3m/s, water inlet =40℃, radiator flow rate=7g/s. |
| Scenario7 |
Inlet wind speed=4m/s, water inlet =40 ℃, radiator flow rate=7g/s. |
| Scenario8 |
Inlet wind speed=6m/s, water inlet =40 ℃, radiator flow rate=7g/s. |
Table 6.
Convection radiator heating and floor radiation heating conditions.
Table 6.
Convection radiator heating and floor radiation heating conditions.
| Scenario1 |
Condition 1: (Low temperature condition) Clothing thermal resistance=1.1clo. The inlet wind speed=1m/s, the inlet temperature=40 ℃, and the radiator flow rate=7g/s. |
| Scenario2 |
Comparison of condition 1: Floor radiation heating, floor temperature = 30 ℃, clothing thermal resistance=1.1clo. |
| Scenario3 |
Condition2: (Low temperature condition) Clothing thermal resistance=1.1clo. The inlet wind speed=3m/s, the inlet temperature=55 ℃, and the radiator flow rate=7g/s. |
| Scenario4 |
Comparison of condition 2: Floor radiation heating, floor temperature = 35℃, clothing thermal resistance=1.1clo. |
|
Disclaimer/Publisher’s Note: The statements, opinions and data contained in all publications are solely those of the individual author(s) and contributor(s) and not of MDPI and/or the editor(s). MDPI and/or the editor(s) disclaim responsibility for any injury to people or property resulting from any ideas, methods, instructions or products referred to in the content. |
© 2023 by the authors. Licensee MDPI, Basel, Switzerland. This article is an open access article distributed under the terms and conditions of the Creative Commons Attribution (CC BY) license (http://creativecommons.org/licenses/by/4.0/).
