2.1. Blockade of DAGLα decreases 2-AG levels in Endothelial Cells without altering AEA levels
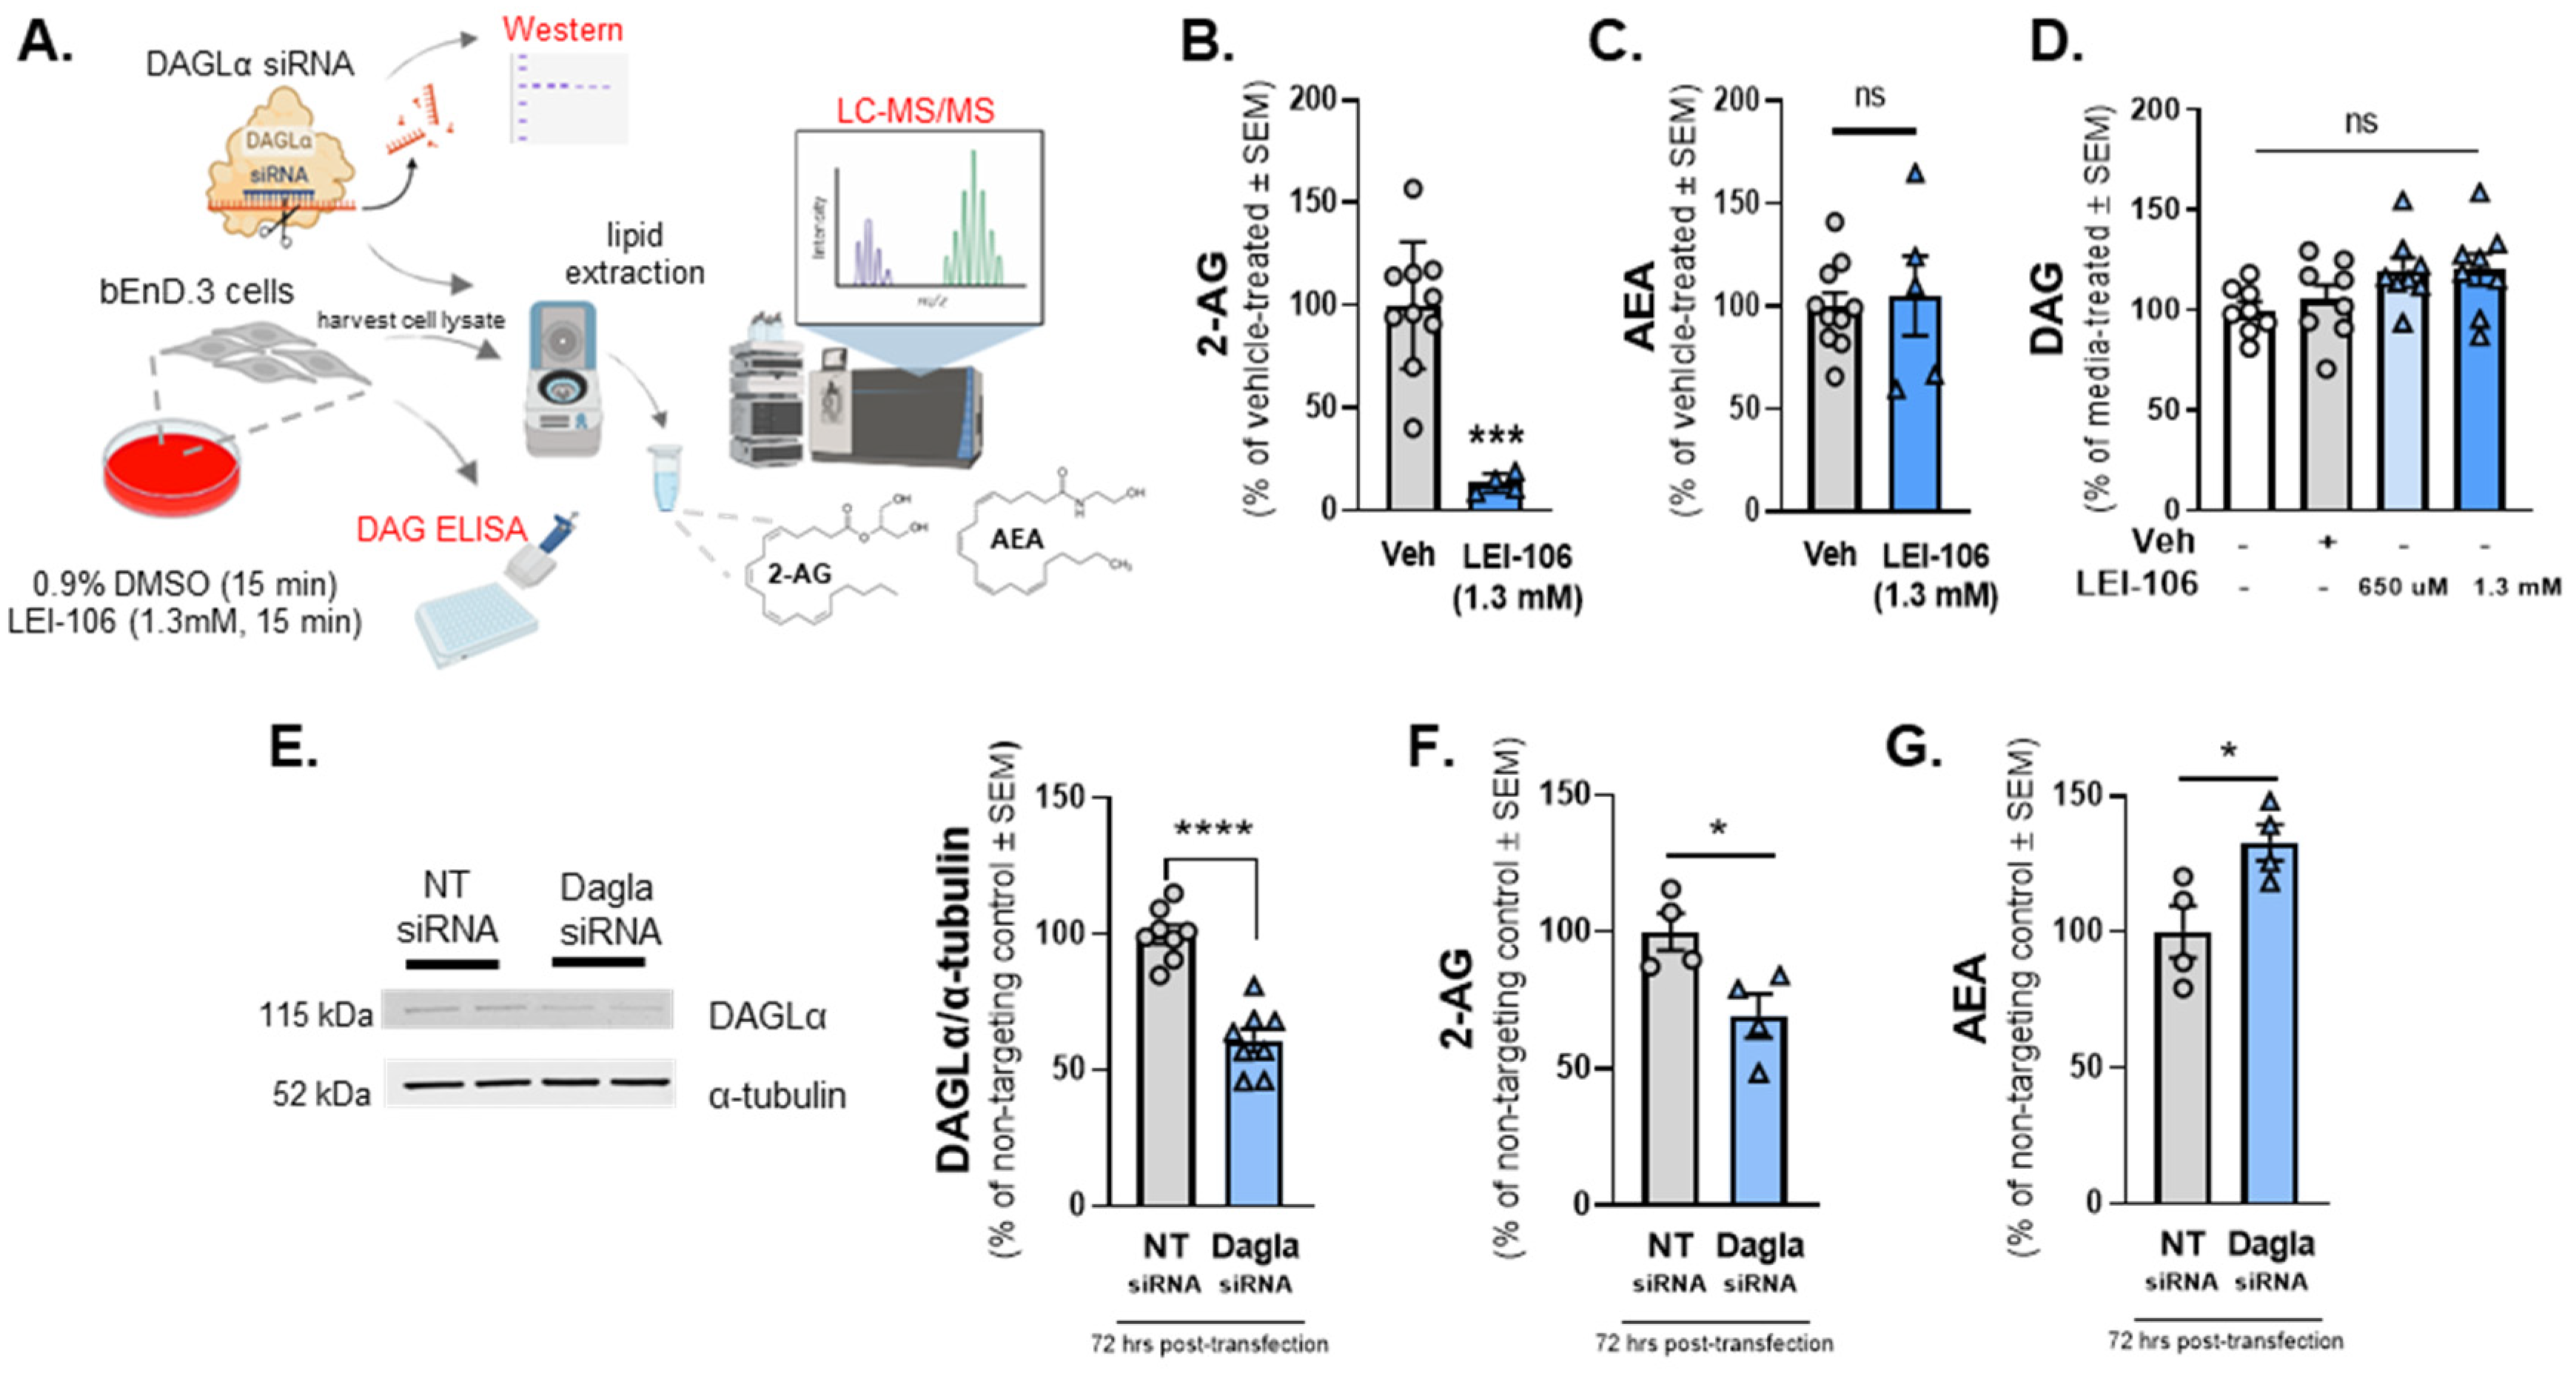
The first experiment was designed to determine whether cultured brain endothelial cells (bEnd.3) synthesized endocannabinoid lipids, 2-AG and AEA using LC-MS. Basal levels of 2-AG and AEA synthesized by bEnd.3 cells were determined to be 25.27 ± 2.89 pmol/g and 0.324 ± .02516 pmol/g, respectively. We next examined whether
blockade of DAGLα in the brain endothelial cells (bEnd.3) altered endocannabinoid lipid levels. Cells were treated with LEI-106 (1.3mM equimolar to the 40 mg/kg dose in vivo) for 15 min followed by a wash step before harvest by cell scraping (
Figure 1A). The cell pellet was lysed and subjected to LC-MS to measure 2-AG and AEA levels. The treatment of bEnD.3 cells with LEI-106 significantly reduced the level of 2-AG without changing to levels of AEA as compared to vehicle (
Figure 1B, C; LEI-106 vs. vehicle, 2-AG: p=0.001, as assessed by unpaired t-test, n=4-10 in each group; AEA: p=0.1984, as assessed by unpaired t-test, n=4-10 in each group), suggesting on-target actions of LEI-106 at DAGLα. It is noteworthy that 2-AG and AEA were detected in the pmol and fmole ranges, respectively, mirroring tissue observations of a roughly 1000x fold difference in concentration.
To determine if LEI-106 induced depletion in 2-AG was coupled to changes in DAG levels, quantitative ELISA was performed using the same experimental setting. No significant difference was observed between LEI-106 and vehicle-treated cells (
Figure 1D) (DAG level in LEI-106 (650 µM) group: 4.713±0.2946 ng/mL, DAG level in LEI-106 (1.3 mM) group: 4.701±0.327 ng/mL, DAG level in vehicle group: 4.259±0.485 ng/mL, LEI-106 (650 µM) vs. vehicle: p=0.4364; LEI-106 (1.3 mM) vs. vehicle: p=0.4626, as assessed by unpaired t-test, n=8/group).
The next investigation employed genetic manipulation of DAGLα to assess endocannabinoid levels in bEnd.3 cells to complement pharmacology with LEI-106. bEnD.3 cells were transiently transfected with siRNA targeting DAGLα or a scrambled, non-targeting control. Cells were lysed 72 h post-transfection and lysates subjected to Western blot to detect DAGLα expression. The transfection of DAGLα -targeting siRNA significantly decreased the detection of DAGLα protein as compared to the non-targeting control (
Figure 1E) (DAGLα siRNA vs. non-targeting control siRNA: p<0.0001, as assessed by unpaired t-test, n=8/group). siRNA transfected cells were assessed as well for levels of 2-AG (
Figure 1F) and AEA (
Figure 1G) via LC-MS. siRNA knock down of DAGLα in bEnD.3 cells caused significant reduction of 2-AG levels as compared to non-targeting control (
Figure 1F) (DAGLα siRNA vs. non-targeting control siRNA: p=0.0266, as assessed by unpaired t-test, n=4/group). However, AEA level in bEnd.3 cells was significantly increased after DAGLα siRNA transfection compared to non-targeting control, which suggests that the cells can compensate the loss of 2-AG by increasing AEA level (
Figure 1G) (DAGLα siRNA vs. non-targeting control siRNA: p=0.031, as assessed by unpaired t-test, n=4/group). Overall, these data support that brain endothelial cells have DAGLα, make detectable 2-AG under physiological conditions, and are sensitive to treatment with LEI-106 in vitro.
Figure 1.
The pharmacological or genetic manipulation of DAGLα decrease the level of 2-AG in bEnD.3 endothelial cells.
Figure 1.
The pharmacological or genetic manipulation of DAGLα decrease the level of 2-AG in bEnD.3 endothelial cells.
bEnD.3 endothelial cells were treated with LEI-106 (1.3 mM) or vehicle (0.9% DMSO in media) for 15 min, then subjected to LC-MS to measure 2-AG and AEA levels. In a separate set, level of DAG was quantified by ELISA. In the siRNA transfection experiments, bEnD.3 cells were transiently transfected with siRNA targeting DAGLα or a scrambled, non-targeting control, then harvested 72 hs post-transfection followed by a Western-blot to detect DAGLα expression. In a separate set of experiment, the cell pellet was lysed and subjected to LC-MS to measure 2-AG and AEA levels. (A) The schema of experimental setting. (B) The pharmacological blockade of DAGLα with LEI-106 significantly reduced the 2-AG level in endothelial cells (LEI-106 vs. vehicle, p=0.001, t(12)=5.447 as assessed by unpaired t-test). Data are shown as % of vehicle-treated ± SEM (n=4-10 in each group). *** denotes significantly different (p<0.001). (C) After LEI-106 treatment, the level of AEA was unchanged (LEI-106 vs. vehicle, p=0.7578, t(13)=0.3149 as assessed by unpaired t-test). Data are shown as % of vehicle-treated ± SEM (n=5-10 in each group). ns=non-significant. (D) The LEI-106 treatment did not significantly change the level of DAG as compared to vehicle control (LEI-106-650 µM vs. vehicle: p=0.4364, t(14)=0.8011; LEI-106-1.3 mM vs. vehicle: p=0.4626, t(14)=0.7553 as assessed by unpaired t-test). Data are presented as % of media-treated ± SEM (n=8/group). ns=non-significant. (E) Representative image showing the expression of DAGLα with α-tubulin as loading control in bEnd.3 cell lysate harvested72 h after siRNA transfection. The transfection of DAGLα -targeting siRNA significantly reduced detection of DAGLα protein as compared to the non-targeting control (DAGLα siRNA vs. non-targeting control siRNA: p<0.0001, t(14)=7.227, as assessed by unpaired t-test). Data are shown as % of non-targeting control ± SEM (n=8/group). **** denotes significantly different (p<0.0001). (F) siRNA knock down of DAGLα in bEnD.3 cells significantly reduced 2-AG levels as compared to non-targeting control (DAGLα siRNA vs. non-targeting control siRNA: p=0.0266, t(6)=2.919, as assessed by unpaired t-test). Data are shown as % of non-targeting control ± SEM (n=4/group). * denotes significantly different (p<0.05). (G) AEA level of bEnd.3 cells was significantly increased after DAGLα siRNA transfection compared to non-targeting control, suggesting the presence of a compensatory mechanism after the loss of 2-AG (DAGLα siRNA vs. non-targeting control siRNA: p=0.031, t(6)=2.804, as assessed by unpaired t-test). Data are shown as % of non-targeting control ± SEM (n=4/group). * denotes significantly different (p<0.05).
2.2. 2-AG Depletion Decreases Trans-Endothelial Electrical Resistance
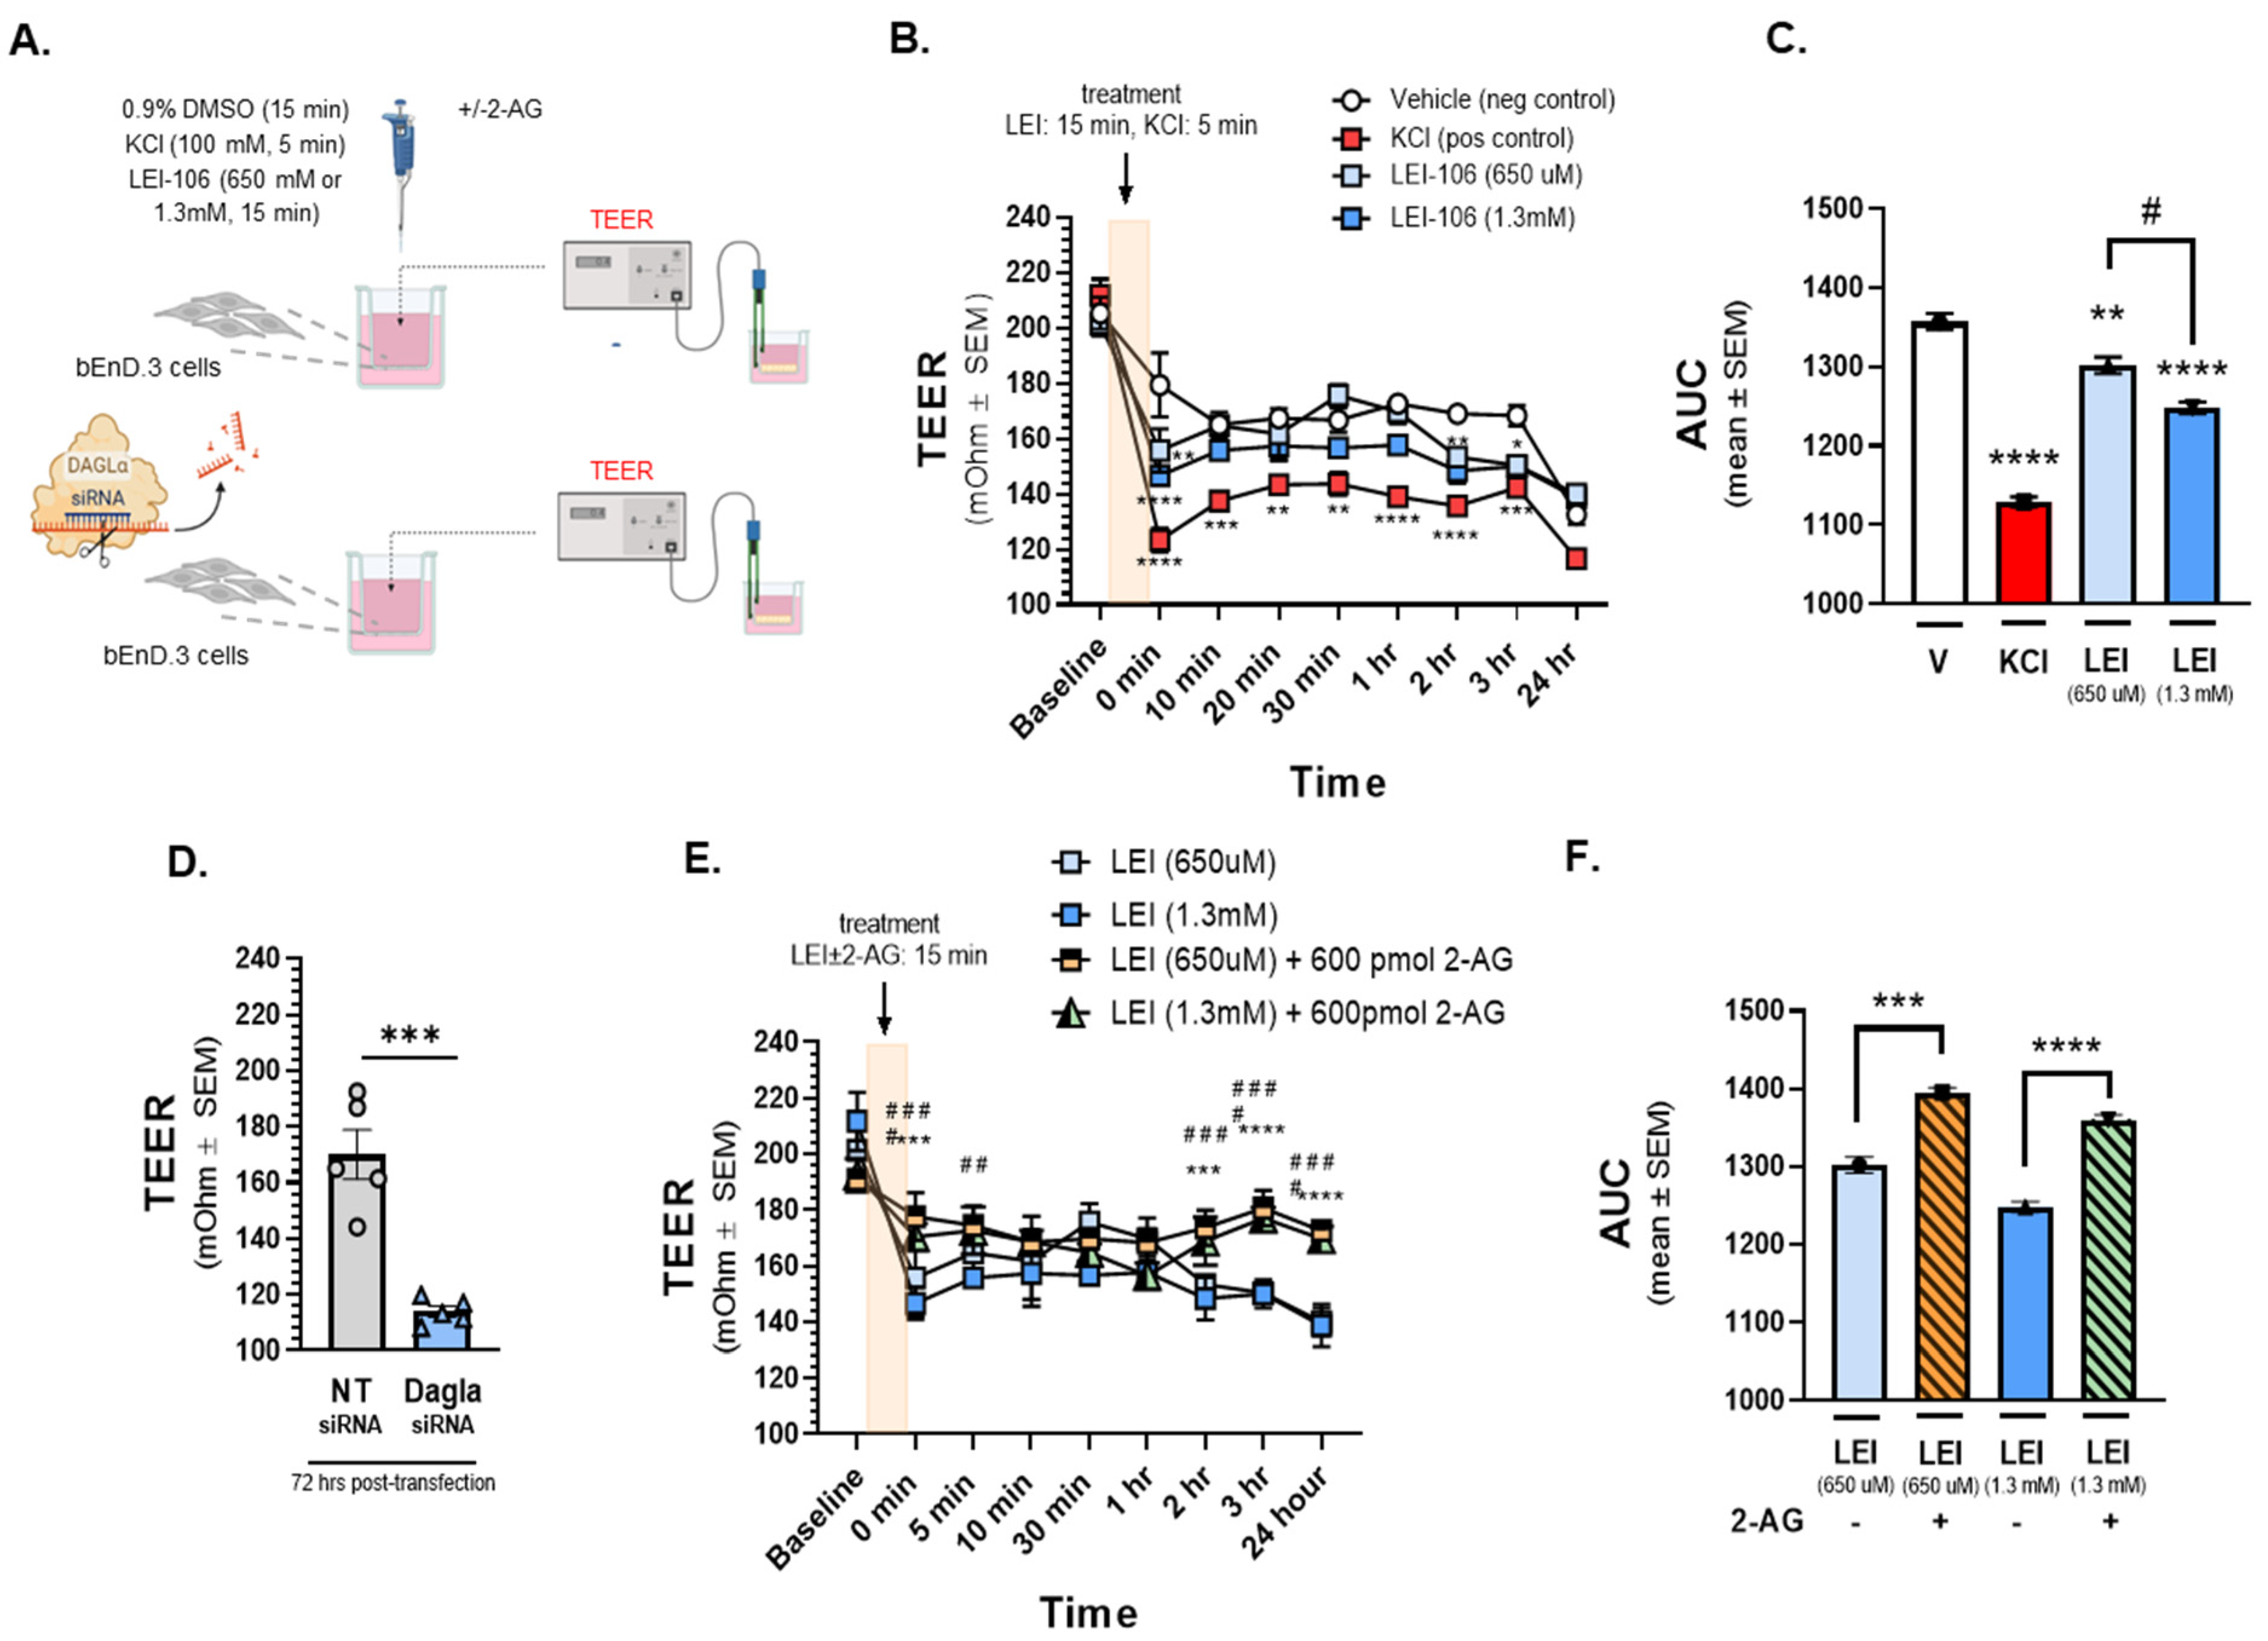
Having established that bEnd.3 cells are responsive to LEI-106, in vitro analysis of barrier integrity was performed via testing of TEER (
Figure 2) and
14C-sucrose transport (
Figure 3). For TEER experiments, bEnd.3 cells were grown to confluency on trans-well membranes, and then treated with LEI-106 (15min, 650µM, 1.3mM, luminal side) or KCl as positive control (100mM, 5min, abluminal side) (
Figure 2A). TEER values in monolayers treated with 0.9% DMSO vehicle were significantly decreased when media was changed at t=0 min; no further changes in TEER were observed across the experimental duration. As previously documented, KCl application significantly decreased TEER [
22] (
Figure 2B, C). TEER values were also significantly reduced from baseline and as compared to vehicle treatment at the end of 15 min incubation period (0 min time-point) of either concentration of LEI-106 (
Figure 2B) (LEI-106-650 uM vs. vehicle: p=0.0017; LEI-106-1.3 mM vs. vehicle: p<0.0001, as assessed by two-way ANOVA). At additional time-points, TEER was normalized, however additional decrease of TEER values was detected at 2 and 3 h (
Figure 2B) (2 h time-point: LEI-106-1.3 uM vs. vehicle: p=0.0075; 3 h: LEI-106-650 µM vs. vehicle: p=0.0254, LEI-106-1.3 mM vs vehicle: p<.0.022, as assessed by two-way ANOVA). The effect of LEI-106 on endothelial cell monolayer integrity over time was confirmed by AUC analysis (
Figure 2C) (LEI-106-650 µM vs. vehicle: p=0.009; LEI-106-1.3 mM vs. vehicle: p<0.0001; LEI-106-650 µM vs. LEI-106-1.3 mM: p=0.01, as assessed by one-way ANOVA with Tukey post-test).
In the siRNA transfection experiments, bEnd.3 cells were seeded on trans-well inserts 24 h post-transfection, then TEER was performed 72 h after the transfection. Silencing DAGLα by siRNA transfection significantly reduced TEER, compared to non-targeting control (
Figure 2D) (DAGLα siRNA vs. non-targeting siRNA: p=0.0003, as assessed by unpaired t-test, n=5). Together, these TEER data provide evidence that the integrity of the endothelial monolayer is disrupted following pharmacological or genetic blockade of DAGLα.
In a separate experiment designed to establish whether the decreases in TEER induced by LEI-106 were a result of reduced 2-AG, cells received treatment with LEI-106 followed by media spiked with 2-AG (15 min, 600pmol/well). Vehicle and LEI-106 were applied to the luminal side of the trans-well, to simulate blood stream delivery of drug to the BBB; 2-AG was added to the abluminal side of the trans-well insert to mimic CNS production of 2-AG (
Figure 2A). 2-AG treatment (600pmol/well) in the abluminal chamber significantly increased TEER at individual time-points and as confirmed by AUC analysis (
Figure 2E, F; 0 min time-point: LEI-106-650 µM vs. LEI-106-650 µM+2-AG: p=0.0002; LEI-106-1.3 mM vs. LEI-106-1.3 mM+2-AG: p<0.0001, as assessed by two-way ANOVA), (AUC: LEI-106-650 µM vs. LEI-106-650 µM+2-AG: p=0.0001; LEI-106-1.3 mM vs. LEI-106-1.3 mM+2-AG: p<0.0001, as assessed by one-way ANOVA). All measurements were repeated in triplicate (technical replicate) over three individual experiments (biological replicate). These data suggest that increasing 2-AG levels after DAGLα inhibitor restores endothelial monolayer electrical resistance.
Figure 2.
The depletion of 2-AG decreased Trans-Endothelial Electrical Resistance (TEER) of bEnD.3 cells, indicating the loss of barrier integrity.
Figure 2.
The depletion of 2-AG decreased Trans-Endothelial Electrical Resistance (TEER) of bEnD.3 cells, indicating the loss of barrier integrity.
The bEnD.3 endothelial cells were cultured on trans-well insert, then treated with LEI-106 (650 uM or 1.3 mM) or vehicle (0.9% DMSO in media) with or without 2-AG (600 pmol) for 15 min. KCl pulse (100 mM, 5 min) was used as positive control. TEER was measured at baseline (before any treatment), right after the treatment (0 min), then 10, 20, 30 min, 1, 2, 3, and 24 h after post-treatment. In the transfection experiments, TEER was measured 72 h post-transfection. (A) This panel shows the schematic experimental setting. (B) The application of LEI-106 in either dose significantly decreased the TEER value, compared to vehicle control at 0 min time-point, suggesting the loss of barrier integrity (LEI-106-650 uM vs. vehicle: p=0.0017; LEI-106-1.3 mM vs. vehicle: p<0.0001, as assessed by two-way ANOVA, F(24,72)=3.723). At later time-points, the TEER was then normalized, followed by an additional significant decrease at 2 and 3 h (2 hr time-point: LEI-106-1.3 uM vs. vehicle: p=0.0075; 3 hr time-point: LEI-106-650 uM vs. vehicle: p=0.0254 LEI-106-1.3 mM vs vehicle: p<0.022, as assessed by two-way ANOVA, F(24,72)=3.723). All data represent the mean ± SEM of three independent experiment performed in triplicate. *p<0.05, **p<0.01, ***p<0.001, ****p<0.0001 as compared to vehicle control. (C) The area under the curve (AUC) of the corresponding panel B. The AUC analysis further confirmed the significant reduction of TEER induced by LEI-106 treatment (LEI-106-650 uM vs. vehicle: p=0.009; LEI-106-1.3 mM vs. vehicle: p<.0.0001; LEI-106-650 uM vs.LEI-106-1.3 mM: p=0.01, as assessed by one-way ANOVA with Tukey post-test, F(3,8)=125.2). Data are shown mean ± SEM. **p<0.01, ****p<0.0001 as compared to vehicle control. #p<0.05: LEI-106-650 uM vs. LEI-106-1.3 mM. (D) bEnD.3 cells were transfected either with non-targeting control siRNA or siRNA targeting DAGLα. TEER was assessed 72 h post-transfection. Significant decrease of TEER was observed in DAGLα siRNA-transfected cells, compared to non-targeting control, indicating disruption of the barrier integrity after silencing of DAGLα (DAGLα siRNA vs. non-targeting siRNA: p=0.0003, t(8)= 6.203 as assessed by unpaired t-test, n=5). Data are shown mean ± SEM. ***p<0.001, as compared to the non-targeting control. (E) The application of 2-AG diminished the effect of LEI-106 on BBB integrity. Significant differences were observed between LEI-106 vs. LEI-106+2-AG groups at 0 min time-point (LEI-106-650 uM vs. LEI-106-650 uM+2-AG: p=0.0002; hjnnnoLEI-106-1.3 mM vs. LEI-106-1.3 mM+2-AG: p<0.0001, as assessed by two-way ANOVA, F(24,90)=7.318). All data represent the mean ± SEM of three independent experiment performed in triplicate. LEI-106-650 uM vs. LEI-106-650 uM+2-AG: ***p<0.001, ****p<0.0001. LEI-106-1.3 mM vs. LEI-106 1.3+2-AG: ##p<0.01, ###p<0.001, ####p<0.0001. (F) The area under the curve (AUC) for panel E. The AUC analysis also showed that 2-AG can mitigate the loss of barrier integrity caused by the inhibition of DAGLα (LEI-106-650 uM vs. LEI-106-650 uM+2-AG: p=0.0001; LEI-106-1.3 mM vs. LEI-106-1.3 mM+2-AG: p<0.0001, as assessed by one-way ANOVA, F(3,8)=67.39). Data are shown mean ± SEM. ***p<0.001, ****p<0.0001 as compared to the corresponding 2-AG treatment.
2.3. 2-AG Depletion Increases in vitro 14C-Sucrose Transport
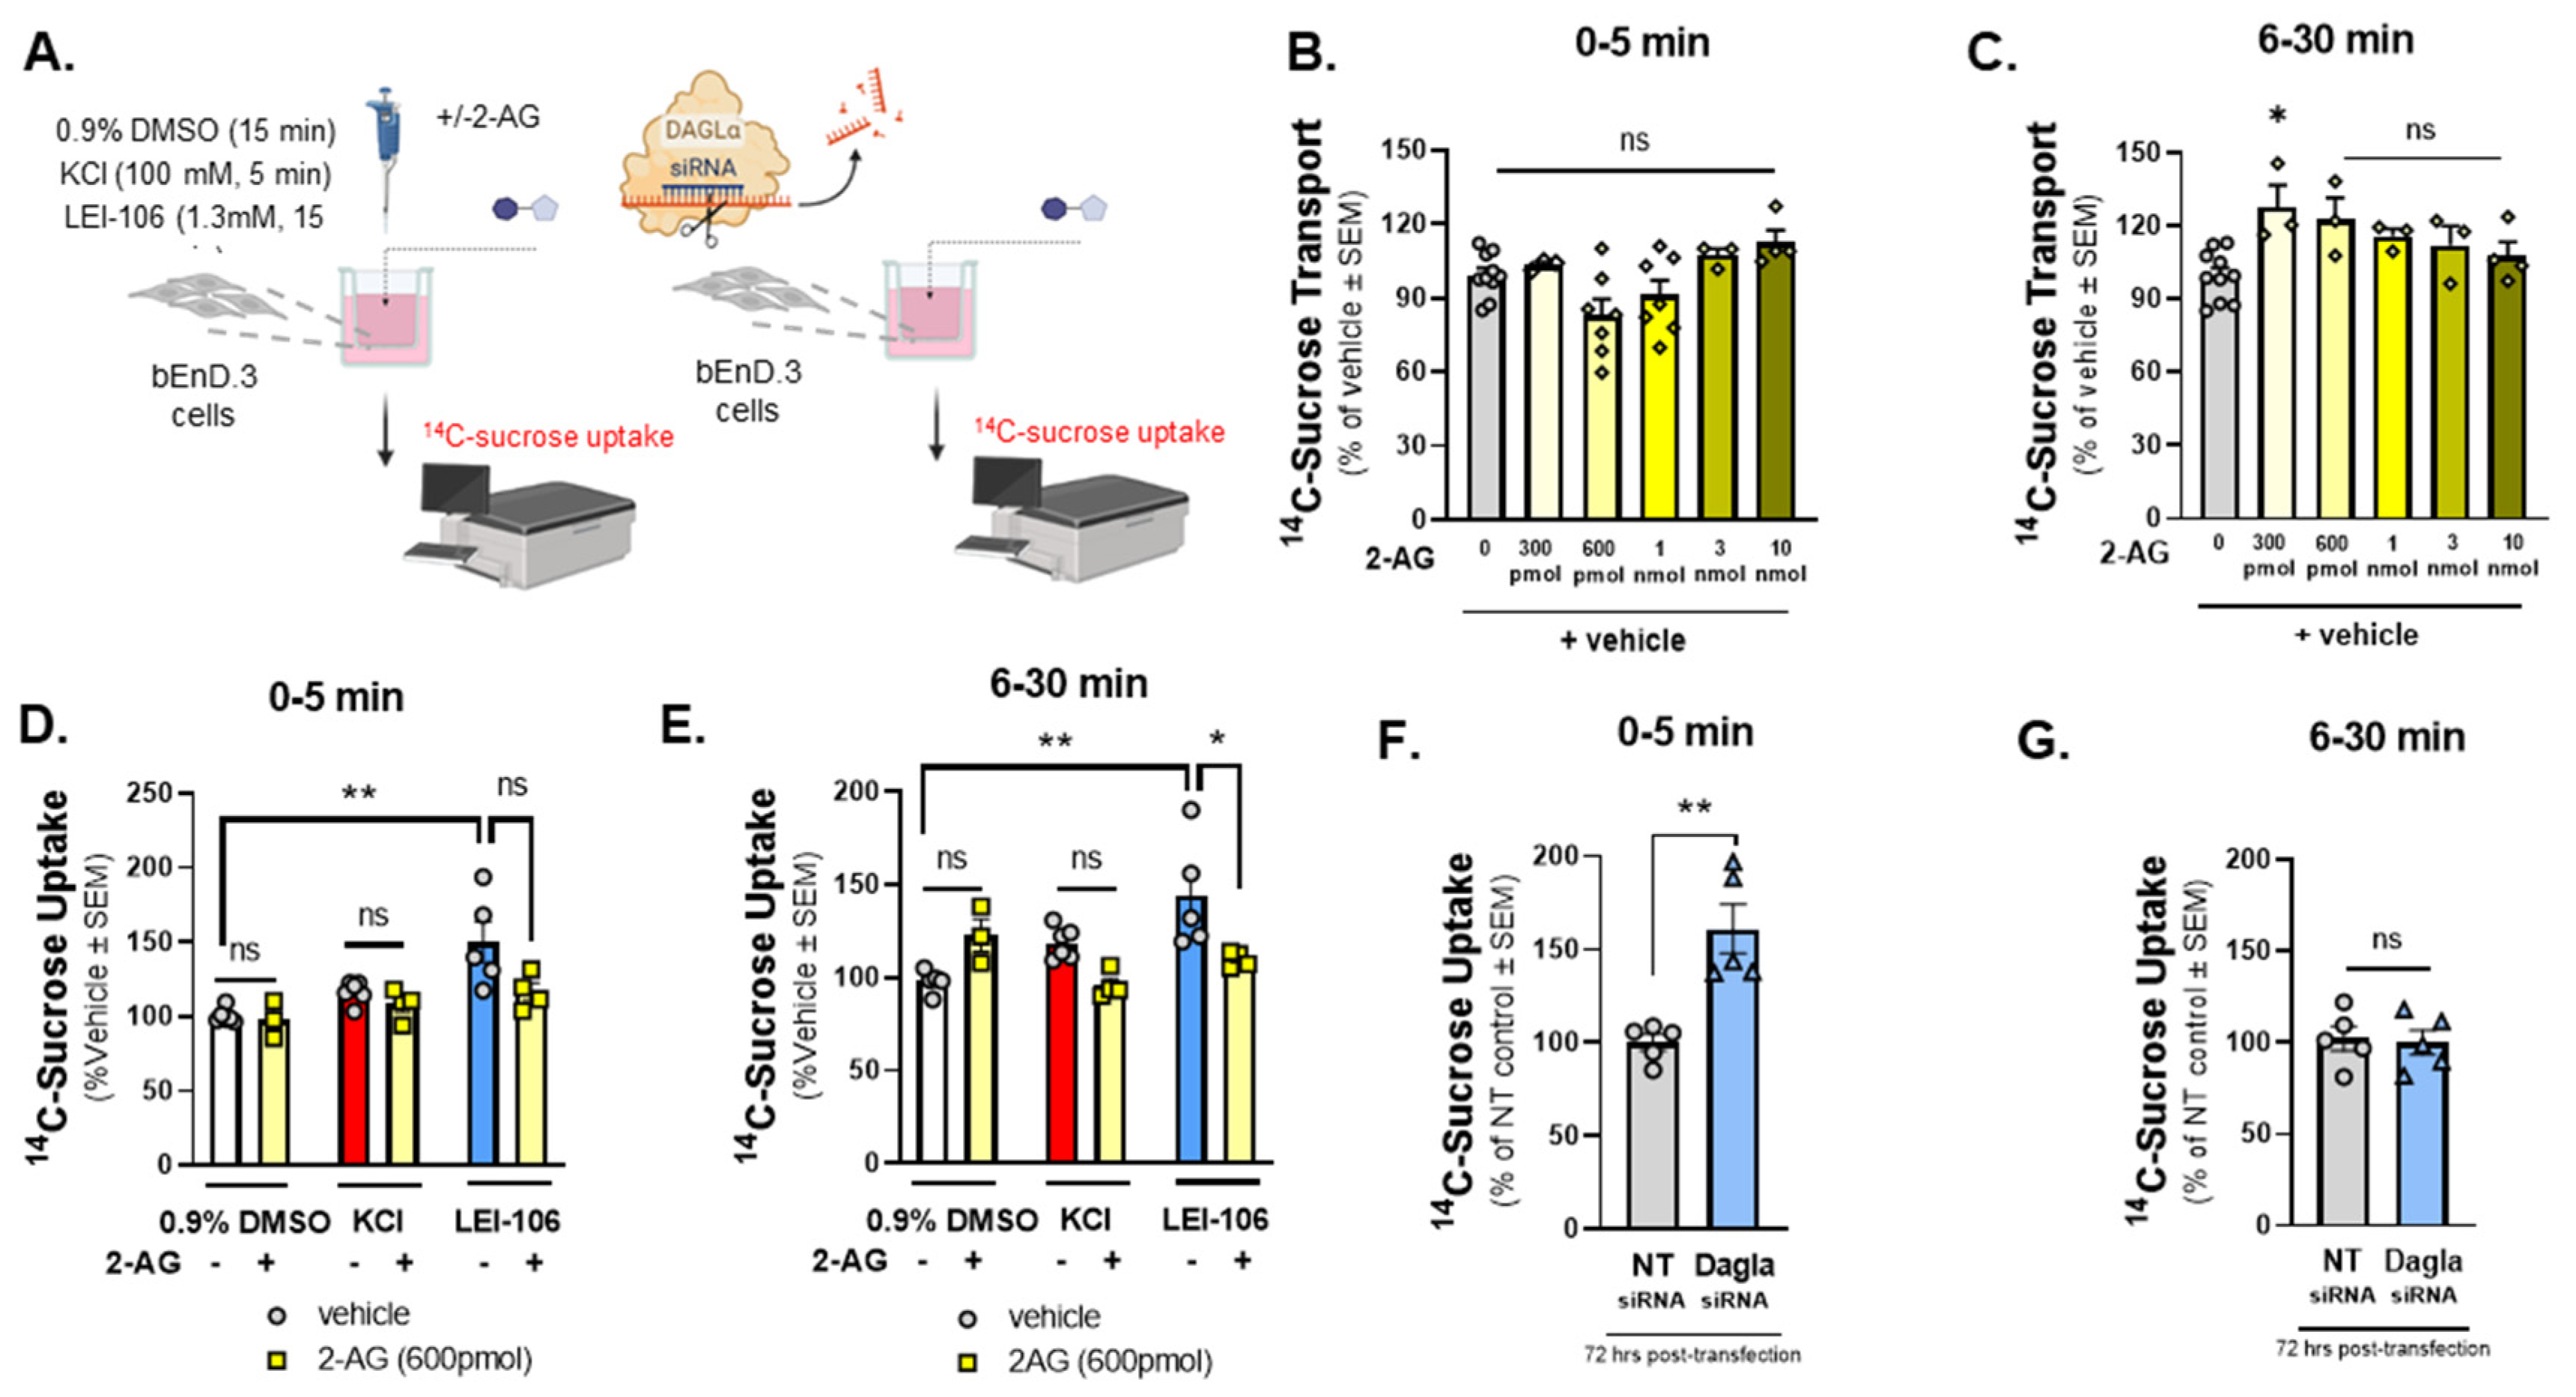
To determine if the observed TEER changes reflected functional changes in paracellular permeability, the next study examined
14C-sucrose transport across the bEnd.3 monolayer (
Figure 3A). Cells were treated with 2-AG at concentrations aligning with what has been recorded
in vivo from the parenchyma (300pmol/well-10nmol/well; 600µL/well) to determine basal responses to 2-AG on monolayer functionality (
Figure 3B, C). Thirty min after treatment, 2-AG (300pmol/well) increased
14C-sucrose transport across the monolayer (2-AG-300 pmol vs. vehicle: p=0.0172, 2-AG at other doses vs. vehicle: p>0.05, F(5,20)=3.879, as assessed by one-way ANOVA with Bartlett`s test, n=3-10/group); no other significant effects of 2-AG alone on bEnd.3 monolayer integrity were observed. Separate sets of cells were incubated in LEI-106 (1.3mM), KCl (100mM), or vehicle (0.9% DMSO) with or without 2-AG application (600 pmol/insert). LEI-106 (1.3 mM) significantly increased the
14C-sucrose detection in the abluminal chamber at 5- and 30-min time-points as compared to vehicle control, indicating the presence of paracellular leak (
Figure 3D, E) (5 min: LEI-106 vs. vehicle: p=0.0033, 30 min: LEI-106 vs. vehicle: p=0.0092, as assessed by unpaired t-test). We next investigated whether these paracellular breaches could be corrected with exogenously applied 2-AG. The application of 2-AG did not significantly influence the elevated sucrose uptake induced by LEI-106 at 5 min (
Figure 3D) (LEI-106 vs. LEI-106+2-AG: p=0.0797, as assessed by unpaired t-test). However, 2-AG treatment significantly mitigated the increase of sucrose uptake caused by DAGLα inhibition at 30 min (
Figure 3E) (LEI-106 vs. LEI-106+2-AG: p=0.05, as assessed by unpaired t-test). Data were obtained from three-four independent experiments using 4 trans-well inserts/group.
In the siRNA transfection experiments, bEnd.3 cells were seeded on trans-well-inserts 24 h post-transfection, then the
14C-sucrose assay was performed 72 h after the transfection. Transfection of DAGLα siRNA in bEnD.3 cells significantly increased the detection of
14C-sucrose in the abluminal chamber at 5 min, suggesting paracellular leak after DAGLα silencing. However no significant change between DAGLα siRNA and control was observed at 30 min time-point (
Figure 3F, G) (5 min: DAGLα siRNA vs. non-targeting siRNA: p=0.0022, as assessed by unpaired t-test, n=5; 30 min: DAGLα siRNA vs. non-targeting siRNA: p=0.8204, as assessed by unpaired t-test, n=5). Together, these data suggest that 2-AG signaling in endothelial cells functionally maintains barrier integrity and that loss of endogenous 2-AG tone promotes paracellular leak.
Figure 3.
14C-Sucrose Transport through the bEnd.3 monolayer was increased after the blockade of DAGLα.
Figure 3.
14C-Sucrose Transport through the bEnd.3 monolayer was increased after the blockade of DAGLα.
The bEnD.3 endothelial cells were cultured on trans-well insert, then treated with increasing amount of 2-AG (0-10 nmole). In a separate experiment, cells were treated with LEI-106 (1.3 mM) or vehicle (0.9% DMSO in media) with or without 2-AG (600 pmol) for 15 min. KCl pulse (100 mM, 5 min) was used as positive control. Following treatment, luminal media was replaced with fresh media containing 14C-sucrose (0.25uCi/mL). Abluminal media was collected at 5 min and 30 min post treatment and subjected to measure radioactivity with a liquid scintillation counter. 14C-sucrose uptake assay was performed 72 h after transfection of DAGLα siRNA or non-targeting control. 14C-sucrose (0.25uCi/mL) was added to the luminal side, abluminal media was collected at two time-points (5 min and 30 min), then radioactivity was measured. (A) Schema of experimental setting. (B) 2-AG treatment at any dose did not cause significant change in 14C-sucrose uptake at 5 min time-point as compared to vehicle control (2-AG at any dose vs. vehicle: p>0.05, F(5,28)=4.010, as assessed by one-way ANOVA with Bartlett`s test) All data represent the % of vehicle-treated ± SEM (n=3-10/group). ns=non-significant. (C) A significant increase of 14C-sucrose uptake after 300 pmol of 2-AG treatment was observed at 6-30 min time-point as compared to vehicle control (2-AG-300 pmol vs. vehicle: p=0.0172, 2-AG at other doses vs. vehicle: p>0.05, F(5,20)=3.879, as assessed by one-way ANOVA with Bartlett`s test) All data represent the % of vehicle-treated ± SEM (n=3-10/group). ns=non-significant, *p<0.05. (D) LEI-106 (1.3 mM) increased the 14C-sucrose uptake at 5 min time-point as compared to vehicle control, indicating the presence of paracellular leak (LEI-106 vs. vehicle: p=0.0033, t(9)=3.965 as assessed by unpaired t-test). The application of 2-AG did not significantly reduce the elevated sucrose uptake induced by LEI-106 (LEI-106 vs. LEI-106+2-AG: p=0.0797, t(7)=2.049 as assessed by unpaired t-test). All data represent the % of vehicle-treated ± SEM from three-four independent experiments using 4 trans-well inserts/group. **p<0.01 as compared to vehicle control. ns=non-significant. (E) Increased 14C-sucrose uptake was also observed at the 30 min time-point after LEI-106 treatment (LEI-106 vs. vehicle: p=0.0092, t(8)=3.415 as assessed by unpaired t-test). 2-AG treatment significantly mitigated the increase of sucrose uptake caused by DAGLα inhibition (LEI-106 vs. LEI-106+2-AG: p=0.05, t(7)=2.273 as assessed by unpaired t-test). All data represent the % of vehicle-treated ± SEM from three-four independent experiments using 4 trans-well inserts/group. *p<0.05, **p<0.01 as compared to corresponding controls. (F) Silencing of DAGLα significantly increased the sucrose uptake in the first 5 min, compared to non-targeting control, suggesting reduced barrier integrity caused by genetic inhibition of DAGLα (DAGLα siRNA vs. non-targeting siRNA: p=0.0022, t(8)=4.420 as assessed by unpaired t-test, n=5). Data are shown mean ± SEM. **p<0.01, as compared to the non-targeting control. (G) No significant difference between DAGLα siRNA and control was observed at the later time-point (6-30 min) (DAGLα siRNA vs. non-targeting siRNA: p=0.8204, t(8)=0.2347 as assessed by unpaired t-test, n=5). Data are shown mean ± SEM. ns=non-significant, as compared to the non-targeting control.
2.4. Immunocytochemistry of 2-AG Depleted Cells Reveals Morphological Changes
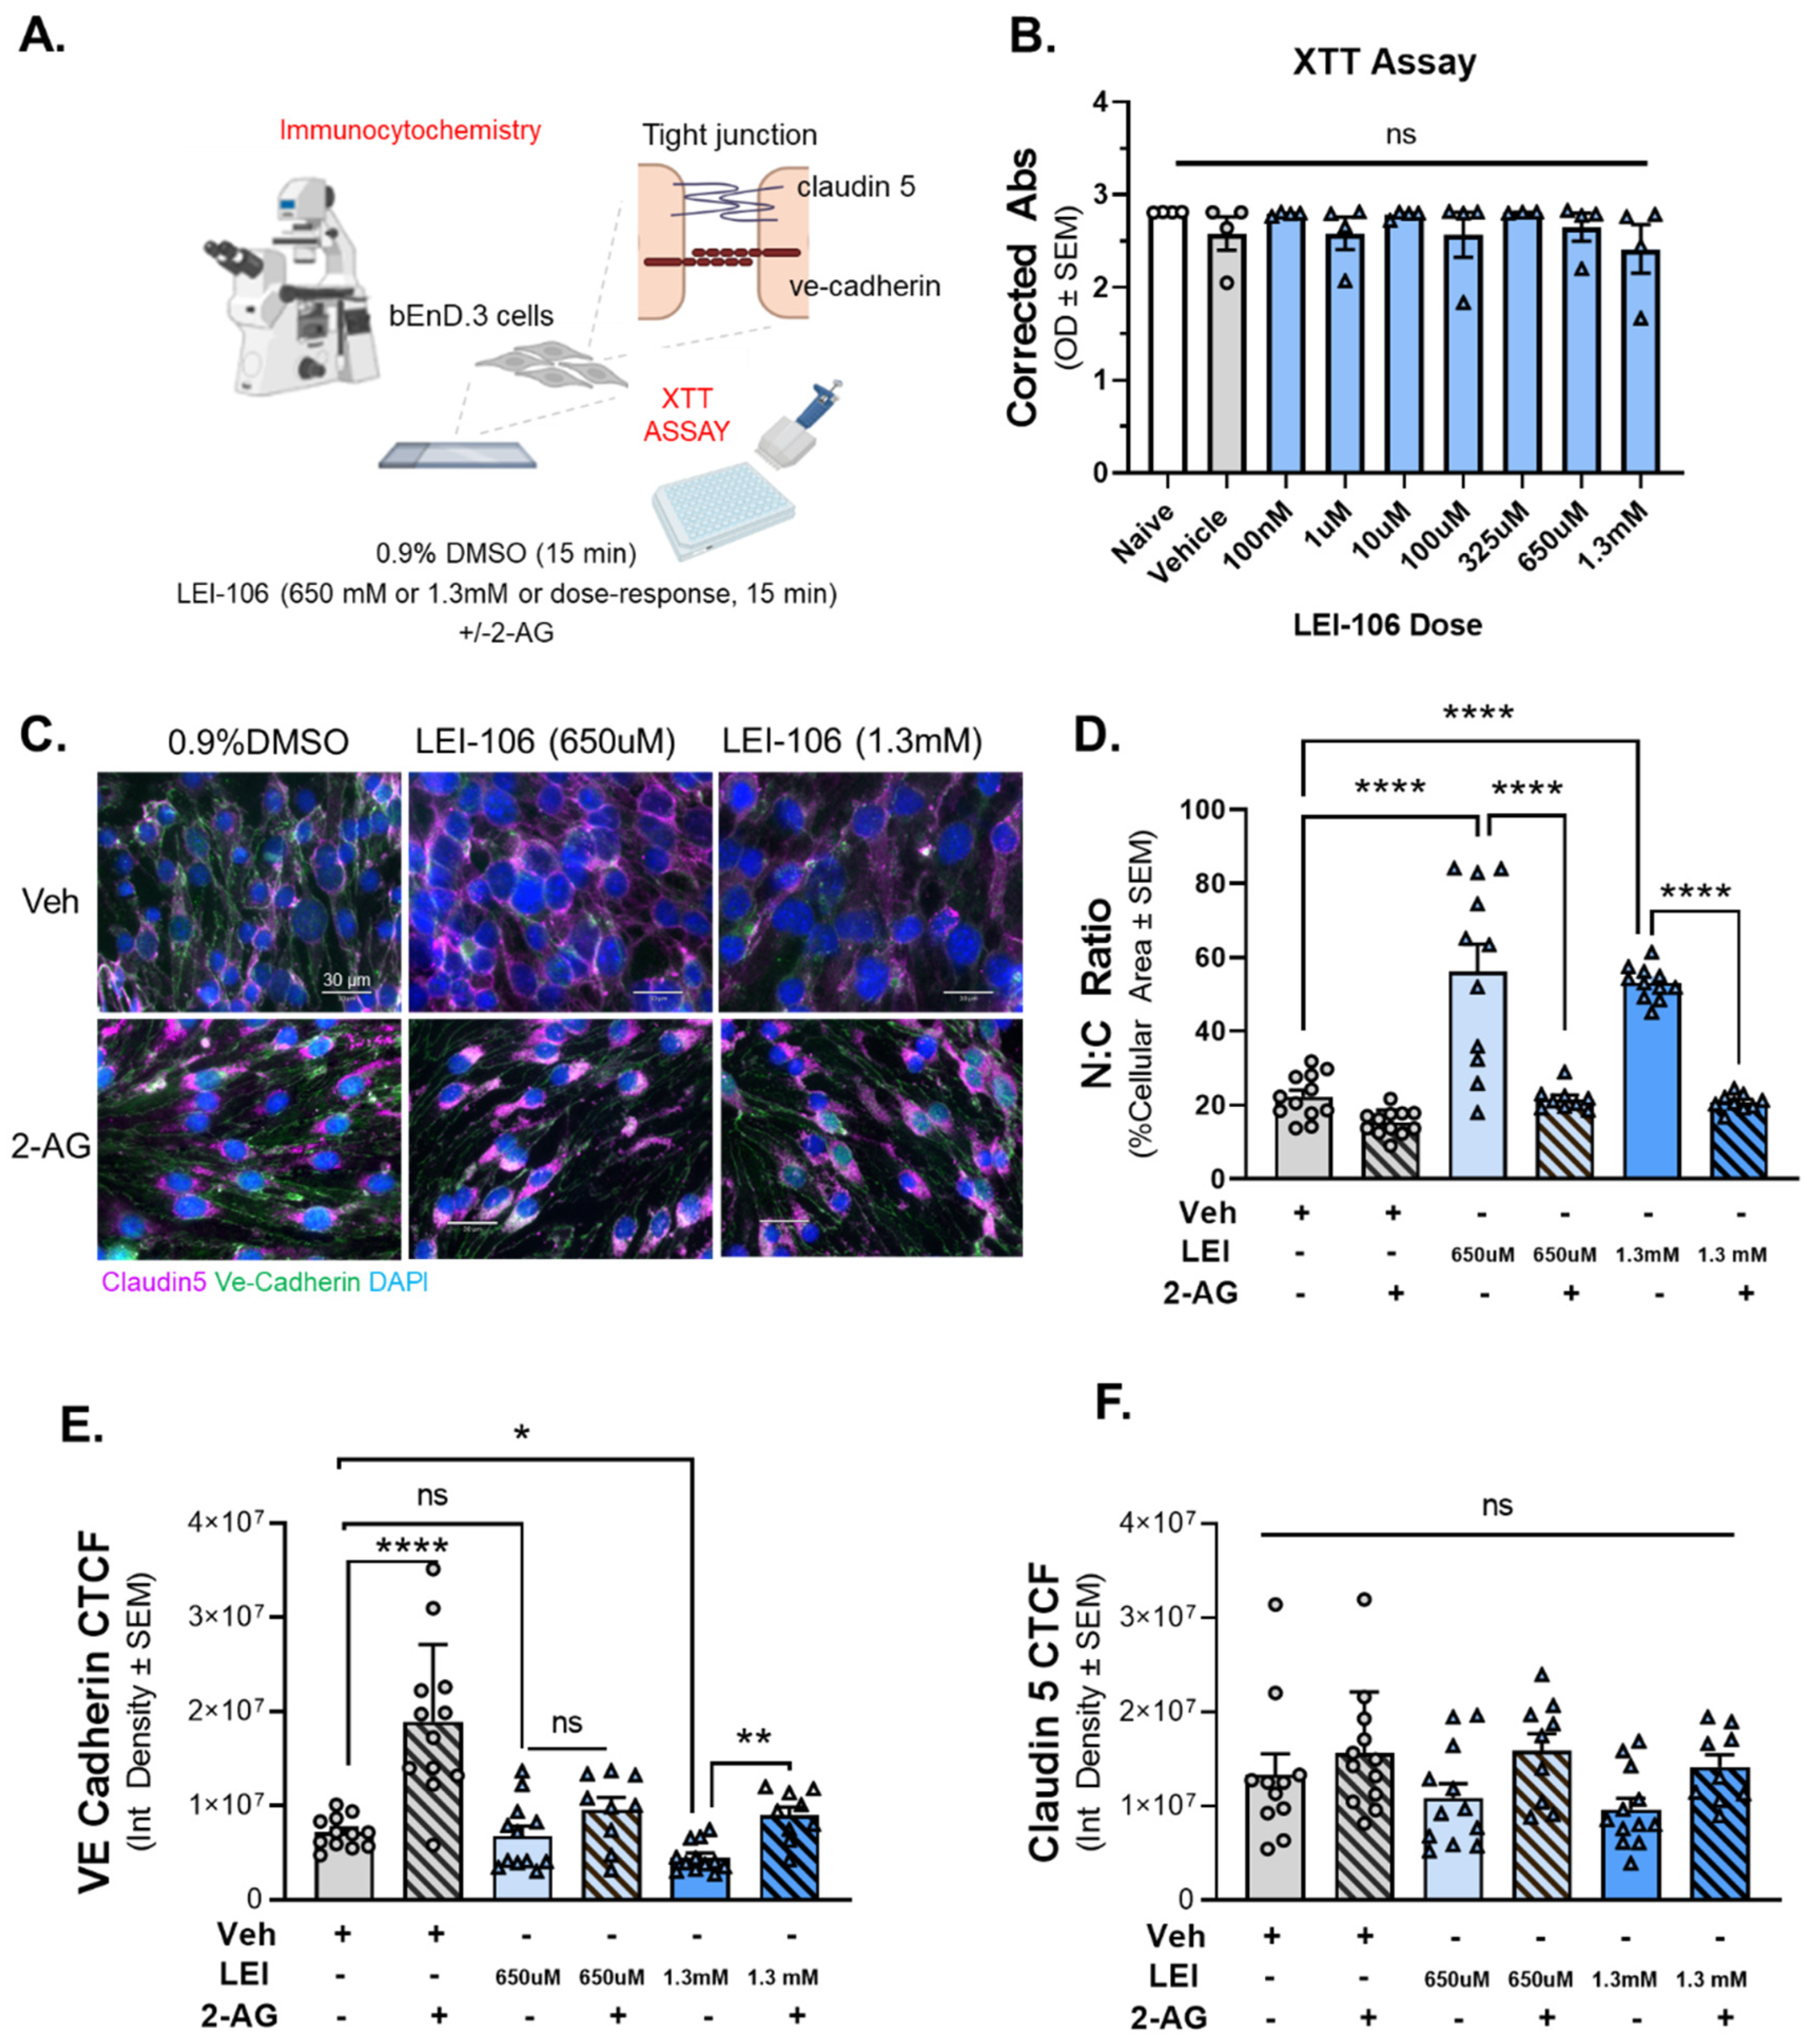
With confirmation that LEI-106 was reducing 2-AG within endothelial cells, and that this loss functionally reduced monolayer paracellular integrity, we investigated possible underlying mechanisms including cell viability, morphological changes, and junctional protein expression (
Figure 4A). To test whether changes in barrier permeability reflect loss of cell viability, an XTT cell viability assay was employed. Cells were treated with titrated doses of LEI-106 (100nM, 10µM, 100µM, 325µM, 650µM, and 1.3mM). No significant differences in oxidative capacity were noted at all LEI-106 doses (
Figure 4B) (LEI-106 at any doses vs. vehicle: p>0.05, as assessed by one-way ANOVA with Bartlett post-test, n=4/group) suggesting DAGLα inhibition and loss of 2-AG does not play a role in bEnd.3 cell viability.
ICC revealed significant changes in endothelial cell morphology following LEI-106 (650µM, 1.3mM;
Figure 4C, D). Total cell area was significantly decreased with a significant increase in nuclear: cytoplasmic (N:C) ratio following LEI-106. 2-AG treatment following LEI-106 significantly reversed these effects (
Figure 4D) (LEI-106-650 µM vs. vehicle: p<0.0001, LEI-106-1.3 mM vs. vehicle: p<0.0001, as assessed by one-way ANOVA with Tukey post-test, n=9-12/conditions) (LEI-106-650 µM vs. LEI-106-650 µM+2-AG: p<0.0001, LEI-106-1.3 mM vs. LEI-106-1.3 mM+2-AG: p<0.0001, as assessed by one-way ANOVA with Tukey post-test, n=9-12/conditions) suggesting that endothelial derived 2-AG plays a role in maintenance of endothelial cell structural integrity.
Using the same cells as morphology experiments, immunoreactivity of VE-cadherin and claudin 5 were assessed to determine the impact of LEI-106 exposure on endothelial cell junctional proteins. LEI-106 (1.3 mM) significantly reduced VE-cadherin corrected total cell fluorescence (CTCF); no significant differences were detected at the lower dose (650 µM) as compared to vehicle control (
Figure 4E; LEI-106-650 µM vs. vehicle: p=0.9052, LEI-106-1.3 mM vs. vehicle: p=0.0233, as assessed by one-way ANOVA with Bartlett post-test, n=9-12/condition). The administration of 2-AG increased the VE-cadherin CTCF, mitigating the loss of VE-cadherin expression after LEI-106 treatment (LEI-106-1.3 mM vs. LEI-106-1.3 mM+2-AG: p=0.005, as assessed by one-way ANOVA with Tukey post-test, n=9-12/conditions). The blockade of DAGLα with LEI-106 at either 650 µM or 1.3mM did not induce significant changes in the CTCF of claudin-5 as compared to the vehicle control (
Figure 4F) (LEI-106-650 µM vs. vehicle: p=0.8982, LEI-106-1.3 mM vs. vehicle: p=0.6161, as assessed by one-way ANOVA with Tukey post-test, n=9-12/condition). These data indicate that the concentrations of LEI-106 utilized in this study do not reduce endothelial cell viability and that the alterations observed following LEI-106 treatment reflect changes to endothelial morphology and expression of the adherens junctional protein, VE-cadherin.
Figure 4.
The inhibition of DAGLα induced morphological changes in bEnD.3 cells accompanied with reduced expression of VE-cadherin.
Figure 4.
The inhibition of DAGLα induced morphological changes in bEnD.3 cells accompanied with reduced expression of VE-cadherin.
Cell viability assay on bEnD.3 cells was performed using increasing doses of LEI-106 (100 nM-1.3 mM). For ICC experiments, the bEnD.3 cells were treated with two doses of LEI-106 (650 uM and 1.3 mM) for 15 min, followed by 2-AG or vehicle application. ICC was performed to detect possible change in the expression of two tight junction protein, claudin 5 and VE-cadherin. (A) The panel represents the setting of experiments. (B) LEI-106 did not cause significant change in the cell viability at any doses applied in the study. (LEI-106 at any doses vs. vehicle: p>0.05, as assessed by one-way ANOVA with Bartlett post-test, F(8,26)=0.7738). All data are expressed as mean of optical density ± SEM (n=4 in each group). ns=non-significant. (C) Representative ICC images of bEnd.3 cells treated with LEI-106+/-2-AG application. (D) Significant changes in the nuclear: cytoplasmic ratio were observed following LEI-106 treatment, suggesting possible morphological alteration caused by 2-AG depletion (LEI-106-650 uM vs. vehicle: p<0.0001, LEI-106-1.3 mM vs. vehicle: p<0.0001, as assessed by one-way ANOVA with Tukey post-test, F(8,85)=30.50). 2-AG treatment following LEI-106 application significantly reversed these effects (LEI-106-650 uM vs. LEI-106-650 uM+2-AG: p<0.0001, LEI-106-1.3 mM vs. LEI-106-1.3 mM+2-AG: p<0.0001, as assessed by one-way ANOVA with Tukey post-test, F(8,85)=30.50). All data are shown as the mean % of cellular area ± SEM (n=9-12/condition). ****p<0.0001, as compared to corresponding controls. (E) The higher dose of LEI-106 (1.3 mM) significantly reduced VE-cadherin CTCF, however no significant change was detected at the lower dose (650 uM) as compared to vehicle control (LEI-106-650 uM vs. vehicle: p=0.9052, LEI-106-1.3 mM vs. vehicle: p=0.0233, as assessed by one-way ANOVA with Bartlett post-test, F(2,33)=4.100). The administration of 2-AG increased the VE-cadherin CTCF, moderating the loss of VE-cadherin expression after LEI-106 treatment (LEI-106-1.3 mM vs. LEI-106-1.3 mM+2-AG: p=0.005, as assessed by one-way ANOVA with Tukey post-test, F(4,49)=5.568). All values are expressed as the mean of corrected total cell fluorescence (CTCF) ± SEM (n=9-12/condition). *p<0.05, **p<0.01, ****p<0.0001, compared to the corresponding controls. ns=non-significant. (F) Neither doses of LEI-106 treatment significantly influence the CTCF of claudin-5 as compared to vehicle control (LEI-106-650 uM vs. vehicle: p=0.8982, LEI-106-1.3 mM vs. vehicle: p=0.6161, as assessed by one-way ANOVA with Tukey post-test, F(5,59)=2.276). All values are expressed as the mean of corrected total cell fluorescence (CTCF) ± SEM (n=9-12/condition). ns=non-significant.
2.5. Endothelial Tight Junction Protein Detection is Modulated Following DAGLα Inhibition
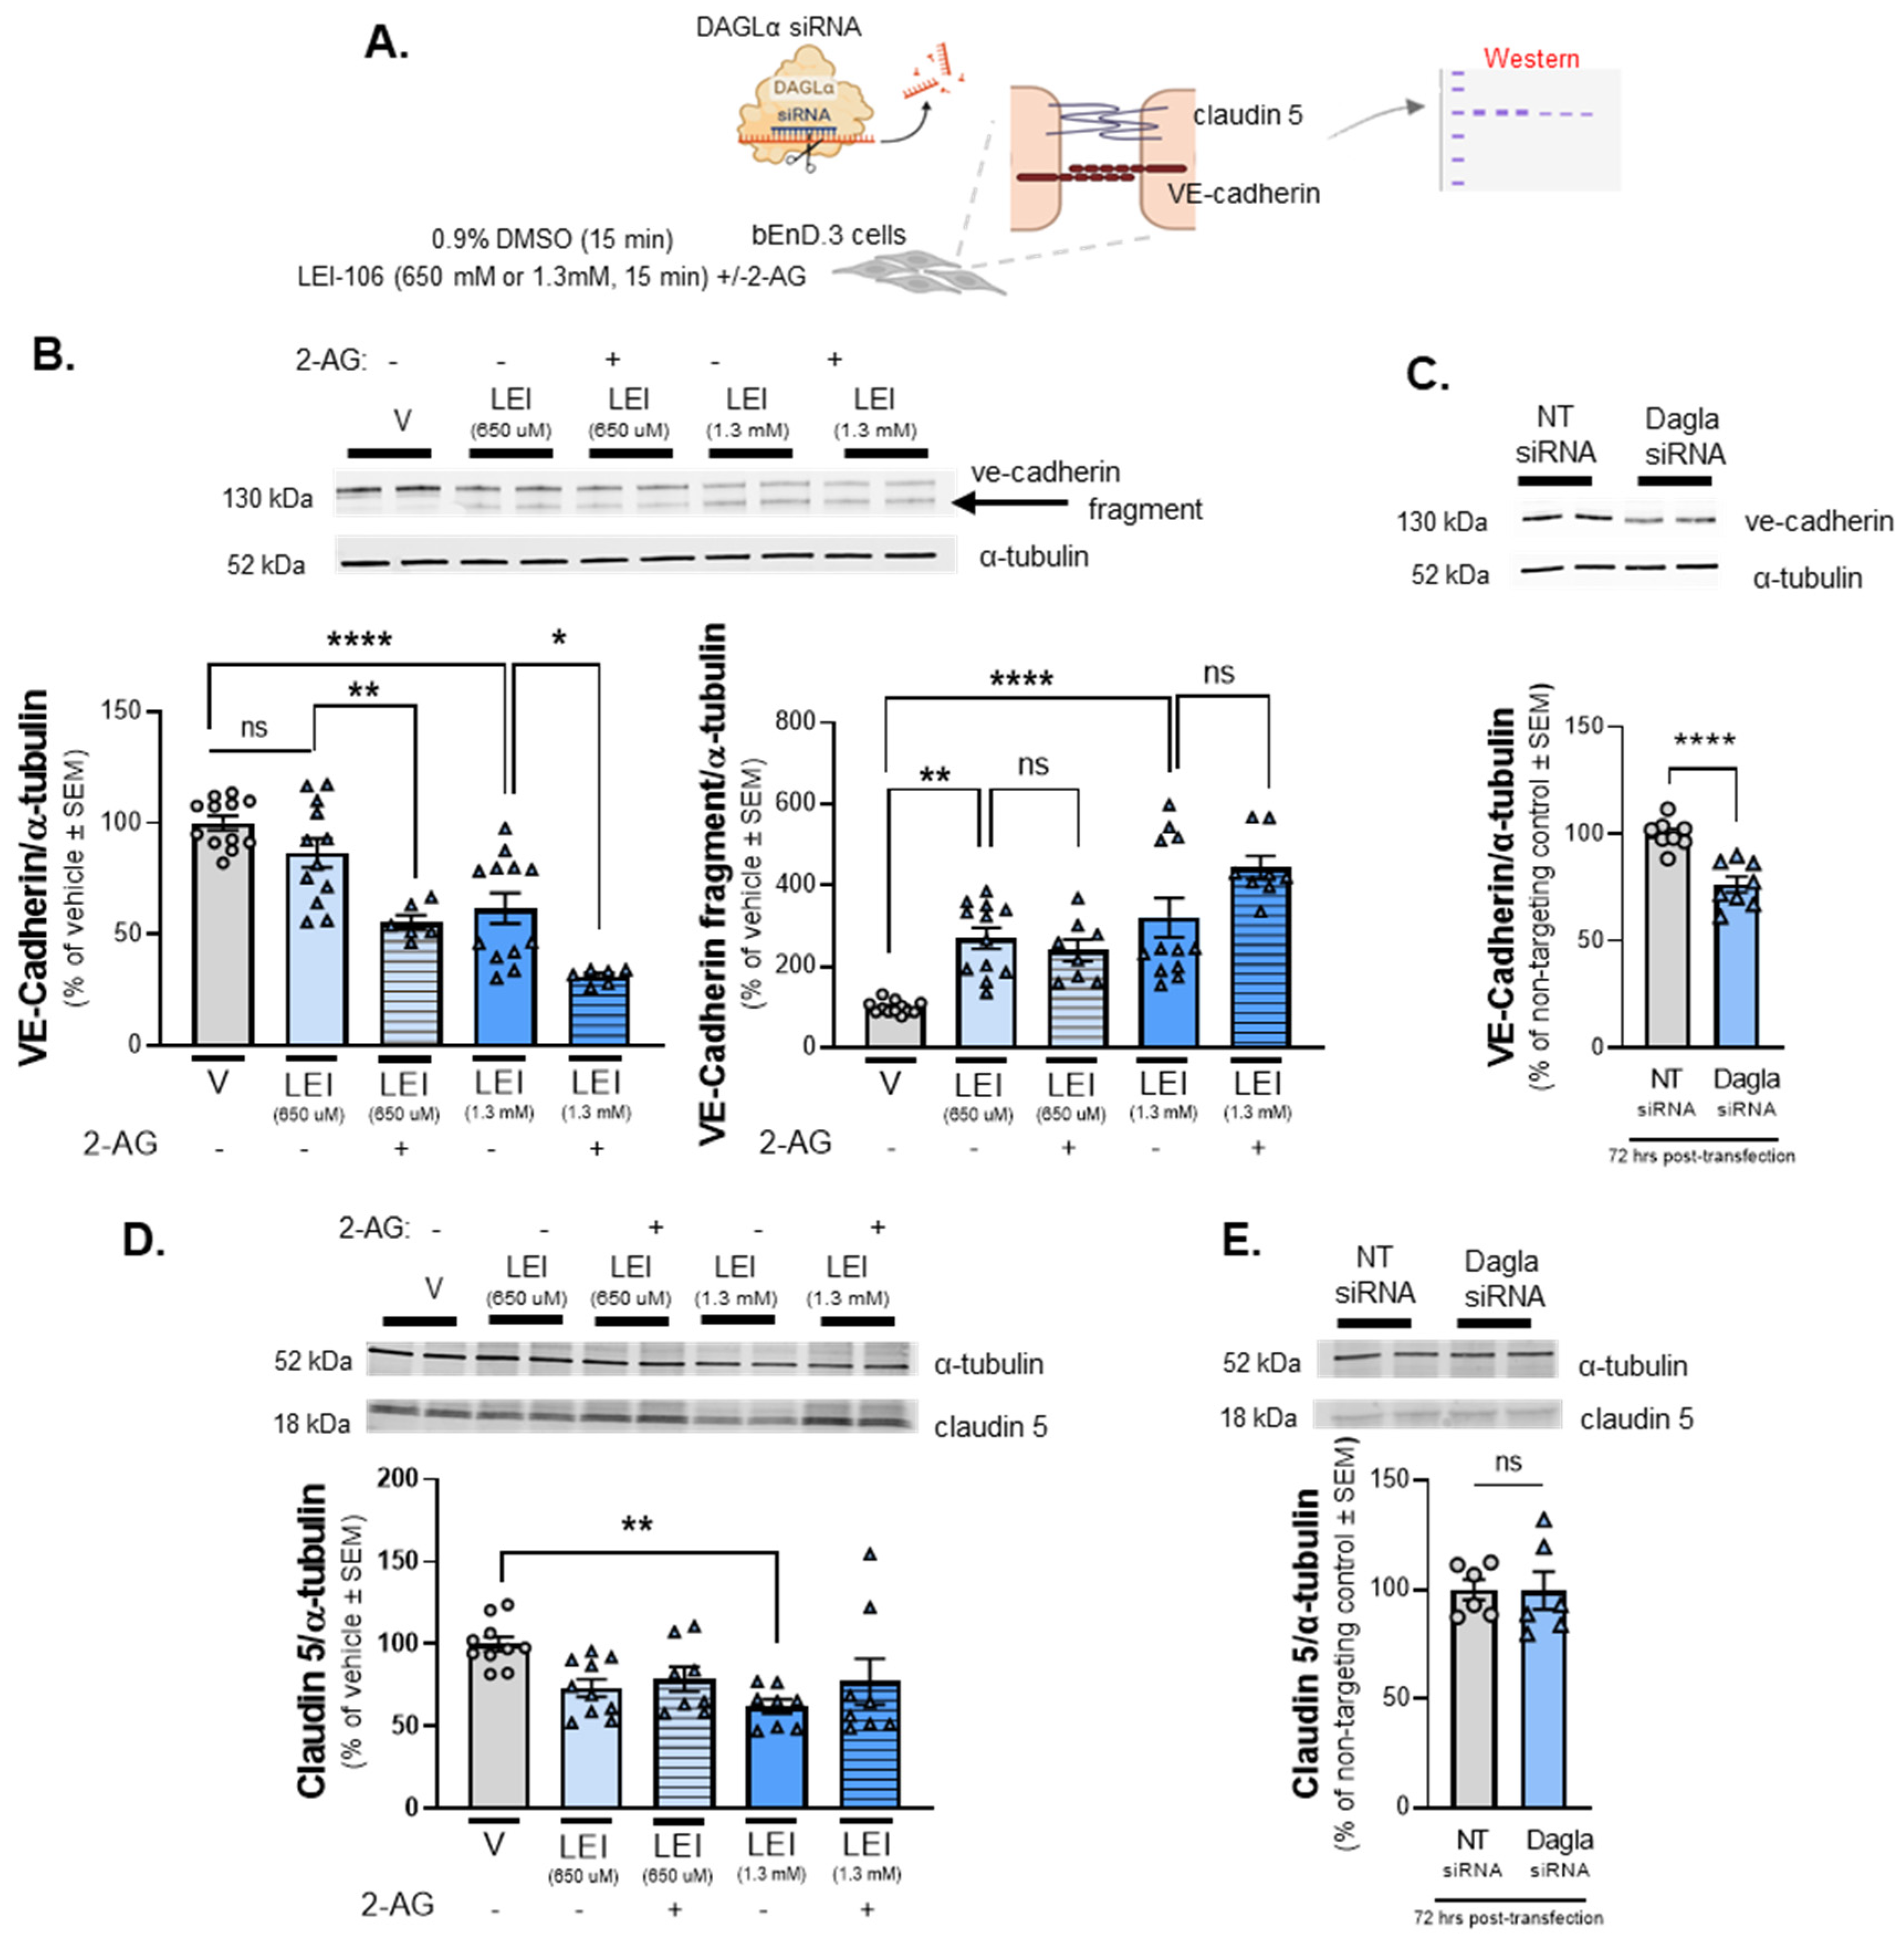
The next series of experiments sought to validate the ICC obervations of VE-cadherin and claudin 5 immunofluorescence by performing Western blot analysis following LEI-106 treatment or gene editing (
Figure 5A). Cell lysates harvested after LEI-106 (650µM, 1.3mM; 15min) were first probed for VE-cadherin. VE-cadherin was detected at 130 kDa in all treatment conditions. In LEI-106-treated cell lysates, a notable fragment at approximately 100kDa was also detected, indicating that VE-cadherin had undergone a fragmenting event following DAGLα inhibition. The treatment of LEI-106 at 650 uM dose did not cause significant change in the detection of VE-cadherin main 130kDa band as compared to vehicle control (
Figure 5B) (vehicle vs. LEI-106-650 uM: p=0.3565 as assessed by one-way ANOVA with Bartlett`s test, n=8-12/group), but it significantly increased the detection of 100kDa fragment (vehicle vs. LEI-106-650 uM: p=0.0014 as assessed by one-way ANOVA with Bartlett`s test, n=8-12/condition). The higher dose of LEI-106 (1.3 mM) significantly reduced the detection of VE-cadherin main band and increased the detection of the fragmented one as compared to vehicle control (
Figure 5B) (main band: vehicle vs. LEI-106-1.3 mM: p<0.0001 as assessed by one-way ANOVA with Bartlett`s test; fragment: vehicle vs. LEI-106-1.3 mM: p<0.0001 as assessed by one-way ANOVA with Bartlett`s test, n=8-12/group). Interestingly, the application of 2-AG further decreased the detection of main VE-cadherin band, but it did not significantly influence the fragmentation as compared to corresponding controls (
Figure 5B) (main band: LEI-106-650 uM vs. LEI-106-650 uM+2-AG: p=0.0092, LEI-106-1.3 mM vs. LEI-106-1.3 mM+2-AG: p=0.011 as assessed by one-way ANOVA with Bartlett`s test; fragment: LEI-106-650 uM vs. LEI-106-650 uM+2-AG: p=0.9665, LEI-106-1.3 mM vs. LEI-106-1.3 mM+2-AG: p=0.0769 as assessed by one-way ANOVA with Bartlett`s test, n=8-12/condition). The expression of VE-cadherin was also assessed at 72 h after siRNA transfection in bEnD.3 cells. The transfection of DAGLα -specific siRNA significantly decreased the detection of VE-cadherin as compared to the non-targeting control (
Figure 5C) (DAGLα siRNA vs. non-targeting control siRNA: p<0.0001, as assessed by unpaired t-test, n=8/group); this strategy did not lead to detection of the VE-cadherin fragment. These data, taken with the ICC data suggest regulation of endothelial derived 2-AG regulates the detection of VE-cadherin in bEnd.3 cells
Claudin 5 was detected in all cell lysates at 18kDa (
Figure 5D). WB analysis of claudin-5 signal was significantly decreased after LEI-106 treatment at the higher dose (vehicle vs. LEI-106-650 uM: p=0.0759; vehicle vs. LEI-106-1.3 mM: p=0.0076 as assessed by one-way ANOVA with Tukey`s test, n=8-10/group). The application of 2-AG did not cause significant changes as compared to the corresponding controls (LEI-106-650 uM vs. LEI-106-650 uM+2-AG: p=0.9870, LEI-106-1.3 mM vs. LEI-106-1.3 mM+2-AG: p=0.6535 as assessed by one-way ANOVA with Tukey`s test, n=8-10/condition). No significant difference in the detection of claudin-5 was observed after the transfection of DAGLα -specific siRNA either (
Figure 5E) (DAGLα siRNA vs. non-targeting control siRNA: p=0.9666, as assessed by unpaired t-test, n=6/group). Together with the ICC results, these data indicate that the pharmacological inhibition of DAGLα has a limited impact on detection of claudin 5 in bEnd.3 cells.
Figure 5.
The detection of VE-cadherin was altered after DAGLα blockade in bEnd.3 cells.
Figure 5.
The detection of VE-cadherin was altered after DAGLα blockade in bEnd.3 cells.
The bEnD.3 cells were treated with LEI-106 (650 uM or 1.3 mM) for 15 min with or without 2-AG (600 pmol) application. The cell lysate was subjected to Western to detect the expression of VE-cadherin and claudin 5. In the siRNA transfection experiment, samples were harvested 72 h post-transfection and subjected to Western to detect the expression of VE-cadherin and claudin 5. (A) Scheme of experimental outline. (B) Representative image showing the expression of VE-cadherin with α-tubulin used as loading control. The pharmacological blockade of DAGLα induced fragmentation of VE-cadherin. The treatment of LEI-106 at 650 uM dose did not cause significant change in the detection of VE-cadherin main band as compared to vehicle control (vehicle vs. LEI-106-650 uM: p=0.3565 as assessed by one-way ANOVA with Bartlett`s test, F(4,43)=19.62), but it significantly increased the detection of VE-cadherin fragment (vehicle vs. LEI-106-650 uM: p=0.0014 as assessed by one-way ANOVA with Bartlett`s test, F(4,47)=15.19). The higher dose of LEI-106 (1.3 mM) significantly reduced the detection of VE-cadherin main band and increased the detection of the fragmented one as compared to vehicle control (main band: vehicle vs. LEI-106-1.3 mM: p<0.0001 as assessed by one-way ANOVA with Bartlett`s test, F(4,43)=19.62; fragment: vehicle vs. LEI-106-1.3 mM: p<0.0001 as assessed by one-way ANOVA with Bartlett`s test, F(4,47)=15.19). The application of 2-AG further decreased the detection of main VE-cadherin band, but it did not significantly influence the fragmentation as compared to corresponding controls (main band: LEI-106-650 uM vs. LEI-106-650 uM+2-AG: p=0.0092, LEI-106-1.3 mM vs. LEI-106-1.3 mM+2-AG: p=0.011 as assessed by one-way ANOVA with Bartlett`s test, F(4,43)=19.62; fragment: LEI-106-650 uM vs. LEI-106-650 uM+2-AG: p=0.9665, LEI-106-1.3 mM vs. LEI-106-1.3 mM+2-AG: p=0.0769 as assessed by one-way ANOVA with Bartlett`s test, F(4,47)=15.19). All data presented as % of vehicle-treated ± SEM (n=8-12/condition). *p<0.05, **p<0.01, ****p<0.0001, compared to the corresponding controls. ns=non-significant. (C) Representative image showing the expression of VE-cadherin with α-tubulin as loading control in transfected cell samples. The transfection of DAGLα -specific siRNA significantly reduced the detection of VE-cadherin as compared to the non-targeting control (DAGLα siRNA vs. non-targeting control siRNA: p<0.0001, t(14)=5.376, as assessed by unpaired t-test). Data are shown as % of non-targeting control ± SEM (n=8/group). **** denotes significantly different (p<0.0001). (D) Representative image displaying the expression level of claudin 5. α-tubulin was used as loading control. The lower dose of LEI-106 (650 uM) did not significantly influence the detection of claudin 5 as compared to vehicle control (vehicle vs. LEI-106-650 uM: p=0.0759 as assessed by one-way ANOVA with Tukey`s test, F(4,39)=3.559). The treatment of LEI-106 at 1.3 mM dose significantly reduced the detection of of claudin 5 as compared to vehicle control (vehicle vs. LEI-106-1.3 mM: p=0.0076 as assessed by one-way ANOVA with Tukey`s test, F(4,39)=3.559). The application of 2-AG did not cause significant changes as compared to the corresponding controls (LEI-106-650 uM vs. LEI-106-650 uM+2-AG: p=0.9870, LEI-106-1.3 mM vs. LEI-106-1.3 mM+2-AG: p=0.6535 as assessed by one-way ANOVA with Tukey`s test, F(4,39)=3.559). All data presented as % of vehicle-treated ± SEM (n=8-10/condition). **p<0.01, compared to vehicle control. (E) Representative image of the expression of claudin 5 along with α-tubulin as loading control in transfected cell samples. No significant difference in the detection of claudin 5 was observed after the transfection of DAGLα -specific siRNA (DAGLα siRNA vs. non-targeting control siRNA: p=0.9666, t(10)=0.04292, as assessed by unpaired t-test). Data are shown as % of non-targeting control ± SEM (n=6/group). ns =non-significant.
2.6. DAGLα Inhibition Increases Cellular Calcium Detection with Engagement of Protein Kinase C (PKC) and Rho-Kinase Pathways
VE-cadherin is a calcium-dependent junctional protein, and prior reports indicate that VE-cadherin is fragmented by a calcium-dependent kinase, calpain [
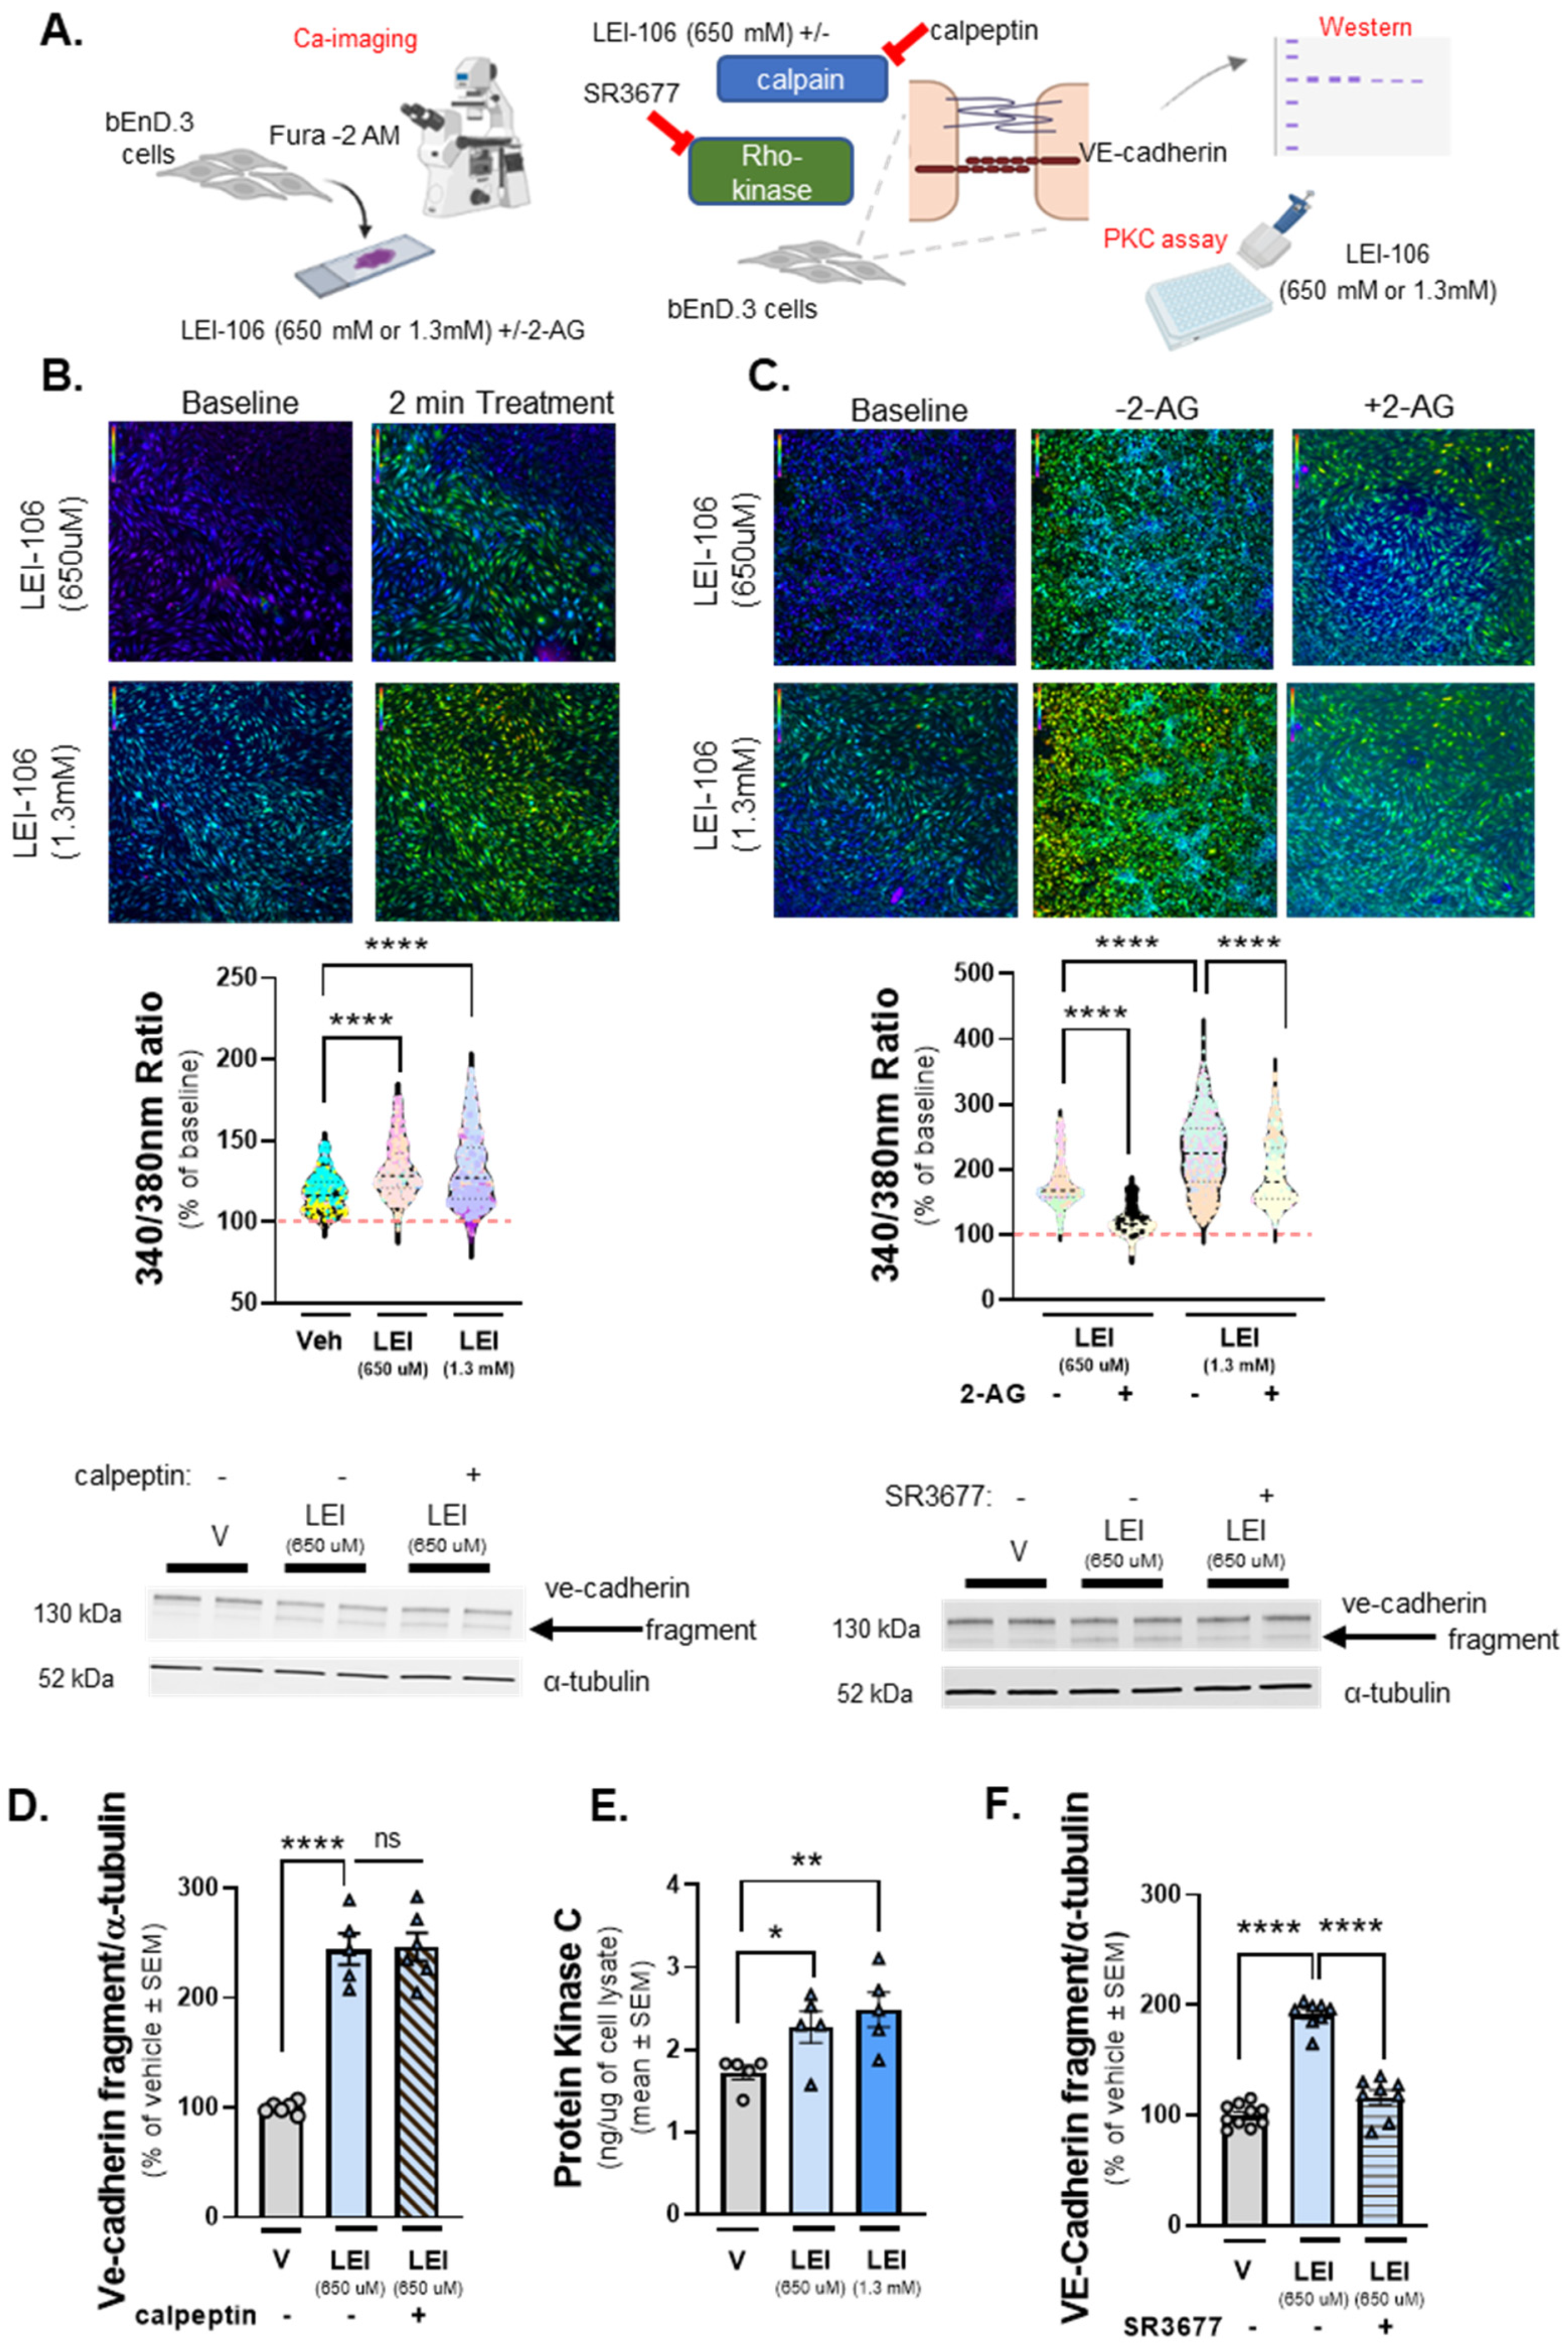
23]. The next experiments sought to determine whteher the fragment of VE-cadherin detected after LEI-106 treatment resulted from increasing intracellular calcium within bEnd.3 cells and calpain engagement. The first study used calcium imaging of bEnd.3 cells with the dye Fura-2, AM. Test cells underwent a 2-minute baseline observation in buffer, followed by 2-minute treatment with LEI-106 (650µM, 1.3mM), vehicle (0.9% DMSO), and a subsequent 2-minute washout phase. In a separate experiment, cells received buffer spiked with 2-AG (600pmol/coverslip) during the washout phase (
Figure 6A). bEnd.3 cells treated with LEI-106 at both doses displayed significant increases in intracellular calcium as compared to vehicle control (
Figure 6B) (LEI-106-650 uM vs. vehicle: p<0.0001, LEI-106-1.3 mM vs. vehicle: p<0.0001, as assessed by one-way ANOVA with Tukey post-test). Treatment with 2-AG spiked buffer following LEI-106 significantly decreased detection of intracellular calcium as compared to buffer alone (
Figure 6C) (LEI-106-650 uM vs. LEI-106-650 uM+2-AG: p<0.0001, LEI-106-1.3 mM vs. LEI-106-1.3 mM+2-AG: p<0.0001, as assessed by one-way ANOVA with Tukey post-test). To determine if this partial 2-AG effect was mediated by cannabinoid receptors (CB
1R and CB
2R), we repeated the experiment with the non-selective synthetic agonist, WIN-55,212. Application of WIN-55,212 after LEI-106 reduced the calcium signal as compared to LEI-106 alone (LEI-106-1.3 mM vs. LEI-106-1.3 mM+ WIN-55,212: p<0.0001, t(14.30)=856, as assessed by unpaired t-test). Together, these data indicate that LEI-106 treatment increases intracellular calcium concentration in a dose-dependent manner over time, which can be partially corrected with exogenous 2-AG supplementation and the non-selective CB
1R/CB
2R agonist WIN-55,212.
Having established that intracellular calcium levels are increased after treatement with LEI-106, we tested if the calcium-dependent kinase, calpain, played a role in the cleavage of VE-cadherin caused by DAGLα blockade. bEnD.3 cells were treated with LEI-106 in the combination with calpain inhibitor calpeptin (10µM, 30 min pretreatment). The calpain inhibitor did not significantly mitigate the fragmentation of VE-cadherin caused by LEI-106 treatment (
Figure 6D) (LEI-106-650 uM vs. LEI-106-650 uM+calpeptin: p>0.9999, as assessed by one-way ANOVA with Tukey post-test, n=5-6/condition) suggesting that calpain did not play a role in the cleavage of VE-cadherin caused by DAGLα inhibition.
Previous work has shown as well that Ca-signalling along with activation of protein kinase C (PKC) has a critical role in mediating the disruption of VE-cadherin [
24]. Therefore, the activity of PKC was determined in LEI-106 treated bEnD.3 cells. PKC activity, as assessed by ELISA, showed that LEI-106 treatment at both doses (15 min) significantly increased the PKC activity as compared to vehicle control (
Figure 6E) (LEI-106-650 uM vs. vehicle: p=0.0289, t(8)=2.658; LEI-106-1.3 mM vs. vehicle: p=0.0099, as assesed by unpaired t-test, n=5/group). In order to test how PKC inhibitor can affect the fragmentation of VE-cadherin caused by LEI-106, bEnD.3 cells were pretreated with PKC inhibtor, G06938 (100 nM) 30 min before DAGLα inhibition. The PKC inhibitor did not cause significant changes in the fragmentation of VE-cadherin (
Suppl Figure S1) (LEI-106-650 uM vs. LEI-106-650 uM+ G06938: p=0.9999, LEI-106-1.3 mM vs. LEI-106-1.3 mM+ G06938: p=0.9548, as assessed by one-way ANOVA with Tukey post-test, F(5,18)=21.88, n=4/condition).
To further investigate the possible signaling mechanism underlying how DAGLα inhibition resulted in VE-cadherin fragmentation, the pan-Rho-kinase inhibitor, SR3677 was tested in a combination with LEI-106. bEnD.3 cells were treated with SR3677 (100 nM) 30 min prior LEI-106 (650 uM), then subjected to Western-immunoblotting to probe for VE-cadherin. Rho-kinase inhibitor significantly mitigated the fragmentation of VE-cadherin caused by DAGLα inhibitor (
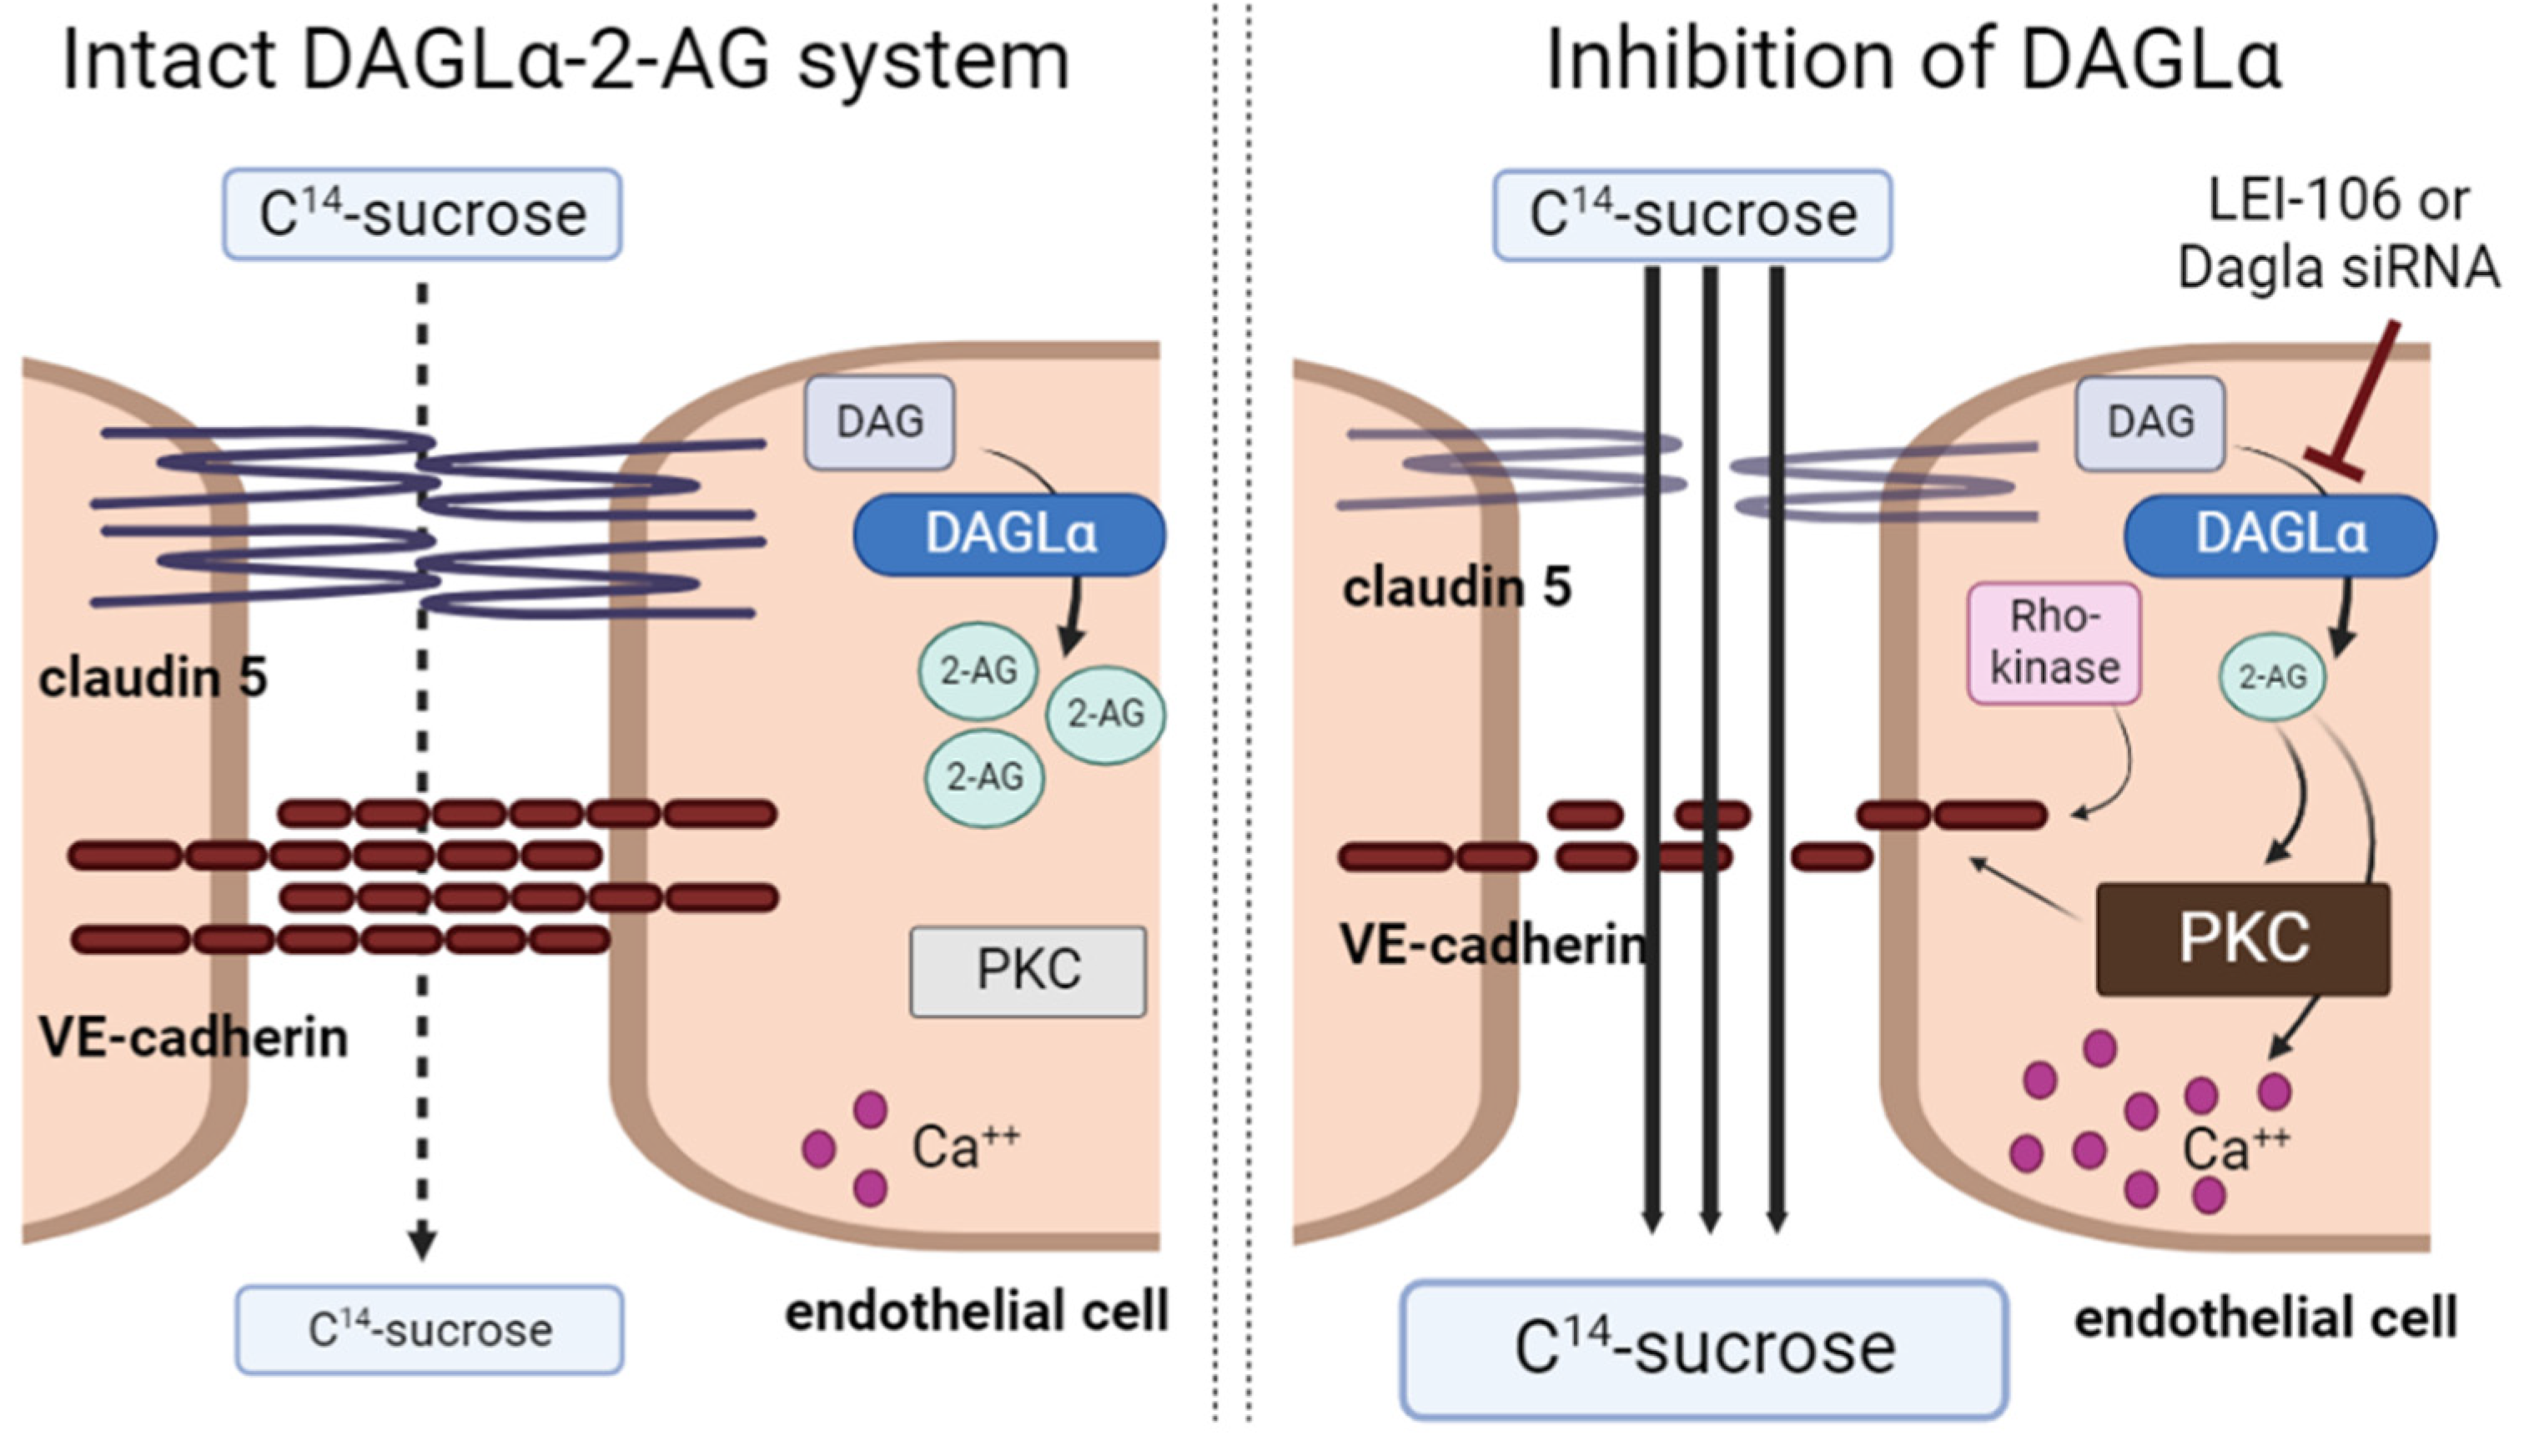
Figure 6F) (LEI-106-650 uM vs. LEI-106-650 uM+SR3677: p<0.0001, as assessed by one-way ANOVA, n=8-10/condition). Together, these data suggest a role for increased intracellular Ca-signal, elevated PKC activity, and the engagement of Rho-kinase pathway in the effect of DAGLα inhibition on VE-cadherin.
Figure 6.
Increased intracellular calcium level and elevated PKC activity after DAGLα inhibition in bEnD.3 cells.
Figure 6.
Increased intracellular calcium level and elevated PKC activity after DAGLα inhibition in bEnD.3 cells.
The bEnd.3 cells plated on collagen coated coverslips were subjected to calcium imaging with the dye Fura-2. After 2-minute baseline observation in buffer, cells were treated with LEI-106 (650µM or 1.3mM) or vehicle (0.9% DMSO) for 2 minutes, followed by a subsequent 2-minute washout phase. In a separate experiment, cells received buffer spiked with 2-AG (600pmol/coverslip) during the washout phase. Images used for analysis were captured at the beginning of the treatment application and after removal of the treatment, approximately 2 minutes apart. In a separate experiment, protein kinase C (PKC) activity was measured by ELISA in bEnD.3 cells after LEI-106 treatment. bEnD.3 cells were treated with calpain inhibitor, calpeptin (10µM) or Rho-kinase inhibitor, SR3677 (100 nM) 30 min prior the application of LEI-106 (650 µM), then subjected to Western blot to detect changes in the fragmentation of VE-cadherin caused by DAGLα inhibition. (A) Schema of experimental setting. (B) Representative calcium images of bEnD.3 cells at baseline, then treated with two different doses of LEI-106 (650 uM, 1.3 mM). LEI-106 at both doses significantly increased the intracellular calcium levels as compared to vehicle control (LEI-106-650 uM vs. vehicle: p<0.0001, LEI-106-1.3 mM vs. vehicle: p<0.0001, as assessed by one-way ANOVA with Tukey post-test, F(3,3295)=482.1). All values are % of baseline obtained from three independent experiment using three coverslips in each. In each coverslip, 100 cells were analyzed by Image J software. ****p<0.0001 as compared to vehicle control. Red dashed line represents the baseline. (C) Representative images showing intracellular calcium levels in bEnD.3 cells treated with LEI-106 (650 uM or 1.3 mM) with or without 2-AG. The application of 2-AG significantly reduced the elevation of intracellular calcium caused by LEI-106 treatment (LEI-106-650 uM vs. LEI-106-650 uM+2-AG: p<0.0001, LEI-106-1.3 mM vs. LEI-106-1.3 mM+2-AG: p<0.0001, as assessed by one-way ANOVA with Tukey post-test, F(3,2700)=889.9). All data are shown as % of baseline obtained from three independent experiment using three coverslips in each. In each coverslip, 100 cells were analyzed by Image J software. ****p<0.0001 as compared to vehicle control. Red dashed line represents the baseline. (D) Representative image of Western blot showing VE-cadherin expression in bEnD.3 cells treated with LEI-106 with or without calpain inhibitor, calpeptin (10µM). α-tubulin was used as loading control. The calpain inhibitor did not significantly change the fragmentation of VE-cadherin caused by LEI-106 treatment (LEI-106-650 uM vs. LEI-106-650 uM+calpeptin: p>0.9999, as assessed by one-way ANOVA with Tukey post-test, F(4,20)=84.40). All data are shown as % of vehicle-treated ± SEM (n=5-6/condition). ****p<0.0001, ns=non-significant. (E) The assessment of PKC activity by ELISA showed that LEI-106 treatment (15 min) significantly increased the activity level of PKC as compared to vehicle control (LEI-106-650 uM vs. vehicle: p=0.0289, t(8)=2.658; LEI-106-1.3 mM vs. vehicle: p=0.0099, t(8)=3.362 as assessed by unpaired t-test). Data are presented as mean of PKC in ng/µg of cell lysate ± SEM (n=5/group). (F) Representative image of immunoblot targeting VE-cadherin and α-tubulin as loading control in bEnD.3 cells treated with LEI-106 (650 uM) with or without Rho-kinase inhibitor, SR3677 (100 nM). The pretreatment (30 min) with Rho-kinase inhibitor significantly mitigated the fragmentation of VE-cadherin caused by LEI-106 (LEI-106-650 uM vs. LEI-106-650 uM+SR3677: p<0.0001, as assessed by one-way ANOVA with Tukey post-test, F(2,23)=110.3). All data are shown as % of vehicle-treated ± SEM (n=8-10/condition). ****p<0.0001, compared to the LEI-106 (650 uM) treatment.
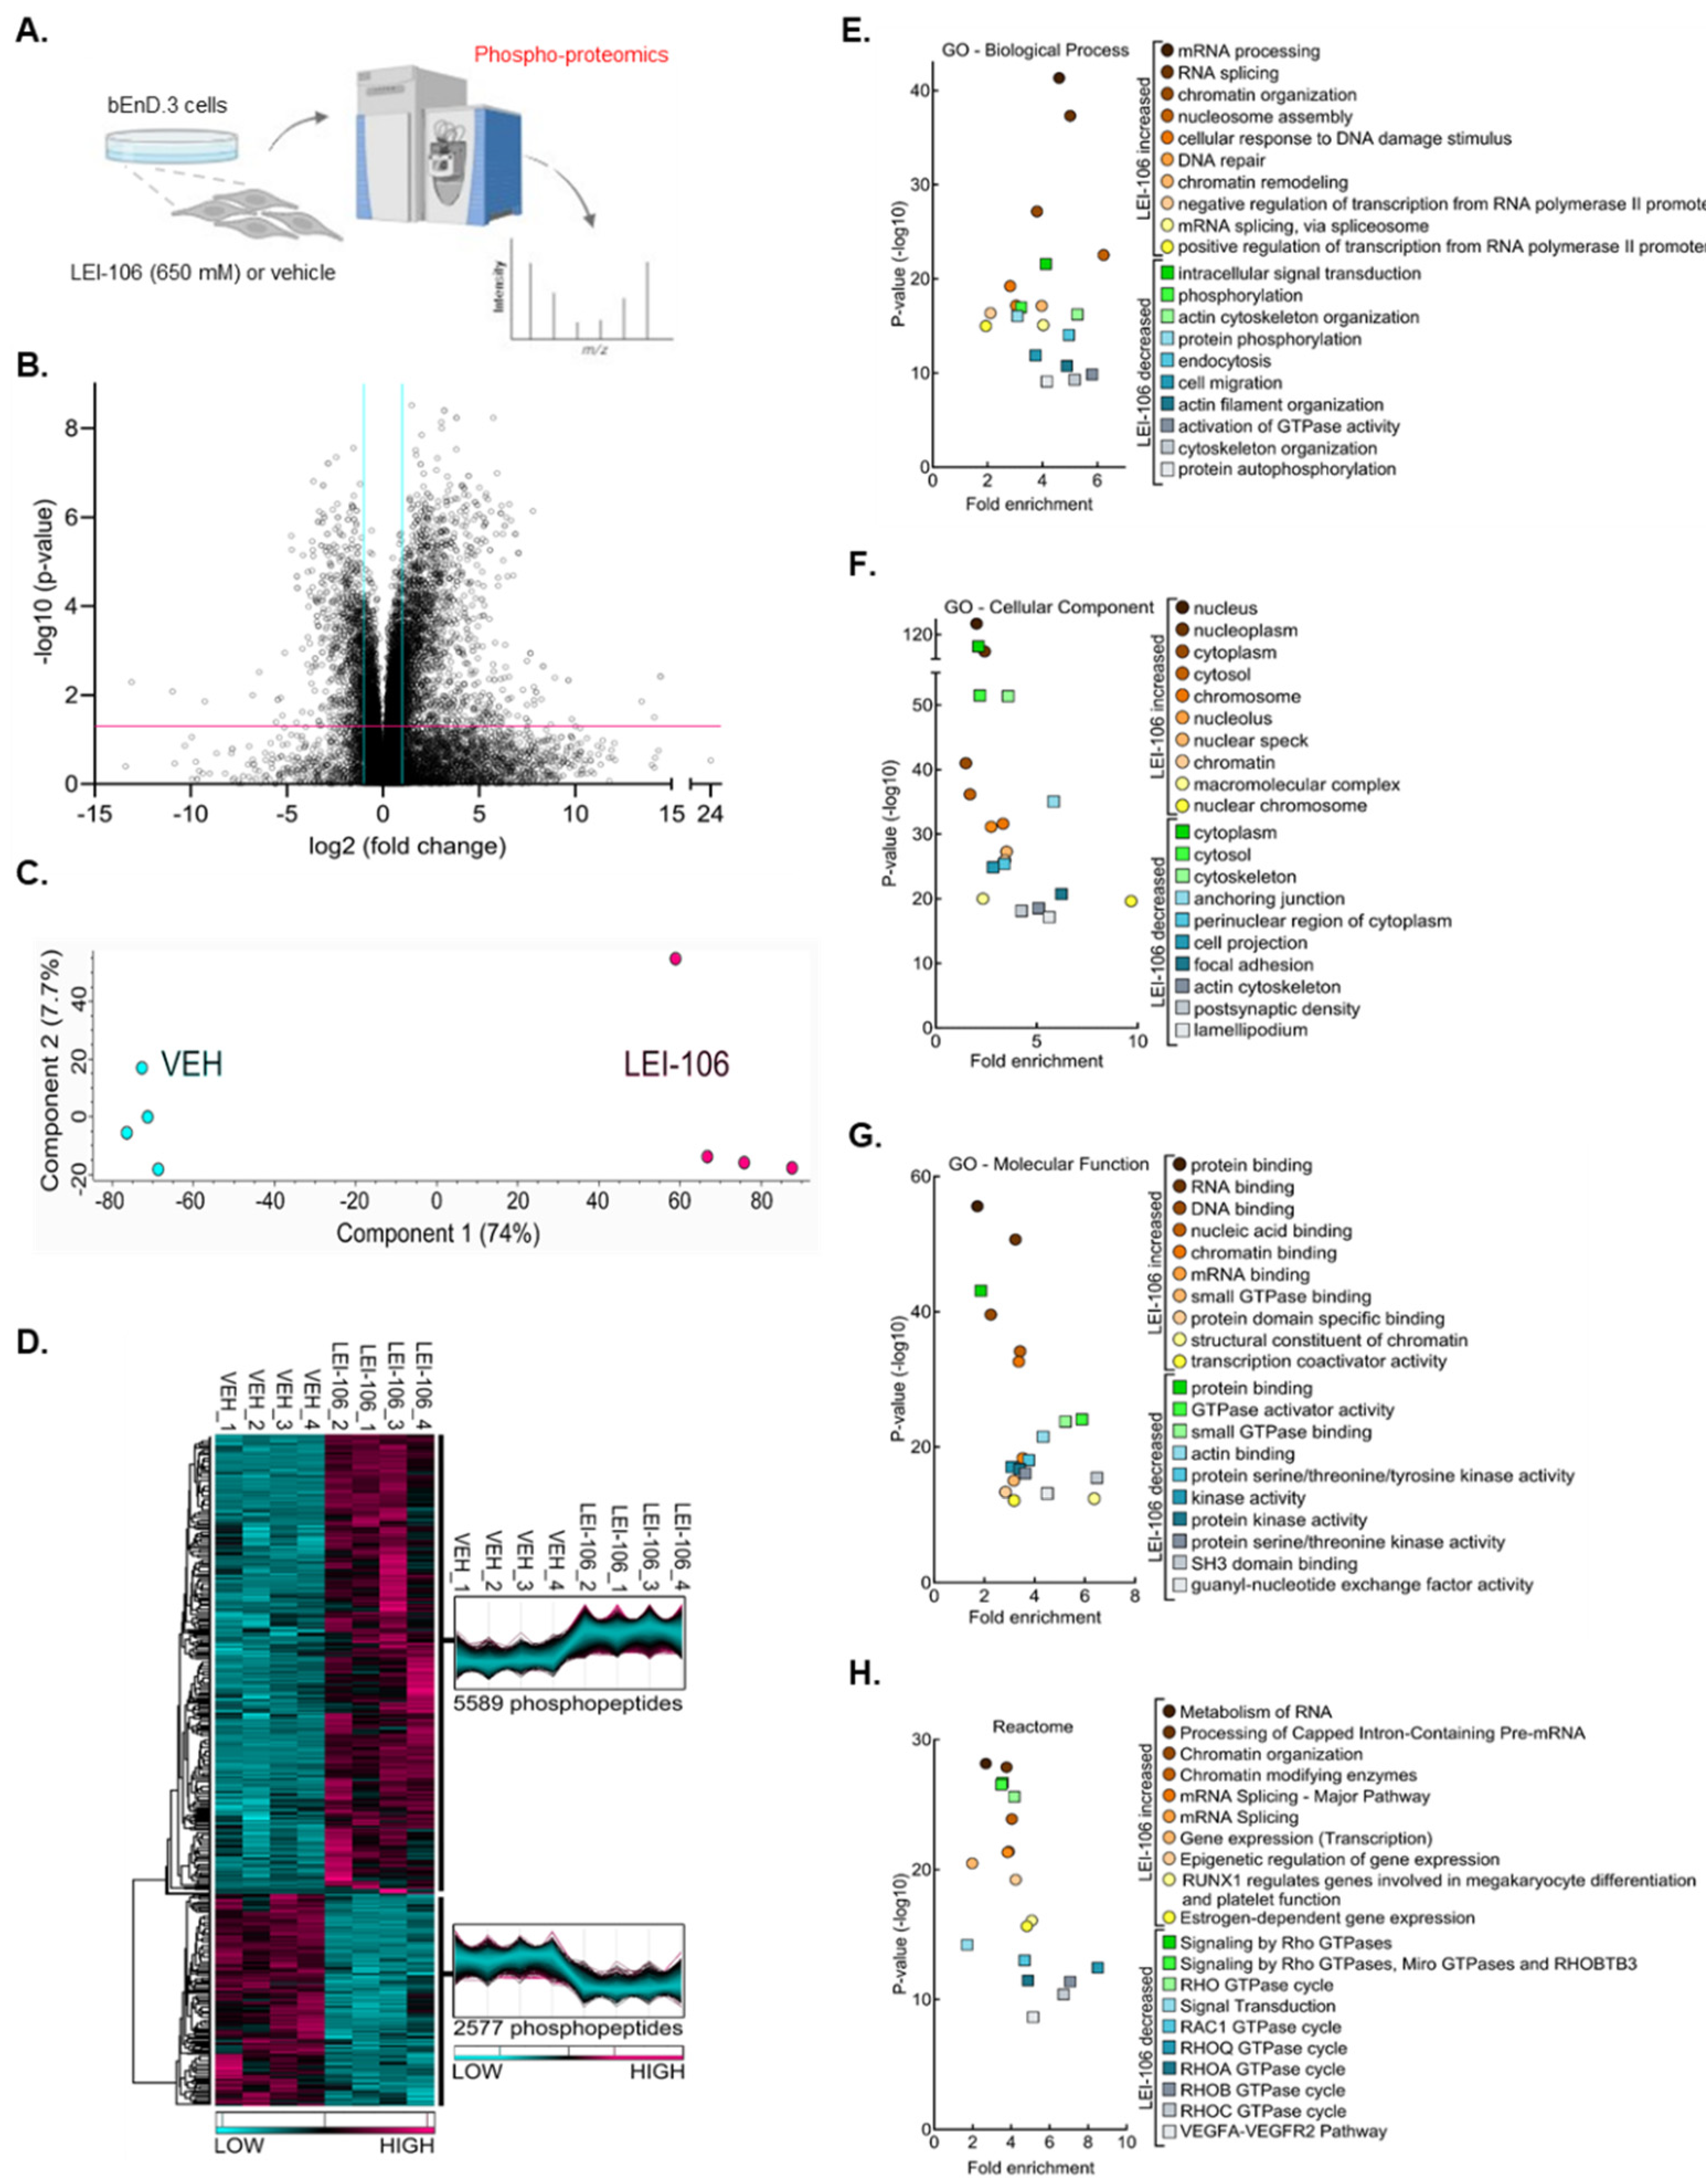
To further elucidate the effect of DAGLα inhibition in endothelial cells, an unbiased phosphoproteomics screen was performed on bEnd.3 cells treated with either vehicle or the DAGLα inhibitor LEI-106 (
Figure 7A). Mass spectrometry analysis of the phosphopeptides purified from the bEnd.3 lysates detected a total of 24,505 phosphopeptide ions (
Supplemental Tables S1–S5), of which 8,166 posessed significantly different abundances between the two groups (
Figure 7B - VOLCANO). Unbiased principal component analysis (PCA) of the significantly affected phosphopeptide ions clustered the samples according to treatment, supporting the strength of the effect of LEI-106 inhibitor on changes in phosphorylation (
Figure 7C - PCA). While within-group variance along component 2 accounted for only 7.7% of the variance, the LEI-106-treated samples did exhibit more pronounced phosphopeptide ion abundance heterogeneity as compared to the vehicle controls. Hierarchical protein clustering, heatmap visualization and protein cluster profiles of the 8,166 significantly affected phosphopeptide ions confirmed that samples within groups cluster together, supporting reproducibility of the findings (
Figure 7D – HEAT MAP). Of the 8,166 significantly affected phosphopeptide ions, 5,589 (68.4%) exhibited a greater abundance after the LEI-106 treatment (Supplemental
Table S3) while 2,577 phosphopeptide ions underwent a decrease as compared to vehicle treatment (
Figure 7D – HEAT MAP). Of these, and related to the pharmacological experiment in
Figure 6, ROCK 2 had sites (
1121-SQLQALHIGMD
SSSIG
SGPGDAEPDDGFPESR
-1152 that were significantly decreased by LEI106 (p<0.001,
Supplemental Table S1). Gene Ontology enrichment analysis of the proteins displaying significant changes in phosphopeptide ion abundance after LEI-106 treatment was performed for biological processes, cell compartment, and molecular function; Reactome pathways were also assessed (
Figure 7 E-H). Proteins displaying a significant loss in phosphopeptide ion abundance after LEI-106 treatment revealed gene ontology enrichment for cytoskeletal organization, activation of GTPase activity including RHO isoform cycling, actin binding, focal adhesions, and VEGFA-VEGFR2 pathways. LEI-106 significantly increased phosphorylation of proteins involved in mRNA processing and binding as well as pathways regulating mRNA splicing, RUNX1 mediated gene regulation, and estrogen dependent gene expression. Proteomics data also suggets changes of ZO-1 after DAGLα inhibition. In order to confirm that finding, Western experiment was peformed to detect ZO-1 expression after LEI-106 treatment. The blockade of DAGLα significantly reduced the detection of ZO1 as compared to vehicle control (
Suppl Figure S2) (vehicle vs. LEI-106-650 uM: p=0.034, vehicle vs. LEI-106-1.3 mM: p=0.0004, as assessed by one-way ANOVA with Tukey post-test, n=3-4/condition). Together, these data suggest that disruption of 2-AG homeostasis by DAGLα inhibition significantly alters the phospho-proteome of bEnd.3 cells.
