Submitted:
07 December 2023
Posted:
07 December 2023
You are already at the latest version
Abstract
Keywords:
1. Introduction
2. Test Sections and Methods
2.1. Test Sections
2.2. Test Methods
2.2.1. CiCS of Multifunctional Automatic Pavement Detection Vehicle
2.2.2. On-board Sound Intensity (OBSI) Tire/Pavement Noise Test
2.3. Characteristic Indexes
3. Result and Analysis
3.1. Development Trend of Service Performance of Porous Asphalt Pavement
3.2. Tire/Pavement Noise Analysis Based on the OBSI Method
3.3. Correlation Analysis on OBSI and Pavement Performance Indicators
4. Conclusions
Author Contributions
Funding
Institutional Review Board Statement
Informed Consent Statement
Data Availability Statement
Acknowledgments
Conflicts of Interest
References
- Stempihar, J.J.; Pourshams, M.T.; Kaloush, K.E.; Rodezno, M.C. Porous Asphalt Pavement Temperature Effects for Urban Heat Island Analysis. Transportation Research Record: Journal of the Transportation Research Board. 2012, 2293, 123-130.
- Michiyuki, Y.; Hiroshi, N.; Takuya, M. Sound absorption mechanism of porous asphalt pavement. Journal of Ince/japan. 1999, 25, 29-43.
- Schaus, L.; Tighe, S.L.; Uzarowski, L. Porous Asphalt Pavement Designs: Canadian Climate Use. Transportation Research Board Meeting. 2008.
- Pakholak, R.; Plewa, A.; Gardziejczyk, W. Influence of Type of Modified Binder on Stiffness and Rutting Resistance of Low-Noise Asphalt Mixtures. Materials (Basel). 2021, 14, 2884. [CrossRef] [PubMed]
- Rassoshenko, I.; Nikitenko, A.; Ivanov, N. Low-Noise Asphalt Application and Its Efficiency Analysis. Akustika. 2019. 34, 127-131. [CrossRef]
- Mo, L.T.; Huurman, M.; Woldekidan, M.F.; Wu, S.P.; Molenaar, A. Investigation into material optimization and development for improved ravelling resistant porous asphalt concrete. Materials & Design. 2010, 31, 3194-3206. [CrossRef]
- Hauwermeiren, W.V.; David, J.; Dekoninck, L. Assessing Road Pavement Quality Based on Opportunistic In-car Sound and Vibration Monitoring. International Congress on Sound and Vibration. 2019.
- Awwal, A.; Mashros, N.; Hasan, S.A.; Hassan, N.A.; Rahman, R. Road Traffic Noise for Asphalt and Concrete Pavement. IOP Conference Series Materials Science and Engineering. 2021, 1144, 012082. [CrossRef]
- Vaitkus, A.; Skrodenis, D.; Ernas, O.; Vorobjovas, V. Surface Texture And Layer Permeability Of Aquaplaning Resistant Asphalt Pavements. IOP Conference Series: Materials Science and Engineering. 2021, 1202, 012026. [CrossRef]
- Li, M.; Lu, H.; Li, J.; Mao, Q.; Chen, L. Performance study and application of porous ultra-thin wearing course for asphalt pavement maintenance. IOP Conference Series: Materials Science and Engineering. 2021, 1075, 012014. [CrossRef]
- Rita Kleizien, O.S.; Simanavitiene AVaR. Asphalt Pavement Acoustic Performance Model. Sustainability. 2019, 11, 2938. [CrossRef]
- Pizzo, L.; Bianco, F.; Moro, A.; Schiaffino, G.; Licitra, G. Relationship between tyre cavity noise and road surface characteristics on low-noise pavements. Transportation Research Part D Transport and Environment. 2021, 98, 102971. [CrossRef]
- Spies, L.; Li, T.; Burdisso, R.; Sandu, C. An artificial neural network (ANN) approach to model Tire-Pavement interaction noise (TPIN) based on tire noise separation. Applied Acoustics. 2023, 206, 109294. [CrossRef]
- Shen, D.H.; Wu, C.M.; Du, J.C. Application of Grey Model to Predict Acoustical Properties and Tire/Road Noise on Asphalt Pavement. IEEE Intelligent Transportation Systems Conference. 2006.
- Faßbender, S.; Oeser, M. Investigation on an Absorbing Layer Suitable for a Noise-Reducing Two-Layer Pavement. Materials 2020, 13, 1235. [CrossRef]
- Zhang, H.; Liu, Z.; Meng, X. Noise reduction characteristics of asphalt pavement based on indoor simulation tests. Construction and Building Materials. 2019. 215(AUG.10): 285-297. [CrossRef]
- Jin, D.; Ge, D.; Wang, J.; Malburg, L.; You, Z. Reconstruction of Asphalt Pavements with Crumb Rubber Modified Asphalt Mixture in Cold Region: Material Characterization, Construction, and Performance. Materials. 2023, 16, 1874. [CrossRef] [PubMed]
- Jaskula, P.; Ejsmont, J.A.; Gardziejczyk, W.; Mioduszewski, P.; Stienss, M.; Motylewicz, M.; Szydlowski, C.; Gierasimiuk, P.; Rys, D.; Wasilewska, M. Bitumen-Based Poroelastic Pavements: Successful Improvements and Remaining Issues. Materials. 2023, 16, 983. [CrossRef] [PubMed]
- Chu, L.; Tan, K.H.; Fwa, T.F. Evaluation of wearing course mix designs on sound absorption improvement of porous asphalt pavement. Construction and Building Materials. 2017, 141, 402-409. [CrossRef]
- Gao, L.; Wang, Z.; Xie, J.; Wang, Z.; Li, H. Study on the sound absorption coefficient model for porous asphalt pavements based on a CT scanning technique. Construction and Building Materials. 2020, 230, 117019. [CrossRef]
- Mahmud, M., Hassan, N.A.; Hainin, M.R.; Che, R.I.; Mashros, N. Characterisation of microstructural and sound absorption properties of porous asphalt subjected to progressive clogging. Construction and Building Materials. 2021, 283, 122654. [CrossRef]
- Ni. T.Y.; Jiang, C.H.; Tai, H.X.; Zhao, G.Q. Experimental Study on Sound Absorption Property of Porous Concrete Pavement Layer. Applied Mechanics and Materials. 2014, 507, 238-241. [CrossRef]
- Zhang, Y.; Li, H.; Abdelhady, A.; Du, H. Laboratorial investigation on sound absorption property of porous concrete with different mixtures. Construction and Building Materials. 2020, 259, 120414. [CrossRef]
- Xu, B. Li, M.; Liu, S.; Fang, J.; Ding, R.; Cao, D. Performance analysis of different type preventive maintenance materials for porous asphalt based on high viscosity modified asphalt. Construction and Building Materials. 2018, 191, 320-329. [CrossRef]
- Zw, A.; Jx, A.; Lei, G.A.; Ml, B.; Yl, A. Improvement of acoustic model and structural optimization design of porous asphalt concrete based on meso-structure research. Construction and Building Materials. 2020, 265, 120327.
- Chen, D.; Ling, C.; Wang, T.; Su, Q.; Ye, A. Prediction of tire-pavement noise of porous asphalt mixture based on mixture surface texture level and distributions. Construction and Building Materials. 2018, 173, 801-810. [CrossRef]
- Alber, S.; Ressel, W.; Liu, P.; Wang, D.; Oeser, M. Influence of soiling phenomena on air-void microstructure and acoustic performance of porous asphalt pavement. Construction and Building Materials. 2018, 158, 938-948. [CrossRef]
- Amrina, R.J.A.; Buchari, E. Evaluation Pavement Deteriorating Condition on Surface Distress Index (SDI) Data Using Radial Basis Function Neural Networks (RBFNN). Journal of Physics: Conference Series, 2019, 032008.
- Hao, W.; Wang, Z.; Evaluation of pavement surface friction subject to various pavement preservation treatments. Construction & Building Materials. 2013, 48, 194-202.
- Afarin, K.; Amir, G. Machine learning for developing a pavement condition index. Automation in Construction. 2022, 139, 104296.
- Piryonesi, S.M.; Tamer, E.; Examining the relationship between two road performance indicators: Pavement condition index and international roughness index. Transportation Geotechnics. 2021, 100441. [CrossRef]
- Cao, L.; Li, L.W.; Yang, C.; Zhang, B.; Dong, Z. Performance prediction of expressway pavement in high maintenance level areas based on cosine deterioration equation: A case study of Zhejiang Province in China. Journal of Road Engineering. 2022, 267-278. [CrossRef]
- Vaitkus, A.; Cygas, D.; Motiejunas, A.; Pakalnis, A.; Miskinis, D. Improvement of road pavement maintenance models and technologies. Baltic Journal of Road & Bridge Engineering. 2016, 11, 242-249. [CrossRef]
- Ganji, MR.; Golroo, A.; Sheikhzadeh, H.; Ghelmani, A.; Bidgoli, MA. Dense-graded asphalt pavement macrotexture measurement using tire/road noise monitoring. Automation in Construction. 2019, 106, 102887. [CrossRef]
- Lei J., Zheng N., Chen X.,et al; Research on the relationship between anti-skid performance and various aggregate micro texture based on laser scanning confocal microscope. Construction and Building Materials. 2022, 125984. [CrossRef]
- Zheng N, Bi J, Dong S, Lei J., He Y., Cui Z., Chen L.; Testing and evaluation for long-term skid resistance of asphalt pavement composite seal using texture characteristics. Construction and Building Materials. 2022, 129241.
- Víctor, V.; Fernando, T.; Pedro, H.; Santiago, P. Surface Aging Effect on Tire/Pavement Noise Medium-Term Evolution in a Medium-Size City. Coatings. 2018, 8, 206.
- Cedric, V.; Anneleen, B.; Barbara, V. The Acoustical Durability of Thin Noise Reducing Asphalt Layers. Coatings. 2016, 6, 21.
- Li, M.; Van, K.W.; Ceylan, H.; Tang, G.; Martin, V.D.V.; Molenaar, A. Influence of road surface characteristics on tire–road noise for thin-layer surfacings. Journal of Transportation Engineering, 2015, 141, 04015024. [CrossRef]
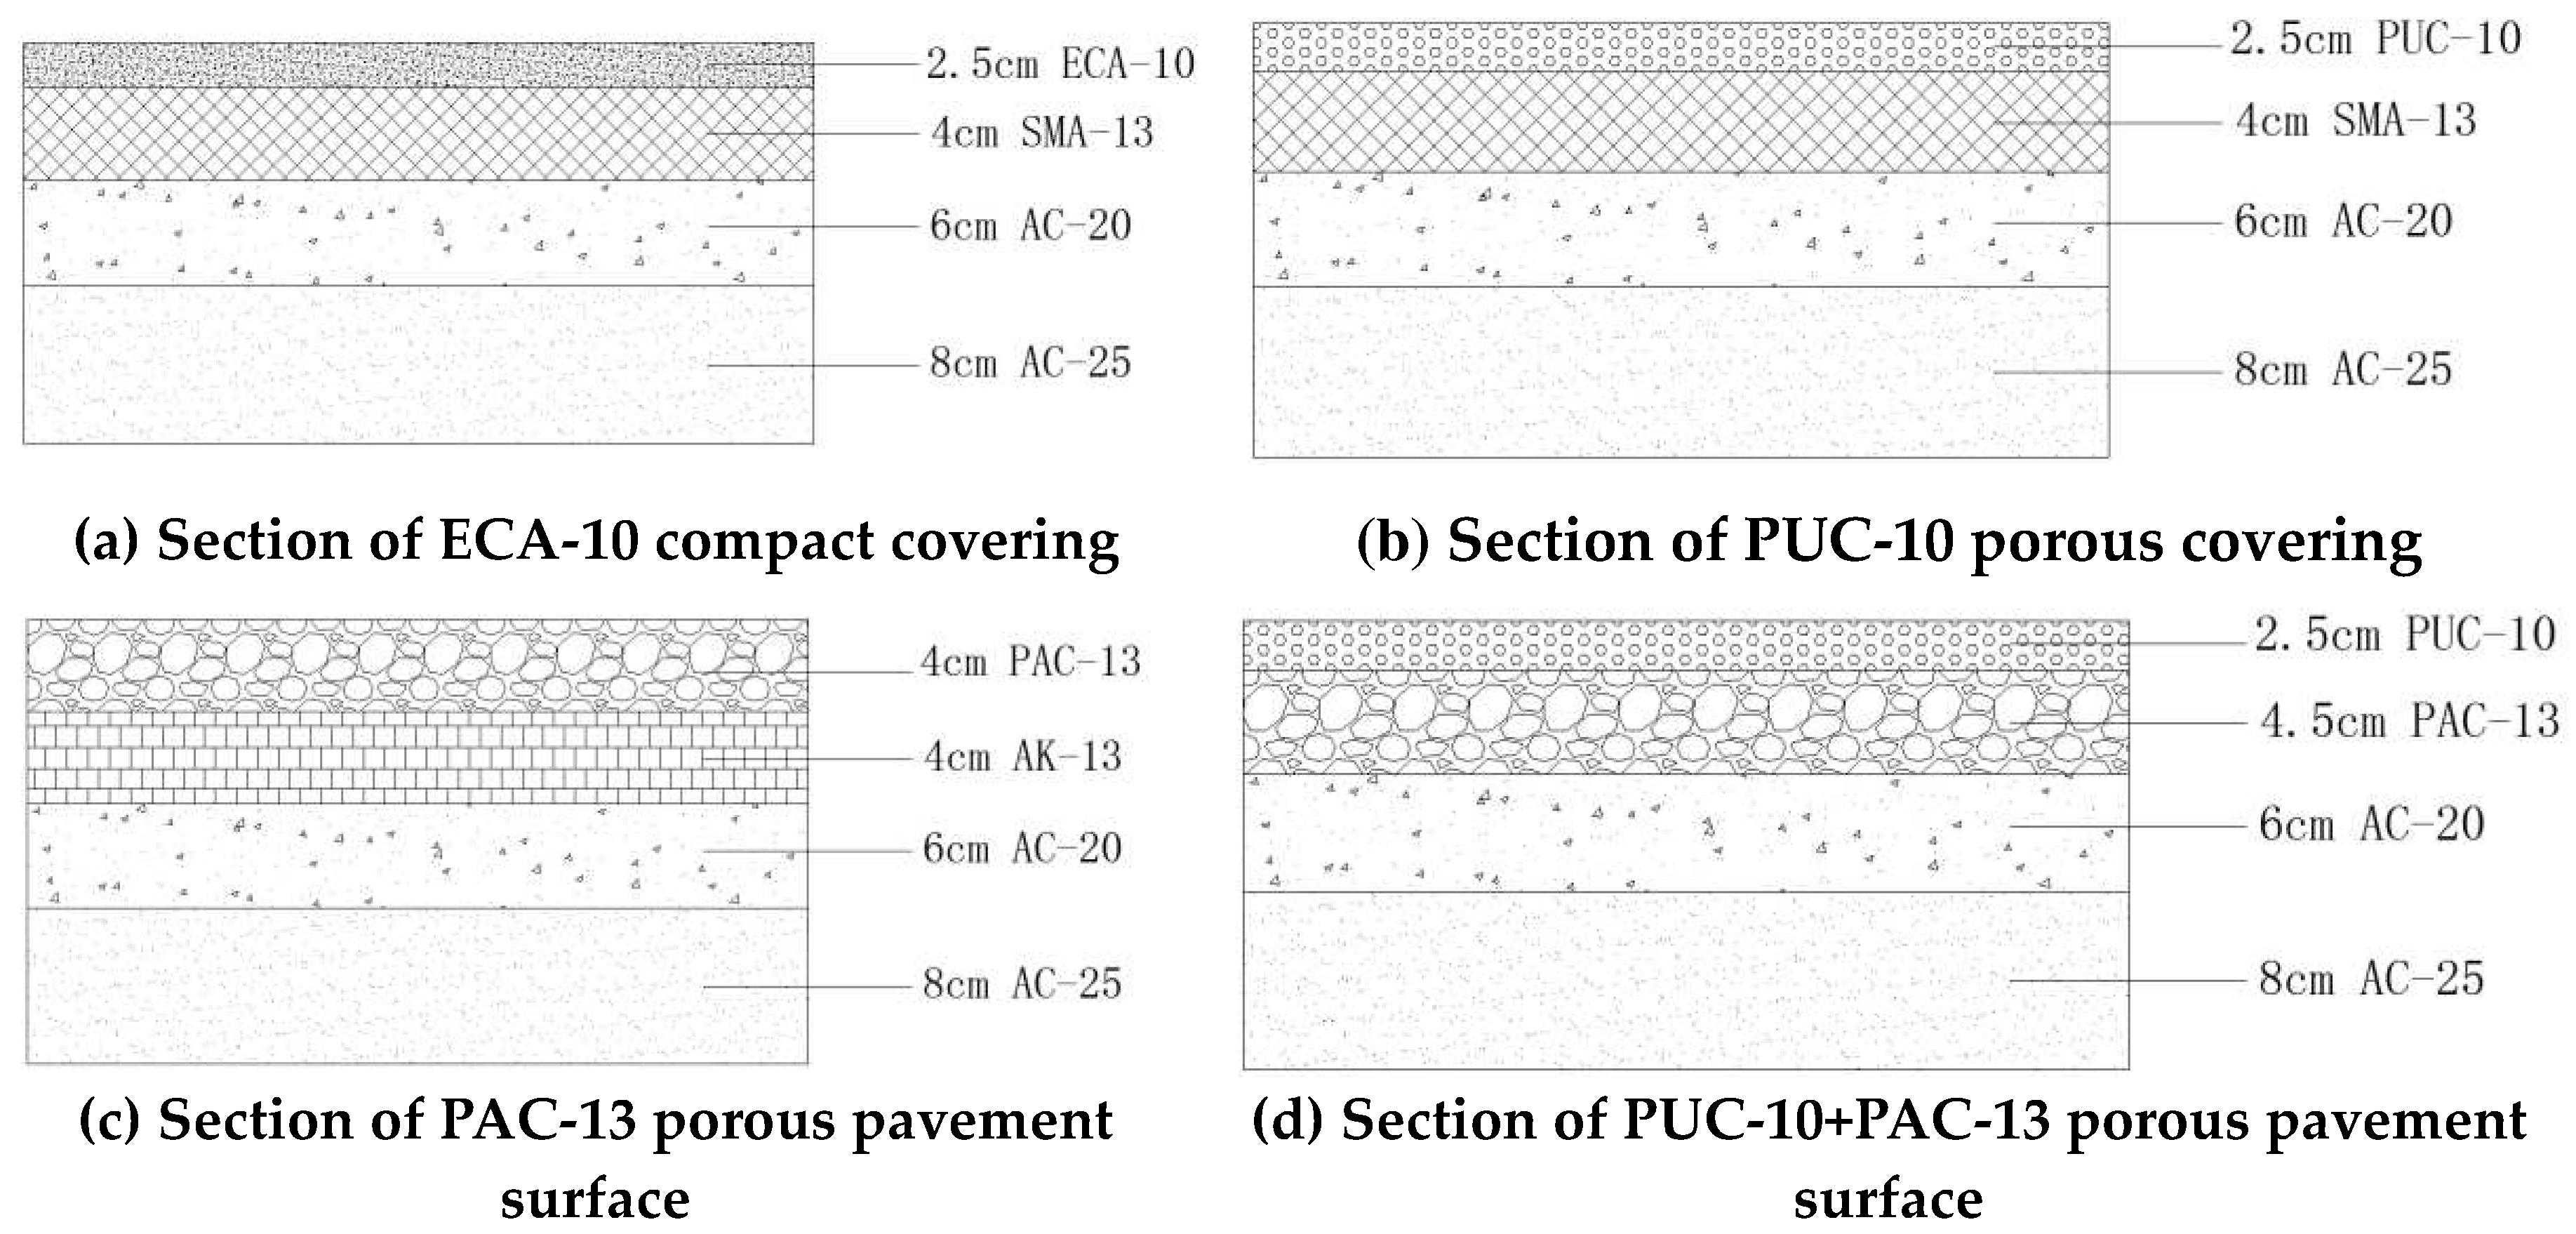
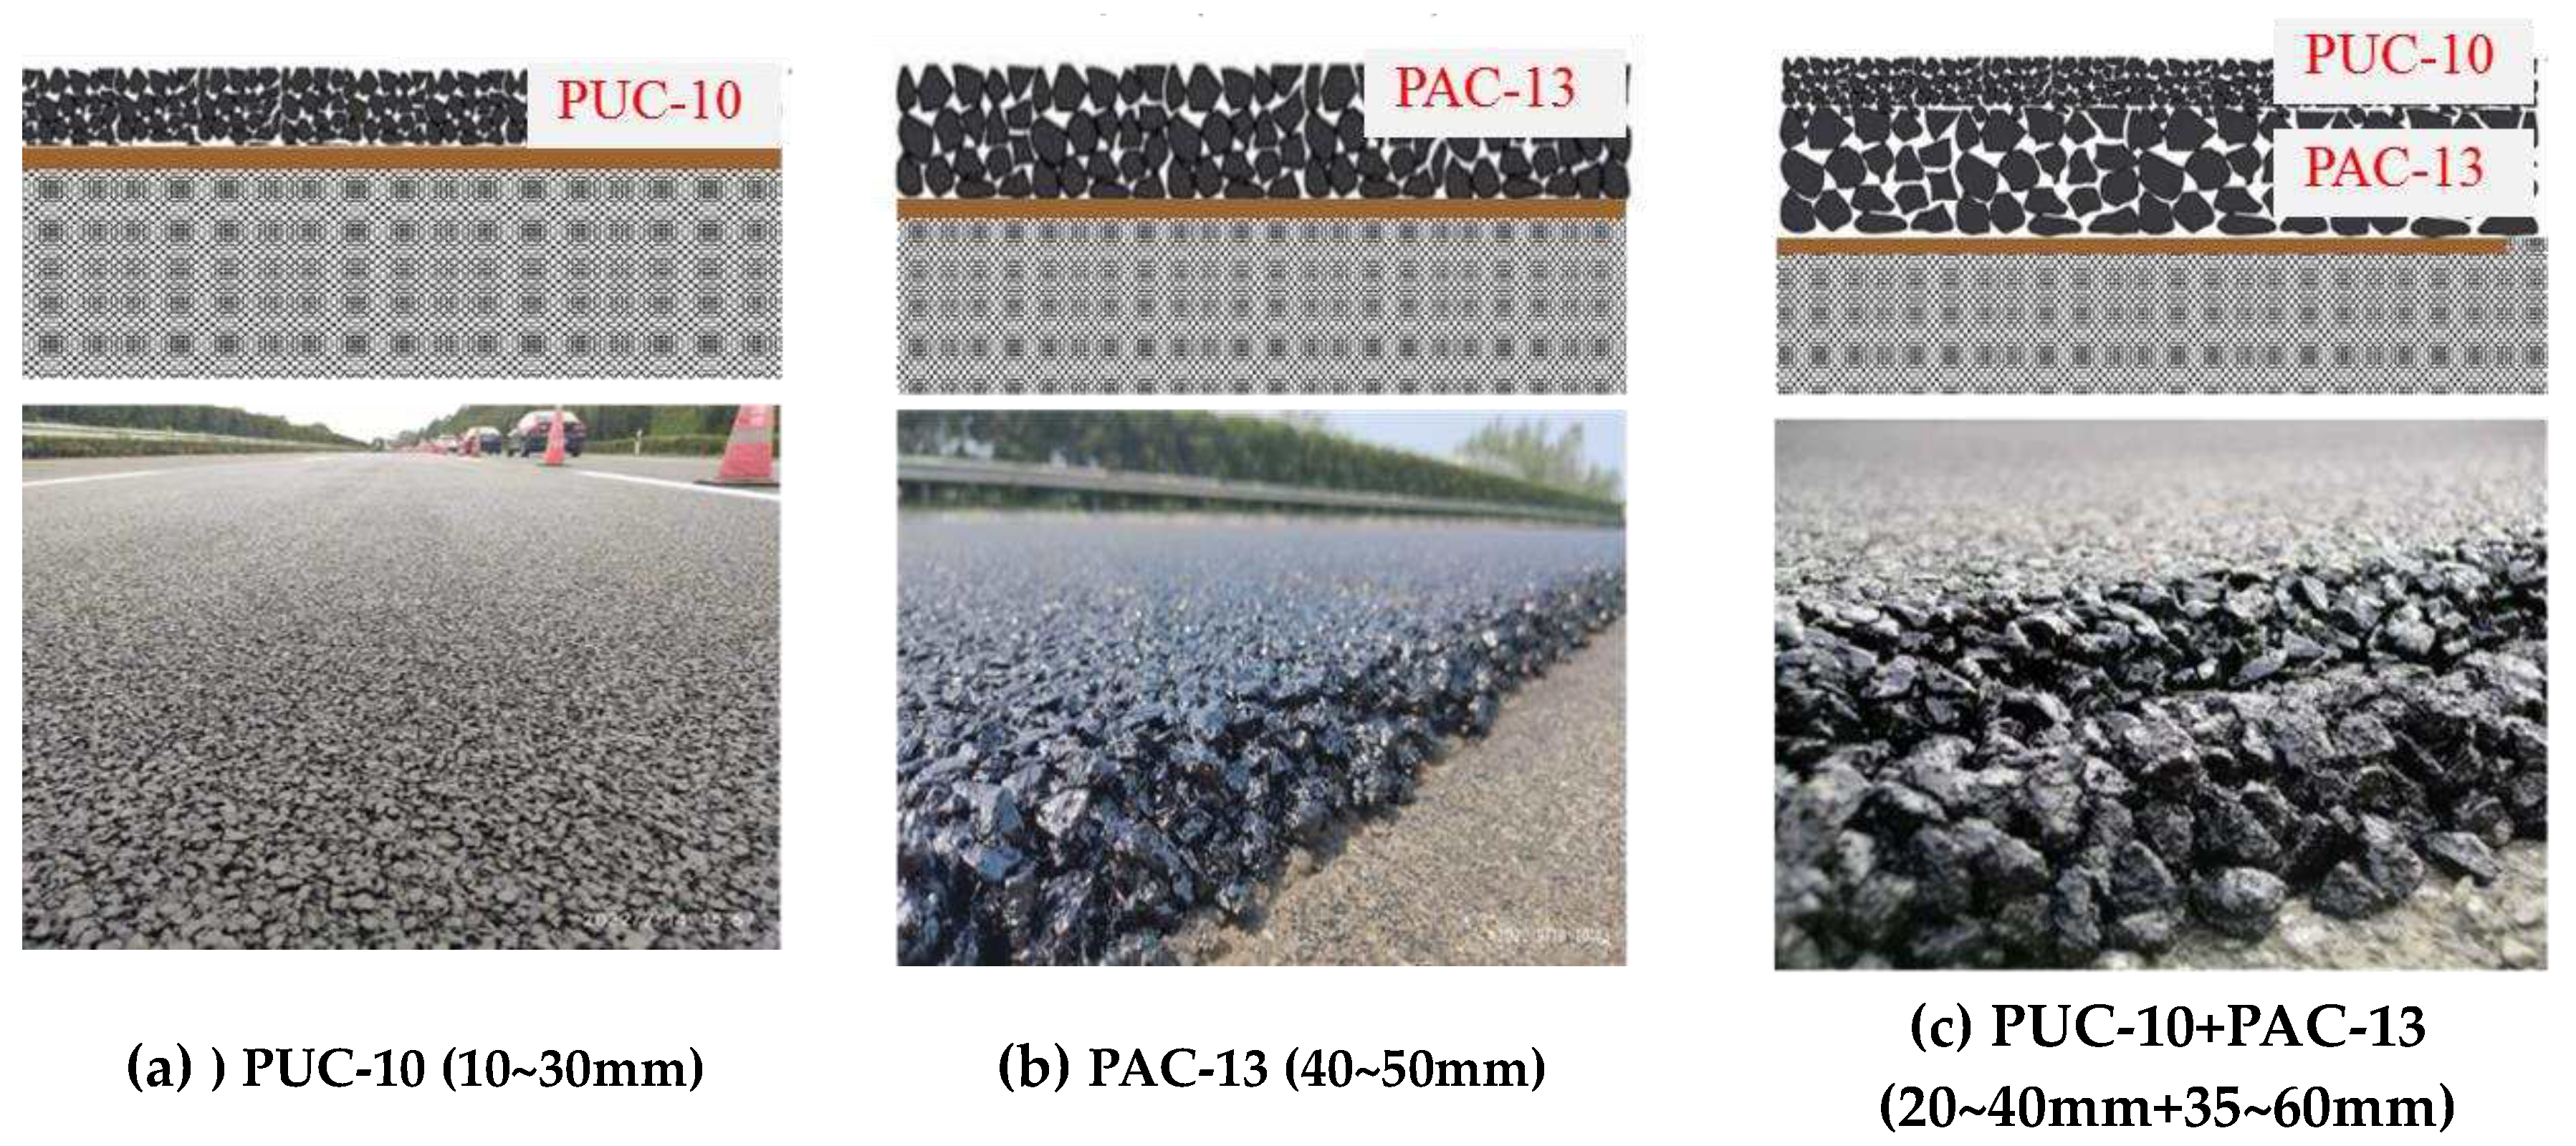

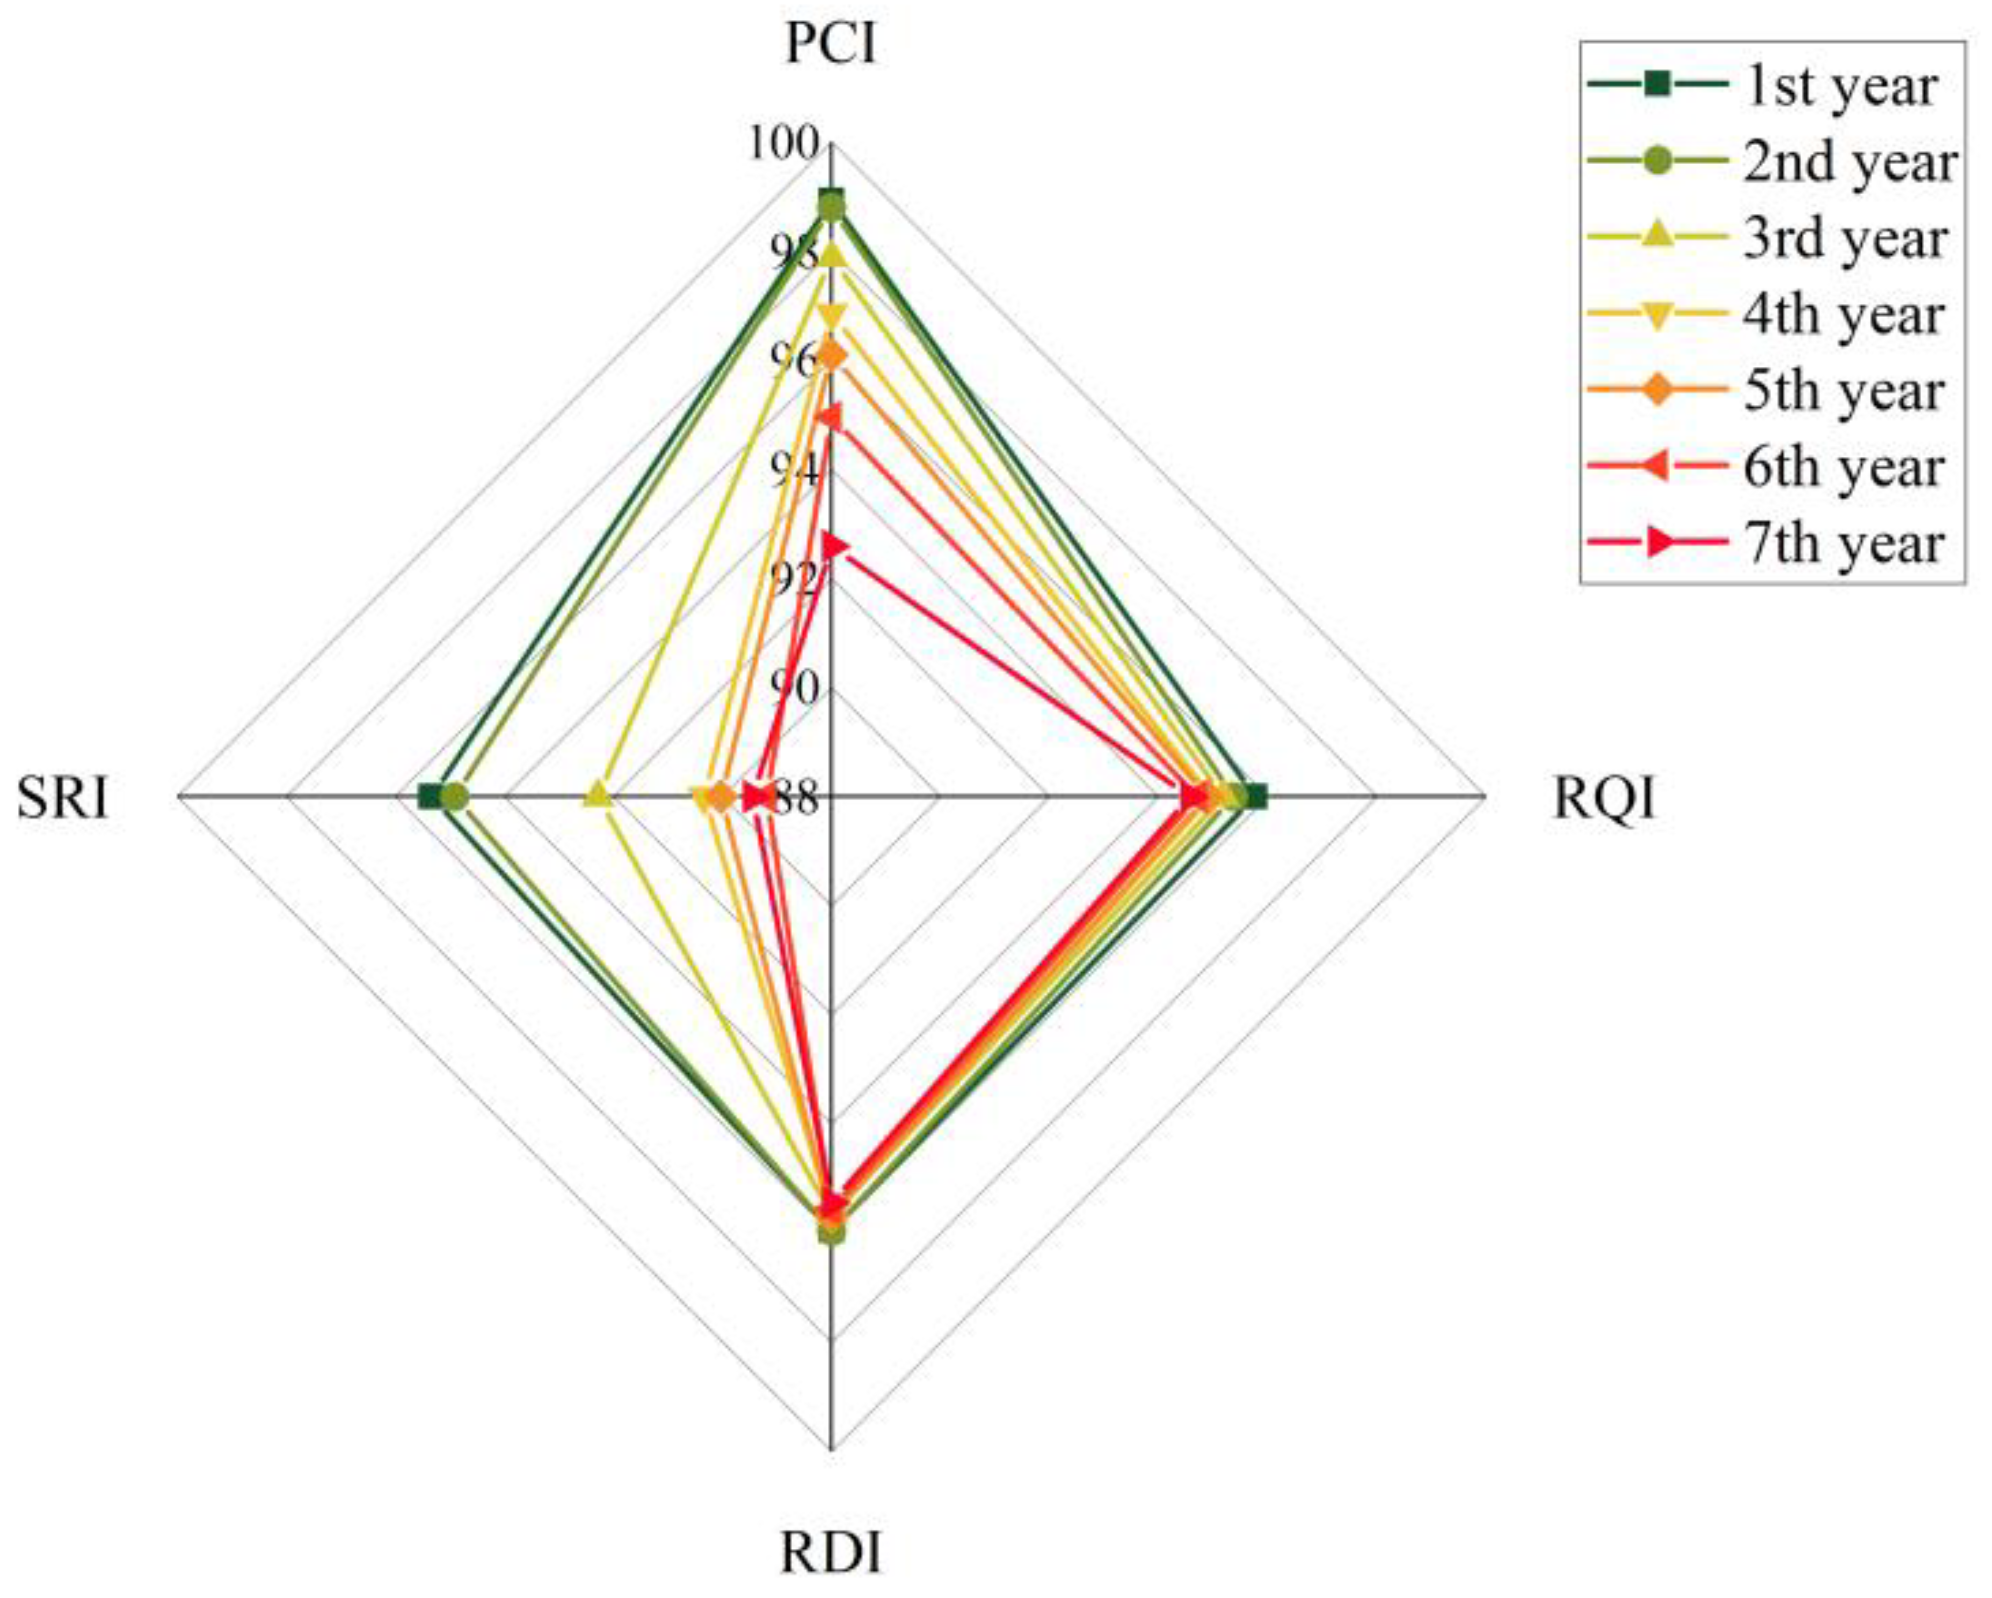
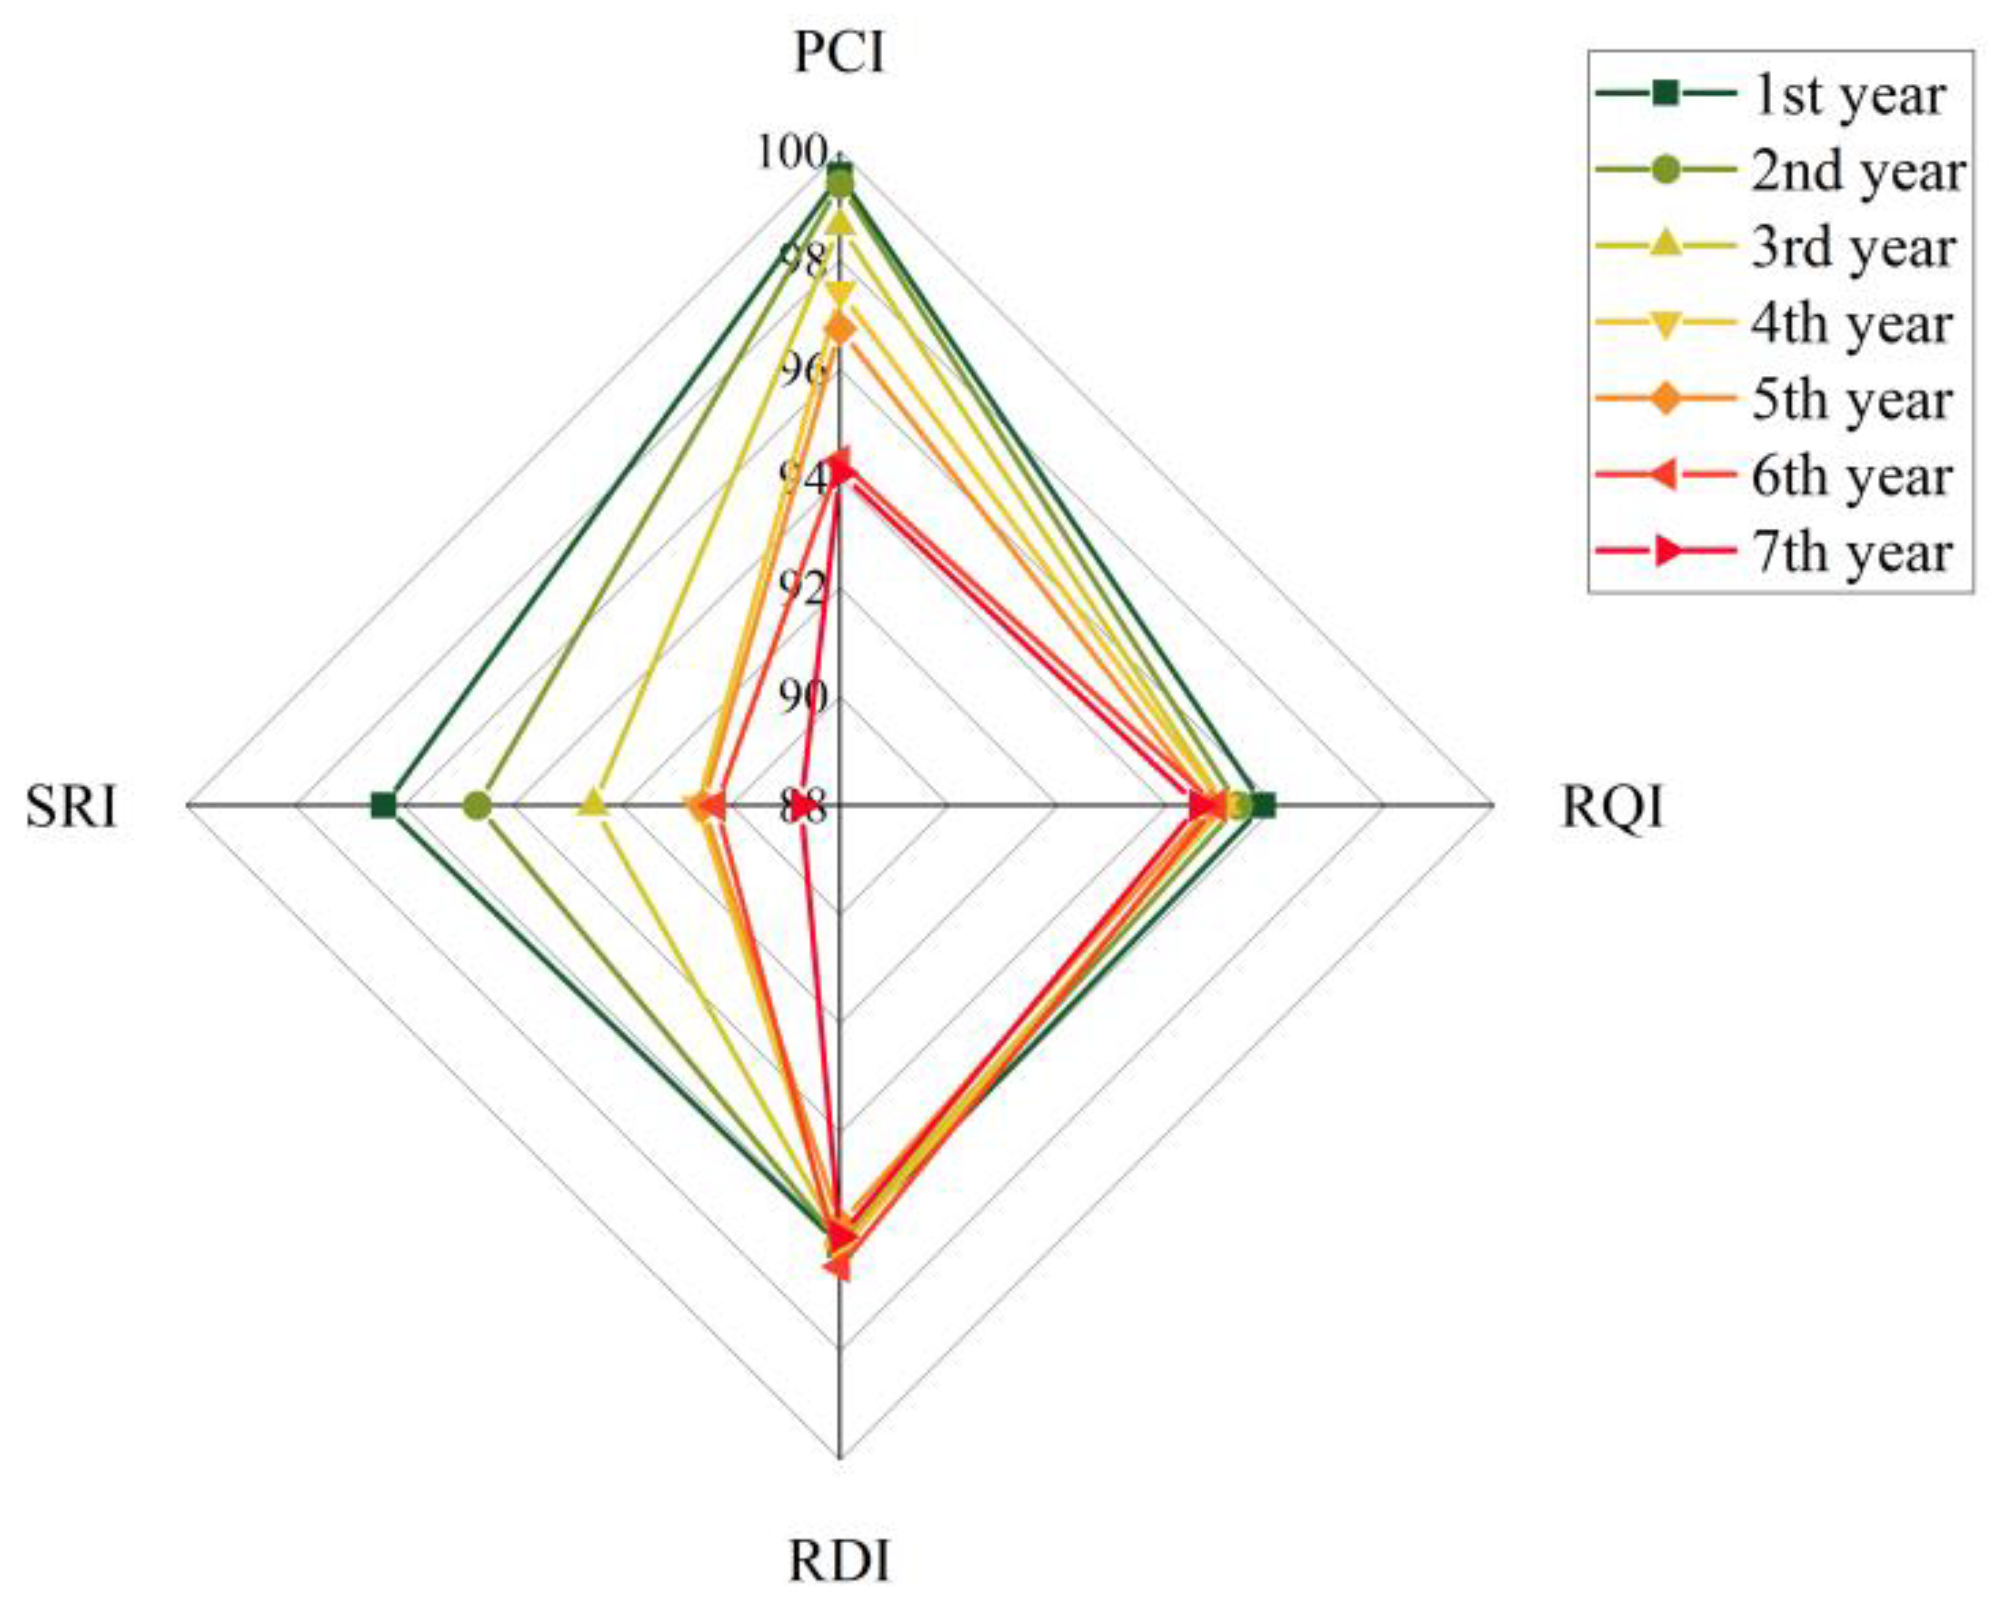
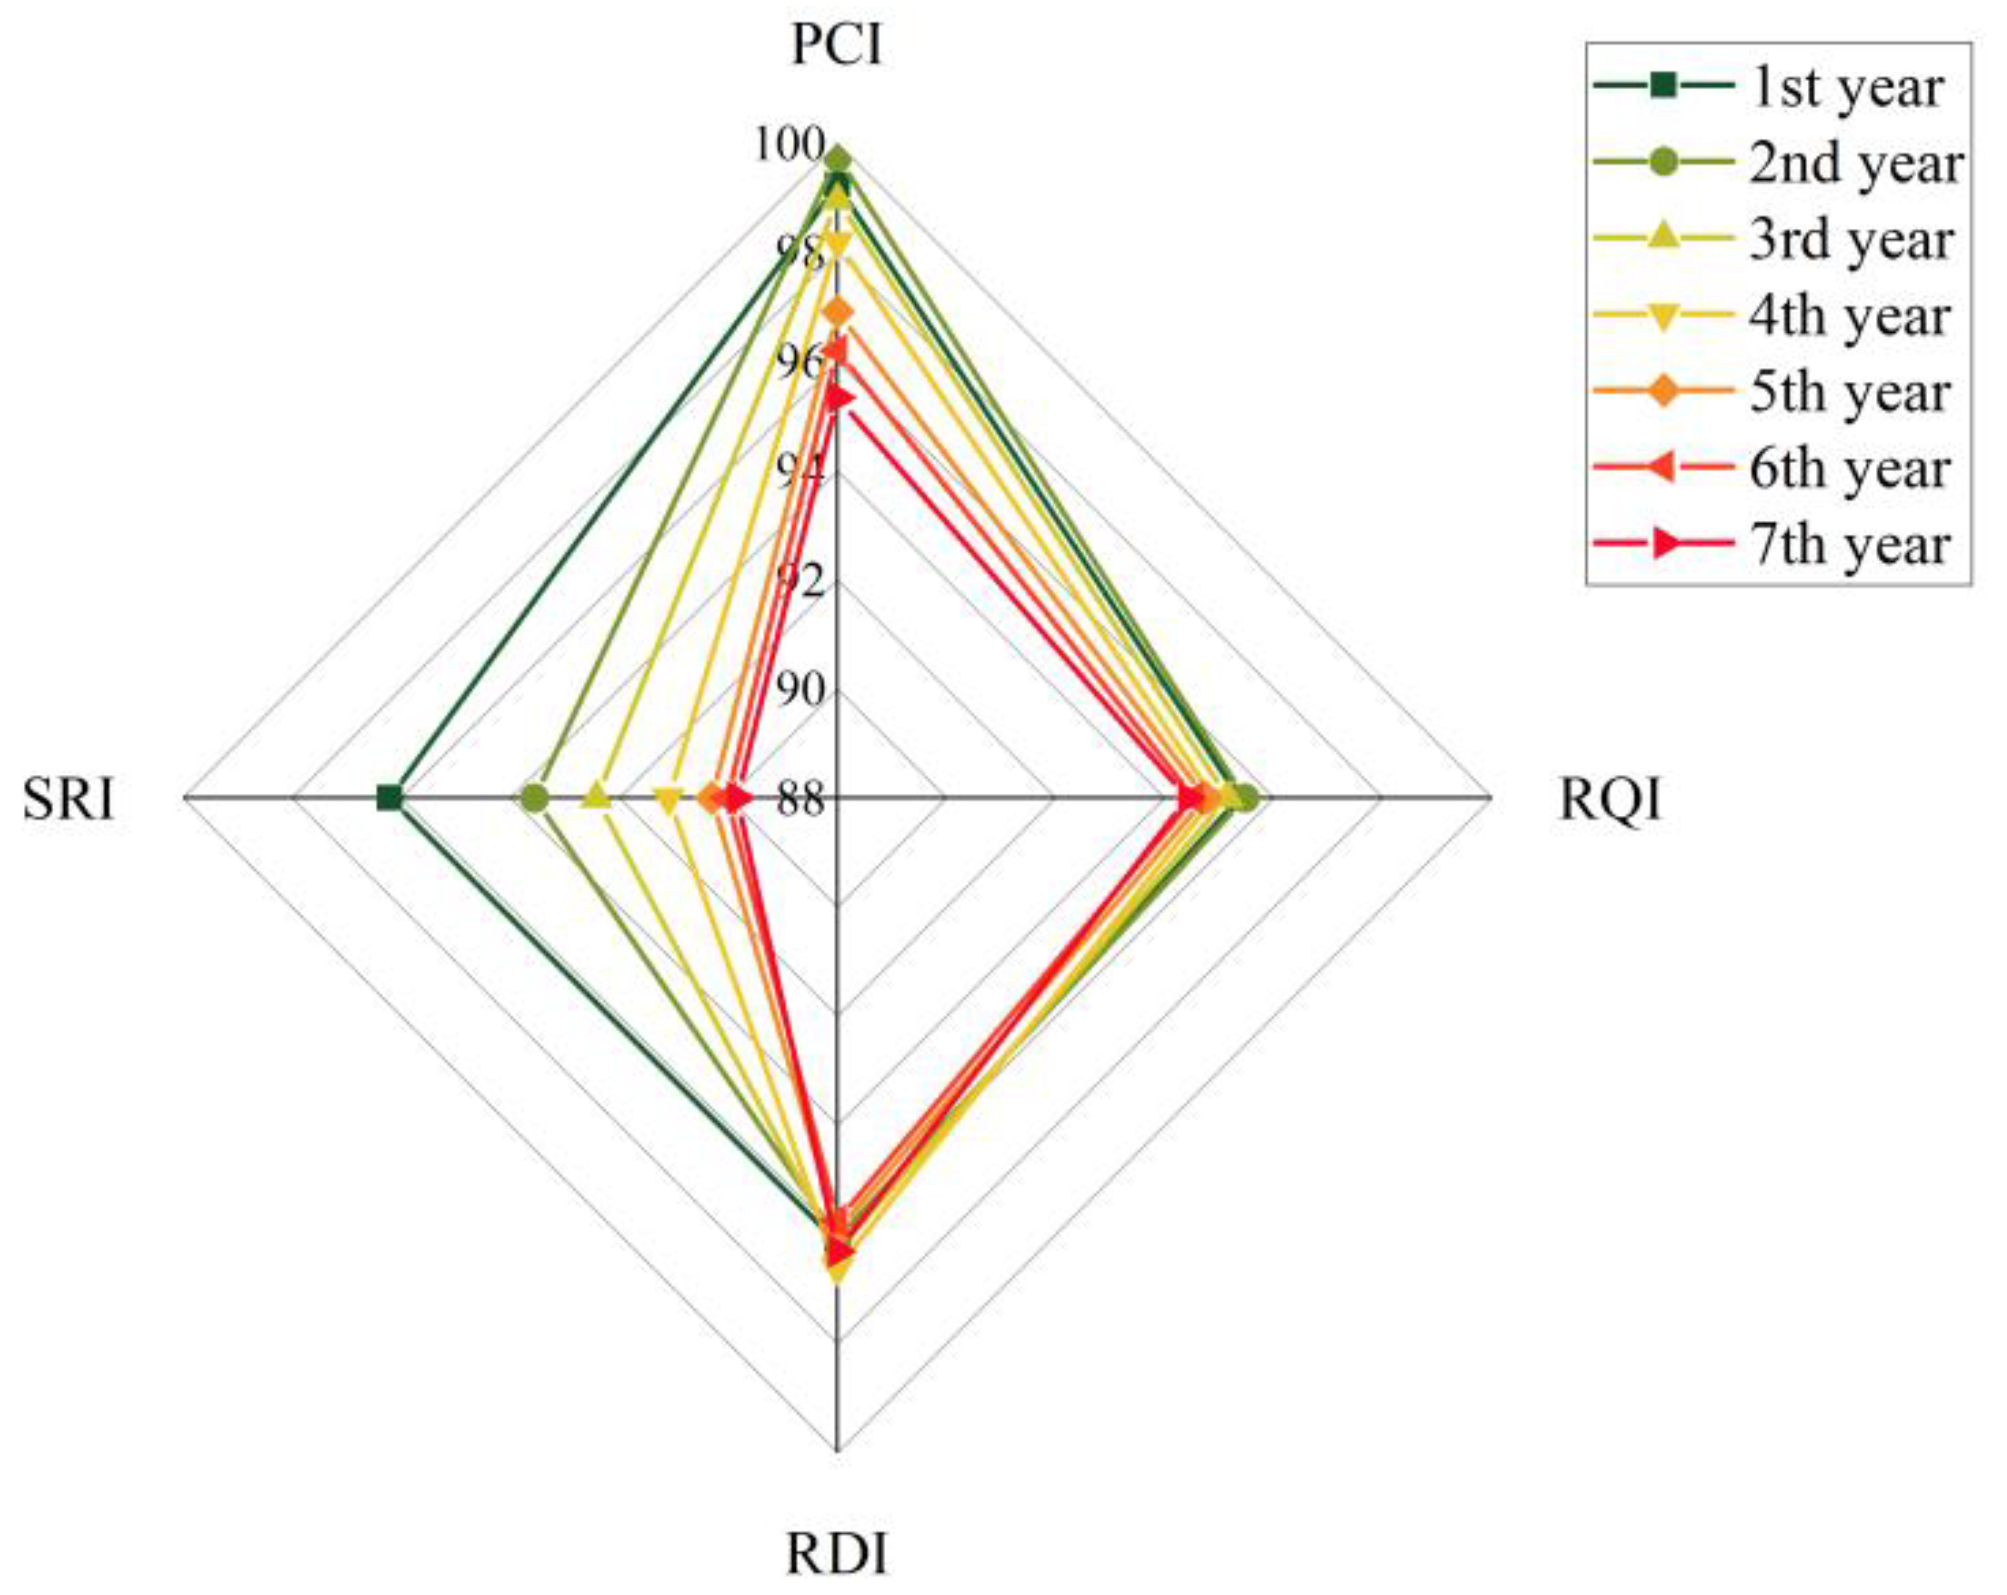
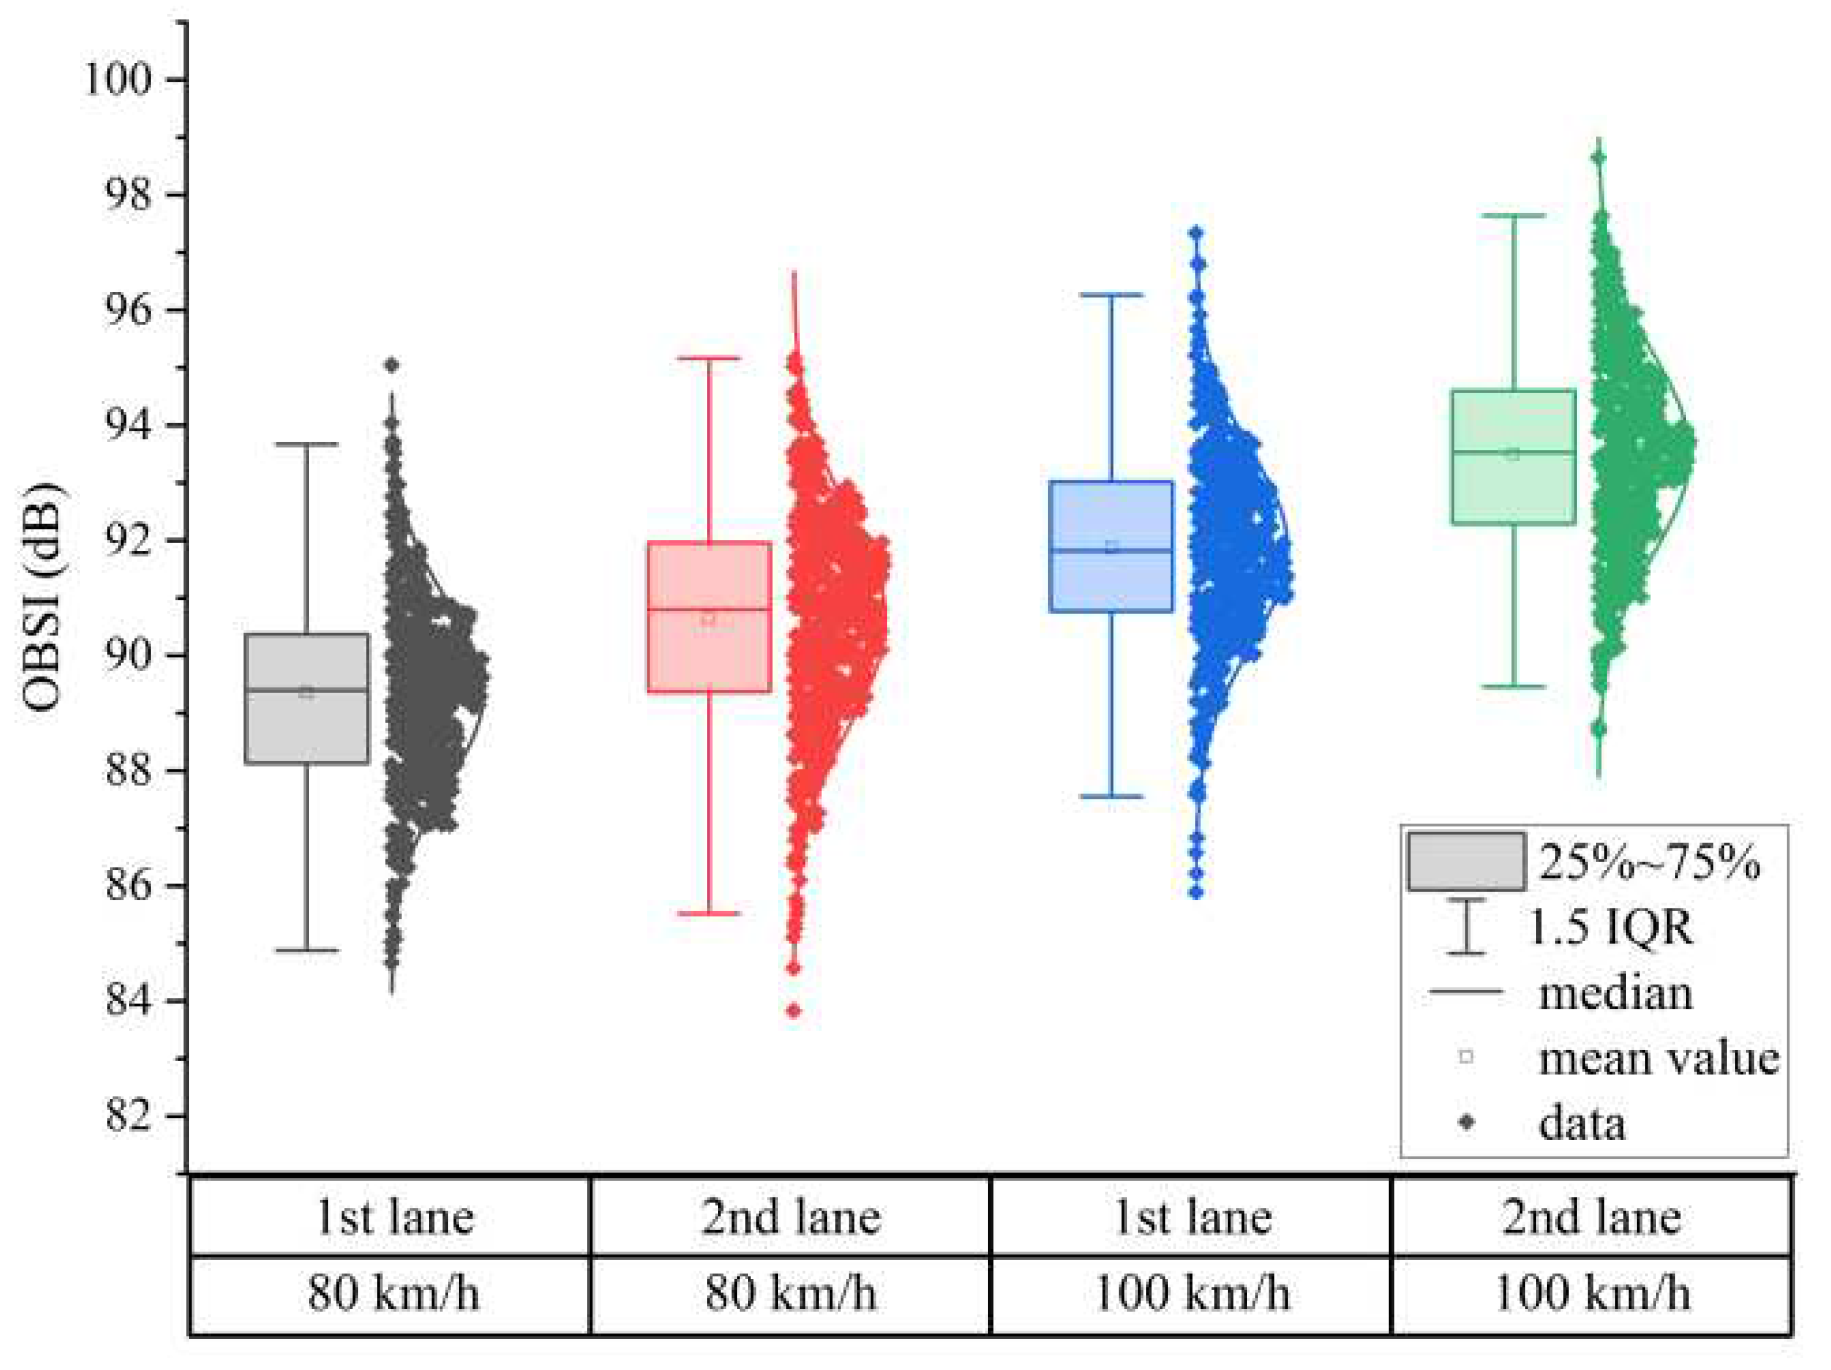
| Type of mixture | Passing percentage (%) of the following sieve holes (mm) | Polyester fiber content (%) | Asphalt-aggregate ration (%) | |||||||||||
|---|---|---|---|---|---|---|---|---|---|---|---|---|---|---|
| 16.0 | 13.2 | 9.5 | 7.5 | 6.7 | 4.75 | 2.36 | 1.18 | 0.6 | 0.3 | 0.15 | 0.075 | |||
| ECA-10 | 100 | 100 | 92.7 | - | 44.9 | 28.8 | 23.4 | 17.1 | 11.1 | 8.9 | 8 | 6.4 | 0.2 | 5.4 |
| PUC-10 | 100 | 100 | 90.0 | 72.0 | - | 25.3 | 12.3 | 11.9 | 9.1 | 7.5 | 6.4 | 5.4 | 0.1 | 5.0 |
| PAC-13 | 100 | 87.5 | 4.8 | - | - | 13.7 | 11.2 | 8.7 | 7.3 | 6.2 | 5.4 | 4.8 | 0.1 | 4.8 |
| Indicator Name | Unit | ECA-10 | PUC-10 | PAC-13 |
|---|---|---|---|---|
| Void content percentage | % | 4.2 | 20.4 | 19.9 |
| Marshall Stability | kN | 9.1 | 7.22 | 7.42 |
| Residual Mashall stability percentage |
% | 94.6 | 90.4 | 89.7 |
| Residual Freeze-thaw split tensile strength ratio | % | 93.4 | 95.7 | 84.8 |
| Standard raveling loss percentage | % | 3.32 | 5.3 | 7.5 |
| Immersion raveling loss percentage |
% | - | 4.3 | 9.2 |
| Dynamic Stability | time/mm | 5231 | 6574 | 9043 |
| Permeability | ml/min | 52 | 6570 | 7116 |
| Variable | Variable setting |
|---|---|
| Test speed | 1=80 km/h; 2=100 km/h |
| Lane | Passing lane=1; Driving lane =2 |
| Pavement structure | 1= Compact gradation pavement; 2=PUC-10; 3=PAC-13; 4=PUC-10+PAC-13 |
| Type of pavement disease | 1= No damage; 2= Transverse cracks; 3= Longitudinal cracks; 4= Repair |
| Indicator | M (SD) | Range | OBSI | Speed | Lane | Pavement structure | Pavement disease | |
|---|---|---|---|---|---|---|---|---|
| OBSI (dB) | Correlation significant |
91.33 (2.30) | 83.83-98.65 | 1 | ||||
| Speed (km/h) | Correlation significant |
- | - | 0.585* 0.000 |
1 | |||
| Lane | Correlation significant |
- | - | 0.317* 0.000 |
0.000 1.000 |
1 | ||
| Pavement Structure | Correlation significant |
- | - | -0.201* 0.000 |
0.000 1.000 |
0.161* 0.000 |
1 | |
| Pavement disease | Correlation significant |
- | 0.034 0.109 |
0.003 0.899 |
0.036 0.089 |
-0.195* 0.000 |
1 | |
| Pavement structure | Indicator | SMTD | RD | DR | SFC | IRI | |
|---|---|---|---|---|---|---|---|
| ECA-10 | Correlation Significance |
0.567* 0.000 |
0.035 0.619 |
-0.123 0.083 |
-0.304* 0.000 |
-0.121 0.088 |
|
| PUC-10 | Correlation Significance |
0.265 0.157 |
0.545* 0.002 |
0.084 0.738 |
0.132 0.488 |
-0.089 0.638 |
|
| PAC-13 | Correlation Significance |
0.127 0.067 |
-0.135 0.052 |
0.074 0.486 |
0.082 0.240 |
0.022 0.746 |
|
| PUC-10+PAC-13 | Correlation Significance |
-0.052 0.554 |
-0.024 0.786 |
0.142 0.095 |
-0.231* 0.008 |
-0.044 0.618 |
|
Disclaimer/Publisher’s Note: The statements, opinions and data contained in all publications are solely those of the individual author(s) and contributor(s) and not of MDPI and/or the editor(s). MDPI and/or the editor(s) disclaim responsibility for any injury to people or property resulting from any ideas, methods, instructions or products referred to in the content. |
© 2023 by the authors. Licensee MDPI, Basel, Switzerland. This article is an open access article distributed under the terms and conditions of the Creative Commons Attribution (CC BY) license (http://creativecommons.org/licenses/by/4.0/).


