
Submitted:
06 December 2023
Posted:
06 December 2023
You are already at the latest version
Abstract
Higher education informatization (HEI) is an interdisciplinary field that examines the use and integration of information and communication technologies (ICTs) in higher education. This paper provides a bibliometric and visual analysis of the research trends, patterns, and topics in this field. Using the Web of Science database, we selected and analyzed 199 SCI and SSCI papers on HEI published from 2000 to 2023 by VOSviewer and CiteSpace software. The results indicate that the publication volume of HEI research has grown significantly in recent years, with China and the US being the most productive and influential countries. The author network shows the collaboration and contribution of different researchers and institutions, while the journal network reveals the multidisciplinary nature and scope of the field. The keyword network and the burst keyword analysis identify the main research themes and the emerging hot topics in HEI, such as online learning, big data, and artificial intelligence. The co-citation network of sources illustrates the theoretical and methodological foundations and influences of the field. The paper concludes with some implications and suggestions for future HEI research.
Keywords:
Bibliometric Analysis
; Higher Education Informatization
; E-learning
; Motivation
1. Introduction
Higher education informatization is the application of information and communication technologies to enhance the quality and efficiency of higher education [1,2]. It uses digital resources, platforms, and systems to support teaching, learning, research, and management in higher education institutions[3]. Higher education informatization is essential for improving the accessibility, equity, and innovation of higher education, and for meeting the needs and expectations of learners and educators in the digital age[4,5].
With the emergence of new technologies and new means, such as artificial intelligence, big data, cloud computing, and mobile learning[6], higher education informatization has achieved new growth and breakthroughs in recent years. These technologies have facilitated the development of smart education[7], which offers personalized, adaptive, and intelligent learning environments and services[8]. Various fields of higher education have benefited from the application and impact of these technologies, such as curriculum design[9,10], teaching evaluation[11], student engagement[12,13], academic performance[14], and learning analytics[15,16].
However, higher education informatization also encounters new challenges and opportunities[17], especially in the post-epidemic era, when online and hybrid learning modes have become more common and necessary[18]. The COVID-19 pandemic has revealed the gaps and weaknesses in the current higher education informatization systems and practices[19], such as the lack of infrastructure, resources, skills, and policies. Meanwhile, the pandemic has also stimulated the innovation and transformation of higher education informatization[20], such as the emergence of new pedagogies, platforms, and partnerships. Therefore, a review of higher education informatization is timely and relevant, to understand its current state, trends, and issues.
This paper aims to provide a comprehensive and systematic review of higher education informatization research, using bibliometric visualization methods. Bibliometric visualization is a technique that analyzes and displays the information and relationships of scientific publications, such as citation data, bibliographic metadata, and article content[21], using statistics and graphics. This paper applies bibliometric visualization methods to map the landscape of higher education informatization research, and to identify the key authors, journals, countries, keywords, and themes in this field. This paper also reveals the interdisciplinary nature of higher education informatization, as it involves various disciplines such as computer science, engineering, education, and psychology. This paper hopes to contribute to the advancement of higher education informatization research and practice, by providing a comprehensive overview, a critical evaluation, and a future outlook of this field.
2. Methods and Data
2.1. Research Methods
Bibliometrics is a discipline that uses quantitative methods to analyze and evaluate various aspects of scholarly literature[22], which originated in the late 19th century[23]. It mainly includes citation-based analysis and science mapping[24]. These methods enable researchers to measure the impact of their work, compare it with others, and identify influential papers within a specific field[25]. When applied to the higher education informatization research, bibliometrics can provide objective, transparent, and cost-effective measurements of research impact. Moreover, it helps to visualize the evolution of the research field.
This study employs CiteSpace and VOSviewer to constructing the bibliometric knowledge graph. CiteSpace is particularly good at detecting patterns and trends in literature[26]. It offers a variety of functions to facilitate the understanding and interpretation of network patterns and historical trends. Alternatively, VOSviewer focuses on the graphical representation of bibliometric maps[27]. It is especially useful for analyzing large datasets, as it can process millions of records and offer a range of advanced features, such as a cluster detection and a visualization of temporal trends.
In conclusion, both CiteSpace and VOSviewer have unique capabilities that make them valuable tools for bibliometric research and knowledge graph construction. They enable the researchers to visualize complex bibliometric data in a meaningful and interpretable way.
2.2. Data Sources and Screening
We used the Web of Science (core collection) as our main data source, as it ensures the comprehensiveness and reliability of the data analyzed. The indices selected were SSCI and SCI-Expanded. Our search strategy incorporated the following terms:
TS=((“Higher Education” OR “College” OR “University”) AND (“Informatization” OR “Office Automation”) AND (“E-Learning” OR “Mobile Learning”) OR (“Administration” OR “Management” OR “Supervision”)).
The search covered the period from January 1, 2000 to December 1, 2023, yielding a total of 2,950,001 literature records.Next, we refined our search by selecting ‘Article’ as the document type, which yielded 2,336,821 articles. Further refinement was achieved by screening the Web of Science categories and Citation Topics, leading to a selection of 2355 articles.
However, the data obtained directly from the search formula may contain duplications or inconsistencies with the topic[28]. Therefore, we performed a pre-processing step before the analysis, which involved a manual review of each article’s content (including the title and abstract) to eliminate redundant and irrelevant publications, ensuring that the selected articles were indeed related to Higher Education Informatization Research. After this rigorous screening process, we retained 199 articles for content and bibliometric mapping analysis (see Figure 1).
3. Descriptive Statistics
3.1. Analysis of Publication Volume
The study incorporates 199 papers, contributed by 565 authors hailing from 295 organizations across 53 countries. These papers, published in 65 different journals, have garnered 8620citations from 5183 journals.
Figure 2 illustrates the annual distribution of published papers in the field of Higher Education Informatization Research from 2000 to 2023, based on data from the Web of Science. The x-axis denotes the year, while the y-axis signifies the number of papers published. The blue line represents the actual number of papers published, and the black dotted line symbolizes the trend line of the number of papers over the years, exhibiting a positive and linear relationship. The trend line reveals an increasing number of published papers over the years, with a slight dip observed in the middle. The R-squared value of 0.7709 suggests that the trend line fits the data well.
The figure underscores that the field of Higher Education Informatization Research has witnessed a significant surge in the number of published papers In the new century, escalating from a solitary paper in 2000 to near 50 papers in 2023. This surge mirrors the growing attention and interest of researchers and practitioners in this field, as well as the swift development and innovation of the related theories and methods.
3.2. Analysis of the Author
Bibliometric analysis of authorship is a technique employed to examine the productivity, impact, collaboration, and research topics of authors in a specific field or discipline[29]. It aids in identifying the most influential and prolific authors, their co-authorship networks and patterns, their research interests and themes, and their citation performance and role in the field. Price proposed that half of the papers on a given topic are authored by a group of highly productive authors, and this collection of authors is numerically equivalent to the square root of the total number of all authors [30].
In equation (1), n(x) signifies the number of authors who have authored x papers, I = nmax represents the number of papers by the most prolific authors in the field (nmax = 5 here), N is the total number of authors, and m is the minimum number of publications by core authors. According to Price’s Law, the minimum number of publications by core authors in a field:
Here, m≈1.675, so authors with more than 2 publications (including 2) are considered as core authors in the field. Upon analyzing the 199 papers referenced in the text, a total of 76 core authors have published 103 papers, accounting for 51.76% of the total number of papers, thereby meeting the 50% standard proposed by Price. This suggests the formation of a relatively stable author collaboration group in the field of Higher Education Informatization Research.
Table 1 showcases the top 10 scholars in the realm of Higher Education Informatization Research, ranked by their productivity and impact. This information is derived from VOSviewer.
The most productive author is kinshuk, who has published 5 documents and received 271 citations, with an average citation per publication of 54.20. He is a professor of learning technologies at the University of North Texas, USA, and his research interests include smart learning environments[31], adaptive and personalized learning[32], and mobile and ubiquitous learning [33].The author with the highest average citation per publication and the most cited is graf, sabine, who has published 2 documents and received 153 citations, with an average citation per publication of 76.50. She is an associate professor of computing and information systems at Athabasca University, Canada, and She has published high-quality and high-impact papers on topics such as adaptive and personalized learning, learning analytics[34], and artificial intelligence in education[35].
In essence, the top 10 authors demonstrate diverse levels of productivity and influence in the field of Higher Education Informatization. Kinshuk and Graf Sabine are particularly noteworthy contributors, with Kinshuk leading in terms of productivity. Authors with fewer publications prove that significant impact can be achieved through focused and substantial contributions, as reflected in their average citation/publication ratios. The varied characteristics of these authors add to the richness and multidimensionality of research in Higher Education Informatization.
3.3. Analysis of the Journals
The quantity of journal publications serves as a measure of the productivity and output of a field, journal, author, or topic[36]. It also provides insights into the activity and dynamism of a field, the popularity and influence of a journal, the productivity and prominence of an author, and the relevance and appeal of a topic[37].
Table 2 enumerates the top 10 sources that have contributed the most to the field of Higher Education Informatization Research, detailing their document count, citation count, and average citation per document. The top 10 journals have collectively published 111 documents and garnered 1416 citations in the field of higher education informatization, averaging 12.76 citations per document. This underscores the high productivity and impact of these journals in this field.
Education and Information Technologies emerges as the most productive journal with 32 publications and 130 citations, averaging 4.06 citations per publication. This journal, the official journal of the International Federation for Information Processing Technical Committee on Education, explores the intricate relationships between information and communication technologies and education.
Educational Technology & Society, the most cited journal, has published 24 documents and received 551 citations, averaging 22.96 citations per publication. This quarterly academic journal in educational technology addresses issues pertinent to the developers of educational systems and educators who implement and manage such systems.
The Journal of Computer Assisted Learning, which has the highest average citation per publication, has published 4 documents and received 140 citations, averaging 35.00 citations per publication. This international peer-reviewed journal covers the entire spectrum of uses of information and communication technology to support learning and knowledge exchange.
The journals with the lowest average citation per publication are the Journal of Hospitality Leisure Sport & Tourism Education and Studies in Continuing Education, each having published 4 documents and received 6 and 11 citations respectively, averaging 1.50 and 2.75 citations per publication respectively. While these journals are related to the field of education, their scope is more specific and narrow compared to the other journals, and they may cater to a smaller and less active audience.
The top 10 journals exhibit varying levels of productivity, impact, and quality, as evidenced by their differing document counts, citation counts, and average citation per document. The table also reveals the diverse disciplinary backgrounds of the journals, spanning fields such as education, computer science, information technology, management, hospitality, leisure, sport, and tourism. This underscores the interdisciplinary and cross-disciplinary nature of higher education informatization.
4. Visual Analysis and Discussion
4.1. Visual Analysis of the Countries
Bibliometric research allows for the exploration of the geographical distribution and diversity of research activities and outputs within a specific field or topic[38]. This approach facilitates an understanding of regional disparities, commonalities, and collaborations in terms of research productivity, impact, quality, and specialization. Moreover, it aids in identifying the leading, emerging, and underrepresented nations within a field or topic[39].
Table 3 lists the top ten countries with the highest number of publications in this area. The People’s Republic of China stands out as the most productive country with the highest average citation per publication. With 40 documents published and 634 citations received, resulting in total link strength of 1430, it is evident that China is a leading and active contributor in the field of higher education informatization, boasting a significant number of researchers and publications on this topic.
The United States, on the other hand, is the most cited country. With 26 documents published and 220 citations received, resulting in total link strength of 973, it is clear that the United States holds a position of influence and authority in the field of higher education informatization, as evidenced by the high impact and recognition of its publications on this topic.
The geographical distribution of the top 10 countries in this study spans various continents and regions, including Asia, Europe, North America, and Oceania. This diversity underscores the global and cross-cultural nature of higher education informatization research, suggesting that different countries and regions may offer unique perspectives and experiences on this topic.
Figure 3, a network visualization generated using VOSviewer data, illustrates the countries that have contributed academic papers on higher education informatization. The graph reveals that 52 countries have published papers on this topic, each demonstrating varying degrees of productivity, collaboration, and recency.
China, represented by the largest circle, is the most productive country with 40 papers on higher education informatization. The United States, depicted by the second-largest circle, is the most cited country with 220 citations for its 26 papers on this topic. The thickest line connecting China and the United States indicates their status as the most collaborative countries, having co-authored 12 papers on higher education informatization. Spain, connected to China by the second thickest line, ranks as the second most collaborative country, having co-authored 9 papers on this topic with China.
In terms of recency, Israel, represented by the most yellow circle, is the most recent country with an average publication year of 2020.5 for its 5 papers on higher education informatization. Canada, depicted by the second most yellow circle, is the second most recent country with an average publication year of 2020.3 for its 12 papers on this topic. Conversely, Greece, represented by the most blue circle, is the oldest country with an average publication year of 2017.1 for its 8 papers on higher education informatization. Turkey, depicted by the second most blue circle, is the second oldest country with an average publication year of 2017.3 for its 11 papers on this topic.
4.2. Visual Analysis of Keywords
Bibliometric analysis of author-assigned keywords offers a method for examining the frequency, co-occurrence, and evolution of keywords within a specific field or discipline[40]. This approach can provide valuable insights for various stakeholders, including researchers, editors, reviewers, funders, and policymakers, enabling them to understand the current state and trends of a field, identify potential research gaps and opportunities, evaluate the quality and impact of their keywords, and make strategic decisions for the field’s development[41].
Table 4 presents the top 10 author keywords used in papers on higher education informatization, as per VOSviewer data. The table reveals that:
The author keywords in higher education informatization research encapsulate the key topics, themes, and issues pertinent to the field. These include the influence of technology, the challenges and opportunities presented by online and hybrid education, the quality and effectiveness of instruction and learning, and the evolving requirements of work and society. The author keywords are dynamic and evolve over time, reflecting emerging trends and developments in the field, such as the COVID-19 pandemic, advancements in artificial intelligence, and innovations in learning analytics. This suggests that higher education informatization is a progressive and adaptive field aiming to enhance and transform education and society.
Figure 4 provides a network visualization of author keywords in higher education informatization research. It displays the results of clustering the 46 author keywords that appear more than three times in the papers on higher education informatization, based on VOSviewer data. The graph indicates that the author keywords can be categorized into seven clusters, each representing a different aspect or theme of higher education informatization. The clusters are as follows:
Cluster 1 (9 items): This cluster encompasses author keywords associated with the design and implementation of online learning across various educational contexts and disciplines. Keywords include collaborative learning, distance education, elementary education, engineering education, instructional design, project management, and teaching/learning strategies. This cluster underscores the diversity and complexity of online learning in higher education informatization, as well as the pedagogical and managerial challenges and opportunities it presents.
Cluster 2 (9 items): This group encompasses keywords from authors that pertain to the utilization and evolution of learning management systems (LMS) and virtual learning environments (VLE) in the context of higher education informatization. Keywords such as e-learning, LMS, Moodle, and VLE are included. Additionally, this group contains keywords related to the customization and adaptability of learning, including adaptive learning, distance learning, learning styles, and personalized learning. This group underscores the significance and novelty of LMS and VLE in higher education informatization, as well as the potential for and necessity of adaptive and personalized learning.
Cluster 3 (8 items): This group includes keywords from authors that discuss the effects of COVID-19 on higher education informatization and the subsequent responses, with keywords like COVID-19, online education, teacher training, and technology. It also contains keywords about the digital competence and literacy of teachers and learners, such as digital competence, learning, secondary school teachers, and teaching. This group highlights the challenges and opportunities presented by COVID-19 for higher education informatization, as well as the skills and knowledge needed by teachers and learners.
Cluster 4 (7 items): This group includes keywords from authors that relate to the application and integration of artificial intelligence (AI) and machine learning in higher education informatization, with keywords like AI, machine learning, and learning analytics. It also includes keywords about the evaluation and assurance of learning outcomes and quality, such as educational technology, learning outcomes, quality assurance, and self-directed learning. This group reflects how AI and machine learning are advancing and transforming higher education informatization, as well as how learning outcomes and quality are being assessed and improved.
Cluster 5 (6 items): This group includes keywords from authors that relate to the changes and innovations in multimedia and soft sensors in higher education informatization, with keywords like change, multimedia, and soft sensors. It also includes keywords about the training and development of teachers and workers, such as teachers, training, and workplace learning. This group reflects the innovation and development of multimedia and soft sensors in higher education informatization, as well as the training and development of teachers and workers.
Cluster 6 (4 items): This group includes keywords from authors that discuss the sustainability and transformation of higher education informatization, with keywords such as higher education, management education, sustainability, and transformative learning. This group highlights the sustainable transformation of higher education informatization and its management and leadership aspects.
Cluster 7 (3 items): This group includes keywords from authors that focus on the evaluation and leadership of staff development in higher education informatization, with keywords like evaluation, leadership, and staff development. This group emphasizes the evaluation and leadership aspects of staff development in higher education informatization, as well as staff empowerment.
4.3. Co-citation Analysis of Sources
Co-citation analysis, a bibliometric method, gauges the similarity and relationship between two sources based on their co-citation frequency and strength[42]. This technique aids in pinpointing influential and pertinent sources within a research domain, mapping the field’s intellectual structure and evolution[43]. Additionally, it facilitates the discovery of research themes, clusters, and fronts, and uncovers the links and gaps among different areas[44].
In our research, we employed VOSviewer to construct a co-citation map of journals, setting the minimum co-citation frequency threshold at 10. This resulted in the inclusion of 89 journals for the co-citation analysis. The three most frequently cited journals were Comput Educ (335 papers), Comput Hum Behav (109 papers), and Educ Inf Technol (105 papers).
Figure 5 and Figure 6 depict the Network Visualization and Density Visualization Map of Co-citation Sources on Higher Education Informatization Research, respectively. These figures present the same co-citation data of the journals in the field of higher education informatization in two distinct ways, utilizing different visual elements and indicators. The density visualization illustrates the distribution and concentration of the co-citation links among the journals, using varying colors and shades. Conversely, the network visualization displays the co-citation links’ network and structure among the journals, using different shapes and sizes. Both visualizations reveal the same six clusters of journals, each representing a unique aspect or theme of higher education informatization, albeit with varying levels of detail and labels. The clusters are:
Cluster 1 (17 items): This cluster encompasses sources related to the general and interdisciplinary aspects of higher education, such as higher education, adult education, lifelong education, management education, sustainability, and transformative learning. It mirrors the wide-ranging and diverse scope and context of higher education informatization, along with the social and environmental issues and implications involved.
Cluster 2 (15 items): This cluster comprises sources related to the online and distance learning modes and technologies of higher education informatization, such as e-learning, learning management systems, online learning, distance education, and internet and higher education. It reflects the prevalent modes and technologies of higher education informatization, as well as the pedagogical and technical challenges and opportunities involved.
Cluster 3 (14 items): This cluster comprises sources that delve into the educational and psychological facets of higher education informatization, such as education, psychology, learning, teaching, instruction, and evaluation. It mirrors the fundamental aspects of higher education informatization and the cognitive and affective factors and outcomes involved.
Cluster 4 (14 items): This cluster encompasses sources that explore the computer science and engineering dimensions of higher education informatization, such as computer science, engineering, artificial intelligence, machine learning, and computer education. It reflects the advanced and innovative aspects of higher education informatization and the scientific and technological methods and applications involved.
Cluster 5 (14 items): This cluster includes sources that focus on the media and communication aspects of higher education informatization, such as media, communication, technology, information, and digital literacy. It mirrors the media and communication aspects of higher education informatization and the information and communication skills and competencies involved.
Cluster 6 (13 items): This cluster comprises sources that concentrate on the specific and regional aspects of higher education informatization, such as Asia-Pacific, language, nursing, system, and vocational learning. It reflects the specific and regional aspects of higher education informatization and the cultural and contextual differences and similarities involved.
4.4. Visual Analysis of Burst Keyword
Burst keywords in bibliometrics denote the abrupt and temporary surge in the occurrence frequency of specific terms or keywords in scholarly literature within a defined period[44]. This analysis aids in detecting emerging topics, trends, and frontiers in a research field, and in revealing shifts in research focus and interest over time[45].
In our study, we utilized the burst keywords function of CiteSpace to extract the burst words in this research field. Nine burst keywords were identified, as depicted in Figure 7. The figure conveys the following information:
The earliest burst keyword, knowledge management, began to surge in frequency in 2003 and ceased in 2006, with a strength of 2.2372. This suggests that knowledge management was a burgeoning and trending topic in the early stage of higher education informatization, referring to the process of creating, sharing, and applying knowledge in higher education institutions and practices.
The most recent burst keyword, styles, began to surge in frequency in 2021 and is still ongoing, with a strength of 2.057. This suggests that styles is a burgeoning and trending topic in the current stage of higher education informatization, referring to the different preferences and approaches of learners and educators in higher education informatization.
The strongest burst keyword, higher education, began to surge in frequency in 2018 and is still ongoing, with a strength of 3.6925. This suggests that higher education is a burgeoning and trending topic in the current stage of higher education informatization, referring to the level of education that is most affected and transformed by information and communication technologies.
The weakest burst keyword, culture, began to surge in frequency in 2013 and ceased in 2016, with a strength of 1.7431. This suggests that culture was a burgeoning and trending topic in the middle stage of higher education informatization, referring to the social and cultural factors and implications of higher education informatization.
The burst keyword analysis of the papers on higher education informatization can aid in understanding the evolution and development of the research field, as well as in identifying the hot and novel topics and issues in the research field. The burst keyword analysis can also guide the current and future research directions and priorities in the research field, as well as inspire new and innovative ideas and solutions in the research field.
5. Conclusion and Prospect
This paper investigated the field of higher education informatization (HEI) from a bibliometric and visual perspective, using 199 SCI and SSCI papers on HEI published from 2000 to 2023. The paper employed VOSviewer and CiteSpace software to examine the publication volume, author network, journal network, country network, keyword network, co-citation network, and burst keyword network of the selected papers. The main findings of this paper are as follows:
- The publication volume of HEI research has increased significantly in recent years, especially since 2018, indicating the growing attention and importance of this field.
- China and the US are the most productive and influential countries in HEI research, followed by Spain, Australia and Canada. The country network reveals the collaboration and competition among different regions and continents in this field.
- A relatively stable author collaboration group has formed in HEI. The author network identifies the leading and emerging scholars and institutions in HEI research, as well as the co-authorship patterns and clusters. The most prolific and cited authors are kinshuk, martin, sinclair and chang.
- The journal network demonstrates the multidisciplinary nature and scope of HEI research, covering various disciplines such as education, computer science, information science, and management. The most active and prestigious journals are education and information technologies, educational technology &society, british journal of educational technology.
- The author keyword and the burst keyword analysis identify the main research themes and the emerging hot topics in HEI research, such as online learning, big data, and artificial intelligence. The keyword network also shows the evolution and transition of research topics over time, reflecting the changing needs and challenges of higher education in the digital era.
- The co-citation network of sources illustrates the theoretical and methodological foundations and influences of HEI research, highlighting the key sources that shape the field. The most cited and influential sources are from Comput Educ (335 papers), Comput Hum Behav (109 papers), and Educ Inf Technol (105 papers).
Theoretically, this paper provides a comprehensive and systematic overview of the current state and trends of HEI research, which can help researchers to understand the development and direction of the field, as well as to identify the research gaps and opportunities. Practically, this paper can help policymakers, educators, and practitioners to gain insights into the use and integration of ICTs in higher education, as well as to evaluate and improve the quality and effectiveness of HEI practices.
However, the analysis in this study was based on the Web of Science database, which may not include all relevant publications on HEI. Future studies could consider incorporating other databases to provide a more comprehensive view of the field. Additionally, the rapid pace of technological innovation necessitates continuous monitoring and analysis of the latest trends and topics in HEI research.
In conclusion, this paper has contributed to the understanding of the HEI research field from a bibliometric and visual perspective. It underscores the importance of HEI in shaping the future of higher education and offers valuable insights for researchers, educators, and policymakers in their pursuit to leverage ICTs for enhanced teaching and learning outcomes. As we continue to navigate the digital age, the exploration and understanding of HEI will remain a critical endeavor in our collective pursuit of educational excellence.
Author Contributions
Conceptualization,methodology, software, writing—original, draft preparation, supervisionYushi Duan; validation, formal analysis, writing—review and editing Yang An; investigation,data curation, Yuchen Zhang. All authors have read and agreed to the published version of the manuscript.
Funding
This research was funded by Education research and Teaching Reform project of Institute of Disaster Prevention, grant number JY2023A01 and JY2023B02.
Institutional Review Board Statement
Not applicable.
Informed Consent Statement
Not applicable.
Data Availability Statement
The raw data presented in this study are openly available at https://www.webofscience.com, accessed on November 11, 2023. The other data used to support the findings of the study are available from the author upon request.The author’s email address is duanyushi2023@163.com.
Acknowledgments
Thanks to the Education research and Teaching Reform project of Institute of Disaster Prevention (grant number JY2023A01 and JY2023B02) for funding this study.
Conflicts of Interest
The authors declare no conflict of interest.
References
- Stosic L, Dermendzhieva S, Tomczyk L. Information and Communication Technologies as a Source of Education[J]. World Journal on Educational Technology: Current Issues 2020, 12, 128–135. [Google Scholar]
- Gafiatulina N, Shishova N, Volkova D, et al. Applying of information and communication technologies in the education process[C]//E3S Web of Conferences. EDP Sciences 2020, 175, 15031. [Google Scholar]
- Dobre, I. Learning Management Systems for higher education-an overview of available options for Higher Education Organizations[J]. Procedia-social and behavioral sciences 2015, 180, 313–320. [Google Scholar] [CrossRef]
- Villegas-Ch, W.; García-Ortiz, J. Enhancing Learning Personalization in Educational Environments through Ontology-Based Knowledge Representation. Computers 2023, 12, 199. [Google Scholar] [CrossRef]
- Hénard F, Roseveare D. Fostering quality teaching in higher education: Policies and practices[J]. An IMHE guide for higher education institutions 2012, 1, 7–11. [Google Scholar]
- Halili S, H. Technological advancements in education 4.0. The Online Journal of Distance Education and e-Learning 2019, 7, 63–69. [Google Scholar]
- Peng H, Ma S, Spector J M. Personalized adaptive learning: an emerging pedagogical approach enabled by a smart learning environment[J]. Smart Learning Environments 2019, 6, 1–14. [Google Scholar]
- Sousa-Vieira, M.-E.; Ferrero-Castro, D.; López-Ardao, J.-C. Design, Development and Use of a Digital Badges System in Higher Education. Appl. Sci. 2022, 12, 220. [Google Scholar] [CrossRef]
- Fedorenko E H, Velychko V Y, Stopkin A V, et al. Informatization of education as a pledge of the existence and development of a modern higher education[J]. 2019.
- Fedorenko E G, Velychko V Y, Naboka O G, et al. Informatization of education: driving force for integration of modern higher education in the global information space[C]. CEUR Workshop Proceedings. 2023; 128–147.
- Liang Z, Zhang G, Qiao S. Research and practice of informatization teaching reform based on ubiquitous learning environment and education big data[J]. Open Journal of Social Sciences 2021, 9, 334–341. [Google Scholar] [CrossRef]
- Alkorashy, H.A.; Alotaibi, H.A. Locus of Control and Self-Directed Learning Readiness of Nursing Students during the COVID-19 Pandemic: A Cross-Sectional Study from Saudi Arabia. Nurs. Rep. 2023, 13, 1658–1670. [Google Scholar] [CrossRef] [PubMed]
- Kahu E, R. Framing student engagement in higher education[J]. Studies in higher education 2013, 38, 758–773. [Google Scholar] [CrossRef]
- Liu J L, Zhao G D. The measurement and determinants of student satisfaction of education informatization in Chinese universities[C]//2018 International Symposium on Educational Technology (ISET). IEEE 2018, 183–187.
- Veluri R K, Patra I, Naved M, et al. Learning analytics using deep learning techniques for efficiently managing educational institutes[J]. Materials Today: Proceedings 2022, 51, 2317–2320. [Google Scholar]
- Salas-Pilco S Z, Xiao K, Hu X. Artificial intelligence and learning analytics in teacher education: A systematic review[J]. Education Sciences 2022, 12, 569. [Google Scholar] [CrossRef]
- Mynbayeva A, Anarbek N. Informatization of education in Kazakhstan: New challenges and further development of scientific schools[J]. International Review of Management and Marketing 2016, 6, 259–264. [Google Scholar]
- Zhang Y, Liu J, Liang J, et al. Online education isn’t the best choice: evidence-based medical education in the post-epidemic era—a cross-sectional study[J]. BMC Medical Education 2023, 23, 744. [Google Scholar]
- Turnbull D, Chugh R, Luck J. Transitioning to E-Learning during the COVID-19 pandemic: How have Higher Education Institutions responded to the challenge?[J]. Education and Information Technologies 2021, 26, 6401–6419. [Google Scholar] [CrossRef]
- Tejedor S, Cervi L, Pérez-Escoda A, et al. Higher education response in the time of coronavirus: perceptions of teachers and students, and open innovation[J]. Journal of Open Innovation: Technology, Market, and Complexity 2021, 7, 43. [Google Scholar] [CrossRef]
- Moral-Muñoz J A, Herrera-Viedma E, Santisteban-Espejo A, et al. Software tools for conducting bibliometric analysis in science: An up-to-date review[J]. Profesional de la información/Information Professional 2020, 29.
- Ellegaard O, Wallin J A. The bibliometric analysis of scholarly production: How great is the impact?[J]. Scientometrics 2015, 105, 1809–1831. [Google Scholar] [CrossRef] [PubMed]
- Lawani S, M. Bibliometrics: Its theoretical foundations, methods and applications[J]. Libri 1981, 31, 294–315. [Google Scholar] [CrossRef]
- Braam, Robert R., and H. F. Moed. Mapping of science: foci of intellectual interest in scientific literature; DSWO Press, University of Leiden, 1991.
- Roldan-Valadez E, Salazar-Ruiz SY, Ibarra-Contreras R, Rios C. Current concepts on bibliometrics: a brief review about impact factor, Eigenfactor score, CiteScore, SCImago Journal Rank, Source-Normalised Impact per Paper, H-index, and alternative metrics. Irish Journal of Medical Science (1971-) 2019, 188, 939–51. [Google Scholar] [CrossRef]
- Chen, C. CiteSpace II: Detecting and visualizing emerging trends and transient patterns in scientific literature. Journal of the American Society for information Science and Technology 2006, 57, 359–77. [Google Scholar] [CrossRef]
- Van Eck N, Waltman L. Software survey: VOSviewer, a computer program for bibliometric mapping. scientometrics. 2010, 84, 523–38. [Google Scholar] [CrossRef] [PubMed]
- Martín-Martín A, Orduna-Malea E, Delgado López-Cózar E. Coverage of highly-cited documents in Google Scholar, Web of Science, and Scopus: a multidisciplinary comparison. Scientometrics. 2018, 116, 21. [Google Scholar]
- Donthu N, Kumar S, Mukherjee D, Pandey N, Lim WM. How to conduct a bibliometric analysis: An overview and guidelines. Journal of business research. 2021, 133, 285–96. [Google Scholar] [CrossRef]
- Milojević, S. How are academic age, productivity and collaboration related to citing behavior of researchers? . PloS ONE 2012, 7, e49176. [Google Scholar] [CrossRef]
- Kinshuk, Chen N S, Cheng I L, et al. Evolution is not enough: Revolutionizing current learning environments to smart learning environments[J]. International Journal of Artificial Intelligence in Education 2016, 26, 561–581. [Google Scholar] [CrossRef]
- Kinshuk. Roadmap for adaptive and personalized learning in ubiquitous environments[M]//Ubiquitous learning environments and technologies. Berlin, Heidelberg; Springer: Berlin/Heidelberg, Germany, 2014; pp. 1–13. [Google Scholar]
- Kinshuk, Jesse R. Mobile authoring of open educational resources as reusable learning objects[J]. International Review of Research in Open and Distributed Learning 2013, 14, 28–52. [Google Scholar] [CrossRef]
- Graf S, Kinshuk K. Providing adaptive courses in learning management systems with respect to learning styles[C]//E-Learn: World Conference on E-Learning in Corporate, Government, Healthcare, and Higher Education. Association for the Advancement of Computing in Education (AACE) 2007, 2576–2583.
- Graf S, Liu T C, Kinshuk. Analysis of learners’ navigational behaviour and their learning styles in an online course[J]. Journal of Computer Assisted Learning 2010, 26, 116–131. [Google Scholar] [CrossRef]
- Yu, Z. Development of public administration research with a bibliometric analysis[J]. Scientific Programming 2022, 2022, 1–19. [Google Scholar] [CrossRef]
- Razmjooei D, Alimohammadlou M, Ranaei Kordshouli H A, et al. A bibliometric analysis of the literature on circular economy and sustainability in maritime studies[J]. Environment, Development and Sustainability.
- Merigó J M, Cancino C A, Coronado F, et al. Academic research in innovation: a country analysis[J]. Scientometrics 2016, 108, 559–593. [Google Scholar] [CrossRef]
- Baek C, Doleck T. Educational data mining: A bibliometric analysis of an emerging field[J]. IEEE Access 2022, 10, 31289–31296. [Google Scholar] [CrossRef]
- Tripathi M, Kumar S, Sonker S K, et al. Occurrence of author keywords and keywords plus in social sciences and humanities research: A preliminary study[J]. COLLNET Journal of Scientometrics and Information Management 2018, 12, 215–232. [Google Scholar] [CrossRef]
- Donthu N, Kumar S, Mukherjee D, et al. How to conduct a bibliometric analysis: An overview and guidelines[J]. Journal of business research 2021, 133, 285–296. [Google Scholar] [CrossRef]
- Kleminski R, Kazienko P, Kajdanowicz T. Analysis of direct citation, co-citation and bibliographic coupling in scientific topic identification[J]. Journal of Information Science 2022, 48, 349–373. [Google Scholar] [CrossRef]
- Nerur S P, Rasheed A A, Natarajan V. The intellectual structure of the strategic management field: An author co-citation analysis[J]. Strategic Management Journal 2008, 29, 319–336. [Google Scholar]
- Boyack K W, Klavans R. Co-citation analysis, bibliographic coupling, and direct citation: Which citation approach represents the research front most accurately?[J]. Journal of the American Society for information Science and Technology 2010, 61, 2389–2404. [Google Scholar] [CrossRef]
- Tang M, Liao H, Wan Z, et al. Ten years of sustainability (2009 to 2018): A bibliometric overview[J]. Sustainability 2018, 10, 1655. [Google Scholar] [CrossRef]
- Xu H, Winnink J, Yue Z, et al. Multidimensional Scientometric indicators for the detection of emerging research topics[J]. Technological Forecasting and Social Change 2021, 163, 120490. [Google Scholar] [CrossRef]
Figure 1.
Paper Screening and Data Cleaning Process Flowchart.
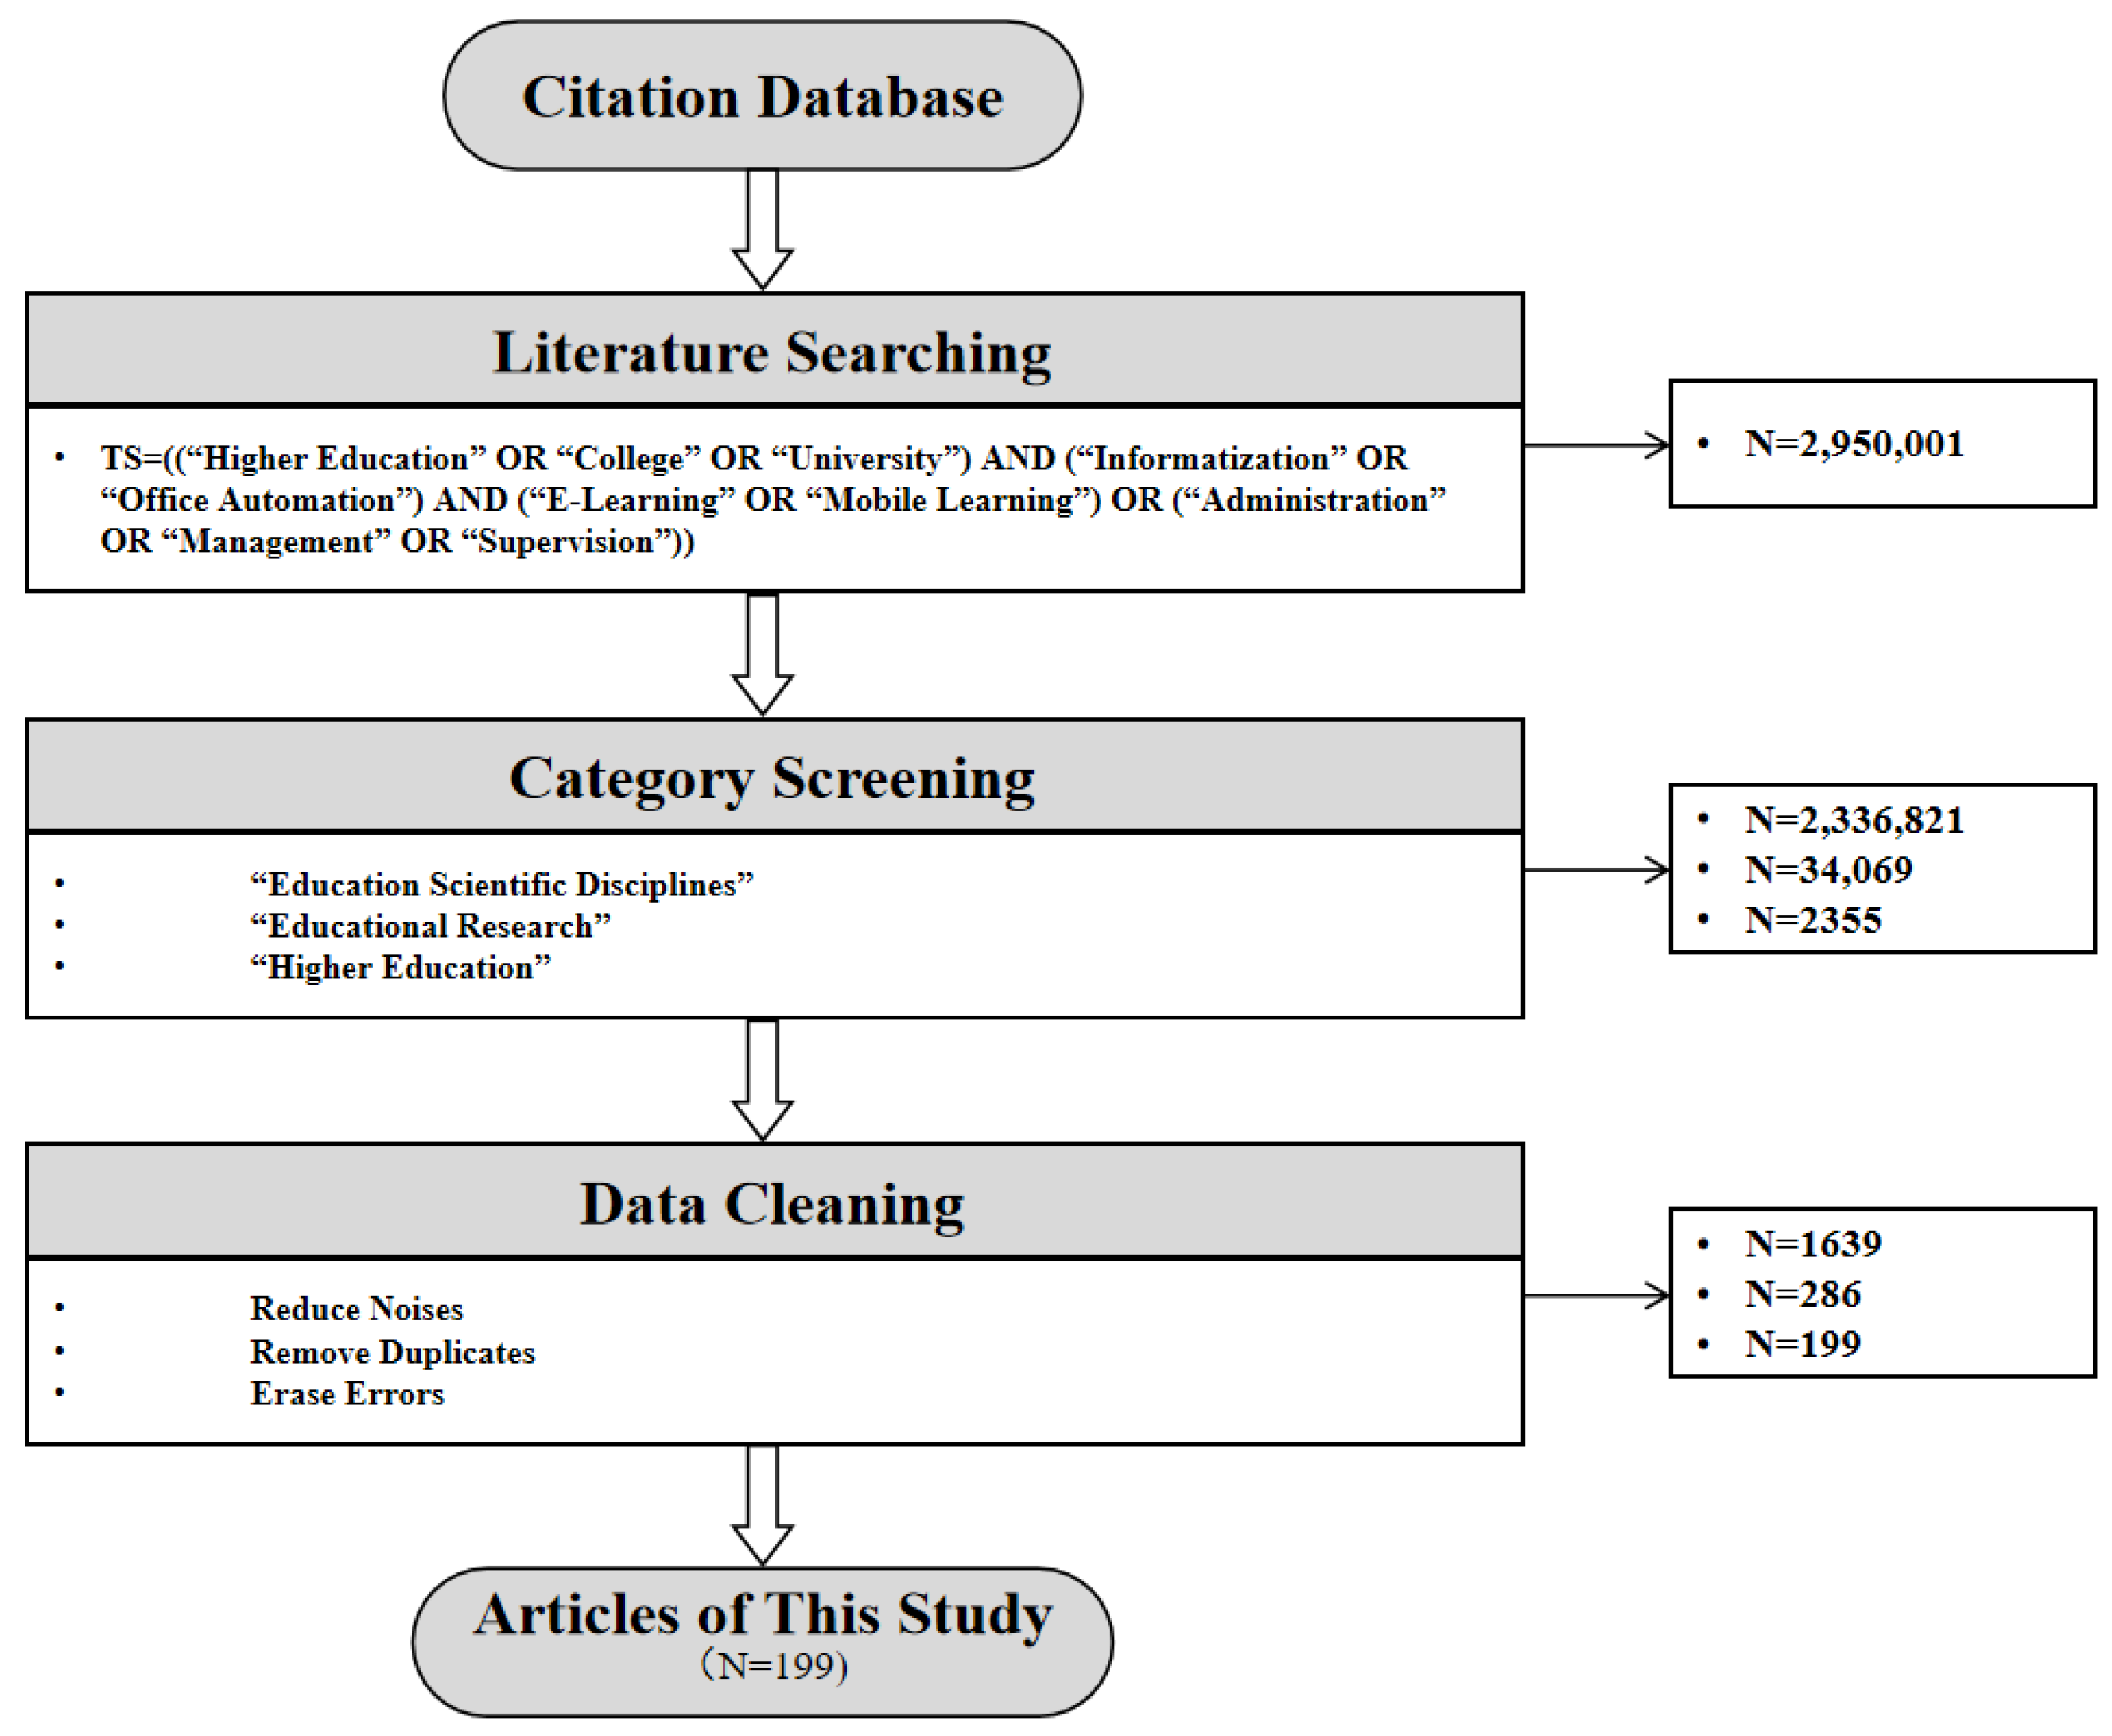
Figure 2.
Literature on Higher Education Informatization Research (2000-2023).
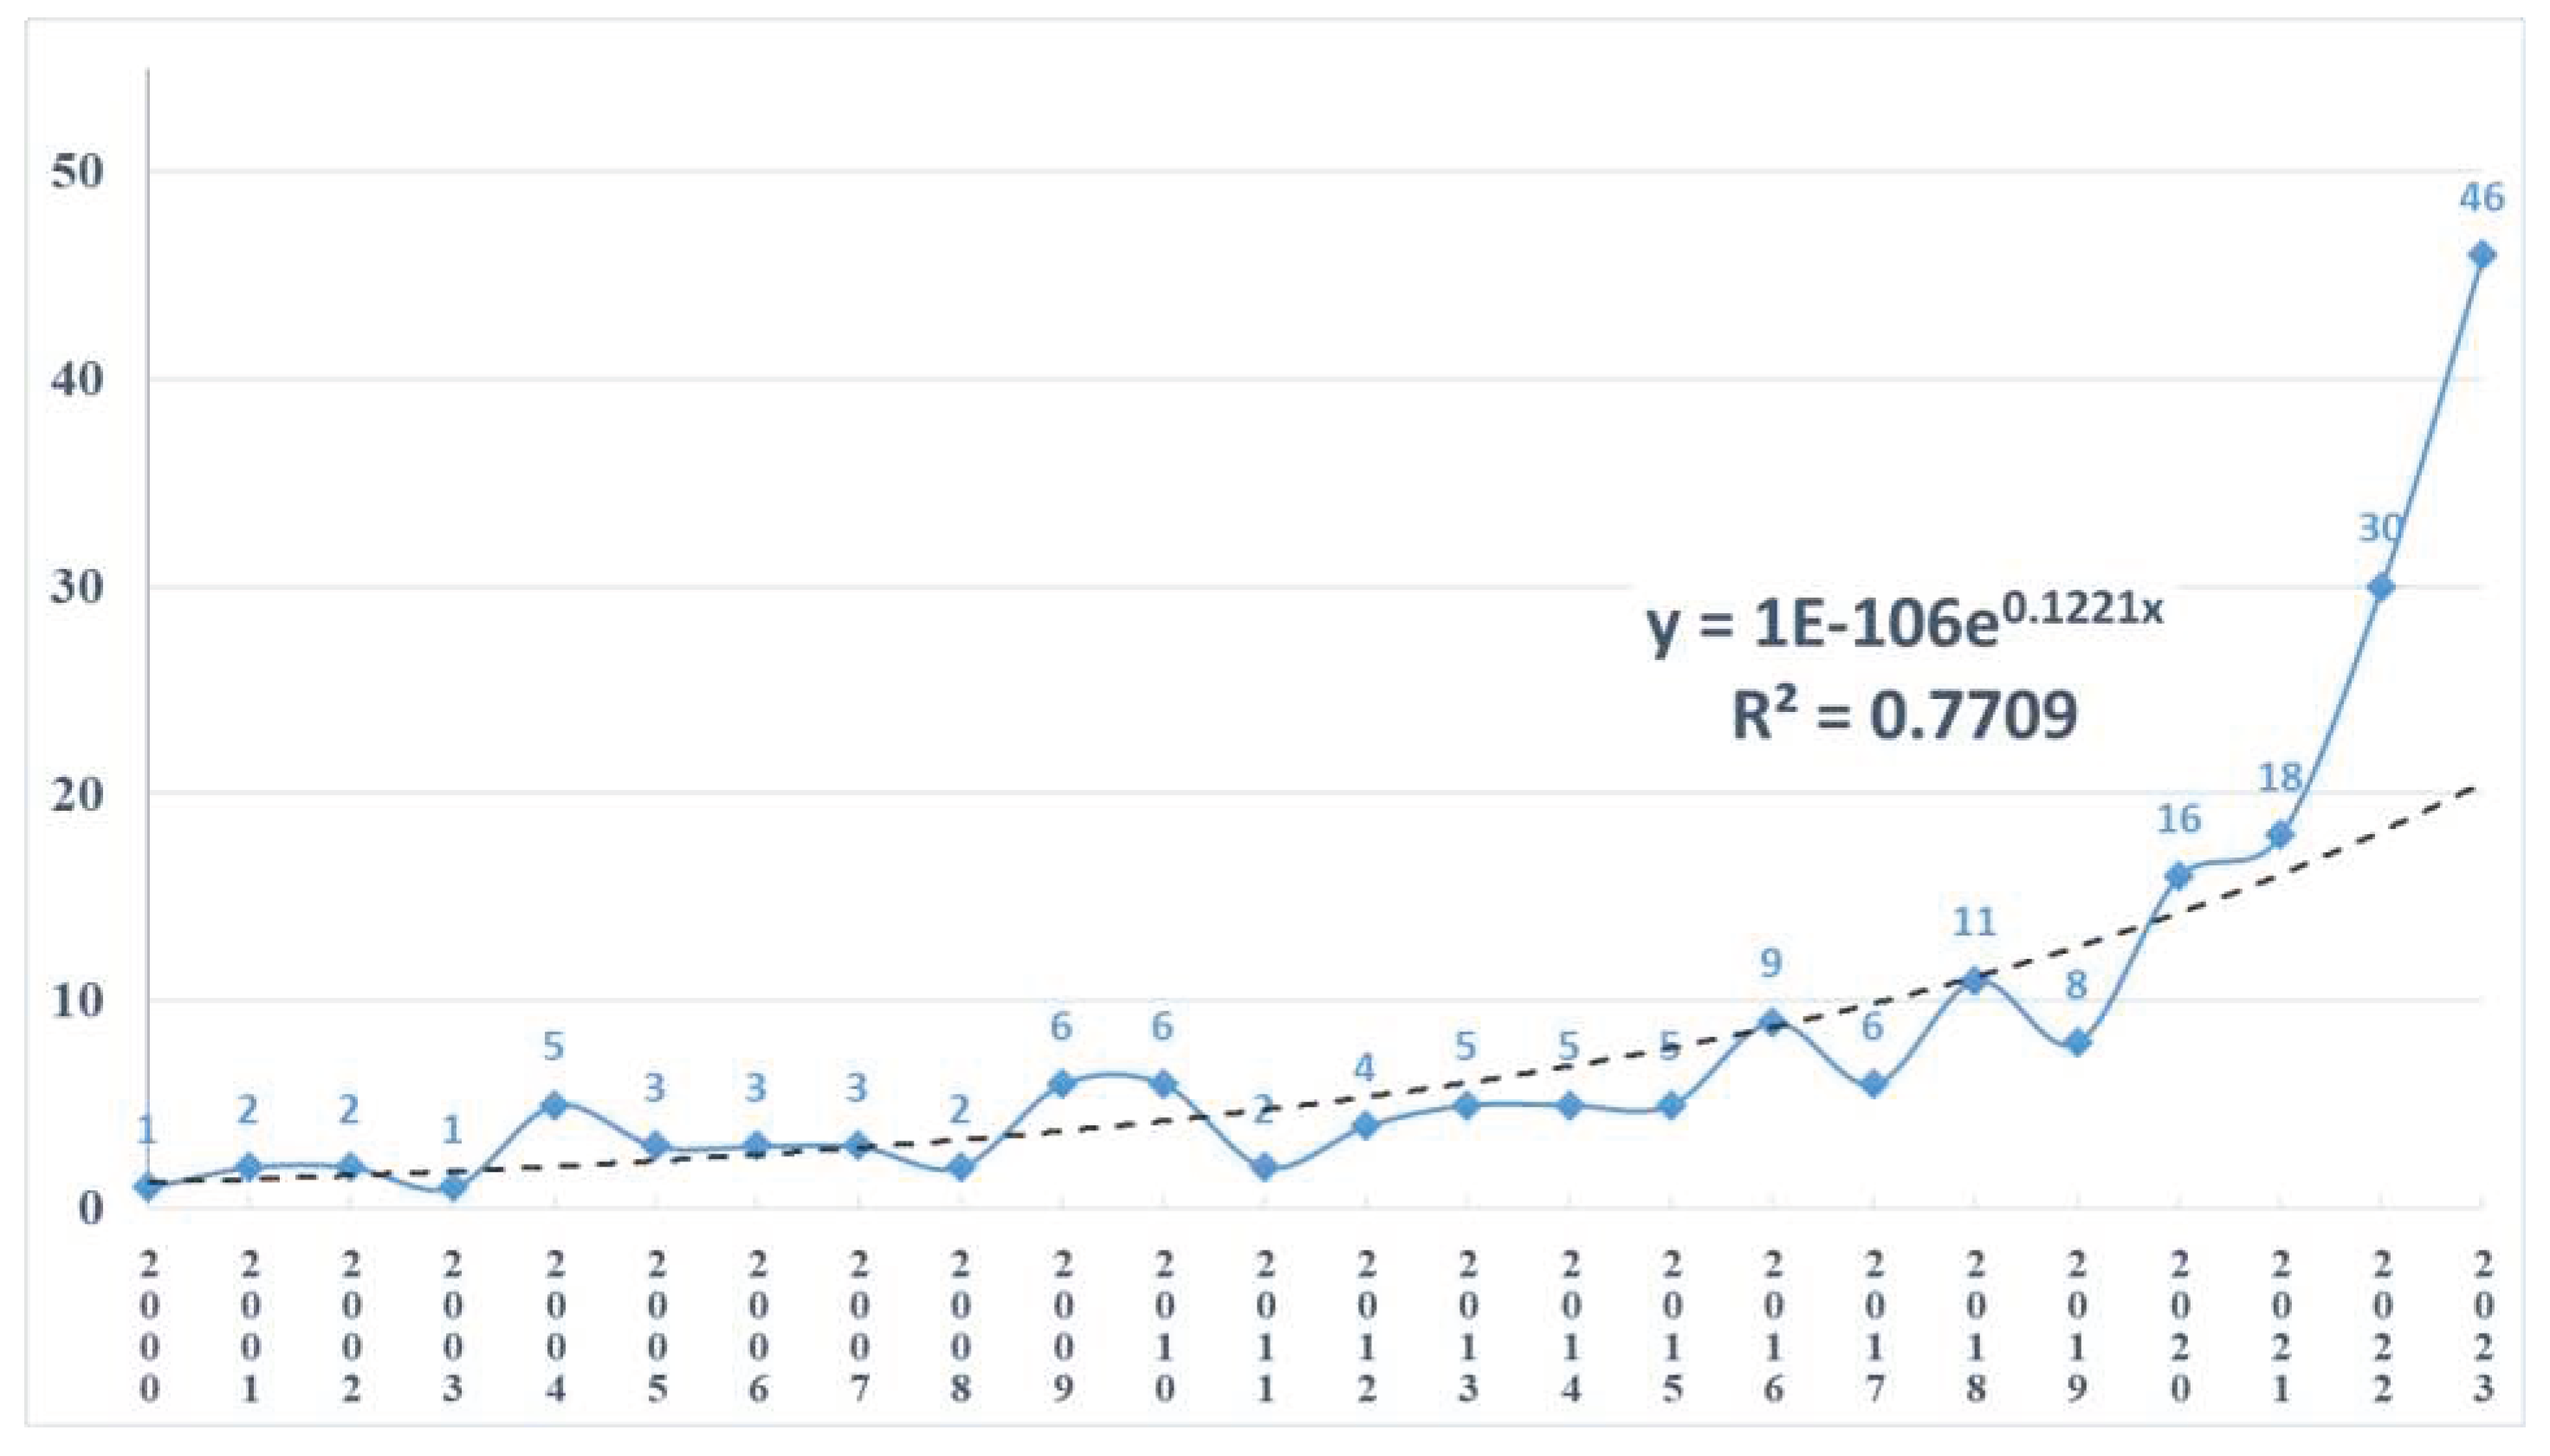
Figure 3.
Countries Overlay Visualization in Higher Education Informatization Research.
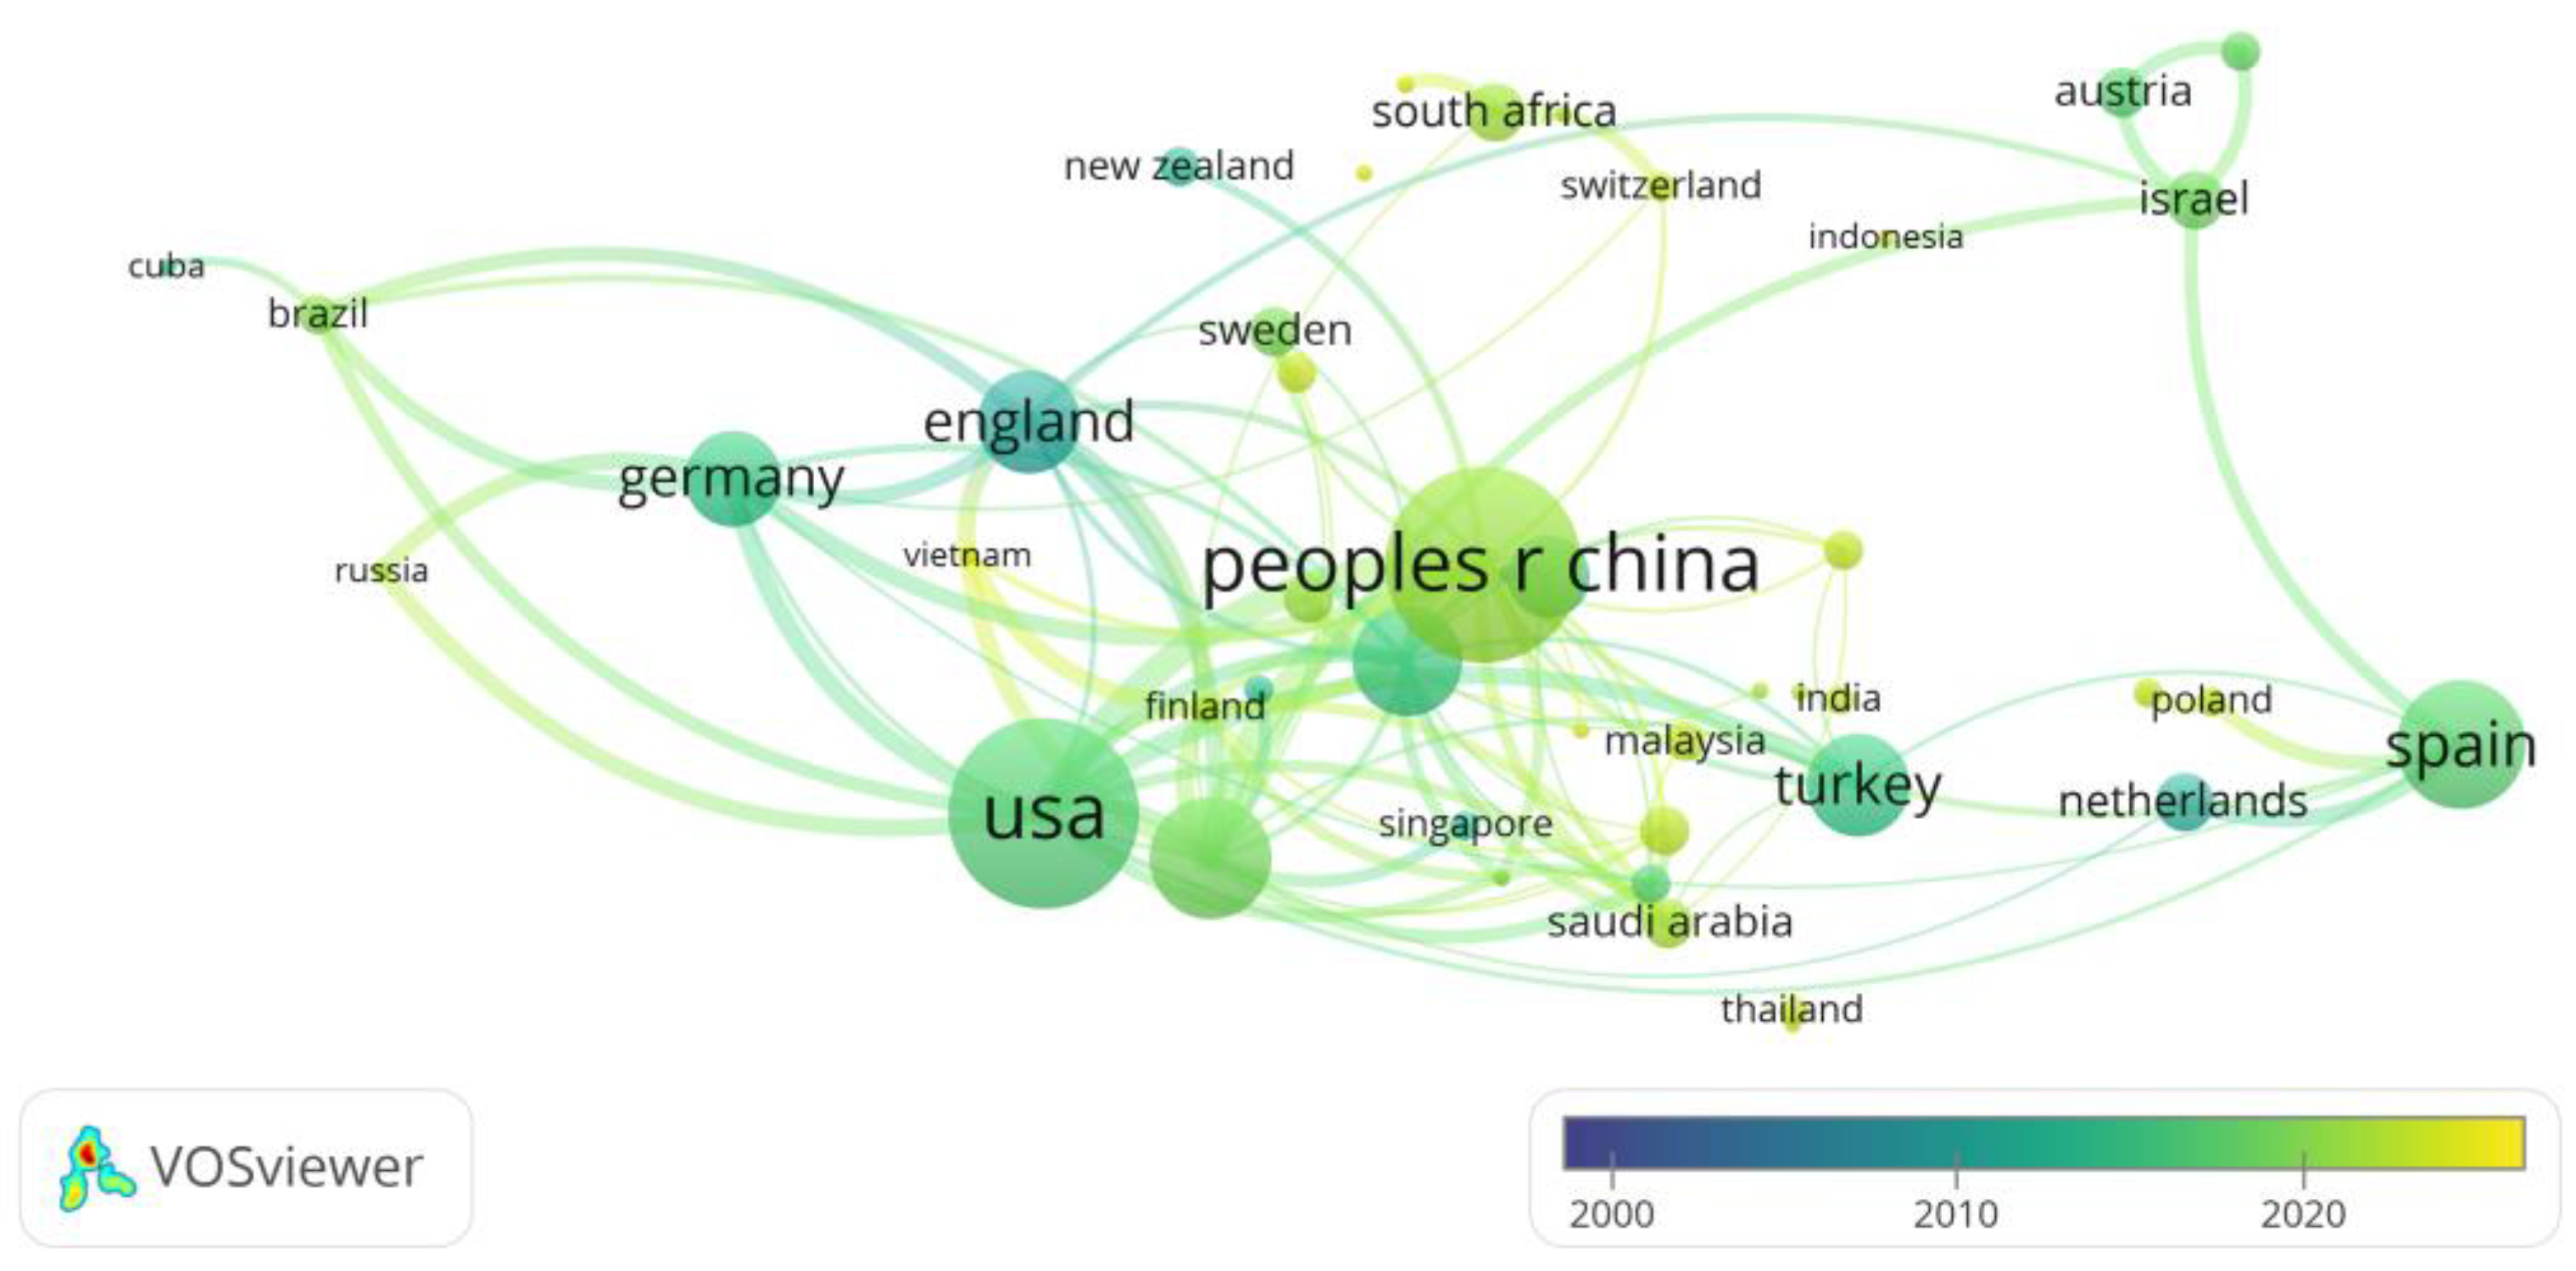
Figure 4.
Author Keyword Network Visualization in Higher Education Informatization Research.
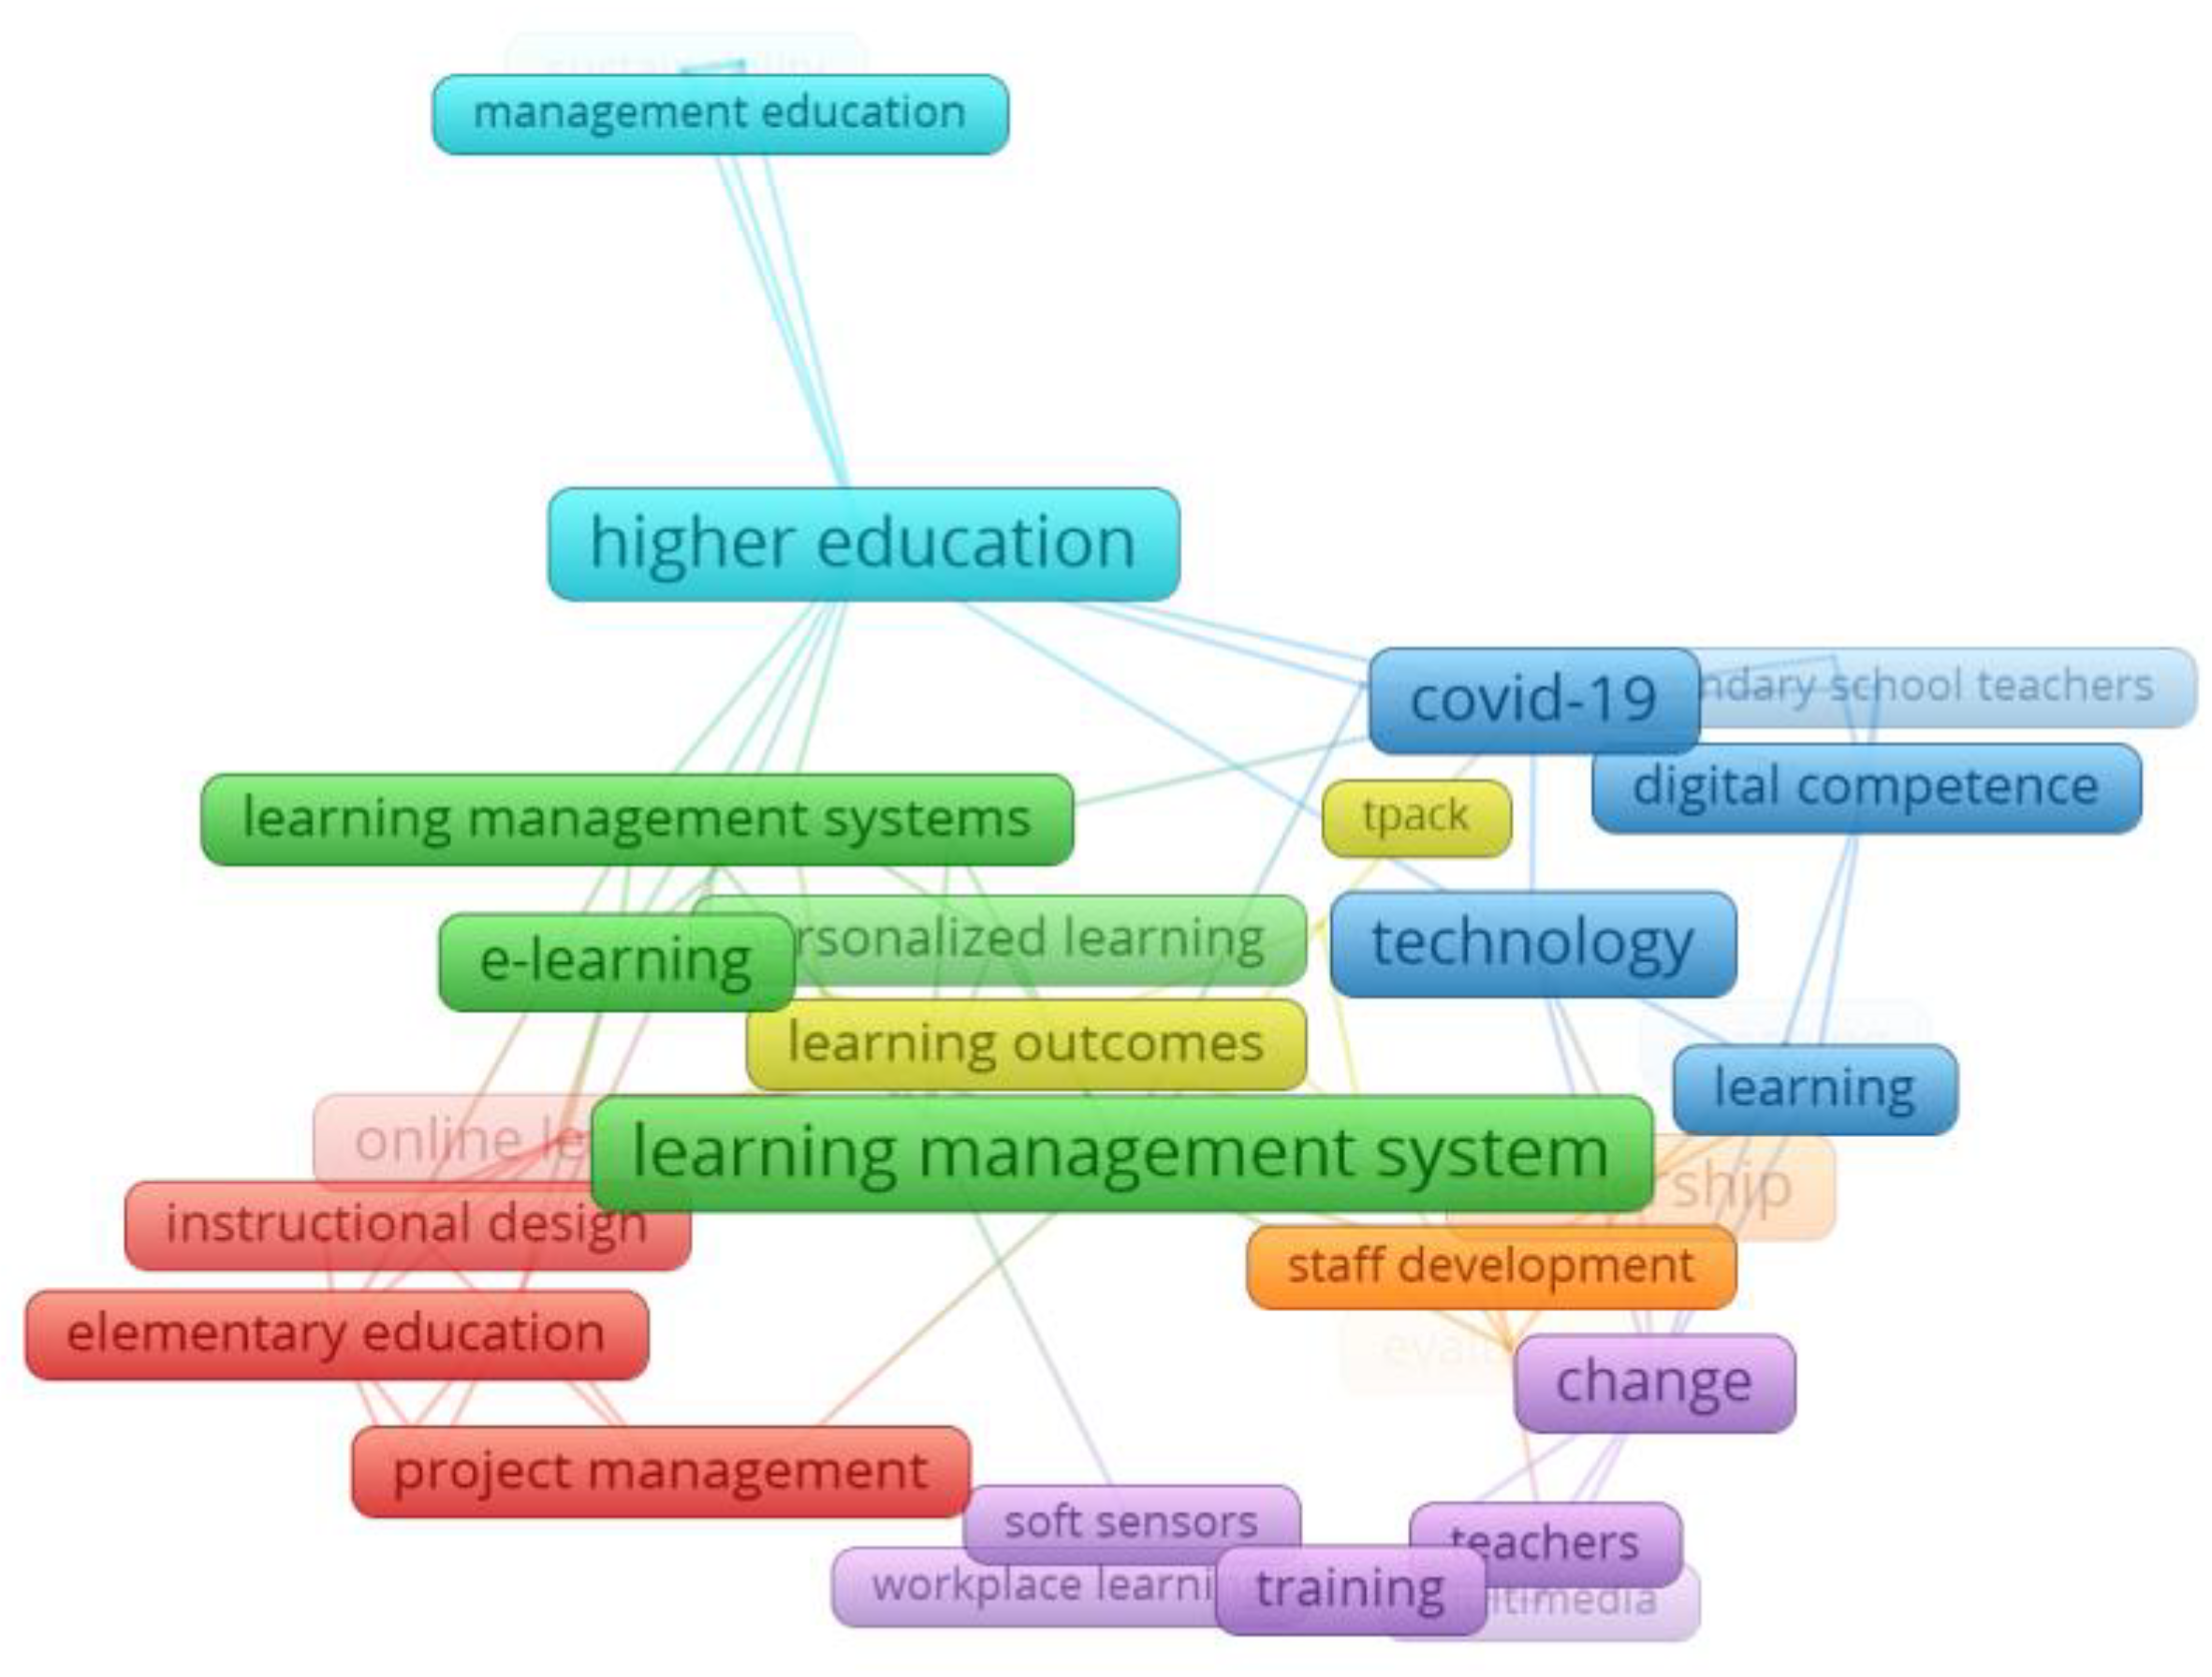
Figure 5.
Co-citation Sources Network Visualization in Higher Education Informatization Research.
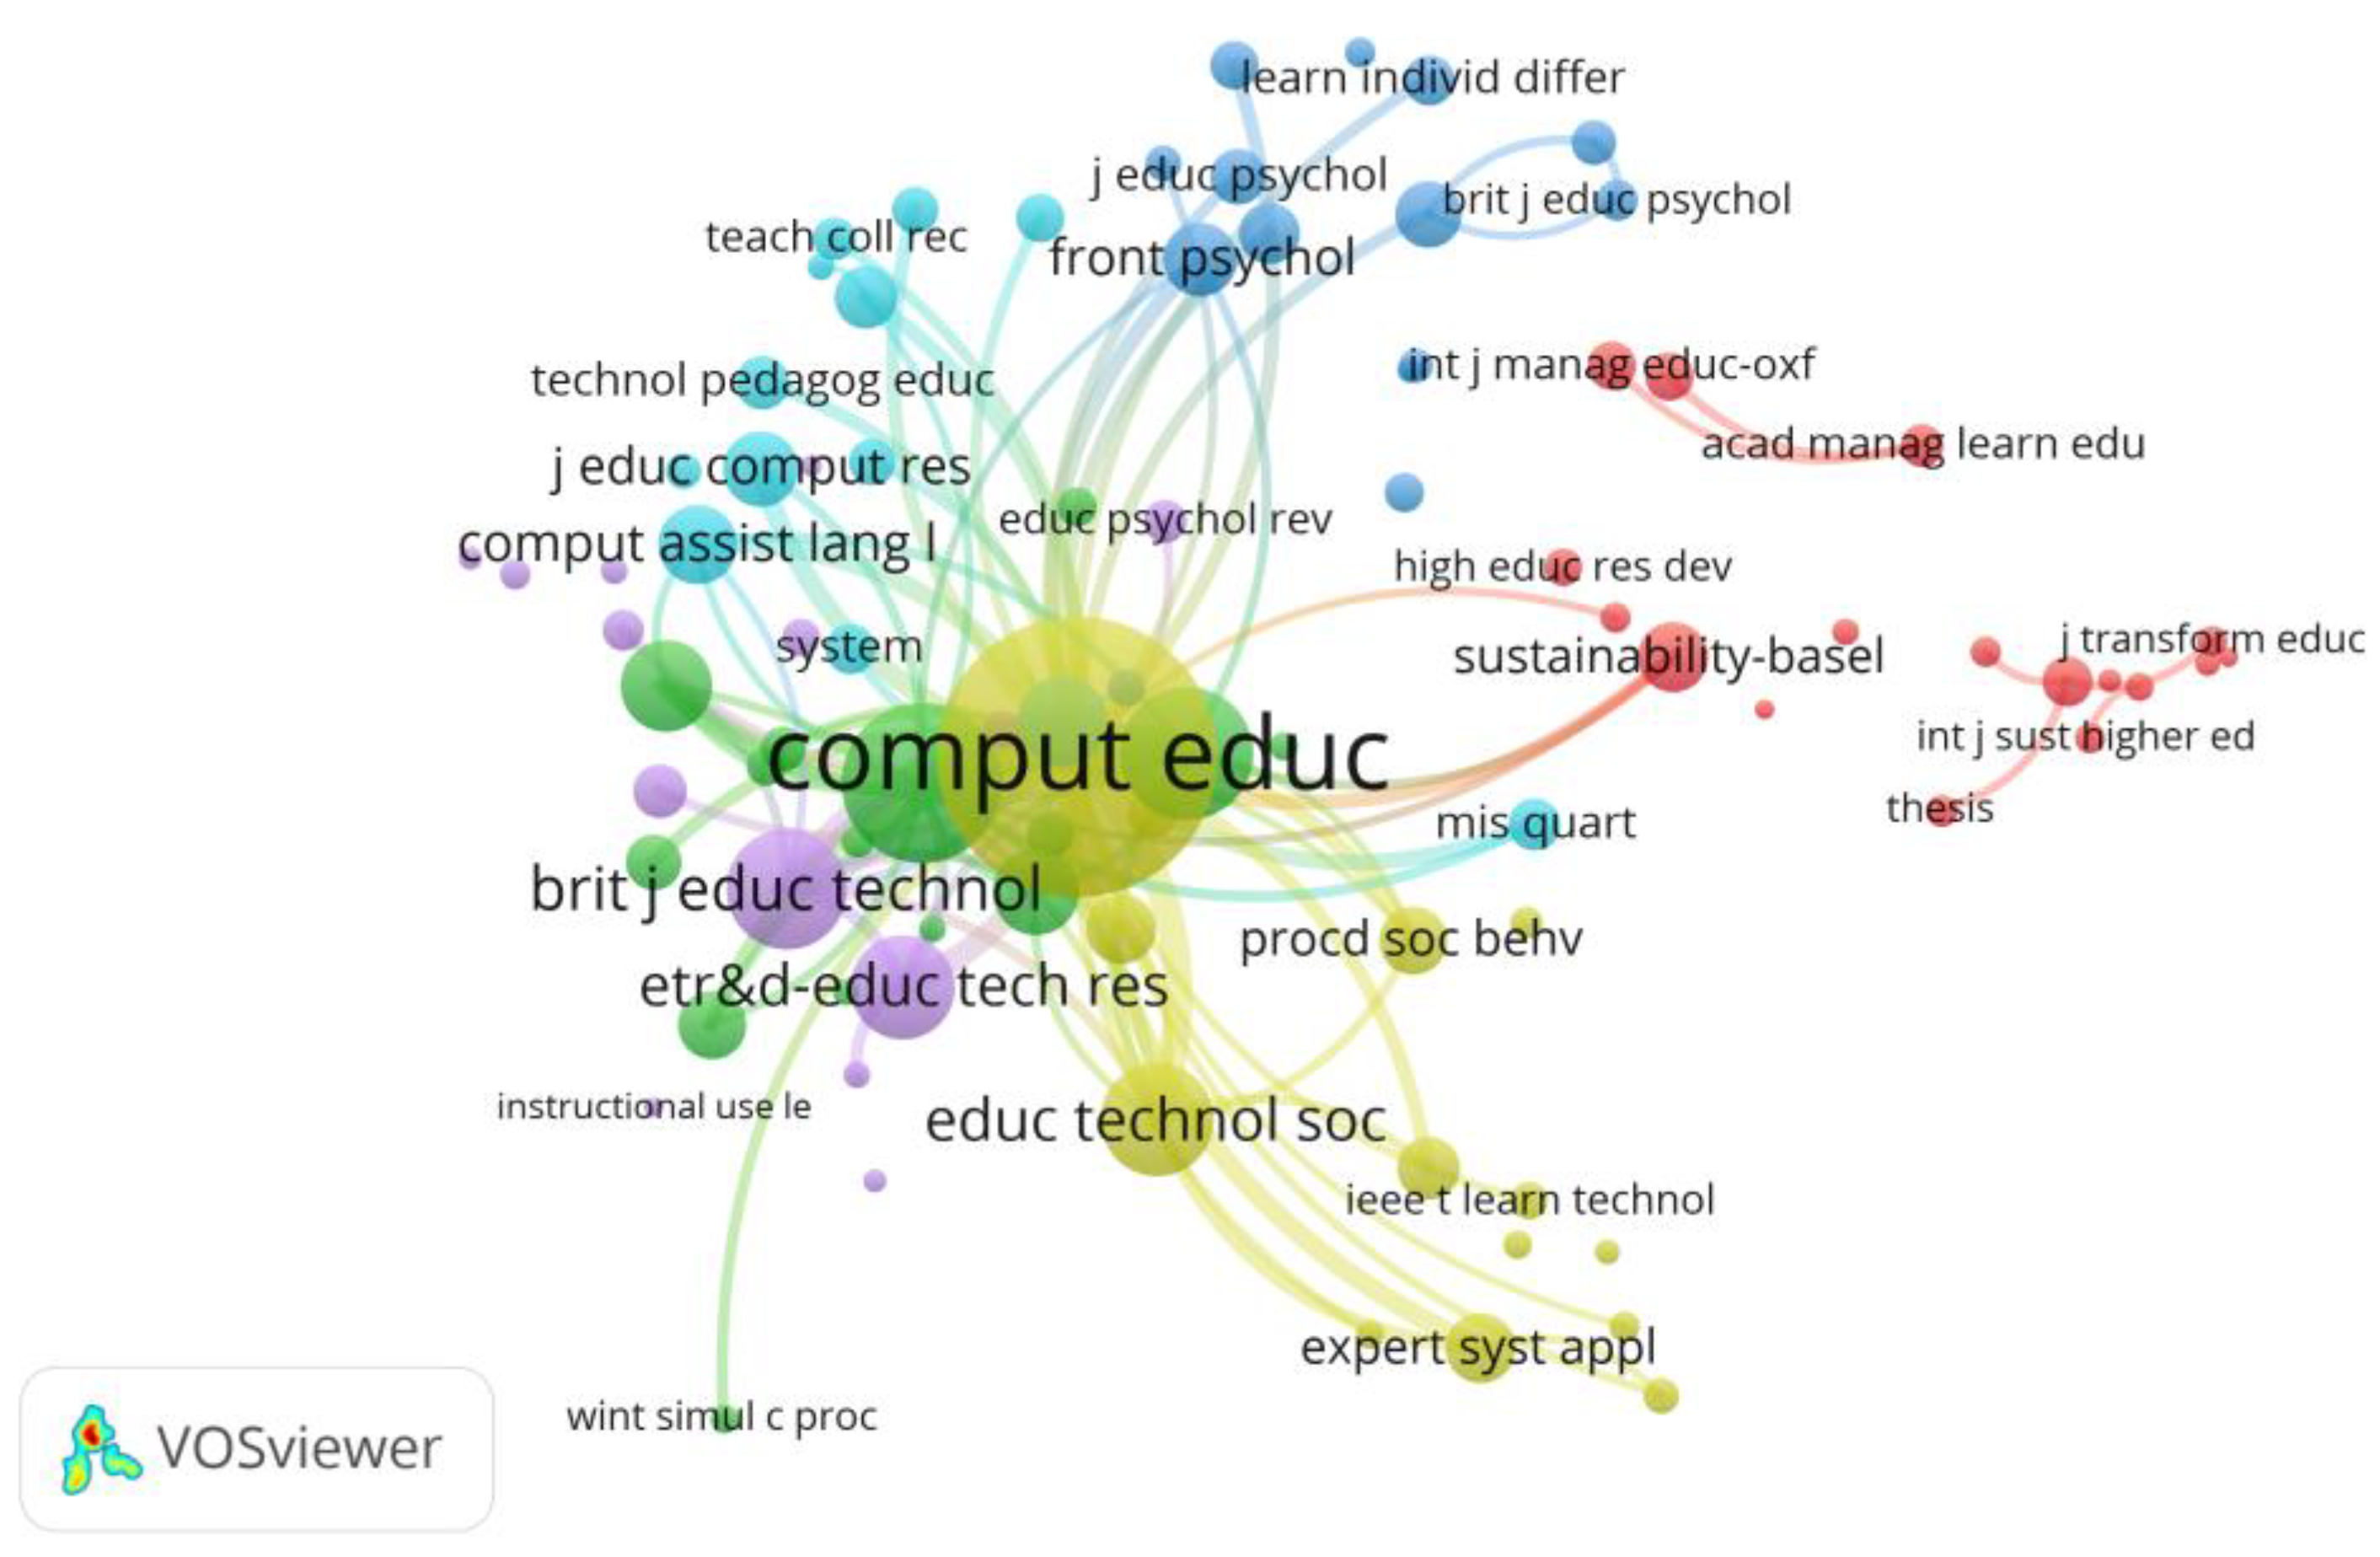
Figure 6.
Co-citation Sources Density Visualization in Higher Education Informatization Research.
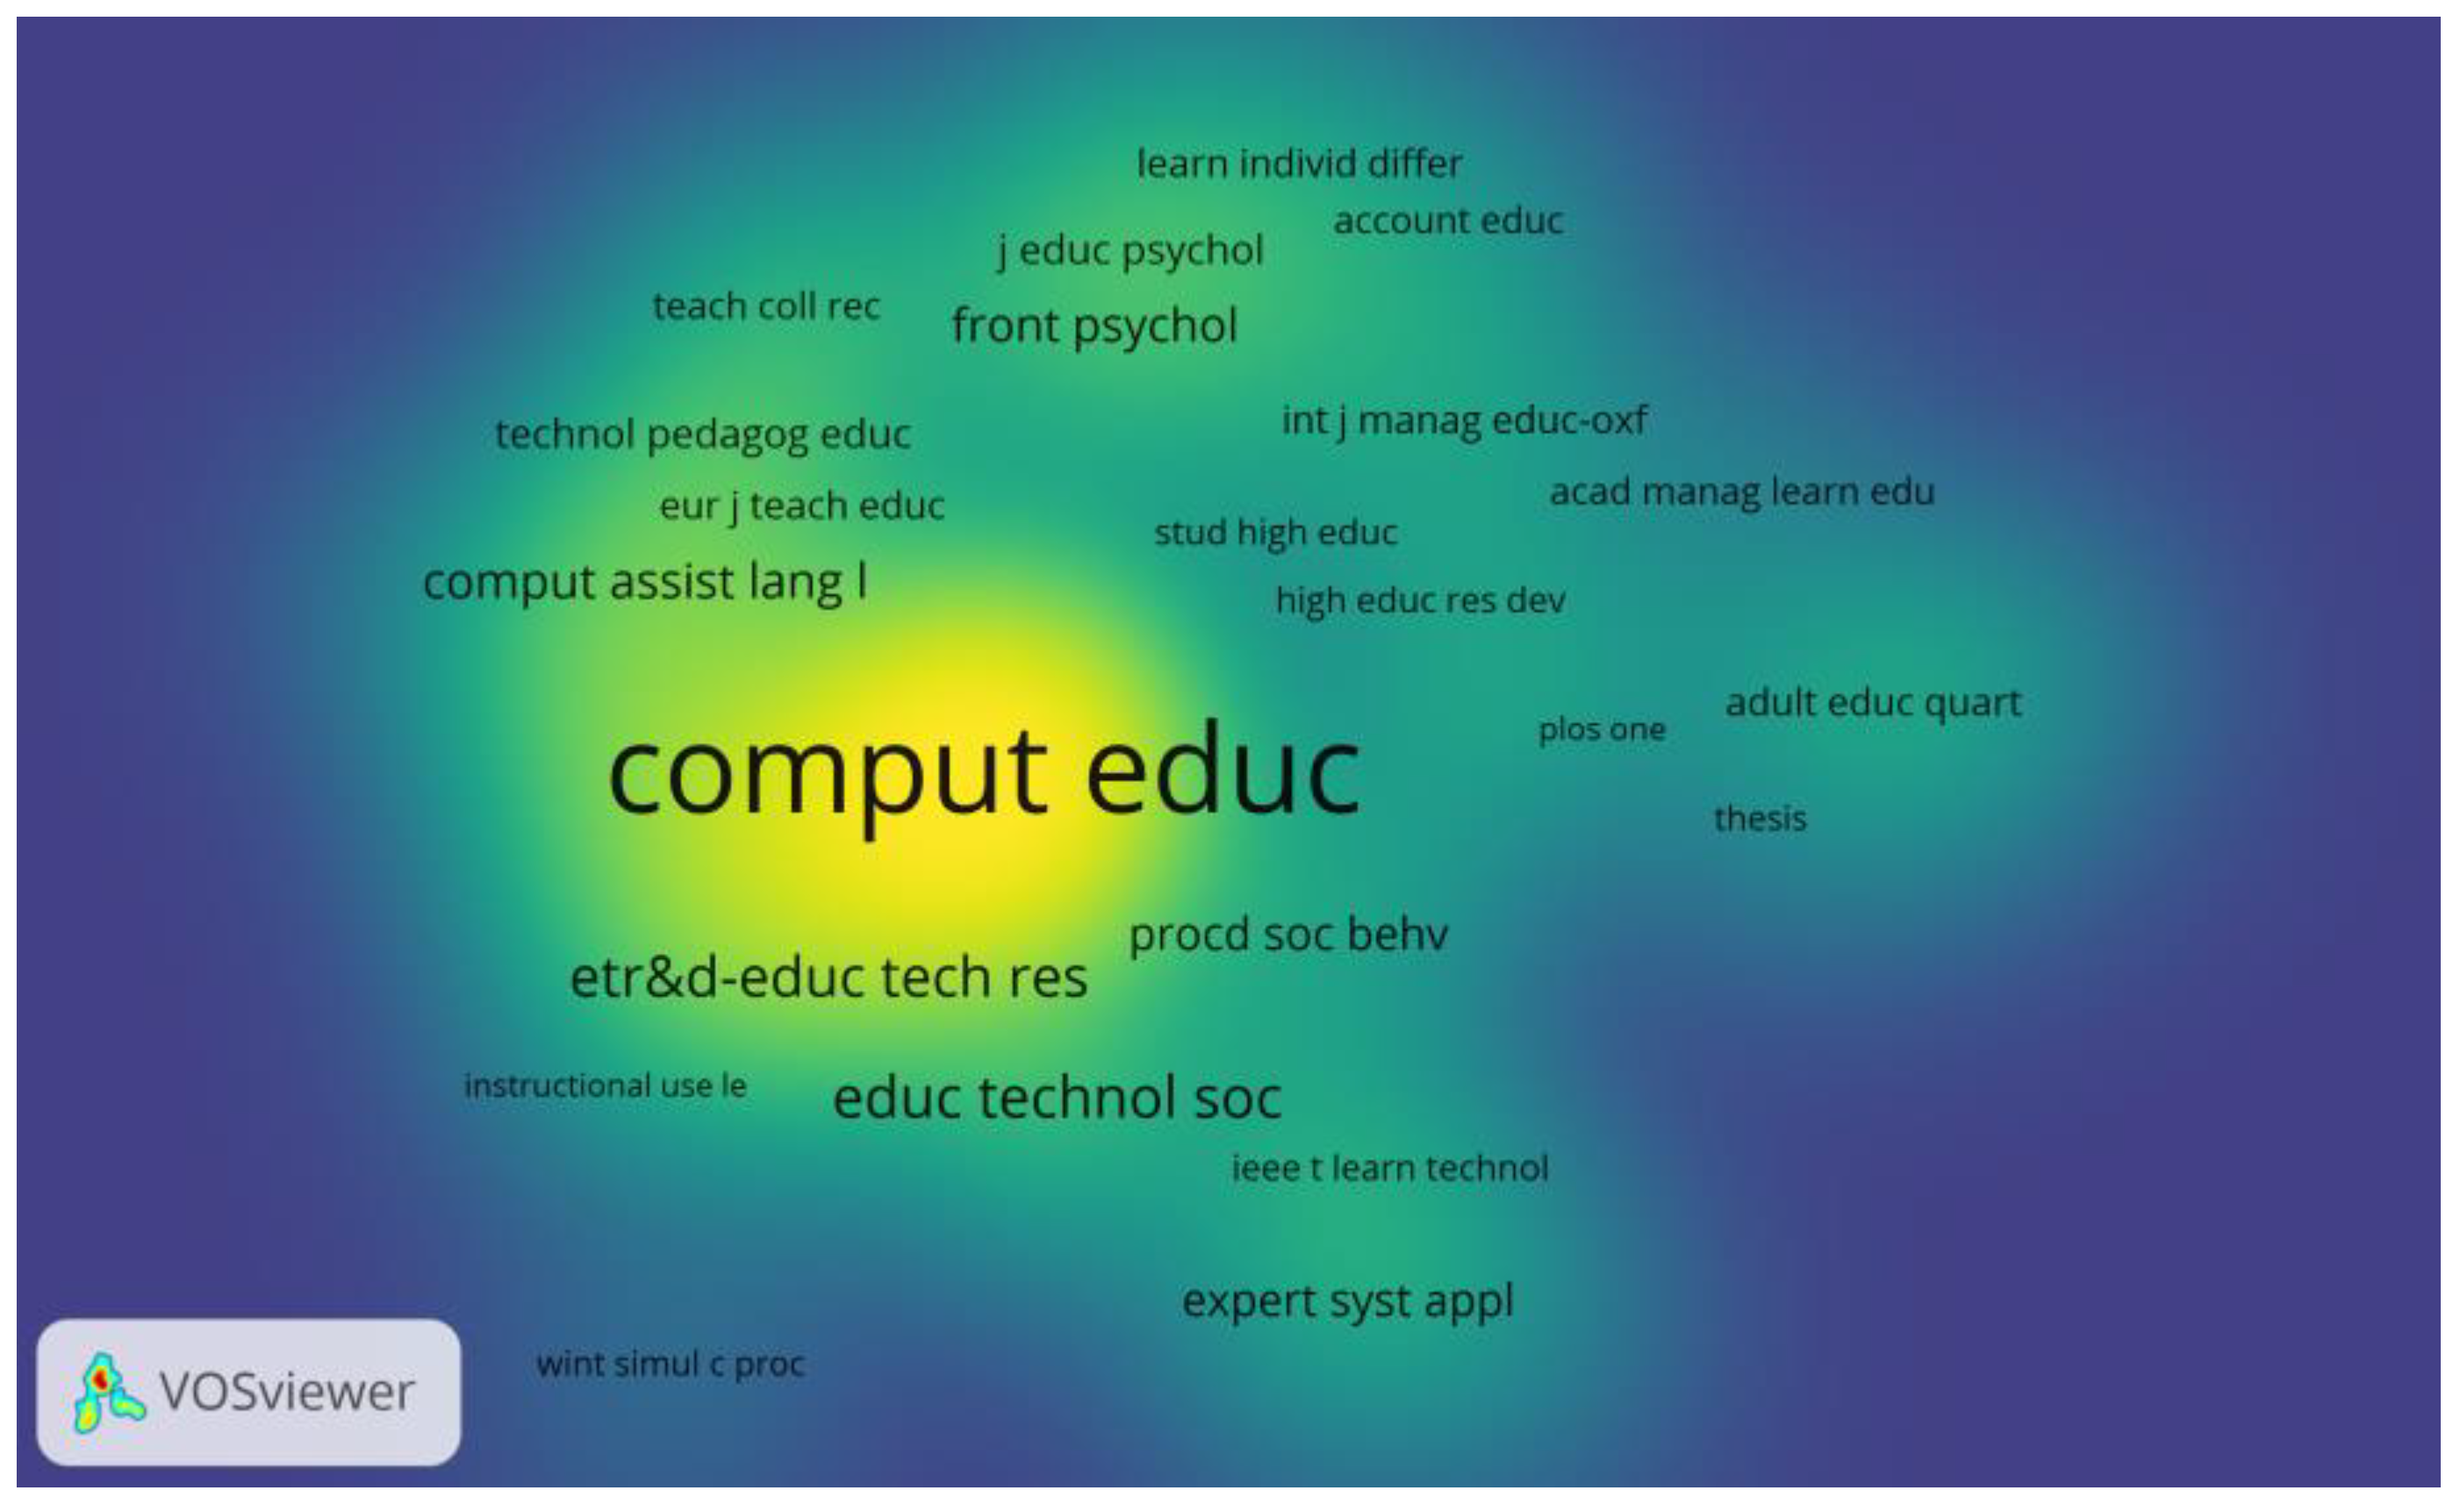
Figure 7.
Top Keywords with the Strongest Citation Bursts on Higher Education Informatization Research.
Figure 7.
Top Keywords with the Strongest Citation Bursts on Higher Education Informatization Research.
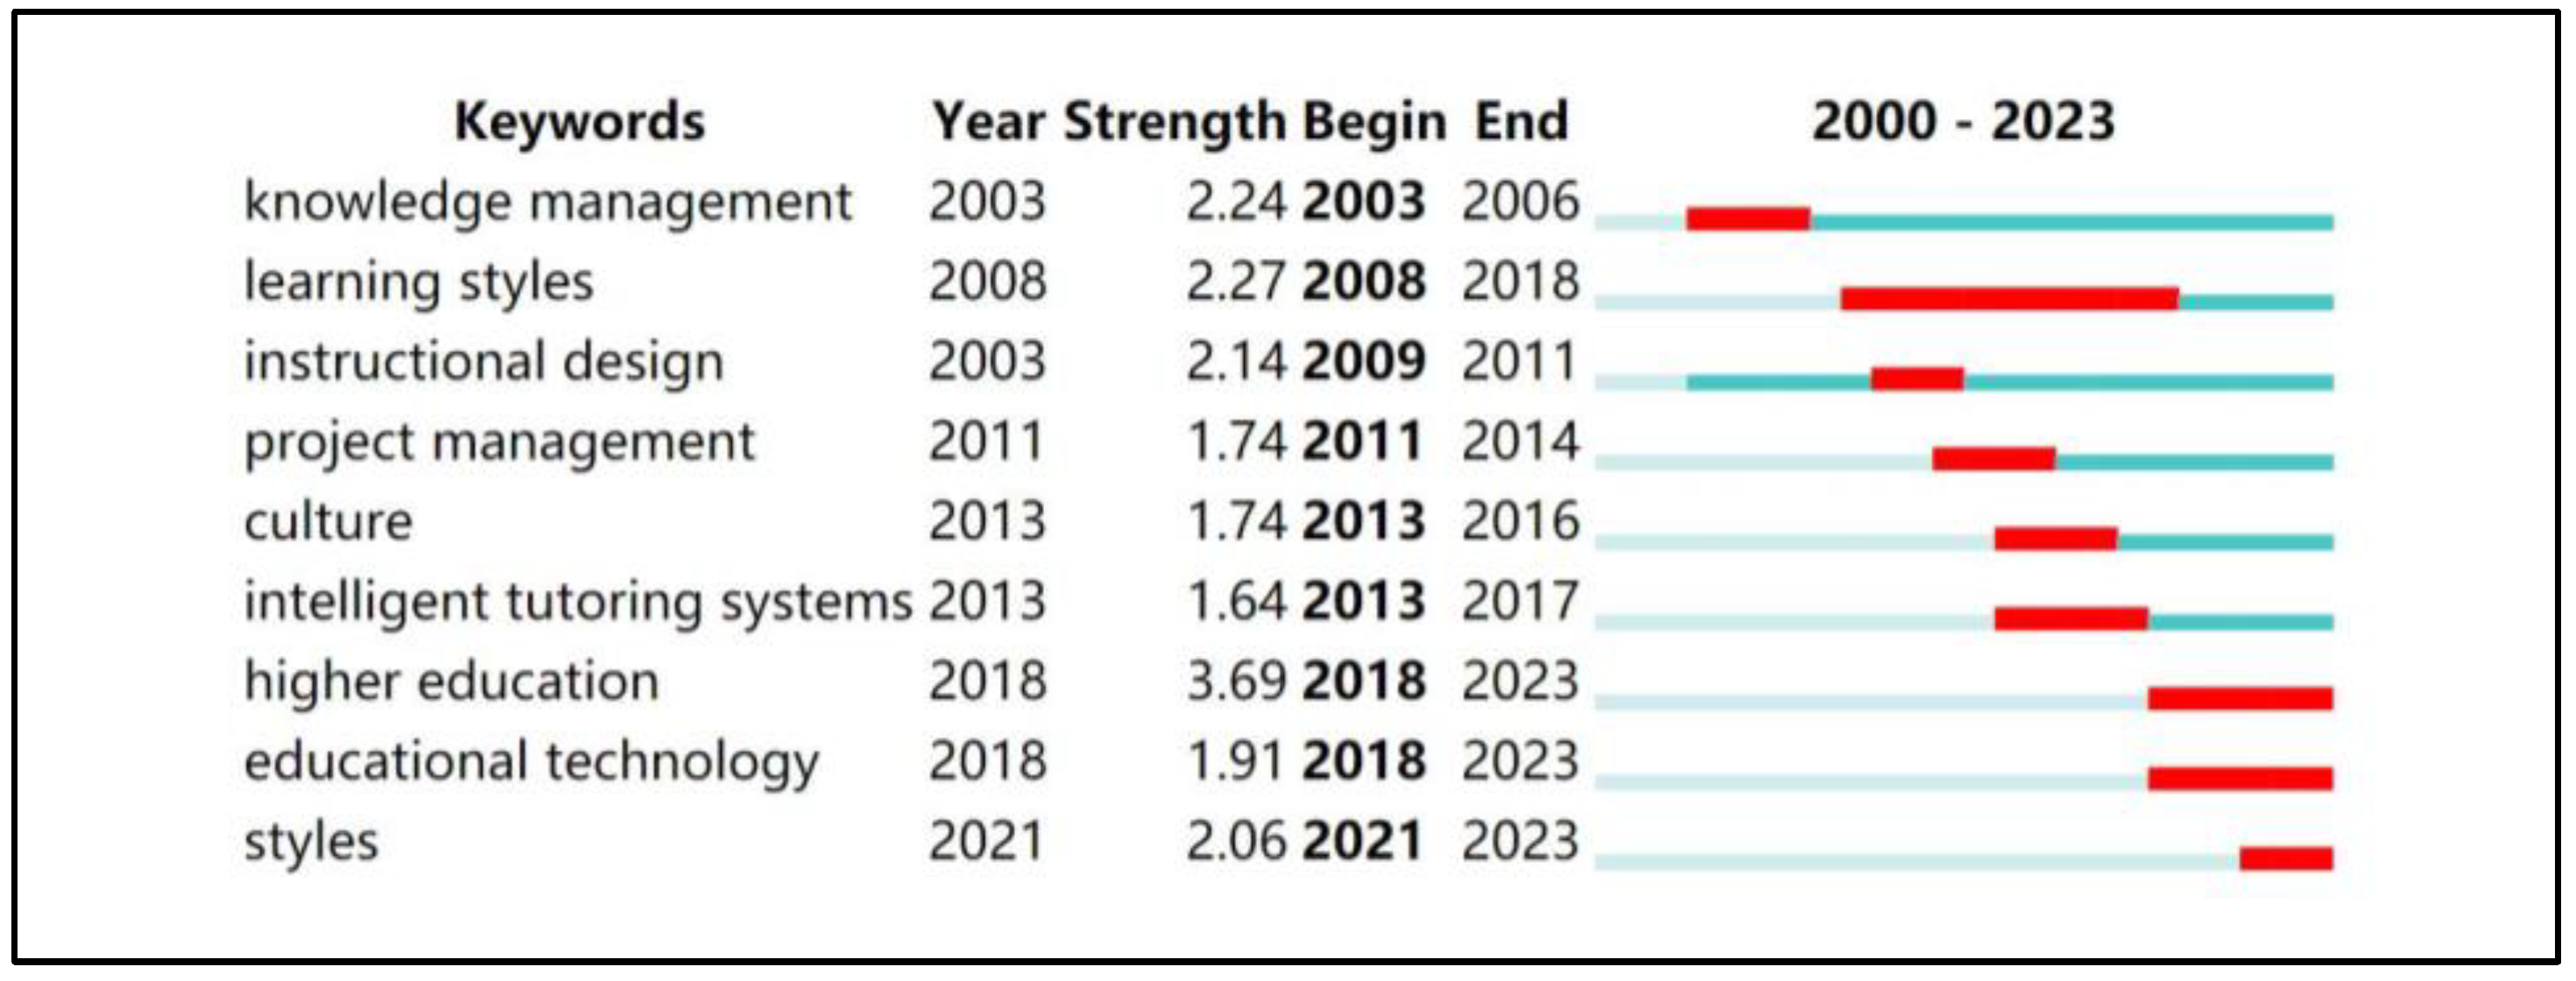

Table 1.
Top Authors in Higher Education Informatization Research.
| Rank | Author | Documents | Citations | Average Citation/Document |
|---|---|---|---|---|
| 1 | kinshuk | 5 | 271 | 54.20 |
| 2 | martin,florence | 4 | 42 | 10.50 |
| 3 | sinclair,a.john | 3 | 71 | 23.67 |
| 4 | chang,yi-chun | 3 | 107 | 35.67 |
| 5 | chu,chih-ping | 2 | 107 | 53.50 |
| 6 | graf,sabine | 2 | 153 | 76.50 |
| 7 | moyer,joanne m. | 2 | 29 | 14.50 |
| 8 | ritzhaupt,albert d. | 2 | 42 | 21.00 |
| 9 | altun,arif | 2 | 16 | 8.00 |
| 10 | diaz-pérez,p | 2 | 15 | 7.50 |
Table 2.
Key Journals in Higher Education Informatization Research.
| Rank | Source | Publications | Citations | Average Citation/Publication |
|---|---|---|---|---|
| 1 | education and information technologies | 32 | 130 | 4.06 |
| 2 | educational technology &society | 24 | 551 | 22.96 |
| 3 | british journal of educational technology | 12 | 123 | 10.25 |
| 4 | computers &education | 9 | 290 | 32.22 |
| 5 | interactive learning environments | 9 | 46 | 5.11 |
| 6 | etr&d-educational technology research and development | 8 | 103 | 12.88 |
| 7 | international journal of management education | 5 | 16 | 3.20 |
| 8 | journal of computer assisted learning | 4 | 140 | 35.00 |
| 9 | journal of hospitality leisure sport &tourism education | 4 | 6 | 1.50 |
| 10 | studies in continuing education | 4 | 11 | 2.75 |
Table 3.
Leading Countries in Higher Education Informatization Research.
| Rank | Country | Document | Citation | Total link strength |
|---|---|---|---|---|
| 1 | peoples r china | 40 | 634 | 1430 |
| 2 | US | 26 | 220 | 973 |
| 3 | spain | 15 | 104 | 339 |
| 4 | australia | 14 | 74 | 956 |
| 5 | canada | 12 | 45 | 658 |
| 6 | englan | 11 | 256 | 620 |
| 7 | turkey | 11 | 80 | 226 |
| 8 | germany | 10 | 96 | 544 |
| 9 | greece | 8 | 152 | 164 |
| 10 | israe | 5 | 30 | 308 |
Table 4.
Prominent Author Keywords in Higher Education Informatization Research.
| Rank | Author Keyword | Occurrences | Total link strength |
|---|---|---|---|
| 1 | higher education | 11 | 10 |
| 2 | learning management system | 9 | 14 |
| 3 | covid-19 | 9 | 9 |
| 4 | e-learning | 9 | 8 |
| 5 | learning management systems | 7 | 8 |
| 6 | learning styles | 7 | 6 |
| 7 | workplace learning | 7 | 3 |
| 8 | instructional design | 6 | 5 |
| 9 | adaptive learning | 5 | 7 |
| 10 | online learning | 5 | 7 |
Disclaimer/Publisher’s Note: The statements, opinions and data contained in all publications are solely those of the individual author(s) and contributor(s) and not of MDPI and/or the editor(s). MDPI and/or the editor(s) disclaim responsibility for any injury to people or property resulting from any ideas, methods, instructions or products referred to in the content. |
© 2023 by the authors. Licensee MDPI, Basel, Switzerland. This article is an open access article distributed under the terms and conditions of the Creative Commons Attribution (CC BY) license (http://creativecommons.org/licenses/by/4.0/).
Copyright: This open access article is published under a Creative Commons CC BY 4.0 license, which permit the free download, distribution, and reuse, provided that the author and preprint are cited in any reuse.


