1. Introduction
The mankind currently lives with climate change and natural occurrences that cause fatalities and damages that permanently alter the lives of those who witness them, such as global warming, earthquakes and countless other environmental changes, but nothing really frightening like what has recently been discovered with some research probes that document the characteristics of the planets of the solar system, demonstrating that extremely, radical changes have occurred in the solar system in which we live, such as the characteristics of the planet Pluto with its extremely low ambient temperature and with signs that it once had a temperature environment like that of planet Earth in the not too distant past, based on a prediction of solar activity for another five billion years, as well as theories that the resulting gas mixtures in the atmosphere can carry out reactions that cool the surrounding environment, fogs of hydrocarbons demonstrate substantial effects of radioactive heating and cooling in planetary atmospheres. The propulsive energy for displacement to places beyond the planet we live on, for example, has been evolving since the beginning of the last century until today, when the incursion of propulsion systems close to infinite energy can be seen and could drive a spacecraft with design resilient enough to move in movements similar to the displacement of light in a vacuum, which makes it possible to approach interstellar systems.
The recent global energy evolution in the electrical sector from power supply using fossil fuels to generation systems with renewable energy in a period in which over the last two centuries there has been an orderly growth in energy use, especially electrical energy, where the evolution is driven by the abundance of energy available during its period of use equated with the most acquisitive final price conducive to sustainable development. In many cases of technological evolution, the competitive price conditions to the consumer to demand renewable generations, such as wind and solar, in different locations and especially where there is no access to electricity or piped natural gas.
Electrical energy from wind or solar generation has become a source of fast evolution of implementation among emerging generation technologies globally, demonstrating benefits in the economic cycle in which the technological improvement of generation in relation to production costs results in a increased demand with a reduction in the final price for the consumer. As the years go by, wind and solar energy become cheaper and more resilient compared to fossil fuels.
The application of computer systems equipped with artificial intelligence abilities continues to be intrinsically widespread in electrical power systems. The field of artificial intelligence demonstrates a broad and comprehensive field of action, combined with conventional programming languages, which consists of machine learning systems, logic-based tools, knowledge-based tools, as well as based on data bases, information, standards and rules for planning, operation and development.
Over the last few decades, the use of digital systems has imposed greater connectivity on electrical energy systems, enabling greater numbers of consumers, computational intelligence, general efficiency, reliability of electrical energy supply and more sustainability, adhering to supply networks distributed electrical energy generation systems with renewable sources. Technological advances in data processing, analytical systems and connectivity, bringing greater evolution to digital applications, such as smart home appliances connected by data networks, access to shared mobility, and 3D printing. Future electrical power systems will enable the use of demand response, identifying the need for electrical energy supply and providing the required demand immediately, in the exact location and at a much lower cost. The use of computational systems equipped with quantum photonic processing will enable real-time preventive automation of practically the entire electrical power system, bringing greater reliability, as well as promoting the use of computational systems with lower electrical energy consumption, which will reduce the implementation cost for the electricity supply, as well as the computational structure to be used by the consumer. In the electric vehicle microgrid (powertrain), the photonic quantum computing system will enable faster and safer automation and lower electrical energy consumption.
The implementation of advanced scientific research and technological development in broader electrical power generation systems and comprehensive conditions in smart electricity grids grows continuously and in parallel with effective monitoring and management systems for delivering electrical power with more reliability and resilience. Alternative and renewable sources of electrical energy generation impose new directions in electrical energy planning, emphasizing sustainability with new types of solar energy generation with panels based on perovskite, a mineral made up of a unique crystalline structural form, gaining significant attention and popularity in recent years due to high potential and high efficiency at low cost compared to traditional silicon solar cells. Along with traditional renewable energies, infinite electrical energy generators gain prominence in the commercial activities of generation systems, based on permanent magnets or motor-generator sets, these energy generation systems impose an efficient generation standard, with low cost, and being a more viable energy efficiency option compared to generation based on fossil fuels, as it does not require any external form of supply product and does not emit gases into the atmosphere, being able to replace thermoelectric generators completely and at low cost, due to the emergence of better power motor-generator groups with up to 12 Kw/kg, the infinite generation of electrical energy proves to be highly efficient and affordable.
Artificial intelligence (AI) applied to electrical energy systems plays significant roles in the successful planning and operation of smart electrical grids, highlighting active grid systems, highlighting the improvement of the electrical system operated in real time, demonstrating speed, excellent adaptation, robustness and less dependent on model configuration and specific parameters of the electrical energy system, which considerably reduces the cost of implementing, maintaining and operating the network, such as eliminating and reducing the time of faults occurring on the network. Machine learning, as an application of artificial Intelligence, has the characteristic of obtaining data from its environment, learning to act with it. With the use of systems with DC microgrids, the use of distributed generation imposed greater energy efficiency in the use of generated electrical energy. By placing electrical energy consumption loads closer to generation, DC microgrids reduce electrical energy losses, as well as bringing electrical energy storage units closer to the consumer. With an electrical energy system formed by the DC microgrid, the connection is made directly, as there is no variation in frequency, therefore there is no need for synchronization between the generating sources to be connected.
With the determination of the dynamism performed and the result of various variations regarding fluctuations of voltage levels coming from any significant disorders, composing parameters shaped by the resulting performance proportional to the time following the event, aiming to act according to the system, with the establishment of its initial conjuncture with stable characteristic, the foundation of methodologies is characterized as conducive to application in a singular and primordial argument for the composition of the microgrid control (MG), as well as the analytical verification of stability. Even though the microgrid has a structure formed with reduced characteristics regarding conventional networks, the unfolding of performance promotes relatively complex responses, similarly as the conventionally larger structural formation systems. Thus, in order to achieve the stability of the microgrid in the operation it is essential to use a dynamic stability analysis, leading to system voltage levels as a whole to the desired control limits specifically to attender the supply of electricity. As the microgrid varies in operation mode, alternating in the modes: connected or islanded with respect to a main power grid, predictions to the introspection of disorders composed of the essence of part of the actions determined by the power switching systems of the electrical microgrid between the modes of operation connected and islanded, a mechanism that expresses extreme complexity of the structural formulation of this type of electricity system. The dynamic behavioral performance of a microgrid differs and specifically proportional to numerous plications, according to the specified models of composite patterns, type and structuring, which requires the use of specific methodological modeling patterns, so that this type of the electric power system, as much as it is compared to conventional power electrical system, and should attack the requisites necessary by providing the demand for electricity in its entirety.
In addition to the VSGs (virtual synchronous generators) are designed introductory to explain the characteristic emulation of SGS response, analogously demonstrates a re-formulating of translation angle for VSGs. There is a probabilistic possibility that the VSGs are subject to the occurrence of instability caused by the deteriorative effect imposed by the reactive energy control loop. A differential aspect is expressed in the necessary subsistence of a current limiter, implemented to tame the current output from the power inverters, aspect that can lead the performance to the transitional angle instability.
The structural implementation of fast chargers for EV in certain connections of electrical grids raises the likelihood of overloading in distribution transformers, electrical power losses by joule effect, network voltage oscillations, harmonic distortion elevation, total system instability and eventual blackout. Even differing from conventional systems, EVs are characterized by a more conducive alternative compared to fossil fuels, the need for battery carriage systems in the structure of the electrical distribution system imposes a set of preventive measures to minimize their consequences of harmful characteristics, otherwise supply problems and tension quality get worse in a noticeable manner. Transitional occurrences caused by overvoltage and inrush current at the time of initialization of these fast power charging equipment with respect to conventional facilities make up the formulation of a change inappropriate in the converter's functioning, as well as the electricity distribution system. In the appearance of greater visualization of the transitional, the distorted voltage and the transient elevation of electric current imposed by the unfolding of the electric trigger tend to decrease the life of the electrical component, cause overload in the electricity distribution system and compromise the reliability and quality of the supply of electricity demanded in the installation.
The system stability margin can be significantly improved by an appropriate virtual impedance technique. The implementation of virtual impedance to correct non-ideal reactive power sharing eliminates a disability known as reactive incompatibility. Virtual impedances are chosen at specific intervals, considering the stability analysis of microgrid, voltage limits, reactive energy sharing and required damping status. The virtual admittance is also adopted to apply to parallel current controlled DGs (in microgrids connected to the grid or on the island mode) to compensate for harmonic currents and reduce transmission losses. Adaptive virtual impedance tends to change active and reactive power sharing in a microgrid in islanded mode.
The reconciliation of the virtual impedance method along with metaheuristic algorithms portrays an improved solution for proportional and relatively ideal electricity distribution among distributed energy generation units. The PSO algorithm is still considered one of the metaheuristic methods most efficiently due to its inherent specific characteristics. The PSO algorithm has many advantages compared to other metaheuristic optimization methods that differentiate this algorithm from other algorithms. One of the properties of the highlighted algorithm is emphasized in its differentiated population-based resource. This feature highlights this less likely algorithm to enter the estimated local ideal points. This algorithm continues to operate with probabilistic rules, rather than defined rules. Thus, PSO represents an algorithm of stochastic optimization that tends to focus its research in areas with uncertainties and complex. This feature highlights PSO one of the most flexible and resilient when compared to conventional ones. The PSO acts with non-differential objective functions. PSO operates using the result of the return index or objective function to act by directing the research on the problem space. The quality of the ideal response is independent of the initial population. Starting anywhere in the research space, the algorithm's response eventually tends to converge to the ideal answer. PSO has a lot of flexibility to act by controlling the balance between the site and the specified global research space. This property of specific and exclusive PSO crosses the problem of premature convergence and increases the operational research capacity. These specified properties make PSO a different method from genetic algorithm (GA), as well as other metaheuristic algorithms. The PSO algorithm expresses a memory property in which each particle uses information from past particles, allowing the algorithm to have less computational time when confronted with other methods. Diming the level of complexity implemented in computational methods with artificial intelligence mechanisms.
The use of systems with artificial intelligence in the planning of electrical power systems stands out in this research, with the use of an evolutionary system based on Particle Swarm Optimization [7], improved to determine the ideal parameter of the virtual impedance scaled in the need to maintain the system in its ideal conditions for any type of variation in load demanded and various electromagnetics transients occurring on the grid.
2. Re-synchronization of the Microgrid
-
A.
Re-synchronization of VSG
Unlike SGS, VSGs impose their own power inverters attributes, and are safer to establish electricity sharing through electricity control loops. Due to the different aspects between SGS and VSGs, the operating resources of VSGs have attributes that differ from SGS, and VSGs integrate a more technological evolution directed to re-synchronization after the suppression of significant anomalies and serious absences in electrical systems . In general, the re-synchronization device of VSGs is subordinated to essential analyzes, and analogously, the results of different parameters are relevant [
1].
-
B.
Operation of the re-synchronization mechanism
VSGs have the function of emulating all the characteristic functions of the result SGs to operation; Thus, it occurs similarly to the change of transient stability at the angle of VSGs. As a result of the deteriorative repercussion caused by the reactive energy control loop, VSGs become susceptible to being impelled to the area of instability. As well as the function of the current limiter, implemented to limit the inverter outlet current, which could lead to the transient instability of the virtual power angle [
2].
Instability does not demonstrate the only behavior that VSGs or SGs would present after the power angle go beyond the UEP (unstable equilibrium point). Evidence of rotating SGs in the conventional electricity system, when the SG pranks the UEP during the absence period, there are two possibilities of results after the elimination of absences: resume a specific stable state, called re-synchronization at this point or demonstrates characteristic Behavior chaotic [
2]. As in conventional SGs, the transition response of the VSGs composes their own characteristics. Considering the VGSs, it is mirrored that it is more likely to return to the stable state, as a small line impedance is characterized and a damping coefficient and greater equivalent shape remains in the electricity system. This evidences how and why the VSGs would return to a new state after the absence is extinguished.
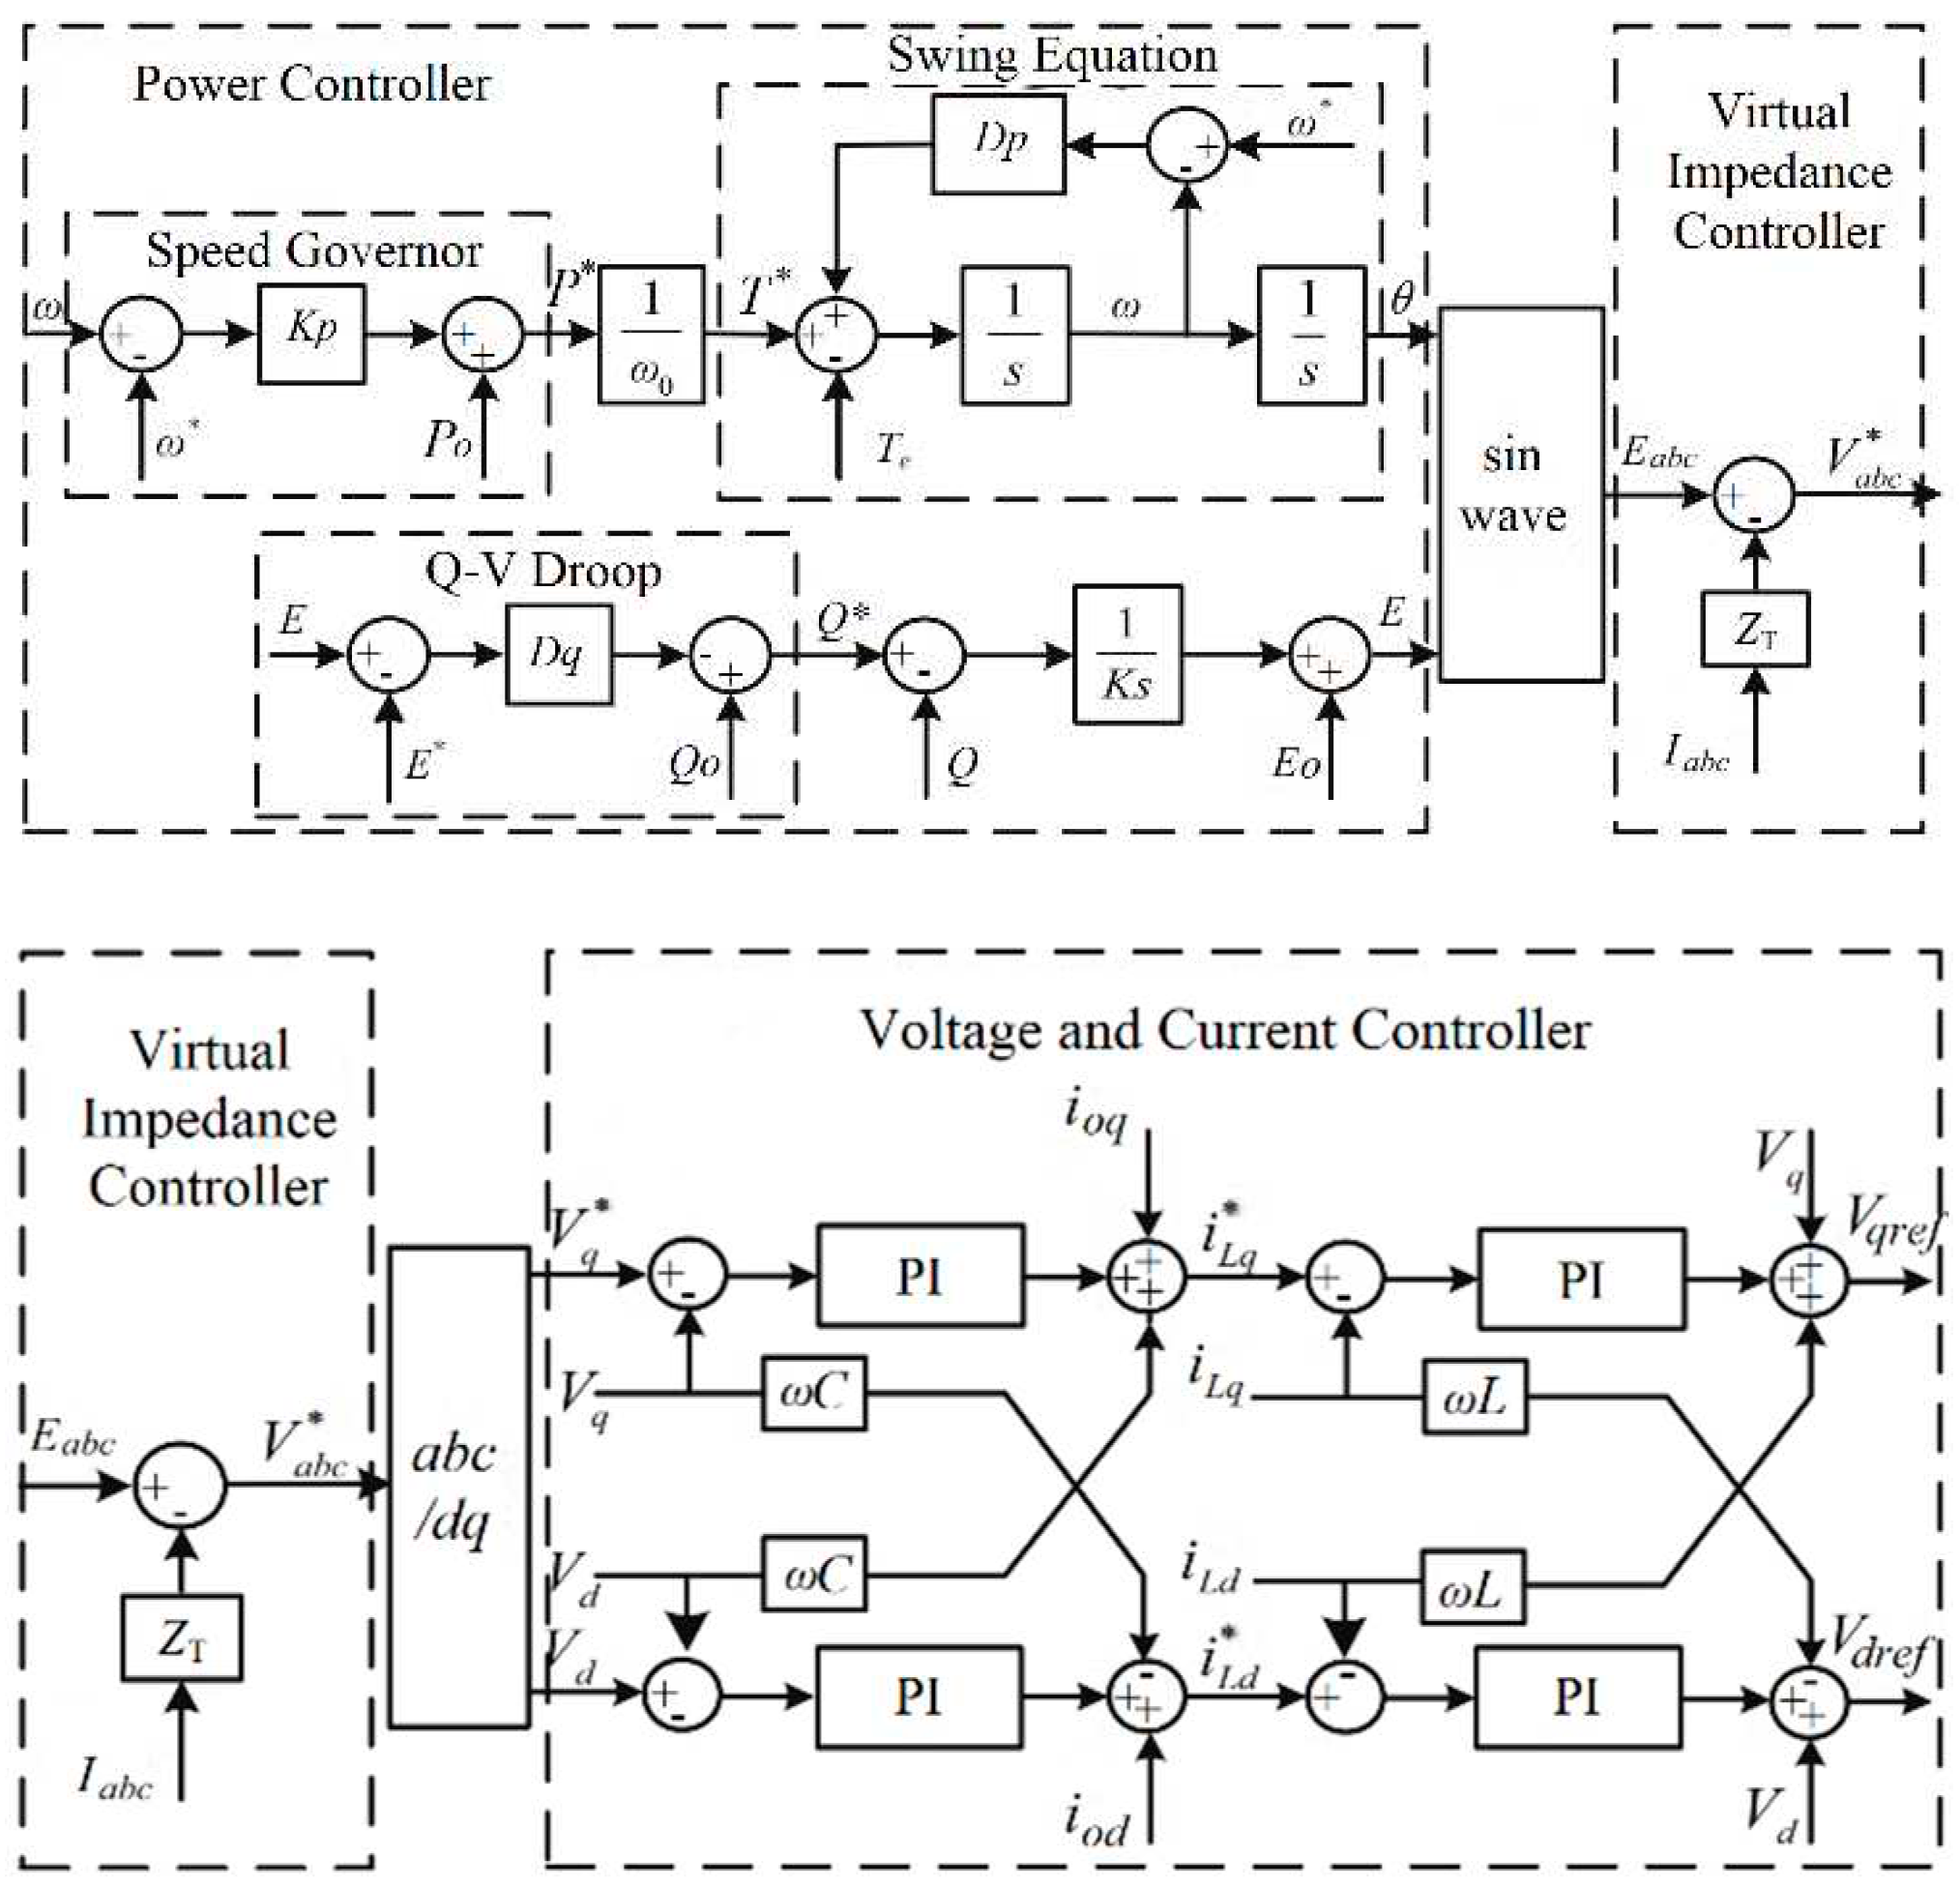
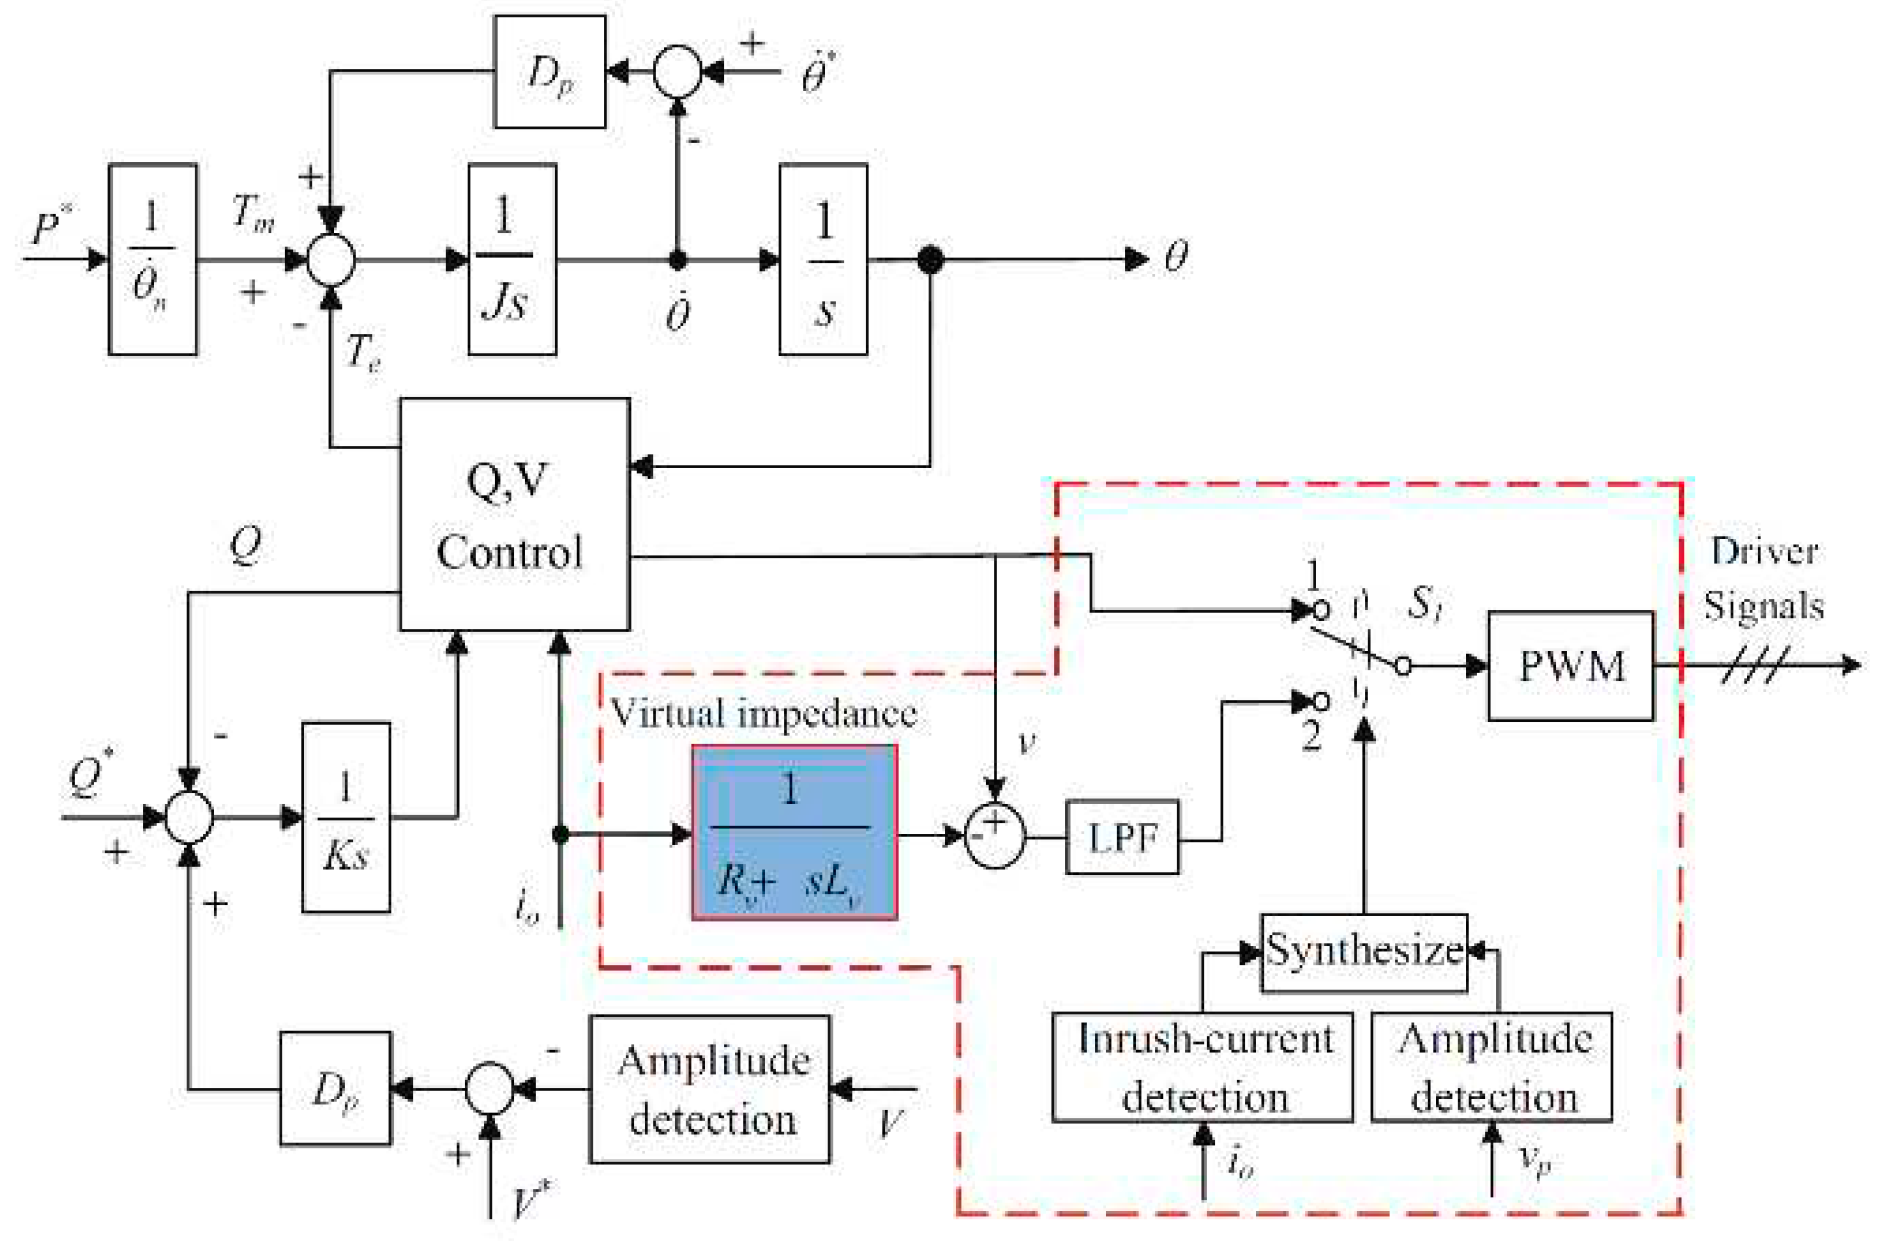
Figure 1 displays the demystified control scheme, which is divided into three sections: power control loop, voltage loop and virtual impedance control and current control loops. The control of electricity in the control loop aims to regulate the active power of the output and performs emulation to the dynamic response of the SGs.
Reactive energy control performs energy sharing, regulating the output voltage. The electrical power system contains a line impedance with resistive characteristics, and the virtual impedance control loop liquid the dissociation of electricity in the energy control loop.
The acceleration of current and voltage tracking speed forms in the current and voltage control loop, as well as optimizing the output power limit of a VSG. The PWM modulation unit receives the generated signs, prosecuting with the activation of switching devices for the execution of the electricity conversion.
The active energy control loop is expressed as:
where
,
, and
,
D represents equivalent damping. Similarly, the reactive power control loop represents as:
where
K represents the voltage coefficient and
represents the coefficient
.
and
represents, the voltage reference and the reactive power reference, in this order. VSG output power follows as:
Figure 2 describes the results of a simulation, which appears that the fault is extinguished at 1.7 s, VPA does not appear beyond the UEP and the system will be directed to the original EP (equilibrium point), called first-swing stability, as appears in the blue curve in
Figure 2.
When the fault is extinguished at 1.8 s, the VPA of a VSG follows beyond the UEP. Based on the perspective of the transitory stability criterion in the electric power system, this implies that the system will enter into the condition of irreversible instability and cannot be established for the synchronous state with the grid. As shown by the results, it was found that the electric power system can reach another EP, described by the red curve in
Figure 2. When this type of phenomenon occurs means that a VSG in the electric power system has strong synchronism capacity, as even experiencing the first-swing instability.
In other words, there are two possible results when the system is distinguished from first-swing instability. One result has the VPA that continues to go beyond the next equilibrium point (NUEP), which is called the transient angle instability. The next result shows that the VPA continues to tend to the differential EP and the system can operate to maintain the synchronism with the power grid, called re-synchronization stability.
2.1. I Re-synchronization influenced by different parameters.
Combining Equations (1) and (3), it can be seen that:
Where
and
, Z and
represent the equivalent line impedance and the residual angle of the impedance angle in this order. As shown in
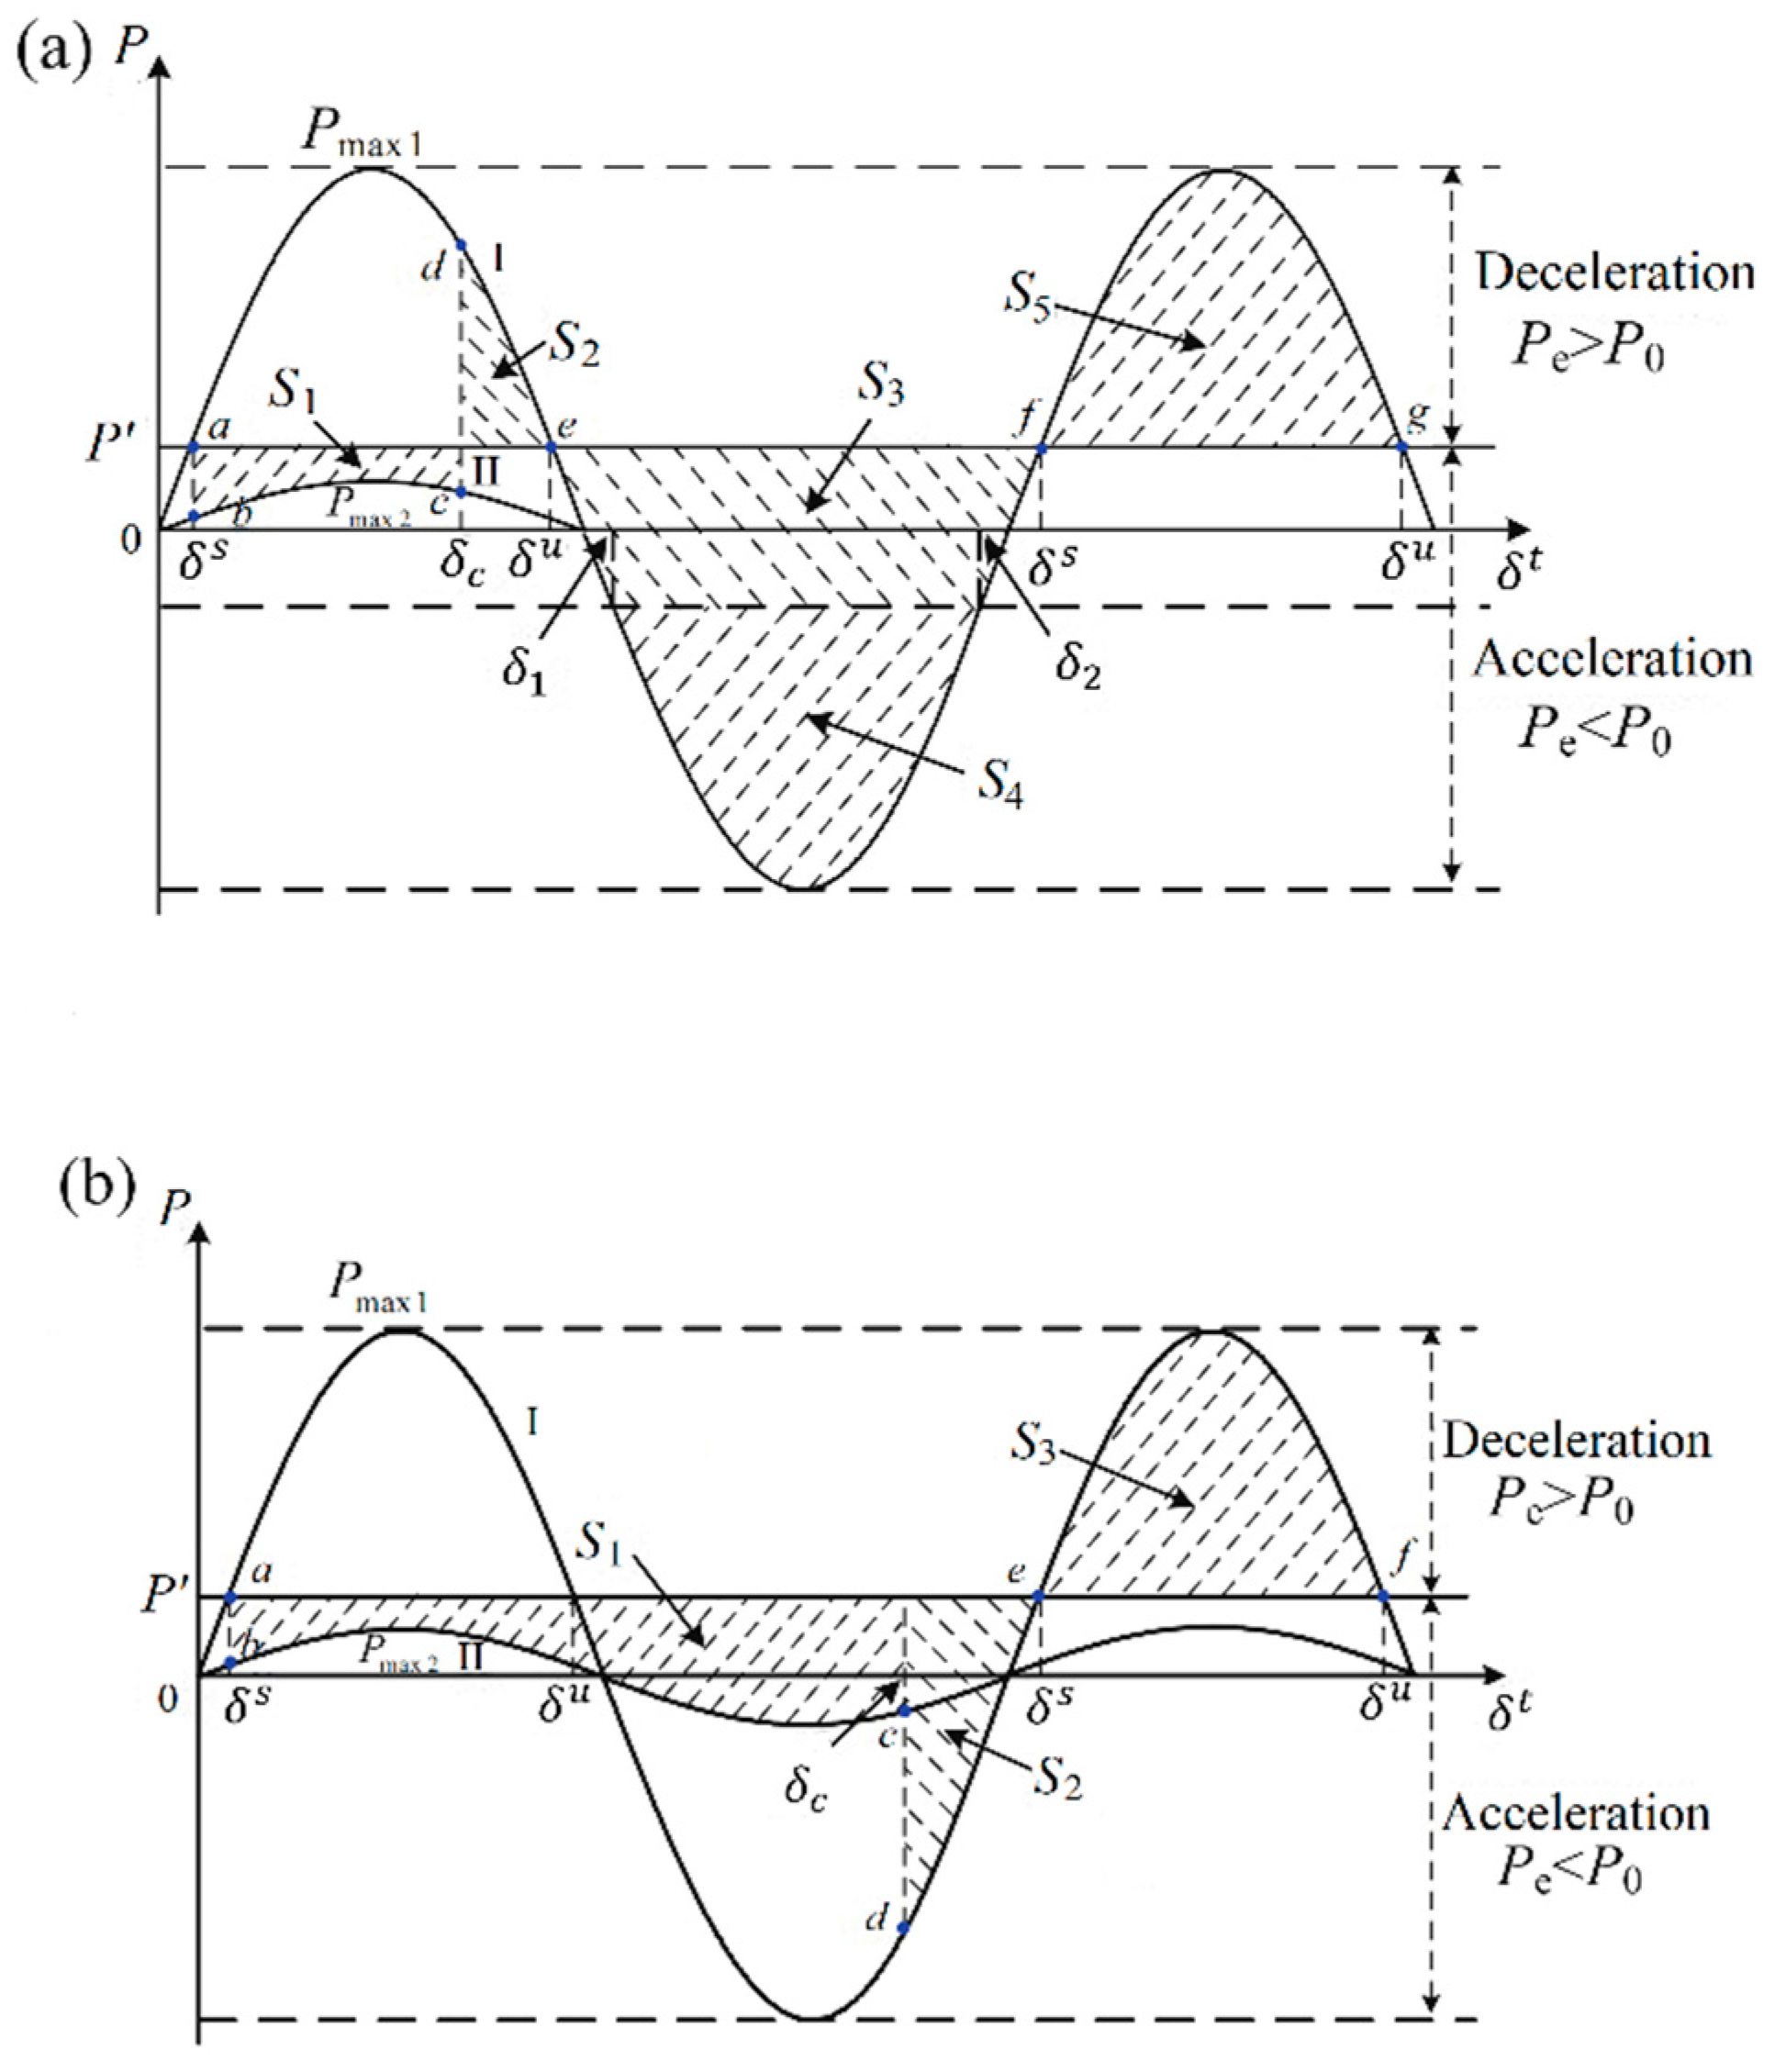
Figure 3, point A and point and represent EP and UEP in this order. And point G represents NUEP (the next stable equilibrium point). Curve I express the relationship between
and δ of the pre-fault and post-fault systems, while curve II represents the curve
– δ of the system under a fault. There are two EPS indicated by
and
in which the power balance can be achieved.
represents stable EP and
represents the UEP.
portrays the VPA of a VSG in the moment of the annihilation of fault.
-
A.
Simulation with .
When
at the time of extinction of the fault, the curve appears in
Figure 3b. Expressing that the system trajectory happens from point
a to point
f.
and
describe the acceleration area but
describes the deceleration area. Similarly, the criteria of re-synchronization stabilization in this case can be determined as:
Where describes the loss of energy by damping.
Combining Equations (2) and (4):
where
and
.
Thus, the
– δ curve of a VSG resembles a sine wave when the reactive power control loop becomes considered. The
– δ during the variation of
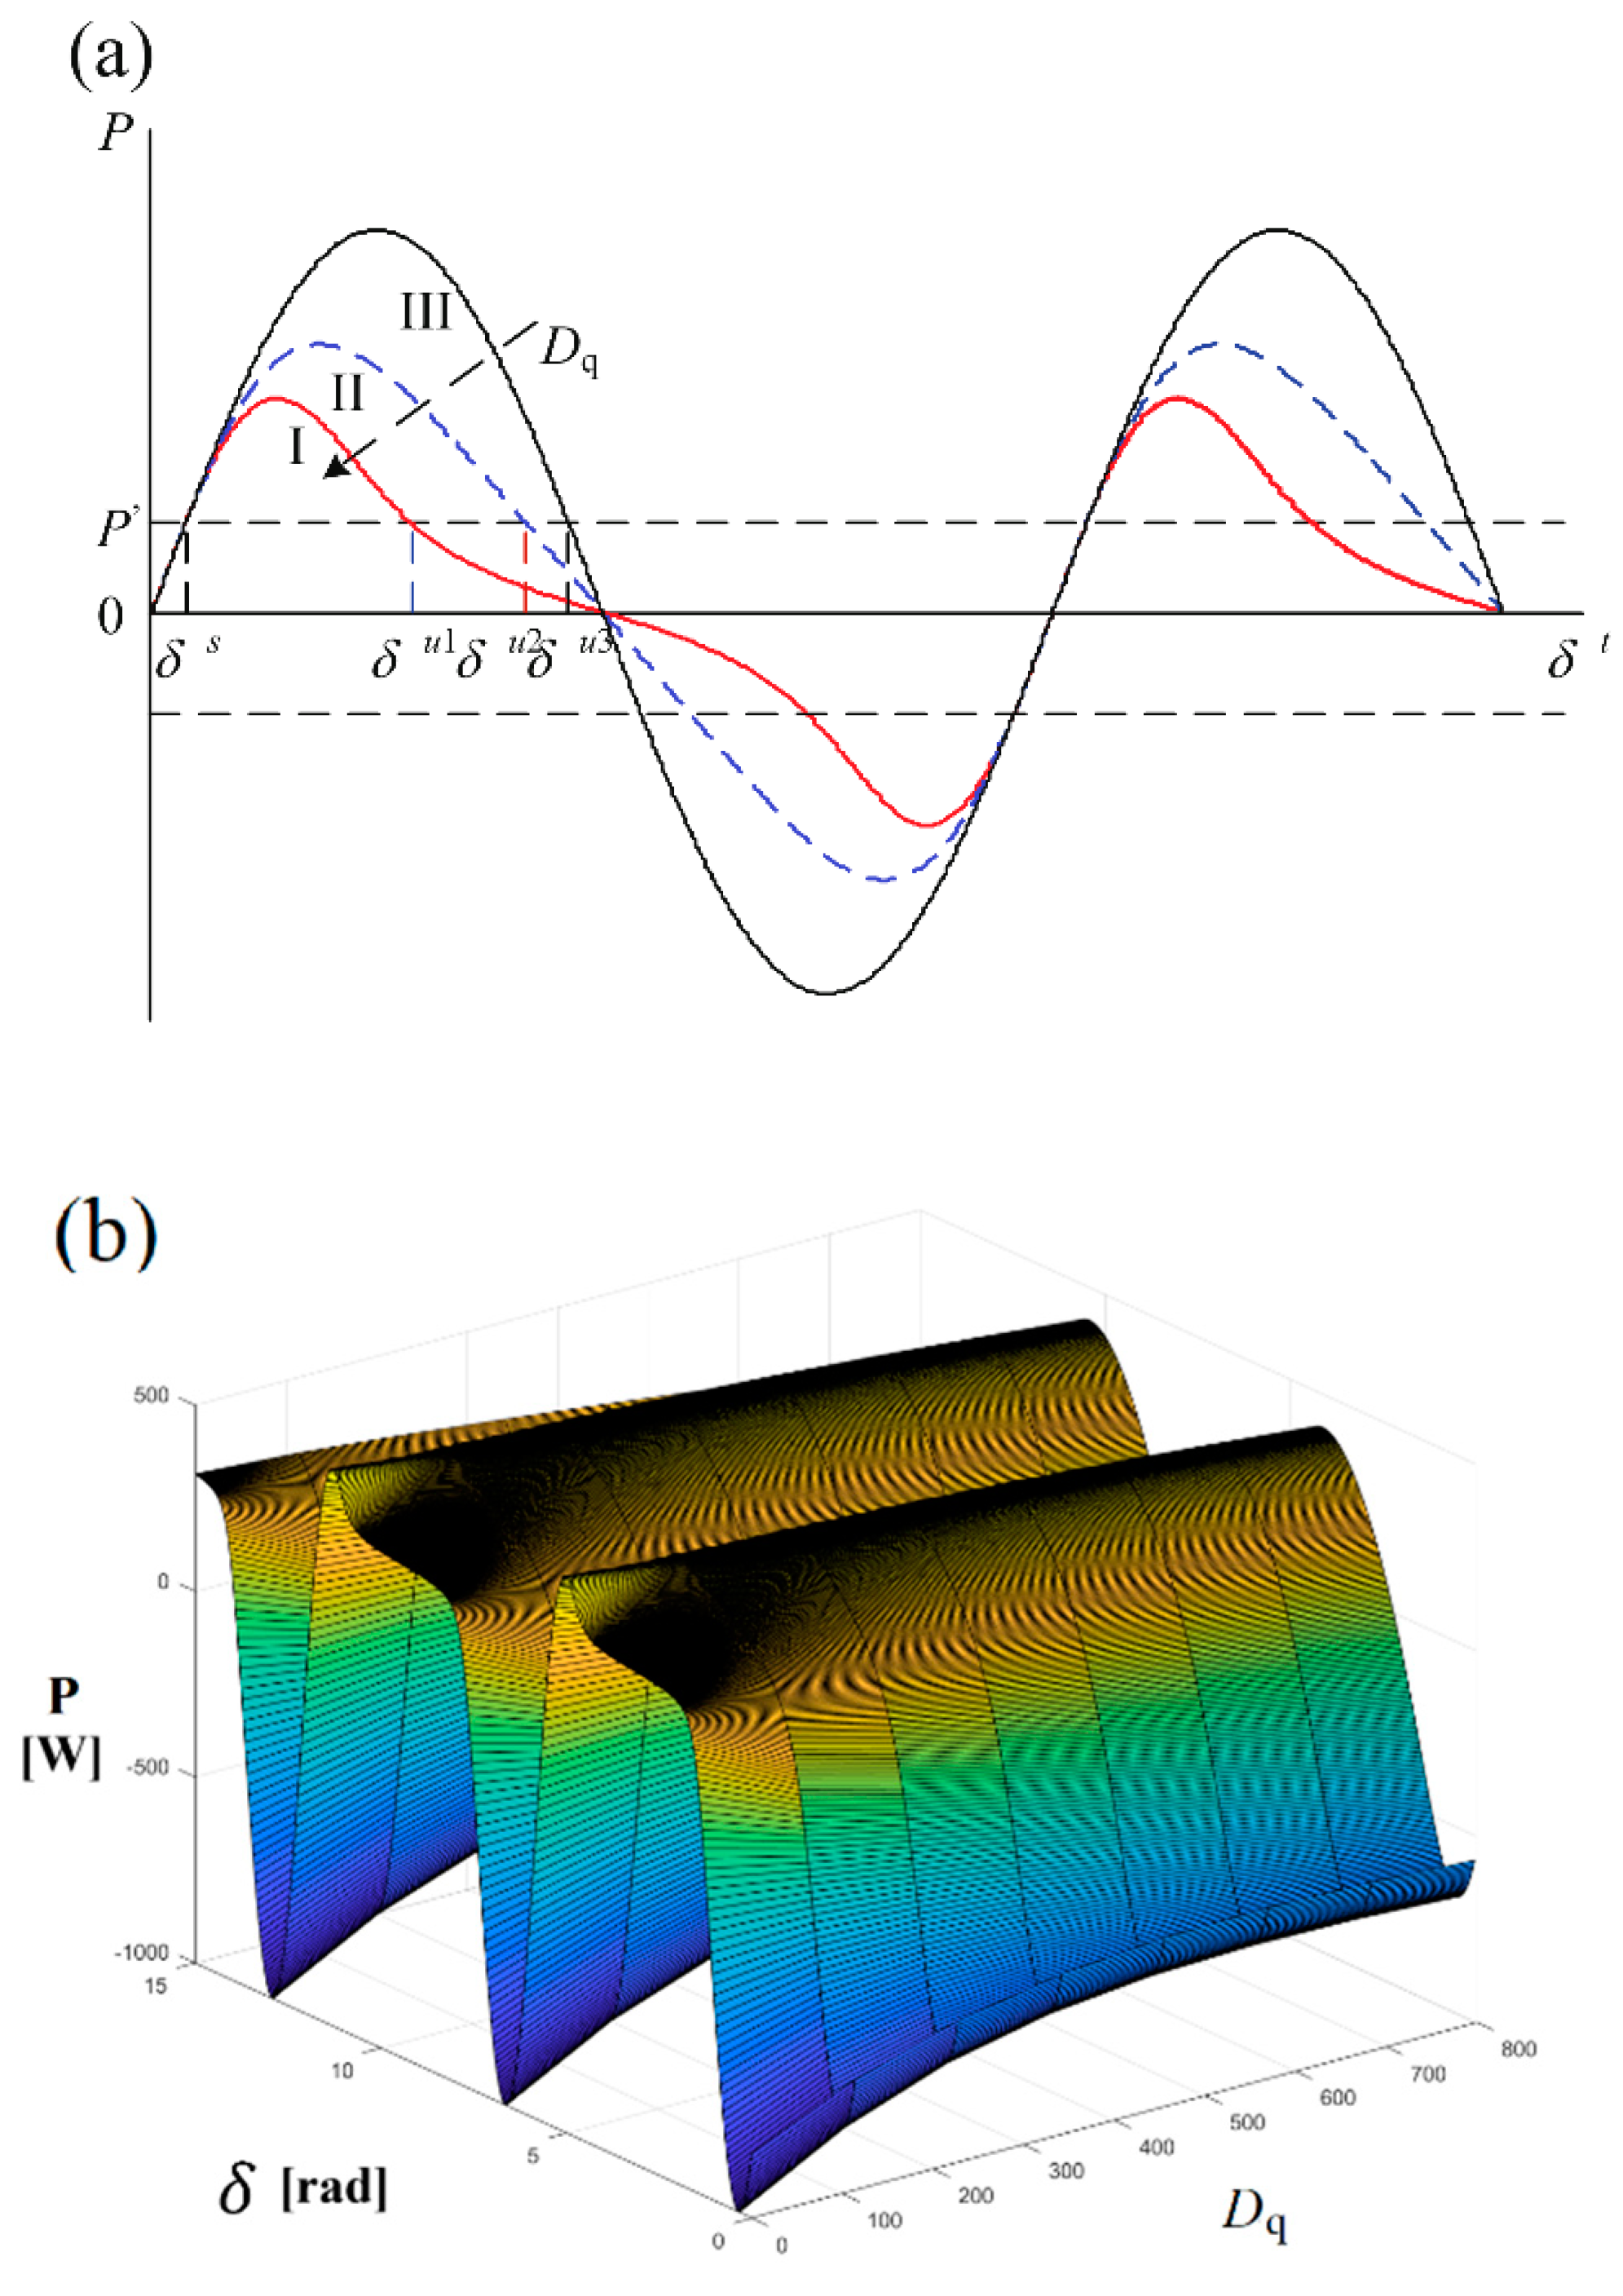
appears in
Figure 4.
The value of for curve I, II and II expressed in 40, 400 and 4000, in this order. It should be noted that UEP decreases according the decrease of . Moreover, it becomes simpler for a VSG to be conducted to the Instability First-Swing area and thus the system experiences a re-synchronization process. Moreover, the operational activity of the systems becomes reduced as the decreases, promoting the reduction energy loss of the system. Therefore, S3 in this case I does not change with the alternation of , while S3 in case II will decrease.
-
B.
Inrush current calculation of fast charger of electric vehicles
With the specific emphasis on the electricity classification of rapid electric vehicle loaders, the specifications for the integration of the grid differentiate. Transient voltage and current oscillation during the initialization of these fast chargers impose a negative impact on the operational performance of the conversion and distribution systems [
3].
The equation formulation that results in the amplitude of the inrush current as a time expressed as:
where
– maximum applied voltage;
– point at which core saturates;
– total impedance under inrush, including system; τ– time constant of transformer winding under inrush conditions;
– energization angle;
– time;
– function of
;
– accounts for 3 phase winding connection;
– accounts for short-circuit power of network.
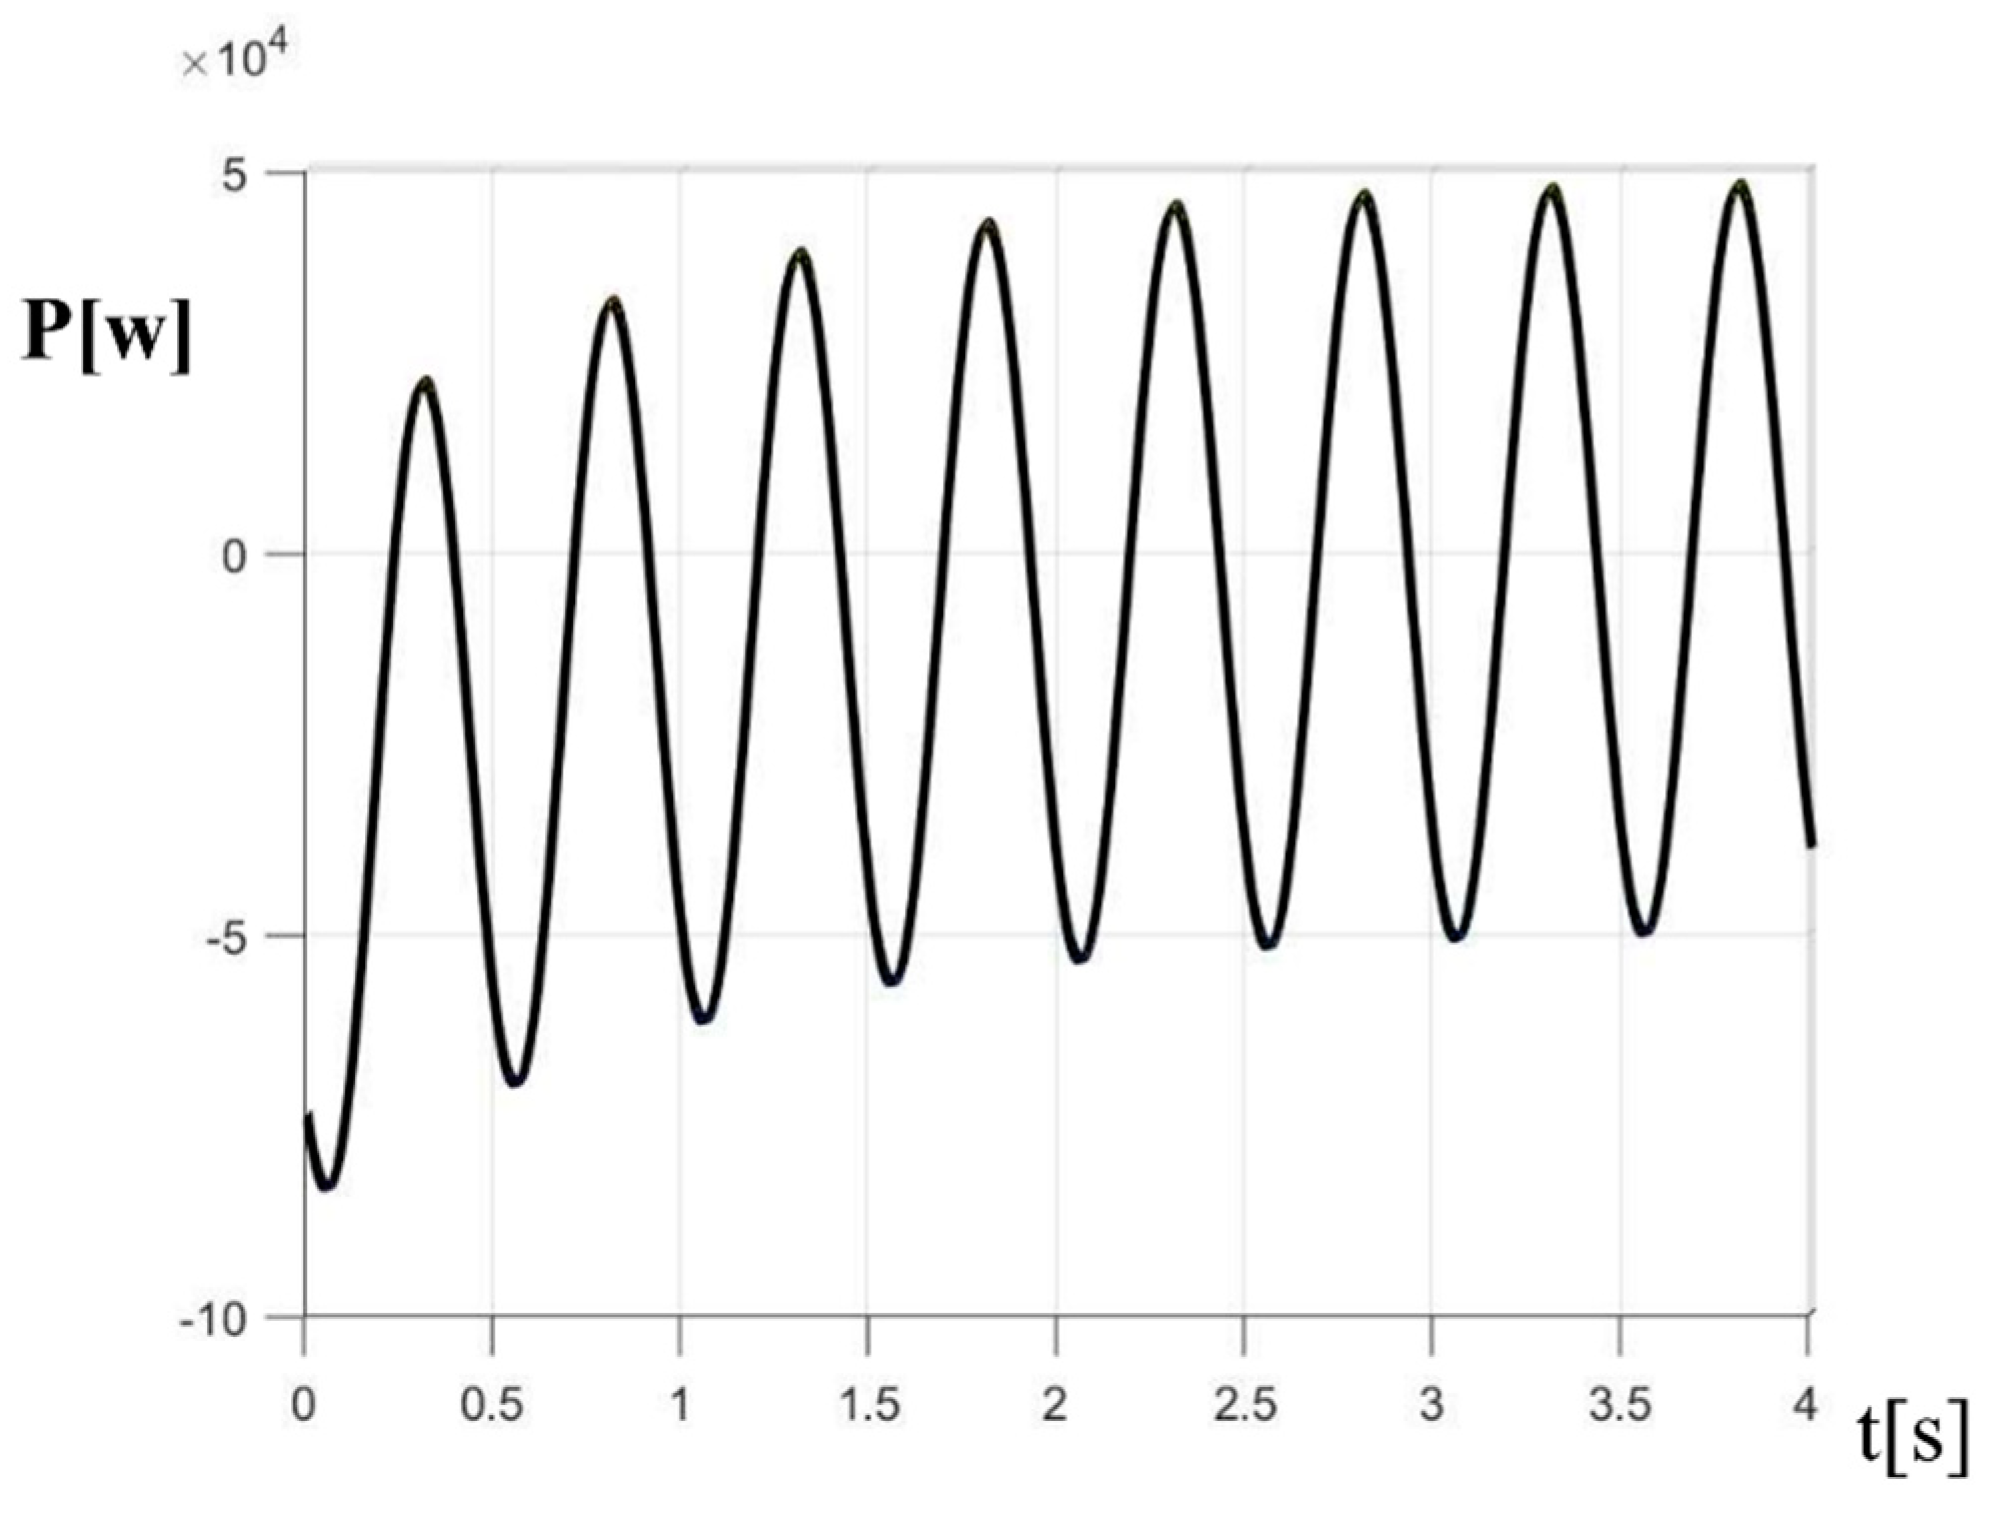
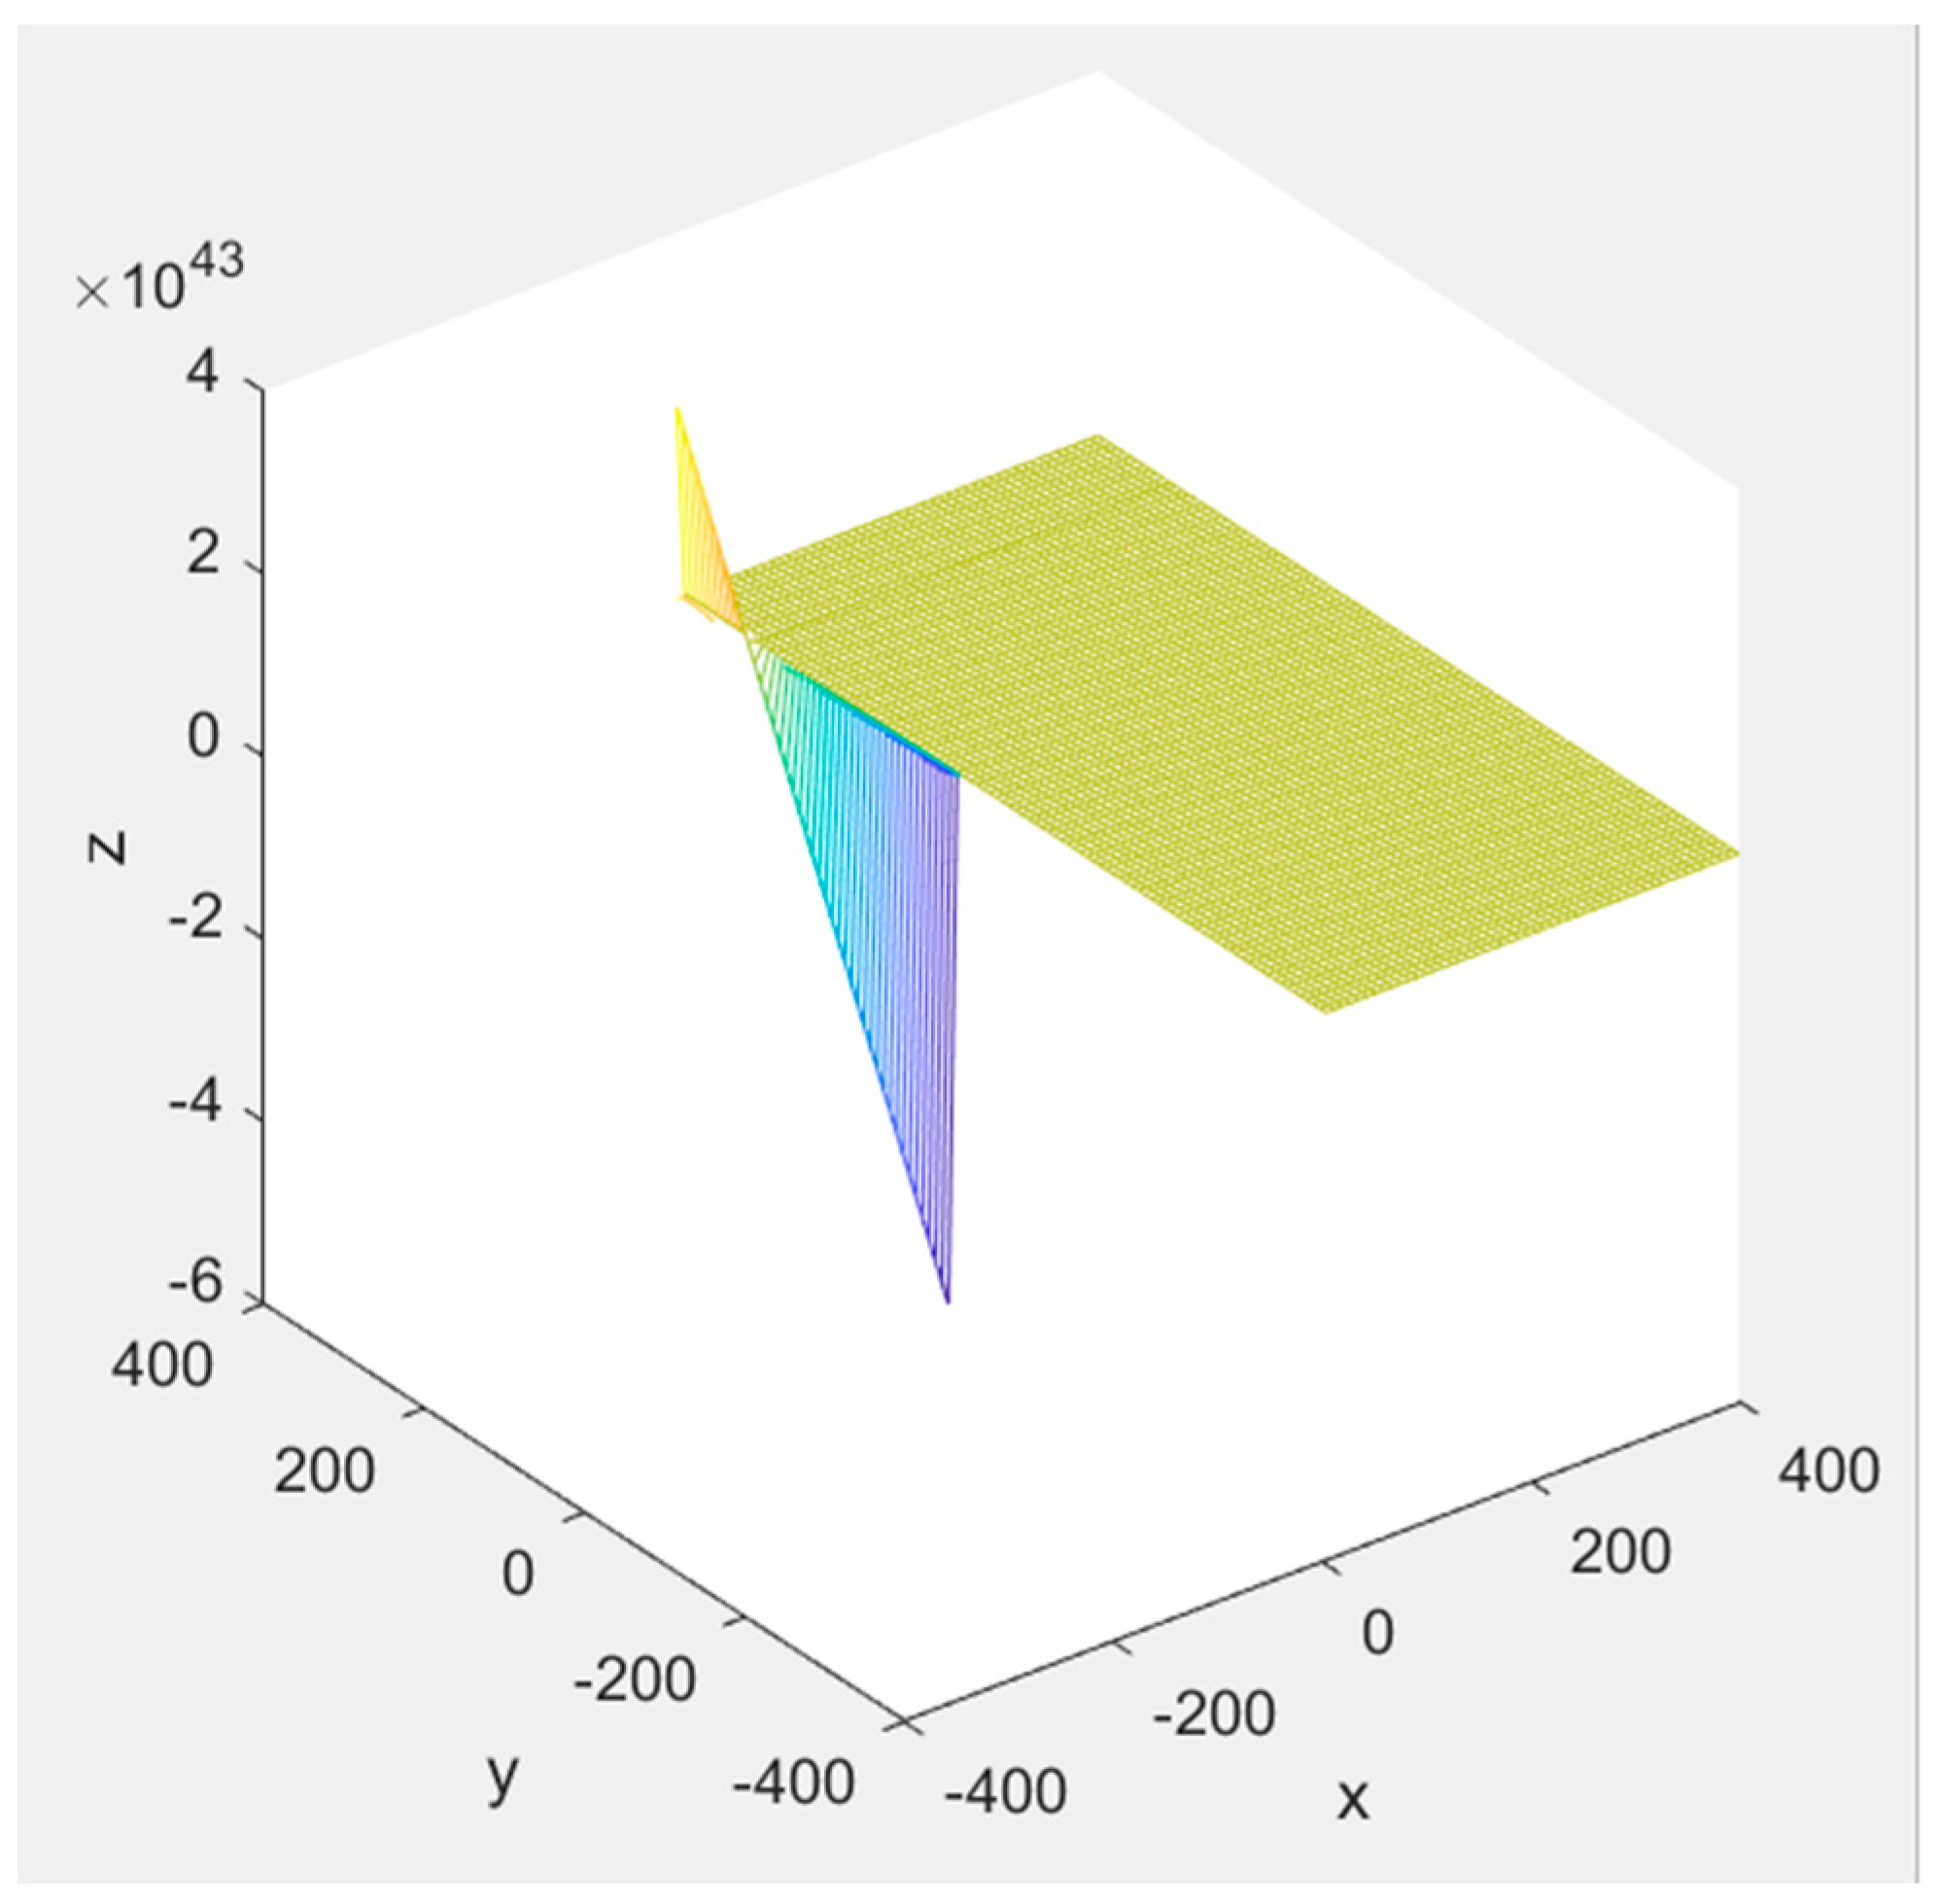
Simulating the above equation (7) in order to determine the inrush current of fast electric chargers of electrical vehicles in a re-synchronization electric power microgrid has
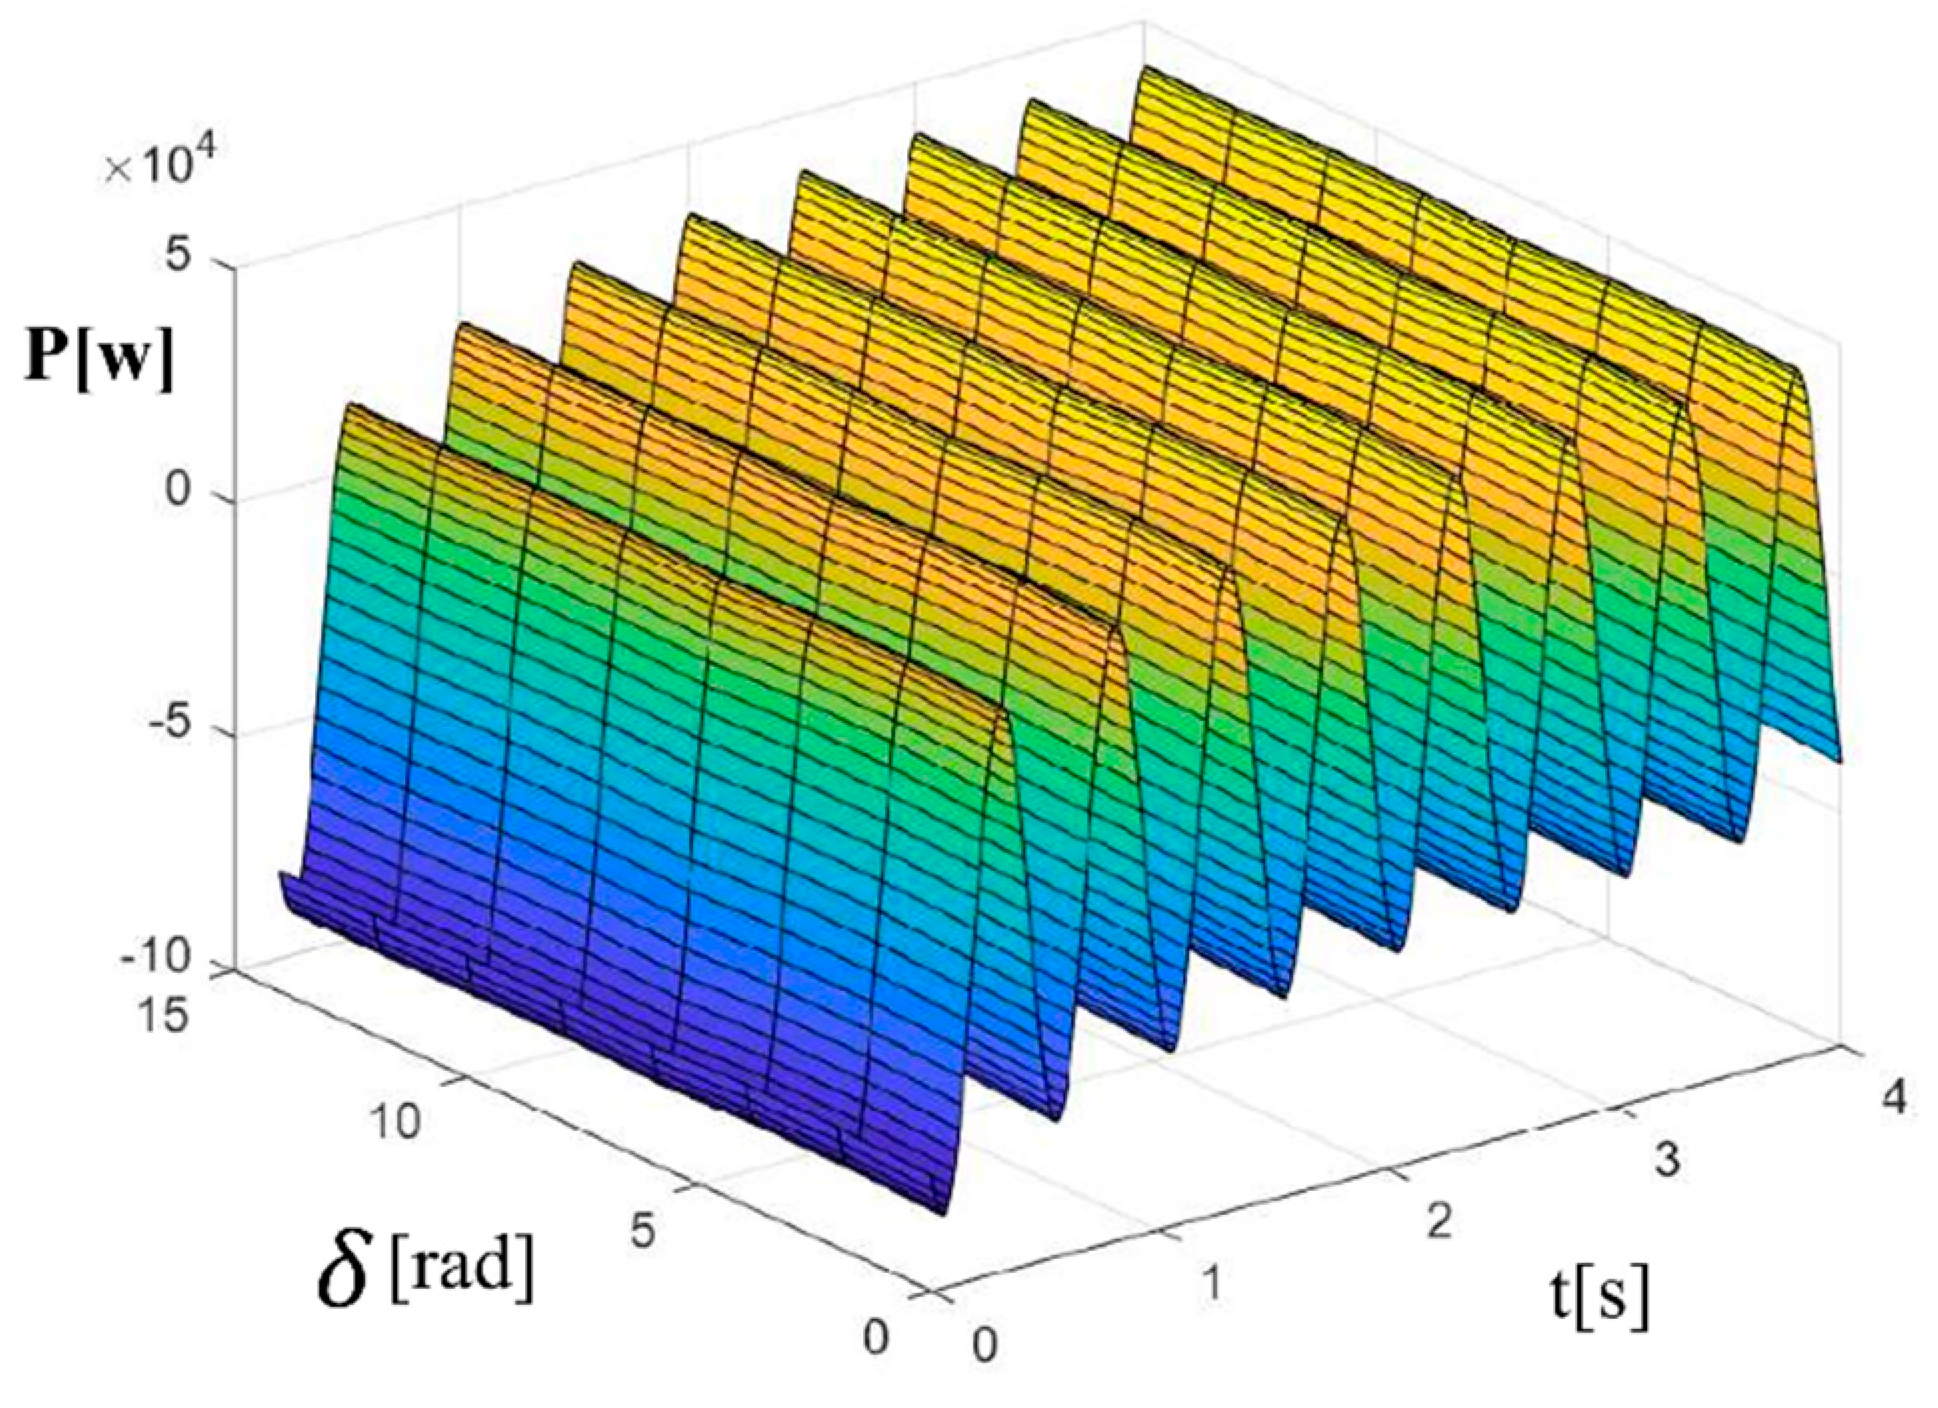
Figure 5 as a result.
Viewing the chart in
Figure 5, which describes the variation of the power value regarding the transitional imposed by the inrush current, it is noted that there is a discrepancy over time at a specific value of the delta angle verified in the simulation with the value of
= 0, meaning that in each value
in resynchronization, a value is added to the power proportional to the input current variation in the rapid initialization of the electric charger. Taking as the random value of the angle and
= 0 the graph in
Figure 6 demonstrates the added input current described by the power of the VSG system with fast electric charger initialization for battery-electric vehicle.
3. Enhanced mechanism of Droop control through virtual impedance.
3.1. Virtual impedance operation principle.
The primary objective of power control of an electricity micrograph deals with controlling the inverter output energy to meet the nominal power supply capacity of the system. Considering practical situations, the impedance of the line has a very narrow relationship with the way, length etc. However, due to the inefficiency of the measurement, it compromises the control of electricity in new power microgrids models; Therefore, the method of energy control analysis with virtual impedance implementation was introduced as the virtual impedance loop acted by liquidating the dissociation of electricity in the energy control loop. The virtual impedance demonstrates the characteristic of imitating the impedance of the microgrid, additionally implanting a feedback loop to the current loop and the microgrid voltage loop. The objective of the voltage and current control loop comes down to causing the inverter output voltage to promote an electric power supply with an ideal voltage in the e microgrid [
4].
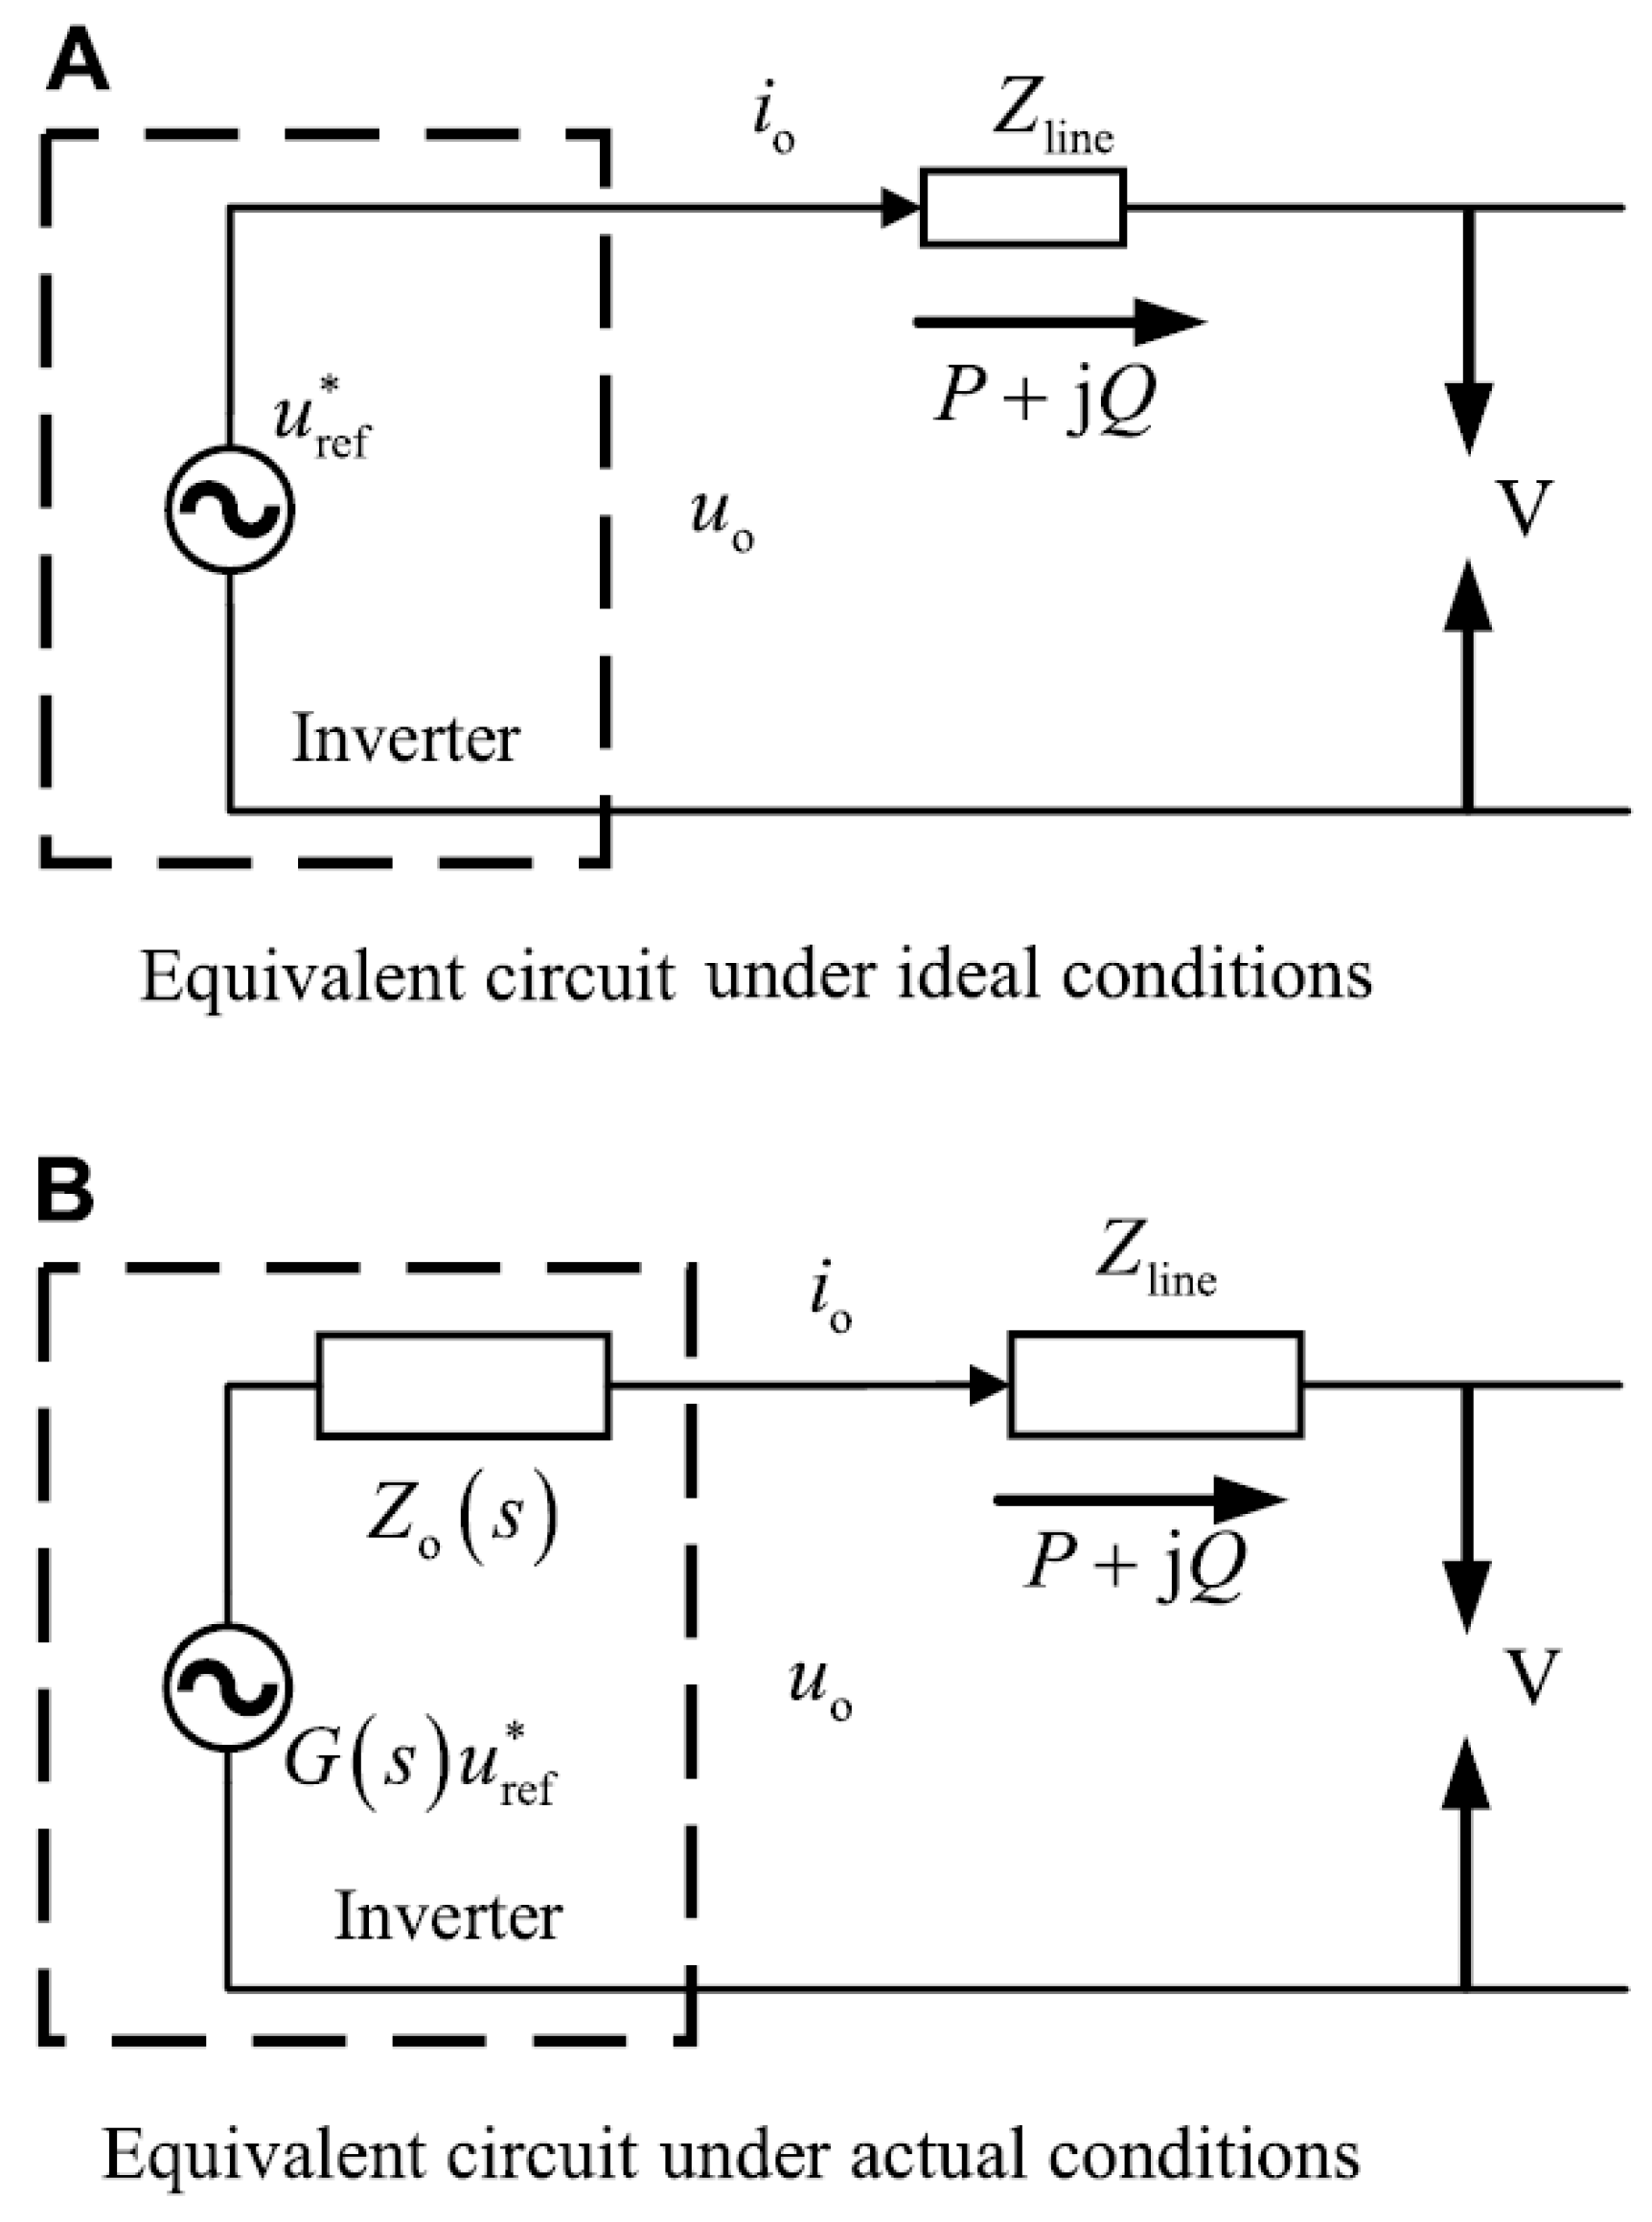
The ideal electrical circuit diagram and real equivalent circuit diagram moments before adding the virtual impedance is represented in
Figure 7.
Figure 7a demonstrates an equivalent electrical circuit diagram under ideal conditions. In general, the equivalent impedance of inverter production changes to G (s) due to the voltage value presented in the double voltage loop link and the effect of the inverter output equivalent should be considered. In
Figure 7b, the value of the inverter output voltage is:
After the implantation of the virtual impedance, the output of the inverter is:
Thus, the total impedance of the inverter performance after the implementation of the virtual impedance is:
The equivalent circuit diagram after adding the virtual impedance is shown in
Figure 7b.
4. Current control Method with Virtual Impedance.
4.1. Control Principle.
The structured current control method with virtual impedance reduces the inverter’s internal electrical potential to reduce the fault current if it occurs, incorporating a virtual impedance into the control loop. The current limiting control algorithm through virtual impedance is described in
Figure 8. Under normal operating conditions, the inverter has an option in VSG control mode. When a fault happens in the power grid, S1 changes to 2 and the virtual impedance is still implemented to limit the current. At the moment the fault happens, the value of the inverter out current changes markedly, which brings broadband signs, while virtual inductance has a certain elevation effect on high frequency harmonics. Thus, the implementation of the bass filter (LPF) to limit high frequency harmonics and improve the resilience capacity to high frequency disorders will also bring the backward protection delay of electric current. In a while the simulation, the LPF cut frequency is 3000 Hz, which can improve the quality of electricity without affecting the control effect of electric current limitation through virtual impedance.
Through the properties of voltage transients, it can be verified that the electric current of VSG-controlled IIDGs includes in its formation a decay component and a periodic electrical component. The amplitude of the component DC relates directly to the moment when the fault, and the impedance of the power line, mitigated by the constant time
, and the peak value of the fault of power outage is essentially related to the component DC. As a result, the limiting control of electric current through the virtual impedance, not only delimits the periodic component of the fault electrical current, but also delimits the decay component [
1].
Increasing the value of the resistive virtual impedance, the decay time of the electrical component changes constant to (12).
And the periodic component of the fault electrical current:
Thus, the decay rate of the electrical component DC can be evidenced by increasing the permissible virtual impedance, thus the amplitude of the periodic electrical component of the fault electrical current may be delimited. In addition to AMIS, VSG control has low sensitivity to line impedance properties, and virtual impedance, even having greater virtual resistance, can still keep the electrical system stable according to the transient stability conditions of the electric power systems. Thus, the limitation of electric current through the virtual impedance disregards the power coupling of the VSG control.
Moreover, as the electrical system connected to the grid becomes usually distorted by divergent fault electrical current levels, the virtual impedance needs to be adaptedly sized according to the amplitude of the grid voltage drop, as described in (14) and (15). When the inverter output voltage value runs into greater than 0.9
, the current inverter operating under normal conditions. When the output voltage value is reduced to a value below 0.5
, the virtual impedance is a maximum value to ensure the system stability and deepen the inverter's electricity transfer capacity. When the voltage value is reduced to a value below 0.9
and greater than 0.5
, the virtual impedance debuts to be selected adaptively, according to the amplitude of the inverter output voltage drop.
and
represent virtual reactance and virtual resistance coefficient, in this order. To settle the decay time constant from the electrical component DC of the fault electrical current,
and
determine (16).
Moreover, to further boost the decay of the DC electrical component, the beginning value of virtual resistance is twice worth the steady-state value and gradually decreases with the time constant T, and the virtual reactance gradually increases from zero to the steady-state value according to the time constant T, as described in (14) and (15). At the moment the time constant has a very small value, it is very likely that the high line resistance can be refurbished to low line resistance instantly, a procedure that can have a major impact on the performance of the electricity microgrid. Thus, the time constant T cannot have a very small value, in this interim, cannot influence the inverter operation during the fault of steady-state. At this time, T has twice the value of the line frequency period.
The fault electrical current is delimited by the control of electric current limit by adding a virtual impedance. To establish the stable operation of the electrical microgrid and the electric power transmission capacity, the value of the virtual impedance has higher delimitation. Thus, in the case of a deep voltage drop value and a high value of inrush current, the method of delimitation of electric current on virtual impedance has difficulty restricting the electric current of inrush.
5. Fundamental aspects of particle swarm optimization.
Given the analysis of the non-linear stochastic model developed by Heppner and Grenander to graduate the transposition of species that move into groups, an attempt to identify a computational model that discusses, through a simulation, the behavioral performance of Bands of poultry and shoals of fish, Kennedy and Eberhart implemented the PSO in 1995 as a metaheuristic method. In this way Kennedy and Eberhart concluded that the social procedural conduct model also serves as a convenient intensifier with some interchalation in their research. They realized how these species endeavored to reach their ideal austerity target, which resembles an ideal solution for any mathematical improvement problem. The preceding version of PSO has been planned to develop only non-linear continuous improvement problems.
By assimilating only two equations in the model, the PSO exhibits sensational simplicity, which highlights one of its most stunning properties. In the PSO, the coordinates of each particle impose a possible similar solution to two vectors, the position (XI) and the velocity vectors (VI). In the N-Dimensional Research Space, xi = [xi1, xi2,… xiN] and vi = [vi1, vi2,… viN] portray the two similar vectors to each particle i. In this half-time in the feasible solution space to examine the points where ideal solutions persevere, a swarm defines itself as a particle chain "or candidates for the solution." In their screening, particles corelate in a certain severity to evolve their definite research experience. In each iteration verified, the particle with the main elucidation shares its attributed information from position coordinates (GBEST) with the remaining cluster. Thus, each particle rectifies its coordinates through its vast research experience (PBEST), as well as (GBEST), founded on the following equations [
5].
Where:
- c1 and c2 symbolize two constants of positive impulse, they accommodate the balance related to the individual and social behavior of the particle when stipulated to be equal.
- r1 and r2 symbolize two numbers randomly created with an interval of [0,1] entered into the model to consent the stochastic nature of particle displacement.
- is the primordial position of particle that due to your own experience; .
- is the primordial position of particle due to the overall experience of the swarm; .
- k is the iteration index.
Equations (17) and (18) describe the equations of the original PSO model implemented in 1995. Between the model, this model described tiny convergence resources and sometimes additional predisposition evaluations were needed to find an ideal solution.
5.1. PSO algorithm with MATLAB code
PSO algorithm process
Step 1: Input the system parameters.
Load the cycle data into the program (DGs, Inverters and load information).
Input the frequency variation 𝚫f, voltage errors 𝚫V and Power errors (𝚫P, 𝚫Q).
Set the control limits for the frequency and voltage constraints based on Power errors (𝚫P, 𝚫Q).
Set other PSO parameters: swarm size, iterations, upper/lower bounds of control variables, C1/C2, r1/r2, initial velocity (v), and inertia weight (w).
Step 2: Initialization
An initial population, cluster size, parameters, … are generally created.
Begin (swarm initialization, n = 0)]
Generate initial position Xi0, velocity Vi0.
Evaluate objective function the each particle in the initial population.
Step 3: Set iterations
Update inertia weight:
Step 4: update velocity of particles
Update Velocity of each particle [
6]:
Step 5: Update position of particles.
Update Position of each particle:
Step 6: Update Individual best (Pbest).
Evaluate fitness function of each particle and updates as local best (Pbest).
Step 7: Update global best (Gbest).
Evaluate minimum value among the Pbest and update as global best.
Step 8: If Iteration ≥ maximum iterations.
(Go to Step 9, else to Step 3).
Step 9: Optimized output Results: Gbest.
Step 10: End.
_______________________________________________
5.2. Virtual Impedance structure design
The virtual impedance operational performance procedure algorithm is demonstrated in
Figure 4. This procedure is performed by specifying the properties of virtual impedances that are implemented in the electricity converter controllers. Control with specified points for voltage value adjustment are unprecedented. In the next step, a positive interval is still defined for virtual resistance and inductance. Equal intervals are evidenced to allow the objective function to perform optimization. The maximum values are calculated through the characteristics of maximum impact incompatibilities. The optimization promoted by particle swarm (PSO) proves to be an exceptional stochastic tool to settle the optimization problem, proving the descriptive characteristic of its application to the problems of the electricity system. High convergence capacity, global research with enhancement, relative simplicity of adjustment parameters and the highest accuracy found of the solution instructed the research to apply the PSO algorithm [
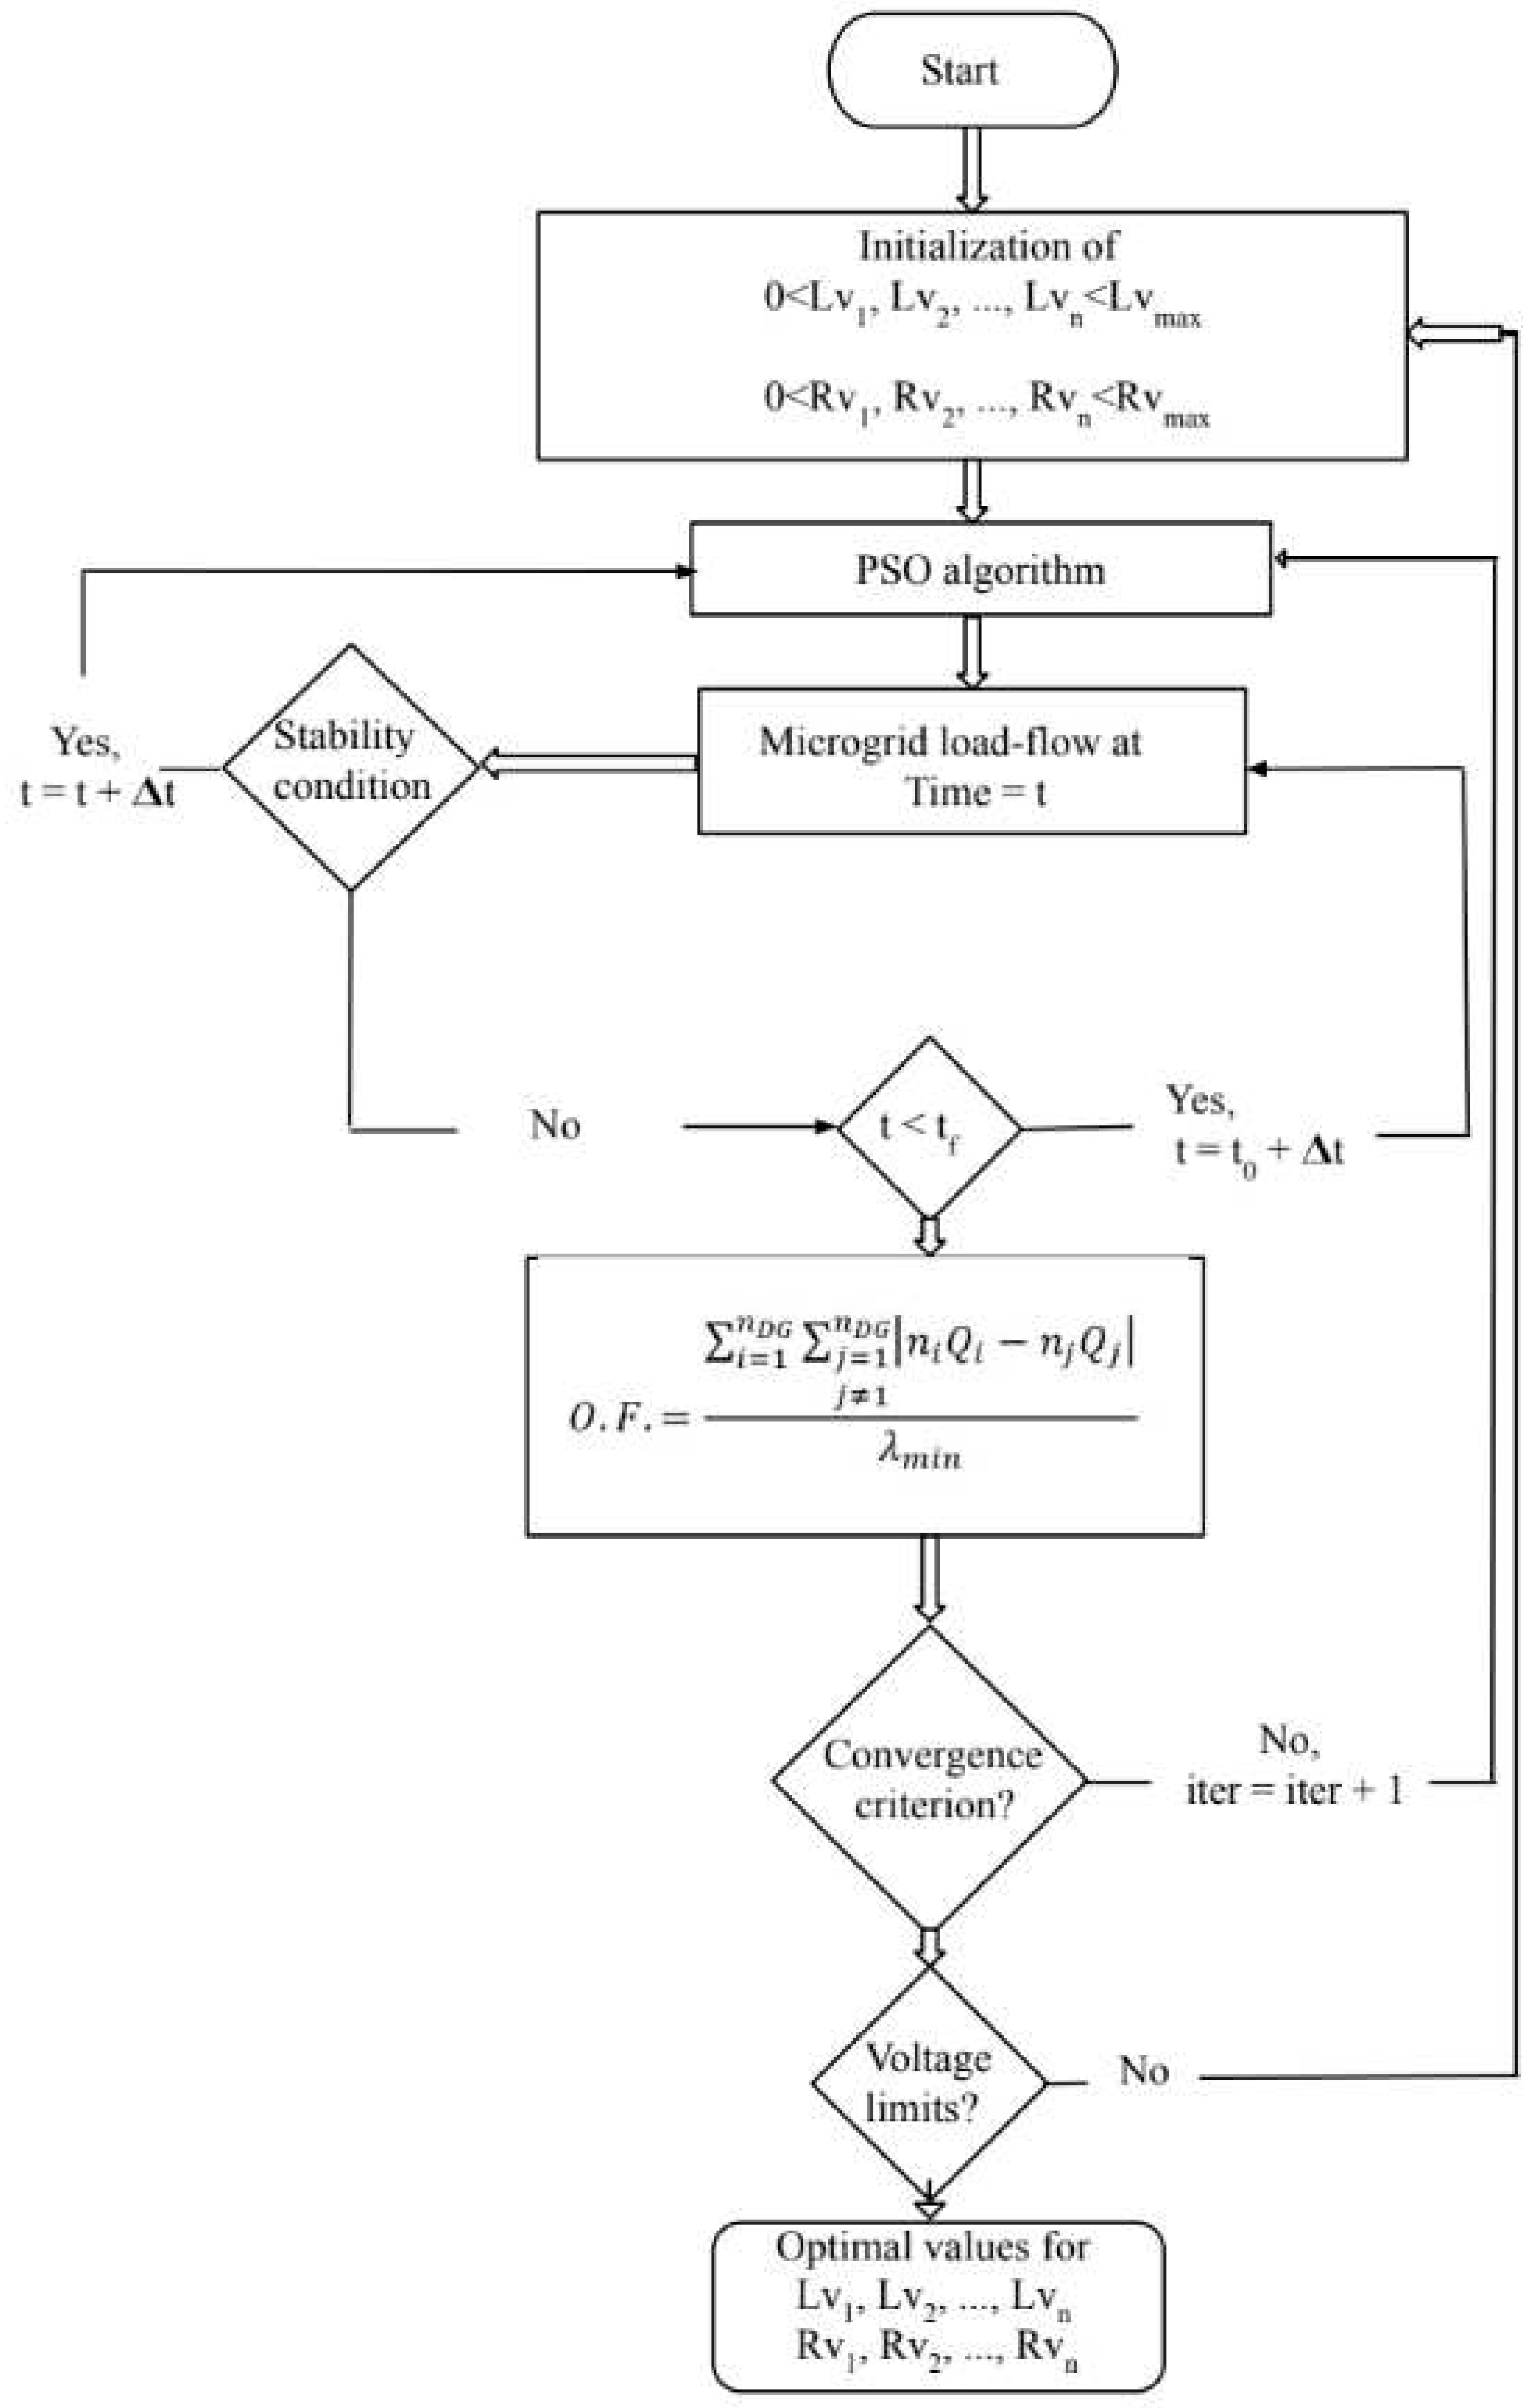
7]. The initial population is a virtual resistance and inductances. The PSO algorithm visualized on any iteration requires the small signal analysis, thus confirming the stability of the microgrid power system and the load flow to determine the stability index of the microgrid, the electrical currents injected into the system and, consequently, the objective function. The operating flowchart used for the virtual impedance project is described in
Figure 9. After the application operation of the algorithm presented in
Figure 9, ideal inductances and resistances are sized and applied to the electricity converter control system.
6. Simulation results
6.1. Parameters of the experimental system
Table 1.
Parameters of the experimental system.
Table 1.
Parameters of the experimental system.
| Parameters |
Values |
| Nominal frequency |
50 Hz |
| V* |
310 V |
| Lf |
4 mH |
| Rf |
ohm |
6.2. Parameters of the controller
Table 2.
Parameters of the controller.
Table 2.
Parameters of the controller.
| Parameters |
Values |
| Dp |
12.665 |
| Fc(carrier frequency) |
6.4 kHz |
| KL/KR |
0.00315/0.0065 |
| Dq |
160.7061 |
Note: the PSO method determines the optimized value of the virtual impedance through the minimum value of the functional expression, as shown in the
Figure 10.
The PSO algorithm planned with the flowchart of
Figure 9 presents the expected result determined the virtual impedance and maintaining the electricity system in its normal operating conditions.
7. Conclusion
In this scientific research described in the article, the study conducted in the case of the operating phenomenon of VSG re-synchronization in the electric power microgrid can verify in the results obtained with the simulation, the limits on stability where, in addition, the system describes a First-Swing Instability, from serious faults and imposing significant anomalies on electrical systems. The transient stability criterion analyzed in this research provides engineers to judge whether the electrical system may return to the stable operating state after the extinction of faults. Thus, the operating mechanism of re-synchronization of VSGs is subject to succinct quantitative analyzes and, analogously, the interventions of different impassive parameters become relevant, which was found with the study of the initialization of the fast charger of electric vehicles in an electric power microgrid with VSG in re-synchronization process after an anomaly in the system. The fast-charger battery-electric vehicle inrush current has a negative impact seen in the study, even on a re-synchronization system, impacting the performance on conversion and electric distribution systems.
Dimensioned virtual impedances are implemented in all electrical energy converters. When applying the electricity converter control system methodology on microgrid, a levelling scenario is implemented in the microgrid. The voltage value, as well as the frequencies of microgrid are maintained within the standard operational limits, the stability index of microgrid is optimized and the reactive energy is minimized. Moreover, the transient behavior of current electrical components and active power is optimized.
In this research, an adaptive operational method of virtual impedance control is evidenced based on the perfected method of particle swarm optimization. The structural mechanism, according to the results obtained from different scenarios, besides providing efficient evolutionary capacity, also demonstrates the ability to efficiently work under different operating conditions.
The electrical system receives the ideal optimized distribution of active and reactive energy, establishing the impedance of the distributed power generation unit conception line through the adaptable drop method and acting with the monitoring of the optimization unit. Thus, with the implementation of the ideal active and reactive energy management, the reference of the voltage and frequency value with greater accuracy and speed than the implanted methods of conventional drop. For this to proceed, it is analysed considering different operating conditions, including load fluctuations, plug and play and communication infrastructure error.
Conflicts of Interest
The author declares no conflict of interest.
Appendix A
Abbreviations
| DC |
Direct Current |
| DG |
Distributed Generation |
| EP |
Equilibrium Point |
| EV |
Electric Vehicle |
| GA |
Genetic Algorithm |
| LPF |
Low Pass Filter |
| MG |
Microgrid |
| NUEP |
Next Unstable Equilibrium Point |
| O.F. |
Objective Function |
| PI |
Proportional Integral Controller |
| PSO |
Particle Swarm Optimization |
| PWM |
Pulse Width Modulation |
| SG |
Synchronous Generator |
| UEP |
Unstable Equilibrium Point |
| VPA |
Virtual Power Angle |
| VSG |
Virtual Synchronous Generator |
Appendix B
Symbols
|
Dp
|
Active damping coefficient[W/rad2] |
|
Dq
|
Voltage-drooping coefficient [Var/V] |
| ω |
Output angular frequency[rad/s] |
| ω*
|
Reference frequency[rad/s] |
| P |
Active Power [W] |
|
P*
|
Nominal Active Power [W] |
|
P0
|
Initial Active Power [W] |
|
Pe
|
Output Active Power[W] |
|
P′
|
Active Power [W] |
|
Pmax
|
Maximum active power [W] |
| E |
Inverter’s internal voltage [V] |
|
E*
|
Reference Inverter’s internal voltage [V] |
|
E0
|
Initial Inverter’s internal voltage [V] |
| Q |
Reactive Power [Var] |
|
Q*
|
Reference Reactive Power [Var] |
|
Q0
|
Initial Reactive Power [Var] |
|
Te
|
Electromagnetic toque [Nm] |
|
T*
|
Reference Torque [Nm] |
|
T′
|
Torque [Mn] |
| θ |
Angular position of the rotor with respect to a stationary axis in (rad) |
|
Eabc
|
Inverter’s internal voltage [V] |
|
Reference Voltage [V] |
|
ZT
|
Internal Virtual Impedance [Ω] |
|
Iabc
|
Reference Current [A] |
|
Vd
|
d-axis reference Voltage [V] |
|
Vq
|
q-axis Reference Voltage [V] |
|
Nominal q-axis Reference Voltage [V] |
|
ioq
|
q-axis reference current [A] |
|
i0d
|
d-axis reference current [A] |
|
iLq
|
q-axis line current [A] |
|
q-axis line current [A] |
|
Vqref
|
q-axis Reference Voltage [V] |
|
Vdref
|
d-axis reference Voltage [V] |
| J |
Moment of Inertia
|
| 𝛿 |
Virtual Power Angle [rad] |
|
Impedance angle [degree] |
| D |
Damping coefficient |
| t |
Time [seconds] |
| K |
Voltage integral coefficient |
| G |
State matrix |
|
Vg
|
Equivalent RMS voltage of the grid |
| B |
State matrix |
| Z |
Impedance [Ω] |
|
Power angle stable EP |
|
Power angle UEP |
|
Power angle When the fault is cleared |
|
Eloss
|
Damping loss energy |
| B |
State matrix |
| X |
Reactance |
|
Maximum applied voltage[V] |
|
Total impedance under inrush, including system[Ω] |
|
Energization angle[degree] |
|
Time[seconds] |
|
Point at which core saturates |
| Τ |
Time constant of transformer winding under inrush conditions |
|
Function of
|
|
3 phase winding connection coefficient |
|
short-circuit power of network coefficient |
|
Inductance |
|
Virtual inductance |
|
Resistance |
|
Virtual Resistance |
|
Fault current |
|
Voltage |
|
Equivalent impedance |
|
Virtual impedance |
|
Fault angle |
|
Thevenin current |
|
Thevenin voltage |
| Pbest |
Local best |
| Gbest |
Global best |
|
Virtual reactance coefficient |
|
Virtual resistance coefficient |
| 𝚫f |
Frequency variation |
| 𝚫V |
Voltage variation |
| 𝚫P |
Active power variation |
| 𝚫Q |
Reactive power variation |
|
Fc
|
Carrier frequency [kHz] |
|
Lf
|
Inductance |
|
Rf
|
Resistance |
References
- Zhikang Shuai, Transient Characteristics, modelling and Stability Analysis of Microgrid, © Springer Nature Singapore Pte Ltd. 2021.
- H. Xin, L. Huang, L. Zhang, Z. Wang, J. Hu, Synchronous instability mechanism of P-f droopcontrolled voltage source converter caused by current saturation. IEEE Trans. Power Syst. 31, 5206–5207 (2016).I. S. Jacobs and C. P. Bean, “Fine particles, thin films and exchange anisotropy,” in Magnetism, vol. III, G. T. Rado and H. Suhl, Eds. New York: Academic, 1963, pp. 271–350.
- M. Jamali, M. Mirzaie, S. Asghar Gholamian. Calculation and Analysis of Transformer Inrush Current Based on Parameters of Transformer and Operating Conditions // Electronics and Electrical Engineering. – Kaunas: Technologija, 2011. – No. 3(109). – P. 17–20. [CrossRef]
- Su H, Zhang Z and Wang S (2023), Island microgrid power control system based on adaptive virtual impedance. Front. Energy Res. 10:974288. [CrossRef]
- Bijaya Ketan Panigrahi, Ajith Abraham, Swagatam Das; Computational Intelligence in Power Engineering, © 2010 Springer-Verlag Berlin Heidelberg.
- Reza Sepehrzad, Mostafa Khojasteh Rahimi, Ahmed Al-Durra, Mehdi Allahbakhshi, Alireza Moridi, Optimal energy management of distributed generation in micro-grid to control the voltage and frequency based on PSO-adaptive virtual impedance method, Electric Power Systems Research, Volume 208, 2022, 107881, ISSN 0378-7796. Available online: https://www.sciencedirect.com/science/article/pii/S0378779622001110. [CrossRef]
- B. Pournazarian, S. S. Seyedalipour, M. Lehtonen, S. Taheri and E. Pouresmaeil, “Virtual Impedances Optimization to Enhance Microgrid Small-Signal Stability and Reactive Power Sharing,” in IEEE Access, vol. 8, pp. 139691-139705, 2020. [CrossRef]
- C. Shen et al., Re-synchronization capability analysis of virtual synchronous generators in microgrids. 2019 IEEE Energy Conversion Congress and Exposition (ECCE), Baltimore, MD, USA, 2896–2901 (2019).
- P. Kundur, Power System Stability and Control (McGraw-Hill Education, New York, 1994).
- Nima Tashakor, Bita Arabsalmanabadi, Teymoor Ghanbar, Ebrahim Farjah, Stefan Götz, Start-up circuit for an electric vehicle fast charger using SSICL technique and a slow estimator,IET Gener. Transm. Distrib., 2020, Vol. 14 Iss. 12, pp. 2247-2255 © The Institution of Engineering and Technology 2020.
- Z. Shuai, C. Shen, X. Liu, Z. Li, Z.J. Shen, Transient angle stability of virtual synchronous generators using Lyapunov’s direct method. IEEE Trans. Smart Grid 10(4), 4648–4661 (2019). [CrossRef]
- Hassan Farhangi, SMART MICROGRIDS-Lessons from Campus Microgrid Design and Implementation © 2017 by Taylor & Francis Group, LLC.
- Greenwood, Allan; Electrical Transients in power systems, © 1991 by john Wiley & Sons, Inc.
- Hassan Bevrani, Bruno Francois, Toshifumi Ise, Microgrid Dynamics and Control, © 2017 by john Wiley & Sons, Inc.
- Naser Mahdavi Tabatabaei, Ersan Kabalci, Nicu Bizon Editors, Microgrid Architectures, Control and Protection Methods, © Springer.Nature Switzerland AG 2020.
- Neville Watson, Jos Arrillaga, Power Systems Electromagnetic Transients Simulation 2nd Edition, © The Institution of Engineering and Technology 2019.
- Sasi K. Kottayil, Smart Microgrids, © 2021 Taylor & Francis Group, LLC.
- Stephen A. Roosa, Fundamentals of Microgrids, © 2021 Taylor & Francis Group, LLC.
- S.M. Muyeen, Syed Mofizul Islam and Frede Blaabjerg, Variability, Scalability and Stability of Microgrids, © The Institution of Engineering and Technology 2019.
- Ran Wang, Ping Wang, Gaoxi Xiao, Intelligent Microgrid Management and EV Control Under Uncertainties in Smart Grid, © Springer Nature Singapore Pte Ltd. 2018.
- Tiburcio Dos Santos Junior, B. D. Bonatto, C. Ferreira and A. C. Zambroni de Souza, “Impact of Harmonic Distortion on the Energization of Energy Distribution Transformers Integrated in Virtual Power Plants,” 2018 15th International Conference on Control, Automation, Robotics and Vision (ICARCV), 2018, pp. 1252-1256. [CrossRef]
- T. dos Santos Junior, “Verification of Inrush currents from electromagnetic transients influencing the stability of voltage in Smart Microgrids connected to systems with electric vehicles,” 2022 17th International Conference on Control, Automation, Robotics and Vision (ICARCV), Singapore, Singapore, 2022, pp. 961-965. [CrossRef]
|
Disclaimer/Publisher’s Note: The statements, opinions and data contained in all publications are solely those of the individual author(s) and contributor(s) and not of MDPI and/or the editor(s). MDPI and/or the editor(s) disclaim responsibility for any injury to people or property resulting from any ideas, methods, instructions or products referred to in the content. |
© 2023 by the author. Licensee MDPI, Basel, Switzerland. This article is an open access article distributed under the terms and conditions of the Creative Commons Attribution (CC BY) license (https://creativecommons.org/licenses/by/4.0/).
