Submitted:
28 November 2023
Posted:
29 November 2023
You are already at the latest version
Abstract
Keywords:
1. Introduction
2. Materials and Methods
2.1. Materials
2.1.1. Pre-Treatment of apple pomace and biocomposite production
2.2. Mechanical Properties
2.4. Water Contact Angle
2.3. Colour Analysis
2.4. Scanning Electron Microscope (SEM)
2.5. Thermogravimetry Analysis (TGA) and Derivative Differential Thermal Analysis (DTA)
2.6. FTIR infrared spectrum analysis
3. Statistical Analysis
3. Results
3.1. Bending strength and Young’s modulus
3.3. Water Contact Angle
3.4. Colour Analysis
3.5. Scanning Electron Microscope (SEM)
3.6. Thermogravimetry Analysis (TGA) and Derivative Differential Thermal Analysis (DTA)
3.7. FTIR infrared spectrum analysis
4. Conclusion
Author Contributions
Funding
Informed Consent Statement
Data Availability Statement
Conflicts of Interest
References
- Asgher, M.; Qamar, S. A.; Bilal, M.; Iqbal, H. M. Bio-based active food packaging materials: Sustainable alternative to conventional petrochemical-based packaging materials. Food Research International 2020, 137, 109625. [Google Scholar] [CrossRef] [PubMed]
- Yaradoddi, J. S.; Banapurmath, N. R.; Ganachari, S. V.; Soudagar, M. E. M.; Mubarak, N. M. , Hallad, S., S, Hugar.; Fayaz, H. (Biodegradable carboxymethyl cellulose based material for sustainable packaging application. Scientific reports 2020, 10, 21960. [Google Scholar] [CrossRef] [PubMed]
- Loureiro, N. C.; Esteves, J. L. Green composites in automotive interior parts: A solution using cellulosic fibers. In Green composites for automotive applications. 2019 (pp. 81-97). Woodhead Publishing.
- Moreno, A. G.; Guzman-Puyol, S.; Domínguez, E.; Benítez, J. J.; Segado, P.; Lauciello, S.; Ceseracciu, L.; Porras-Vázquez, J.M. ; Leon-Reina, L,; Heredia, A.; Heredia-Guerrero, J. A. Pectin-cellulose nanocrystal biocomposites: Tuning of physical properties and biodegradability. International Journal of Biological Macromolecules 2021, 180, 709-717.
- Dhillon, G. S.; Kaur, S.; Brar, S. K. Perspective of apple processing wastes as low-cost substrates for bioproduction of high value products: A review. Renewable and sustainable energy reviews 2013, 27, 789–805. [Google Scholar] [CrossRef]
- Gowman, A. C.; Picard, M. C.; Lim, L. T.; Misra, M.; Mohanty, A. K. Fruit waste valorization for biodegradable biocomposite applications: A review. BioResources 2019, 14, 10047–10092. [Google Scholar] [CrossRef]
- Perussello, C.A.; Zhang, Z.; Marzocchella, A.; Tiwari, B.K. Valorization of Apple Pomace by Extraction of Valuable Compounds. Compr. Rev. Food Sci. Food Saf. 2017, 16, 776–796. [Google Scholar] [CrossRef]
- Nawirska, A.; Kwaśniewska, M. Dietary fibre fractions from fruit and vegetable processing waste. Food Chem. 2005, 91, 221–225. [Google Scholar] [CrossRef]
- Bhushan, S. , Gupta, M. (). Apple pomace: source of dietary fibre and antioxidant for food fortification. In Handbook of Food Fortification and Health 2013, (pp. 21-27). Humana Press, New York, NY.
- Hejft, R.; Obidziński, S.; Jałbrzykowski, M.; Markowski, J. Production of heating pellets with apple pomace content. Journal of Research and Applications in Agricultural Engineering 2016, 61, 29–34. [Google Scholar]
- Chojnacki, J.; Zdanowicz, A.; Ondruška, J.; Šooš, Ľ.; Smuga-Kogut, M. The Influence of apple, carrot and red beet pomace content on the properties of pellet from barley straw. Energies, 2021, 14(2), 405.
- Jiang, J.; Huang, Y.; Liu, X.; Huang, H. The effects of apple pomace, bentonite and calcium superphosphate on swine manure aerobic composting. Waste management 2014, 34, 1595–1602. [Google Scholar] [CrossRef] [PubMed]
- Lyu, F.; Luiz, S. F.; Azeredo, D. R. P.; Cruz, A. G.; Ajlouni, S.; Ranadheera, C. S. Apple pomace as a functional and healthy ingredient in food products: A review. Processes 2020, 8, 319. [Google Scholar] [CrossRef]
- Choudhury, A. G.; Roy, P.; Kumari, S.; Singh, V. K. Utility of Fruit-Based Industry Waste. In Handbook of Solid Waste Management: Sustainability through Circular Economy 2022 (pp. 757-784). Singapore: Springer Nature Singapore.
- Bhargava, N.; Sharanagat, V. S.; Mor, R. S.; Kumar, K. Active and intelligent biodegradable packaging films using food and food waste-derived bioactive compounds: A review. Trends in Food Science & Technology 2020, 105, 385-401.
- Riaz, A.; Lei, S.; Akhtar, H. M. S.; Wan, P.; Chen, D.; Jabbar, S.; Abid, M.; Hashim, M.M.; Zeng, X. Preparation and characterization of chitosan-based antimicrobial active food packaging film incorporated with apple peel polyphenols. International journal of biological macromolecules 2018, 114, 547–555. [Google Scholar] [CrossRef]
- Zdybel, E.; Tomaszewska-Ciosk, E.; Gertchen, M.; Drożdż, W. Selected properties of biodegradable material produced from thermoplastic starch with by-products of food industry addition. Polish Journal of Chemical Technology 2017, 19, 51–55. [Google Scholar] [CrossRef]
- Jiang, Y.; Simonsen, J.; Zhao, Y. Compression-molded biocomposite boards from red and white wine grape pomaces. J. Appl. Polym. Sci. 2011, 119, 2834–2846. [Google Scholar] [CrossRef]
- Gaikwad, K. K.; Lee, J. Y.; Lee, Y. S. Development of polyvinyl alcohol and apple pomace bio-composite film with antioxidant properties for active food packaging application. Journal of food science and technology 2016, 53, 1608–1619. [Google Scholar] [CrossRef] [PubMed]
- Wojdalski, J.; Grochowicz, J.; Ekielski, A.; Radecka, K.; Stępniak, S.; Orłowski, A.; Florczak, I. ; Drożdż,B.; Żelaziński,T.; Kosmala, G. Production and Properties of Apple Pomace Pellets and their Suitability for Energy Generation Purposes. Annual Set The Environment Protection Rocznik Ochrona Środowiska 2016, 18(1), 89-111.
- Gouw, V. P. (). Investigation of Bioactive Compounds in Different Types of Fruit Pomace and Their Applications as Bulk Materials for Creating Biocomposite. Master of Science thesis of Virginia, presented on March 2016, 11, 2016. [Google Scholar]
- Picard, M. C.; Rodriguez-Uribe, A.; Thimmanagari, M.; Misra, M.; Mohanty, A. K. Sustainable biocomposites from poly (butylene succinate) and apple pomace: A study on compatibilization performance. Waste and biomass valorization 2020, 11, 3775–3787. [Google Scholar] [CrossRef]
- Gouw, V. P.; Jung, J.; Simonsen, J.; Zhao, Y. Fruit pomace as a source of alternative fibers and cellulose nanofiber as reinforcement agent to create molded pulp packaging boards. Composites Part A: Applied Science and Manufacturing 2017, 99, 48–57. 99.
- Park, J. Y.; Salmeron, M. Fundamental aspects of energy dissipation in friction. Chemical reviews 2014, 114, 677–711. [Google Scholar] [CrossRef] [PubMed]
- Schmid, V.; Trabert, A.; Schäfer, J.; Bunzel, M.; Karbstein, H. P.; Emin, M. A. Modification of apple pomace by extrusion processing: Studies on the composition, polymer structures, and functional properties. Foods 2020, 9, 1385. [Google Scholar] [CrossRef] [PubMed]
- Choudhary, P.; Suriyamoorthy, P.; Moses, J. A.; Anandharamakrishnan, C. Bio-composites from food wastes. Composites for Environmental Engineering 2019, 319–345. [Google Scholar]
- Vanier, N. L.; Vamadevan, V.; Bruni, G. P.; Ferreira, C. D.; Pinto, V. Z.; Seetharaman, K.; Zavareze, E.D.; Elias, M.C.; Berrios, J. D. J. (). Extrusion of rice, bean and corn starches: Extrudate structure and molecular changes in amylose and amylopectin. Journal of Food Science 2016, 81, E2932–E2938. [Google Scholar] [CrossRef]
- Gustafsson, J.; Landberg, M.; Bátori, V.; Åkesson, D.; Taherzadeh, M.J.; Zamani, A. Development of Bio-Based Films and 3D Objects from Apple Pomace. Polymers 2019, 11, 289. [Google Scholar] [CrossRef]
- PN-EN ISO 178:2019-06; Plastics—Determination of Bending Properties. Polish Committee for Standardization: Warsaw, Poland, 2019.
- Gonzalez-Tomás, L.; Coll-Marqués, J.; Costell, E. Viscoelasticity of inulin–starch-based dairy systems. Influence of inulin average chain length. Food Hydrocolloids 2008, 22, 1372–1380. [Google Scholar] [CrossRef]
- Jia, T.; Zeng, J.; Gao, H.; Jiang, J.; Zhao, J.; Su, T.; Sun, J. Effect of pectin on properties of potato starch after dry heat treatment. Tropical Journal of Pharmaceutical Research 2019, 18. [Google Scholar] [CrossRef]
- Shpigelman, A.; Kyomugasho, C.; Christiaens, S.; Van Loey, A. M.; Hendrickx, M. E. Thermal and high pressure high temperature processes result in distinctly different pectin non-enzymatic conversions. Food Hydrocolloids 2014, 39, 251–263. [Google Scholar] [CrossRef]
- Su, J.F.; Huang, Z.; Yuan, X.Y.; Wang, X.Y.; Li, M. Structure and properties of carboxymethyl cellulose/soy protein isolate blend edible films crosslinked by Maillard reactions. Carbohydr. Polym. 2010, 79, 145–153. [Google Scholar] [CrossRef]
- Rahman, A.; Fehrenbach, J.; Ulven, C.; Simsek, S.; Hossain, K. Utilization of wheat-bran cellulosic fibers as reinforcement in bio-based polypropylene composite. Industrial Crops and Products 2021, 172, 114028. [Google Scholar] [CrossRef]
- Grylewicz, A.; Spychaj, T.; Zdanowicz, M. Thermoplastic starch/wood biocomposites processed with deep eutectic solvents. Compos. Part A Appl. Sci. Manuf. 2019, 121, 517–524. [Google Scholar] [CrossRef]
- Bastos, D. C.; Santos, A. E.; da Silva, M. L.; Simão, R. A. Hydrophobic corn starch thermoplastic films produced by plasma treatment. Ultramicroscopy 2009, 109, 1089–1093. [Google Scholar] [CrossRef] [PubMed]
- Andrade, C. T.; Simão, R. A.; Thiré, R. M.; Achete, C. A. Surface modification of maize starch films by low-pressure glow 1-butene plasma. Carbohydrate polymers 2005, 61, 407–413. [Google Scholar] [CrossRef]
- Wang, X.; Pan, Y.; Yuan, H.; Su, M.; Shao, C.; Liu, C.; Guo, Z.; Shen, C.; Liu, X. Simple fabrication of superhydrophobic PLA with honeycomb-like structures for high-efficiency oil-water separation. Chin. Chem. Lett. 2020, 31, 365–368. [Google Scholar] [CrossRef]
- Ortega-Toro, R.; López-Córdoba, A.; Avalos-Belmontes, F. Epoxidised sesame oil as a biobased coupling agent and plasticiser in polylactic acid/thermoplastic yam starch blends. Heliyon 2021, 7. [Google Scholar] [CrossRef]
- Lopez, O.; Garcia, M. A.; Villar, M. A.; Gentili, A.; Rodriguez, M. S.; Albertengo, L. (). Thermo-compression of biodegradable thermoplastic corn starch films containing chitin and chitosan. LWT-Food Science and Technology 2014, 57, 106–115. [Google Scholar] [CrossRef]
- Liu, Y.; Chao, C.; Yu, J.; Wang, S.; Wang, S.; Copeland, L. New insights into starch gelatinization by high pressure: Comparison with heat-gelatinization. Food Chemistry 2020, 126493. [Google Scholar] [CrossRef]
- Nguyen, D. M.; Diep, T. M. H.; da Silva, Y. F.; Vu, T. N.; Hoang, D.; Thuc, C. N. H.; Bui, Q.B.; Perré, P. Three-dimensional pore characterization of poly (lactic) acid/bamboo biodegradable panels. International Journal of Biological Macromolecules 2022, 221, 16–24. [Google Scholar] [CrossRef] [PubMed]
- Mohd Basri, M. S.; Abdul Karim Shah, N. N.; Sulaiman, A.; Mohamed Amin Tawakkal, I. S.; Mohd Nor, M. Z.; Ariffin, S. H.; Abdul Ghani, N.H. , Mohd Salleh, F. S. Progress in the valorization of fruit and vegetable wastes: Active packaging, biocomposites, by-products, and innovative technologies used for bioactive compound extraction. Polymers 2021, 13, 3503. [Google Scholar] [CrossRef]
- Mofokeng, J.P.; Luyt, A.S.; Tábi, T.; Kovács, J. Comparison of injection moulded, natural fibre-reinforced composites with PP and PLA as matrices. J. Thermoplast. Compos. Mater. 2012, 25, 927–948. [Google Scholar] [CrossRef]
- Muthuraj, R.; Misra, M.; Mohanty, A.K. Biodegradable biocomposites from poly (butylene adipate-co-terephthalate) and miscanthus: Preparation, compatibilization, and performance evaluation. J. Appl. Polym. Sci. 2017, 134, 45448. [Google Scholar] [CrossRef]
- Kamdem, D.P.; Shen, Z.; Nabinejad, O.; Shu, Z. Development of biodegradable composite chitosan-based films incorporated with xylan and carvacrol for food packaging application. Food Packag. Shelf Life 2019, 21, 100344. [Google Scholar] [CrossRef]
- Lin, Z.; Renneckar, S.; Hindman, D.P. Nanocomposite-based lignocellulosic fibers 1. Thermal stability of modified fibers with clay-polyelectrolyte multilayers. Cellulose 2007, 15, 333.
- Yang, H.; Yan, R.; Chen, H.; Lee, D.H.; Zheng, C. Characteristics of hemicellulose, cellulose and lignin pyrolysis. Fuel 2007, 86, 1781–1788. [Google Scholar] [CrossRef]
- Ekielski, A. , Żelaziński, T., Mishra, P. K., Skudlarski, J. Properties of biocomposites produced with thermoplastic starch and digestate: Physicochemical and mechanical characteristics. Materials 2021, 14(20), 6092.
- Eleutério, T.; Sério, S.; Teodoro, O. M.; Bundaleski, N.; Vasconcelos, H. C. XPS and FTIR studies of DC reactive magnetron sputtered TiO2 thin films on natural based-cellulose fibers. Coatings 2020, 10, 287. [Google Scholar] [CrossRef]
- Fardioui, M.; Mekhzoum, M. E. M.; Bouhfid, R. (). Photoluminescent biocomposite films of chitosan based on styrylbenzothiazolium-g-cellulose nanocrystal for anti-counterfeiting applications. International Journal of Biological Macromolecules 2021, 184, 981-989.
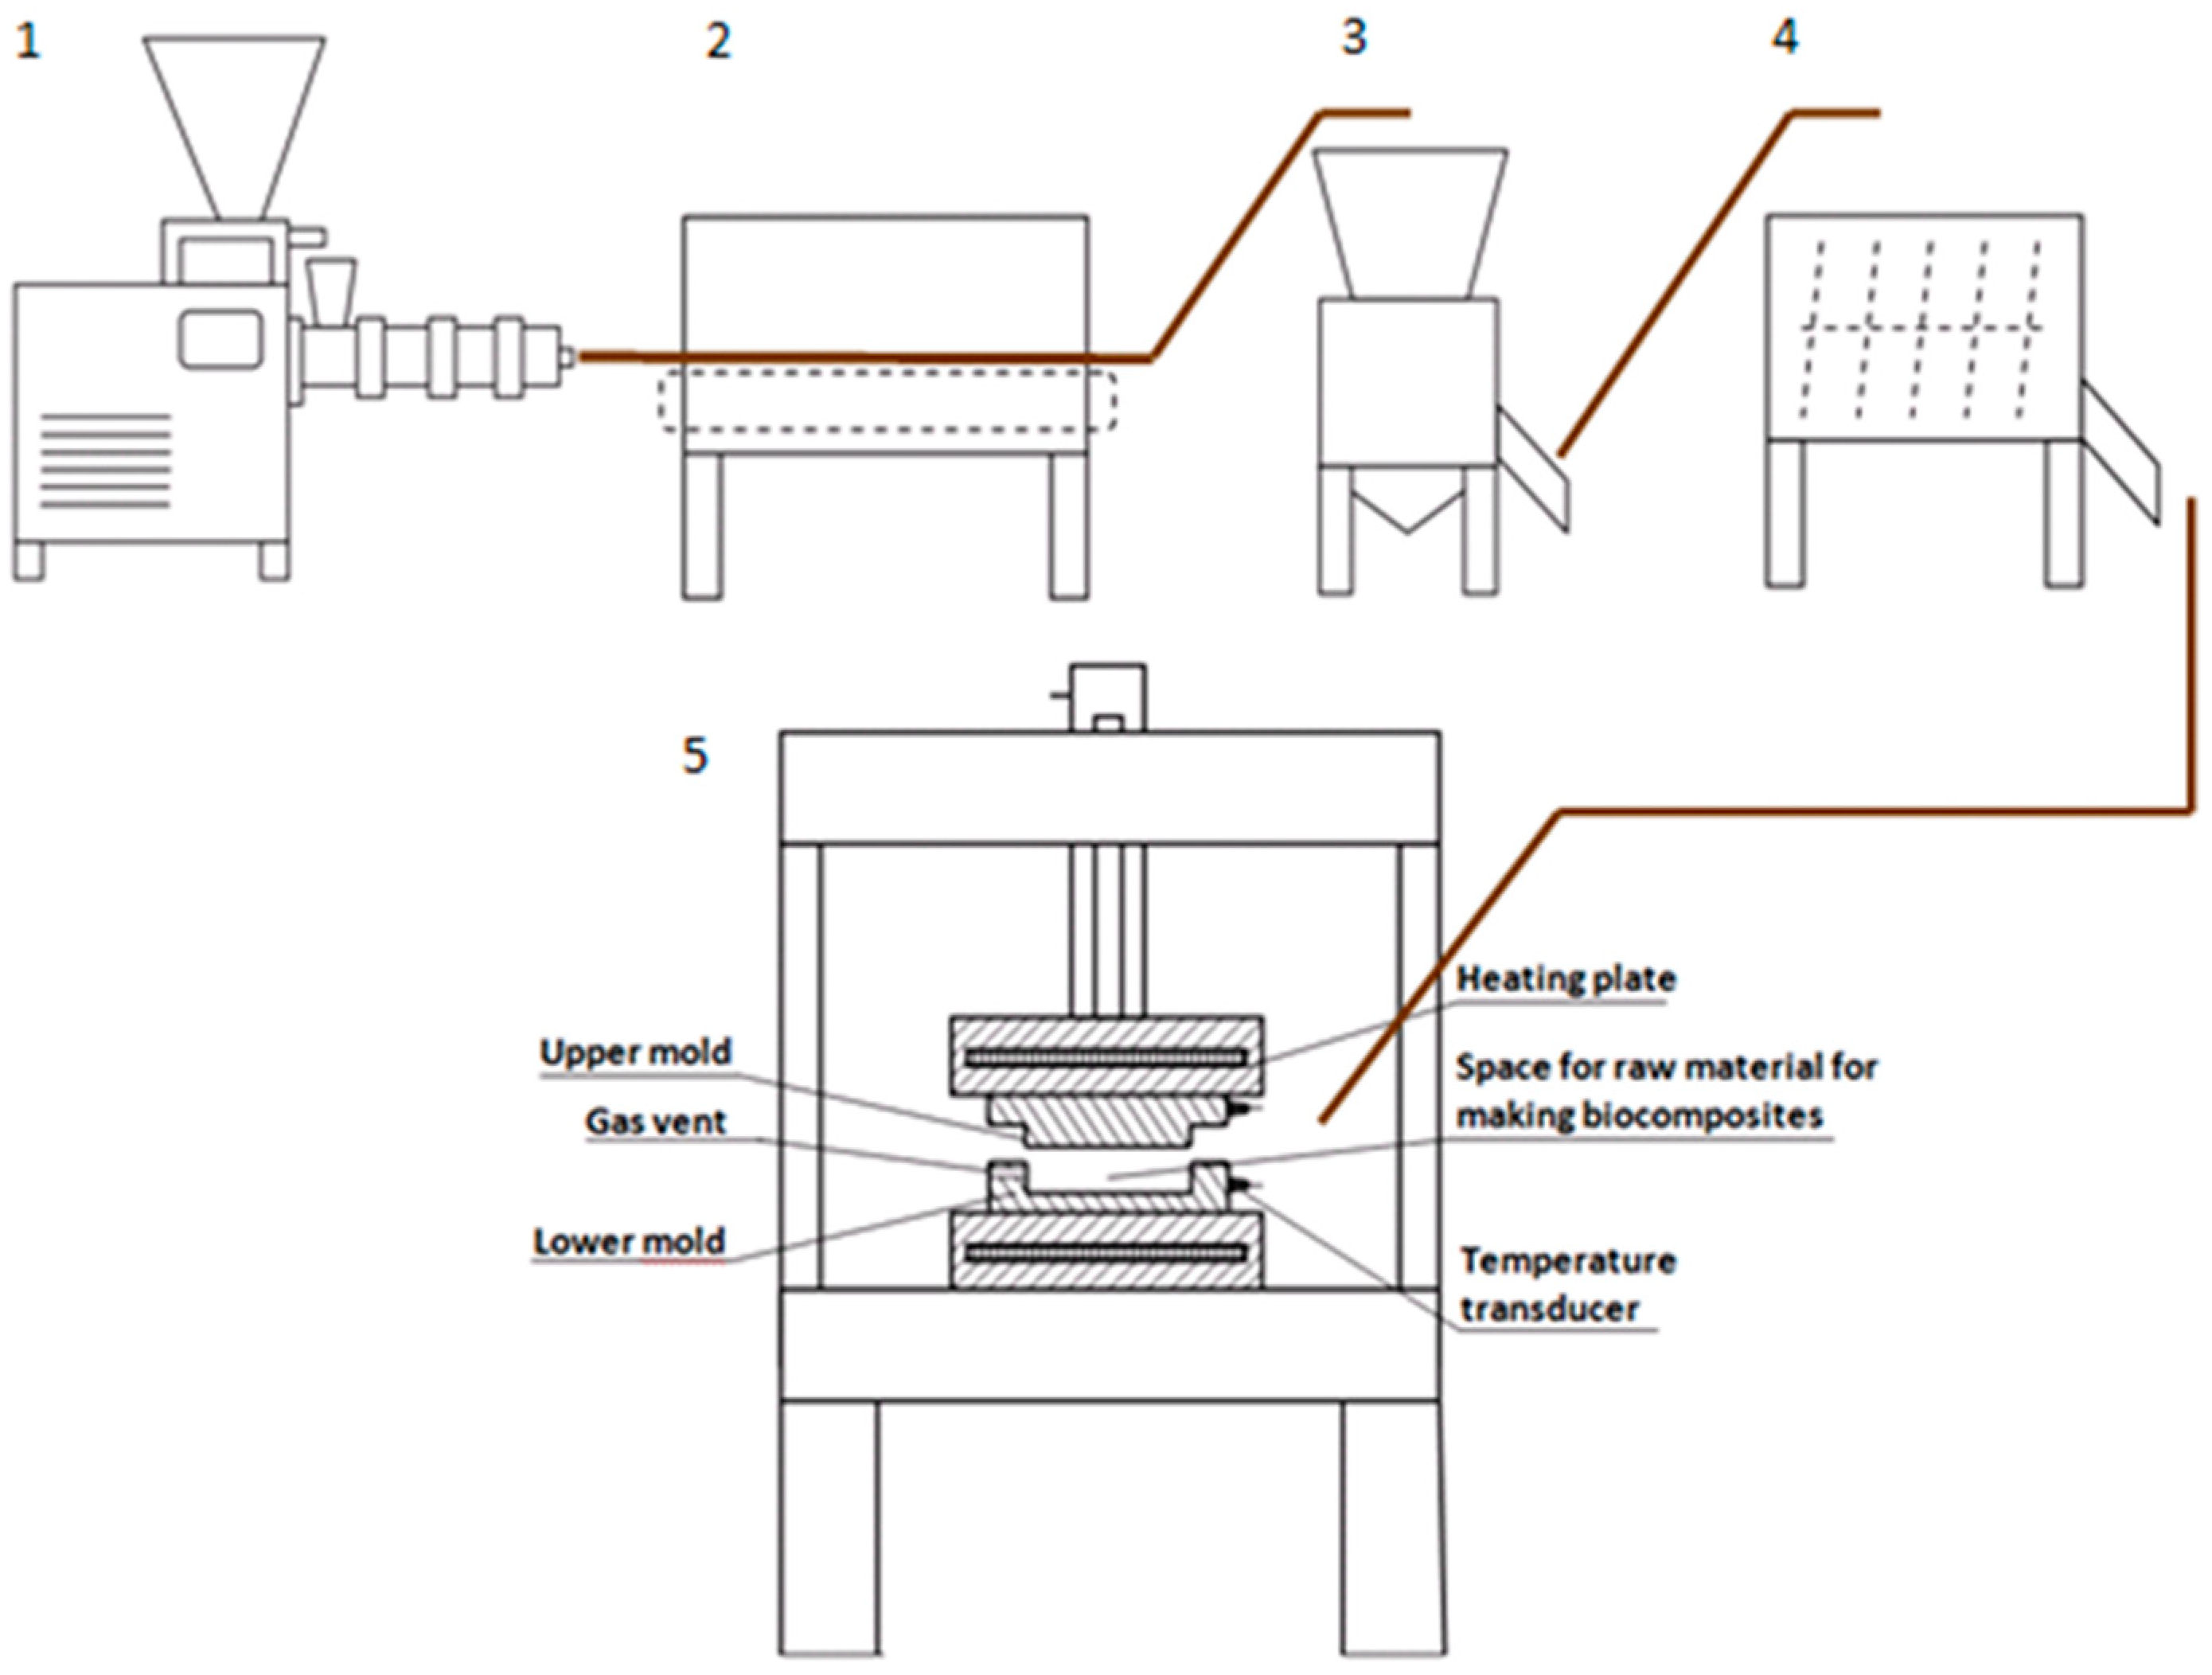
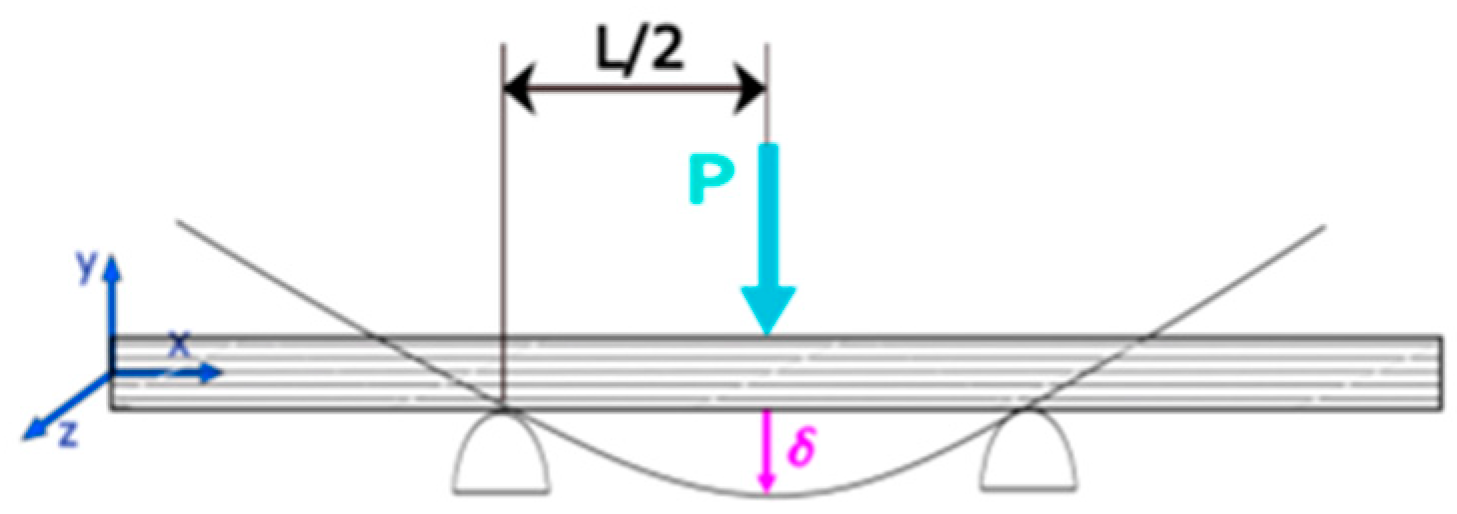
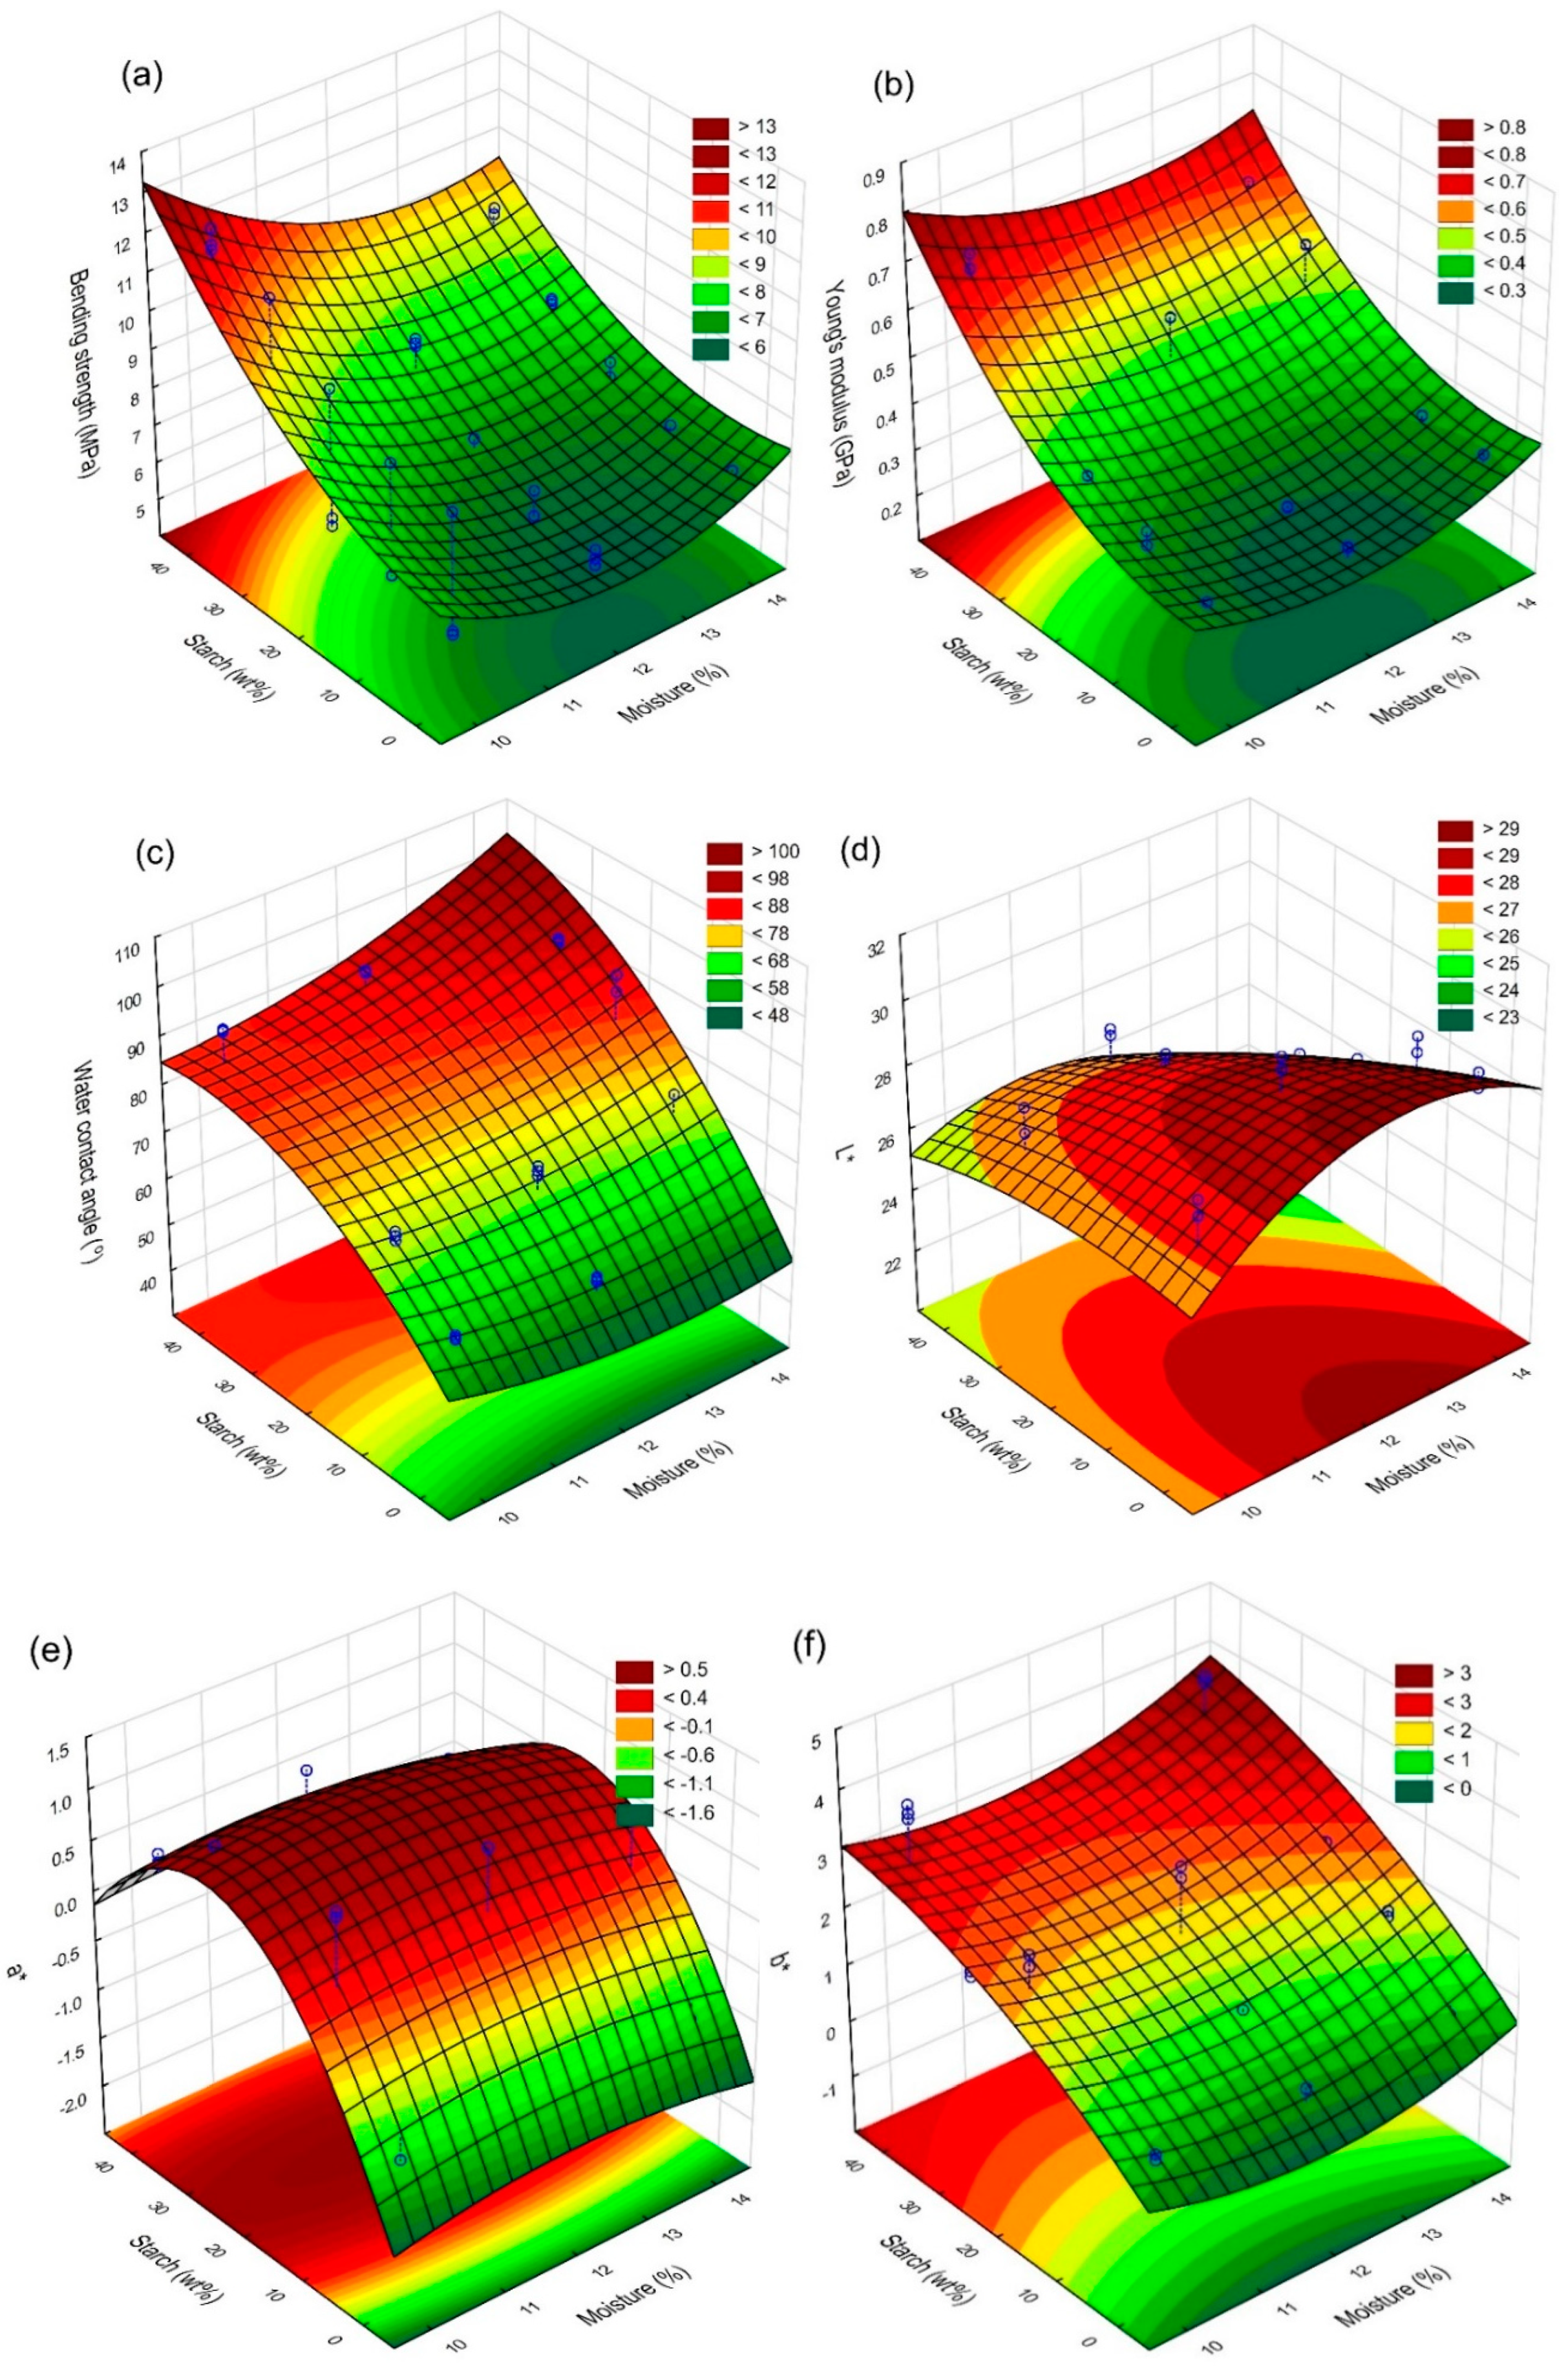

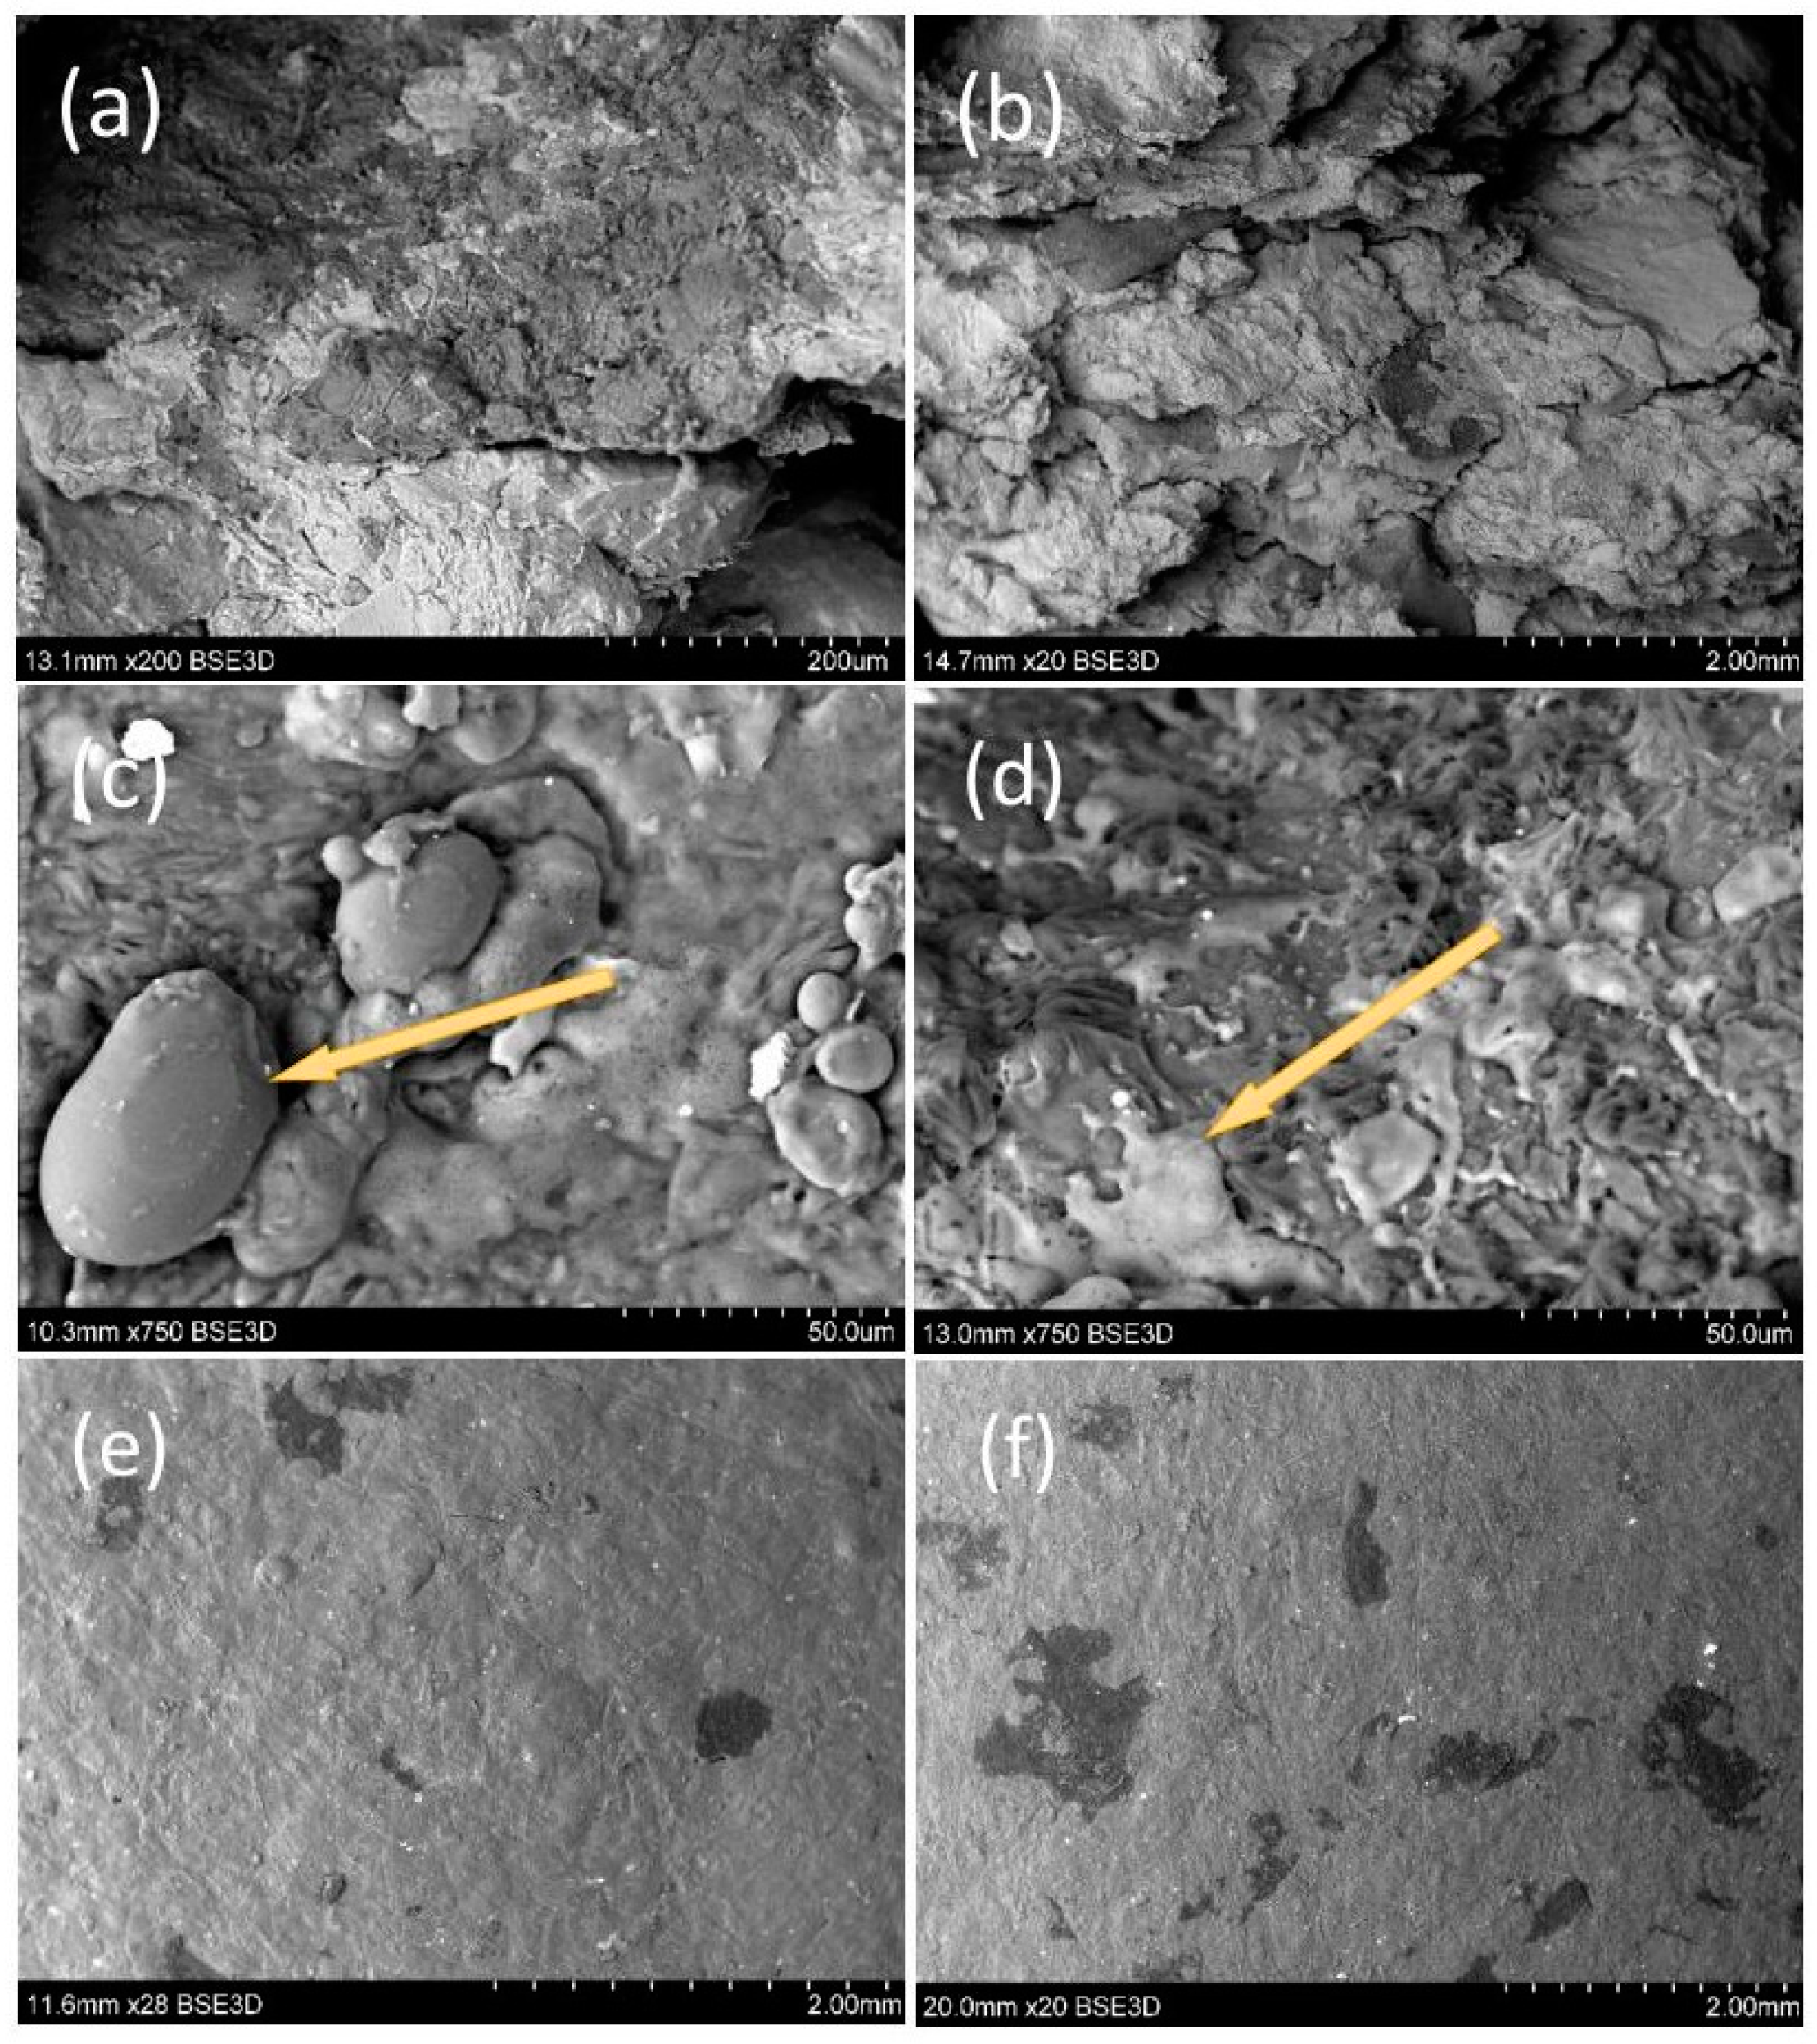
| Sample. nomber | Index* | Apple pomace (EAP) [wt %], |
Starch [wt %] | Moisture [%] |
|---|---|---|---|---|
| 1 | p60_s40_m10 | 60 | 40 | 10 |
| 2 | p70_s30_m10 | 70 | 30 | 10 |
| 3 | p80_s20_m10 | 80 | 20 | 10 |
| 4 | p90_s10_m10 | 90 | 10 | 10 |
| 5 | p100_s0_m10 | 100 | 0 | 10 |
| 6 | p60_s40_m12 | 60 | 40 | 12 |
| 7 | p70_s30_ m12 | 70 | 30 | 12 |
| 8 | p80_s20_ m12 | 80 | 20 | 12 |
| 9 | p90_s10_ m12 | 90 | 10 | 12 |
| 10 | p100_s0_ m12 | 100 | 0 | 12 |
| 11 | p60_s40_m14 | 60 | 40 | 14 |
| 12 | p70_s30_ m14 | 70 | 30 | 14 |
| 13 | p80_s20_ m14 | 80 | 20 | 14 |
| 14 | p90_s10_ m14 | 90 | 10 | 14 |
| 15 | p100_s0_ m14 | 100 | 0 | 14 |
| Source of variation | Bending strength (MPa); R2= 0.762; Pure error MS==0.848 | |||||||||||
|---|---|---|---|---|---|---|---|---|---|---|---|---|
| SS | df | MS | F | p | ||||||||
| 1, Moisture (°C) | L | 12.908 | 1 | 12.908 | 15.218 | 0.0005 | ||||||
| Moisture (°C) | Q | 8.5 | 1 | 8.5 | 10.022 | 0.0035 | ||||||
| 2, Starch (wt%) | L | 74.721 | 1 | 74.721 | 88.093 | 0 | ||||||
| Starch (wt%) | Q | 5.8 | 1 | 5.8 | 6.838 | 0.0138 | ||||||
| Interaction 1Lvs 2L | 4.375 | 1 | 4.375 | 5.158 | 0.0305 | |||||||
| Lack of fit | 7.713 | 9 | 0.857 | 1.01 | 0.4537 | |||||||
| Pure error | 25.446 | 30 | 0.848 | |||||||||
| Total SS | 139.463 | 44 | ||||||||||
| Young’s modulus (MPa); R2= 0.871; Pure error MS=00036 | ||||||||||||
| 1, Moisture (°C) | L | 0.002 | 1 | 0.002 | 5.509 | 0.0257 | ||||||
| Moisture (°C) | Q | 0.027 | 1 | 0.027 | 74.898 | 0 | ||||||
| 2, Starch (wt%) | L | 0.565 | 1 | 0.565 | 1573.495 | 0 | ||||||
| Starch (wt%) | Q | 0.05 | 1 | 0.05 | 138.238 | 0 | ||||||
| Interaction 1L vs.2L | 0.005 | 1 | 0.005 | 14.932 | 0.0006 | |||||||
| Lack of fit | 0.086 | 9 | 0.001 | 26.562 | 0 | |||||||
| Pure error | 0.011 | 30 | 0.0004 | |||||||||
| Total SS | 0.74 | 44 | ||||||||||
| Water contact angle ( °); R2=0.881; Pure error MS=0.866 | ||||||||||||
| 1, Moisture (°C) | L | 173.761 | 1 | 173.761 | 220.634* | 0 | ||||||
| Moisture (°C) | Q | 67.254 | 1 | 67.254 | 85.396* | 0 | ||||||
| 2, Starch (wt%) | L | 6201.76 | 1 | 6201.76 | 7874.695* | 0 | ||||||
| Starch (wt%) | Q | 333.206 | 1 | 333.206 | 423.089* | 0 | ||||||
| Interaction 1L vs.2L | 231.673 | 1 | 231.673 | 294.168* | 0 | |||||||
| Lack of fit | 924.457 | 9 | 102.717 | 130.426* | 0 | |||||||
| Pure error | 23.627 | 30 | 0.788 | |||||||||
| Total SS | 7955.739 | 44 | ||||||||||
| L*; R2= :0.733; Pure error MS=:0.055 | ||||||||||||
| 1, Moisture (°C) | L | 0.702 | 1 | 0.702 | 12.670* | 0.0013 | ||||||
| Moisture (°C) | Q | 18.432 | 1 | 18.432 | 332.810* | 0 | ||||||
| 2, Starch (wt%) | L | 42.955 | 1 | 42.955 | 775.598* | 0 | ||||||
| Starch (wt%) | Q | 1.165 | 1 | 1.165 | 21.042* | 0.0001 | ||||||
| Interaction 1L vs.2L | 8.853 | 1 | 8.853 | 159.847* | 0 | |||||||
| Lack of fit | 24.643 | 9 | 2.738 | 49.440* | 0 | |||||||
| Pure error | 1.661 | 30 | 0.055 | |||||||||
| Total SS | 98.411 | 44 | ||||||||||
| a*; R2= 0.719; Pure error MS=0.00095 | ||||||||||||
| 1, Moisture (°C) | L | 0.197 | 1 | 0.197 | 206.465* | 0 | ||||||
| Moisture (°C) | Q | 0.188 | 1 | 0.188 | 196.878* | 0 | ||||||
| 2, Starch (wt%) | L | 5.73 | 1 | 5.73 | 6011.003* | 0 | ||||||
| Starch (wt%) | Q | 8.265 | 1 | 8.265 | 8669.272* | 0 | ||||||
| Interaction 1L vs.2L | 0.045 | 1 | 0.045 | 47.596* | 0 | |||||||
| Lack of fit | 5.602 | 9 | 0.622 | 652.913* | 0 | |||||||
| Pure error | 0.029 | 30 | 0.00095 | |||||||||
| Total SS | 20.056 | 44 | ||||||||||
| b*; R2= 0.711; Pure error MS=0.0065 | ||||||||||||
| 1, Moisture (°C) | L | 0.853 | 1 | 0.853 | 130.809* | 0 | ||||||
| Moisture (°C) | Q | 1.439 | 1 | 1.4394 | 220.546* | 0 | ||||||
| 2, Starch (wt%) | L | 30.543 | 1 | 30.543 | 4681.378* | 0 | ||||||
| Starch (wt%) | Q | 0.761 | 1 | 0.761 | 116.587* | 0 | ||||||
| Interaction 1L vs.2L | 0.111 | 1 | 0.111 | 17.004* | 0.0003 | |||||||
| Lack of fit | 13.479 | 9 | 1.498 | 229.550* | 0 | |||||||
| Pure error | 0.196 | 30 | 0.0065 | |||||||||
| Total SS | 47.382 | 44 | ||||||||||
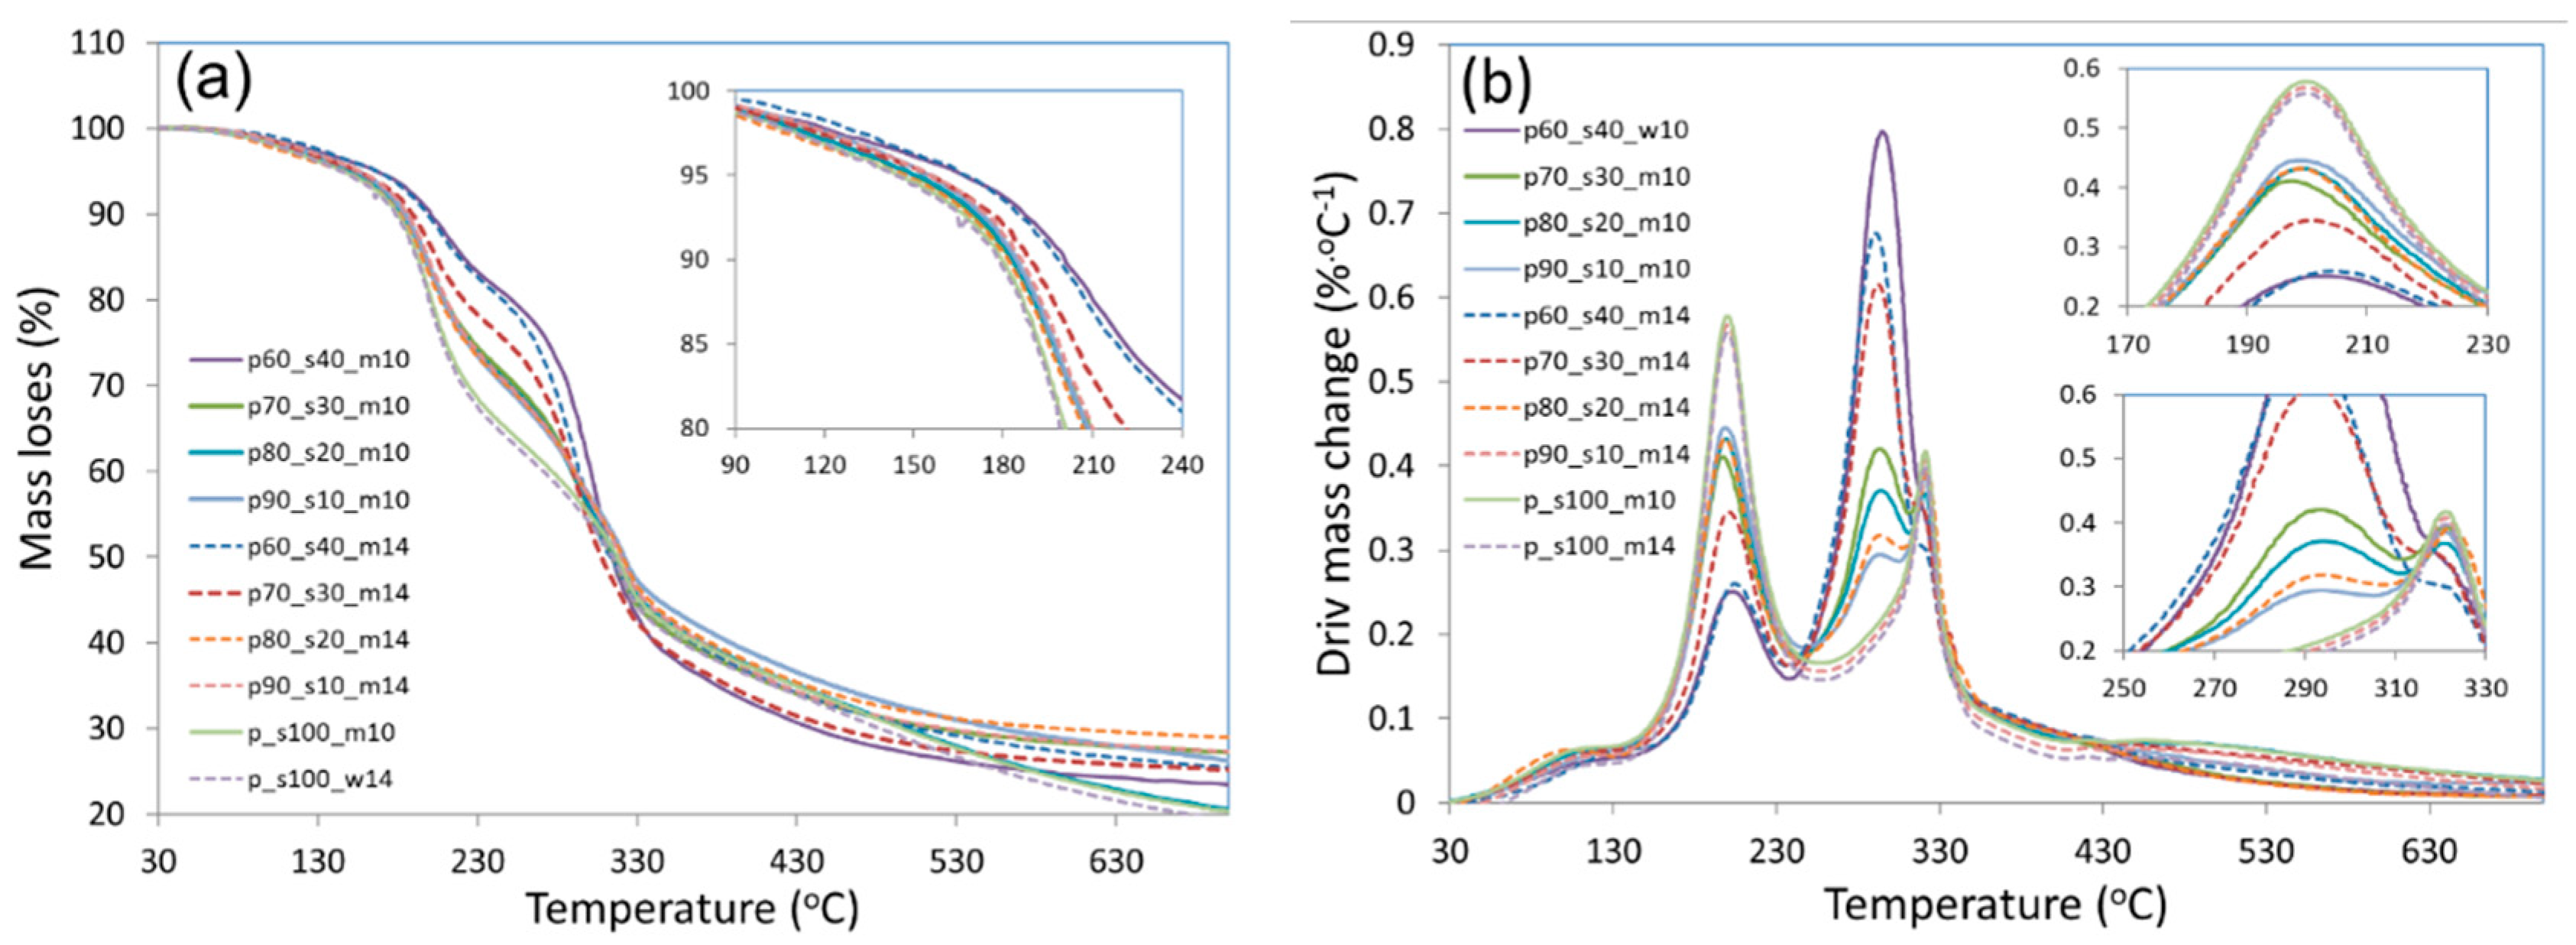
| Sample | Mass losses (%) | Temperature at 5% mass losses (°C) | Temperature at 50% mass losses (°C) | |||||
|---|---|---|---|---|---|---|---|---|
| I 30-150°C |
II 150-250°C |
III 250-350°C |
IV 350-600°C |
Total 30-600 °C |
||||
| p60_s40_m10 | 3.37 | 15.79 | 54.15 | 0 | 73.31 | 166,5 | 314,1 | |
| p70_s30_m10 | 4.02 | 24.28 | 20.91 | 22.49 | 71.70 | 153,2 | 322,7 | |
| p80_s20_m10 | 4.22 | 24.77 | 18.85 | 29.13 | 76.97 | 142,1 | 325,6 | |
| p90_s10_m10 | 3.55 | 26.39 | 14.75 | 26.64 | 71.33 | 158,5 | 330,1 | |
| p60_s40_m14 | 3.19 | 15.64 | 54.49 | 0 | 73.32 | 171,4 | 301,1 | |
| p70_s30_m14 | 2.93 | 20.41 | 49.91 | 0 | 73.25 | 158,5 | 315,5 | |
| p80_s20_m14 | 4.09 | 25.17 | 16.75 | 24.52 | 70.53 | 150,1 | 329,7 | |
| p90_s10_m14 | 3.71 | 25.69 | 15.88 | 26.30 | 71.58 | 159,3 | 328,1 | |
| p100_s0_m10 | 4.15 | 32.09 | 33.75 | 0 | 69.99 | 149,3 | 325,9 | |
Disclaimer/Publisher’s Note: The statements, opinions and data contained in all publications are solely those of the individual author(s) and contributor(s) and not of MDPI and/or the editor(s). MDPI and/or the editor(s) disclaim responsibility for any injury to people or property resulting from any ideas, methods, instructions or products referred to in the content. |
© 2023 by the authors. Licensee MDPI, Basel, Switzerland. This article is an open access article distributed under the terms and conditions of the Creative Commons Attribution (CC BY) license (http://creativecommons.org/licenses/by/4.0/).


