Preprint
Article

Carbon Stock in Coastal Ecosystems of Tombolos of the White and Baltic Seas

Altmetrics

Downloads

90

Views

43

Comments

0

A peer-reviewed article of this preprint also exists.

Submitted:

27 November 2023

Posted:

28 November 2023

You are already at the latest version

Alerts
Abstract
“Blue carbon”, apart from marine humus, includes the carbon (C) stock of coastal ecosystems such as mangroves, marshes, and seagrass meadows, which have been overlooked until recently. Information about the role of coastal wetlands in C sequestration and providing other ecosystem services is still insufficient. In the present study, we assessed the C reserves of soils and vegetation biomass in two complex coastal landscapes (tombolos) located on the coasts of the White and Baltic seas. The soil and plant C stocks were slightly higher at the plot at the Baltic Sea (93.4 ± 46.7 Mg C·ha-1 and 5.22 ± 2.51 Mg C·ha-1, respectively) than at the plot on the White Sea (71.4 ± 38.2 Mg C·ha-1 and 3.95 ± 2.42 Mg C·ha-1, respectively). We attributed the higher values of the C reserved to a warmer climate and less saline water at the plot on the Baltic Sea. Both soil and plant C showed high heterogeneity due to geomorphological complexity and differences in vegetative communities. The Phragmites australis community showed the highest plant biomass and, in some places, high soil C reserves. Allochthonous C contributed to the soil C stock at the site on the White Sea. Though P. australis sequestered more C than other communities, its effect on ecosystem services was mostly negative because the invasion of reeds reduced the biological diversity of the marshes.
Keywords: 
Subject: Environmental and Earth Sciences  -   Soil Science

1. Introduction

An increase in the average concentration of carbon dioxide (CO2) and other greenhouse gases in the atmosphere is considered one of the causes of global warming and climate change [1]. It is of great importance not only to reduce anthropogenic emissions of climatically active gases but also to protect natural carbon (C) depots and promote C sequestration in natural landscapes [2,3]. The World Ocean, which is the largest carbon pool on the planet, thereby makes a huge contribution to the global carbon cycle [1]. All C that is captured by marine and coastal ecosystems and stored in their components is called “blue carbon” [4]. The capture and accumulation of blue carbon by coastal ecosystems such as mangroves, marshes, and seagrass meadows have been overlooked until recently [2]. Apart from C sequestration, coastal landscapes provide a number of other ecosystem services, including playing an important role in biogeochemical cycles, granting habitat for many organisms, acting as a natural filter for water, and protecting soils from coastal erosion. The area occupied by coastal ecosystems has been rapidly decreasing in recent decades due to anthropogenic pressure [5].
Coastal landscapes are characterized by high rates of С accumulation in sediments and soils [2,5]. The amount of stored soil C per unit area in coastal ecosystems is greater than in terrestrial landscapes. In some cases, organic deposits on the shores can reach a thickness of tens of meters, which is associated with regular flooding with seawater and the dominance of anaerobic conditions in soils [3,6]. Low rates of organic matter decomposition make coastal wetlands similar to freshwater bogs and swamps [6,7]. However, tidal ecosystems have an advantage as a C pool over inland peatlands. Due to their position on the border of land and sea, coastal ecosystems receive allochthonous organic matter both with terrestrial runoff and with particles of marine humus, which is fixed by coastal vegetation, settles in the tidal zone, and replenishes blue carbon reserves on the shores [6,8]. In some cases, the share of allochthonous C in total reserves may exceed the share of autochthonous C [2]. Freshwater runoff and tidal wave also introduce mineral particles that may bury the incoming organic material and thus contribute to the long-term preservation of blue carbon stocks [3]. Though allochthonous organic matter is important for C balance on the seacoast, vegetation composition and productivity are of crucial importance. It is noteworthy that in coastal plant communities, the underground biomass is several times higher than the terrestrial one, and the major part of organic deposits in coastal sediments consists of dead underground plant organs [9].
Coastal ecosystems, as a rule, are characterized by a mosaic of habitats and a variety of environmental conditions, which leads to different rates of С accumulation in different parts of the landscape. For example, the rate and capacity of accumulation of organic residues in mangroves and marshes will be the highest in the part that is flooded daily at high tide [10]. The accumulation of blue carbon is influenced by multiple factors such as climatic conditions, hydrology, seawater salinity, topography, sedimentation rate, texture of coastal sediments, plant biomass, species composition, fauna activity, etc. [2,11].
The most important factor influencing the accumulation of blue carbon is soil salinity [12]. The degree of salinity depends on the geomorphology of the coast, climate, season, and thalassogenic conditions and can vary significantly within the boundaries of one ecosystem [13,14]. Soil salinity does not always increase with proximity to the sea in coastal ecosystems. In some places, the highest salinity values are found in areas relatively remote from the sea [15]. This may be due to hot and dry weather conditions that lead to the evaporation of seawater and the accumulation of salts [14,16]. Also, a high degree of salinization can depend on soil texture because water lingers longer on clay soils than on sandy ones; therefore, clay soils are more saturated with salts [13]. The degree of salinity of the substrate significantly affects the species composition of plant communities on the shores and the distribution of species across the ecosystem [14,17]. Under increased salinization, plants experience salt stress, which leads to inhibition of their vital activity and, consequently, reduced rates of carbon sequestration [18,19]. Even halophytic species achieve the best growth parameters under low concentrations of salts [20]. The highest species diversity, the largest primary production, and, in general, blue carbon reserves are observed in the part of the coastal ecosystem with the lowest level of salinity [17,18,21]. Organic residues of plants growing in the most saline areas have fewer stable substances such as lignin, cellulose, and hemicellulose, which increases the rate of their mineralization [21].
Soil texture has both indirect and direct effects on the accumulation of blue carbon. Apart from its effect on soil salinity, texture affects soil aeration. Clay soils are less saturated with oxygen and have a higher water retention capacity than sandy soils, which leads to reduced rates of microbiological decomposition of organic residues and favors C accumulation in heavy-textured soils [22]. Also, organic substances form strong bonds with clay particles rather than with sand, which also contributes to the preservation of soil carbon reserves in clayey soils [23].
The soil reaction somewhat intersects with substrate salinity. The largest carbon reserves are found in parts of the coastal ecosystem where soil pH values are close to neutral. Along the gradient to acidic or alkaline soils, the biomass of plants decreases, and consequently, carbon stocks are also lower. Sidorova et al. [24] showed that organic C concentration increases with distance from the sea and decreasing pH values. The more often seawater impacts vegetation, the less C accumulates. Coastal areas flooded only in syzygy store several times more C than those flooded daily [25].
The diversity of geomorphological positions, sediments, water regime, soils, and vegetation in the coastal areas is the highest on tombolos, deposition landforms connecting islands to the mainland. According to our hypothesis, this diversity might lead to a complex spatial distribution of C incorporated into biomass in soil organic matter. In the present study, we assessed organic C on two tombolos formed on the coasts of two northern European seas: the Baltic and the White Sea. We attempted to relate C reserves to environmental variables and soil properties where possible. Also, we discussed the importance of coastal soils and vegetation for ecosystem services in the region.

2. Materials and Methods

2.1. Study Area

We conducted our research on the Pomor coast of the White Sea, near the village of Kolezhma (Figure 1) and in the southern part of the Gulf of Finland, the Baltic Sea, near the village of Gakkovo. Both study sites are tombolos connecting the mainland with small islands with a linear size of less than 500 m. The environmental conditions, groundwater salinity, soil texture, and acidity, as well as the description of vegetation, are available in our previous publication [26].
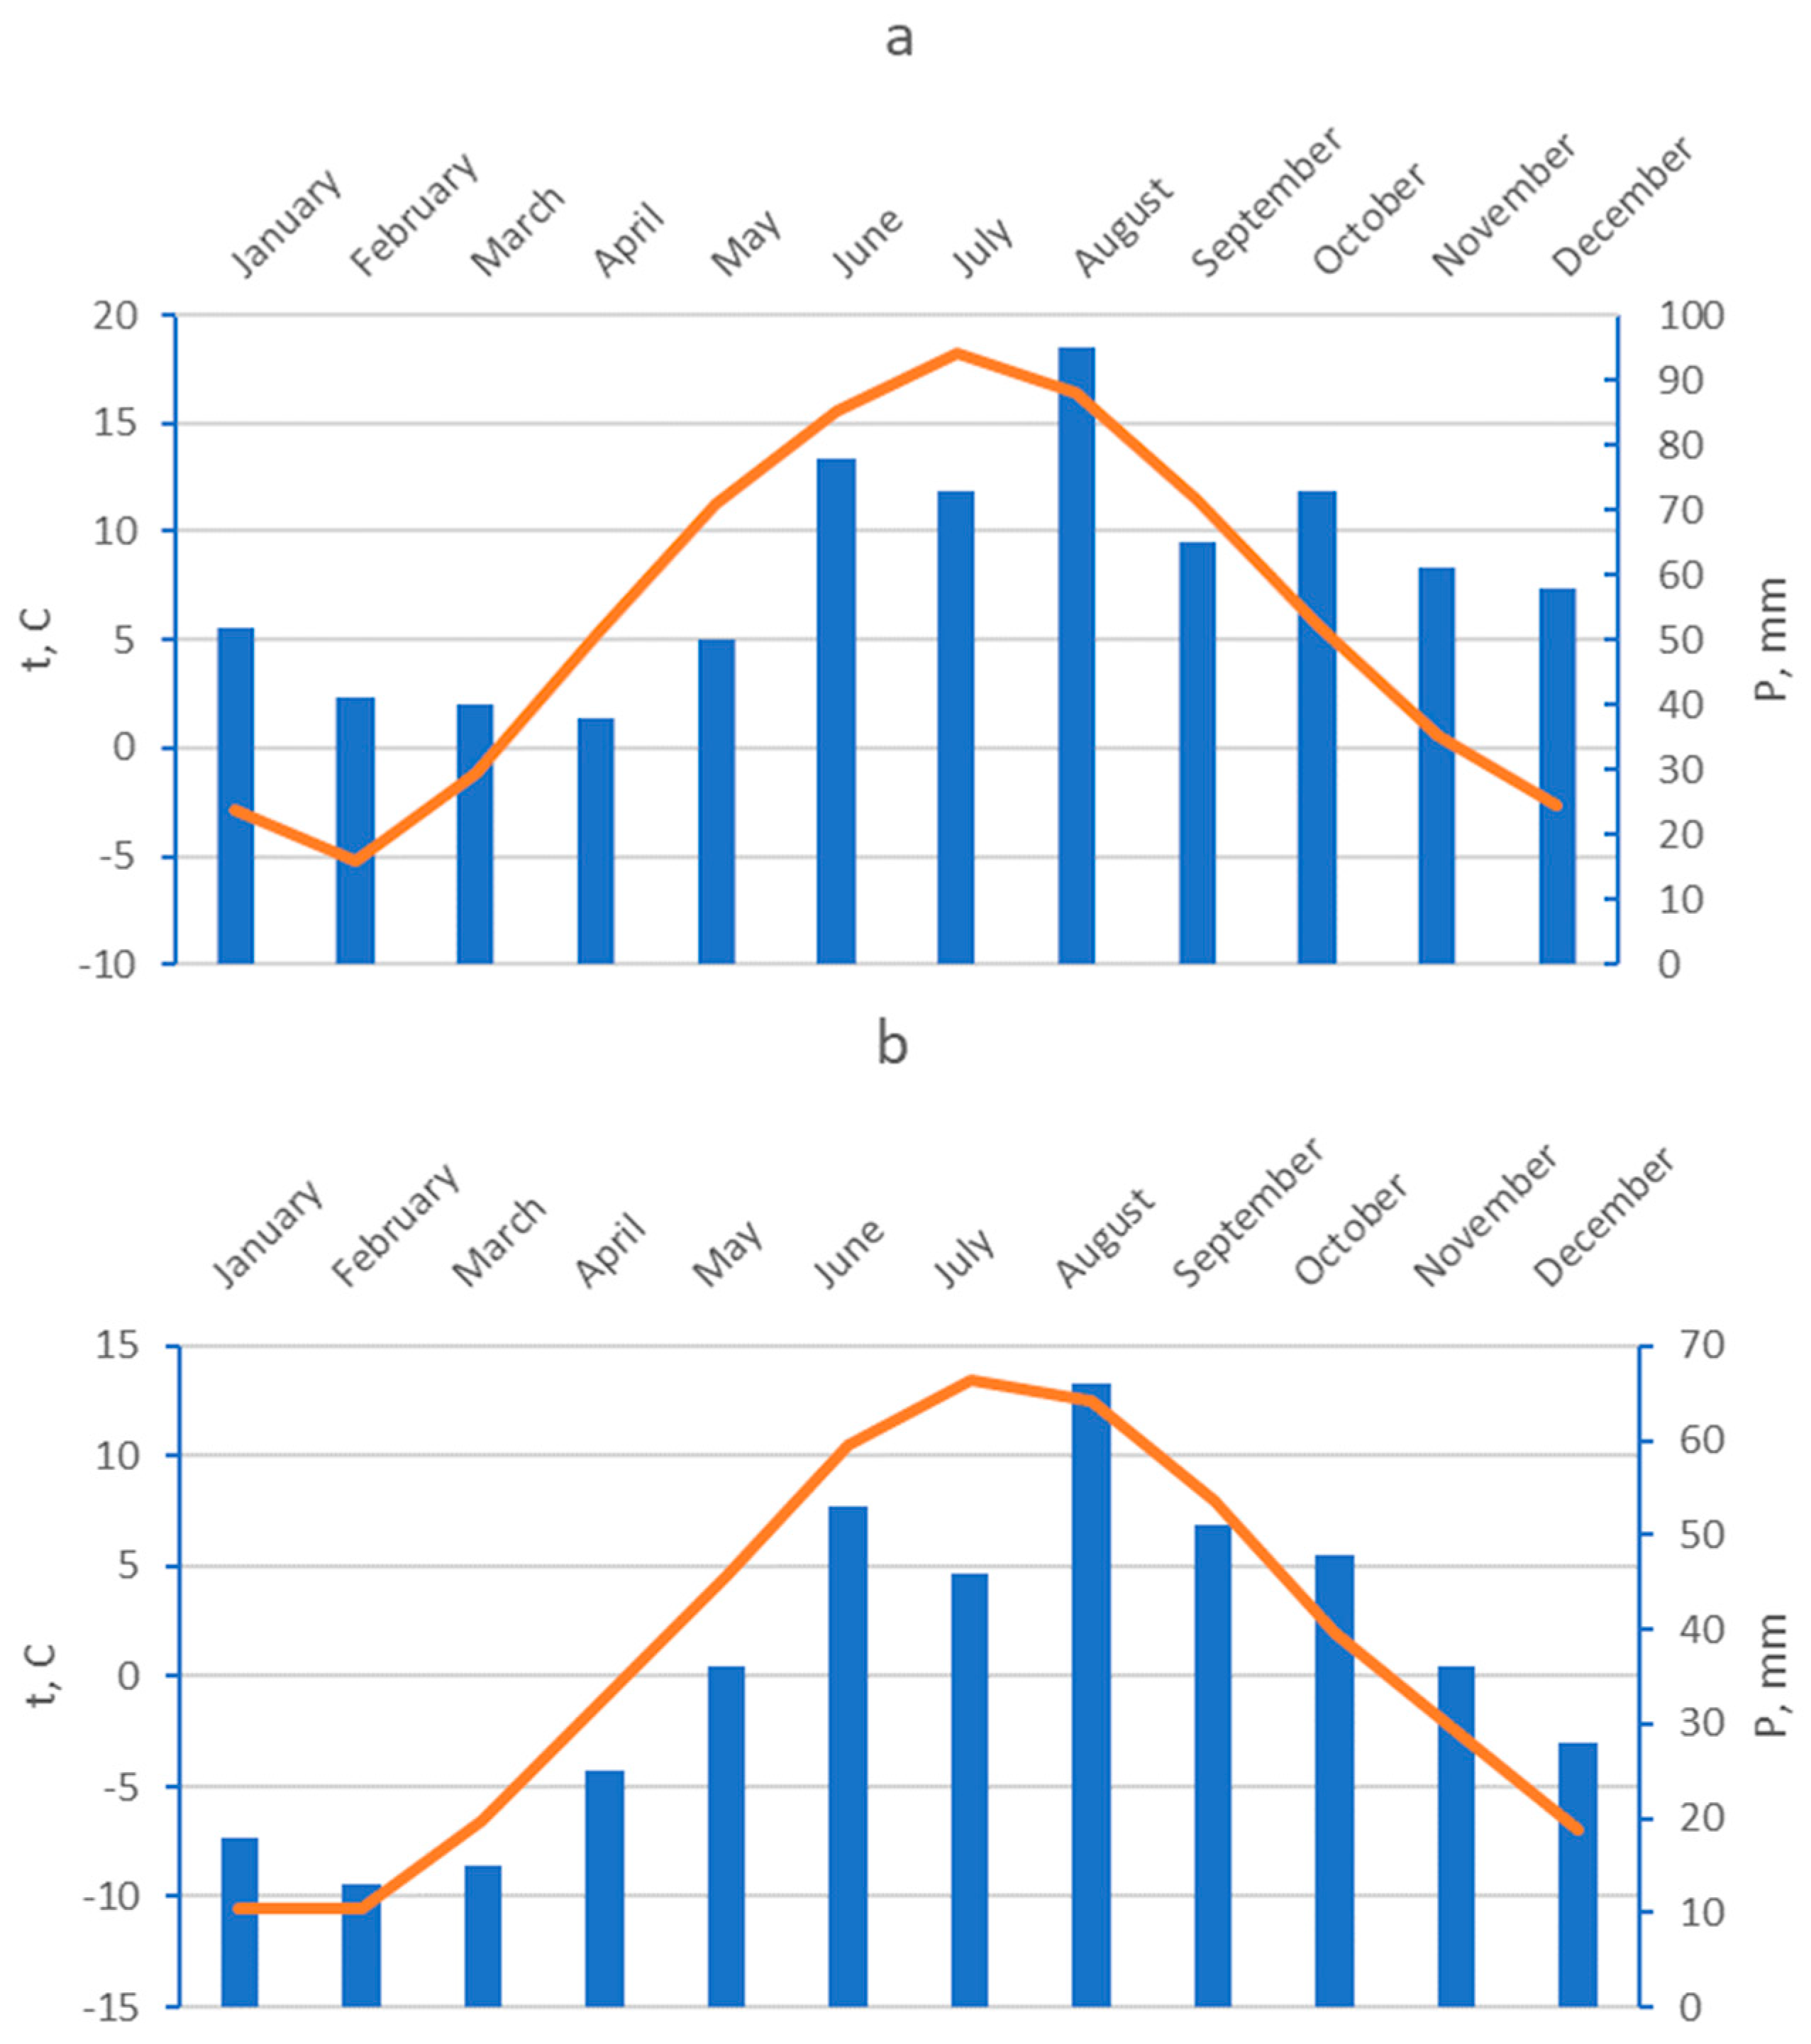
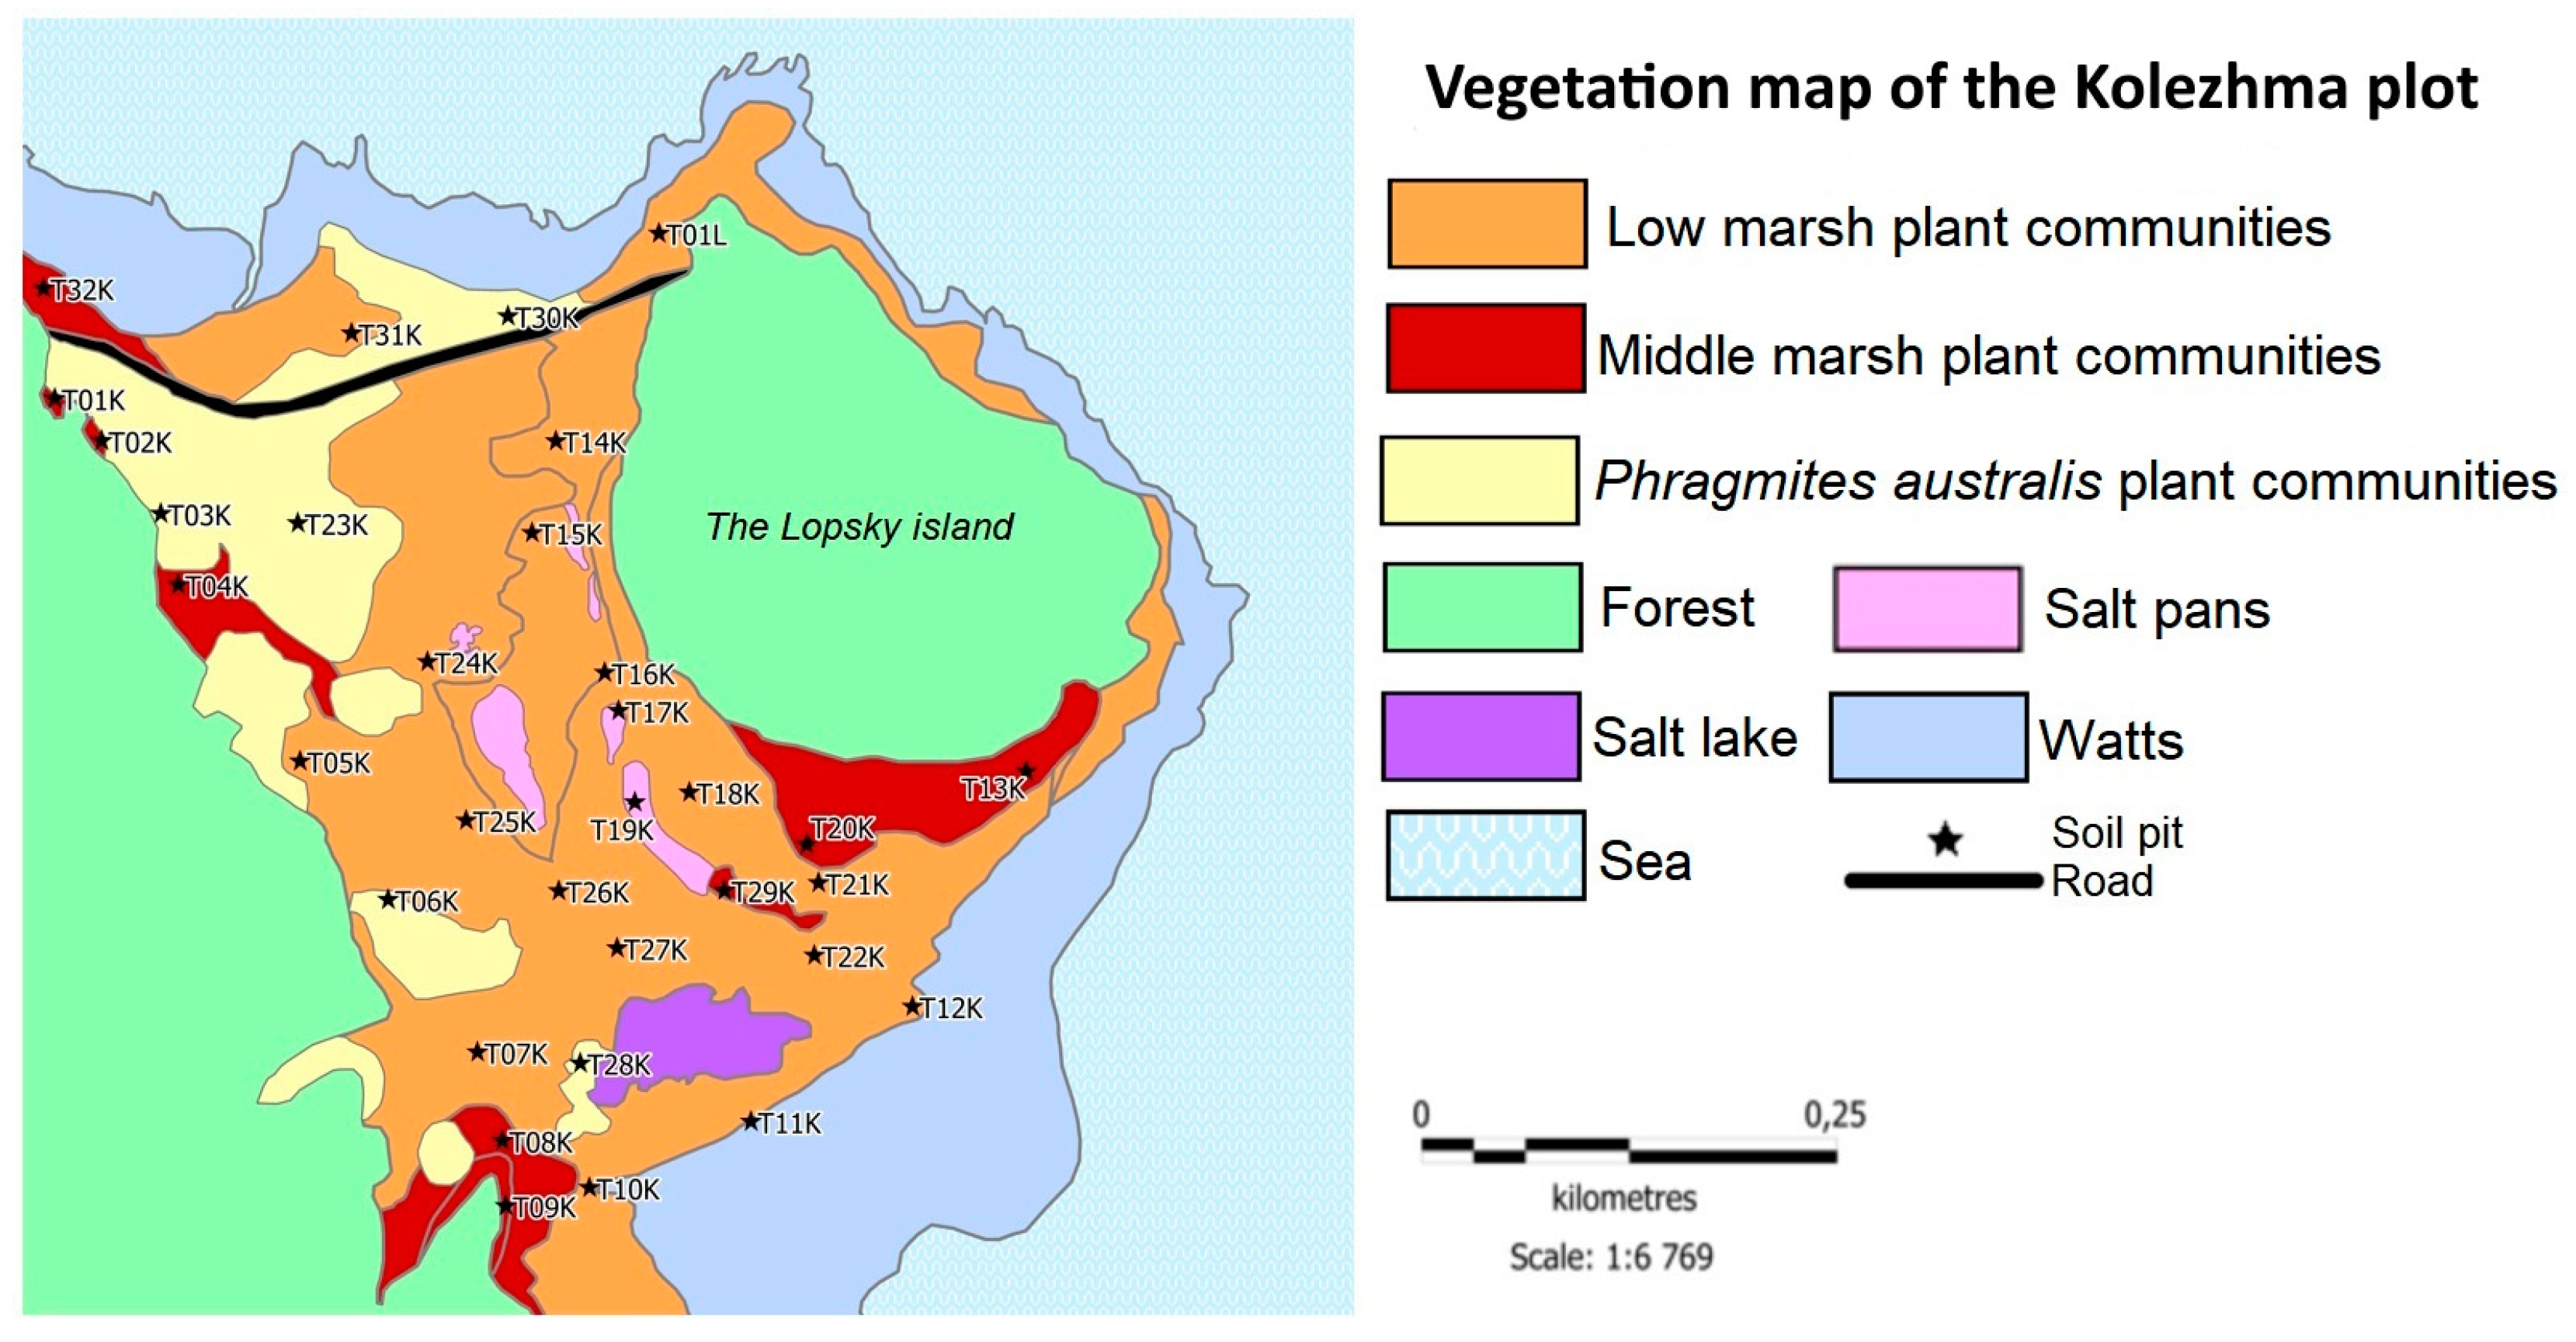
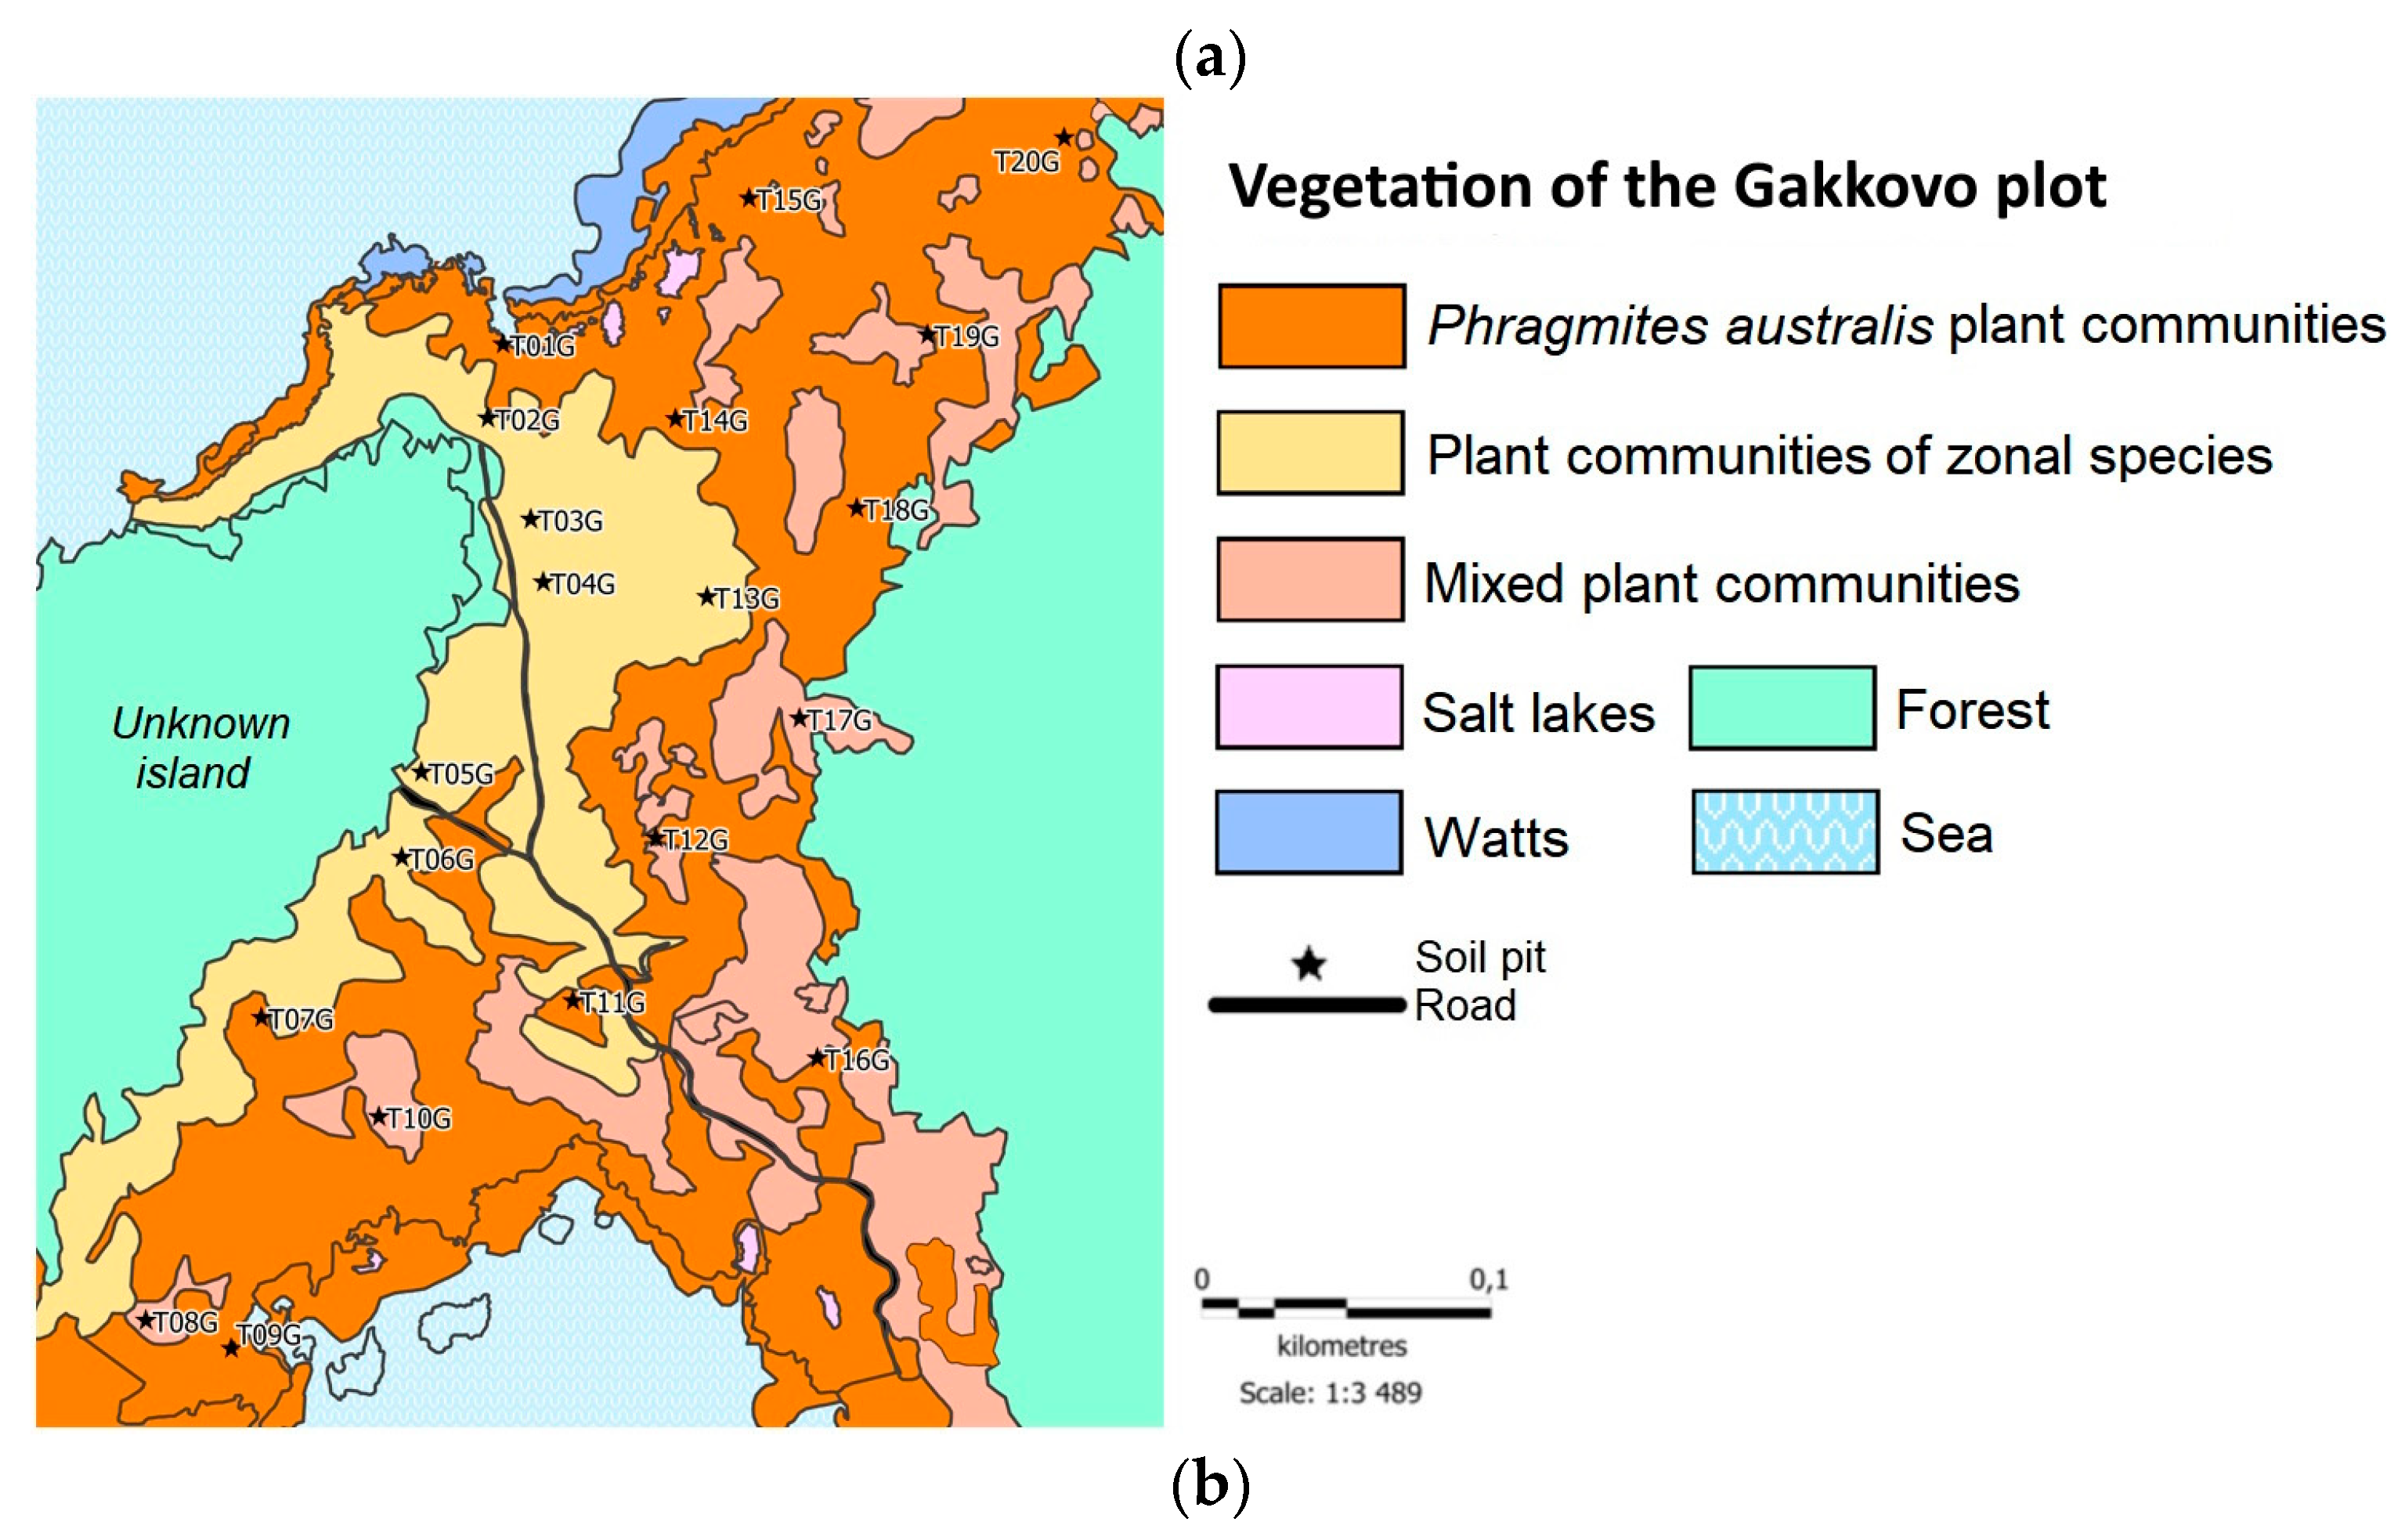
The White and Baltic Seas differ significantly from each other, and the coastal ecosystems at the Kolezhma site and the Gakkovo site are fundamentally different. The climatic conditions at the experimental plots were different: the Gakkovo plot was warmer and more humid than the Kolezhma plot (Figure 2). Also, the salinity of the water in the Baltic Sea is much lower than in the White Sea (4% in the southern waters of the Gulf of Finland versus 26% in the Onega Bay of the White Sea), and tidal activity is much weaker (the average height of the tidal wave in the Baltic Sea is 0.2 m, while in the Onega Bay it is 3.4 m). At the Gakkovo site (the Baltic Sea), the sea has minimal impact on the coastal ecosystem. The vegetative cover on this tombolo is represented by the communities of the euryhaline species Phragmites australis Cav. (communis (Trin.)), forming dense thickets both in the narrow tidal zone and in the central part of the tombolo, and the communities of hygrophytic zonal species (Figure 3). The soils had sandy and loamy sand textures; in most soil profiles, the water was fresh or absent; and the soil pH values were higher than in zonal soils [26]. The soils were classified as Arenosols and Gleysols [27]. In contrast, the ecosystem of the Kolezhma site (the White Sea) is a developed marsh ecosystem. Based on the dominant species in the composition of plant communities, we allocated lower and middle levels of coastal meadows. Lower-level marshes are flooded daily or at high tide with salty seawater. The soils (Stagnosols and Gleysols [27]) at the lower level mostly have a silty loam texture, the pH values of the soils are close to neutral, and groundwater salinity is high. As a result, halophytic species constitute the majority of vegetative cover: Juncus gerardii L., Salicornia europaea L., Carex salina Wahlend, Bolboschoenus maritimus L., Puccinellia coarctata Parl., and Eleocharis uniglumis Link. There are also salt puddles practically devoid of vegetation on the lower level; the water lingers longer in wet and cool periods, and dries faster in hot and dry periods. As a result, the salinity values here are the highest at this site. The vegetation is represented by the community of Salicornia europaea L., a pioneer type of marsh that can survive under extreme salinity.

2.2. Soil Sample Collection and Analysis

The reserves of soil and plant carbon were estimated according to the formulas presented in the UNESCO methodological manual [28], and the results were presented in Mg C·ha-1. Totally, 33 control points were established at the Kolezhma site and 20 at the Gakkovo site. The bulk density of the soil was determined using the cylinder method. Soil samples were collected from each soil horizon. In the laboratory, C content was determined by dry combustion using the analyzer CN 802 8020 (VELP, Italy). C stock was calculated for the upper 30 cm of soil.

2.3. Vegetation Collection and Analysis

Sampling points for vegetative biomass assessment were selected with reference to plant communities. At the first site, on tombolo near Kolezhma, 11 sampling points were selected; at the second site, on tombolo near Gakkovo, six sampling points were selected. At each point, we have laid out three sample squares with an area of 0.25 m2 each for collecting the aboveground biomass of plants. Only above-ground biomass was collected.
Of the 11 vegetation sampling points at the first site (Figure 3), one point was located in the thickets of P. australis (T23K), four on the marsh of the middle level (T01K, T04K, T09K, T01L), and the rest on the marsh of the lower level (T11K, T12K, T14K, T17K, T21K, T27K).
On tombolo in the Gakkovo area, sites T03G and T05G were located under a meadow-swamp community. At T09 and T14, P. australis dominated the composition of plant communities. The two remaining sites, T17G and T10G, were located in transitional communities. For each vegetation type, we made a vegetation description at five test sites, where the species composition and the projective cover of each species were evaluated.
The determination of carbon reserves in vegetation biomass was carried out according to the methodology proposed in the methodological manual on the assessment of “blue carbon” reserves [28]. Within the framework of this methodology, the first stage is the C content in vegetation:
CGC = B · C_coef · S-1
where: CGC is the C in the grass component, kg·C·m-2; B is the biomass of vegetation on the test site, kg; C_coef is carbon conversion coefficient equal to 0.45; S is the area of the test site, m2. C reserves in vegetation (Mg C· ha-1) are:
C_veg = CGC · 1000 kg-1 · 10,000 m-2

2.4. Statistical Processing and Mapping

Next is the average value of carbon stocks among the three test sites. The results were presented taking into account the standard deviation. Statistical processing of the results (finding the average value and standard deviation) took place in the Microsoft Excel program. Based on the received and processed data, cartograms were built in the MapInfo Pro 15.2. program using open-source remote sensing data (Google Earth). Inverse Distance Weighing (IDW) was used to construct cartograms.

3. Results

3.1. C Stock at the Kolezhma Plot (the White Sea)

3.1.1. Soil C Reserves

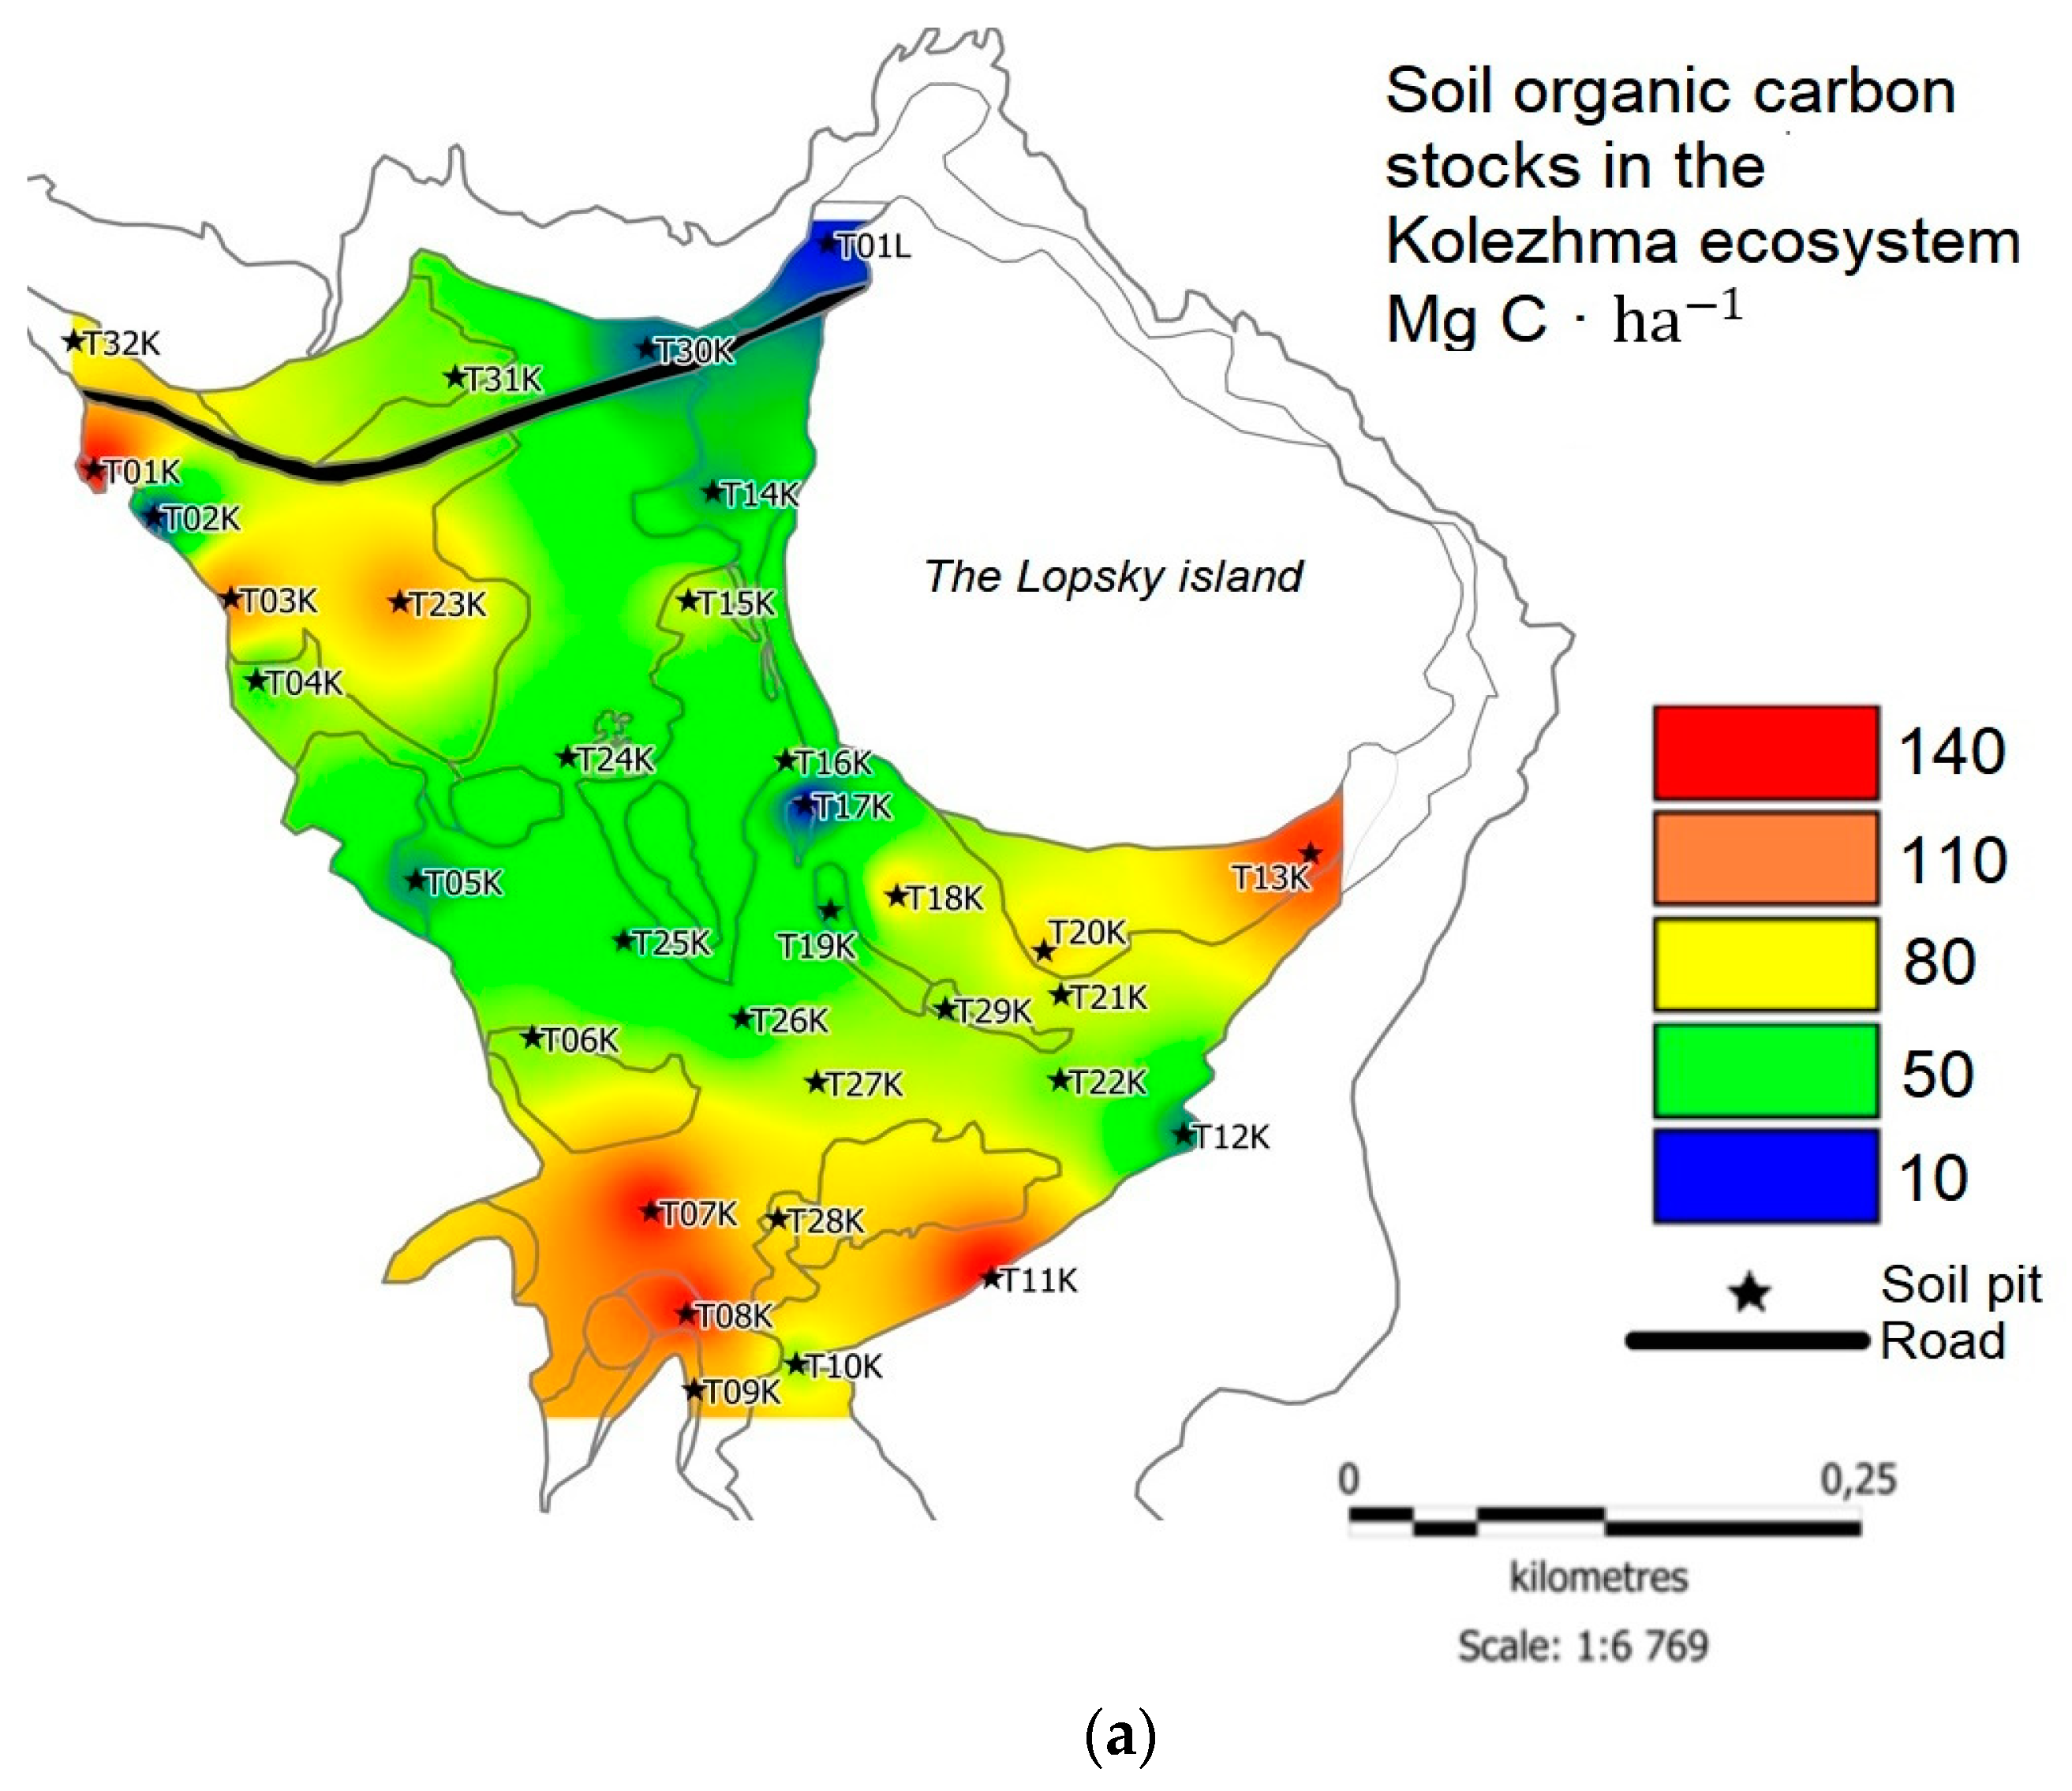
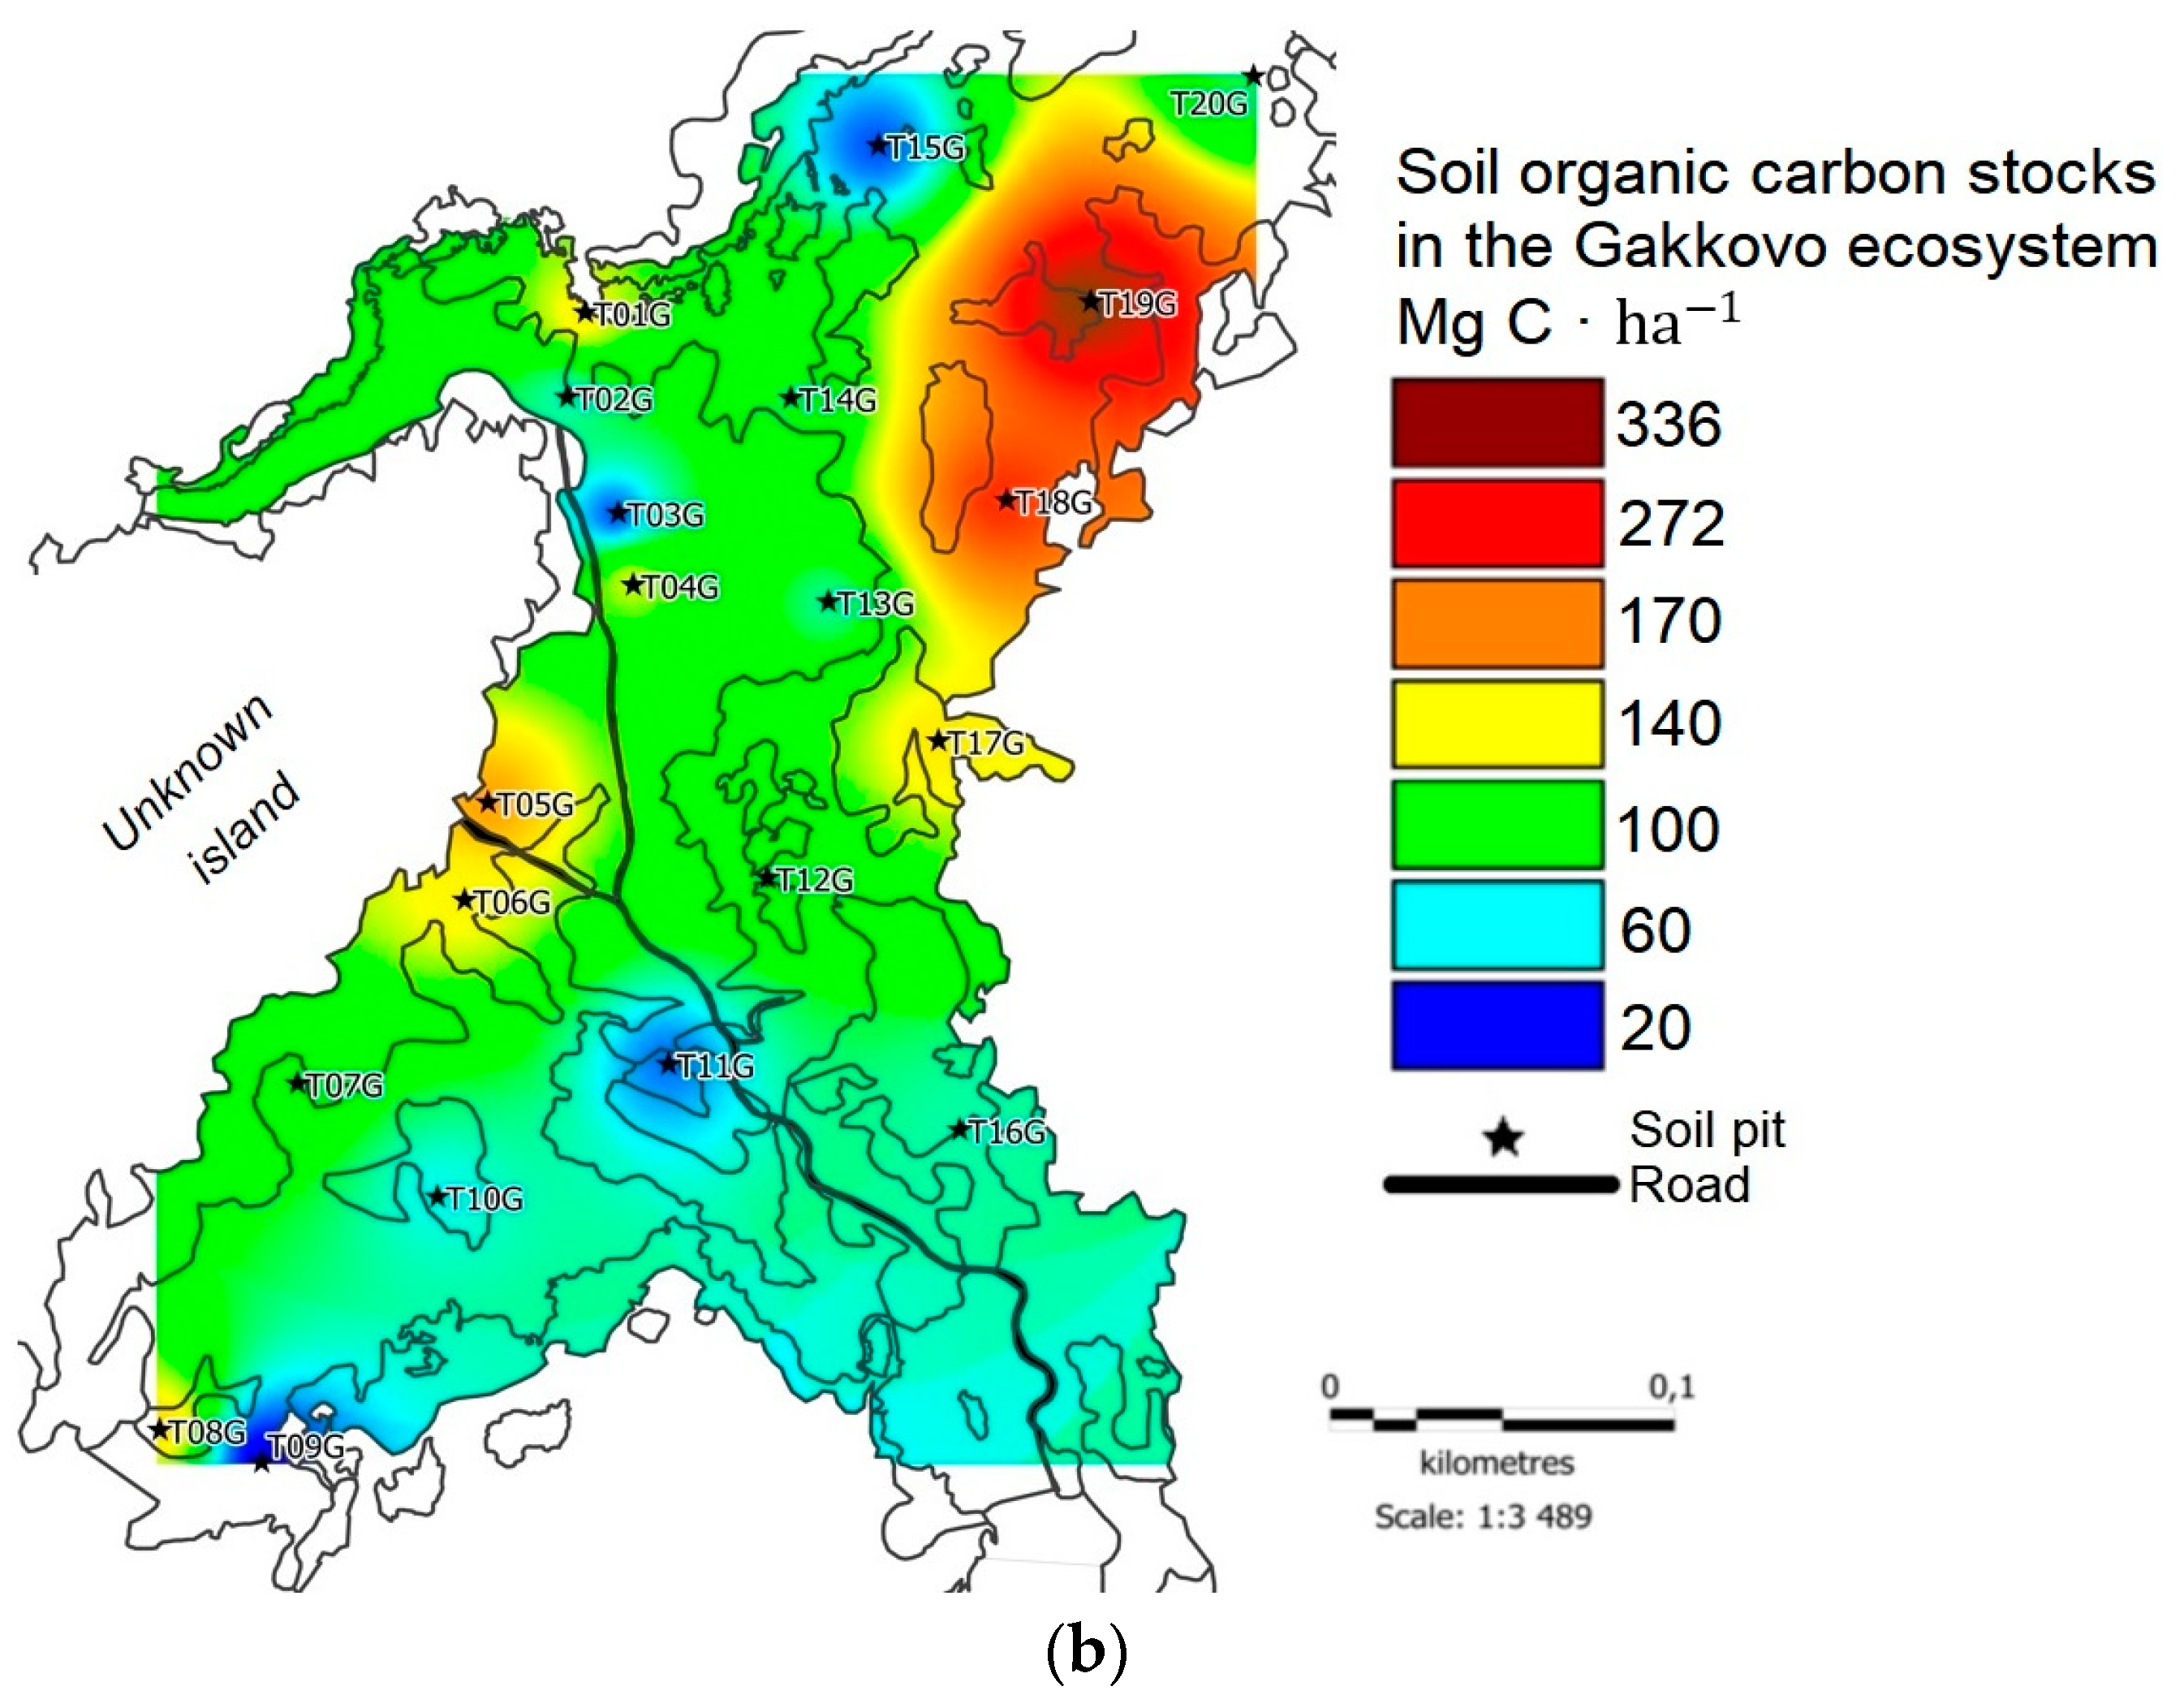
Soils and vegetative cover near the village of Kolezhma resembled soils and plant communities previously described on the other shores of the White Sea [29,30]. The C stock in the soils on the tombolo strongly varied (Figure 4a). The minimum values were recorded at the T17K control point located in the central part of the tombolo (9.63 Mg C·ha-1). This locality was associated with salt puddles formed in the depression in the middle of the tombolo. This area was almost free of vegetation (see Figure 5a) and thus did not receive organic debris. Also, the point T01L on the sandy shore on the northern part of the Lopskiy Island had a low carbon stock (13.29 Mg C·ha-1). The highest values were detected in the southern parts of the plot, especially near the root coast, where forest with arboreal vegetation and dense moss-shrub layer representing zonal vegetation was close to the coastline: T01K – 144.3 Mg C·ha-1, T07K – 140.2 Mg C·ha-1, T08K – 140 Mg C·ha-1, T11K – 142.1 Mg C·ha-1, T13K – 130.3 Mg C·ha-1. On average, soil carbon reserves for the study plot amounted to 71.4 ± 38.2 Mg C·ha-1.
The highest soil С reserves at the site were noted at the T01K control point, which partly confirmed the statement that under the least extreme conditions, C reserves should be higher than in saline environments [21]. Despite the fact that the reserves of plant C at the point T01K were relatively low (on average, 4 ± 0.2 Mg C·ha-1), the C content in the humus horizon was extremely high. The phenomenon could be attributed to the heavy soil texture (silt loam) and redoximorphic conditions even in the areas above the level of daily high tide. Consequently, the rate of organic matter decomposition was low, and humus accumulation occurred. Also, dense roots contributed to organic residue accumulation, as underground biomass is the highest in the least saline areas of the marsh [18]. However, at other control points at the same elevation level of the marsh (T04K and T09K), soil C stocks were lower than in T01K.
Other points with the biggest C reserves were located in areas close to the water edge, where soil salinity was the highest. Elevated C stock in the southern part of the tombolo could result from the influx of allochthonous organic matter from the sea and/or from the continental runoff. A tidal wave might bring particles of marine humus and algae, as observed at the point T11K. Combined with the reduced rates of microbiological decomposition of organic residues, this could lead to increased soil C accumulation. However, the C reserves at the neighboring point T12K, also located near the water’s edge, were only 29.8 Mg C·ha-1 versus 142.1 Mg C·ha-1 at point T11K. The C concentration in the upper soil horizon was more than ten times higher at T11K than at T12K (267.5 vs. 21.6 g·kg-1 C). The phenomenon shows that the augmentation of organic matter is strongly dependent on the geomorphological position. Point T12K was located along the route of tidal flux, while point T11K corresponded to an accumulative position. Also, the difference in C stock was partly due to the difference in soil texture. At the T11K point, the sandy loam surficial layer was only seven centimeters deep and underlain by the silt loam layer. In the T12K point, the entire soil profile had a sandy loam texture that resulted in higher bulk density and consequently greater C stock.
The lowest reserves of soil C were found at the point T17 K = 9.6 Mg C·ha-1. Even despite the heavy texture of soils (silty clay loam), the C content in the soil was extremely low here because there were no significant sources of organic matter. The continental runoff did not reach here; all the organic material carried by the tidal wave settled closer to the coastline. The environmental conditions here were the most extreme, and vegetation could not gain any significant biomass. As a result, this part had the least favorable conditions for C accumulation.

3.1.2. Above-Ground Plant Biomass C Reserves

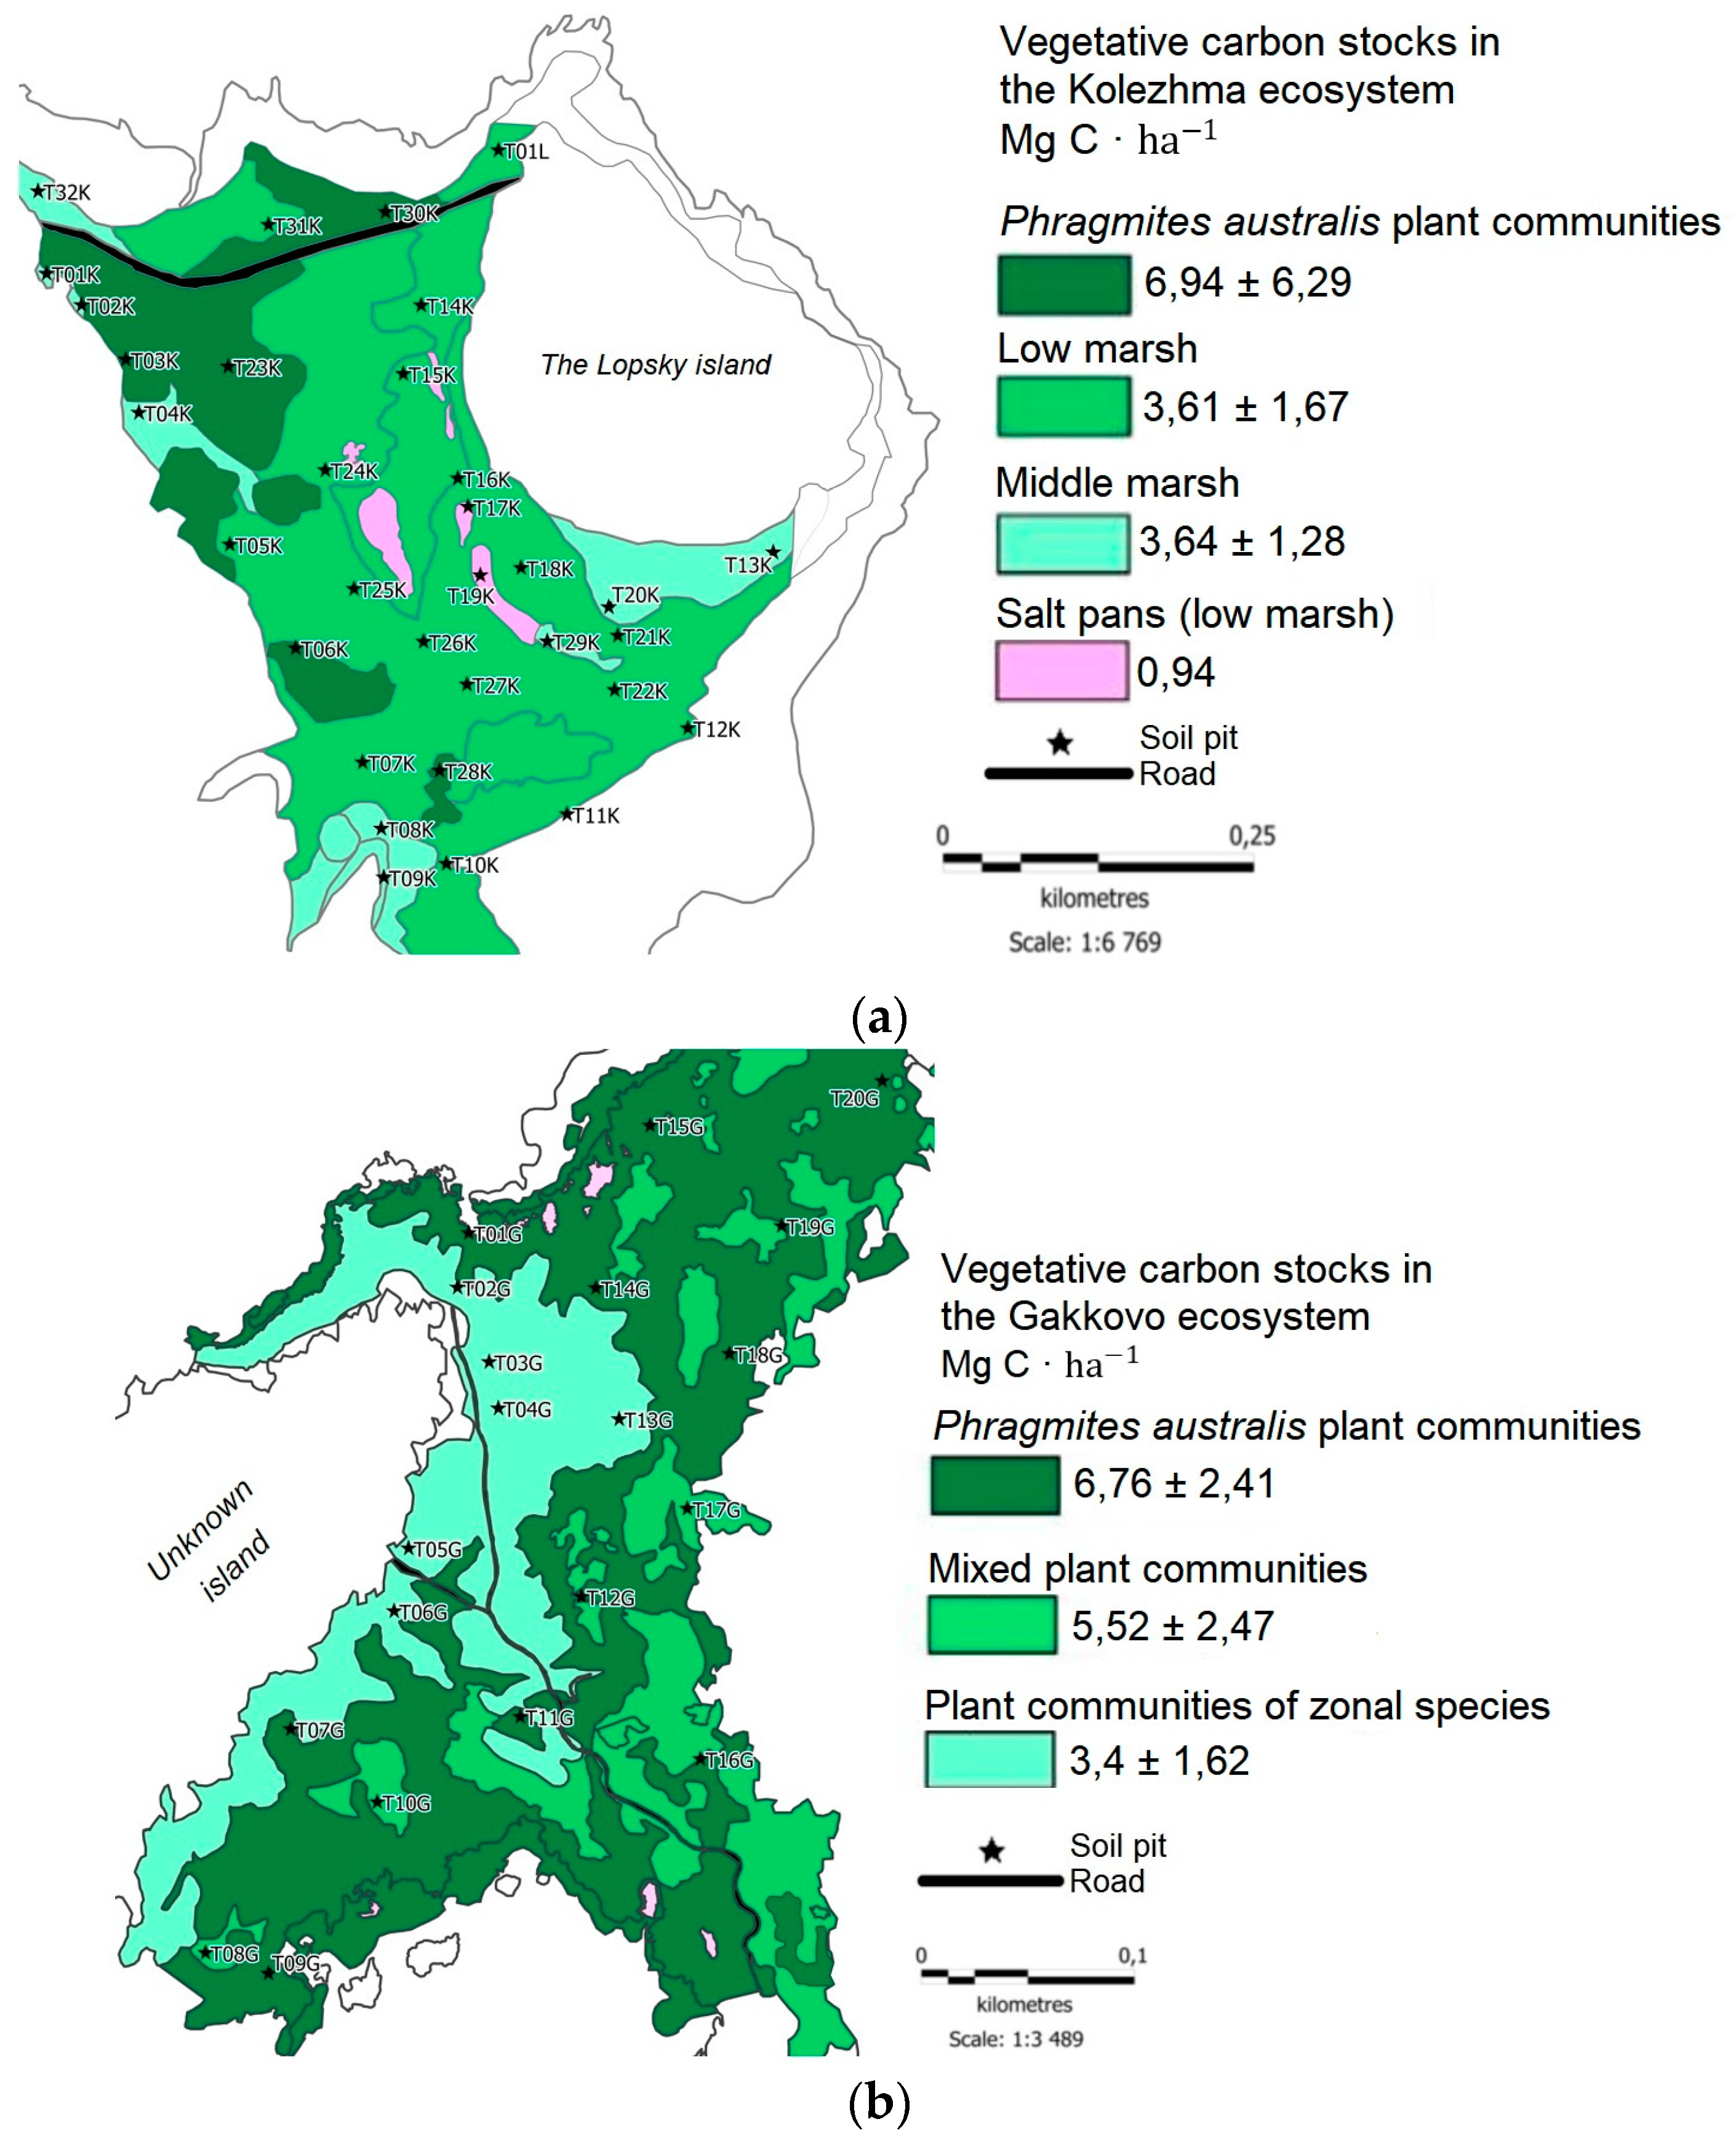
The average reserves of plant C equaled to 3.95 ± 2.42 Mg C·ha-1 at the Kolezhma plot. The highest stocks of C in plant biomass were confined to the territories occupied by P. australis: 6.9 ± 6.3 Mg C·ha-1 (Figure 5a). At the lower and middle levels of the marshes, the reserves were comparable, with a small difference in favor of the lower level: 3.8 ± 1.6 Mg C·ha-1 and 3.6 ± 1.3 Mg C·ha-1, respectively. The lowest values were obtained in the plant communities of salt puddles: 0.09 Mg C·ha-1.
The reserves of plant C at the points T11K and T12K were on average among the highest, excluding reeds, at the Kolezhma site and amounted to 4.1 ± 2 and 4.4 ± 2.1 Mg C·ha-1 correspondingly. The phenomenon was ascribed to low salinity values here a: 10‰ in T11K and 8‰ in T12K against 11‰ on average for the Kolezhma site. Most likely, low salinity was due to the fact that this area was affected by freshwater continental runoff, which flew into the sea through a network of creeks; their role has been described for the marshes of the White Sea previously [31].
The lowest C stock at the Kolezhma plot was confined to the central part of the tombolo, to the territory where salt puddles were common. At the point T17K, the reserves of plant C were 0.94 Mg C·ha-1, which was the absolute minimum for the Kolezhma plot.

3.2. C Stock at the Gakkovo Plot (the Baltic Sea)

3.2.1. Soil С Reserves

At the Gakkovo plot, the average C reserves were 93.4 ± 46.7 Mg C·ha-1, which exceeded those at the Kolezhma plot (Figure 4b). The highest C stock was confined to the central part of tombolo (points T04G – 133.6 Mg C·ha-1, T06G – 143.1 Mg C·ha-1, and T17G – 146.5 Mg C·ha-1) or to the territory near the tidal zone (T01G – 137.7 Mg C·ha-1, T08G – 150.2 Mg C·ha-1); the maximum values were detected at the point T05G – 174.4 Mg C·ha-1. The smallest reserves were found at points located in a narrow tidal zone: T09G (16.8 Mg C·ha-1) and T15G (33.3 Mg C·ha-1).
In general, for the tombolo near the village of Gakkovo, the less the impact of the sea on the territory, the higher the soil C reserves. Paradoxically, the largest reserves were noted in the territory where zonal hygrophytic plant communities were common, despite the fact that zonal species did not gain as much biomass as reeds. We attributed the phenomenon to the fact that the bulk density of topsoil was high under zonal vegetation because the roots of herbaceous species are less voluminous than the roots of reeds. As a result, topsoil with high bulk density formed in the uplifted areas, while under the reed, the topsoil contained massive roots, which decreased the bulk density of the soil and, as a result, C stock.

3.2.2. Plant Biomass C Reserves

The reserves of plant C in the Gakkovo ecosystem are higher than in the Kolezhma vegetation (Figure 5b): the mean values of plant C stock were 5.22 ± 2.51 Mg C·ha-1. The major part of plant C is stored on the territories occupied by communities of P. australis – 6.8 ± 2.4 Mg C·ha-1. The lowest C reserves were recorded in hygrophytic meadows: 3.4 ± 1.6 Mg C·ha-1. In the areas with communities of transitional botanical composition, the C stock in plants was 5.5 ± 2.5 Mg C·ha-1. It is noteworthy that the reserves of plant carbon were also lower in the tidal zone than at a distance from the shoreline: T09G – 5.7 ± 2 Mg C·ha-1, T14G – 7.8 ± 2.7 Mg C·ha-1. Despite the fact that dense thickets of reeds were common almost throughout the territory of the tombolo, P. australis is gaining the best growth parameters at a distance from the sea.
The mean stock of plant С on the tombolo near the village of Gakkovo exceeded the reserves on the tombolo near the village of Kolezhma. In almost the entire territory of the tombolo near Gakkovo, and especially in the areas close to the tidal zone, for example, at the points T01G and T14G, the reed reached about three meters in height. The environmental conditions there were suitable for the growth of hydrophilic species because the territory is moistened and flooded with slightly saline water. Soil reaction varied from slightly acidic to slightly alkaline, which was higher than in zonal soils due to proximity to the sea. All this caused a high biomass at the tombolo.

4. Discussion

4.1. C Stocks of Coastal Ecosystems

According to various estimates, the average global reserves of soil C for marsh ecosystems vary from 162 Mg C·ha-1 [9] to 226 Mg C·ha-1 [1] for the upper meter of the soil profile. At tombolo near the village of Kolezhma, the average values of soil C reserves are significantly lower (71.4 ± 38.2 Mg C·ha-1), as well as at the Gakkovo plot (93.4 ± 46.7 Mg C·ha-1). However, few of the profiles at the experimental plots reach one meter depth in the present study, mostly due to close groundwater table. We decided to limit the estimation of C reserves by to 30 cm like in many other studies of grasslands [32]. We did not detect the presence of buried organic matter-enriched layers that has been previously reported for the marshes of the coast of the Barents Sea [33] and thus accepted the 0-30 cm layer for our study. Recent results found for temperate marshes are comparable with those for the current study: 80.6 ± 43.8 Mg C·ha-1 in North-Western USA [34] and 85 ± 19 Mg C·ha-1 on the Pacific coast of Canada [35]. The soils of temperate inland grassland ecosystems and meadows are reported to contain approximately 55–75 Mg C·ha-1 in the upper 30 cm, i.e., are somewhat poorer in C than marsh soils [36].
The reserves of C incorporated in vegetative biomass varied depending on the plant communities. P. australis is one of the most common invasive species worldwide. The maximum reserves of plant C at both the Kolezhma and Gakkovo plots were found precisely in the territories occupied by reeds: 6.94 ± 6.3 Mg C·ha-1 at the Kolezhma plot and 6.76 ± 2.41 Mg C·ha-1 at the Gakkovo plot. The high value of the standard deviation for the Kolezhma object is due to the fact that some individuals of the reed reached a height of more than 2 m, and some plants were only 30-50 cm in height. The obtained values much lower than those reported for the marshes in New Jersey [37] where the biomass of reeds turned out to be 17 Mg C·ha-1. Most probably, the difference is due to much warmer climatic conditions at the Atlantic coast of the USA than at the coasts of the Baltic and White seas. C reserves in other plant associations, except for communities of P. australis, turned out to be less than the average global carbon reserves on the marshes, but of the same order – 4.3 ± 0.10 Mg C·ha-1 [38].
On most of the Gakkovo site, hygrophytic meadows are formed, only a narrow strip of land near the water’s edge is flooded with brackish sea water. Consequently, the wetland ecosystem occupies an extremely small fraction of the area of the plot. In our case, taking into account the very large biomass and significant moisture content of the territory, soil C reserves are high, even despite the light texture of the soils.
The average reserves of plant C on tombolo near the village of Gakkovo exceed the reserves on tombolo near the village of Kolezhma. This is due to the fact that thalassogenic factors have minimal impact on the Gakkovo ecosystem. The fact that the climate in the Baltic is milder than in the White Sea also plays a role. This is expressed, in particular, in higher air temperatures on the southern shores of the Gulf of Finland, compared with temperatures on the Pomor coast of the White Sea (see Figure 2). As a result, the most favorable conditions for the recruitment of biomass by vegetation are formed on the Gakkovo plot. In general, reed, being an intrazonal hygrophytic species, introduces uncertainty into the assessment of carbon reserves in plant biomass and soil. Its expansion somewhat negates the differences that could be in carbon reserves due to differences in salinity, heat availability and other biogeographic patterns. It is important to note that the distribution of P. australis is very dynamic. When we returned to the same plots for additional sampling three years after the beginning of the research, reeds invaded a significant part of the tombolos, replacing other meadow plan communities. Maybe, quick distribution of this species does not allow establishing a clear relation between soil C and plant biomass.

4.2. The Role of Allochthonous C

Organic matter introduced by terrigenous runoff and tidal waves plays an important role in the C cycle of the tombolo ecosystem near the village of Kolezhma. At the Gakkovo plot, the tidal activity was low and consequently the contribution of allochthonous material was less significant. Allochthonous organic material coming from the continent, as a rule, is more stable and mineralizes more slowly than autochthonous [39]. There are studies that show that the organic carbon content is significantly higher at the marshes where fresh continental runoff enters, therefore, there is a higher content of allochthonous organic matter, which decomposes more slowly [40].
Creeks contribute to the distribution of water and solid material on marshes [13,31]. Through the creeks, a tidal wave can penetrate into territories remote from the sea, while carrying a certain amount of mineral and organic material. This material settles along the way, thereby replenishing carbon reserves in adjacent territories. At the same time, creeks also contribute to the leaching of mineral and autochthonous organic substances from the nearby soil, as well as lead to soil erosion and the volatilization of CO2 from the substrate, that is, their contribution to the carbon cycle is quite twofold [41].
In our case, the contribution of allochthonous organic matter is quite evident at the Kolezhma plot, where the distribution of soil organic C followed the main direction of the tidal wave.

4.3. Ecosystem Services of Coastal Wetlands

The assessment of the ecosystem services for marshes turns to be a complicate d task because of the lack of uniform methodology [42]. The accumulation of C in biomass and soil organic matter seems to be an evident measure of the services provided by these ecosystems. Marshes overgrown with P. australis are the most promising C pool, because reeds, as a rule, gain much more biomass than herbaceous species. And in general, according to other studies, the reserves of not only plant, but also soil carbon increase with the invasion of reeds on marshes [43]. The results obtained in the course of this study demonstrate that the reserves of plant carbon are indeed greater in reed beds than in meadows of native species. Reeds is gaining huge terrestrial and underground biomass, and its organic residues are characterized by slow rates of mineralization, which favors an increase in carbon reserves [43].
However, the invasion of P. australis on the marshes causes concern, since reeds lead to the removal of native coastal species from their habitat. The contribution to maintaining biodiversity is one of the most important services provided by wetlands [42]. The assessment of ecosystem services through C sequestration is popular, because it allows simple transfer to monetary value, while the contribution of biodiversity to the natural capital is difficult to evaluate [44]. However, the increase in biomass on the account of species diversity can be hardly considered to be beneficial. Also, the results of the current study do not show an increase in soil carbon reserves especially in the areas with strong impact of the sea on the reed.

Author Contributions

Conceptualization, P.K. and M.T.; methodology, P.K.; investigation, I.B., I.K., K.T., A.B. and I.I.; data curation, I.B. and M.T.; writing—original draft preparation, I.B.; writing—review and editing, P.K., L.X., J.C.; visualization, I.B. All authors have read and agreed to the published version of the manuscript.

Funding

This research was funded by the Russian Science Foundation, grant numbers 23-67-10006 «“Blue carbon” stock and dynamics of the sea coasts of the western sector of the Russian Arctic» (field work and writing) and 22-27-00420 «Sulfide accumulation and oxidation in marsh soils on the coasts of the White and Baltic seas» (chemical analyses).

Data Availability Statement

The data presented in this study are available on request from the corresponding author. The data are not publicly available until the finalization of the project.

Acknowledgments

We acknowledge kind assistance of the local authorities of the fishery enterprise in the remote village Kolezhma, especially to Mr. Vladimir Kochin. Also, we would like to acknowledge the contribution of Dr. Zemfira Tyugay, Senior Research Officer of the Faculty of Soil Science of the Lomonosov Moscow State University who supervised for organic C analysis conducted by I.B.

Conflicts of Interest

The authors declare no conflict of interest.

References

  1. IPCC. Climate Change 2007. Synthesis Report. Contribution of Working Groups I, II & III to the Fourth Assessment Report of the Intergovernmental Panel on Climate Change, IPCC: Geneva, Switzerland, 2007. [CrossRef]
  2. Mcleod, E., Chmura, G.L., Bouillon, S., Salm, R., Björk, M., Duarte C.M., Lovelock, C.E., Schlesinger, W.H., Silliman, B.R. A blueprint for blue carbon: toward an improved understanding of the role of vegetated coastal habitats in sequestering CO2. Front. Ecol. Environ 2011, 9, 552–560. [CrossRef]
  3. Lovelock, C.E., Reef, R., Variable impacts of climate change on blue carbon. One Earth, 2020, 3, 195–211. [CrossRef]
  4. Nellemann, C. Nellemann, C., Corcoran, E., Duarte, C. M., Valdés, L., De Young, C., Fonseca, L., Grimsditch, G. (Eds). Blue Carbon. A Rapid Response Assessment. United Nations Environment Programme. Birkeland Trykkeri AS: Arendal, Norway, 2009; 78 p.
  5. Ouyang X., Lee S. Y. Carbon accumulation rates in salt marsh sediments suggest high carbon storage capacity. Biogeosciences Discuss. 2013, 10, 19155–19188. [CrossRef]
  6. Chmura, G. L., Anisfeld, S. C., Cahoon, D. R., Lynch, J. C. Global carbon sequestration in tidal, saline wetland soils. Global Biogeochem. Cycles 2003, 17, 22-1–22-11. [CrossRef]
  7. Roulet, N.T. Peatlands, carbon storage, greenhouse gases, and the Kyoto Protocol: Prospects and significance for Canada. Wetlands 2000, 20, 605–615. [Google Scholar] [CrossRef]
  8. Kennedy, H., Beggins, J., Duarte, C. M., Fourqurean, J. W., Holmer, M., Marbà, N., Middelburg, J. J. Seagrass sediments as a global carbon sink: Isotopic constraints. Global Biogeochem. Cycles 2010, 24, GB4026, 1-8. [CrossRef]
  9. Duarte, C. M., Losada, I. J., Hendriks, I. E., Mazarrasa, I., Marbà, N. The role of coastal plant communities for climate change mitigation and adaptation. Nature Climate Change 2013, 3, 961–968. [CrossRef]
  10. Rossi, A.M., Rabenhorst, M.C. Pedogenesis and landscape relationships of a Holocene age barrier island. Geoderma 2016, 262, 71–84. [CrossRef]
  11. Kristensen, E., Bouillon, S., Dittmar, T., Marchand, C. Organic carbon dynamics in mangrove ecosystems: a review. Aquatic Botany 2008, 89, 201–219. [CrossRef]
  12. Craft, C. Freshwater input structures soil properties, vertical accretion, and nutrient accumulation of Georgia and US tidal marshes. Limnology and oceanography 2007, 52, 1220–1230. [Google Scholar] [CrossRef]
  13. Chapman, V. J. Salt Marshes and Salt Deserts of the World. Leonard Hill Limited: London, UK, 1960. 392 p.
  14. Pennings, S. C., Bertness, M. D. Chapter 11. Salt marsh communities. In Marine Community Ecology. Sinauer Associates: Sunderland, Mass. 2001. pp. 289-316.
  15. Zhang, M., Ustin, S., Rejmankova, E., Sanderson, E. Monitoring Pacific coast salt marshes using remote sensing. Ecological Applications 1997, 7, 1039–1053. [CrossRef]
  16. de Leeuw, J., van den Dool, A., de Munck, W. Factors influencing the soil salinity regime along an intertidal gradient. Estuarine, Coastal and Shelf Sci. 1991, 32, 87–97. [CrossRef]
  17. Huckle, J.M., Potter, J.A., Marrs, R. Influence of environmental factors on the growth and interactions between salt marsh plants: effects of salinity, sediment and waterlogging. J. Ecol. 2000, 88, 492–505. [CrossRef]
  18. Craft, C. Freshwater input structures soil properties, vertical accretion, and nutrient accumulation of Georgia and US tidal marshes. Limnology and oceanography 2007, 52, 1220–1230. [Google Scholar] [CrossRef]
  19. Hwan Bang, J., Bae, M., Ju Lee, E. Plant distribution along an elevational gradient in a macrotidal salt marsh on the west coast of Korea. Aquatic Botany 2019, 147, 52–60. [CrossRef]
  20. Crain, C.M., Silliman, B.R., Bertness, S.L., Bertness, M.D. Physical and biotic drivers of plant distribution across estuarine salinity gradients. Ecology 2004, 85, 2539–2549. [CrossRef]
  21. Williams A. K., Rosenheim B. E. What happens to soil organic carbon as coastal marsh ecosystems change in response to increasing salinity? An exploration using ramped pyrolysis. Geochemistry, Geophysics, Geosystems 2015, 16, 2322–2335. [CrossRef]
  22. Kelleway, J.J., Saintilan, N., Macreadie, P.I., Ralph, P.J. Sedimentary factors are key predictors of carbon storage in SE Australian saltmarshes. Ecosystems 2016, 19, 865–880. [CrossRef]
  23. Ford, H., Garbutt, A., Duggan-Edwards, M., Pagès, J.F., Harvey, R., Ladd, C., Skov, M.W. Large-scale predictions of salt-marsh carbon stock based on simple observations of plant community and soil type. Biogeosciences 2019, 16, 425–436. [CrossRef]
  24. Sidorova, V.A., Svyatova, E.N., Tseits, M.A. Spatial variability of the properties of marsh soils and their impact on vegetation. Eurasian Soil Sci. 2015, 48, 223–230. [CrossRef]
  25. Sousa, A.I., Santos, D.B., Silva, E.F.D., Sousa, L.P., Cleary, D.F., Soares, A.M., Lillebø, A.I. ‘Blue carbon’ and nutrient stocks of salt marshes at a temperate coastal lagoon (Ria de Aveiro, Portugal). Scientific Reports 2017, 7, 41225. [CrossRef]
  26. Bagdasarov, I.E., Tseits, M.A., Kryukova, Y.A., Taskina K.B., Konyushkova M.V. A comparative characterization of the soils and plant cover of tombolos on the coasts of the White and Baltic Seas. Moscow Univ. Soil Sci. Bull. 2023, 78, 1–12. [CrossRef]
  27. IUSS Working Group WRB. World Reference Base for Soil Resources 2014. International soil classification system for naming soils and creating legends for soil maps. World Soil Resources Reports, Rome: FAO, 2014, no. 106.
  28. Howard, J., Hoyt, S., Isensee, K., Telszewski, M., Pidgeon, E. (Eds.) Coastal Blue Carbon: Methods for Assessing Carbon Stocks and Emissions Factors in Mangroves, Tidal Salt Marshes, and Seagrasses. Arlington, VA, USA: Conservation International, Intergovernmental Oceanographic Commission of UNESCO, International Union for Conservation of Nature, 2014; 180 p.
  29. Tseits, M.A., Dobrynin, D.V. Morphogenetic diagnostics and classification of tidal marsh soils in Karelia (White Sea Coast). Eurasian Soil Sci. 1997, 30, 352–358.
  30. Oreshnikova, N.V., Krasilnikov, P.V., Shoba, S.A. Marsh soils of the Karelian shore of the White Sea. Moscow Univ. Soil Sci. Bull. 2012, 67, 152–158. [CrossRef]
  31. Tseits, M.A., Marechek, M.S., The formation of soil cover patterns on tidal marshes of the Arctic of Russia. Moscow Univ. Soil Sci. Bull. 2021, 76, 273–282. [CrossRef]
  32. Bartholomée, O., Grigulis, K., Colace, M. P., Arnoldi, C., Lavorel, S. Methodological uncertainties in estimating carbon storage in temperate forests and grasslands. Ecological Indicators, 2018, 95, 331–342. [CrossRef]
  33. Shamrikova, E.V., Deneva, S.V., Kubik, O.S. Spatial patterns of carbon and nitrogen in soils of the Barents Sea coastal area (Khaypudyrskaya Bay). Eurasian Soil Sci., 2019, 52, 507–517. [CrossRef]
  34. Crooks, S., Rybczyk, J., O’Connell, K., Devier, D.L., Poppe, K., Emmett-Mattox, S. Coastal Blue Carbon Opportunity Assessment for the Snohomish Estuary: The Climate Benefits of Estuary Restoration. Report by Environmental Science Associates, Western Washington University, EarthCorps, and Restore America’s Estuaries, 2014; 102 p.
  35. Chastain S. G., Kohfeld K., Pellatt M. G. Carbon stocks and accumulation rates in salt marshes of the Pacific coast of Canada. Biogeosciences Discussions 2018, 1–45. [CrossRef]
  36. Eze, S., Palmer, S. M., Chapman, P. J. Soil organic carbon stock in grasslands: Effects of inorganic fertilizers, liming and grazing in different climate settings. Journal Environ. Manag., 2018, 223, 74–84. [CrossRef]
  37. Tripathee R., Schäfer K.V.R. Above-and belowground biomass allocation in four dominant salt marsh species of the eastern United States. Wetlands, 2015, 35, 21–30. [CrossRef]
  38. Alongi, D.M. Carbon balance in salt marsh and mangrove ecosystems: A global synthesis. J. Marine Sci. Engineering, 2020, 8, 767. [Google Scholar] [CrossRef]
  39. Omengo, F.O., Geeraert, N., Bouillon, S., Govers, G. Deposition and fate of organic carbon in floodplains along a tropical semiarid lowland river (Tana River, Kenya). Journal of Geophysical Research: Biogeosciences 2016, 121, 1131–1143. [CrossRef]
  40. Van de Broek, M., Temmerman, S., Merckx, R., Govers, G. Controls on soil organic carbon stocks in tidal marshes along an estuarine salinity gradient. Biogeosciences 2016, 13, 6611–6624. [CrossRef]
  41. Santos, I.R., Maher, D.T., Larkin, R., Webb, J.R., Sanders, C.J. Carbon outwelling and outgassing vs. burial in an estuarine tidal creek surrounded by mangrove and saltmarsh wetlands. Limnology and Oceanography, 2019, 64, 996–1013. [CrossRef]
  42. Xu, X., Chen, M., Yang, G., Jiang, B., Zhang, J. Wetland ecosystem services research: A critical review. Global Ecol. Conserv., 2020, 22, e01027. [CrossRef]
  43. Windham, L., Weis, J.S., Weis, P. Metal dynamics of plant litter of Spartina alterniflora and Phragmites australis in metal-contaminated salt marshes. Part 1: Patterns of decomposition and metal uptake. Environ. Toxicology and Chemistry, 2004, 23, 1520–1528. [CrossRef]
  44. Meraj, G., Singh, S. K., Kanga, S., Islam, M. N. Modeling on comparison of ecosystem services concepts, tools, methods and their ecological-economic implications: A review. Modeling Earth Systems and Environment, 2022, 8, 1–20. [CrossRef]
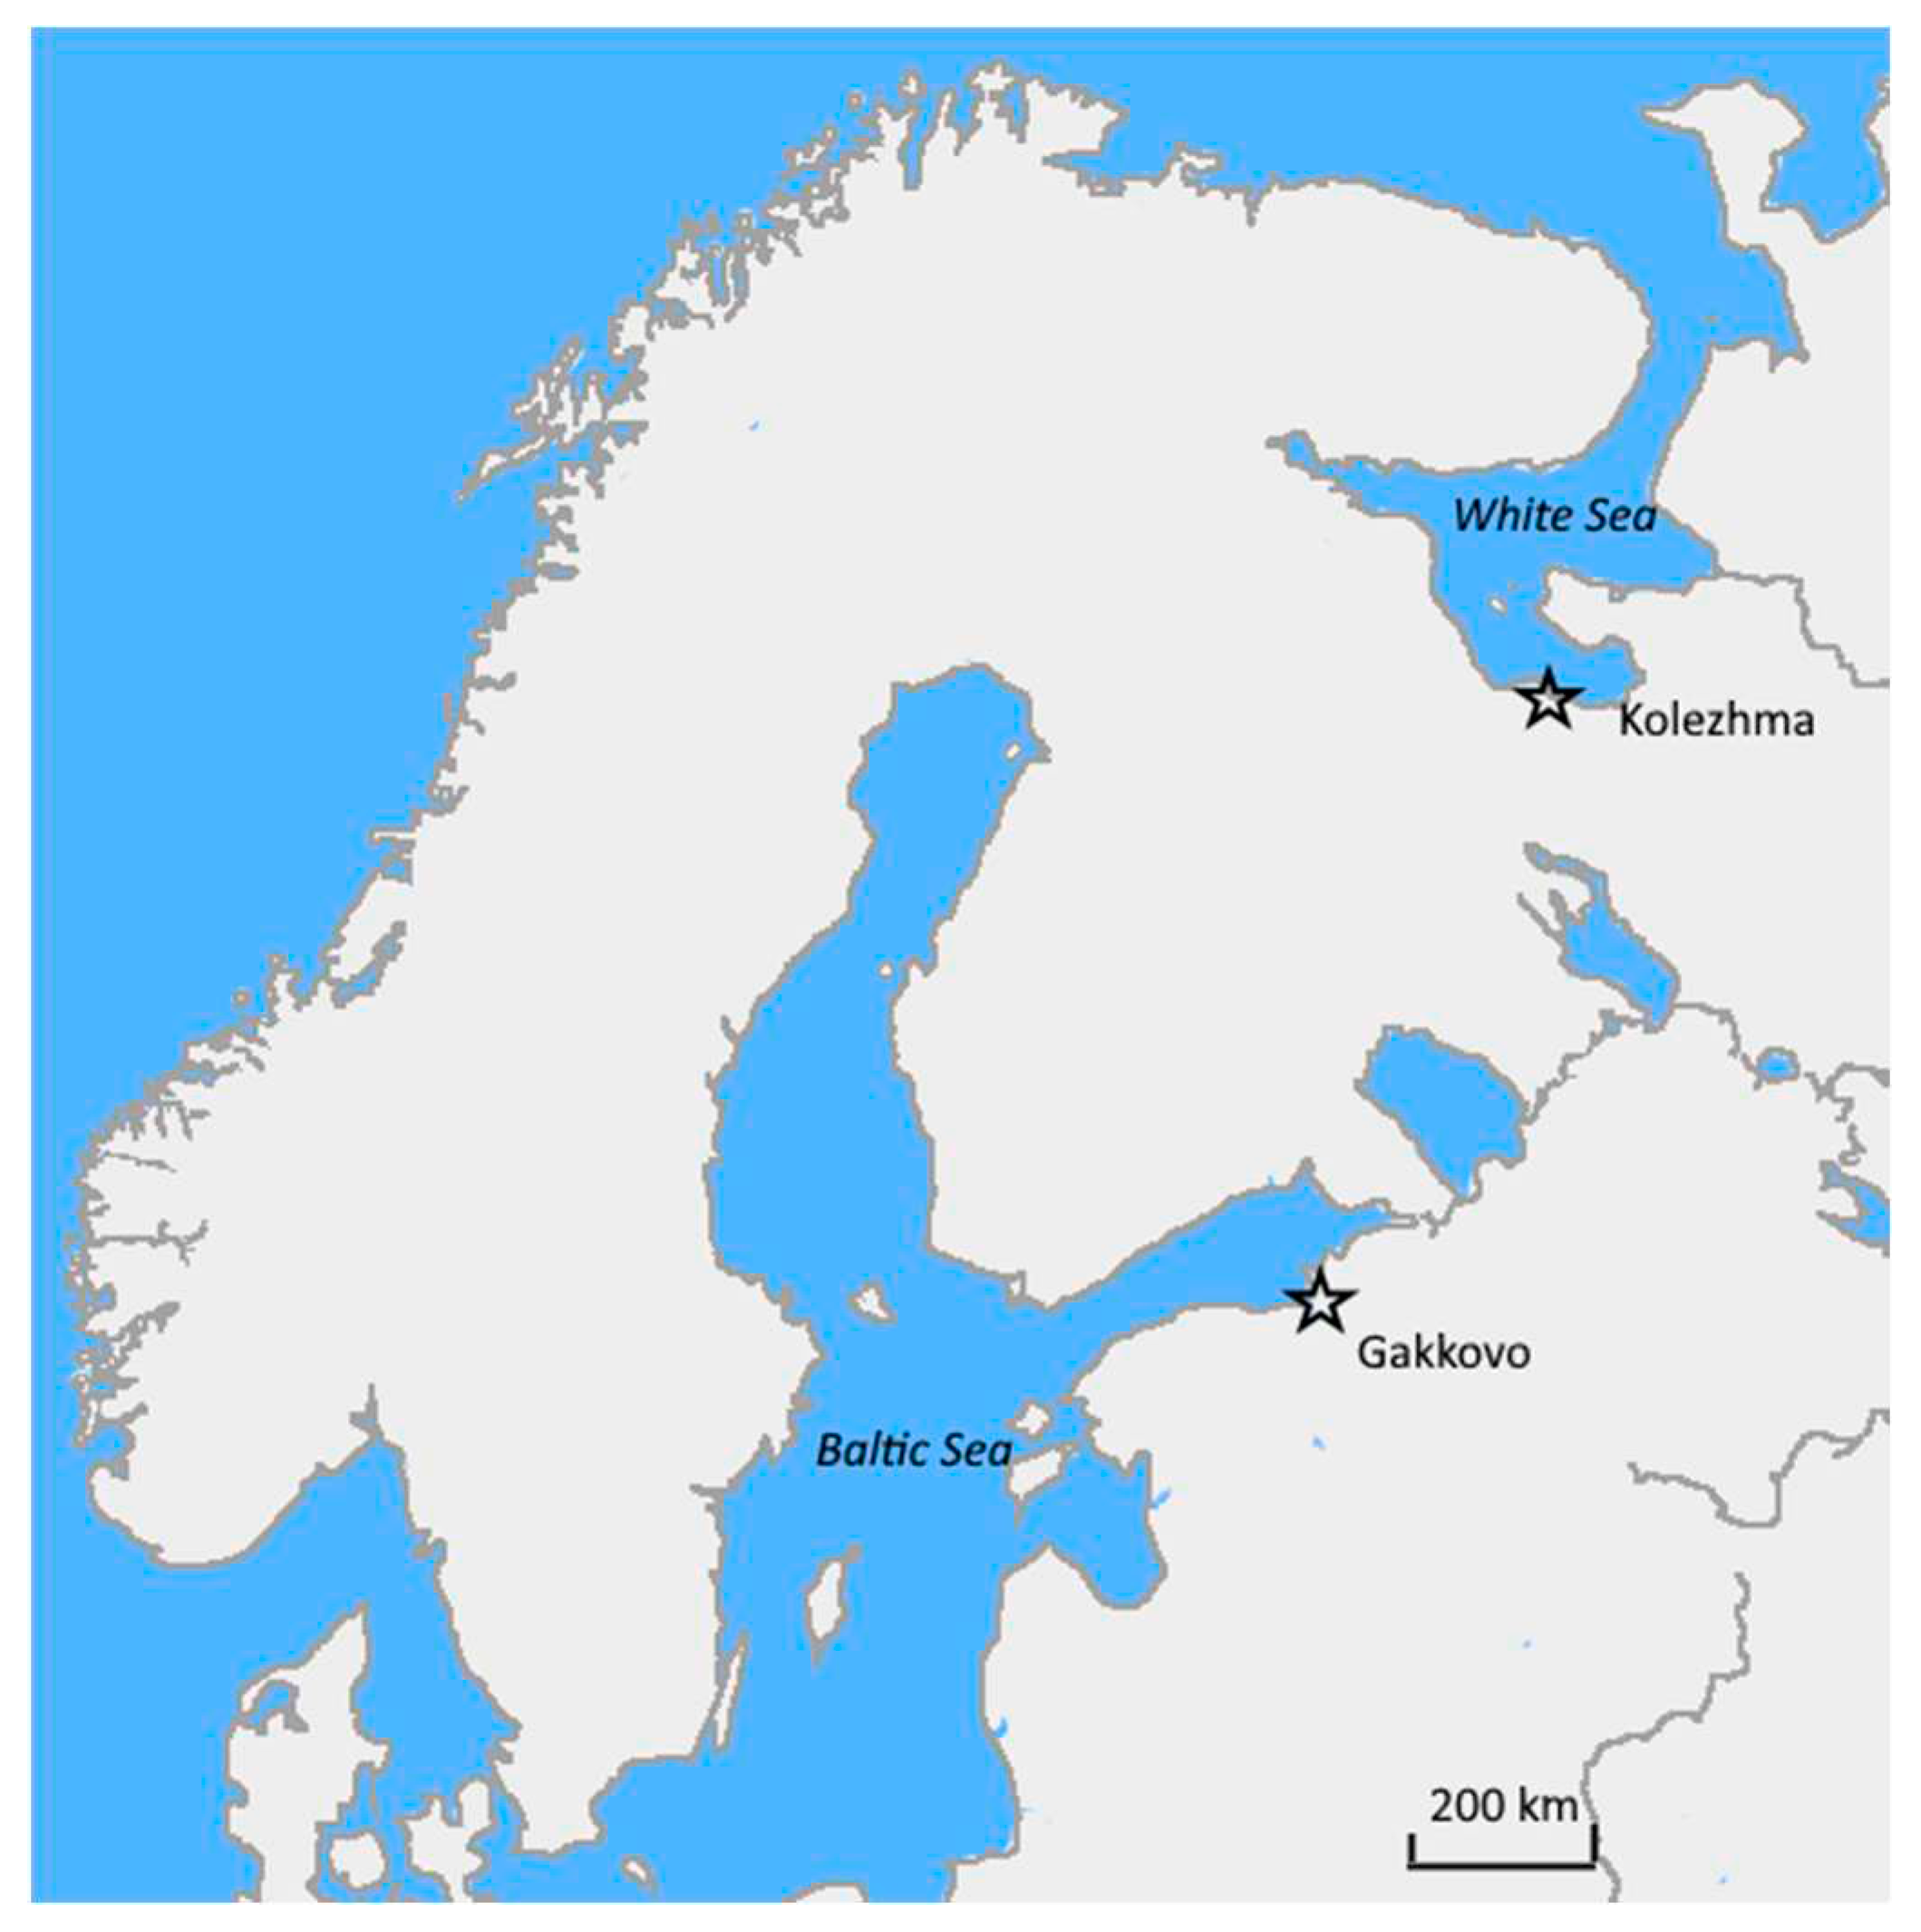
Figure 1. The location of the study plots: Gakkovo (59°40′ N 28°01′ E) and Kolezhma (64°13′ N 35°55′ E).
Preprints 91600 g001
Figure 2. Climatic diagrams of the study sites: a) Gakkovo, b) Kolezhma. Columns show monthly precipitation, line shows mean monthly temperatures.
Preprints 91600 g002
Figure 3. Vegetative communities of the studied tombolos, with the indication of sampling sites: (a) Kolezhma plot; (b) Gakkovo plot. Modified after [26] with permission.
Preprints 91600 g003aPreprints 91600 g003b
Figure 4. C stock in soils, Mg C·ha-1: (a) Kolezhma plot; (b) Gakkovo plot.
Preprints 91600 g004aPreprints 91600 g004b
Figure 5. C stock in plant biomass, Mg C·ha-1: (a) Kolezhma plot; (b) Gakkovo plot.
Preprints 91600 g005
Disclaimer/Publisher’s Note: The statements, opinions and data contained in all publications are solely those of the individual author(s) and contributor(s) and not of MDPI and/or the editor(s). MDPI and/or the editor(s) disclaim responsibility for any injury to people or property resulting from any ideas, methods, instructions or products referred to in the content.
Copyright: This open access article is published under a Creative Commons CC BY 4.0 license, which permit the free download, distribution, and reuse, provided that the author and preprint are cited in any reuse.
Prerpints.org logo

Preprints.org is a free preprint server supported by MDPI in Basel, Switzerland.

Subscribe

© 2024 MDPI (Basel, Switzerland) unless otherwise stated