1. Introduction
Solar-induced chlorophyll fluorescence (SIF) was considered to be an ideal proxy for gross primary production (GPP), because it is directly related to vegetation photosynthesis [
1,
2,
3]. The recent progress in remote sensing techniques and retrieval algorithms has enabled different kinds of satellite SIF products such as GOSAT [
4], OCO-2 [
5], TanSat [
6], and TROPOMI [
7] SIF products, which provide an unprecedented opportunity for large-scale monitoring of SIF and diverse applications in climate, biogeochemical cycle, and Earth system science [
8]. Nevertheless, due to the errors in processing raw data to radiance units and the limitations of the SIF retrieval algorithm, satellite SIF product inevitably suffers from errors. Hence, it is a necessity to validate the accuracy of satellite SIF products to tell end-users their feasibility in various applications [
9].
In previous years, the accuracy of satellite SIF products was generally evaluated indirectly through the cross-comparison with similar satellite-based SIF or vegetation index (VI) or eddy covariance (EC) GPP products [
1,
10,
11,
12]. However, this kind of validation can merely identify the consistency or disagreement between these products, which cannot reveal the true accuracy of satellite SIF products. Direct validation based on in-situ based SIF measurements is still a necessity to fully understand the performance of satellite SIF products. It has been well acknowledged that the direct validation of satellite SIF products based on in-situ SIF measurements is challenged by the uncertainties related to the in-situ measuring system, the spatial scale mismatch between in-situ and satellite-based SIF measurements, spectral difference, and retrieval algorithms. By addressing these challenges, Du et al. [
13] conducted a direct validation of the TROPOMI SIF product based on a sufficient in-situ SIF database. However, the influence of the geolocation mismatch between the validation pixel and reference data on validation results has not been recognized.
Within the direct validation framework, the validation pixel generally refers to the satellite pixel containing in-situ measurements. The reference data for validation is generally obtained within the nominal spatial extent of the validation pixel from in-situ observations through either upscaling or spatial representativeness assessment [
14,
15]. Nevertheless, the validation pixel may suffer from geometric errors and deviate from its nominal location. Then the signal of the validation pixel may come from a different area instead of its nominal location, resulting in inherent incompatibilities [
16]. The geolocation mismatch between the validation pixel and reference data will introduce large uncertainty to the validation results, especially for validation pixels covering heterogeneous areas [
17]. This kind of uncertainty obscures the true accuracy of satellite SIF products. Hence, it is necessary to quantify the uncertainty caused by the geolocation mismatch between the validation pixel and reference data.
This study makes the first attempt to quantitatively identify the geolocation shift of satellite SIF products and quantify the magnitude of uncertainty caused by geolocation mismatch between validation pixel and reference data. Among the various kinds of spaceborne SIF products, the TROPOMI SIF product has been identified as the one with the highest potential due to its relatively high spatial resolution (3.5 km × 7.5/5.5 km at the nadir) and wide swath (~2600 km) [
7]. Hence, it was selected to conduct the analysis. The findings in this study are expected to improve the strictness and reliability of validation results of satellite SIF products.
2. Methods
The purpose of this study is to quantify the uncertainty caused by the geolocation errors of the validation pixel. To achieve this goal, the geolocation shift of the validation pixel should be first identified. It is generally well known that satellite products have been geometrically corrected with errors less than 0.5 pixels [
16,
18]. However, the geometric correction was generally carried out on the satellite image level instead of pixel level. When it comes to a specific pixel, we do not know its exact geolocation error and how it shifts. In response to this challenge, a pixel-based geometric location matching method [
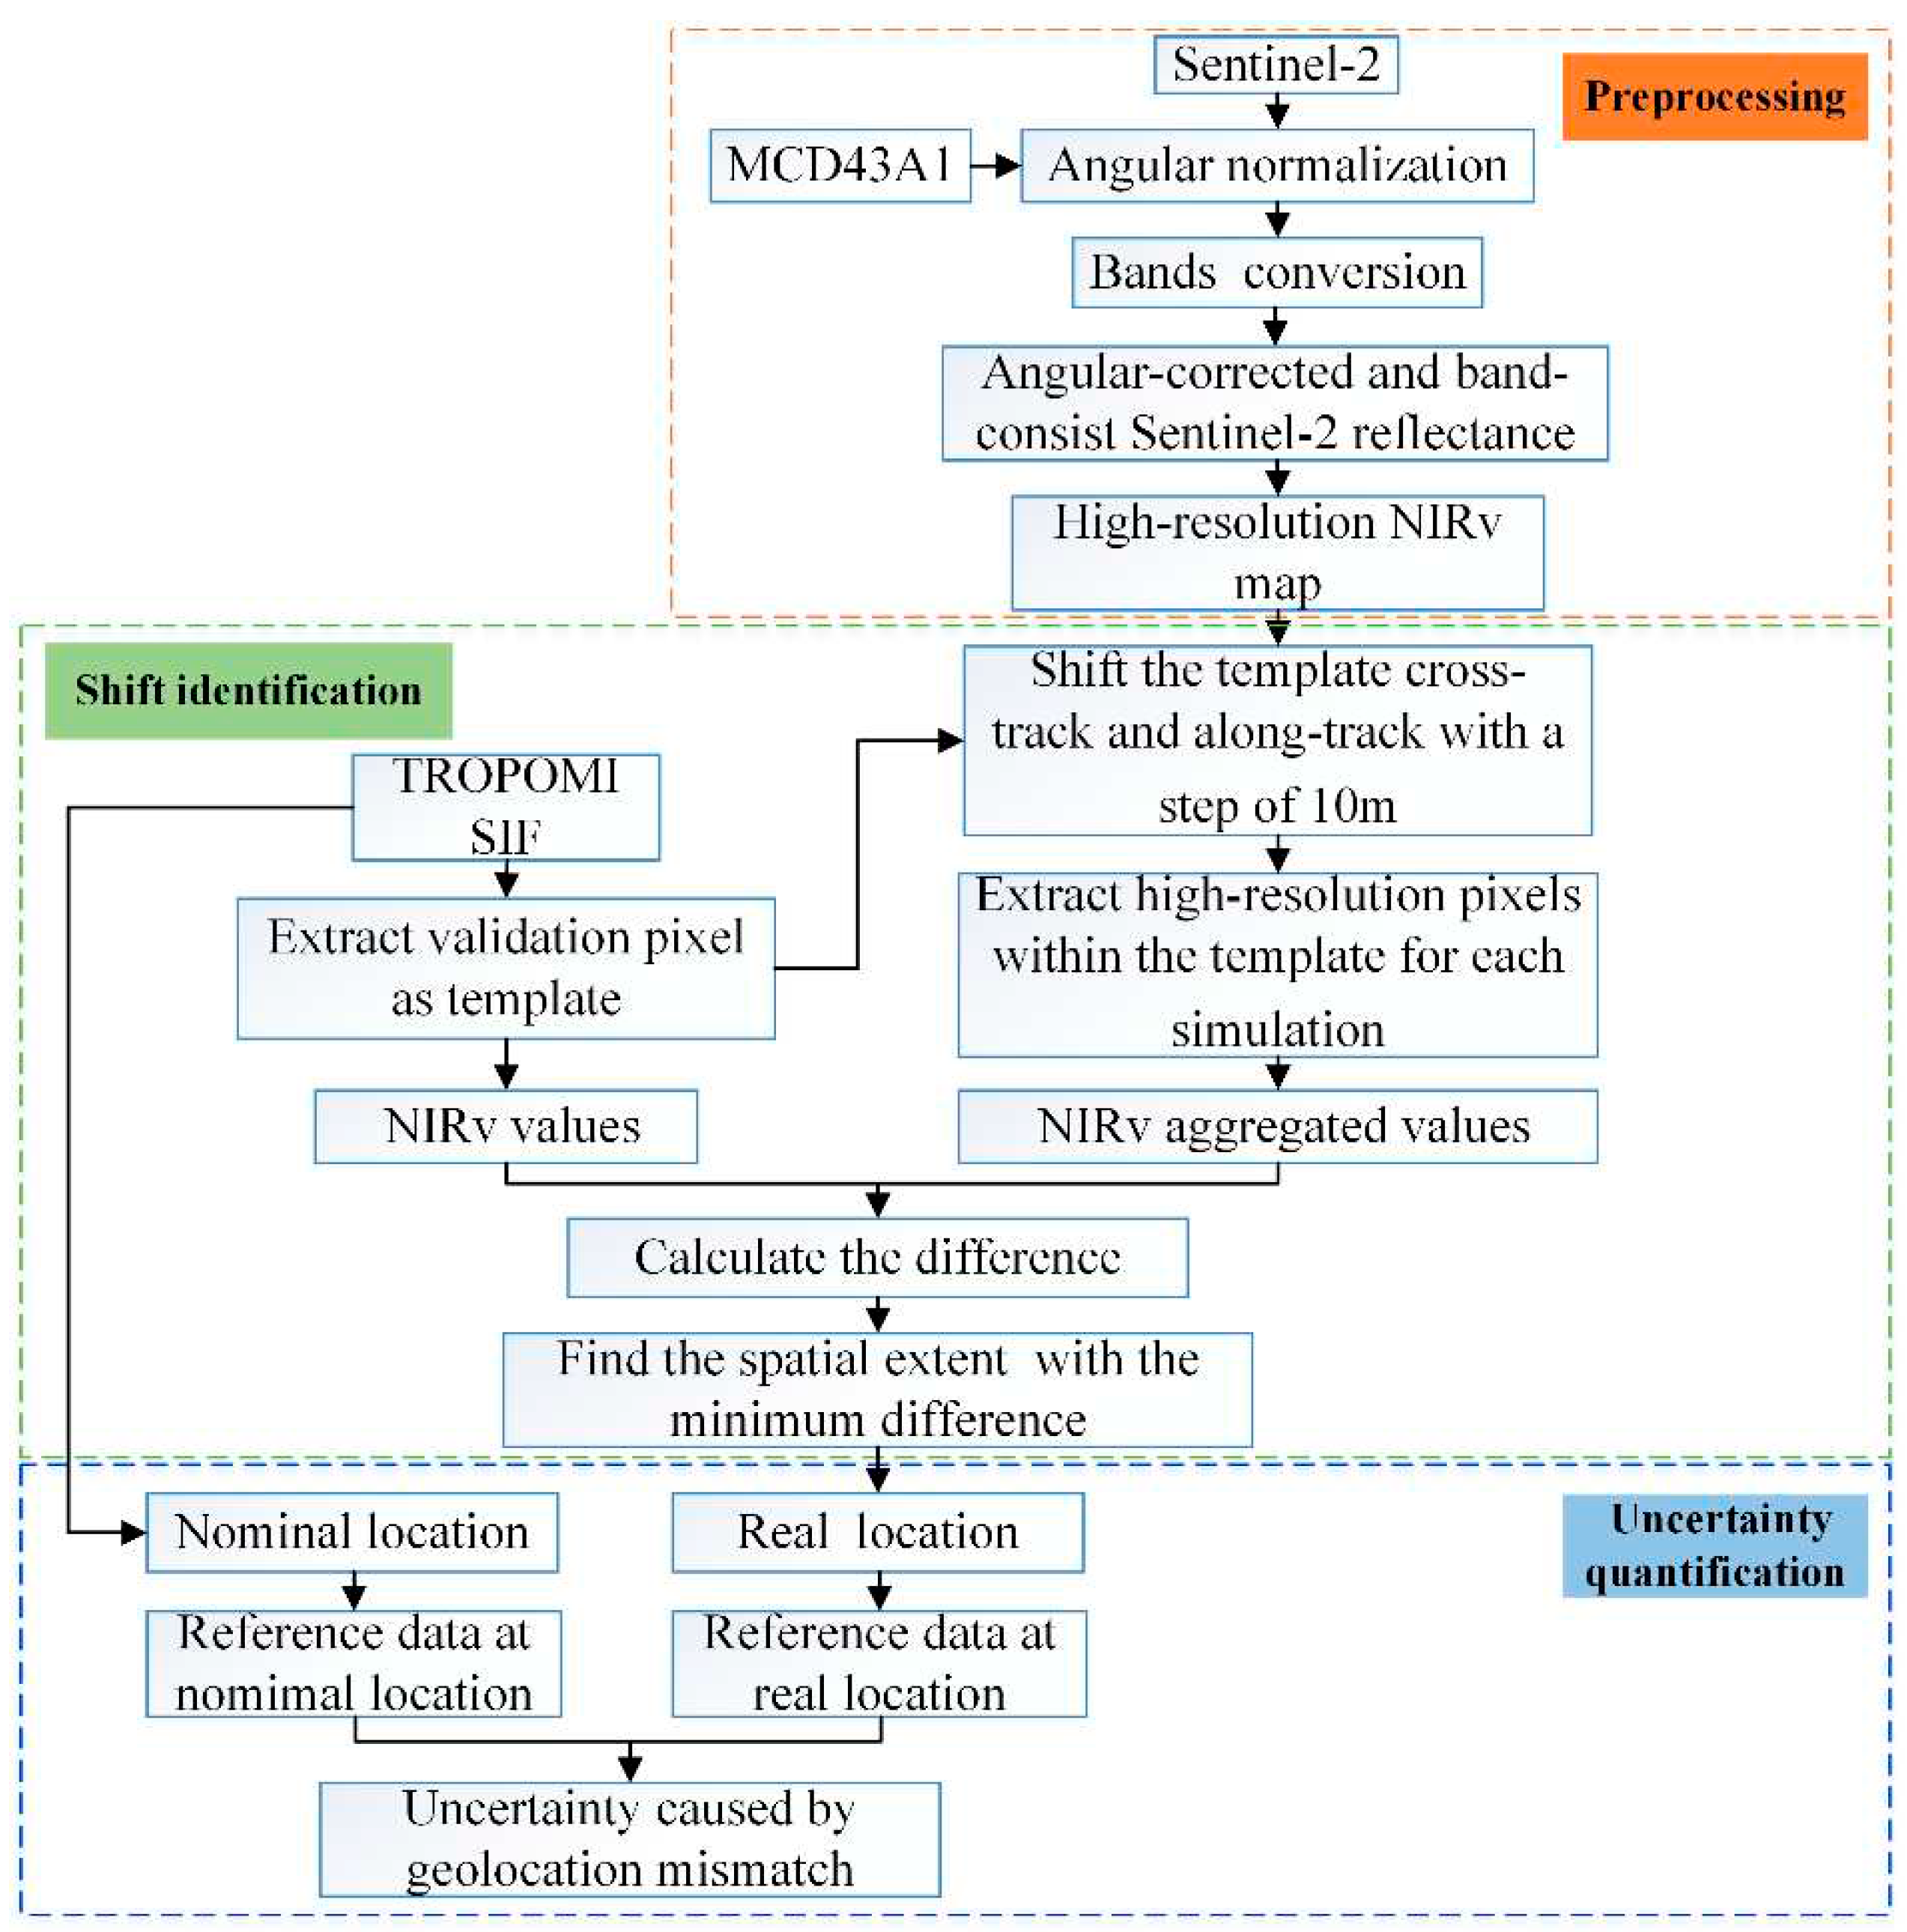
17] was introduced here to identify the geolocation shift of the TROPOMI SIF validation pixel. The basic idea of this method is to simulate the shift in the along-track and across-track directions on the basis of a geo-corrected high-resolution map. The flowchart of the methodology of this study is shown in
Figure 1. The key steps to quantify the uncertainty caused by geolocation mismatch include: preprocessing of a high-resolution map, identification of geolocation shift of TROPOMI SIF validation pixel, and quantification of uncertainty caused by geolocation mismatch.
2.1. The preprocessing of a high-resolution map
The geo-corrected high-resolution map was extracted from level-2 Sentinel-2 Surface Reflectance (SR) data due to its high spatial resolution. Considering the surface reflectance anisotropy, the Sentinel-2 SR should be first normalized to the geometry of the TROPOMI SIF validation pixel. Here, we employed the MODIS MCD43A1 product to calculate the directional reflectance ratio (
), which will be used to adjust Sentinel-2 SR (
) from original geometry (
) to the geometry of TROPOMI validation pixel (
) (Eqs. (1-3)) [
19,
20].
where
is Sentinel-2 adjusted SR,
was estimated using the kernel coefficients (
,
,
) provided by MCD43A1.
and
are volumetric scattering and geometric-optical kernels [
21,
22], respectively.
Considering the inconsistency in spectral bands between TROPOMI and Sentinel-2, Sentinel-2 SR (Sentinel-2 Spectral Response Functions (S2-SRF) - Sentinel Online (copernicus.eu)) was also converted to the band of TROPOMI using the spectral response functions (TROPOMI Response Functions - Sentinel Online (copernicus.eu)). Near-infrared reflectance of vegetation (NIRv) (NIRv = NDVI × ρNIR, where NDVI is the normalized difference VI based on NIR and red spectral bands and ρNIR is the NIR reflectance) has been identified as the prominent indicator of SIF [
23,
24]. Hence, we generated the high-resolution NIRv maps based on angular-corrected and band consistent Sentinel-2 SR data.
2.2. Geolocation shift identification
The geolocation shift of the TROPOMI SIF validation pixel was identified based on the Sentinel-2 NIRv data and the geolocation matching method. During the geolocation matching process, the nominal spatial extent of the validation pixels was extracted as the initial template. Then the template was shifted in the along- and across-track directions with a step of 10 m (i.e., the pixel size of the NIRv map). The maximum shift was set to 0.5 TROPOMI pixel, resulting in [(0.5 TROPOMI pixel /10) × 2 + 1]
2 shift cases for each validation pixel. For each simulated shift case, the NIRv values on the TROPOMI pixel scale (denoted as
) was estimated using the aggregated 10 m Sentinel-2 SR within the template. Afterward, the difference between the simulated TROPOMI pixel scale NIRv (
) and the TROPOMI validation pixel NIRv (denoted as
) was calculated. The shift and the exact location (denoted as
) of the validation pixel correspond to the simulate case with the minimum absolute difference between
and
(Eq. (4)).
(4)
where
denotes the minimal function, and abs represents the absolute difference function.
2.3. Quantification of uncertainty caused by geolocation mismatch
To quantify the uncertainty caused by the geolocation mismatch in validation, the TROPOMI pixel scale reference SIF in the nominal location (denoted as
) and exact location (denoted as
) should be calculated. Here, the TROPOMI pixel scale reference SIF was determined based on tower-based SIF measurements (denoted as
) and an upscaling function. The basic idea of the upscaling function is that the ratio of the NIRv with different spatial scales can be regarded as the upscaling coefficients of SIF for the two spatial scales (Eq. (5)) [
13].
where
and
represented the Sentinel-2 NIRv on the TROPOMI pixel scale at the exact and nominal locations of validation pixel, which was calculated by aggregating Sentinel-2 SR within the footprint of TROPOMI pixel as recommended by Du et al. [
13].
is the Sentinel-2 pixel NIRv containing the tower-based location.
The uncertainty caused by the geolocation mismatch (denoted as
) between validation pixel and reference data can be calculated using Eq. (7).
3. Study area and Materials
3.1. Tower-based measurements
The tower-based SIF validation datasets were collected from five ChinaSpec (
http://chinaspec.nju.edu.cn) network sites (i.e., XTS, DM, GC, HL, and AR) [
25]. The main emphasis of ChinaSpec is to gather ground-based SIF measurements from the flux sites that are part of the ChinaFLUX network (
http://www.chinaflux.org/) [
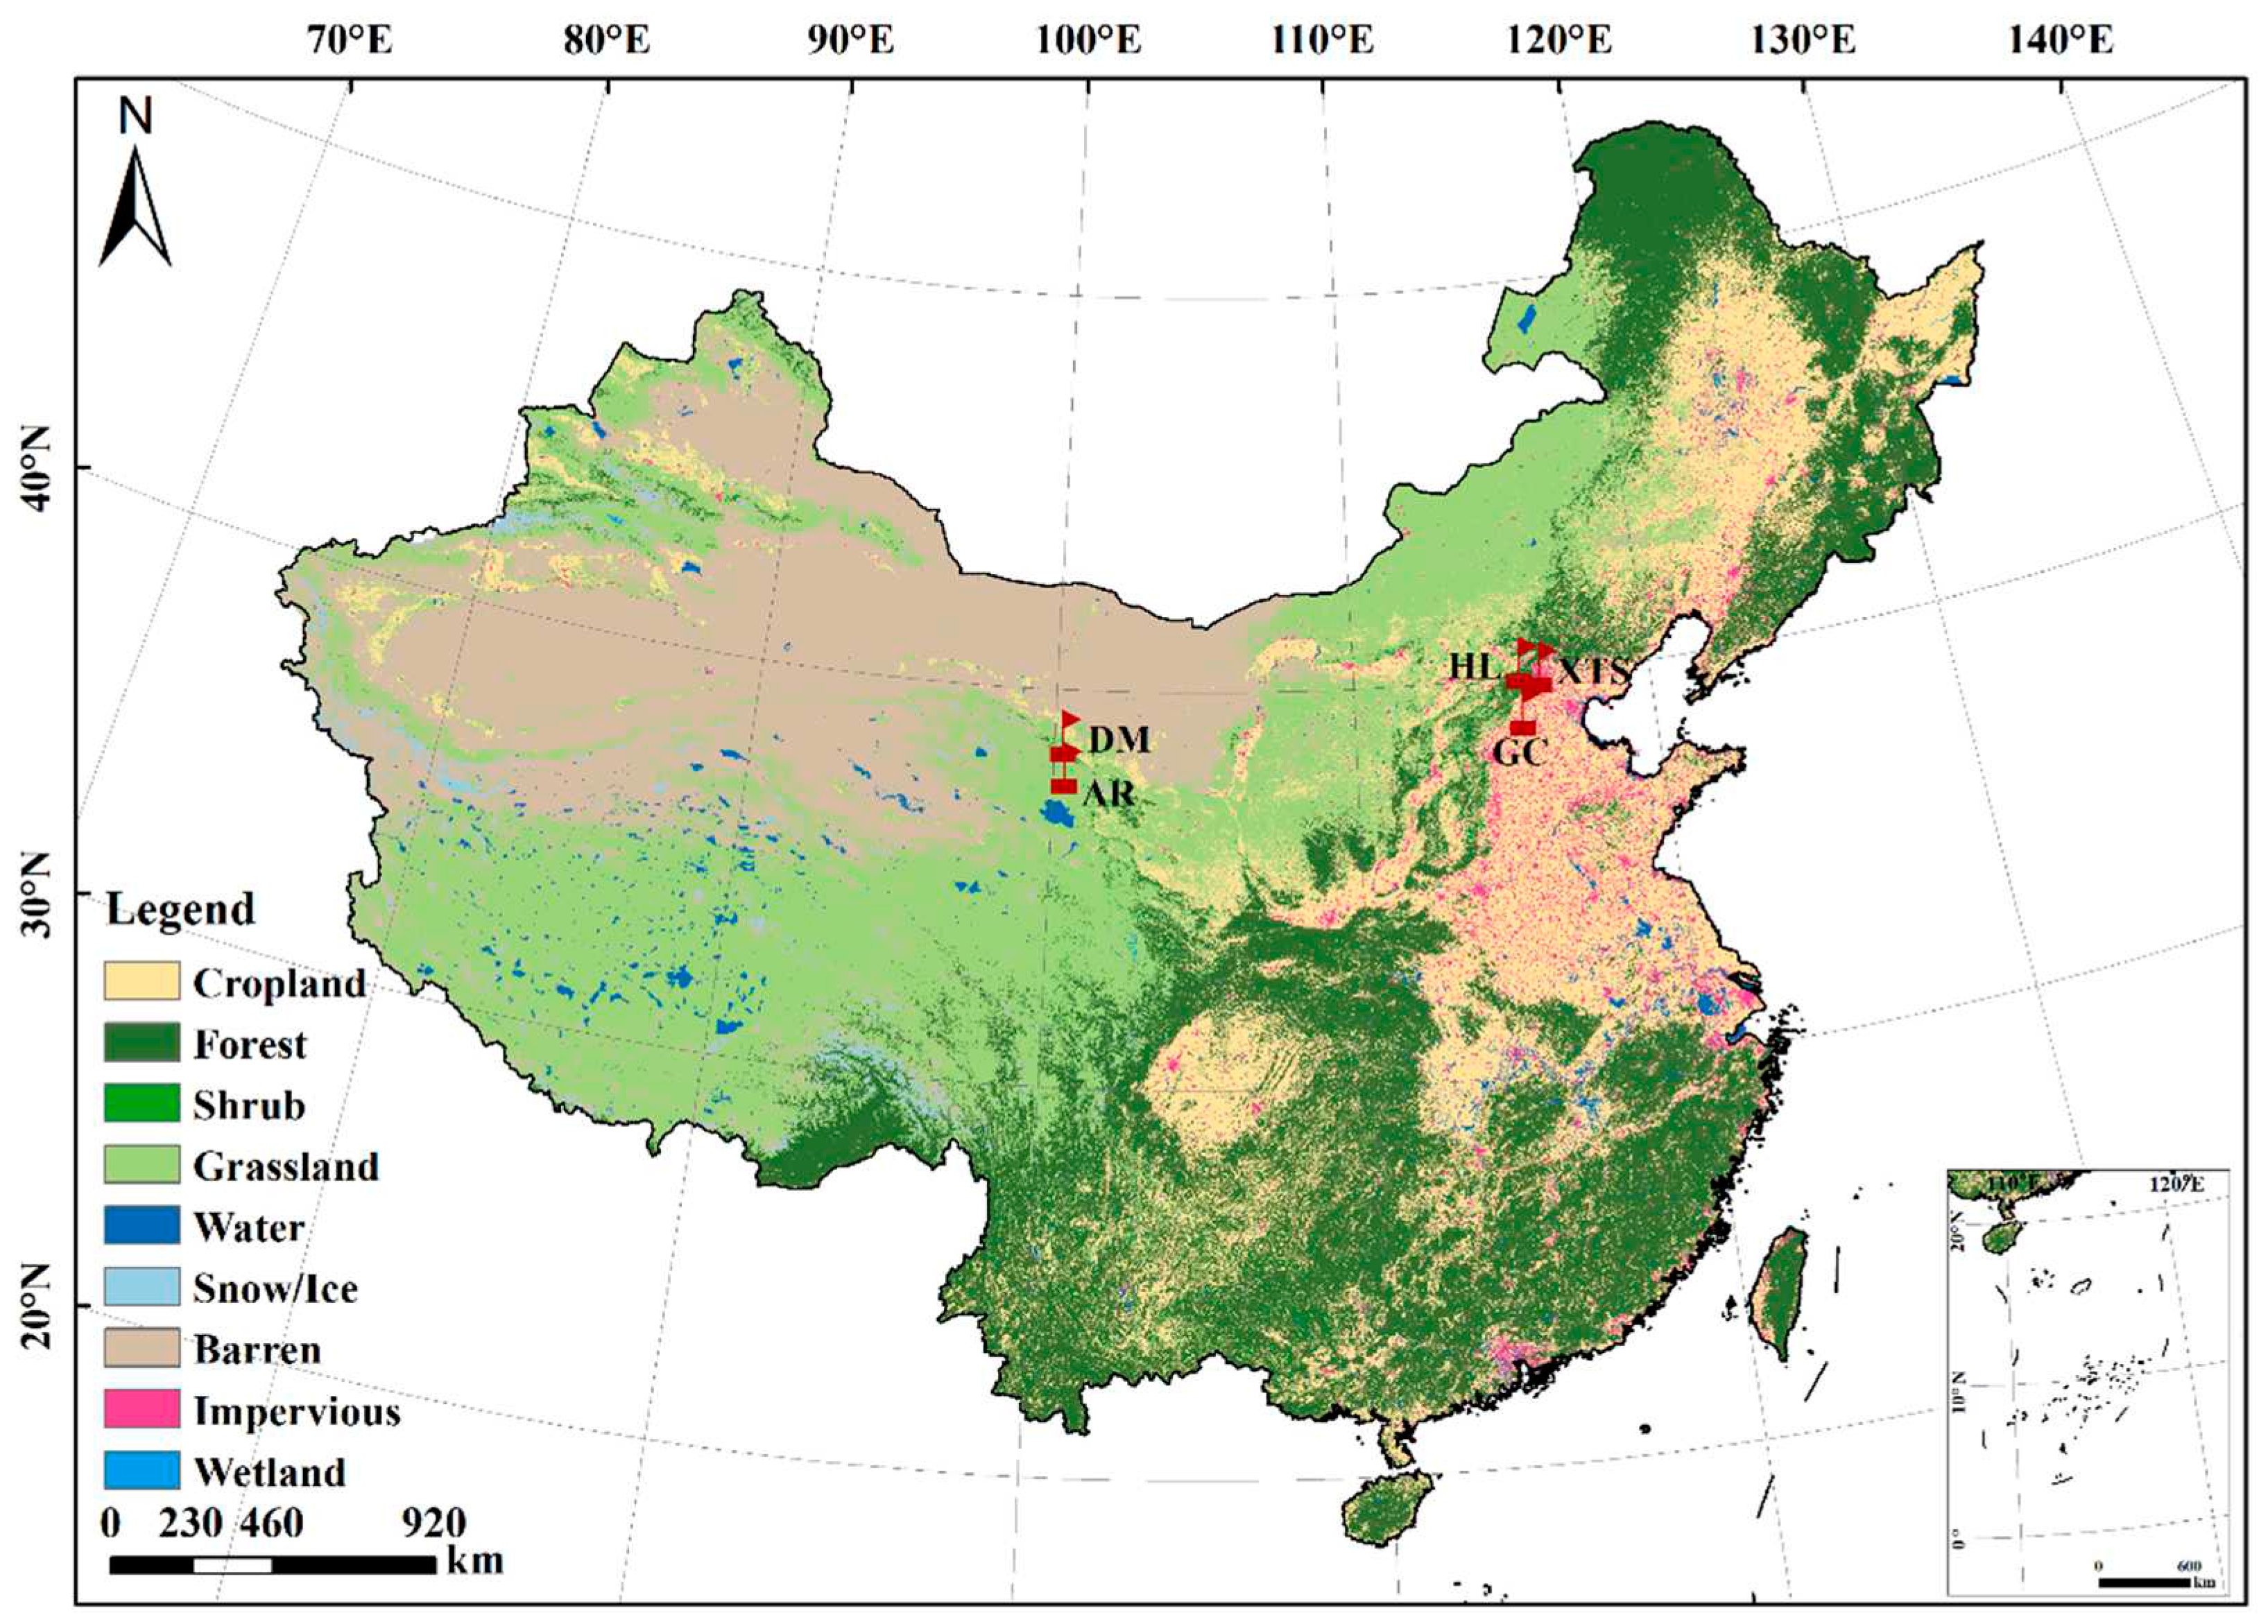
26]. The locations of these five sites are graphically illustrated in
Figure 2.
The five ChinaSpec sites encompasses four croplands and one grassland sites, which are spread out throughout China. The main vegetation types of these cropland sites are different. At XTS and GC sites, a rotation system of maize and wheat crops was implemented. However, at the DM site, only maize was cultivated during the summer season for each year. By contrast, the HL site was featured by a combination of grass and several crabapple trees [
13]. These sites were installed with the SIFSpec instrument, which consists of a QE 65Pro spectrometer, operating within a wavelength range of approximately 650 nm to 840 nm. It offers a spectral resolution of around 0.31 nm.
In order to obtain tower-based SIF, a series of processes have been carried out, including raw data preprocessing, quality control, atmospheric correction, and SIF retrieval. Detailed information on the processing can be referred to Du et al. [
27]. The in-situ tower-based SIF observations over these sites are free to access at
https://zenodo.org/record/7244183. In order to minimize the uncertainties caused by temporal inconsistencies in SIF retrievals, the local time of the TROPOMI overpass was used to extract in situ measurements. Furthermore, to reduce the effect of random errors associated with tower-based measurements, the in-situ observations within a 30-minute window of TROPOMI overpasses were employed, which were averaged to generate half-hourly SIF values to be matched with TROPOMI instantaneous SIF measurements [
13].
It is noteworthy that there are wavelength differences between TROPOMI SIF products (~740 nm) and tower-based SIF retrievals (~760 nm). To address this issue, a ratio of 1.48 was used to convert tower-based SIF760 to SIF740 as recommended by Du et al. [
13]. The experimental period covers the whole year of 2020 with consideration of the temporal variations of geolocation errors of TROPOMI SIF products. The data matching between tower-based, Sentinel-2, and TROPOMI SIF products was made carefully with the consideration of data quality and weather conditions. As a result, a total of 54 data pairs were retained.
3.2. Satellite Data
3.2.1. TROPOMI SIF products
TROPOMI is a step forward of SIF measurements on the global scale due to its high spatial resolution of 3.5 × 7.5 km2 at the nadir (adjusted to 3.5 × 5.5 km2 since August 2019) and high temporal resolution of nearly daily. This improved spatial and temporal resolution significantly increases the number of clear-sky measurements per day compared to previous missions. The TROPOMI SIF product employed in this study was established by Guanter et al. [
7], which includes two far-red SIF datasets derived from the 743–758 nm window and the extended 735–758 nm window (
http://ftp.sron.nl/open-access-data-2/TROPOMI/tropomi/sif/v2.1/l2b/). The former was the baseline SIF product for the moment and recommended for use. Hence, only the 743–758 nm SIF product was adopted in this paper. This product was retrieved from TROPOMI TOA radiance in the far-red spectral region based on a data-driven forward model [
28]. In addition to SIF data, this product also provides top-of-atmosphere (TOA) reflectance for the bands ranging from red-edge to NIR wavelengths, enabling the calculation of NIRv, which is considered to be a good proxy of SIF and approximately equals to the multiplication of NIR reflectance and Normalized Difference Vegetation Index (NDVI). To avoid the uncertainties caused by large view zenith angle (SZA), the TROPOMI SIF records with SZA greater than 60° were excluded from the analysis.
3.2.2. Sentinel-2 SR products
The Level-2A Sentinel-2 SR products were obtained from the Google Earth Engine (GEE) platform (
https://developers.google.com/earth-engine/datasets/catalog/ COPERNICUS_S2_SR). The surface reflectance data along with the associated cloud probability product and default cloud masking parameter (
https://developers.google.com/earth engine/tutorials/community/sentinel-2-s2cloudless) were extracted. The cloud masking parameter utilizes a machine-learning-based Sentinel-2 cloud detection algorithm. The Sentinel-2 offers multispectral optical images with 13 bands ranging from visible to shortwave infrared. Considering the inconsistency of observation geometry and band specifications between Sentinel-2 and TROPOMI, the viewing geometry for three visible bands (blue, green, and red), NIR, and two short wave infrared (SWIR) spectral bands were also extracted to carry out the angular normalization and band conversion. Detailed information on the band conversion process can be found in Lin et al. [
29]. To maintain consistency with other bands, the two SWIR bands were resampled to a spatial resolution of 10 m. Since the Sentinel-2 data have a repeat period of 10 days, the bottom-of-atmosphere reflectances from both Sentinel-2A and 2B were used to calculate high-resolution NIRv maps in order to get more synchronized observations. Meanwhile, to ensure the reliability of the analysis, a filtering process was conducted for the Sentinel-2 observations. The data records with a cloud, snow, or ice coverage exceeding 30% were discarded.
3.2.3. Land cover data
In this study, a land cover dataset, namely the 30m annual China Land Cover Dataset (CLCD), was used to explore the relation between the spatial heterogeneity around the validation pixel and the uncertainty caused by the geolocation errors of the validation pixel. This dataset was selected partly because of its high spatial resolution and partly because of the availability in China. It was generated from Landsat data on the Google Earth Engine (GEE) platform with the random forest (RF) classifier based on the training samples which were collected by combing stable samples provided by China’s land-use/cover datasets and visually interpreted samples from satellite time series data, Google Earth, and Google Maps. Two post-processing procedures including spatial-temporal filtering and logical reasoning were carried out to further improve the spatial-temporal consistency of CLCD. The overall accuracy of CLCD is reasonable, with a value of 79.31% [
30].
4. Results and Discussion
4.1. The variation of NIRv for all simulated shift cases
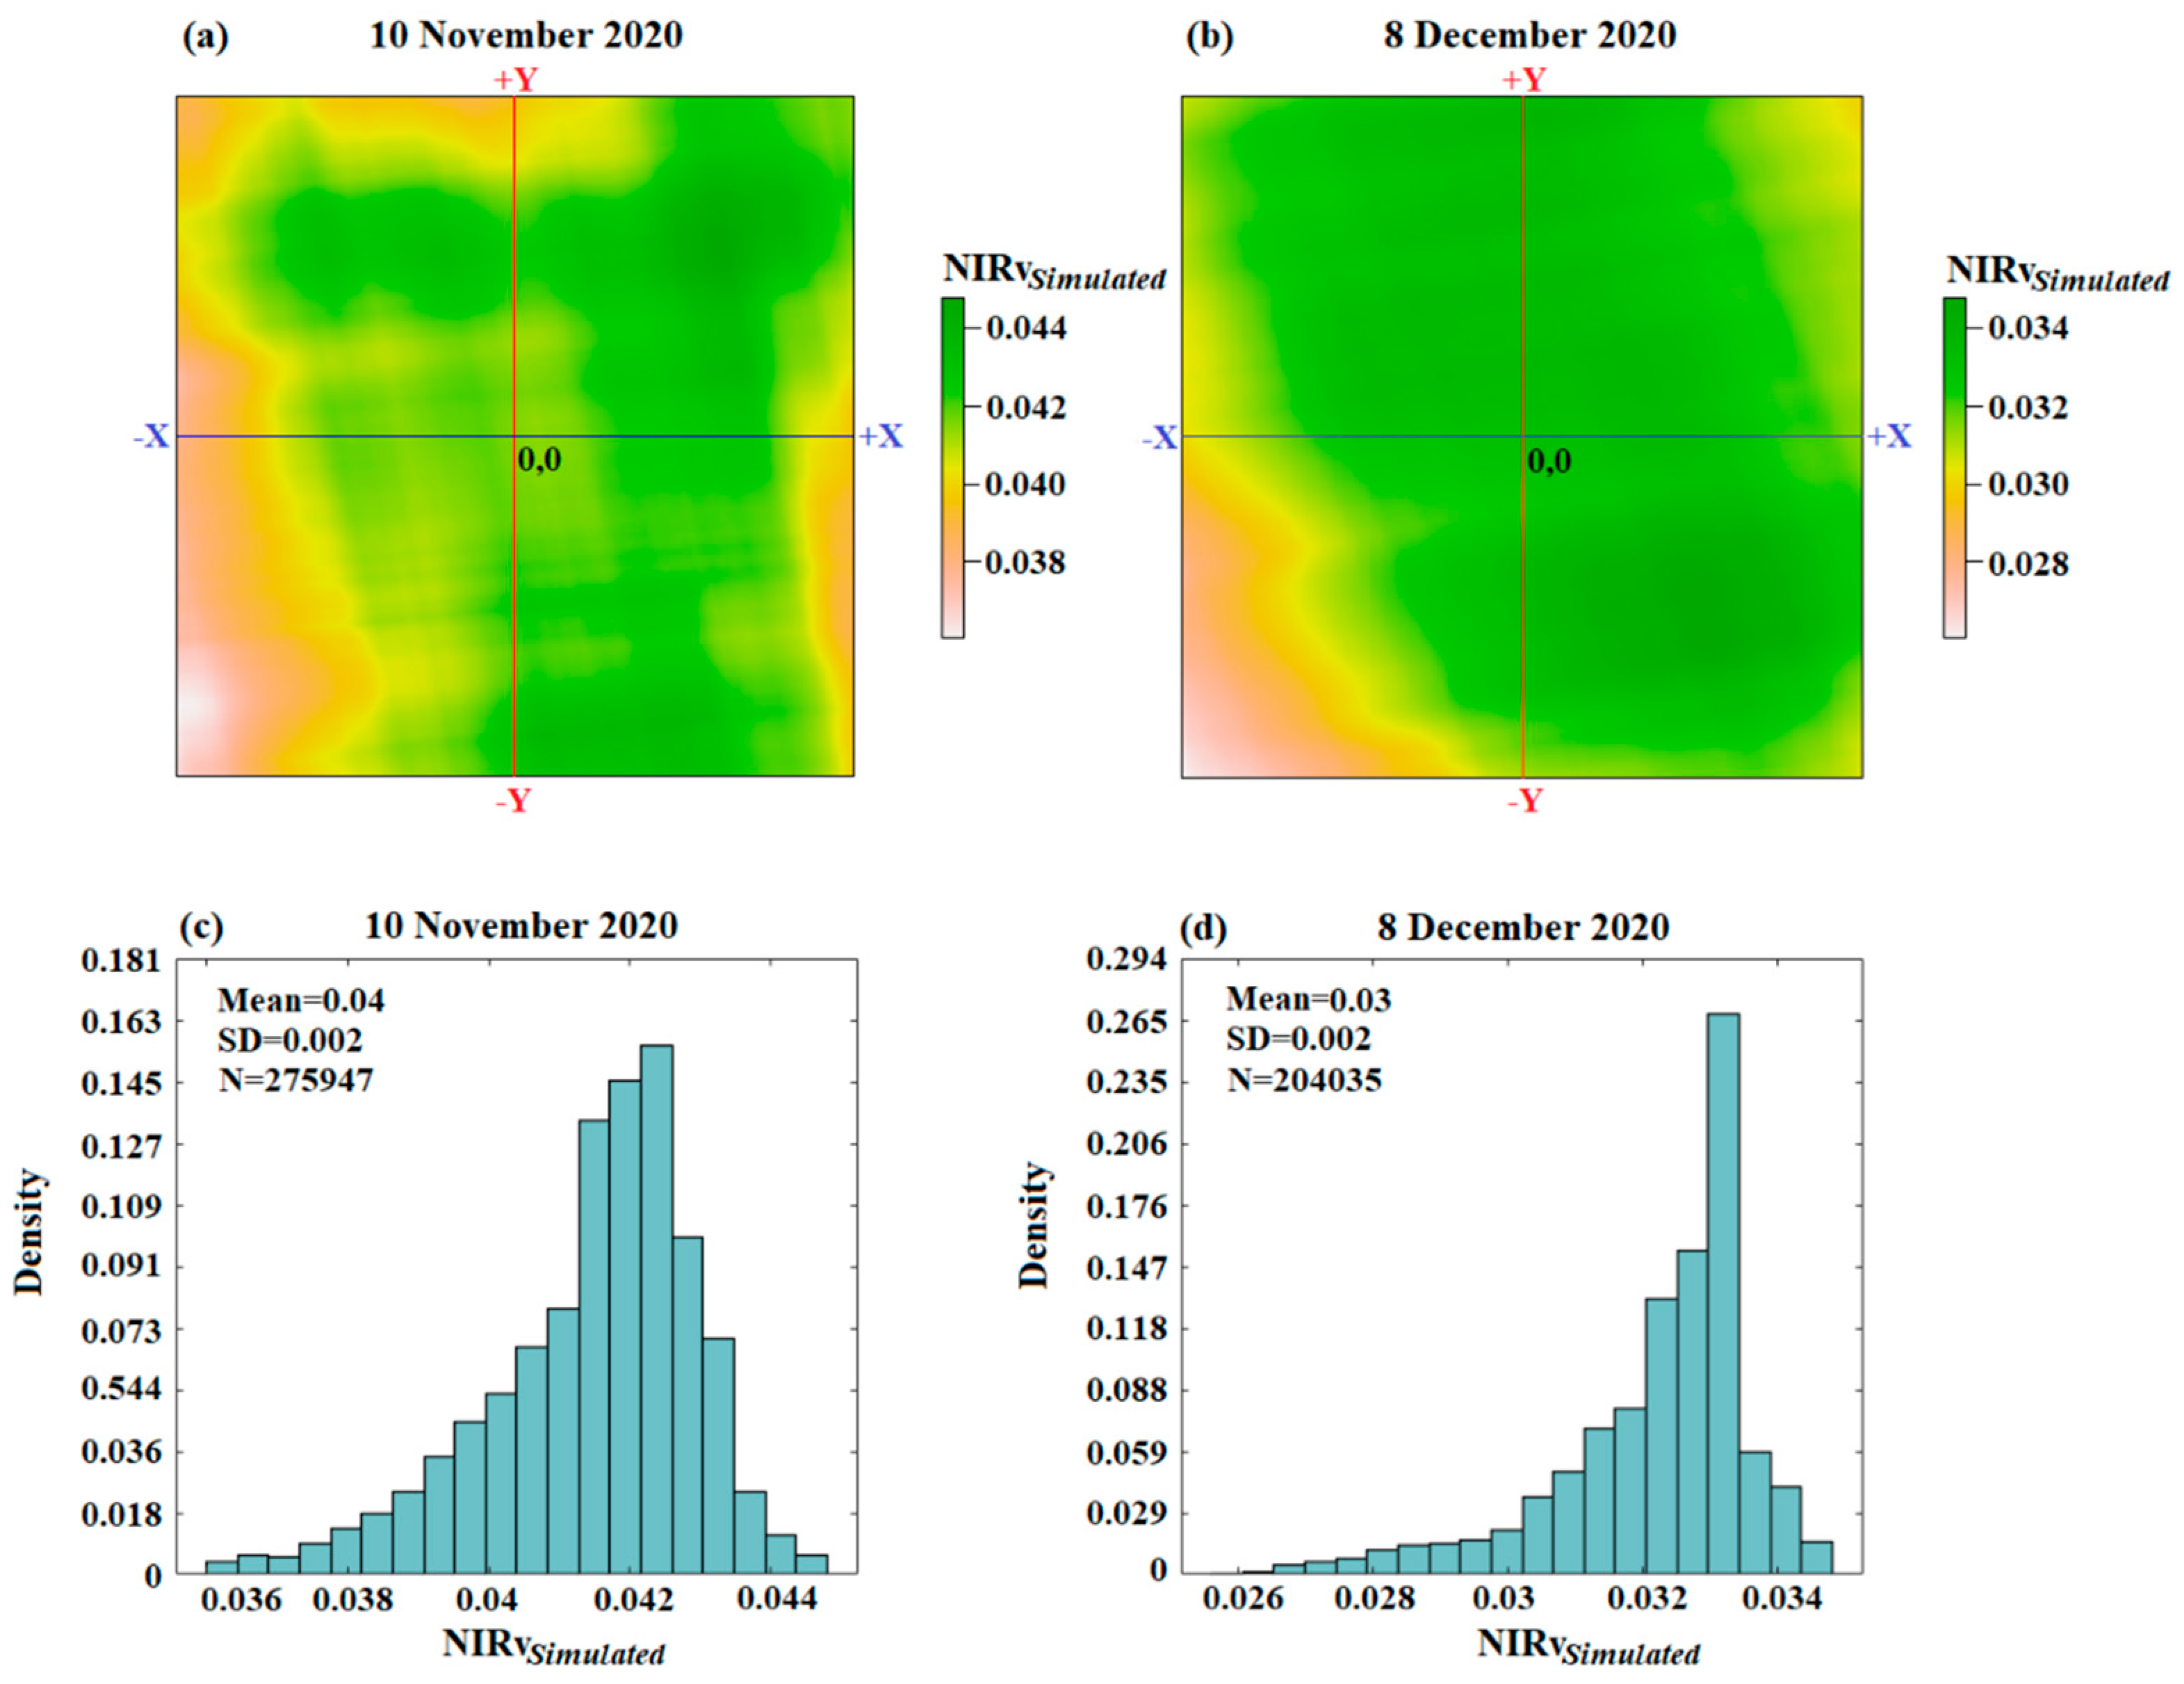
Figure 3 shows the spatial distribution of the
throughout the shifted cases within the ±1 TROPOMI pixels range at a step change of 10 m. For the sake of brevity, only the results for the XTS site on November 10th, 2020 (
Figure 3a) and December 8th, 2020 (
Figure 3b) are displayed here.
Each grid in
Figure 3a,b represents a shifted case, which is represented by the distance from the center in the two directions. The center of each subfigure denotes the nominal location of the validation pixel on the reference scene. It can be seen that
show differences among the different simulated cases. The NIRv corresponding to the exact location of the validation pixel may be either larger or smaller than the NIRv at its nominal location. The maximum and minimum show a difference of about 0.008 for the two dates (
Figure 3c,d). It is important to note that the magnitude of NIRv itself is small, with values less than 0.05. Hence, the influence of geometric mismatch cannot be ignored since it may obscure the true accuracy of TROPOMI SIF products. It is important to note that the spatial range of the TROPOMI pixel is irregular, and the location of one TROPOMI pixel changes with time. Hence, the number of simulated cases for each period is not equal (
Figure 3c,d).
4.2. The Shifts of the Validation Pixels of TROPOMI
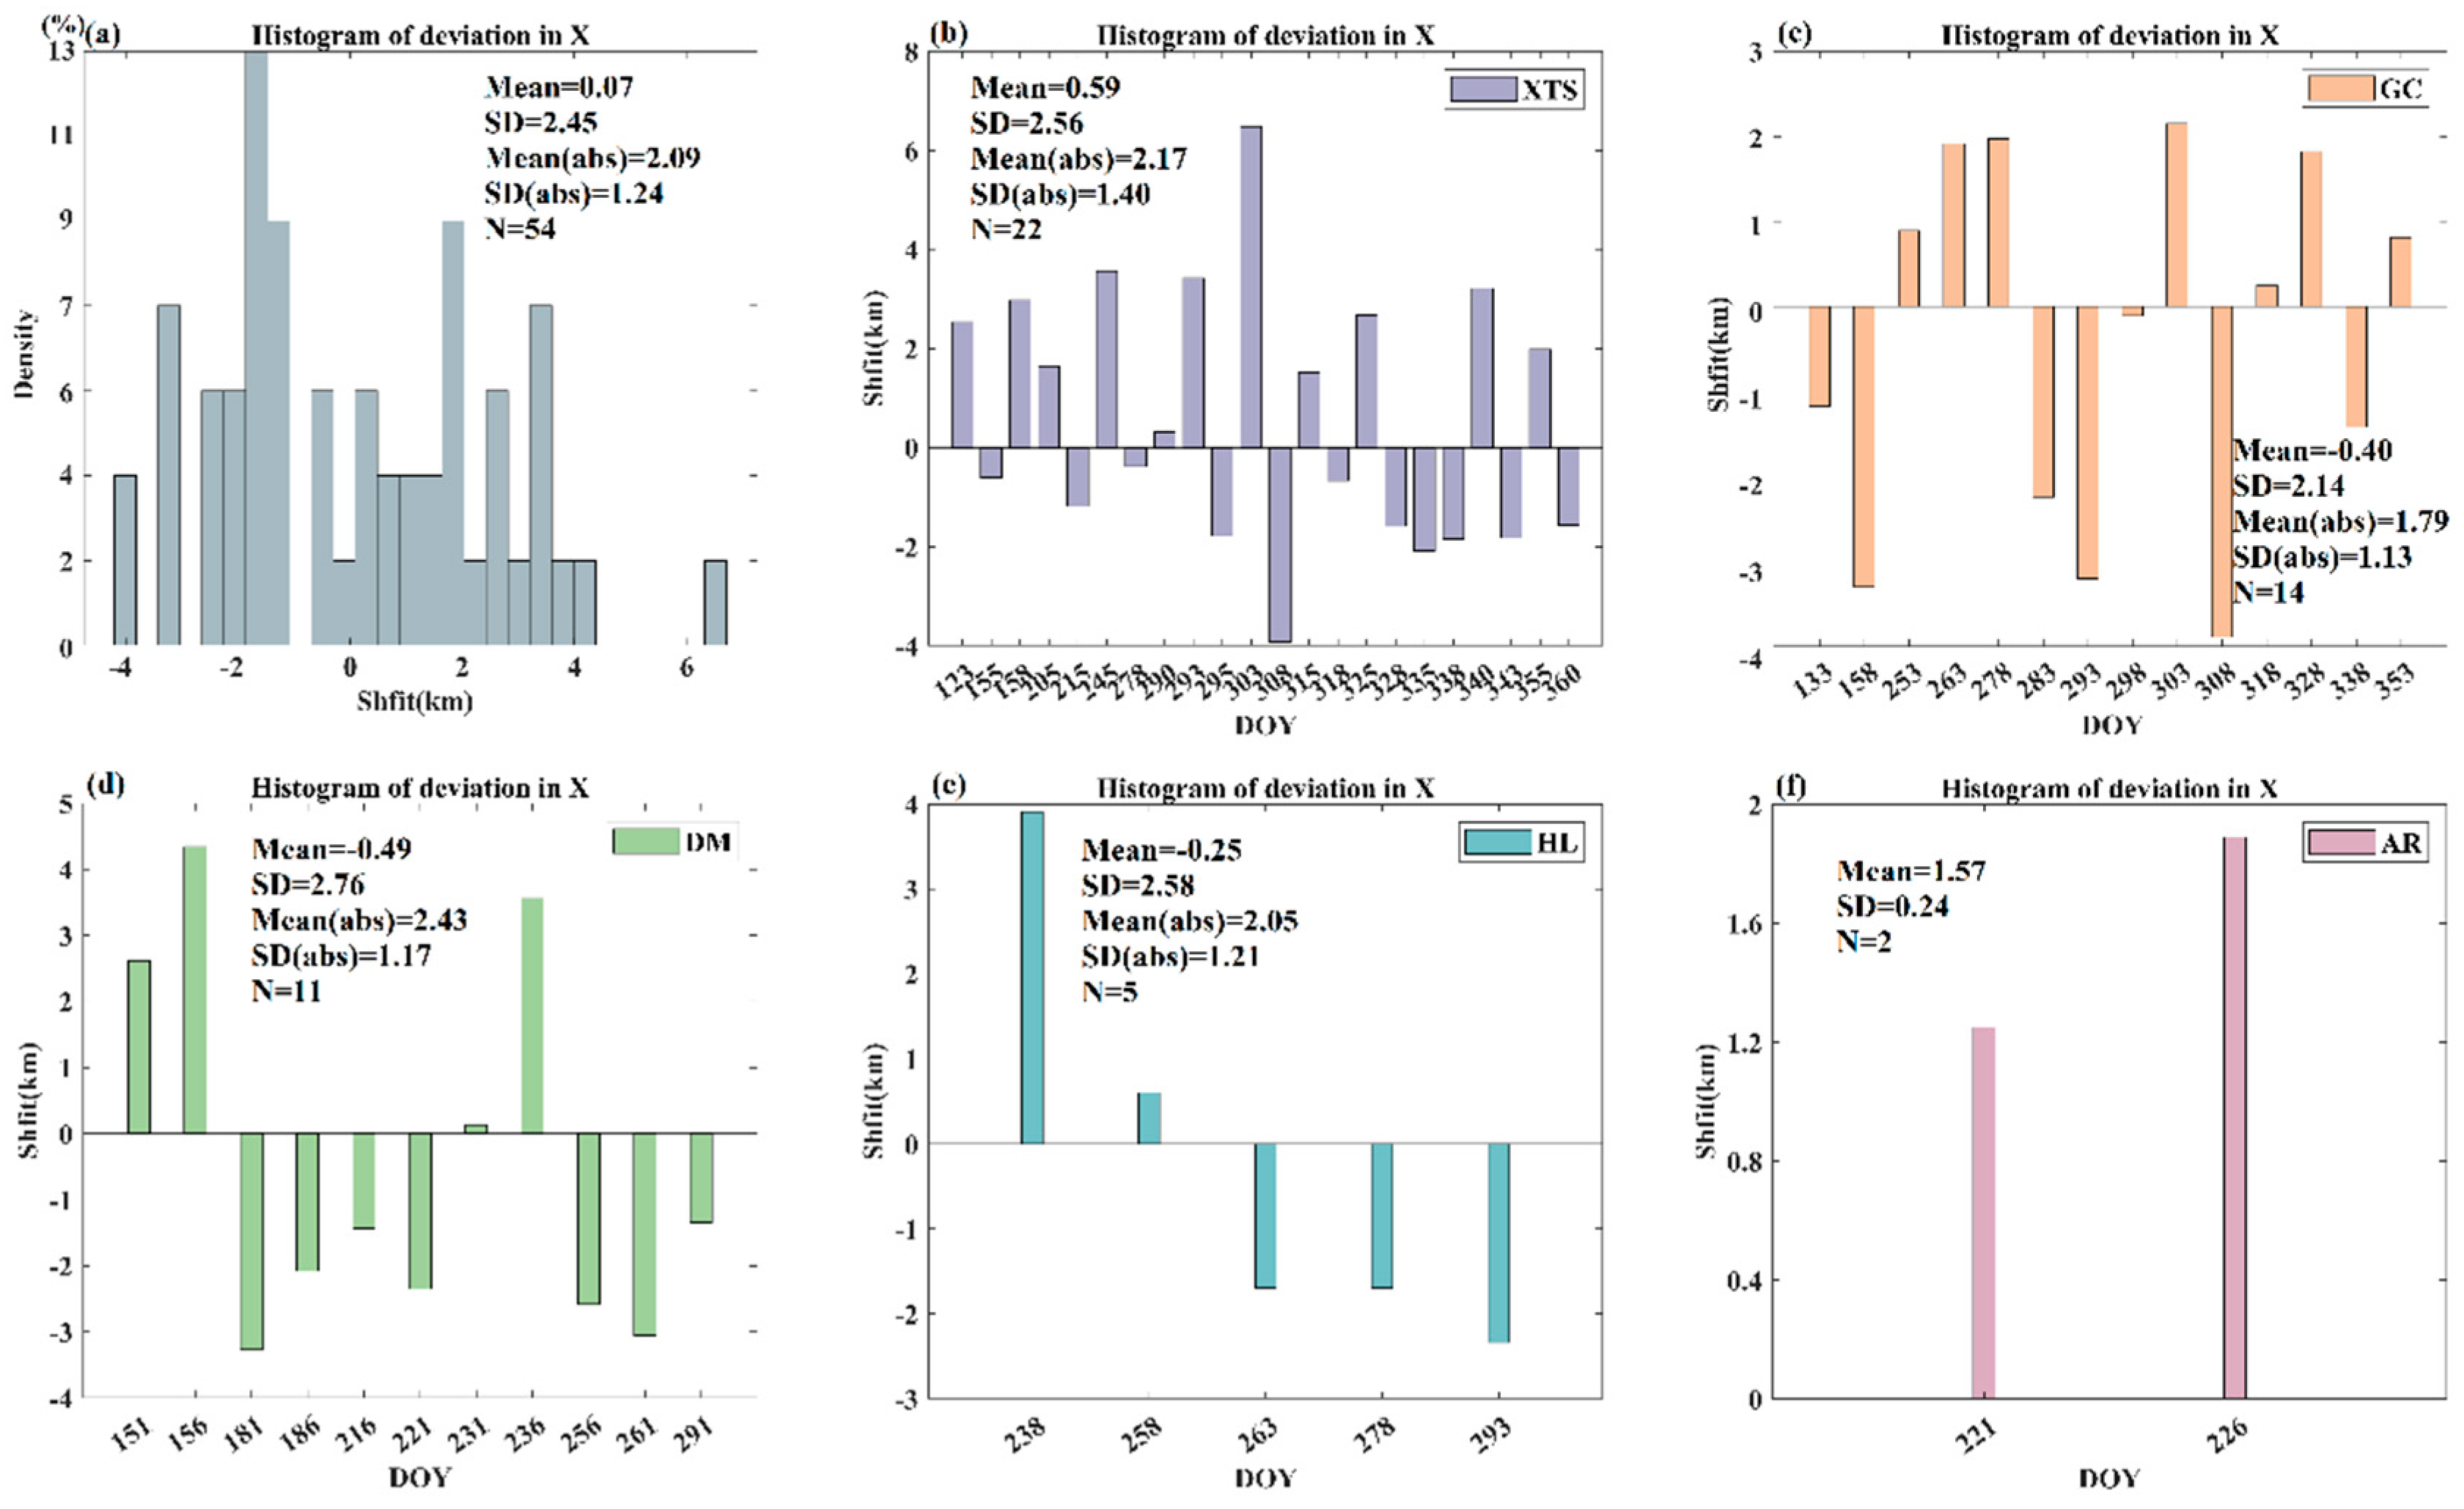
Figure 4 and
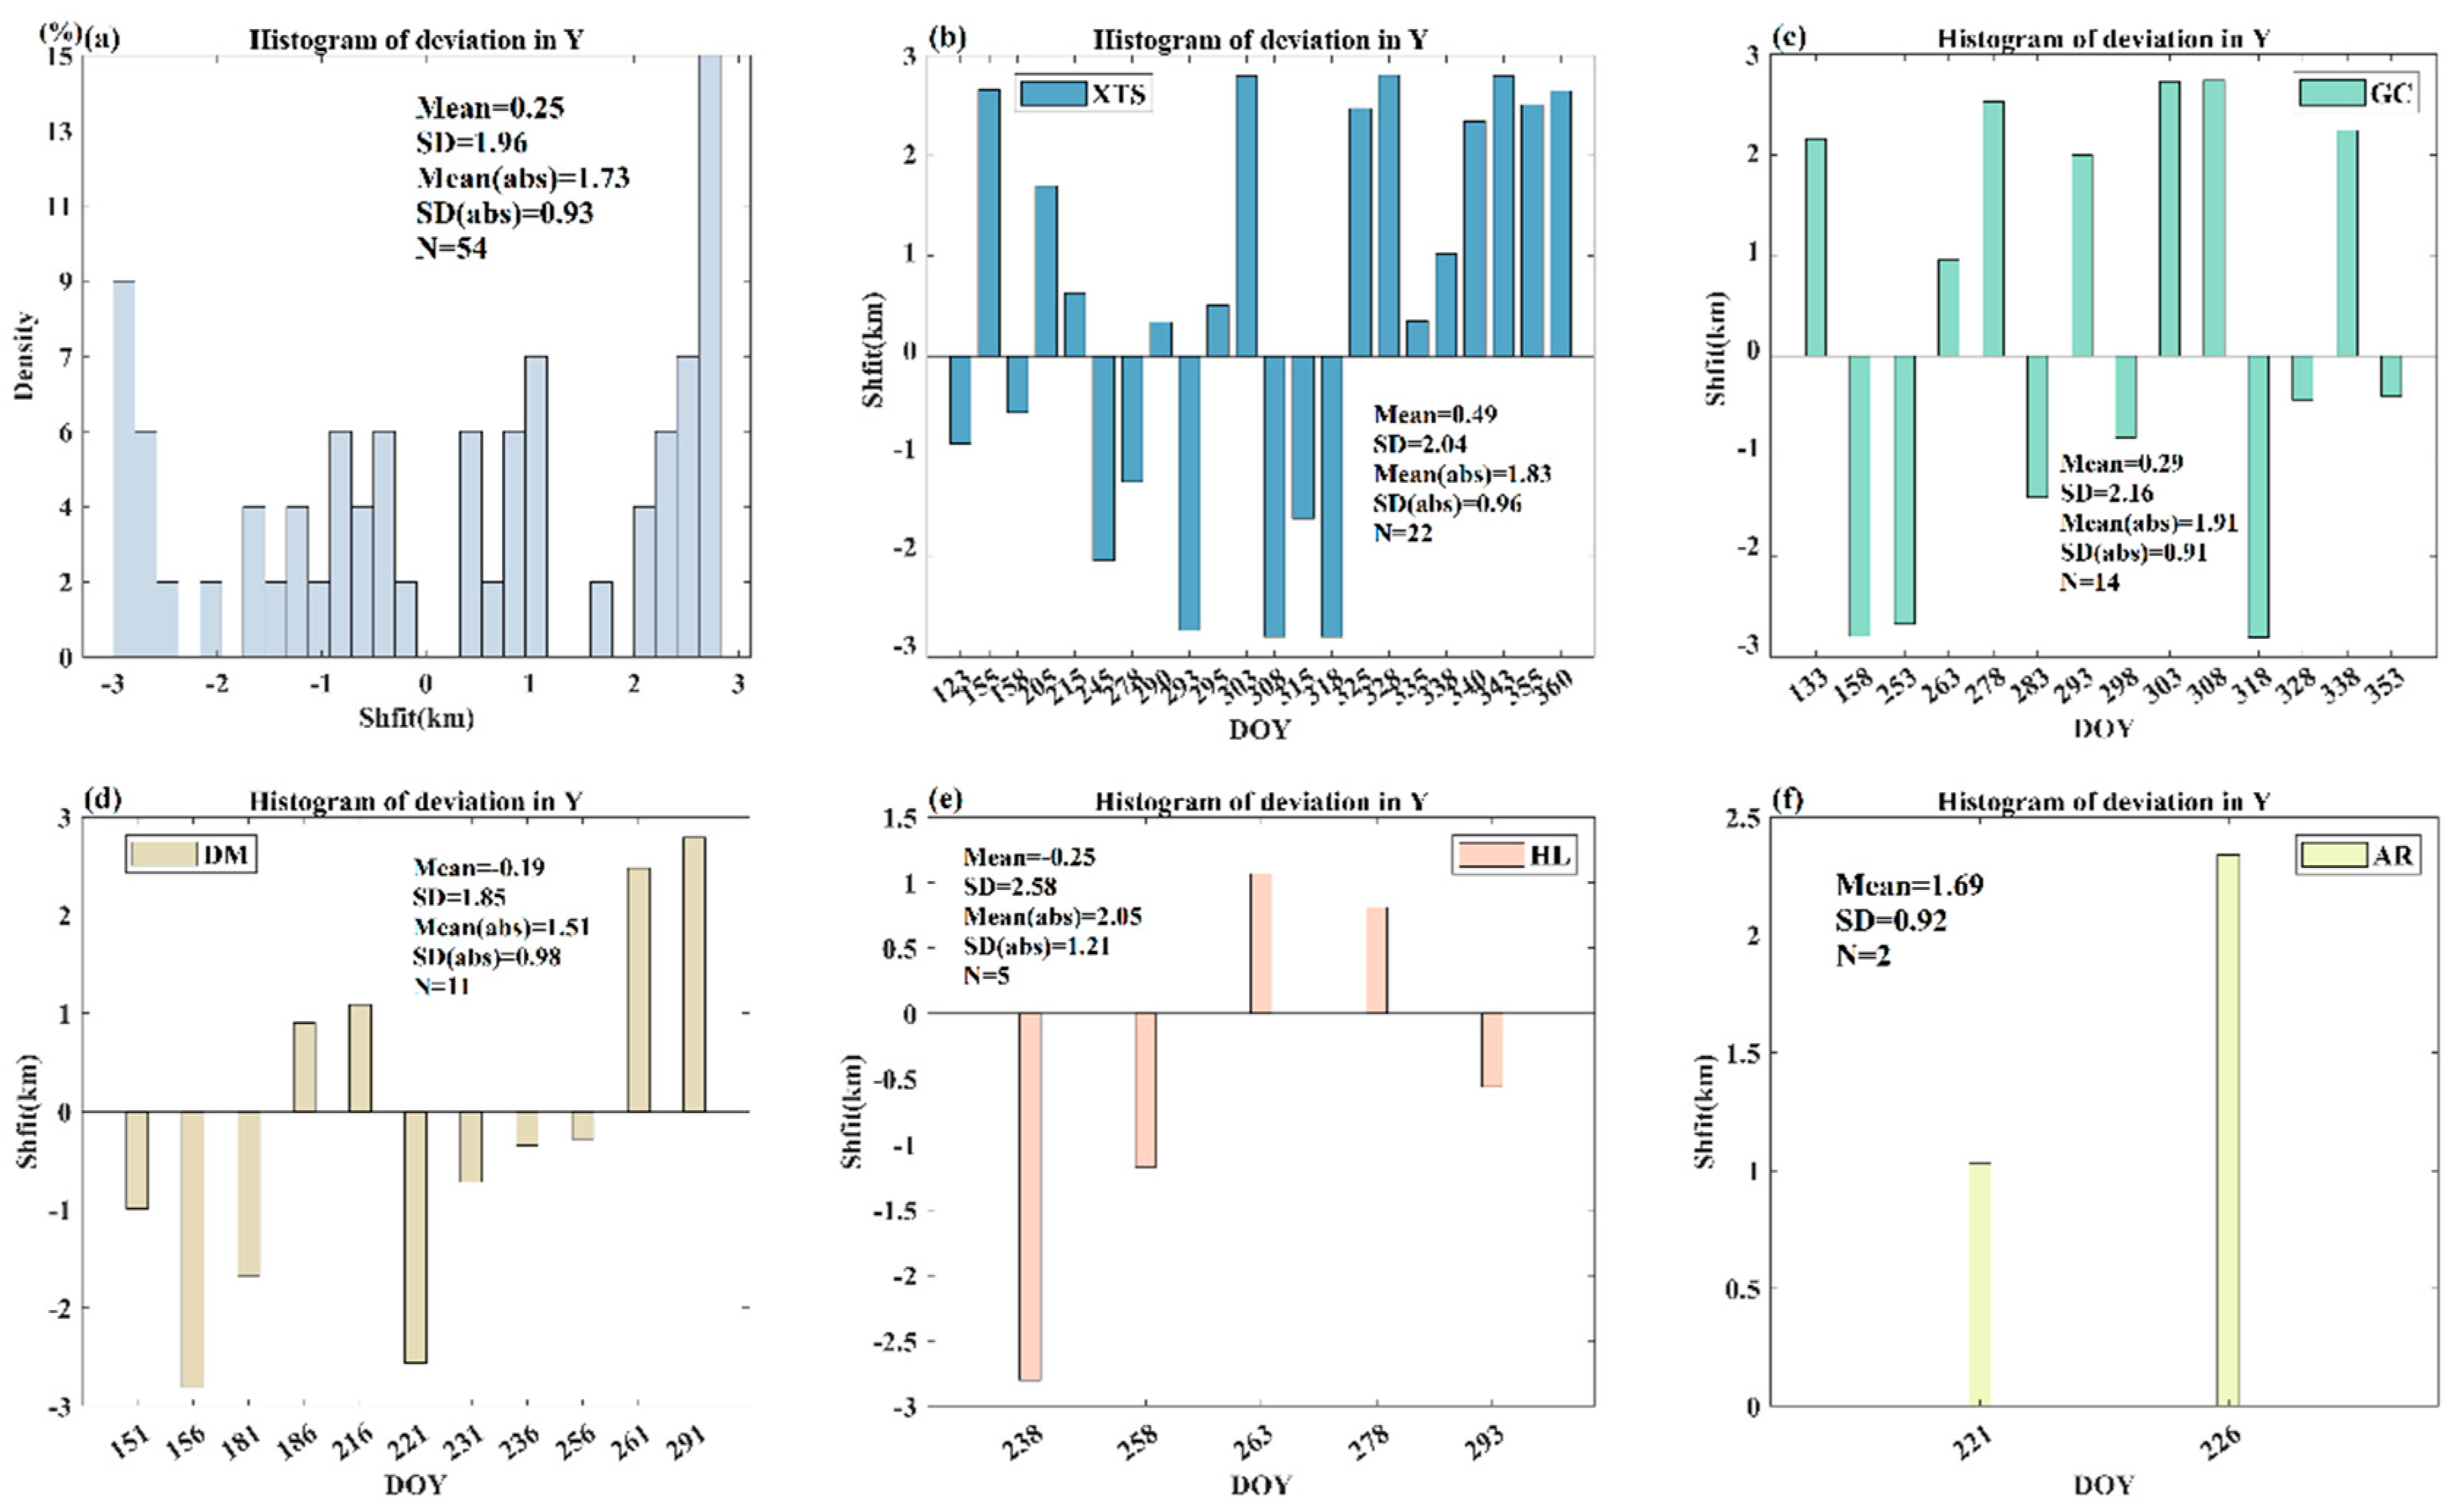
Figure 5 show the geometric shift of the TROPOMI validation pixel in the across-track (X) and along-track (Y) directions, respectively. As shown in
Figure 4a and
Figure 5a, the geolocation shift of the validation pixel is widely present over these five sites throughout the experimental period in both across-track and along-track directions.
The shift in the across-track direction ranges from -3.92 km to 6.48 km, with a mean value of 0.07 km, indicating eastward shifts in the across-track direction in general. While in the along-track direction, the shift of the validation pixel shows directions are comparable, indicated by the similar mean and a range from -2.81 km to 2.80 km, with a mean value of 0.25 km, indicating a northward shift in the along-track direction in general. It is noteworthy that the temporal variations of shifts in the across- and along-track directions are both significant, with a standard deviation of 2.45 km and 1.96 km, respectively. The magnitude of the shift of the TROPOMI validation pixel is generally reasonable, with a mean value of 2.09 km and 1.73 km in two directions (
Figure 4a and
Figure 5a). Moreover, both the magnitude and the temporal variation degree of the shifts in two directions are comparable, indicated by the similar mean and standard deviation values.
Figure 4b–f and
Figure 5b–f display the day-by-day variation of geometric shifts of the validation pixels at these 5 sites in both the cross-track and along-track directions, respectively. It is obvious that the geometric shift of the validation pixels corresponding to the 5 in-situ sites all show significant temporal variations. But the magnitude of geolocation shift and its variation degree show certain dependence on in situ sites (
Figure 4 and
Figure 5). In the cross-track direction (
Figure 4), the XTS site shows the largest range of geolocation shift, with a minimum of -3.92 km and a maximum of 6.48 km. Its mean geolocation error is 0.59 km, indicating an eastward shift on average. Similarly, AR also present a westward shift, with a mean geolocation error of 1.57 km. Nevertheless, it is important to note that the number of data pairs is so small at AR that the results may be not statistically significant. Compared to the eastward shift at XTS and AR, the opposite phenomenon occurs at GC, DM, and HL, which in general show a westward shift, indicated by the mean shifts of -0.4 km, -0.49 km, and -0.25 km, respectively. Among these three in-situ sites, DM shows the largest variation range as well as variation degree (i.e., 2.43 km). By contrast, GC presents the smallest variation range as well as variation degree (i.e., 2.14 km).
When it comes to along-track direction (
Figure 5), XTS, GC, and AR sites generally show a northward shift, indicated by the mean shift of 0.49 km, 0.29 km, and 1.69 km, respectively. The temporal variation range and variation degree of geolocation shift were the largest at the XTS site, with values ranging from -2.81 km to 2.80 km and a standard deviation of 2.04 km. This is followed by GC with comparable variation ranges and variation degrees, indicated by the standard deviations of 2.16 km. The smallest variation degree of the geolocation shift of AR (i.e., 0.92 km) can be partly attributed to the small number of data pairs at this site. Compared to the northward shift of these four sites, a different phenomenon can be observed at the DM and HL sites, which show a southward shift in the along-track direction, indicated by the mean shift of -0.19 km and -0.25km, respectively. The temporal variation degree of geolocation shift is also significant at both sites, with a standard deviation of 1.85 km and 2.58km, respectively.
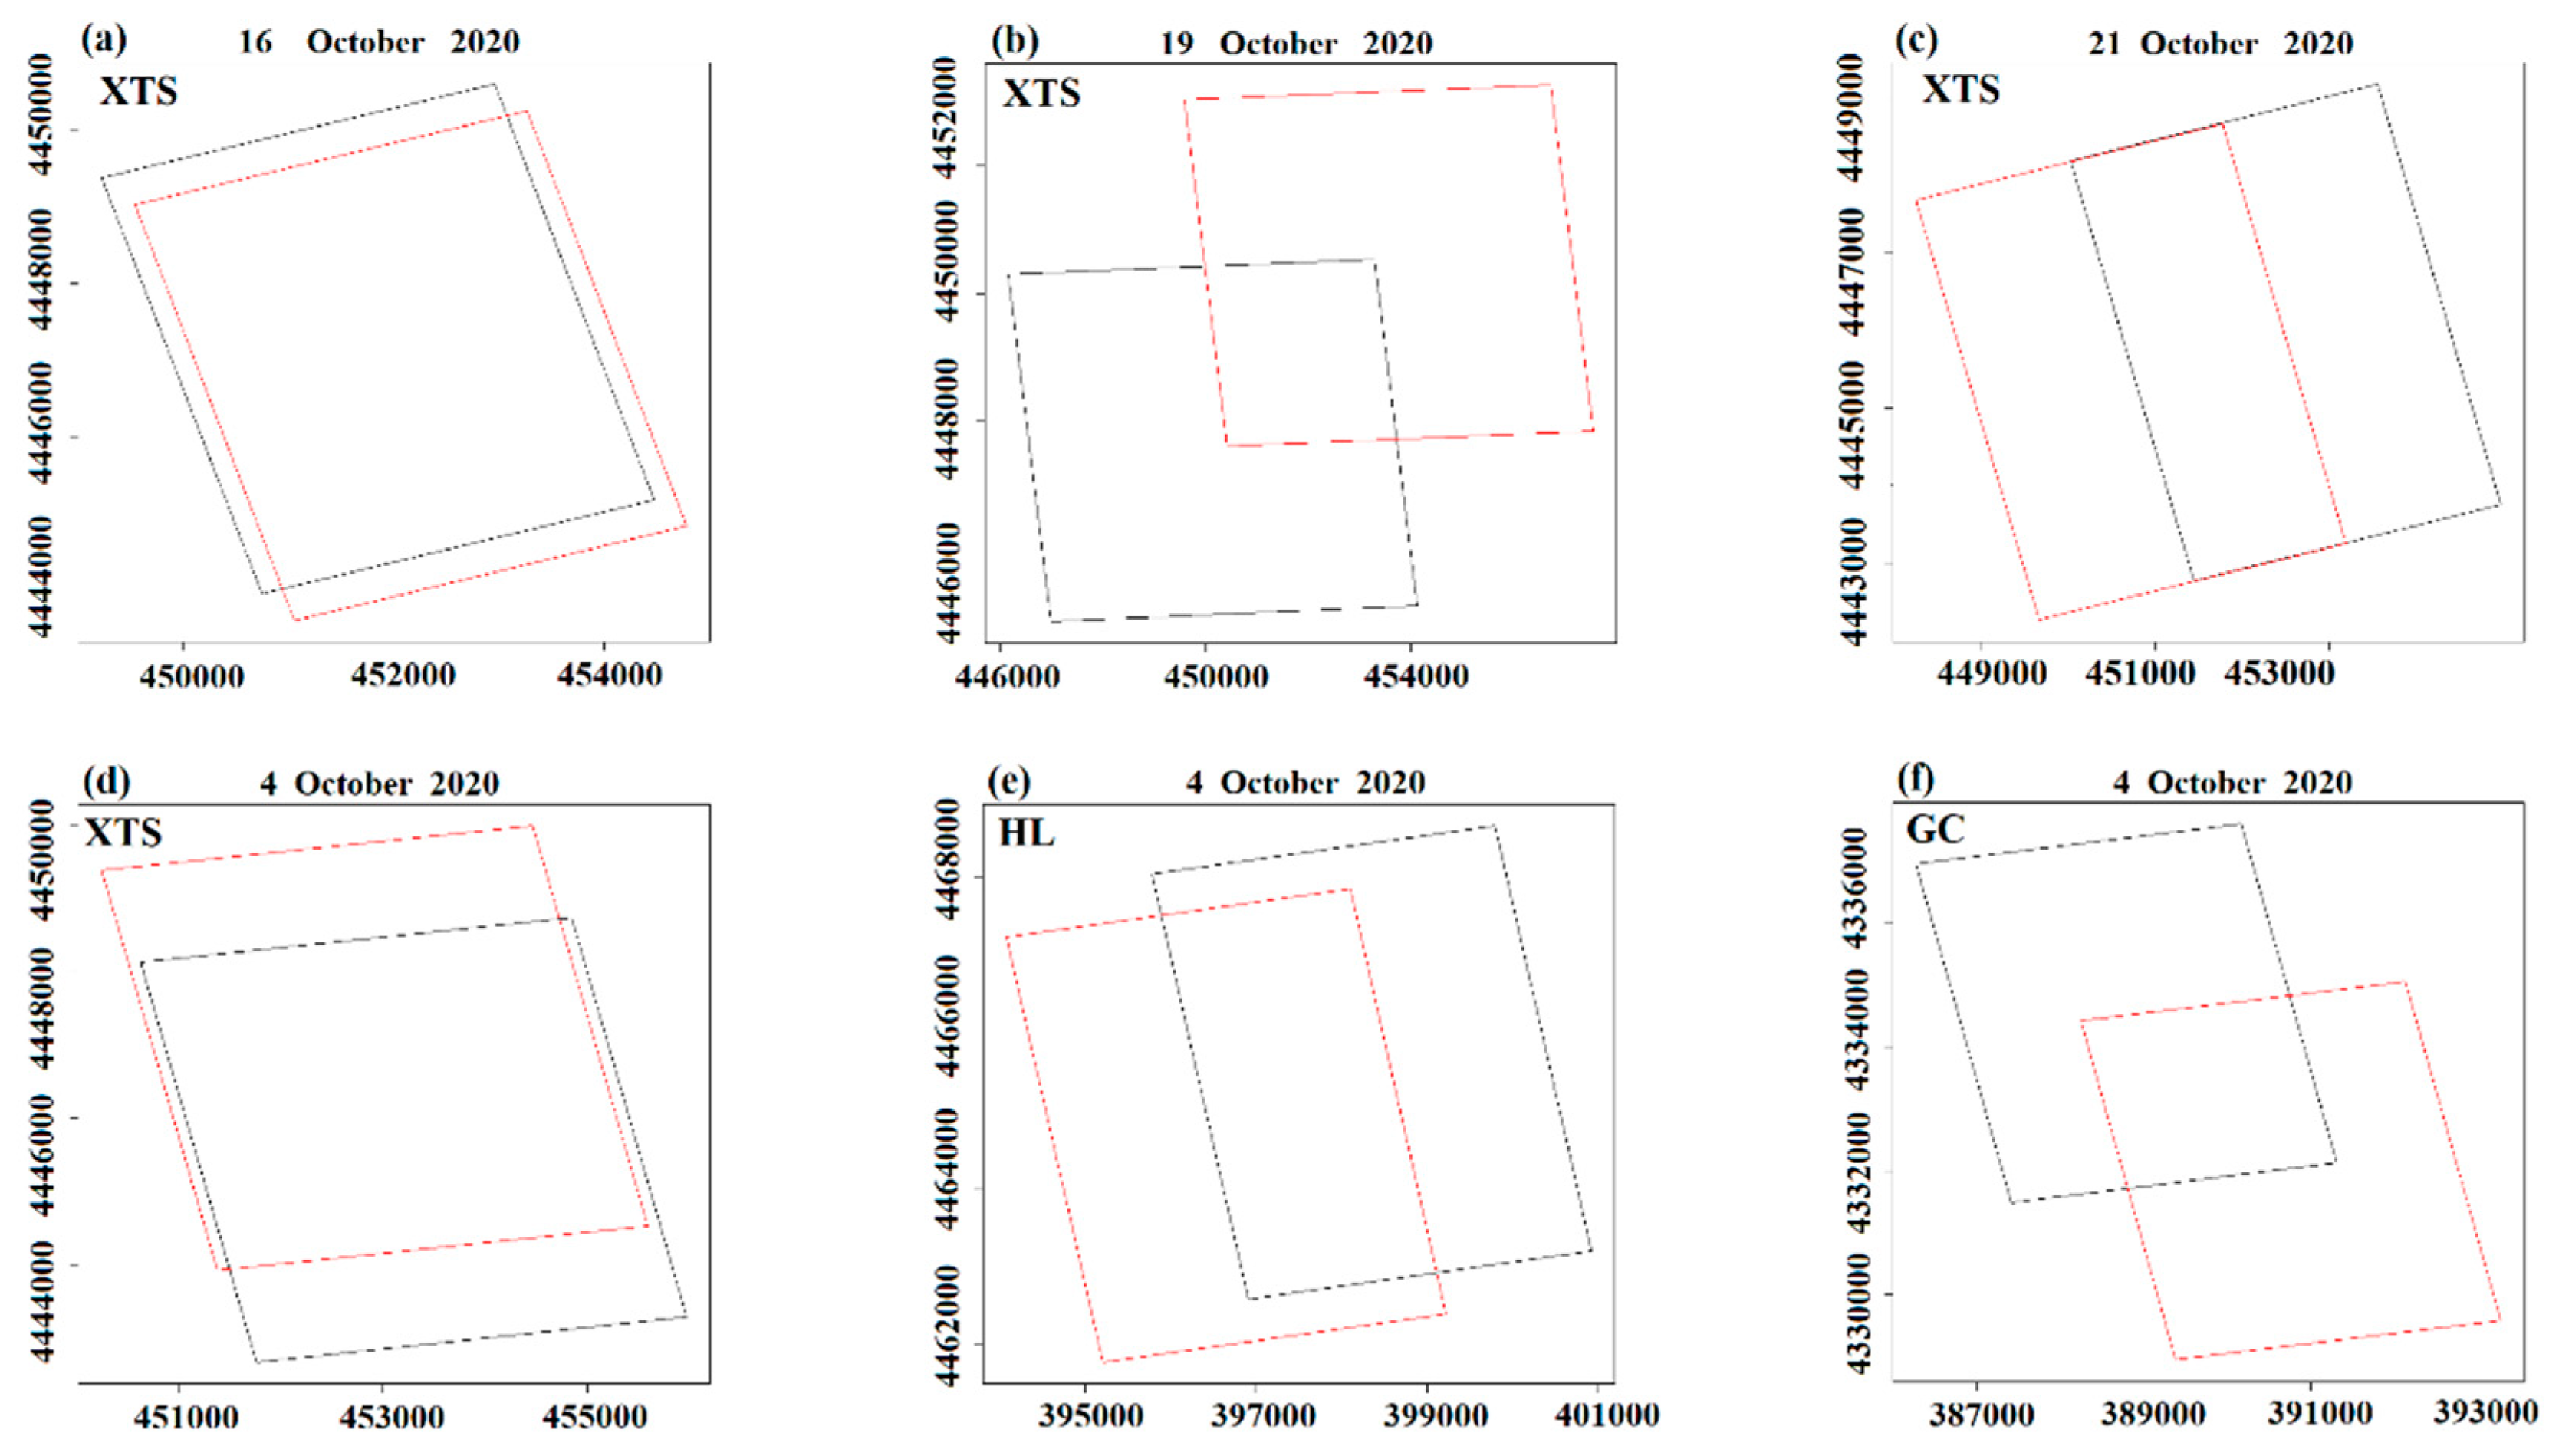
To show the geolocation shift of TROPOMI validation pixel corresponding to in situ sites more intuitively, we present the nominal location and the exact location of validation pixels in
Figure 6. To show the temporal variation characteristics of TROPOMI validation pixel geolocation shift at a specific area, the results at XTS site on October 16, October 19, and October 21, 2020 were shown (
Figure 6a–c). To display the geolocation shift of validation pixels at different locations on the same day, the results at XTS, HL, and GC sites on October 4, 2020, were presented (
Figure 6d–f).
From
Figure 6, it can be seen that the nominal spatial extent of the TROPOMI validation pixel and its exact spatial extent are always not totally overlapped. At the XTS site, the TROPOMI validation pixel exhibits different degrees of geolocation shift in the southeast, northeast, and southwest directions at three different but adjacent time points. This indicates that even for the same site, the magnitude and direction of geolocation shift are inconsistent and even opposite within adjacent periods. As shown in
Figure 6d–f, it can be found that the validation pixels at XTS, HL, and GC sites on October 4, 2020, exhibit different degrees of shifts in the northwest, southwest, and southeast directions, respectively. This indicates that even at the same time, the shift of TROPOMI validation pixels over different areas is not consistent and even the opposite.
Based on these results, it can be concluded that the geolocation shifts of TROPOMI vary irregularly with time and space. It is hard to correct such a kind of geolocation errors through general methods such as the coastline crossing method, the land-sea fraction method, and the coregistration method, because the correction models were generally established on the image level. Instead, the geolocation shift of TROPOMI data should be identified pixel by pixel. It is important to point out that in general validation work, the reference value for validation is generally obtained within the nominal spatial extent of the validation pixel (i.e., black square), but the signal of the satellite validation pixel corresponds to the exact spatial extent (i.e., red square). This geolocation mismatch may artificially expand the difference between the reference value and satellite validation pixel. Therefore, the geographical shift of TROPOMI SIF pixels should be taken seriously when validating TROPOMI SIF products.
4.3. The uncertainty caused by geometric errors of validation pixel
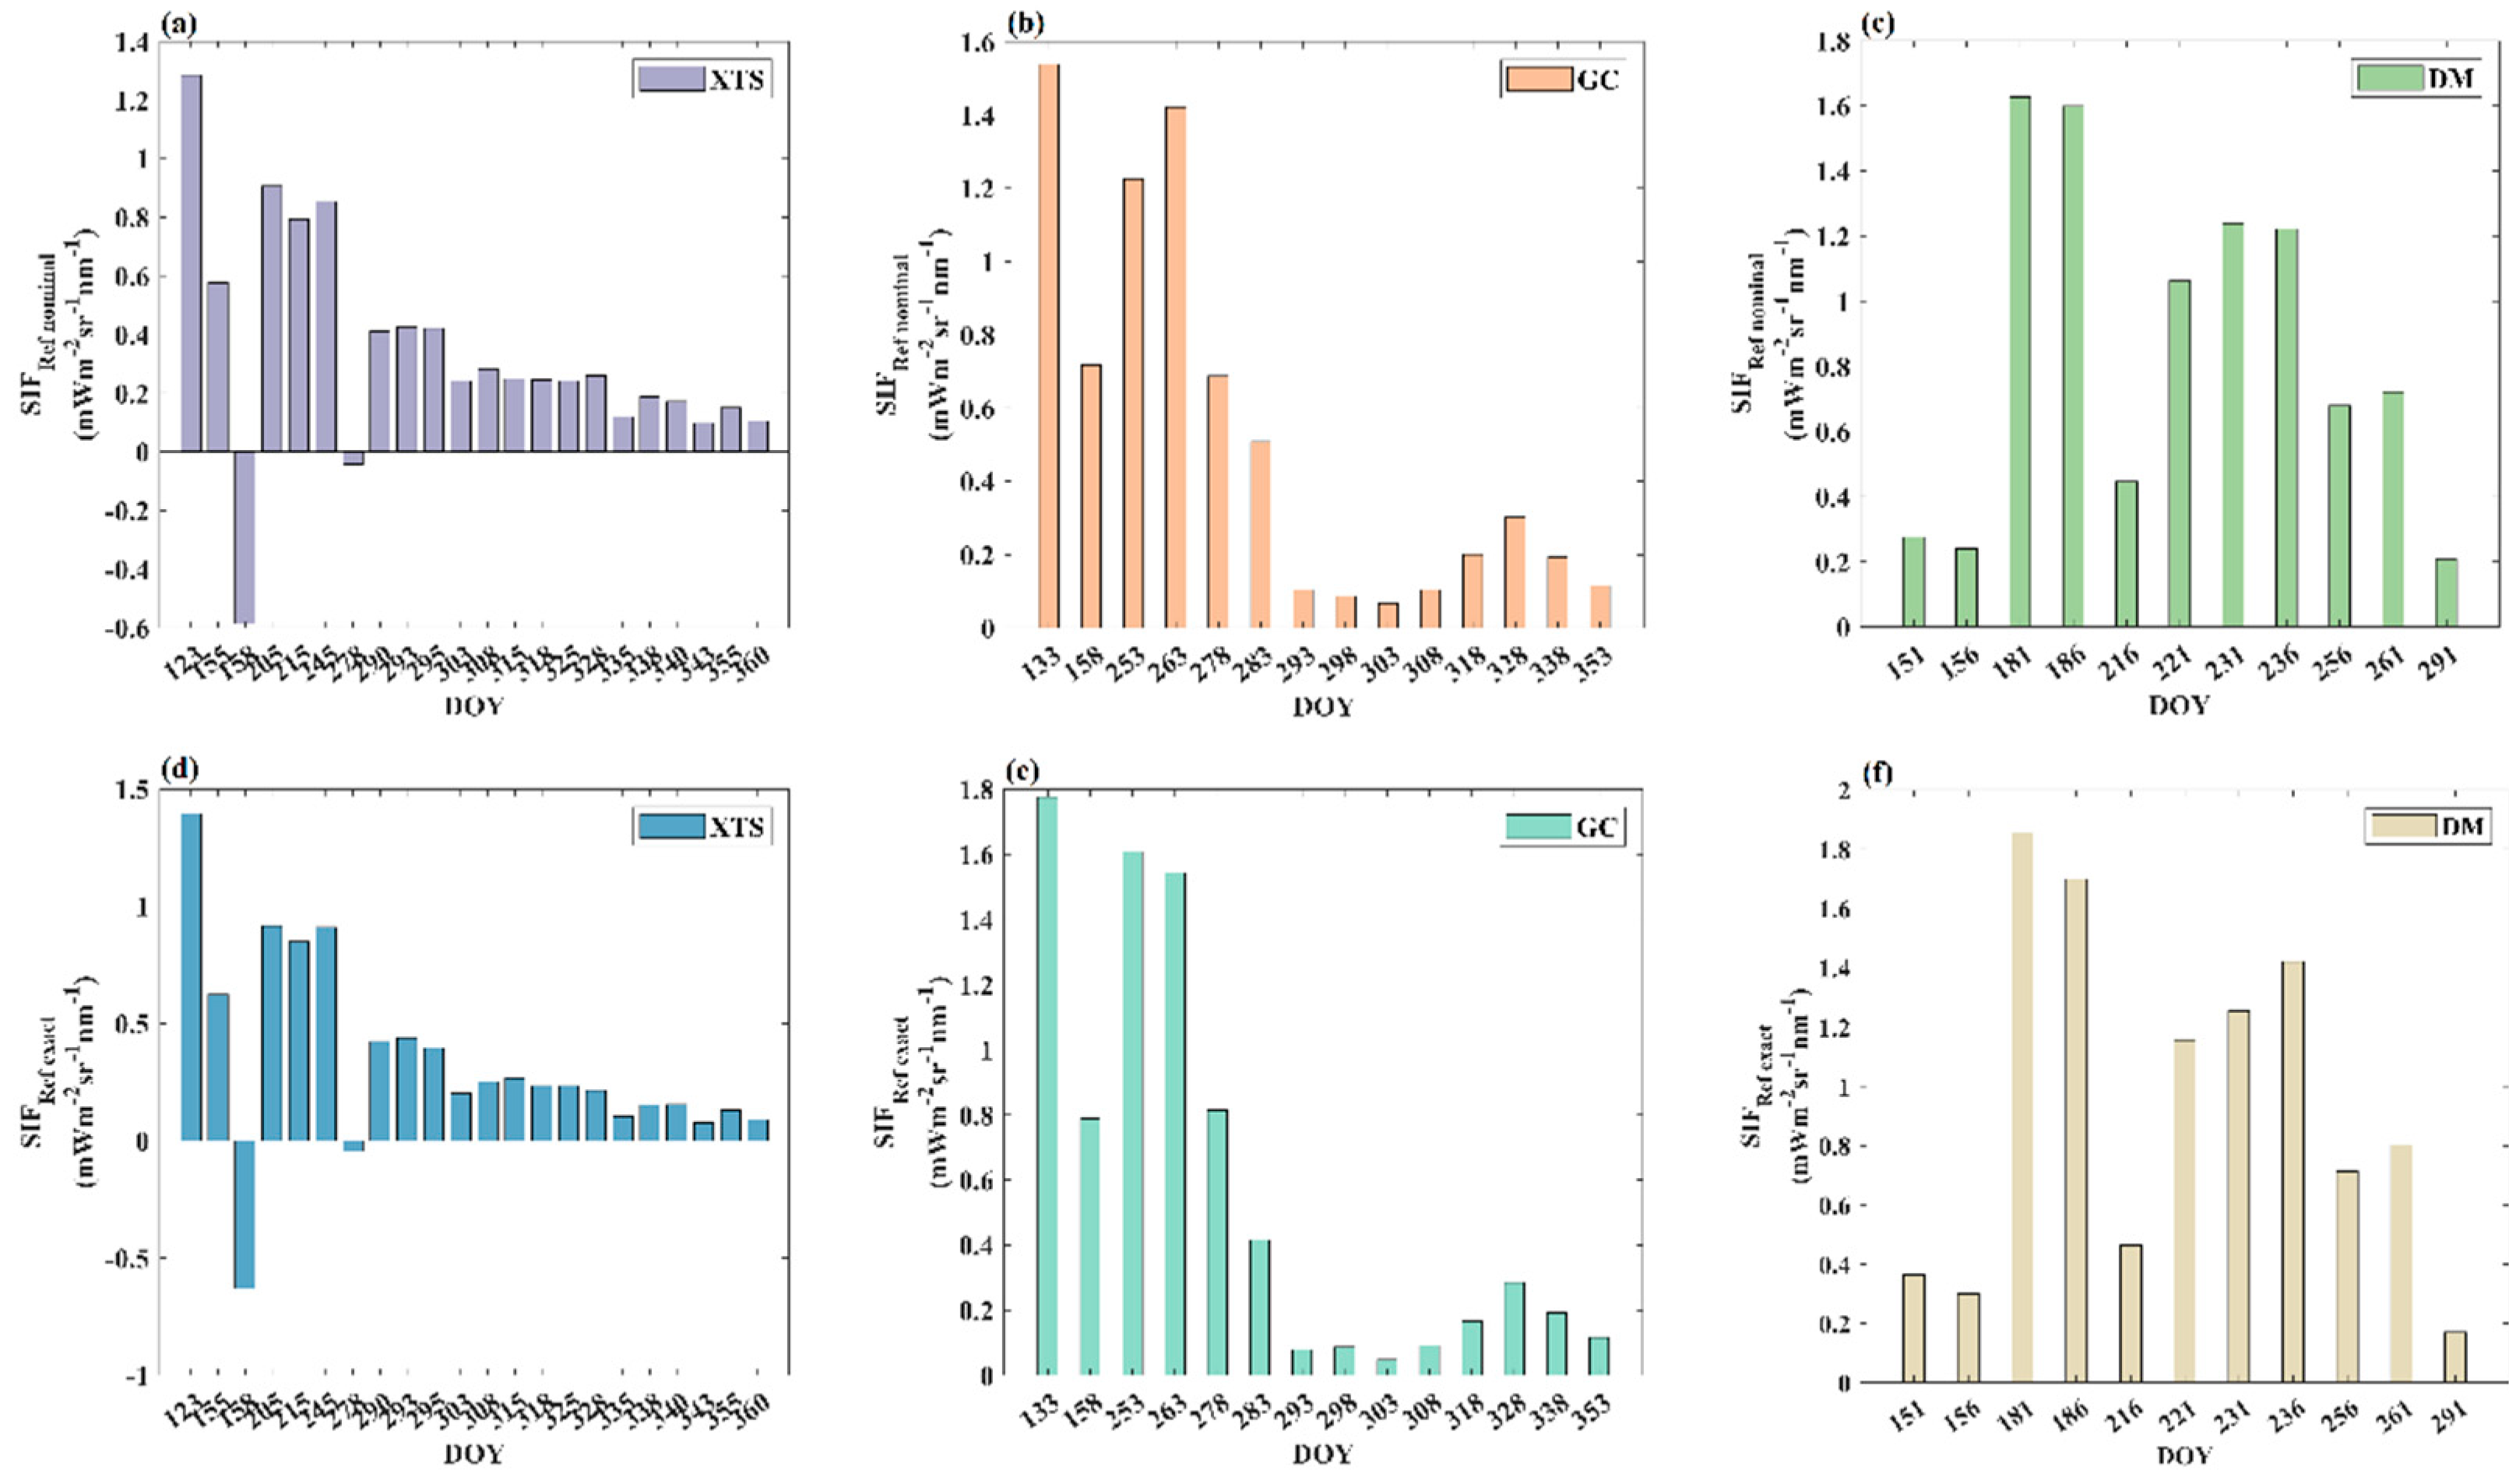
To illustrate the effect of geolocation mismatch on the validation of TROPOMI SIF products,
Figure 7a–f shows the
and
for TXS, DM, and GC sites at each time point. It can be seen that
and
show similar temporal variation characteristics throughout the experimental period. Hence, the geolocation shift of the validation pixel is not a main influencing factor on the temporal change trend of SIF. However, it is obvious that the magnitude of
is not always equal to
in the time series. Therefore, the effect of the geolocation shift of the validation pixel cannot be ignored when the magnitude of SIF is focused. Because it will lead to different interpretations of TROPOMI SIF product errors.
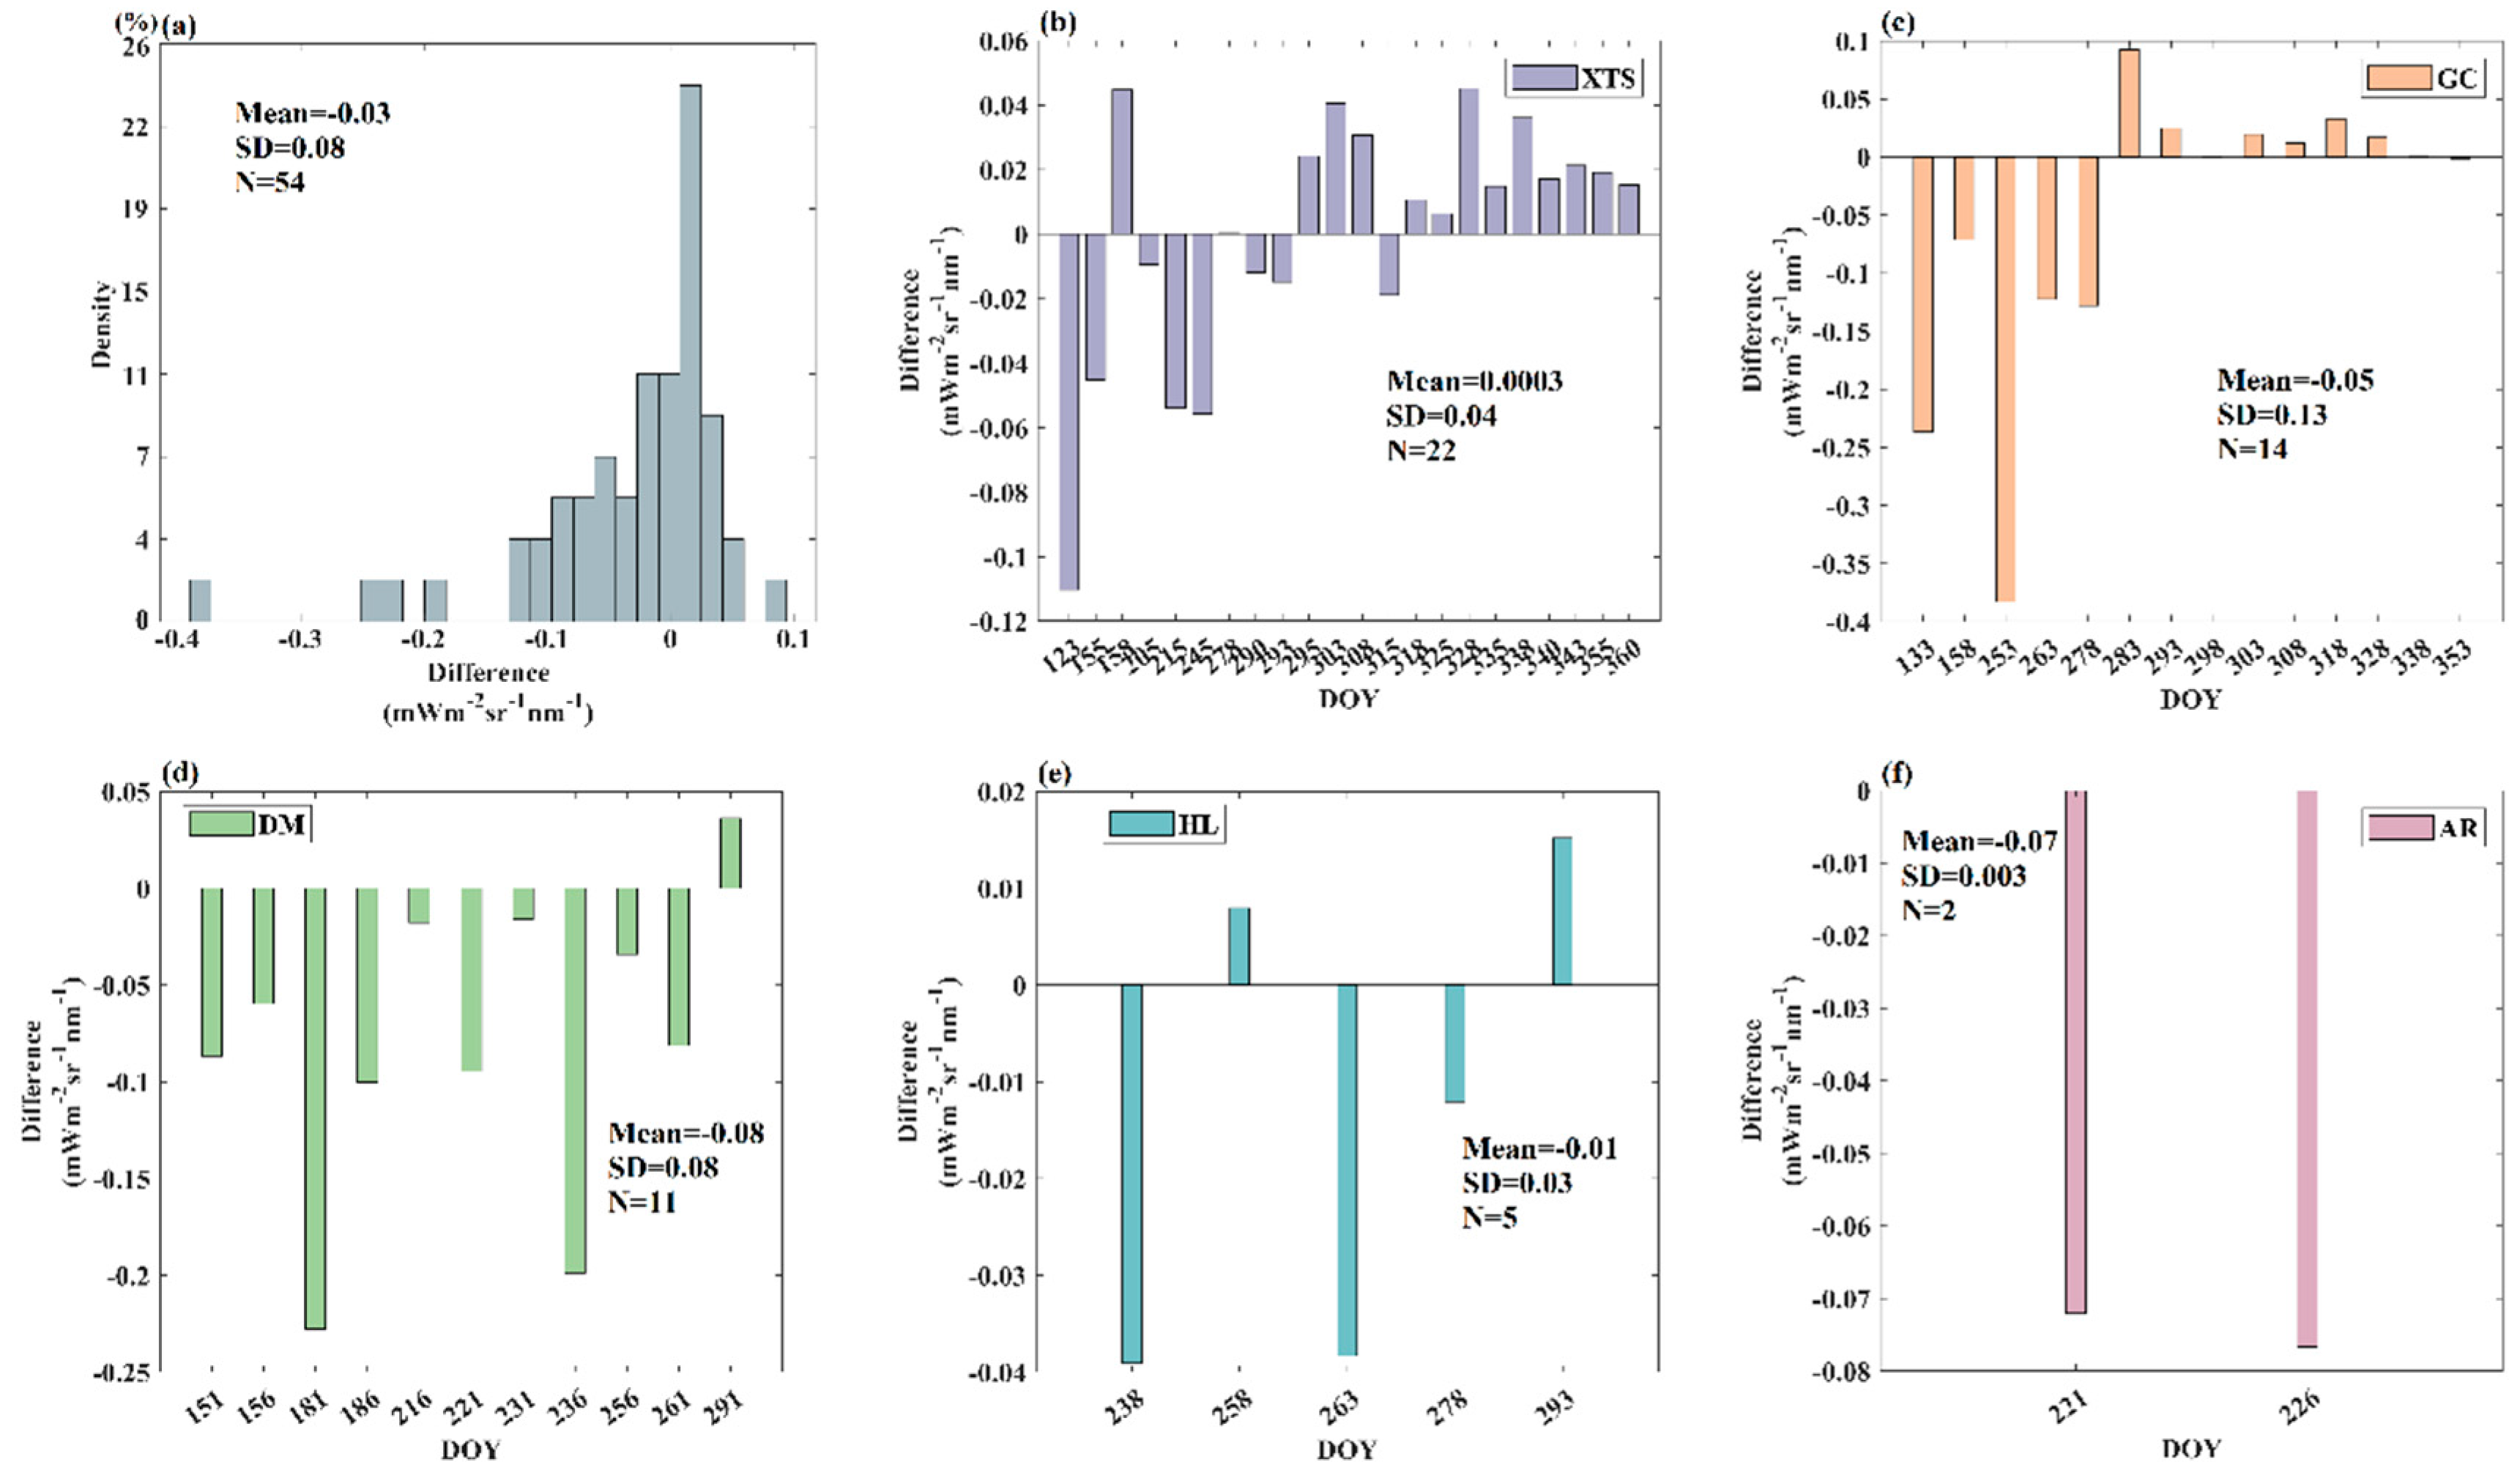
To show the influence of the geolocation shift of validation pixel on reference value more intuitively, we present the distribution of uncertainty and the relative uncertainty of the TROPOMI pixel scale SIF reference caused by geolocation shift in
Figure 8 and
Figure 9, respectively.
Figure 8a shows the frequency histogram of the uncertainty of pixel scale reference values by combining all the results of these five sites throughout the experimental period.
Figure 8b–f shows the day-by-day variation of the uncertainty of pixel scale reference for each site.
From
Figure 8a, it can be seen that the uncertainty caused by the geolocation shift of the TROPOMI validation pixel presents significant spatial and temporal variations, with values ranging from -0.38 to 0.09. Furthermore, negative values occur more frequently and have higher magnitudes compared to positive values, resulting in a mean uncertainty of -0.03 overall. When it comes to each specific site (
Figure 8b–f), it can be seen that all these sites show significant temporal variations regarding the uncertainty of pixel scale reference. This is partly due to the fact that the geolocation shift varies with time, and partly due to the temporal variation of spatial heterogeneity around the validation pixel. For instance, if the land surface around the validation pixel is absolutely homogeneous, then the geolocation mismatch would not cause errors regardless of the shift magnitude of the validation pixel. Nevertheless, it is noteworthy that the distribution characteristics of the uncertainty of pixel scale reference with time are not consistent between these sites. The uncertainties at GC, DM, HL, and AR sites are basically negative. By contrast, positive and negative values occur with almost equal frequency at XTS sites.
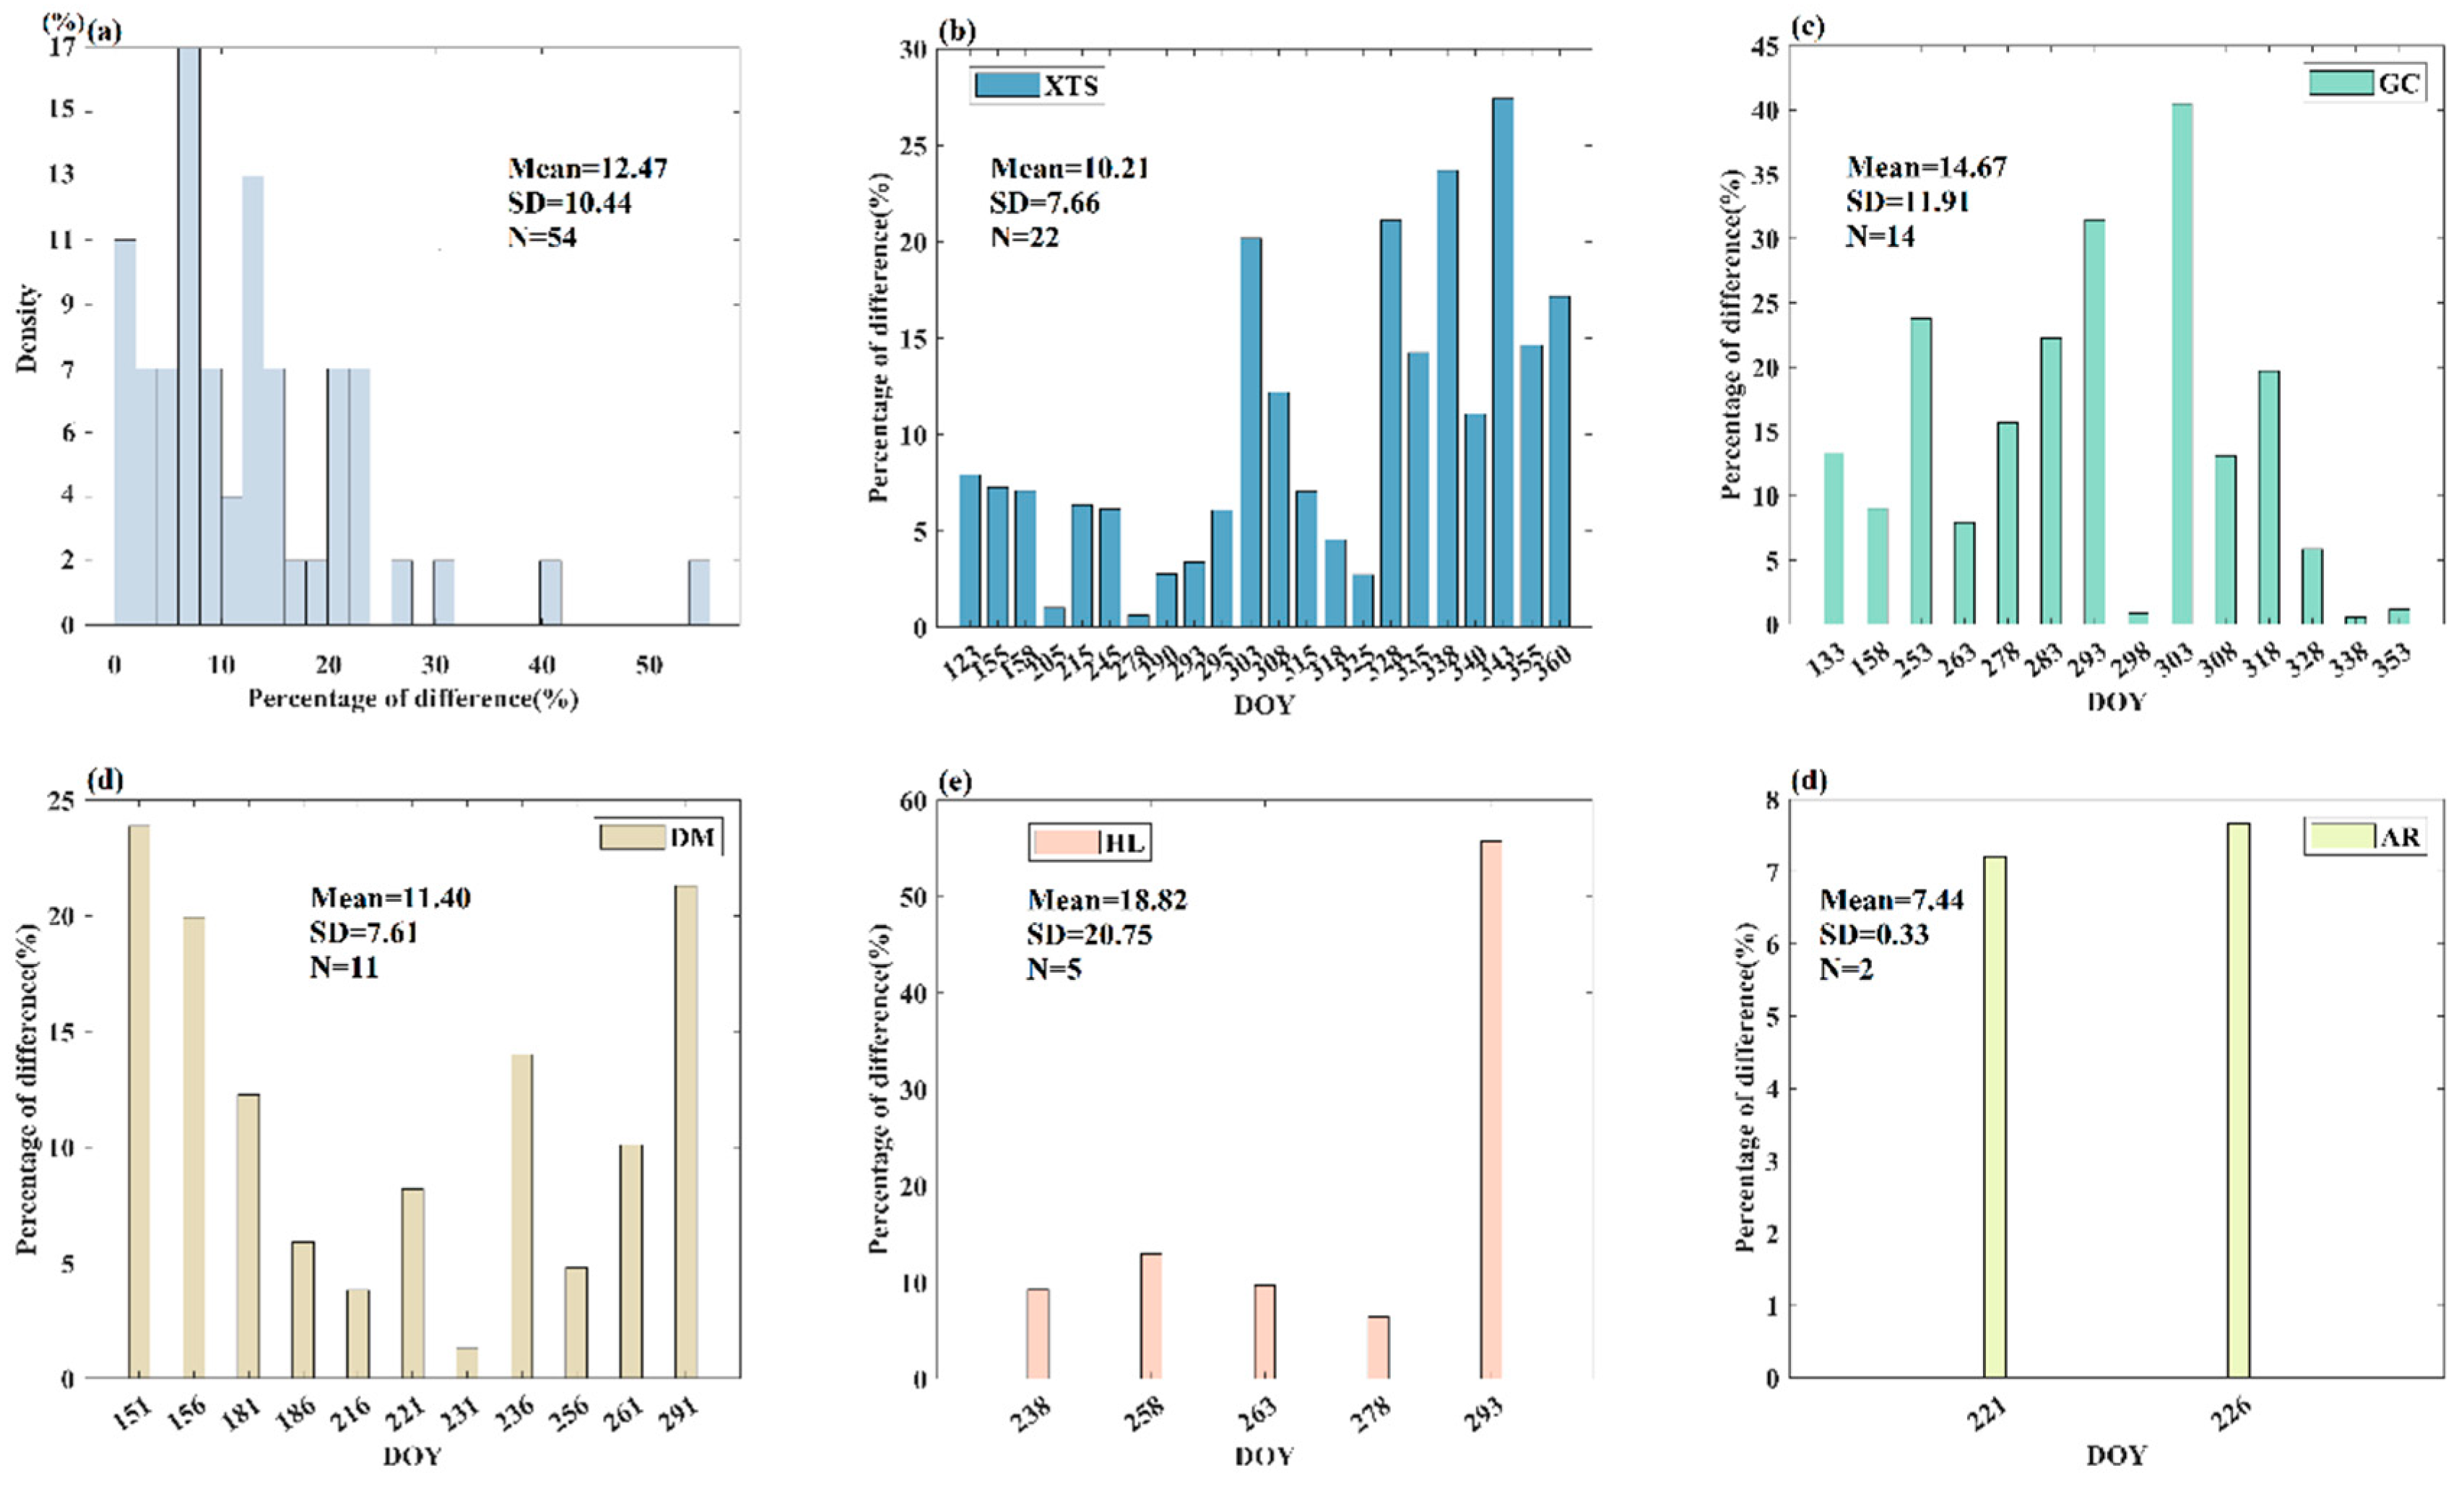
Considering that the magnitude of SIF values may have an influence on the uncertainty, we also calculated the relative uncertainty caused by the geolocation shift of the validation pixel (
Figure 9). Here, the absolute value was shown because only the magnitude of uncertainty was focused. It can be seen that most of the relative uncertainties are lower than 30%. But more than half (i.e., 42/54) of the time periods showed relative uncertainty larger than 5%. It is noteworthy that the maximum uncertainty caused by geolocation shift can be even larger than 50% (
Figure 9a).
The magnitude of the relative uncertainty caused by geolocation errors shows different temporal variation characteristics among these five sites. For instance, at the XTS site (
Figure 9b), the relative uncertainty is generally small in the growing season, with the values distributed around 5%, but becomes to be larger in the dormant season, with the values consistently larger than 10%. By contrast, at the DM sites, the relative uncertainty is large in the growing season occasionally. In particular, the relative uncertainty in the growing season is even larger than that in the dormant season (
Figure 9d). It is noteworthy that although the relative uncertainty at HL is generally distributed around 10%, there is a significantly large value of 55.7%. Hence, it is difficult to give a common conclusion about the magnitude of relative uncertainty caused by geolocation shift. Instead, such a kind of uncertainty should be quantified pixel-by-pixel for each time period in the validation of satellite SIF products, especially over heterogeneous surfaces.
5. Conclusions
The validation of TROPOMI SIF is an essential process to judge whether its accuracy is adequate for the intended use. Although some validation studies have been conducted through direct comparison with in-situ SIF retrievals or cross-comparison with similar satellite-based SIF or VI products, the impact of geolocation mismatch between validation pixel and reference data on validation results has not been taken into account. In fact, the geolocation mismatch is a big contributor to the uncertainty of validation results. This is particularly true over heterogeneous surfaces where the objects at the nominal and real locations may differ. Hence, it is necessary to quantify such a kind of uncertainty in order to determine whether the direct comparison between TROPOMI SIF and reference SIF is feasible and whether the validation results are rigorous and reliable.
This study, for the first time, quantifies the geolocation shift of the TROPOMI validation pixel and then the uncertainty caused by the geolocation mismatch between the TROPOMI SIF and reference SIF. It was found that the shift ranges from -3.92 km to 6.48 km and from -2.81 km to -2.80 km in the across- and along-track directions, respectively. The mean shifts are 0.07 km and 0.25 km in the across- and along-track directions respectively, indicating eastward shifts in the across-track direction in general and northward shifts in the along-track direction. The shift shows significant temporal variations with a standard deviation of 2.45 km and 1.96 km in the across- and along-track directions. In particular, the shifts are even opposite between adjacent times in two directions. When the magnitude of the shift is focused, the geolocation shift of the TROPOMI validation pixel are 2.09 km and 1.73 km in the across-track and along-track directions, respectively.
Regarding the influence of the geolocation shift of the validation pixel, it is not a main influencing factor on the temporal change trend of SIF, but it cannot be ignored when the magnitude of SIF is focused. More than half (42/54) of the time periods showed relative uncertainty larger than 5%, with the maximum even reaching 55.7%. Hence, the uncertainty caused by the geolocation shift of the validation pixel cannot be ignored, because it will lead to different interpretations of TROPOMI SIF product errors. However, it is important to note that this study is only limited to validation pixels from a specific period at five in-situ sites. Hence, whether the findings of this study can be applied to other regions is still an open question. More analyses will be made when more data are available in the future. But anyway, this study is the first step towards a more rigorous and reliable validation of the TROPOMI SIF products.
Author Contributions
Q.Z. conceived the original idea and designed the study. Q.Z. processed and analyzed the data and wrote the manuscript. X.W. provided insights on the revision of the manuscript and suggestions for improvement. Q.Z. and R.T. wrote the software code to verify the method. J.W. and X.L. provide help in data processing and mapping. J.W. and Q.X. funding acquisition. All authors have read and agreed to the published version of the manuscript.
Funding
Please add: This research was funded by the National Natural Science Foundation of China under Grant 42071296, and in part by the Fundamental Research Funds for the Central Universities (lzujbky-2022-09).
Data Availability Statement
The data that support the findings of this study are available from the website given in the manuscript.
Acknowledgments
We gratefully acknowledge the anonymous reviewers and editor of the paper in providing critical and constructive comments, which has helped us to significantly improve the manuscript. We also appreciate the assistance of the all authors of this paper.
Conflicts of Interest
The authors declare no conflict of interest.
References
- Frankenberg, C.; Fisher, J.B.; Worden, J.; Badgley, G.; Saatchi, S.S.; Lee, J.E.; Toon, G.C.; Butz, A.; Jung, M.; Kuze, A.; et al. New global observations of the terrestrial carbon cycle from GOSAT: Patterns of plant fluorescence with gross primary productivity. Geophys. Res. Lett. 2011, 38. [Google Scholar] [CrossRef]
- Guanter, L.; Zhang, Y.; Jung, M.; Joiner, J.; Voigt, M.; Berry, J.A.; Frankenberg, C.; Huete, A.R.; Zarco-Tejada, P.; Lee, J.-E.; et al. Global and time-resolved monitoring of crop photosynthesis with chlorophyll fluorescence. Proc. Natl. Acad. Sci. USA 2014, 111, E1327–E1333. [Google Scholar] [CrossRef]
- Gupana, R.S.; Odermatt, D.; Cesana, I.; Giardino, C.; Nedbal, L.; Damm, A. Remote sensing of sun-induced chlorophyll-a fluorescence in inland and coastal waters: Current state and future prospects. Remote Sens. Environ. 2021, 262, 112482. [Google Scholar] [CrossRef]
- Joiner, J.; Yoshida, Y.; Vasilkov, A.; Middleton, E. First observations of global and seasonal terrestrial chlorophyll fluorescence from space. Biogeosciences 2011, 8, 637–651. [Google Scholar] [CrossRef]
- Frankenberg, C.; O’Dell, C.; Berry, J.; Guanter, L.; Joiner, J.; Köhler, P.; Pollock, R.; Taylor, T.E. Prospects for chlorophyll fluorescence remote sensing from the Orbiting Carbon Observatory-2. Remote Sens. Environ. 2014, 147, 1–12. [Google Scholar] [CrossRef]
- Du, S.; Liu, L.; Liu, X.; Zhang, X.; Zhang, X.; Bi, Y.; Zhang, L. Retrieval of global terrestrial solar-induced chlorophyll fluorescence from TanSat satellite. Sci. Bull. 2018, 63, 1502–1512. [Google Scholar] [CrossRef]
- Guanter, L.; Bacour, C.; Schneider, A.; Aben, I.; van Kempen, T.A.; Maignan, F.; Retscher, C.; Köhler, P.; Frankenberg, C.; Joiner, J.; et al. The TROPOSIF global sun-induced fluorescence dataset from the Sentinel-5P TROPOMI mission. Earth Syst. Sci. Data 2021, 13, 5423–5440. [Google Scholar] [CrossRef]
- Porcar-Castell, A.; Malenovský, Z.; Magney, T.; Van Wittenberghe, S.; Fernández-Marín, B.; Maignan, F.; Zhang, Y.; Maseyk, K.; Atherton, J.; Albert, L.P.; et al. Chlorophyll a fluorescence illuminates a path connecting plant molecular biology to Earth-system science. Nat. Plants 2021, 7, 998–1009. [Google Scholar] [CrossRef]
- Wu, X.; Xiao, Q.; Wen, J.; You, D.; Hueni, A. Advances in Quantitative Remote Sensing Product Validation: Overview and Current Status. Earth-Sci. Rev. 2019, 196, 102875. [Google Scholar] [CrossRef]
- Joiner, J.; Yoshida, Y.; Guanter, L.; Middleton, E.M. New methods for the retrieval of chlorophyll red fluorescence from hyperspectral satellite instruments: simulations and application to GOME-2 and SCIAMACHY. Atmos. Meas. Tech. 2016, 9. [Google Scholar] [CrossRef]
- Sun, Y.; Frankenberg, C.; Jung, M.; Joiner, J.; Guanter, L.; Köhler, P.; Magney, T. Overview of Solar-Induced chlorophyll Fluorescence (SIF) from the Orbiting Carbon Observatory-2: Retrieval, cross-mission comparison, and global monitoring for GPP. Remote Sens. Environ. 2018, 209, 808–823. [Google Scholar] [CrossRef]
- Du, S.; Liu, L.; Liu, X.; Chen, J. First investigation of the relationship between solar-induced chlorophyll fluorescence observed by TanSat and gross primary productivity. IEEE J. Sel. Top. Appl. Earth Obs. Remote Sens. 2021, 14, 11892–11902. [Google Scholar] [CrossRef]
- Du, S.; Liu, X.; Chen, J.; Duan, W.; Liu, L. Addressing validation challenges for TROPOMI solar-induced chlorophyll fluorescence products using tower-based measurements and an NIRv-scaled approach. Remote Sens. Environ. 2023, 290, 113547. [Google Scholar] [CrossRef]
- Wu, X.; Wen, J.; Xiao, Q.; Liu, Q.; Peng, J.; Dou, B.; Li, X.; You, D.; Tang, Y.; Liu, Q. Coarse Scale in Situ Albedo Observations over Heterogeneous Snow-Free Land Surfaces and Validation Strategy: A Case of MODIS Albedo Products Preliminary Validation over Northern China. Remote Sens. Environ. 2016, 184, 25–39. [Google Scholar] [CrossRef]
- Cescatti, A.; Marcolla, B.; Santhana Vannan, S.K.; Pan, J.Y.; Román, M.O.; Yang, X.; Ciais, P.; Cook, R.B.; Law, B.E.; Matteucci, G. Intercomparison of MODIS albedo retrievals and in situ measurements across the global fluxnet network. Remote Sens. Environ. 2012, 121, 323–334. [Google Scholar] [CrossRef]
- Wu, X.; Wen, J.; Xiao, Q.; Bao, Y.; You, D.; Wang, J.; Ma, D.; Lin, X.; Gong, B. Quantification of the Uncertainty Caused by Geometric Registration Errors in Multiscale Validation of Satellite Products. IEEE Geosci. Remote Sens. Lett. 2022, 19, 1–5. [Google Scholar] [CrossRef]
- Tang, R.; Wu, X.; Wang, J.; Zheng, L.; Zeng, Q.; Wen, J.; Xiao, Q. A Geometric Location Matching Method for Validation of Satellite Products: A Case Study for Albedo. IEEE. Geosci. Remote Sens Lett. 2023, 19, 3001405. [Google Scholar] [CrossRef]
- Benediktsson, A. Image Registration for Remote Sensing. Cambridge,U.K.: Cambridge Univ. Press, 2009.
- Roy, D.P.; Kovalskyy, V.; Zhang, H.K.; Vermote, E.F.; Yan, L.; Kumar, S.S.; Egorov, A. Characterization of Landsat-7 to Landsat-8 reflective wavelength and normalized difference vegetation index continuity. Remote Sens. Environ. 2016, 185, 57–70. [Google Scholar] [CrossRef]
- Roy, D.P.; Li, J.; Zhang, H.K.; Yan, L.; Huang, H.; Li, Z. Examination of Sentinel-2A multi-spectral instrument (MSI) reflectance anisotropy and the suitability of a general method to normalize MSI reflectance to nadir BRDF adjusted reflectance. Remote Sens. Environ. 2017, 199, 25–38. [Google Scholar] [CrossRef]
- Roujean, J.L.; Leroy, M.; Deschamps, P.Y. A bidirectional reflectance model of the Earth’s surface for the correction of remote sensing data. J. Geophys. Res.: Atmos. 1992, 97, 20455–20468. [Google Scholar] [CrossRef]
- Schaaf, C.B.; Gao, F.; Strahler, A.H.; Lucht, W.; Li, X.; Tsang, T.; Strugnell, N.C.; Zhang, X.; Jin, Y.; Muller, J.-P.; et al. First operational BRDF, albedo nadir reflectance products from MODIS. Remote Sens. Environ. 2002, 83, 135–148. [Google Scholar] [CrossRef]
- Turner, A.J.; Köhler, P.; Magney, T.S.; Frankenberg, C.; Fung, I.; Cohen, R.C. A double peak in the seasonality of California’s photosynthesis as observed from space. Biogeosciences 2020, 17, 405–422. [Google Scholar] [CrossRef]
- Zeng, Y.; Badgley, G.; Dechant, B.; Ryu, Y.; Berry, J.A. A practical approach for estimating the escape ratio of near-infrared solar-induced chlorophyll fluorescence. Remote Sens. Environ. 2019, 232, 111209. [Google Scholar] [CrossRef]
- Zhang, Y.; Zhang, Q.; Liu, L.; Zhang, Y.; Wang, S.; Ju, W.; Zhou, G.; Zhou, L.; Tang, J.; Zhu, X.; et al. ChinaSpec: A Network for Long-Term Ground-Based Measurements of Solar-Induced Fluorescence in China. J. Geophys. Res. Biogeosci. 2021, 126, e2020JG006042. [Google Scholar] [CrossRef]
- Yu, G.R.; Wen, X.F.; Sun, X.M.; Tanner, B.D.; Lee, X.H.; Chen, J.Y. Overview of ChinaFLUX and evaluation of its eddy covariance measurement. Agric. For. Meteorol. 2006, 137, 125–137. [Google Scholar] [CrossRef]
- Du, S.; Liu, L.; Liu, X.; Guo, J.; Hu, J.; Wang, S.; Zhang, Y. SIFSpec: Measuring solar-induced chlorophyll fluorescence observations for remote sensing of photosynthesis. Sensors 2019, 19, 3009. [Google Scholar] [CrossRef] [PubMed]
- Guanter, L.; Frankenberg, C.; Dudhia, A.; Lewis, P.E.; Gómez-Dans, J.; Kuze, A.; Suto, H.; Grainger, R.G. Retrieval and global assessment of terrestrial chlorophyll fluorescence from GOSAT space measurements. Remote Sens. Environ. 2012, 121, 236–251. [Google Scholar] [CrossRef]
- Lin, X.; Wu, S.; Chen, B.; Lin, Z.; Yan, Z.; Chen, X.; Yin, G.; You, D.; Wen, J.; Liu, Q. Estimating 10-m land surface albedo from Sentinel-2 satellite observations using a direct estimation approach with Google Earth Engine. ISPRS J. Photogramm. Remote Sens. 2022, 194, 1–20. [Google Scholar] [CrossRef]
- Yang, J.; Huang, X. The 30 m annual land cover dataset and its dynamics in China from 1990 to 2019. Earth Syst. Sci. Data 2021, 13, 3907–3925. [Google Scholar] [CrossRef]
Figure 1.
Workflow of quantifying the uncertainty caused by the geolocation errors of the TROPOMI pixel.
Figure 1.
Workflow of quantifying the uncertainty caused by the geolocation errors of the TROPOMI pixel.
Figure 2.
The locations and land-cover types of these five sites used in this study. The base land-cover map was extracted from the 30m annual land-cover dataset (i.e., CLCD) of 2020 developed by Wuhan University (
https://zenodo.org/record/8176941).
Figure 2.
The locations and land-cover types of these five sites used in this study. The base land-cover map was extracted from the 30m annual land-cover dataset (i.e., CLCD) of 2020 developed by Wuhan University (
https://zenodo.org/record/8176941).
Figure 3.
Variation of for each shift combination (a-b) and their histogram distribution (c-d). The Y-axis and X-axis represent the along-track and across-track directions, respectively. +Y and + X indicate the shift to the north and east, respectively. The actual displacement of the validation pixel is determined by the minimum absolute difference between and The geolocation error can be converted to distance in kilometers by multiplying the grid location by 10 m.
Figure 4.
The geometric shift of the validation pixels in the across-track directions. (a) display the histogram distribution of the across-track directions shifts of the validation pixel during the experimental period. (b-f) present the day-by-day shift of the validation pixel at each site in the across-track directions.
Figure 5.
The geometric shift of the validation pixels in the along-track directions. (a) display the histogram distribution of the across-track directions shifts of the validation pixel during the experimental period. (b-f) present the day-by-day shift of the validation pixel at each site in the along-track directions.
Figure 6.
The nominal (black square) and exact (red square) location of the validation pixel corresponding to the in-situ site. (a), (b) and (c) represent the nominal and actual positions of the validation pixels at the XTS sites on October 16, 2020, October 19, 2020, and October 21, 2020, respectively. (c), (d) and (f) represent the nominal and actual positions of the validation pixels at the XTS, HL, and GC sites on October 4, 2020, respectively.
Figure 7.
The value of TROPOMI pixel scale reference SIF at the nominal ()(up) and real () (down) locations, respectively. The first to third columns present the results for XTS, DM, and GC sites, respectively.
Figure 7.
The value of TROPOMI pixel scale reference SIF at the nominal ()(up) and real () (down) locations, respectively. The first to third columns present the results for XTS, DM, and GC sites, respectively.
Figure 8.
The uncertainty caused by the geolocation shift of the TROPOMI validation pixel. (a) display the histogram distribution of the uncertainty () caused by the geolocation shift of the validation pixels at these five sites throughout the experimental period. (b-f) present the day-by-day variation of the errors of reference values caused by the geolocation shift of the validation pixels for each site.
Figure 9.
The relative uncertainty (%) caused by the geolocation shift of the TROPOMI validation pixel. (a) display the histogram distribution of relative uncertainty (%) caused by the geolocation shift of validation pixels at these five sites throughout the experimental period (b-f) present the day-by-day variation of the relative uncertainty (%) caused by the geolocation shift of validation pixels for each site.
|
Disclaimer/Publisher’s Note: The statements, opinions and data contained in all publications are solely those of the individual author(s) and contributor(s) and not of MDPI and/or the editor(s). MDPI and/or the editor(s) disclaim responsibility for any injury to people or property resulting from any ideas, methods, instructions or products referred to in the content. |
© 2023 by the authors. Licensee MDPI, Basel, Switzerland. This article is an open access article distributed under the terms and conditions of the Creative Commons Attribution (CC BY) license (http://creativecommons.org/licenses/by/4.0/).
