Preprint
Article

Assessing the In Vitro Cytotoxicity, Antitumoral and Antioxidant Properties of Polyphenol‐rich Perilla leaves Extracts

Altmetrics

Downloads

133

Views

65

Comments

0

A peer-reviewed article of this preprint also exists.

Submitted:

23 November 2023

Posted:

24 November 2023

You are already at the latest version

Alerts
Abstract
(1) Background: This study aimed to outline the antitumoral, antioxidant, and cytotoxic proprie-ties of various types of Perilla frutescens extracts obtained from the leaves of the species; (2) Methods: We determined total polyphenols, flavonoids and anthocyanins contents, as well as the in vitro antioxidant, antitumoral, and cytotoxic actions in 3 types of ethanolic extracts (E1, E2, E3) and in 3 types of ethanol: acetone extracts (A1, A2, A3) of Perilla frutescens according to standardized procedures; (3) Results: We found that Perilla frutescens ethanolic extracts had higher total phenol concentrations (p= 0.002). Flavonoids and anthocyanins concentrations were not statistically different between the two extracts. The iron chelating capacity, hydroxyl radical scavenging capacity, superoxide anion radical scavenging capacity, and lipoxygenase inhibition capacity showed a significant increase with higher concentrations of Perilla frutescens extracts, particularly the ethanolic extracts. Perillyl alcohol had greater cytotoxic capacity on MG-63 cell line and E1 extract showed similar significant cytotoxic effects on A431 cell line; (4) Conclusions: Both ethanolic and ethanol: acetone extracts from Perilla frutescens exhibited important antioxi-dant and antitumoral actions in vitro, which proportionally increased with concentration. The cytotoxic threshold determined in this study for various types of extracts could help determine the best dosage with the maximum antioxidant and antitumoral potential.
Keywords: 
Subject: Medicine and Pharmacology  -   Pharmacology and Toxicology

1. Introduction

Perilla frutescens (L.) Britton var. frutescens is a medicinal herb that possesses important antioxidant and antitumoral effects demonstrated both in vitro and in vivo [1,2]. Numerous types of extracts and components have been identified from this plant until present times, each comprising a specific portfolio of biochemical activities and cytotoxic effects.
A recent systematic review outlined 14 classes of Perilla frutescens active constituents: alkaloids phenylpropane, terpenoids, polyphenol compounds, flavonoids, anthocyanins, coumarins, carotenoids, neolignans, fatty acids, tocopherols, phytosterols, glucosides and peptides [3]. These classes reunite a plethora of compounds that have antitumoral effects by modulating various elements of the metabolic pathways or intercellular interactions such as reactive oxidative species (ROS), Nuclear factor kappa-light-chain-enhancer of activated B cells (NF-κB), phosphoinositide 3-kinase /protein kinase B (PI3K/AKT), c-Jun N-terminal kinases (JNK), Yes-associated protein/WW domain-containing transcription factor (YAP/TAZ), etc [3,4].
The antioxidant proprieties of Perilla frutescens extracts were demonstrated in numerous trials and have an important impact over the evolution of metabolic or degenerative disorders [5,6,7]. The metabolite profiles of Perilla frutescens extracts vary depending on the species, part of plant used, type of extract, or method of determination, thus rendering numerous study possibilities of their antioxidant proprieties.
During inflammatory processes, a large amount of superoxide radicals, along with other radicals, is produced by activated neutrophils and macrophages under the action of NAD(P)H oxidase. These free radicals generated in the inflammatory focus can induce local and general toxic phenomena. Anti-inflammatory drugs reduce the synthesis of pro-inflammatory compounds, but generally do not have the ability to neutralize the pro-oxidant compounds generated during the inflammatory process. Thus, compounds with antioxidant action can represent an important therapeutic option [8,9,10].
Polyphenols, effective antioxidants identified from Perilla frutescens extracts, are secondary metabolites that have the ability to neutralize hydroxyl and superoxide radicals, to block the oxidizing action of peroxynitrite that affects the structure of biologically active molecules and to chelate pro-oxidizing transitional metals. The antioxidant action is complemented by the anti-inflammatory, antibacterial, enzyme inhibitory and antimutagenic [11].
Flavonoids act as scavengers of free radicals due to their ability to donate hydrogen atoms to radicals and stabilize them. The scavenger capacity of flavonoids depends on their structure, on the number of hydroxyl groups in the structure, on the position of these hydroxyl groups, and on the ability of the hydroxyl groups to give up hydrogen atoms [12].
The scavenging capacity of free radicals is conditioned by the presence of hydroxy groups in the 3', 4' positions of the B ring in the flavonoid structure (Figure 1). The hydroxy groups in the 3', 4' positions of the B ring also influence the ability of flavones to fix transition metals. Methoxylation of hydroxy groups causes the disappearance of the scavenger action [13]. An important role is also played by the OH group in position 3 of ring C. The C2-C3 double bond conjugated with a keto group in position 4 determines the delocalization of electrons in the B nucleus and increases the scavenger capacity of free radicals, while the reduction of this bond will the scavenger potential of the flavone decreased without the antiradical action disappearing [12].
The presence of the hydroxyl group in positions 3 (nucleus A) and 5 (nucleus C) and a carbonyl group in position 4 (nucleus C) increases the scavenger capacity. In the absence of o-dihydroxy groups in the structure of the B nucleus, the hydroxy groups in the A nucleus are capable of inducing the scavenger action of free radicals [12]. The position of hydroxyl groups in the structure of flavonoids is more important compared to their number.
The most active flavonoids are those that have hydroxyl groups in positions 3 and 4 of nucleus B and/or hydroxyl groups in position 3 of nucleus C. Hydroxyl groups in nucleus B also increase the stability of flavonoids. Flavones that do not have OH groups in the B nucleus, but have an OH group in position 3 of the C nucleus and a keto group in position 4, have the scavenger action [10].
Glycosylation at the carbon atom increases the antioxidant character, and glycosylation at the oxygen atom decreases the antioxidant capacity [11].
Flavones can inhibit enzymes that catalyze the synthesis of reactive oxygen species, such as NADH oxidase, mitochondrial succinoxidase and microsomal monooxygenase. They also increase the activity of antioxidant enzymes: superoxide dismutase, catalase, glutathione peroxidase and glutathione reductase [14,15].
This study will comprise three parts corresponding to our primary objectives: a) quantification of the total flavonoid, polyphenols, and anthocyanin content of various types of Perilla frutescens extracts; b) determination of the in vitro antioxidant action of Perilla frutescens extracts; c) characterization of the in vitro cytotoxic and antitumoral activity of Perilla frutescens extracts.

2. Materials and Methods

2.1. The extraction processes

The study focused on the chemical analysis of two types of extracts, obtained by processing the plant material harvested from three varieties of Perilla frutescens species, namely Perilla frutescens var. crispa f. purpurea, Perilla frutescens var. frutescens f. crispidiscolor, and Perilla frutescens var. frutescens f. viridis. The plant material consisted of leaves harvested in September 2020 at the Vegetable Research and Development Station in Buzău, Romania.
The harvested leaves were dried to a constant weight over a period of three weeks. They were placed on white paper sheets in a thin layer in a dark and well-ventilated room at a temperature of 23°C. The plant material was used to obtain two types of extracts, which were employed for both qualitative and quantitative chemical characterization of polyphenolic compounds.
For the first type of extract, 2 grams of pulverized plant material were placed in round-bottom flasks and 50 mL of 70% ethanol were added. The mixture was subjected to reflux extraction at a temperature of 70°C using a thermostatic water bath for a duration of 6 hours, a process repeated twice. The extraction products were filtered and then combined.
In the case of the second type of extract, 2 grams of pulverized plant material were placed in iodometric flasks, and 100 mL of a solvent mixture of acetone: ethanol (7:3) and 0.5 grams of citric acid were added. Each flask was equipped with a magnetic stir bar, tightly sealed, and subjected to extraction on a magnetic stirrer for 6 hours at room temperature. This process was repeated twice. Following extraction, the obtained filtrates were combined.
The extracts obtained, after combining the filtrates, were transferred into porcelain capsules and left at room temperature for concentration and drying. The resulting extracts were utilized for both chemical and biological characterization.

2.2. Total flavonoids, phenols, and anthocyanins quantification

Flavonoids were quantified as previously described and their concentration was expressed as rutoside equivalents (µg/mL). Briefly, 5 mL of each extract sample was mixed with 5.0 mL of 100 g/L sodium acetate and 3.0 mL of 25 g/L aluminum chloride. Methanol was added up to 25 ml in a graduated flask. The absorbance corresponding to the yellow color of the complex was photometered at 430 nm.
Total polyphenols were quantified according to the well-established methodology. For this, 40 microliters of the solution of each extract were mixed with 3160 microliters of distilled water and 200 microliters of Folin-Ciocâlteu reagent. After 5 minutes, 600 microliters of 20% sodium carbonate solution were added. After 2 hours for incubation in the dark, the absorbance of the mixture was read at λ= 716 nm against a compensation liquid consisting of 40 μl extract solution, 3760 μl distilled water and 200 μl Folin-Ciocâlteu reagent.
Staring from the method described by Giusti and Wrolstad in 2001, the total anthocyanin content was evaluated by using two dilutions of the same extract and changing the pH between 1.0 and 4.5. It is known that the chemical form of anthocyanin radicals (oxonium) has different absorption spectra when the acidic environment changes [16].
A quota from each extract was diluted to 10 mL in two volumetric flasks, adjusting the pH to 1.0 (potassium chloride buffer), and the other to pH 4.5 (sodium acetate buffer), mixing continuously. After an equilibration time (15 min.-20 min.), the absorbance of each dilution was measured at 510 nm and then 700 nm against a blank of distilled water. The difference between each measurement at both pH values represents the corrected absorbance used for further calculation.
Calibration curves were established in parallel for each group of components, using the same methodology.
In the present research, a Thermo Fischer UltiMate 3000 ultra-fast system coupled with a multi-diode detector (DAD), quaternary pump (LPG-3400 SD) with built-in four-channel degasser and an autosampler (injecting variable amounts from 2 μL to 200 μL) allowing the consecutive analysis of 120 samples was used. The UV-VIS detection range is between 190 nm and 800 nm. The integration program (Thermo Scientific™ Dionex™ Chromeleon™ 7.3) includes a database that can be improved by adding standards and calibrating them. The chemical profile of polyphenols was established by ultra-performance liquid chromatography (UPLC) techniques under the following conditions:
  • column - Kinetex C18 (150 x 4.6 mm, 100 Å);
  • mobile phase consisting of a mixture of type A/B obtained automatically during the analysis with the help of the quaternary pump: acetonitrile (A), aqueous solution of acetic acid 0.1% (B) with a gradient of 10 to 65 A in B;
  • initial and final flow rate 1 mL/min, 0.8 mL during the determinations;
  • injected volume comprised between 5 -10 µL samples diluted in acidified hydroalcoholic solution and standards dissolved in the same solvent;
  • simultaneous detection at three wavelengths 275 nm (flavonoids), 330 nm (polyphenolic acids), 520 nm (anthocyanins);
  • elution time 25 minutes;
The identification of the components was carried out with the help of the spectra from the database of the processing software and those from the specialized literature, based on the identity of the spectrum and retention time, a series of components present in the investigated extractive fractions could be highlighted.
At the same time, the purity factor of each peak was taken into account, considering exclusively the values ​​for the compounds where the purity exceeded 900 plateaus out of 1000 (maximum). For the correct quantitative assessment, two standard scales obtained under the same conditions as those presented above were used.
At the same time, rosmarinic acid and rutoside were chosen, of which 1 µL, 2 µL, 5 µL, 10 µL and 20 µL of 4 mg/mL solution solubilized in Chromasolv methanol were injected in turn. In this way, the standard curves were obtained for which the linearity was checked and the slope factor was with the value of 0.9990.

2.3. Iron Chelation Capacity Assessment

Principle of the Method: Fe2+ forms a pink-colored complex with ferrozine, exhibiting maximum absorbance at 562 nm. The presence of a chelating agent in the reaction medium results in reduced absorbance of the formed complex, leading to a decrease in the solution's color intensity [17,18]. A list of the reagents used for this procedure is presented as supplementary material S1.
The procedure consisted of the following steps:
  • Mix 0.2 mL of the test sample solution in ultrapure water, 0.74 mL of 0.1 M acetate buffer (pH 5.25), and 0.02 mL of 2 mM iron sulfate in 0.2 M hydrochloric acid. After 10-15 seconds of agitation, add 0.04 mL of 5 mM ferrozine solution.
  • After 10 minutes of incubation in the dark, measure the absorbance of the solution at 562 nm against a control prepared under the same conditions as the sample (ultrapure water was used instead of iron sulfate solution).
  • Simultaneously, prepare the control solution and its control: the control contains 0.2 mL of ultrapure water, 0.74 mL of 0.1 M acetate buffer (pH 5.25), 0.02 mL of 2 mM iron sulfate in 0.2 M hydrochloric acid, and 0.04 mL of 5 mM ferrozine solution.
  • Gallic acid was used as a reference substance, and gallic acid solutions in DMSO were processed under the same conditions as the methanolic extract.
  • All determinations were carried out in triplicate, and results are expressed as the mean of three determinations ± standard deviation.
The chelating capacity of the ferrous ion was calculated using the formula:
% Activity = 100 x (Ac - Ap) / (Ac)
Were:
Ac is the absorbance of the control solution.
Ap is the absorbance of the sample solution.
For samples exhibiting a ferrous ion chelation capacity of over 50%, the CE50 value was calculated and expressed in mg of sample/mL of final solution. CE50 was calculated by considering the first value below 50% and the first value above 50%, and interpolating linearly to determine the concentration of the antioxidant agent corresponding to 50% activity.

2.4. Determination of Hydroxyl Radical Scavenging Capacity

Principle of the Method: The hydroxyl radical, formed in the reaction between ferrous ion and hydrogen peroxide, will hydroxylate salicylic acid, resulting in the formation of a pink-violet compound with maximum absorbance at 562 nm [19]. A list of the reagents used for this procedure is presented as supplementary material S1.
Over 0.225 mL of the sample solution in dimethyl sulfoxide, 0.750 mL of 1.5 mM ferrous sulfate solution, 0.9 mL of 20 mM sodium salicylate solution, and 0.525 mL of 6 mM hydrogen peroxide solution were added. The mixture was kept at 37°C for 30 minutes, and after cooling to room temperature, the absorbance of the sample (control) was read at 562 nm against the sample's (control's) blank in which the ferrous sulfate solution was replaced with distilled water. The positive control was processed under the same conditions as the samples, but dimethyl sulfoxide was used in place of the sample solution.
Gallic acid was used as a reference substance, and gallic acid solutions in DMSO were processed under the same conditions as the methanolic extract. All determinations were performed in triplicate, and the results are expressed as the mean of three determinations ± standard deviation.
The hydroxyl radical scavenging capacity was calculated according to the formula:
% Activity = 100 x (Ac - Ap) / (Ac)
Were:
Ac is the absorbance of the control solution.
Ap is the absorbance of the sample solution.
For the samples that exhibited a hydroxyl radical scavenging capacity of over 50%, the CE50 value was calculated and expressed in µg of sample/mL of the final solution or µg of gallic acid/mL. CE50 was calculated by considering the first value lower than 50% and the first value higher than 50%, obtaining, through linear interpolation, the concentration of the antioxidant solution that corresponds to a 50% activity.

2.5. Determining the scavenging capacity of the superoxide radical anion

Principle of the Method: The superoxide radical generated by the reduced nicotinamide adenine dinucleotide-phenazine methosulfate system reduces nitroblue tetrazolium to a violet-blue formazan compound with maximum absorbance at 560 nm [20]. A list of the reagents used for this procedure is presented as supplementary material S1.
Over 0.5 mL of sample solution in dimethyl sulfoxide (diluted solutions in dimethyl sulfoxide) 0.5 mL of 557 µM NADHNa2 solution in TRIS buffer pH 8, and 0.5 mL of 108 µM nitroblue tetrazolium solution in TRIS buffer pH 8 were added. The mixture was vortexed for 5 seconds. To the mixture, 0.5 mL of 45 µM phenazine methosulfate solution in TRIS buffer pH 8 was added, and it was allowed to stand for 5 minutes at room temperature. Afterward, the absorbance of the sample (control) was measured against the sample control at 560 nm. The positive control was processed under the same conditions as the samples, but dimethyl sulfoxide was used instead of the sample solution.
Gallic acid was used as a reference substance, and solutions of gallic acid in DMSO were processed under the same conditions as the methanolic extract. All determinations were performed in triplicate, and the results were expressed as the mean of three determinations ± standard deviation.
The hydroxyl radical scavenging capacity was calculated according to the formula:
% Activity = 100 x (Ac - Ap) / (Ac)
Where:
Ac is the absorbance of the control solution.
Ap is the absorbance of the sample solution.
For the samples that exhibited a superoxide radical scavenging capacity of over 50%, the CE50 value was calculated and expressed in µg sample/mL final solution or µg gallic acid/mL. The CE50 was calculated by considering the first value lower than 50% and the first value higher than 50%, and then obtaining, through linear interpolation, the concentration of the antioxidant solution corresponding to a 50% activity.

2.6. Determination of the lipoxygenase inhibition capacity of Perilla frutescens extracts

Principle of the Method: The active compounds present in the extracts block 15-lipoxygenase by inhibiting the oxidation of linoleic acid and reducing absorbance at 234 nm [21]. A list of the reagents used for this procedure is presented as supplementary material S1.
0.05 mL of 15-lipoxygenase solution in borate buffer pH 9 was treated with 0.05 mL of the diluted test solution in DMSO, and the mixture was left to stand for 10 minutes at room temperature. Afterward, 2 mL of 0.16 mM linoleic acid solution in 0.1M borate buffer pH 9 was added. The absorbance of the solution was recorded at 234 nm within the 0-120 second interval. In parallel, a positive control was processed in which the test solution was replaced with DMSO.
Gallic acid was used as a reference substance, and solutions of gallic acid in DMSO were processed under the same conditions as the ethanolic extract. All determinations were carried out in triplicate, and the results were expressed as the mean of three determinations ± standard deviation.
The lipoxygenase inhibition capacity was calculated using the formula:
% Activity = (AEFI – AECI) * 100/AEFI
Where:
AEFI - represents the difference between the absorbance of the enzyme solution without an inhibitor at 90 seconds and the absorbance of the same solution at 30 seconds;
AECI - represents the difference between the absorbance of the enzyme solution treated with an inhibitor (test sample or gallic acid) at 90 seconds and the absorbance of the same solution at 30 seconds.
For samples that exhibited a lipoxygenase inhibition capacity of more than 50%, the CE50 value was calculated and expressed in µg of sample/mL of the final solution or µg of gallic acid/mL. CE50 was calculated by taking into account the first value below 50% and the first value above 50%, obtaining, through linear interpolation, the concentration of the antioxidant solution corresponding to 50% activity.

2.7. In vitro cytotoxicity tests and antitumor action of Perilla leaves extracts

For the study of material cytotoxicity, two human tumor cell lines were used: human osteosarcoma cells (MG-63 cell line from ATCC, Rockville, MD, USA) and tumor keratinocytes (A431 cell line from Cell Service, Eppelheim, Germany). The cells were separately incubated for 24 hours (5% CO2, 37°C, 95% relative humidity) in DMEM culture medium enriched with 10% FBS and 1% P/S/N, in 96-well plates for the MTT assay (2 × 10^3 cells/well for MG-63 and 3 × 10^3 cells/well for A431) and in 48-well plates for cell morphology studies (8 × 10^3 cells/well for MG-63 and 1 × 10^4 cells/well for A431). After 24 hours, the medium in the plates was replaced with fresh DMEM medium (with 10% FBS and 1% P/S/N) for the control, and with extracts prepared according to the protocol described in the following paragraph.
For the in vitro cytotoxicity evaluation, an indirect contact method was used. A certain amount (2 mg/mL stock solution) of each material was immersed in DMEM and 1% P/S/N and left to shake (200 rpm, 37°C) for 24 hours. Afterward, the stock solution was obtained by passing the medium through 0.22 μm filters, and finally, 10% FBS was added. For each material, the MTT test was performed for 6 different extract concentrations: 2 mg/mL, 1 mg/mL, 0.5 mg/mL, 0.2 mg/mL, 0.1 mg/mL, and 0.05 mg/mL.
For the MTT assay, the culture medium and extracts from the wells were replaced with MTT working solution (5% MTT in DMEM without FBS and P/S/N). The culture plates were incubated at 37°C for 2 hours, during which viable cells reduced the tetrazolium salt to a colored product called formazan [i], solubilized with DMSO.
The absorbance of the resulting formazan solution (blue-violet color) was measured spectrophotometrically at λ=570nm using a plate reader (Tecan Sun-rise Plate Reader). The spectrofotometric readings from the experimental wells were reported relative to the control wells, where no extracts were present. The calculated ratio represented cell viability (V):
V = a b s   e x t r a c t a b s   c o n t r o l × 100
Where:
abs extract- the absorbance of the extract;
abs control- the absorbance of the control.
The MTT assay was conducted at 24, 48, and 72 hours, in triplicate.
The Calcein-AM Cell Viability Assay was conducted at 72 hours of contact. In the initial stage, the culture medium in the wells was removed, and then the cells were washed twice with HBSS containing calcium and magnesium, without phenol red.
Finally, a calcein solution was added (2 µL calcein per 1 mL HBSS with calcium and magnesium, without phenol red), and the culture plate was incubated at 37°C, 5.5% CO2, and 96% relative humidity for 40 minutes. To study cell morphology, an inverted fluorescence microscope (Leica, Germany) was used, and images were captured.

3. Results

3.1. Quantification of the total phenols, flavonoids and anthocyanins from ethanolic and ethanol: acetone extracts of Perilla frutescens.

Following the drying process, 6 extracts were obtained, consisting of 2 with a brown-violet color and 4 with a brown-green hue. These 6 dried extracts were coded to facilitate their handling in the research, and the extraction yield was calculated. The results are presented in Table 1. The 70% ethanol extracts exhibited the highest extraction yields compared to those obtained using the solvent mixture.
The quantification of total phenols, flavonoids and anthocyanins in 3 types of ethanolic extracts (E1, E2, E3) and in 3 types of a mixture solvents (ethanol: acetone) extracts (A1, A2, A3) is presented in Table 2.
Our results indicated that the total phenols concentration was significantly higher in the ethanolic extracts of Perilla frutescens (p= 0.002). On the other hand, we could not find any statistical difference regarding the flavonoids and anthocyanins concentrations between the two types of extracts.
The results from the UPLC analysis are presented in Table 3. Caffeic acid was significantly higher in the ethanolic extracts of Perilla frutescens, with the highest amount being identified in the E1 extract (p= 0.01). Syringic acid (p= 0.008), p-coumaric acid (p= 0.007), ferulic acid (p= 0.007), kaemferol (p= 0.002), isorhamnetin (p= 0.007), and pinocembrin (p= 0.03) were also found to be significantly higher in ethanolic extracts. E1 extract had the highest amount of p-coumaric acid, isorhamnetin, and pinocembrin, while E2 extract had the highest amount of syringic acid. E3 extract was rich in ferulic acid and kaemferol.

3.2. Determination of the in vitro antioxidant action of Perilla frutescens extracts

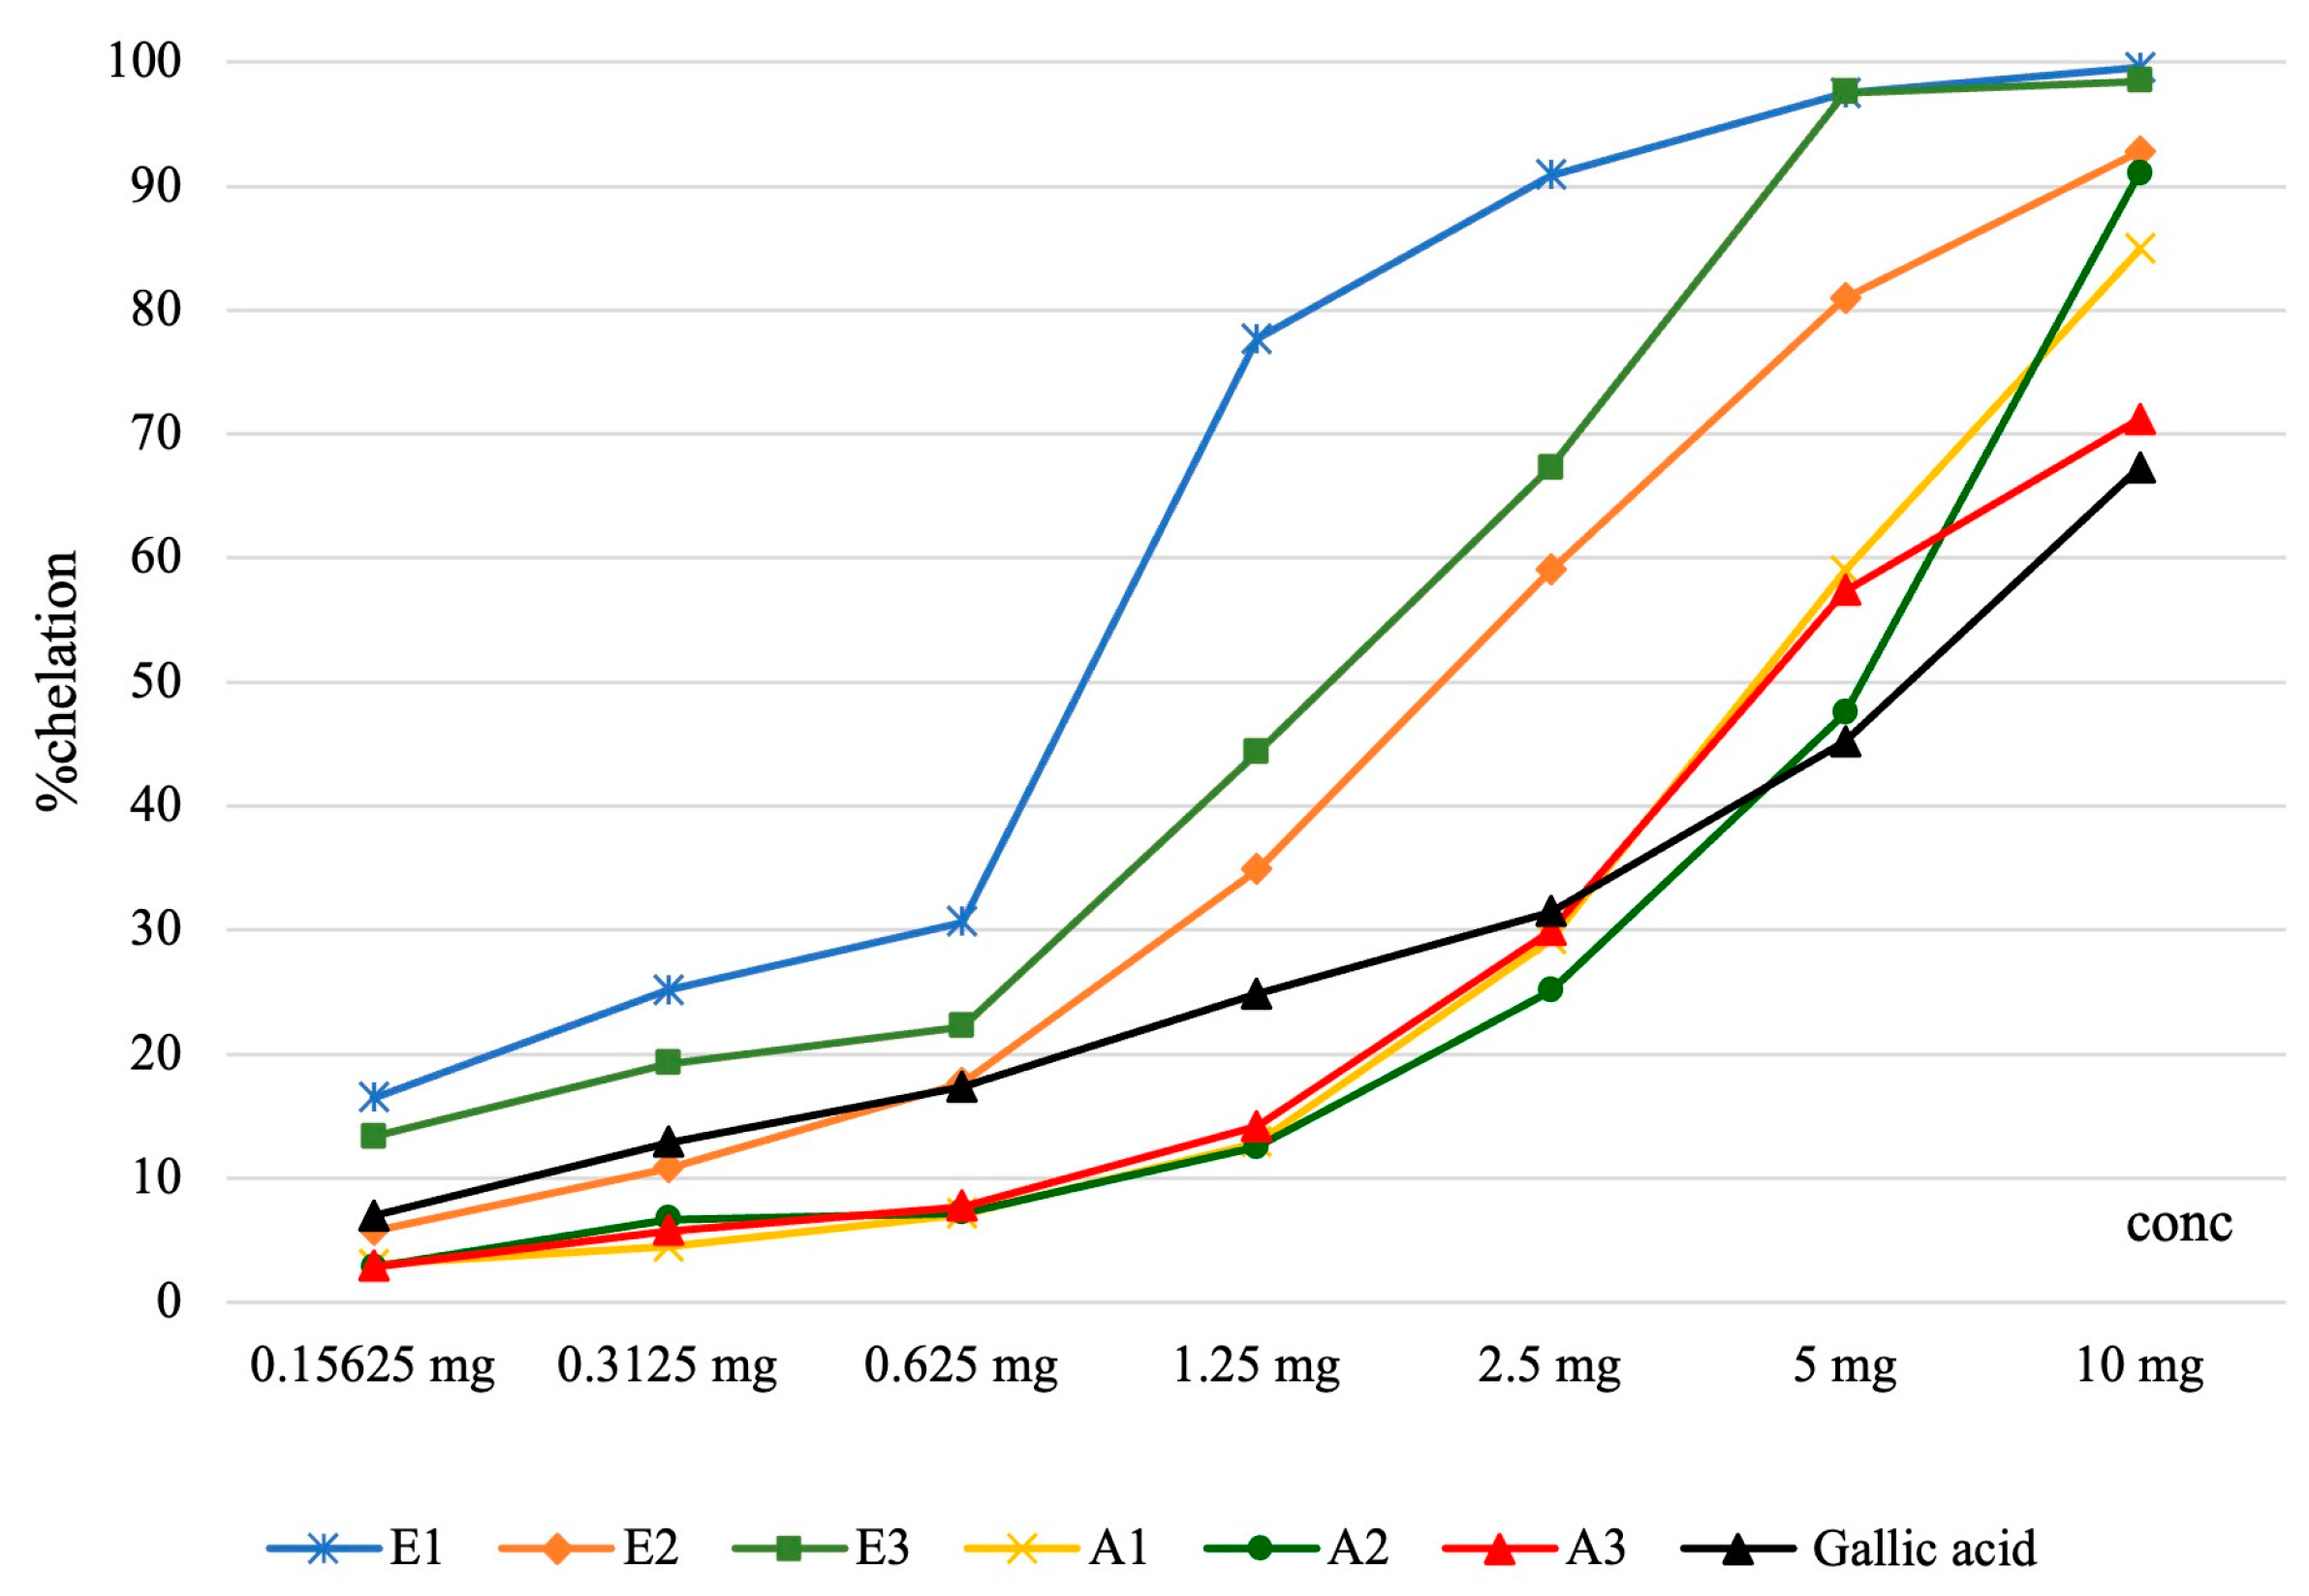
The results from the iron chelation capacity assessment are presented in Figure 2 and Table 4. The iron chelation capacity increased with Perilla frutescens extracts concentrations, and it was significantly higher in ethanolic extracts compared with other types of extracts from this plant.
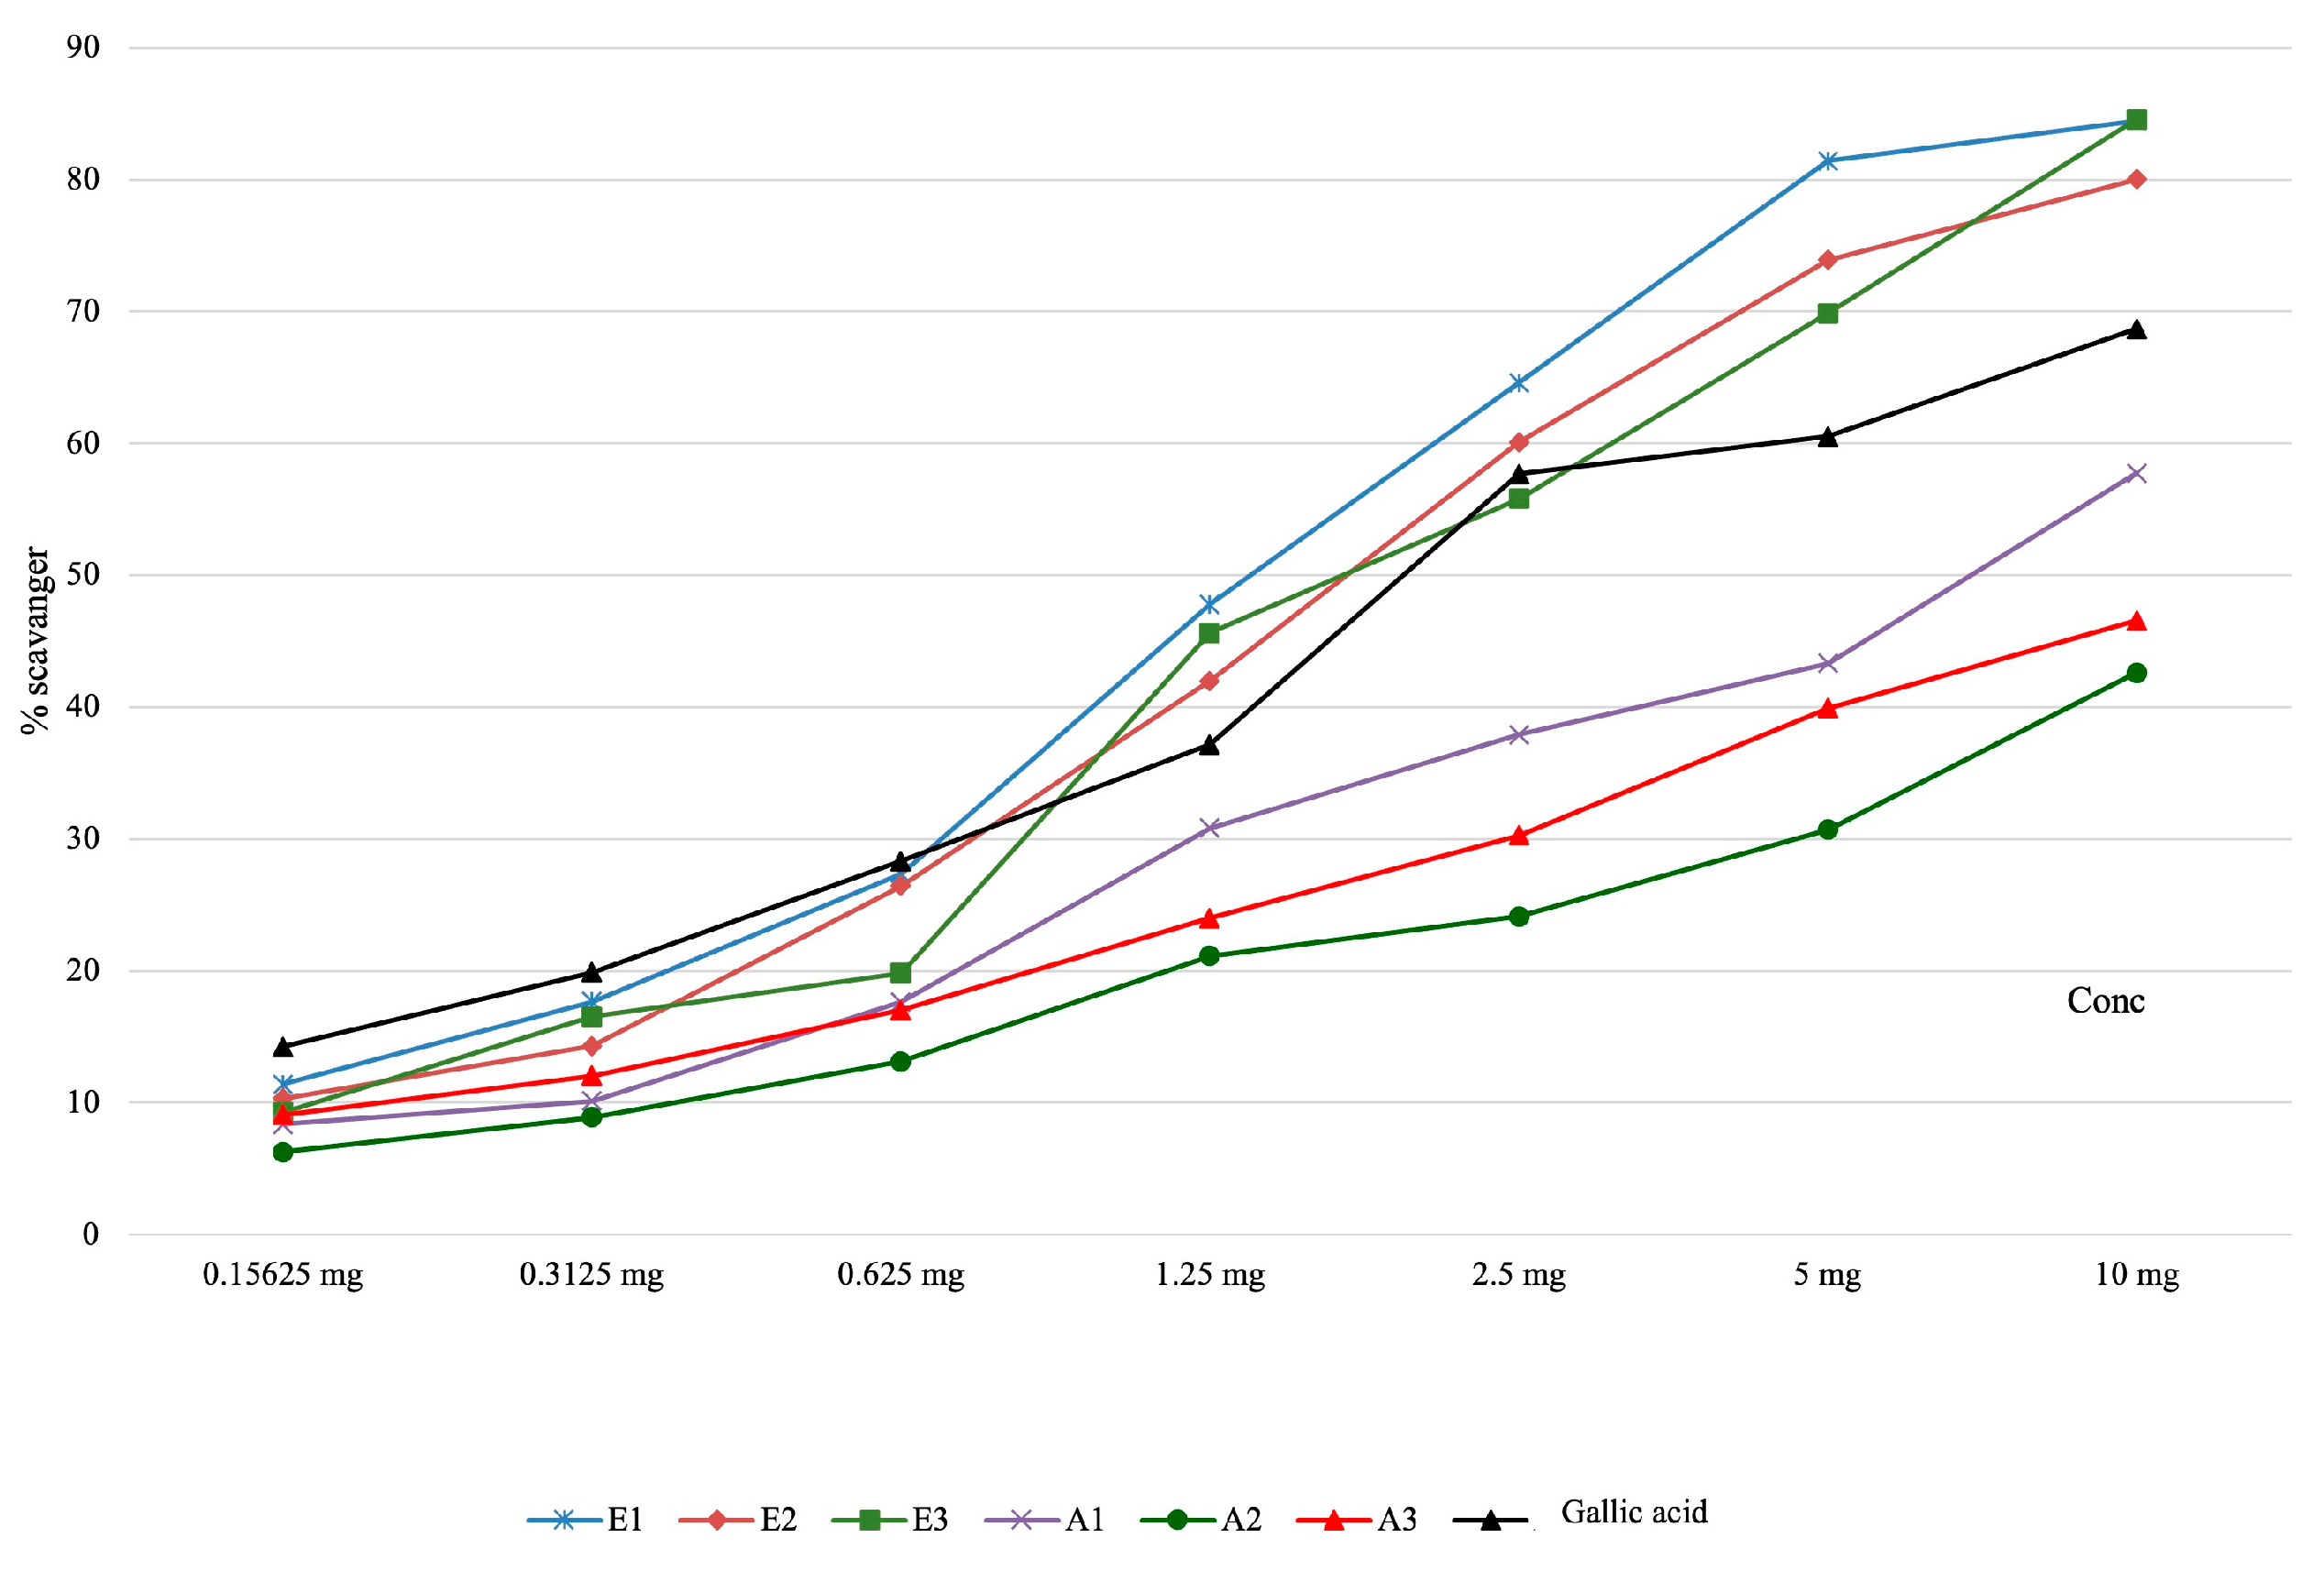
The results obtained for the evaluation of the active principles' capacity, present in the plant extracts, to neutralize the hydroxyl radical are presented in Table 4 and graphically represented in Figure 3. The scavenging capacity of hydroxyl radical increased with the concentration of the analyzed Perilla frutescens extracts, and it was significantly higher for ethanolic extracts in comparison with other types of extracts from this plant or with gallic acid.
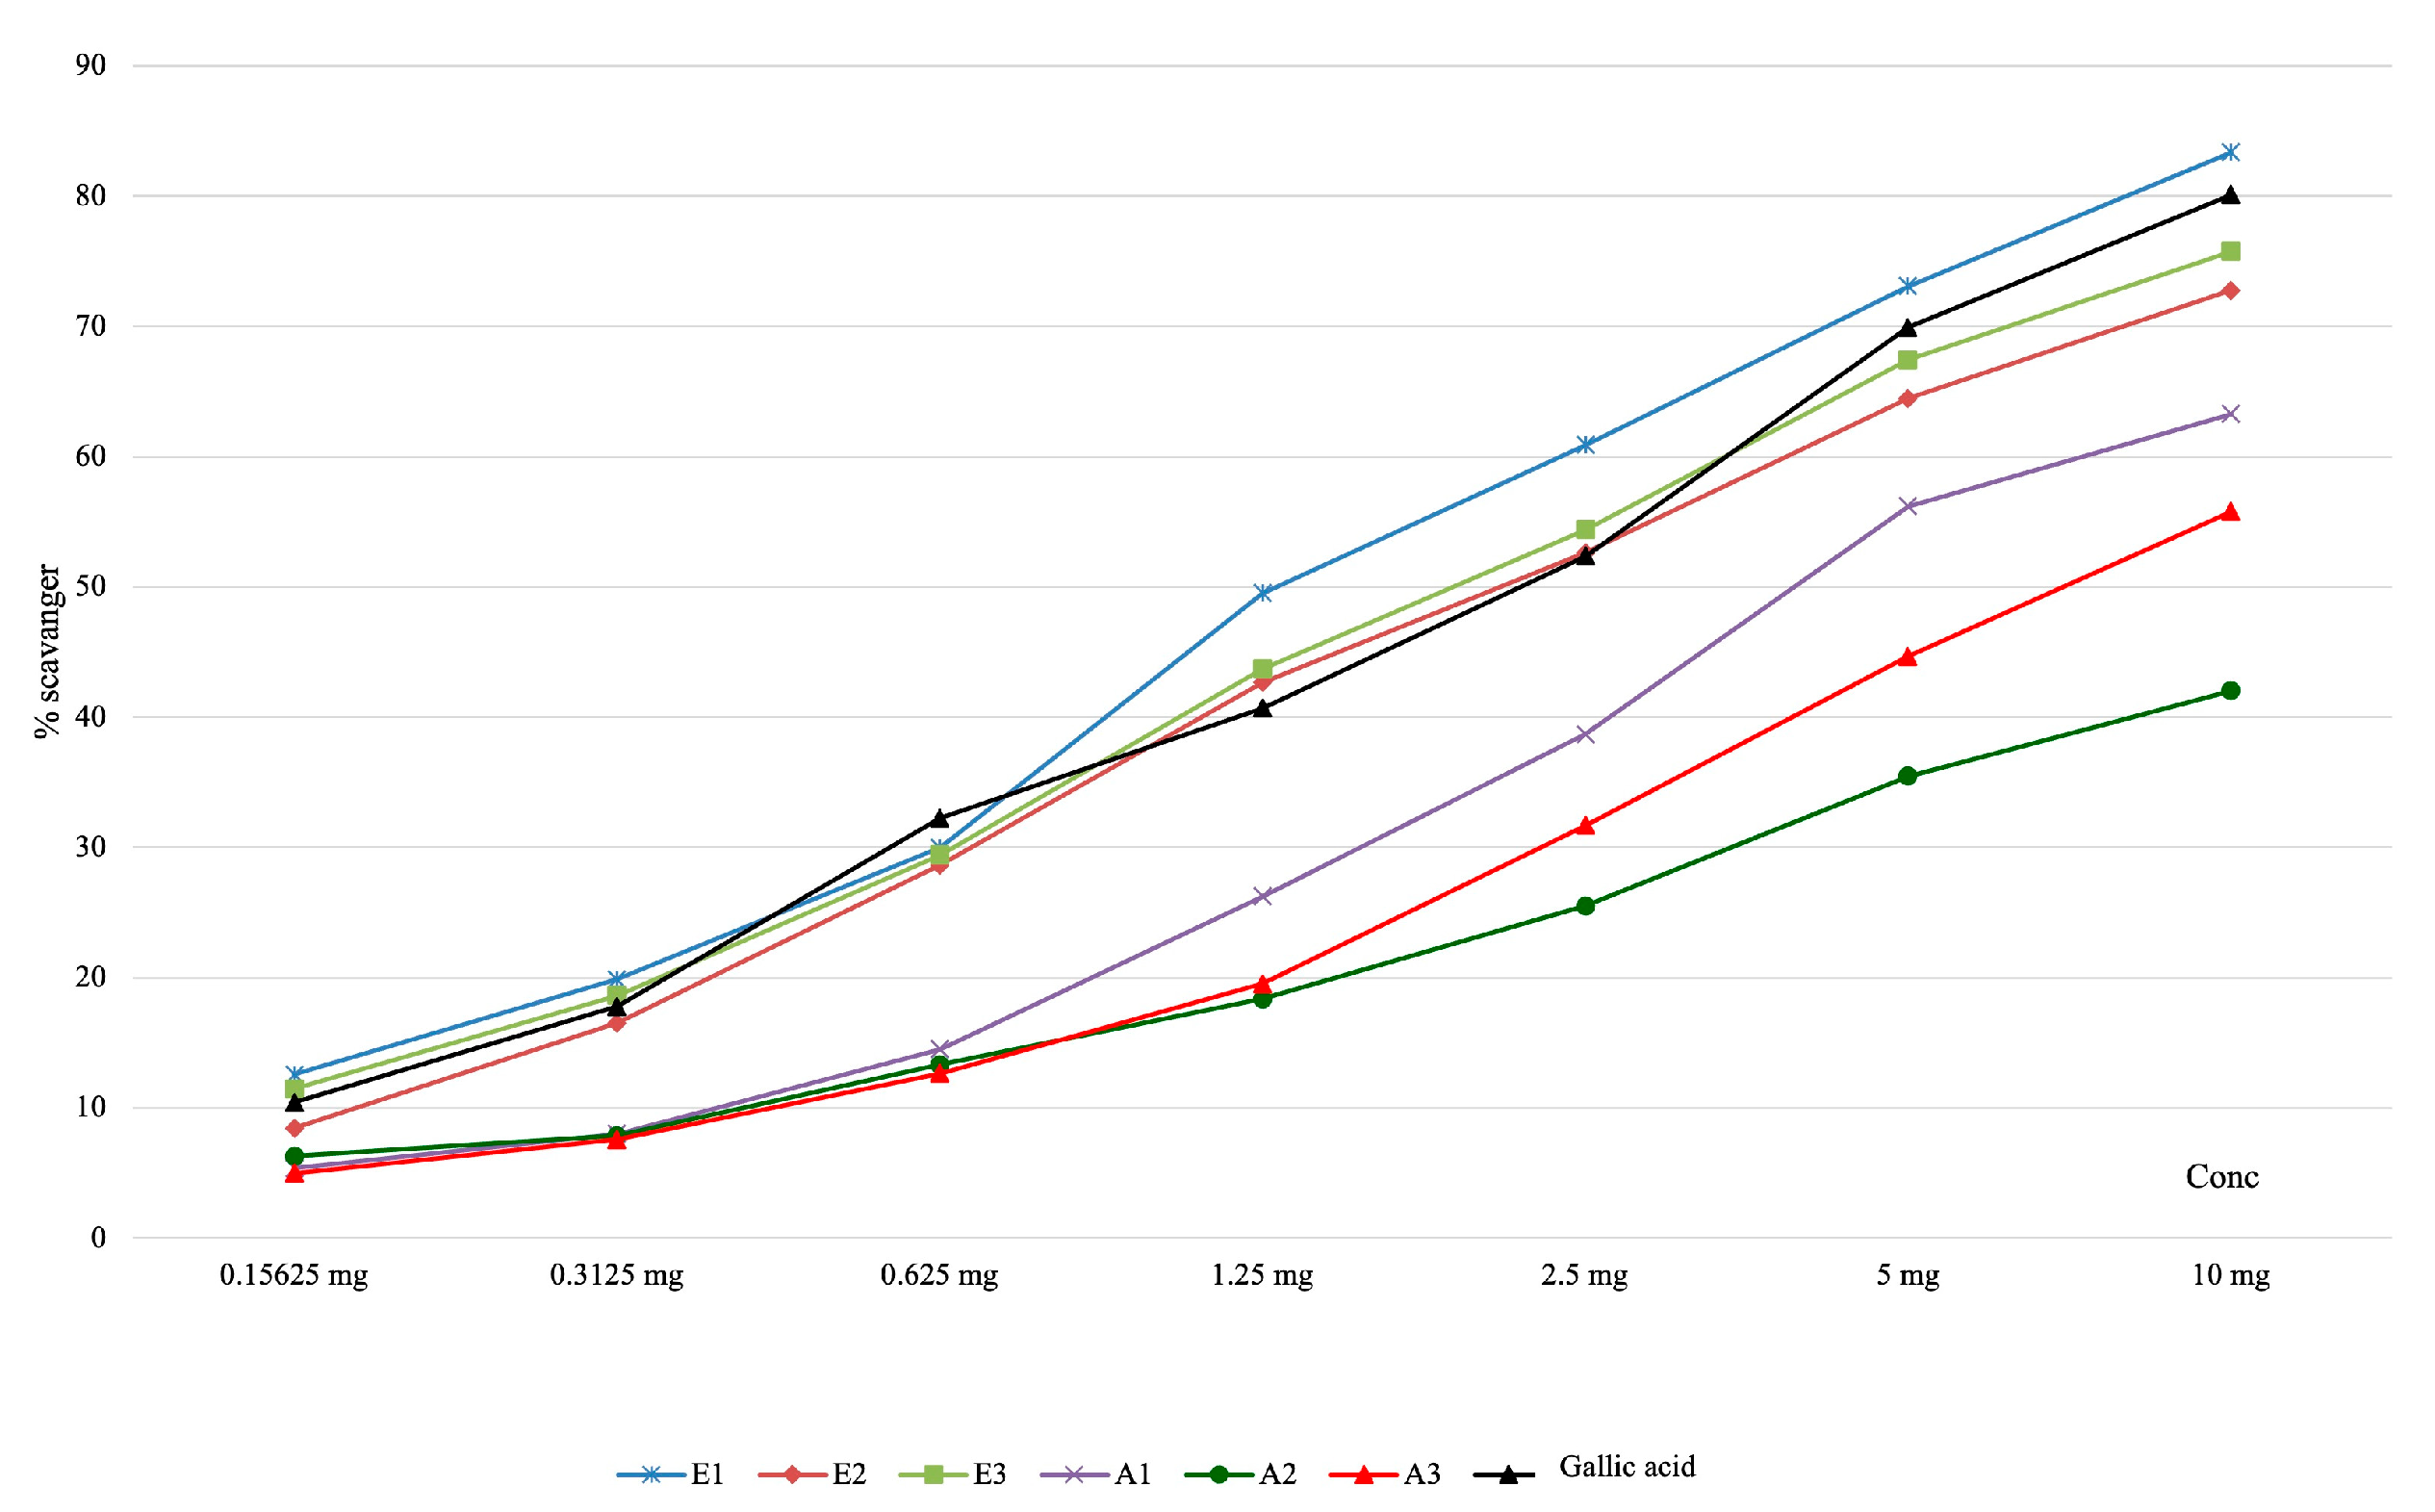
The results obtained from evaluating the capacity of the active principles present in the plant extracts to neutralize the superoxide anion radical are presented in Table 4 and graphically represented in Figure 4. Our results indicated that the scavenging capacity of the superoxide anion radical was significantly higher for ethanolic extracts in comparison with other types of extracts from this plant or with gallic acid.
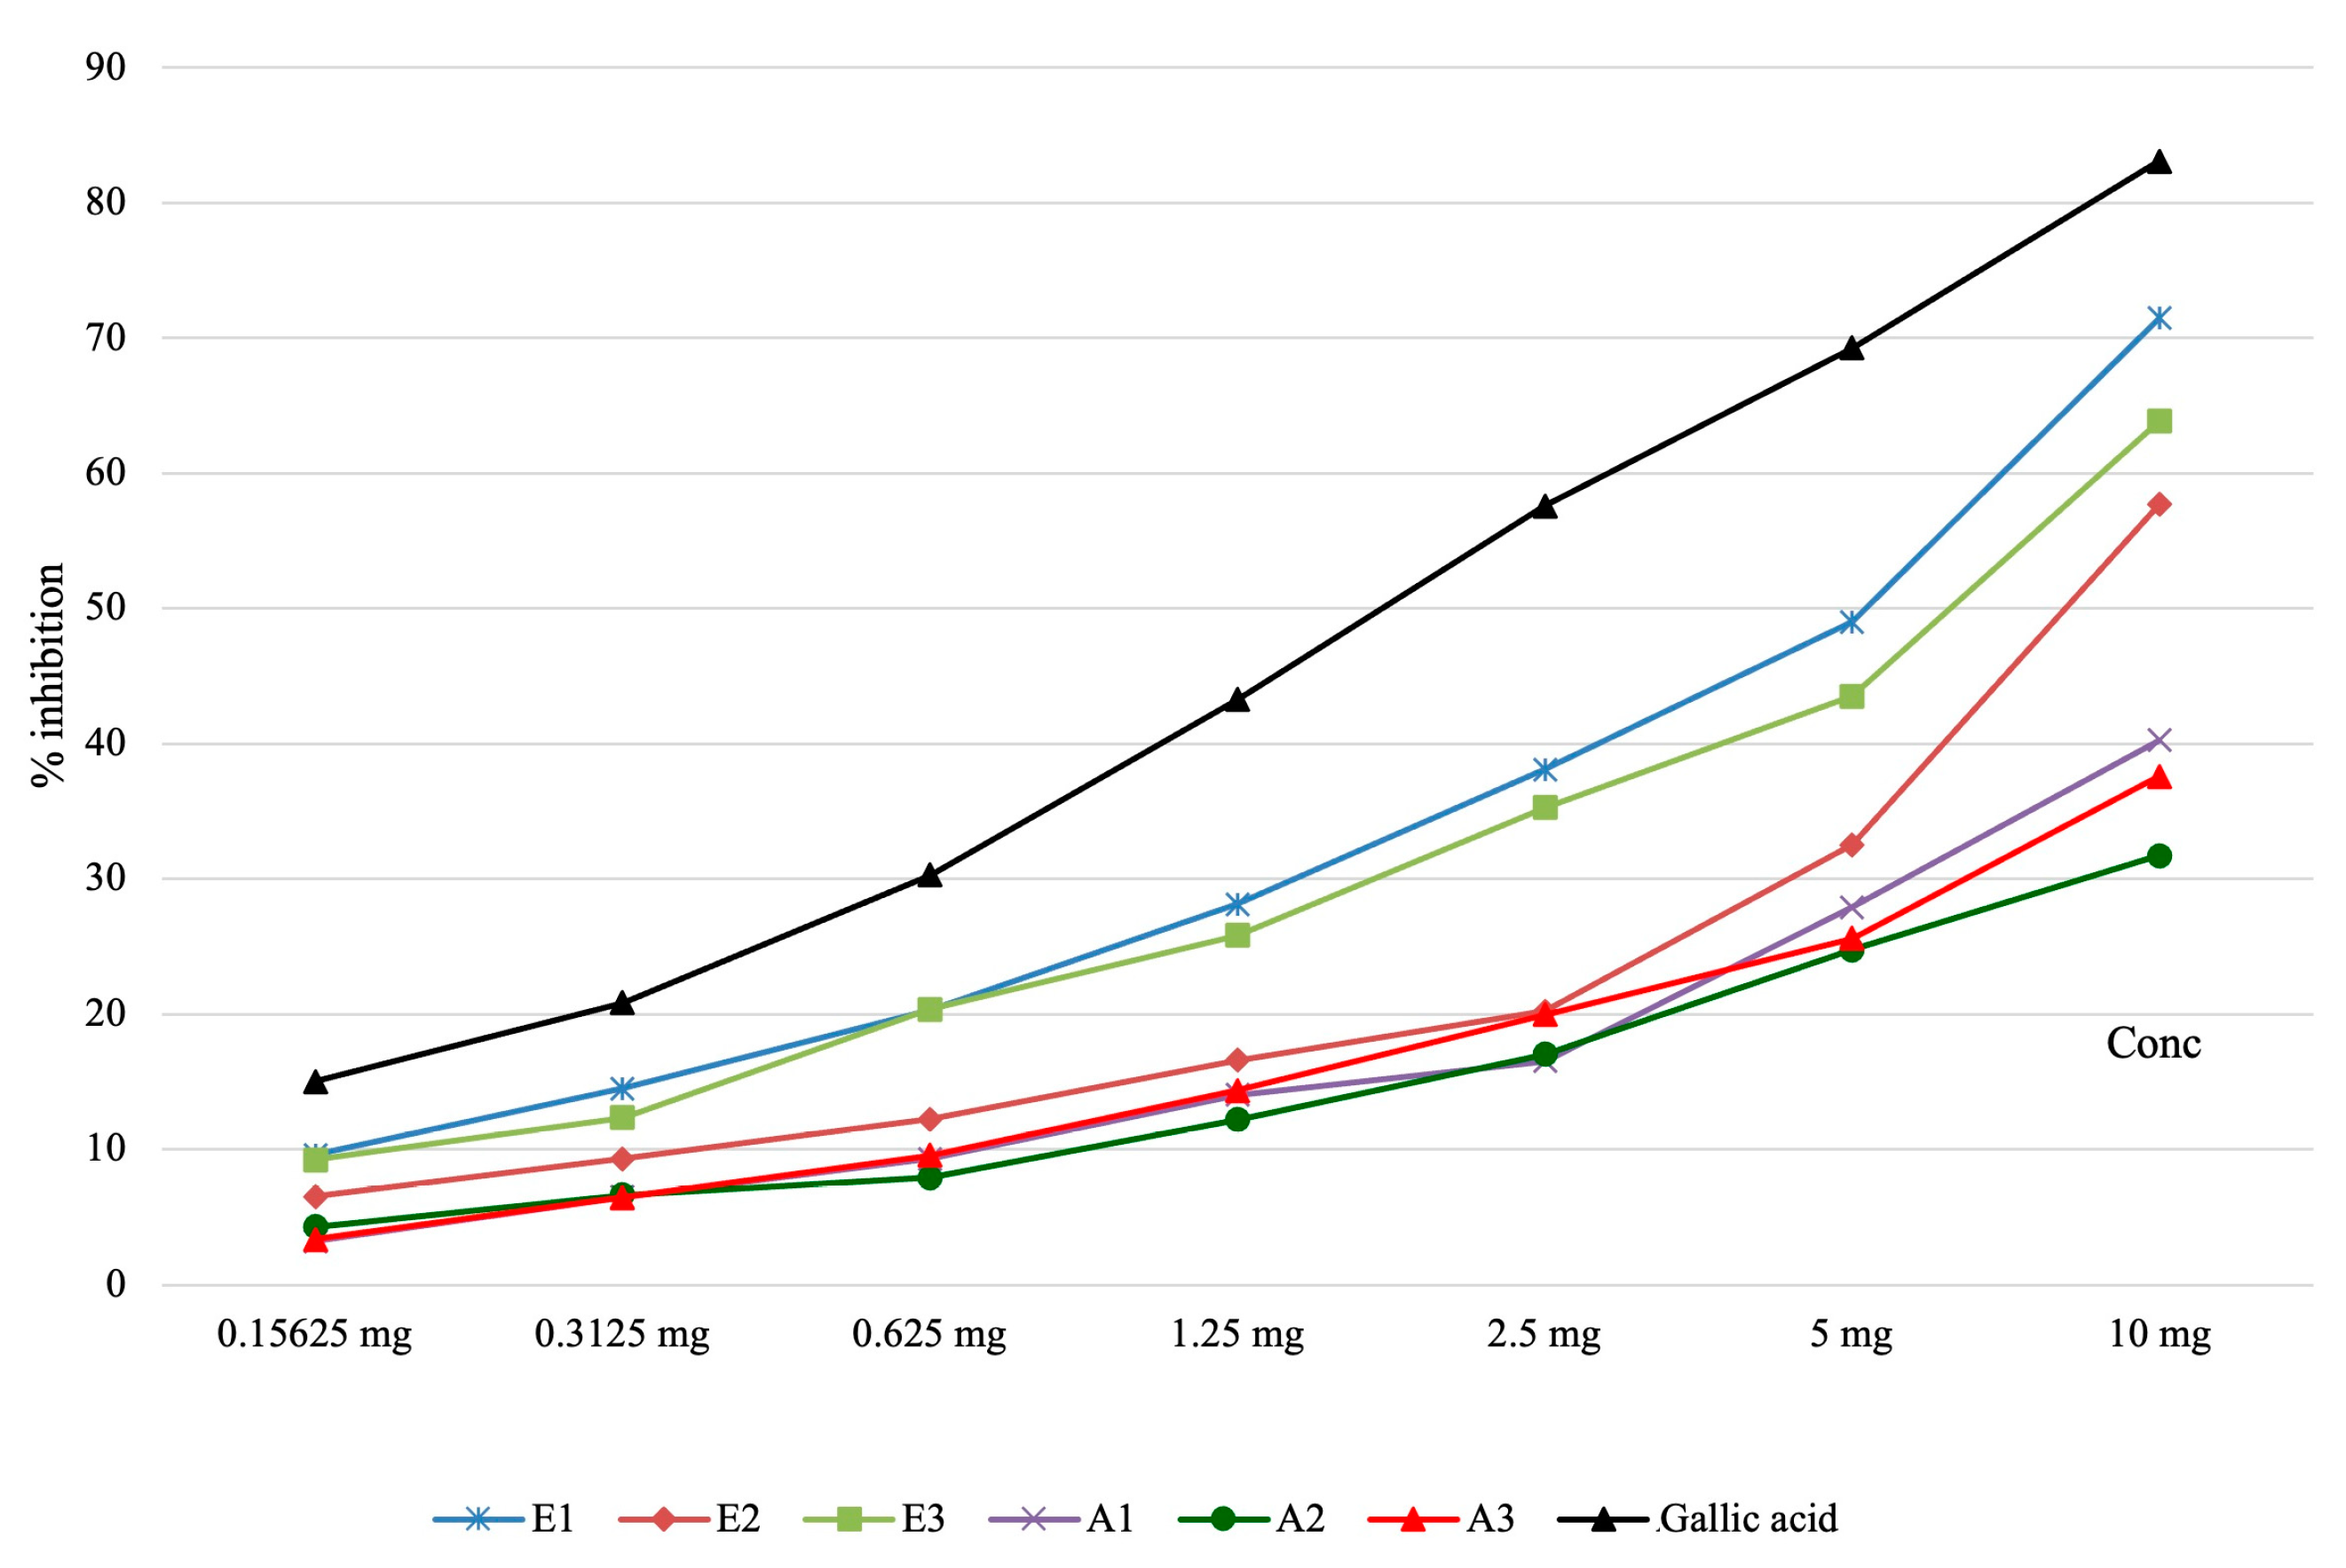
The results obtained from evaluating the capacity of the active principles present in plant extracts to inhibit lipoxygenase are presented in Table 4 and graphically represented in Figure 5. The lipoxygenase inhibition capacity of the analyzed Perilla frutescens extracts was significantly smaller compared to gallic acid. This inhibition capacity was higher for ethanolic extracts in comparison with other types of extracts from this plant.

3.3. Determination of in vitro cytotoxicity and antitumor effects of Perilla frutescens extracts

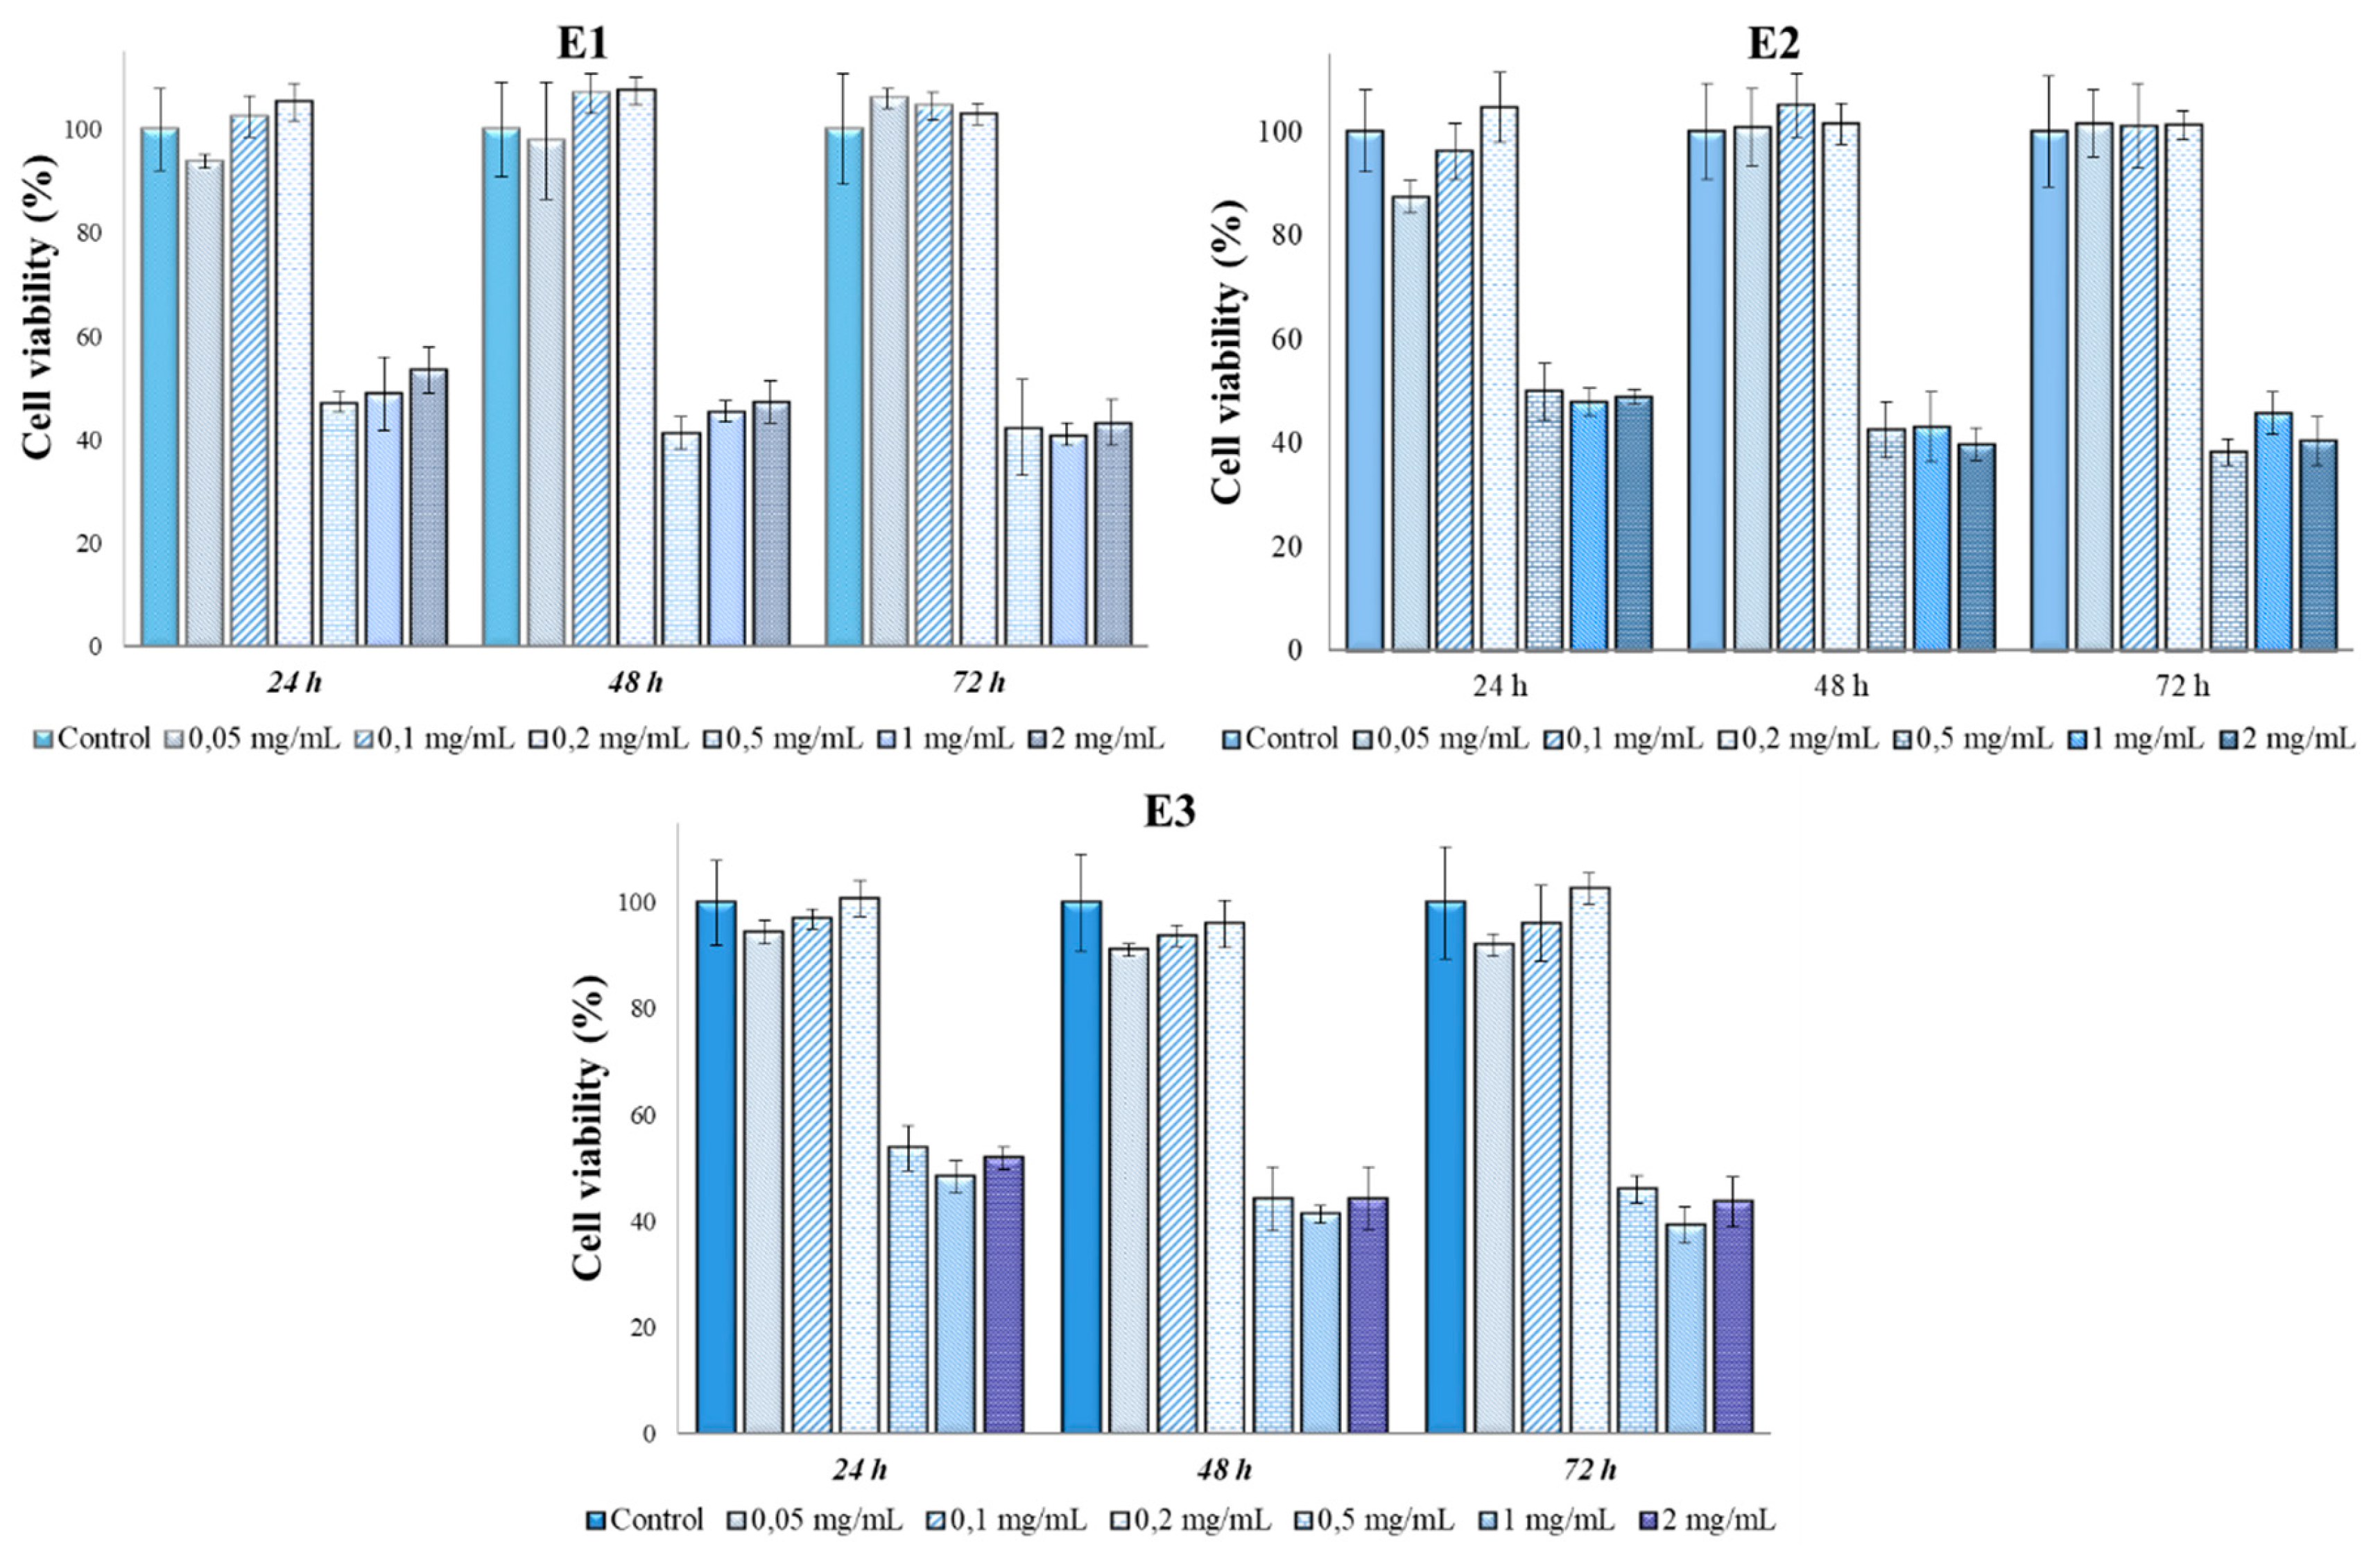
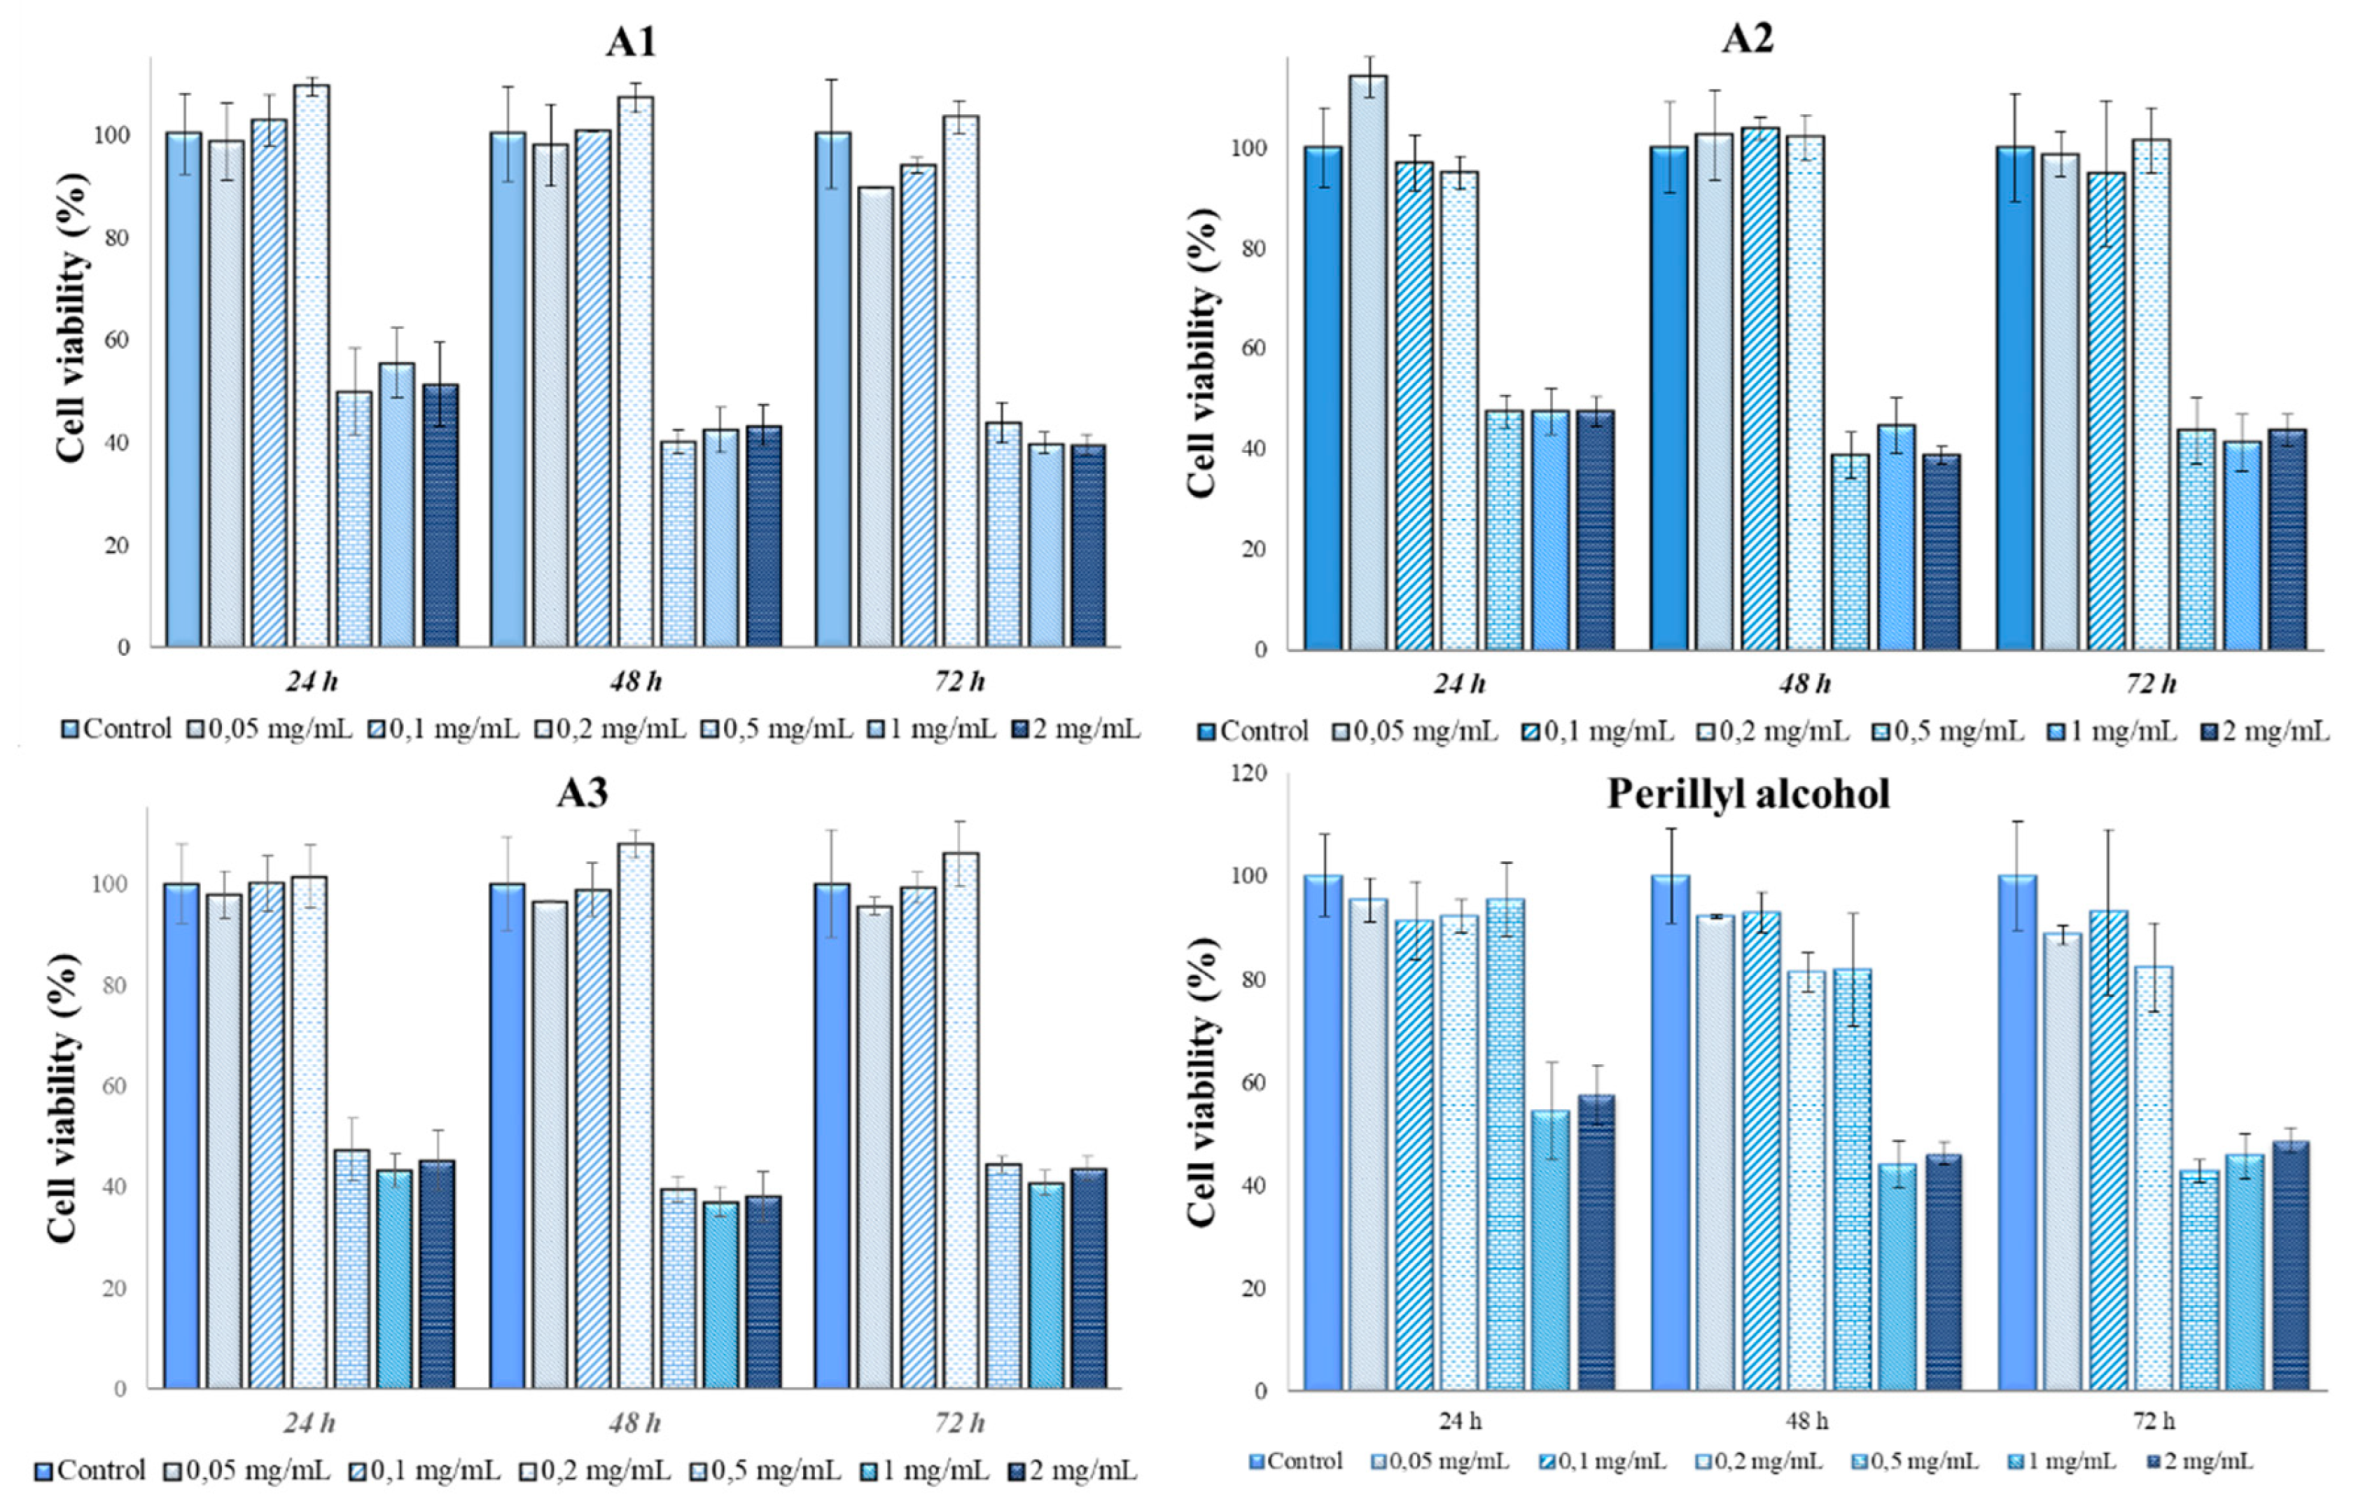
The results from the MTT test using various types of Perilla frutescens extracts and perillyl alcohol on the cellular lines MG63 are presented in Figure 6 and Figure 7.
The antitumoral effect was observed for all types of extracts at ≥ 0.5 mg/ml. The cytocompatibility with the cellular lines MG63 was observed at concentrations of 0.2 mg/ml for all types of extracts. In particular, in case of A1 – A3 extracts (Figure 6), for concentrations of 0.5 mg/ml, 1 mg/ml and 2 mg/ml, the cell viability values ​​were between 37 % (48 hours, A3, 1 mg/ml) and 55 % (24 hours, A1, 1 mg/ml), indicating a cytotoxic behavior, while for concentrations of 0.05 mg/ml, 0.1 mg/ml, and 0.2 mg/ml, the minimum values ​​were 89 % (72 hours, A1, 0.05 mg/ml) and the maximum values 114 % (24 hours, A2, 0.05 mg/ml), indicating no toxicity.
As can be noted in Figure 7, E1 – E3 have cytotoxic effect at concentrations of 0.5 mg/ml, 1 mg/ml and 2 mg/ml, the results indicating a decrease in the viability of MG-63 cells, with values ​​between 38 % (72 hours, E2) and 54 % (24 hours, E3). No significant differences were observed between these 3 concentrations, meaning that at concentrations higher than 0.5 mg/ml, extracts E1 – E3 can be considered for the anti-tumor effect. In contrast, for the concentrations of 0.05 mg/ml, 0.1 mg/ml and 0.2 mg/ml, the extracts did not show a cytotoxic effect, the cell viability values ​​being between 87% (24 hours, E2 , 0.05 mg/ml) and 107% (48 hours, E1, 0.2 mg/ml).
Perillyl alcohol showed an obvious cytotoxicity for 2 mg/ml and 1 mg/ml concentrations, while for 0.5 mg/ml and 0.2 mg/ml, close values ​​were observed for the first two contact times (24 and 48 hours), but for 72 hours, in the case of the concentration of 0.5 mg/ ml, a sudden decrease in the cell viability value was observed, reaching from 82% at 48 hours to 43% at 72 hours. For the concentrations of 0.1 mg/ml and 0.05 mg/ml, it was observed that perillyl alcohol had no cytotoxic effect in contact with Mg-63 cells.
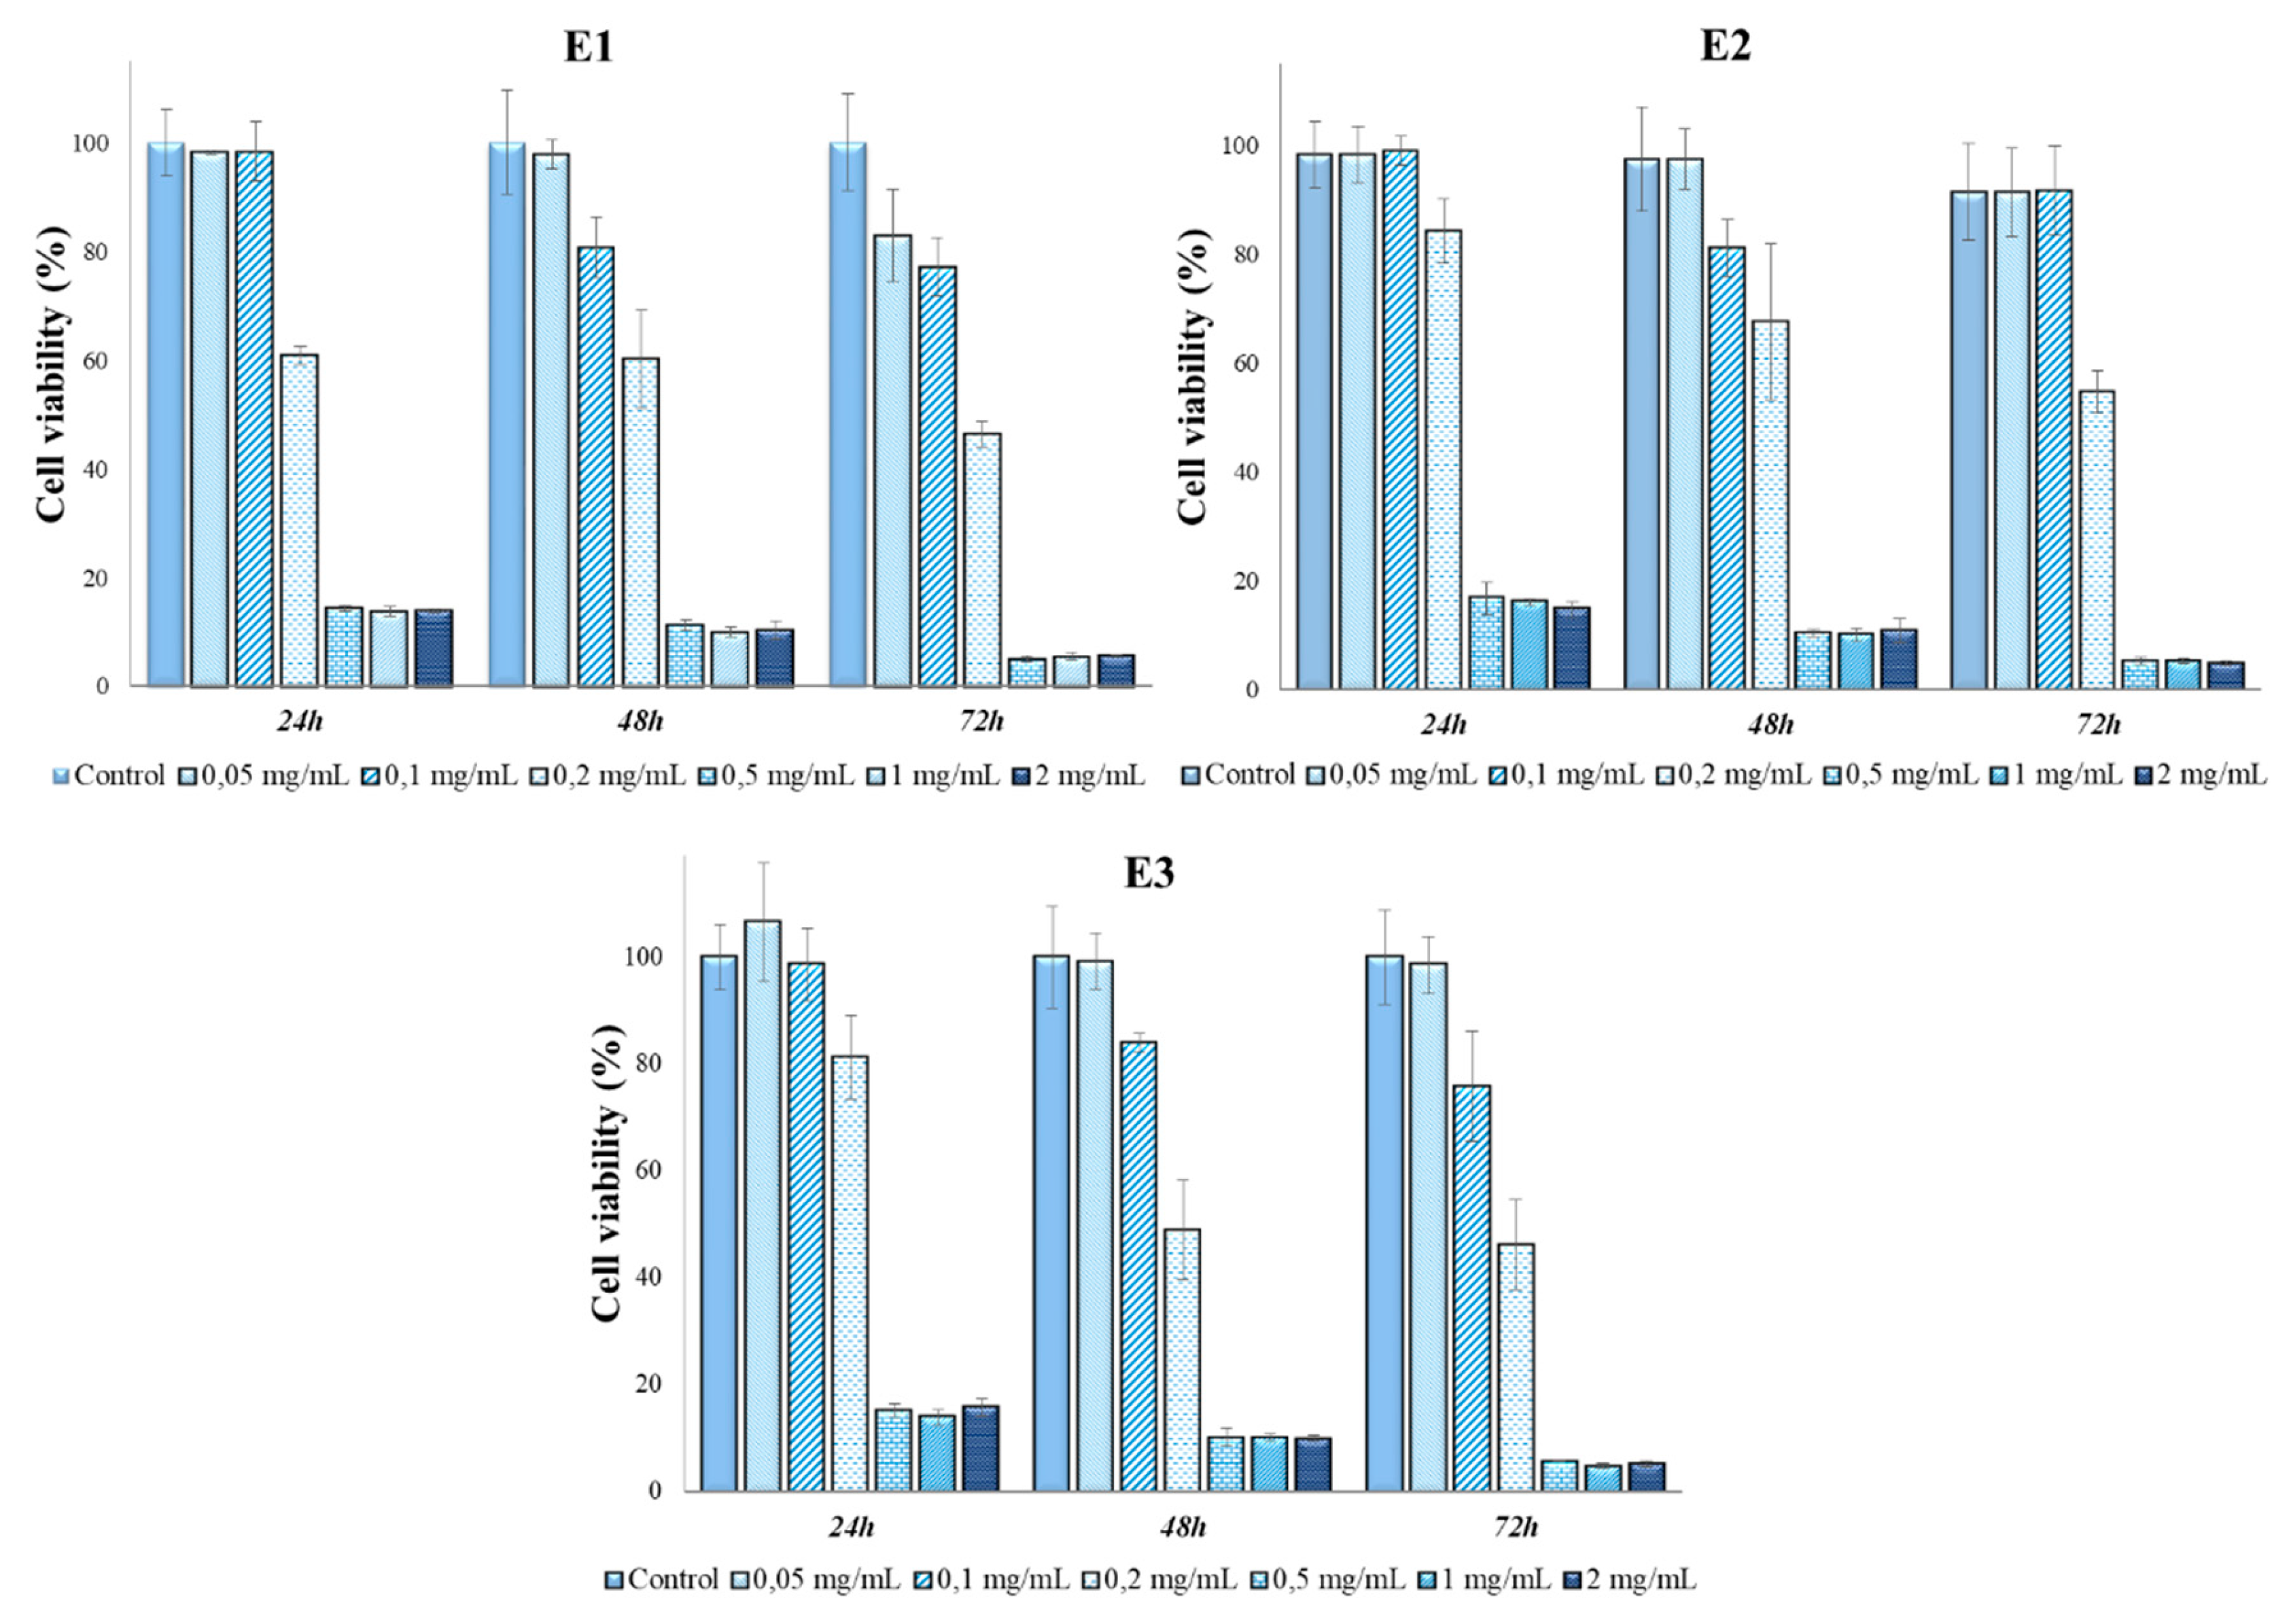
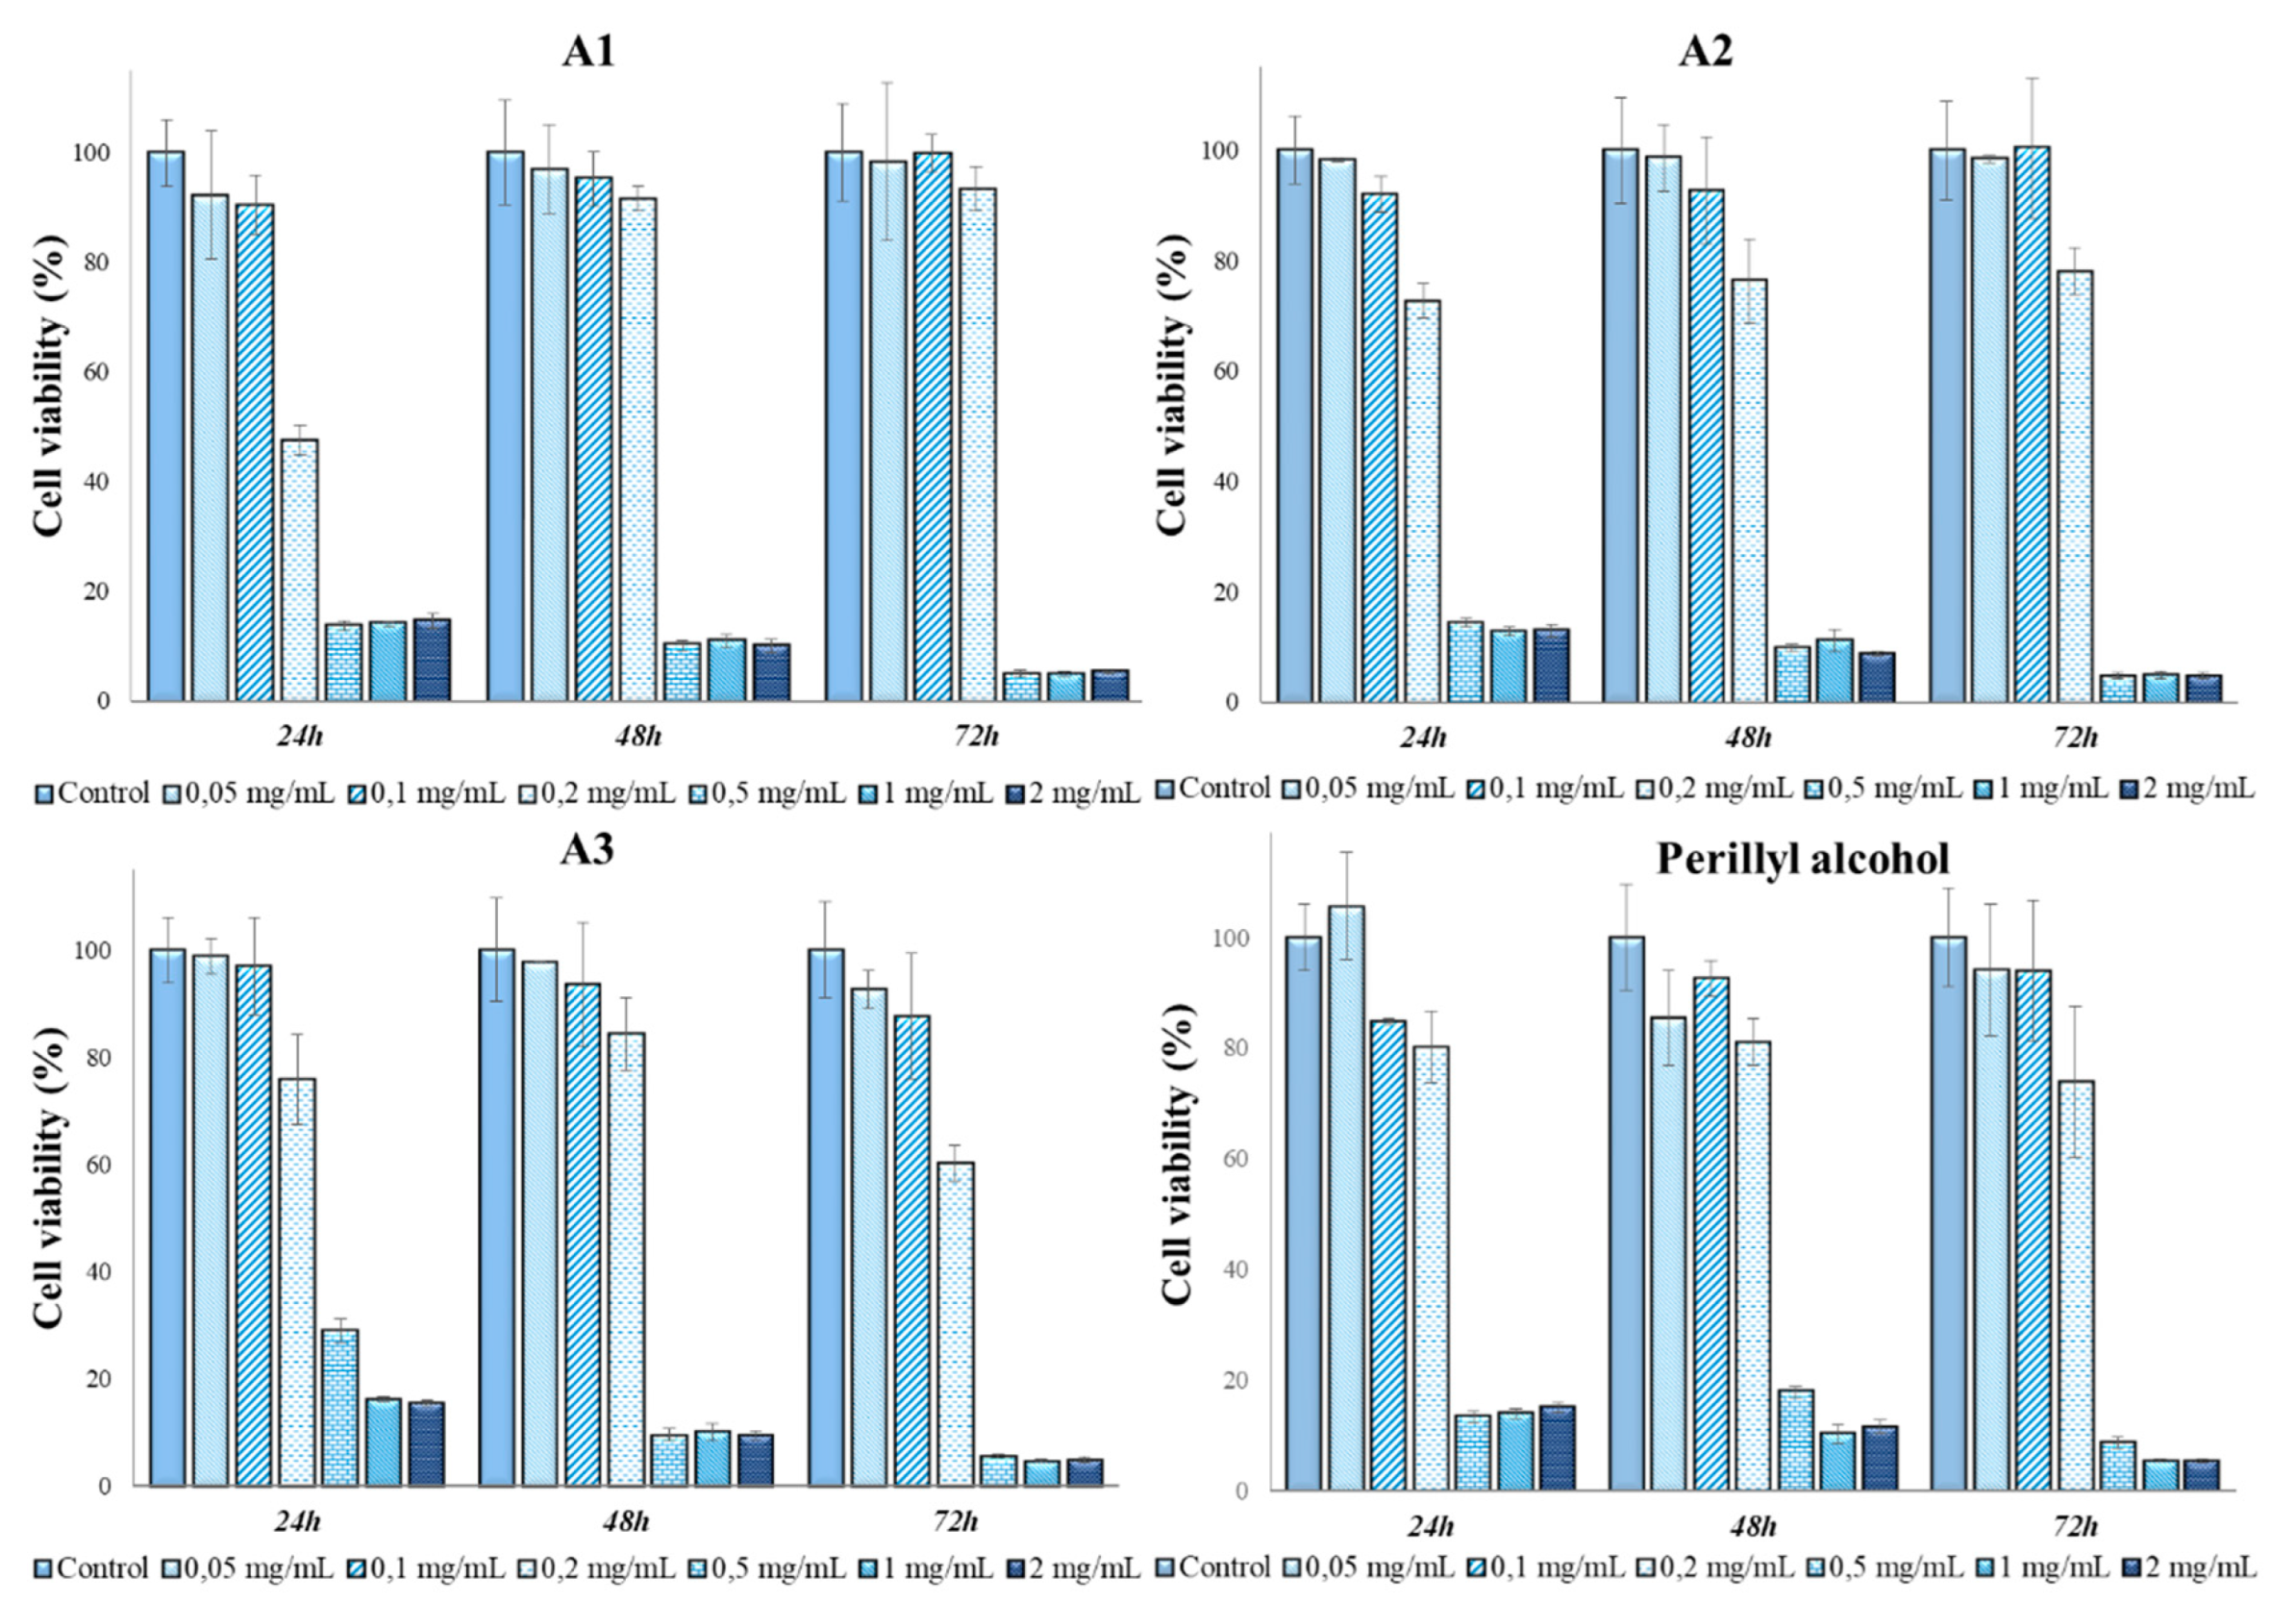
Since, cell line is characterized by specific mechanisms and behavior, therefore, the 6 extracts and perillyl alcohol were also tested in contact with the A431 cell line (tumor keratinocytes), the results being shown in Figure 8, Figure 9, Figure 10 and Figure 11.
The antitumoral effect was observed for all types of extracts at ≥ 0.2mg/ml in comparison with perillyl alcohol, that exhibited an antitumoral effect at concentrations of ≥ 0.5 mg/ml, at 72 hours of contact, cell viability values ​​were below 9 % for all analyzed samples, which indicates the possible use of Perilla frutescens leaf extracts with a concentration higher than 0.5 mg/mL in the treatment of skin tumors, supplementary tests being necessary to accurately establish the dosage and mechanism of action of the extracts.
As mentioned above, all six extracts, in contact with the MG-63 line, are not cytotoxic at concentrations lower than or equal to 0.2 mg/mL, but in contact with A431, it was observed that at a concentration of 0.2 mg/mL, the extracts contributed to the decrease of cell viability up to values ​​of 46 % in the case of extracts E1 – E3, respectively 47 % in the case of extracts A1 – A3. At the other two analyzed concentrations, 0.1 mg/mL and 0.05 mg/mL, extracts A1, A2 and A3 have a non-cytotoxic character.
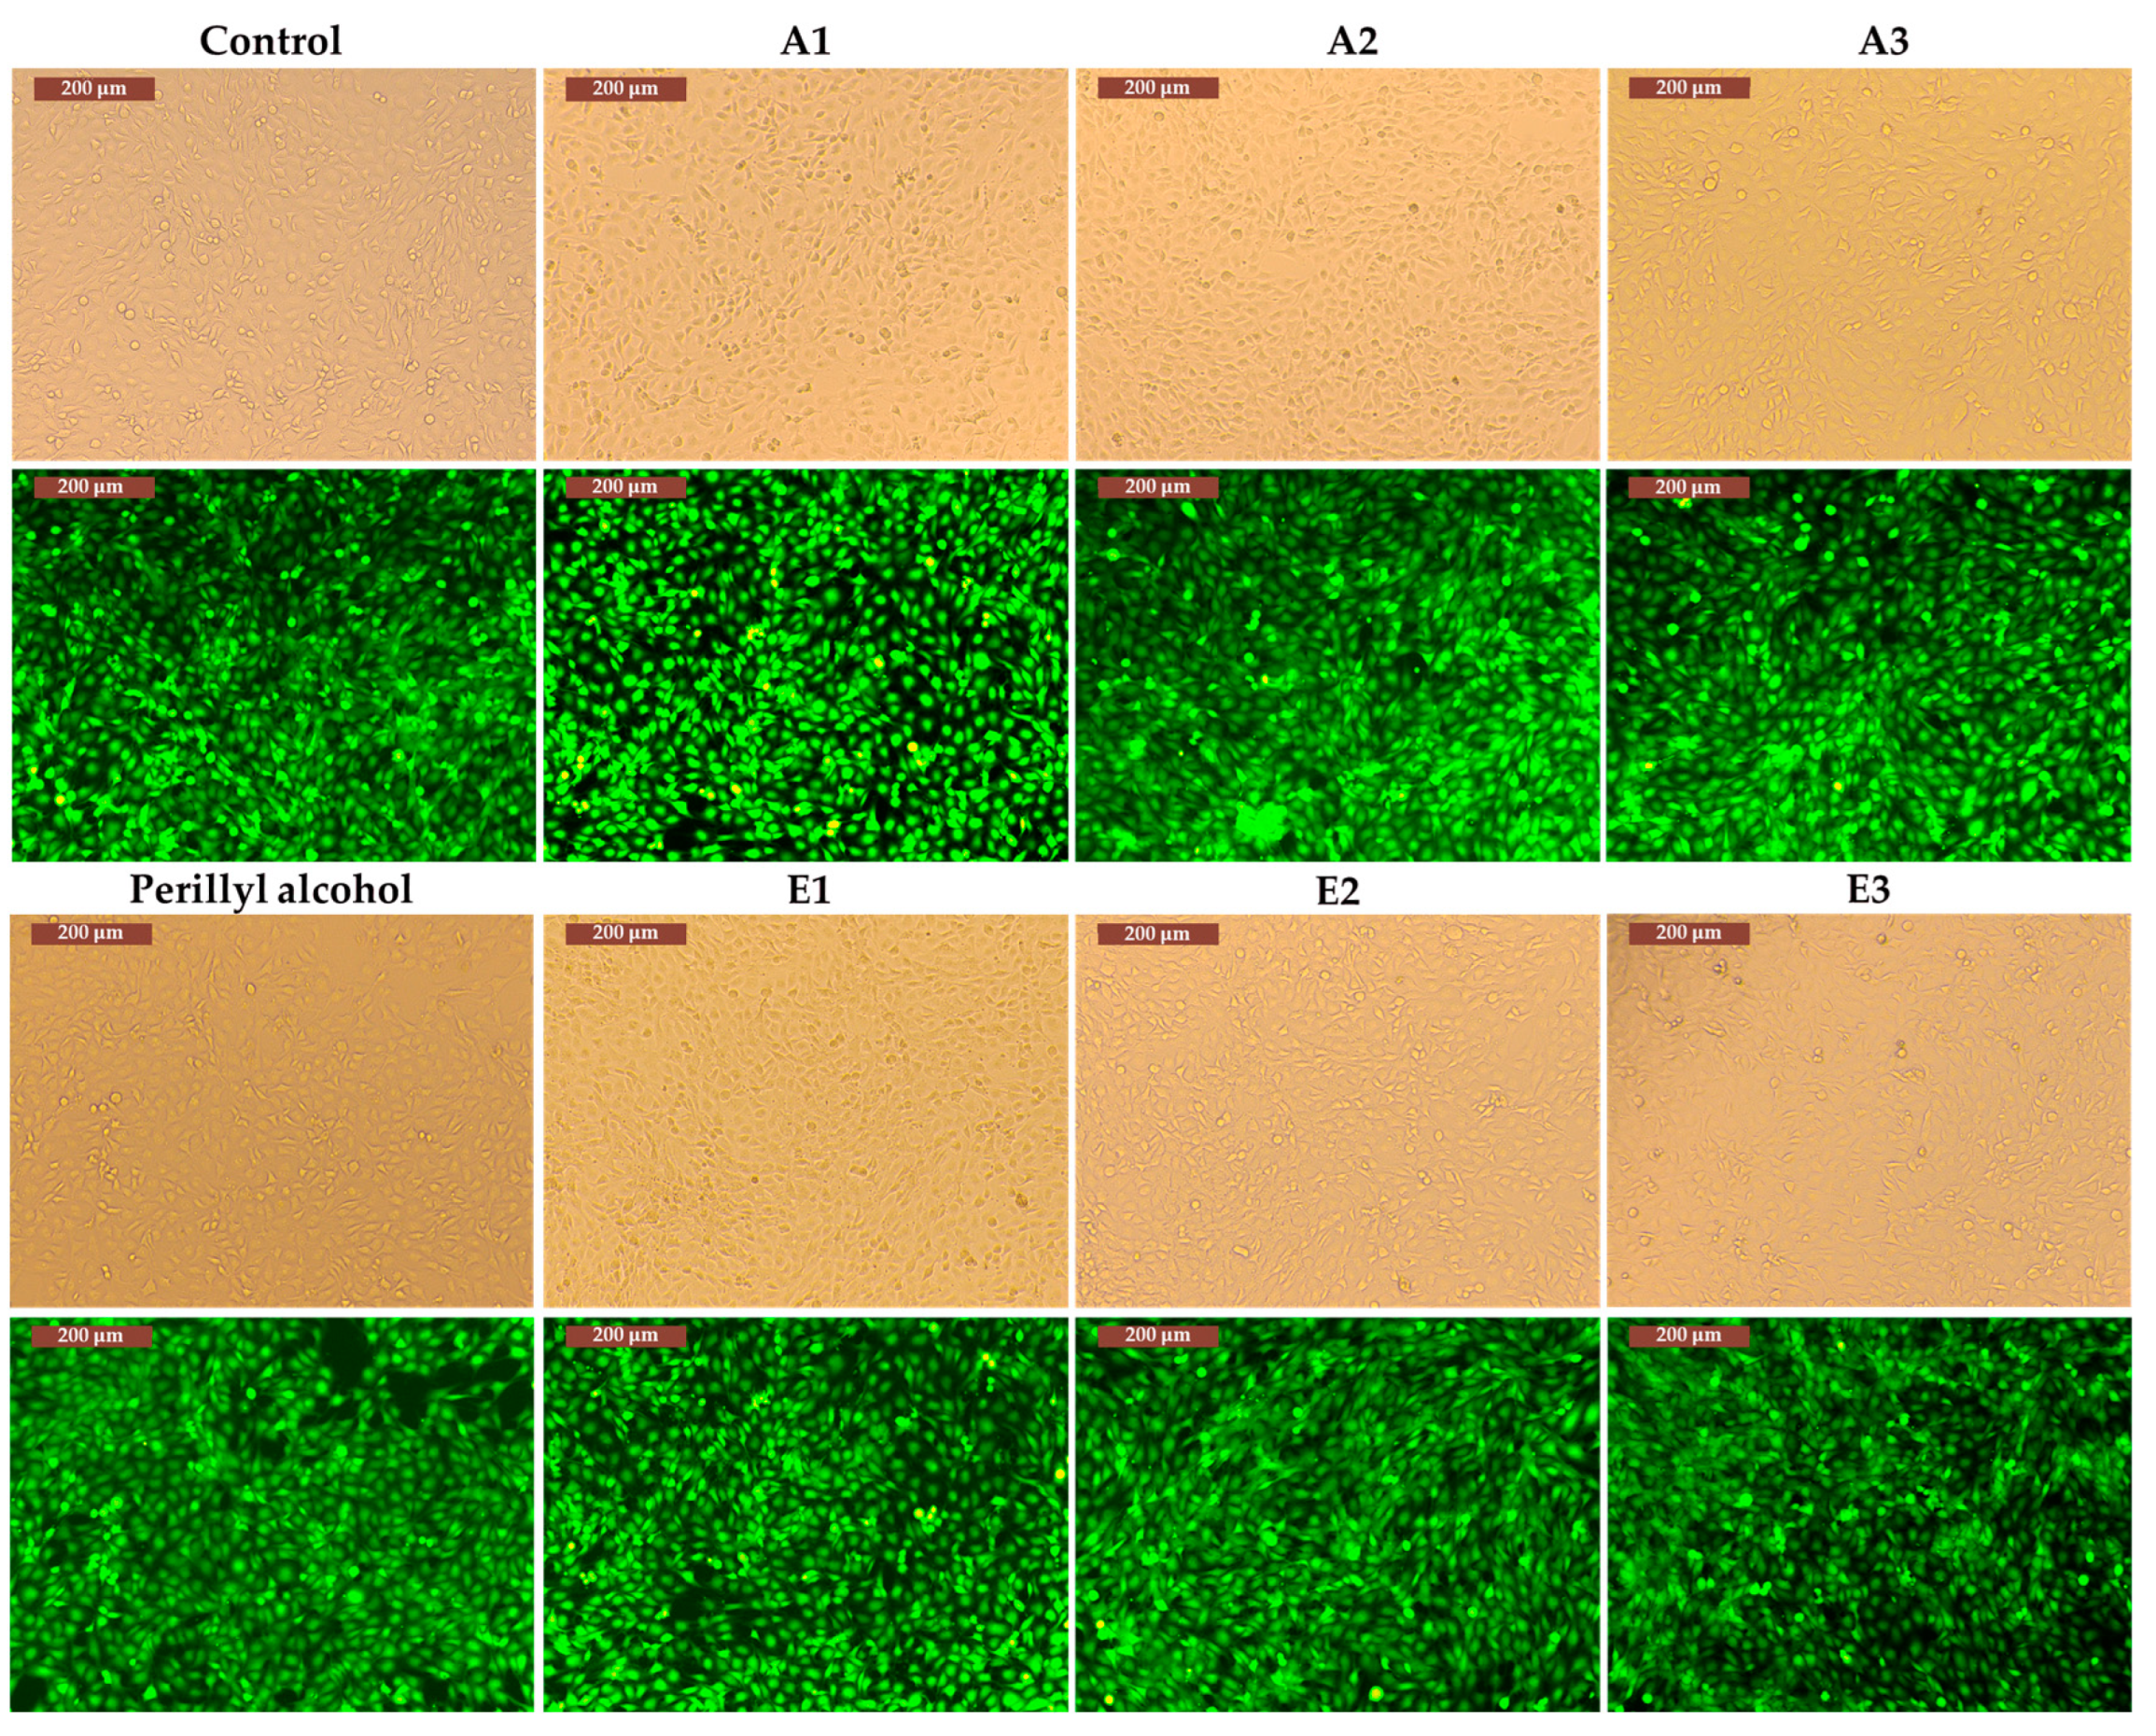
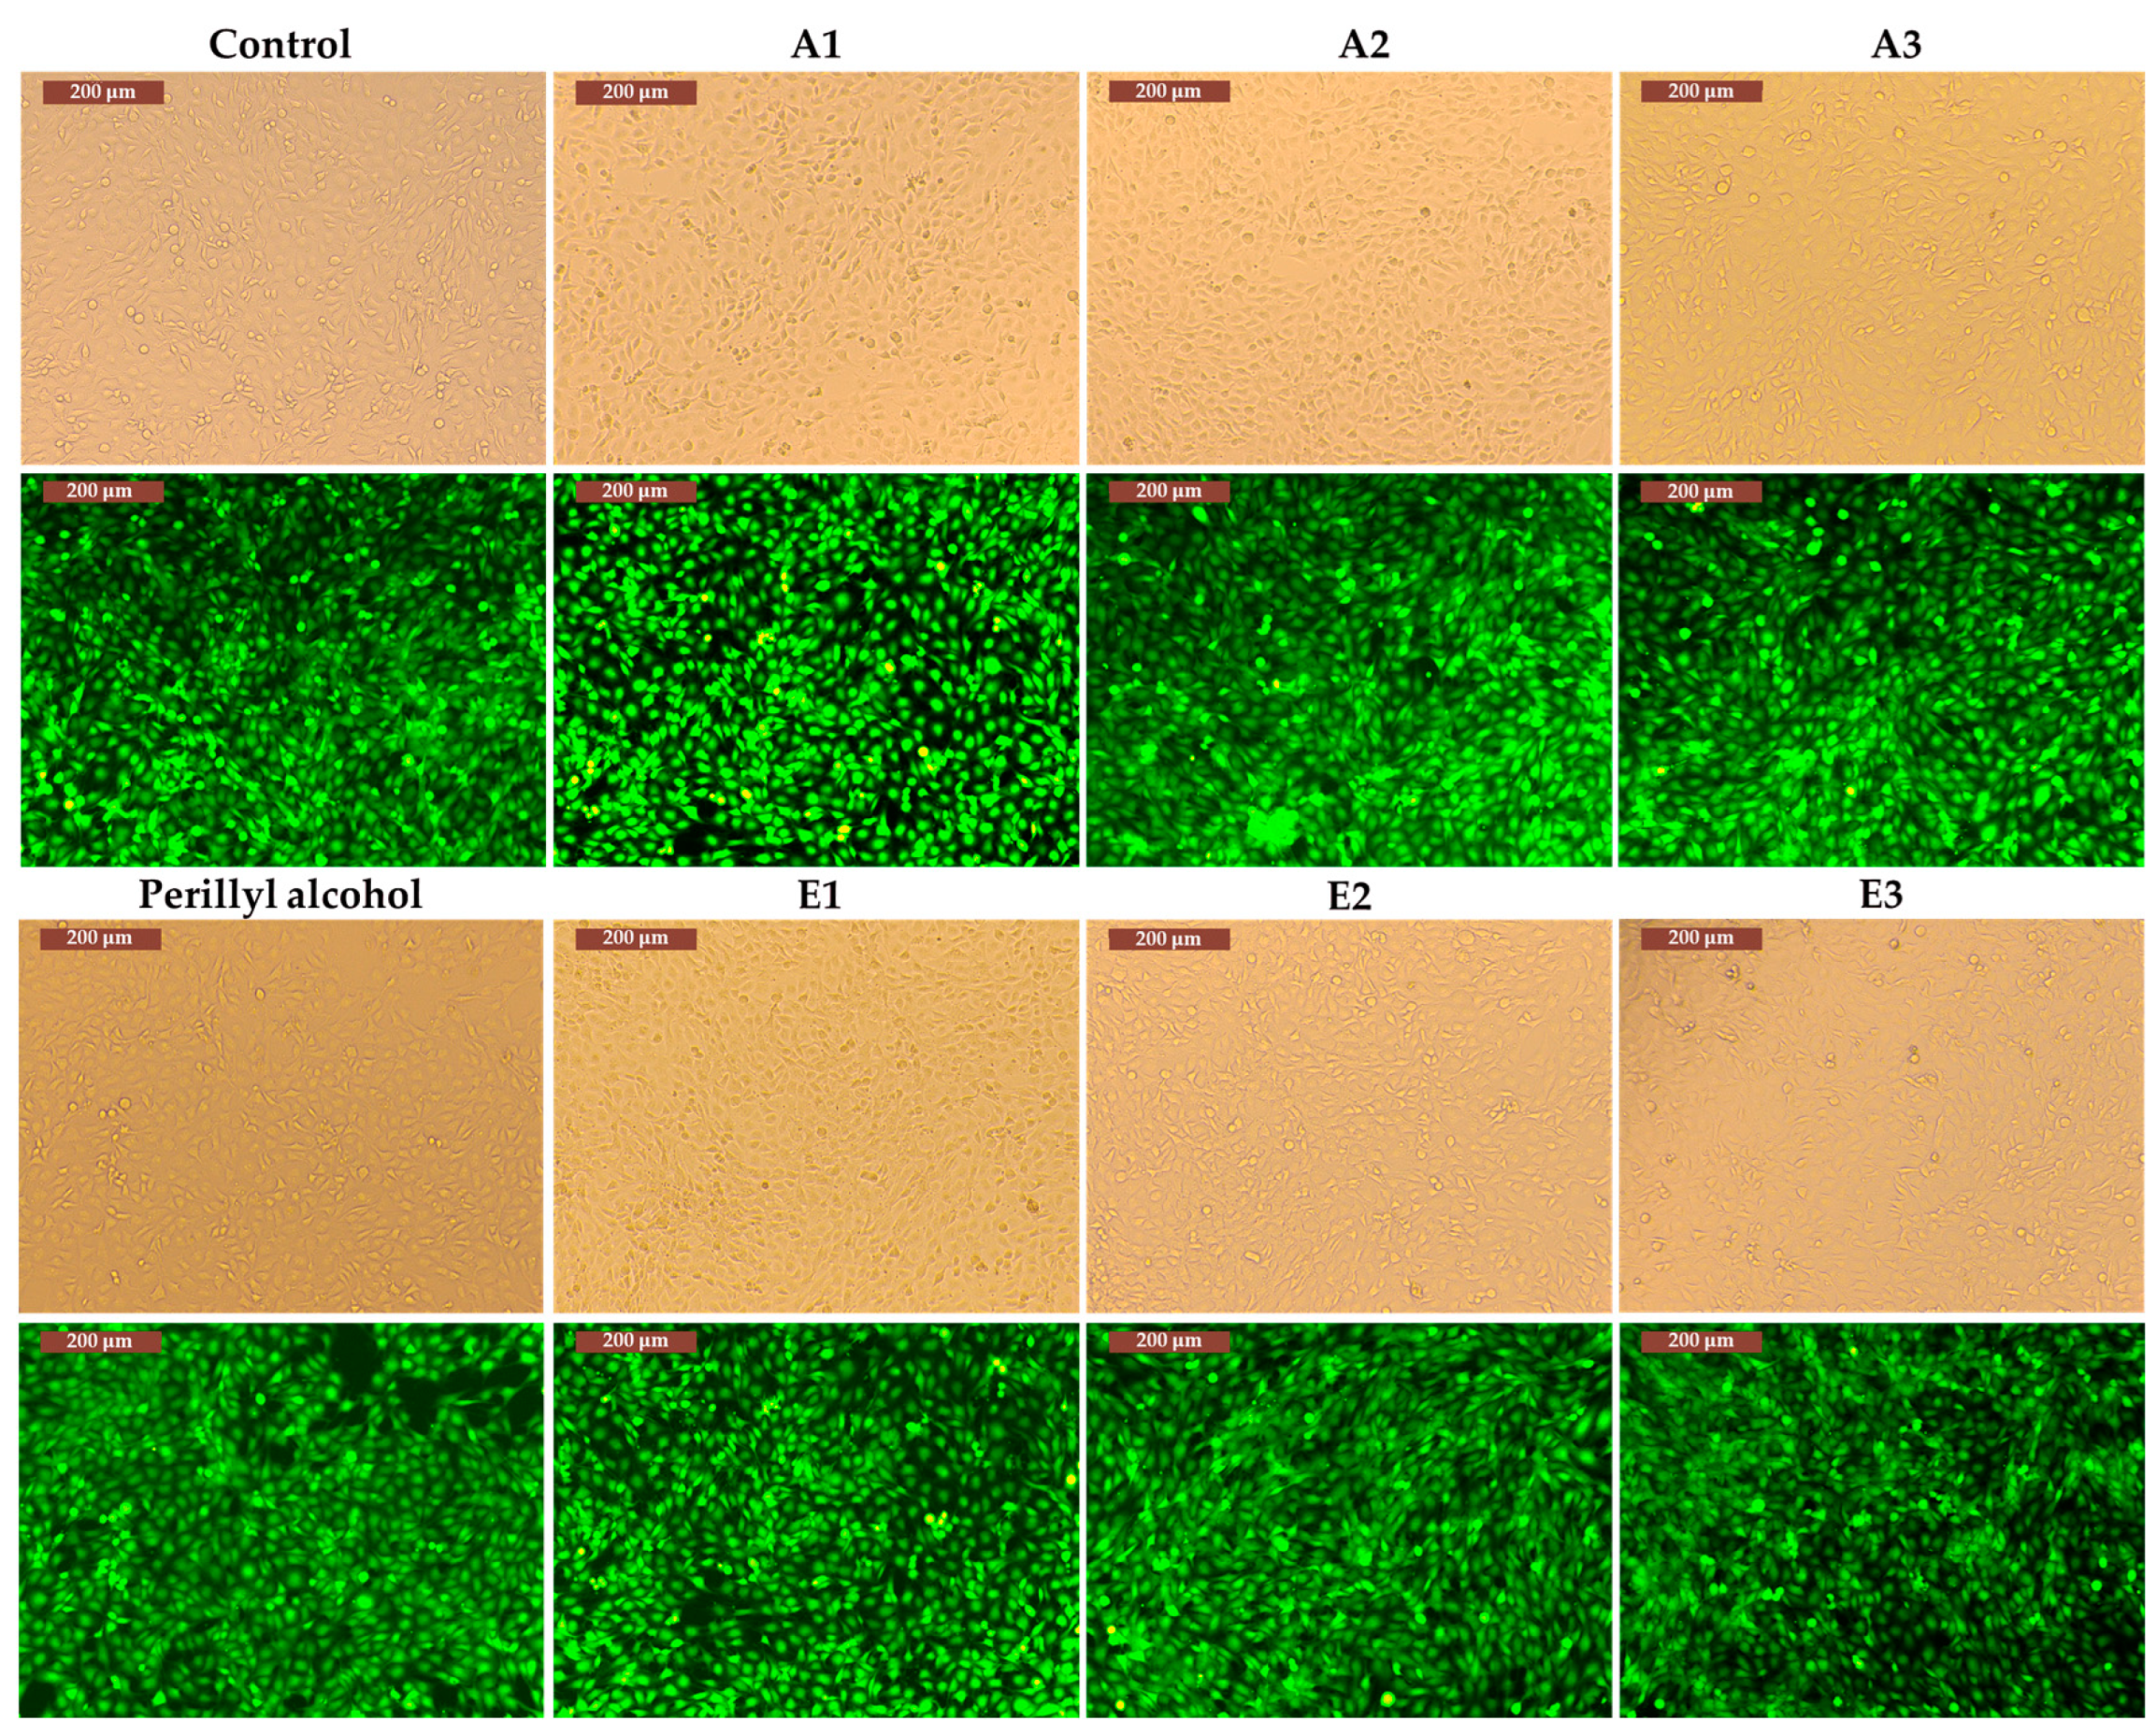
In the figures below, it can be observed that all the data obtained for the Calcein AM assay is correlated with the data obtained in the MTT test. Thus, for the MG-63 cell line, in the case of extracts E1 – E3 and A1 – A3, where viability values ranged from 101% to 106%, a cell density similar to that in the control wells is observed. However, in the case of perillyl alcohol, where viability was 82 %, there are areas that are not populated with cells (Figure 10).
In the case of the A431 cell line, for extracts E3 and A1 – A2 (Figure 10), which showed viability values of approximately 98%, a comparable cell density can be observed compared to the control wells. For extract E1, which resulted in a 72-hour cell viability of 82% (Figure 11) cell density can be observed compared to the control.

4. Discussion

The present study aimed to quantify of the total flavonoid, phenol, and anthocyanin content of some selective Perilla frutescens extracts, to determine the in vitro antioxidant action of Perilla leaves extracts, and to characterize the in vitro cytotoxic and antitumoral activity of Perilla frutescens extracts.
Our results indicated that the extraction yield was higher for ethanolic extracts compared with solvent mixture extracts, both categories had an extraction yield of more than 30%, which indicates a good performance of the process. Our results were comparable to those published in the literature [22,23].
The total phenols concentration was significantly higher in the ethanolic extracts of Perilla leaves, but the flavonoids and anthocyanins concentrations did not significantly differ between the two types of extracts. Zhao et al., investigated the total polyphenols concentration from 44 species of Perilla frutescens using ultrasonic-assisted ethanol extraction (60%) and ultrasound-assisted cellulase hydrolysis, and demonstrated that the total phenols concentration was significantly higher when using cellulase hydrolysis extracts compared to ethanolic extracts [24].
The amount of caffeic acid in the ethanolic extracts of Perilla frutescens was substantially higher, with the greatest concentration found in the E1 extract. Indeed, it was found that the total concentration of caffeic acid varies among various strains of Perilla frutescens, although less than rosmarinic acid, and this might be due to different genetic backgrounds of the plant [25].
Additionally, it was discovered that ethanolic extracts had considerably greater levels of syringic acid, p-coumaric acid, ferulic acid, kaempferol, isorhamnetin, and pinocembrin. P-coumaric acid, isorhamnetin, and pinocembrin were most abundant in E1 extract, but syringic acid was most abundant in E2. Kaempferol and ferulic acid were abundant in the E3 extract. Other studies have confirmed the presence of these compounds in different varieties of Perilla frutescens [26,27,28].
Polyphenolic compounds exhibit antioxidative properties through various mechanisms. The hydroxyl groups serve as effective hydrogen donors and can engage with reactive oxygen and nitrogen species, as discussed by Valentao et al. [29] and Heim, et al [30]. This interaction leads to a termination reaction that effectively halts the generation of free radicals. Consequently, the initial reactive species transform into a radical form of the antioxidant, characterized by significantly enhanced chemical stability compared to the initial radical state.
The antioxidative capacity of phenolic compounds is also associated with their capability to chelate metal ions involved in free radical production [31]. However, it is important to note that phenolics can, under certain circumstances, act as pro-oxidants. This can occur through the chelation of metals that either maintain or enhance their catalytic activity or by reducing metals, subsequently increasing their propensity to generate free radicals [32].
Moreover, the structural attributes of phenolic compounds make them prone to strong interactions with proteins, owing to their hydrophobic benzenoid rings and the hydrogen-bonding potential of phenolic hydroxyl groups. Consequently, phenolics possess the capacity to act as antioxidants by inhibiting specific enzymes involved in radical generation, such as various cytochrome P450 isoforms, lipoxygenases, cyclooxygenase, and xanthine oxidase [33].
In this study, we demonstrated that the iron chelation capacity, the scavenging capacity of hydroxyl radical, the scavenging capacity of the superoxide anion radical, and the lipoxygenase inhibition capacity increased with Perilla frutescens extracts concentrations, and it was significantly higher in ethanolic extracts.
These results could be explained by the fact that the retrieval of antioxidant compounds from botanical sources typically involves employing various extraction methodologies tailored to their inherent chemistry and non-uniform distribution within the plant matrix. Among these methods, solvent extraction stands out as the most commonly utilized technique for the isolation of antioxidant compounds from plants [34].
However, it is crucial to note that the yields of extracted substances, the polyphenolic contents, and the resultant antioxidant properties of plant materials are markedly influenced by the choice of extracting solvent and the extraction method. This variation arises due to the presence of diverse antioxidant compounds with distinct chemical properties and polarities, which may or may not be soluble in a given solvent [34].
In practice, polar solvents are frequently selected for the recovery of polyphenols from plant matrices. Among these, the most suitable options include aqueous mixtures, either hot or cold, incorporating ethanol, methanol, acetone, and ethyl acetate [34].
As far as we know, the cytotoxic effects of Perilla frutescens extracts on tumoral cell cultures is barely studied. E.g., alcoholic extracts (ethanol) from Perilla frutescens leaves shown to have antitumoral effects in vitro, inhibiting the adhesion, proliferation and colony formation of human colon and lung tumor cells [35]. Moreover, it was proved that isoegomaketone extracted from Perilla frutescens can induce in vitro apoptosis in human melanoma cells [35] and in human breast tumor cells [36]. But, up to our knowledge, this was the first time, Perilla frutescens extracts were tested on human tumoral osteoblasts (MG-63 cell line) and human tumoral keratinocytes (A431 cell line).
The results indicated that in MG-63 cell line the antitumoral effects were evident for all extracts at concentrations ≥ 0.5 mg/ml. In contrast, cytocompatibility with the MG63 cell line was observed at concentrations of 0.2 mg/ml for all extracts. Notably, perillyl alcohol exhibited antitumoral effects at concentrations ≥ 0.5 mg/ml. In the case of the MG-63 cell line, extracts E1-E3 and A1-A3, with viability values ranging from 101% to 106%, demonstrated cell densities comparable to those in the control group. However, perillyl alcohol, with a viability of 82 %, displayed areas devoid of cells.
Regarding the A431 cell line, cytocompatibility was observed at concentrations of 0.05 mg/ml for E1 and E3 extracts, 0.1 mg/ml for E2, A1, A2, and A3 extracts, and 0.2 mg/ml for perillyl alcohol. Moreover, extracts E3 and A1 – A2, with viability values of approximately 98%, exhibited cell densities similar to the control group. Conversely, extract E1, resulting in a 72-hour cell viability of 82%, displayed a reduced cell density compared to the control.
Further studies, on various type of oncogenic cell lines, and using different extracts of Perilla frutescens could confirm our results. Overall, all ethanolic extracts exhibited higher concentrations of phenols, and antioxidant activity compared to mixed solvents extracts, thus supporting their use in pharmacological practice.

5. Conclusions

The total concentration of polyphenols was significantly higher in the ethanolic extracts of Perilla frutescens, while the concentrations of flavonoids and anthocyanins were not significantly different between the two types of extracts
In this study, we demonstrated that with increasing concentrations of Perilla frutescens extracts, iron chelating capacity, hydroxyl radical scavenging capacity, superoxide anion radical scavenging capacity, and lipoxygenase inhibition capacity increased and were significantly higher for the ethanolic extracts.
Perillyl alcohol had greater cytotoxic capacity on MG-63 cell line and E1 extract showed similar significant cytotoxic effects on A431 cell line.

Supplementary Materials

The following supporting information can be downloaded at the website of this paper posted on Preprints.org. S1- list of reagents used in our experiments.

Author Contributions

This paper was written as part of a doctoral program of G.A. at UMF “Grigore T. Popa”. Conceptualization, G.A., F.D.C, L.V., O.C., A-M.A., C.M., and M.H.; methodology, M.H.; validation, I-A.V., A.N., V.H., B.H. and A.H..; formal analysis, I-A.V., A.N., V.H., B.H. and A.H.; investigation, G.A., F.D.C, L.V., O.C., A-M.A., C.M., and M.H.; resources, G.A.; data curation I-A.V., A.N., V.H., B.H. and A.H.; writing—original draft preparation, G.A., F.D.C, L.V., O.C., A-M.A., C.M., and M.H.; writing—review and editing, G.A., F.D.C, L.V., O.C., A-M.A., C.M., and M.H.; visualization, G.A.; supervision, M.H.; project administration, M.H.; All authors have read and agreed to the published version of the manuscript.

Funding

This research received no external funding.

Institutional Review Board Statement

Not applicable.

Informed Consent Statement

Not applicable.

Data Availability Statement

The data presented in this study are available on request from the corresponding author. The data are not publicly available due to local policies.

Conflicts of Interest

The authors declare no conflict of interest.

References

  1. Adam, G.; Robu, S.; Flutur, M.M.; Cioanca, O.; Vasilache, I.A.; Adam, A.M.; et al. Applications of Perilla frutescens Extracts in Clinical Practice. Antioxidants (Basel). 2023, 12, 727. [Google Scholar] [CrossRef] [PubMed]
  2. Adam, G.; Adam, A.M.; Robu, S.; Harabor, V.; Harabor, A.; Nechita, A.; et al. The Effects of Perilla frutescens Extracts on IgA Nephropathy: A Systematic Review and Meta-Analysis. Pharmaceuticals (Basel). 2023, 16, 988. [Google Scholar] [CrossRef] [PubMed]
  3. Huang, S.; Nan, Y.; Chen, G.; Ning, N.; Du, Y.; Lu, D.; et al. The Role and Mechanism of Perilla frutescens in Cancer Treatment. Molecules. 2023, 28, 5883. [Google Scholar] [CrossRef] [PubMed]
  4. Kim, C.L.; Shin, Y.S.; Choi, S.H.; Oh, S.; Kim, K.; Jeong, H.S.; et al. Extracts of Perilla frutescens var. Acuta (Odash.) Kudo Leaves Have Antitumor Effects on Breast Cancer Cells by Suppressing YAP Activity. Evid Based Complement Altern. Med. 2021, 2021, 5619761. [Google Scholar] [CrossRef]
  5. Meng, L.; Lozano, Y.F.; Gaydou, E.M.; Li, B. Antioxidant activities of polyphenols extracted from Perilla frutescens varieties. Molecules. 2008, 14, 133–140. [Google Scholar] [CrossRef] [PubMed]
  6. Lee, J.E.; Kim, N.; Yeo, J.Y.; Seo, D.G.; Kim, S.; Lee, J.S.; et al. Anti-Amyloidogenic Effects of Asarone Derivatives From Perilla frutescens Leaves against Beta-Amyloid Aggregation and Nitric Oxide Production. Molecules. 2019, 24, 4297. [Google Scholar] [CrossRef] [PubMed]
  7. Lee, Y.H.; Kim, B.; Kim, S.; Kim, M.S.; Kim, H.; Hwang, S.R.; et al. Characterization of metabolite profiles from the leaves of green perilla (Perilla frutescens) by ultra high performance liquid chromatography coupled with electrospray ionization quadrupole time-of-flight mass spectrometry and screening for their antioxidant properties. J Food Drug Anal. 2017, 25, 776–788. [Google Scholar]
  8. Guzik, T.J.; Korbut, R.; Adamek-Guzik, T. Nitric oxide and superoxide in inflammation and immune regulation. J Physiol Pharmacol. 2003, 54, 469–487. [Google Scholar] [PubMed]
  9. Batir Marin, D.; Cioanca, O.; Apostu, M.; Tuchilus, C.; Mircea, C.; Robu, S.; et al. The Comparative Study of Equisetum pratense, E. sylvaticum, E. telmateia: Accumulation of Silicon, Antioxidant and Antimicrobial Screening. Rev. De Chimie. 2019, 70, 2519–2523. [Google Scholar] [CrossRef]
  10. Aron, N.; Bogdan-Goroftei, R.-E.; Boev, M.; Marin, D.; Ramos-Villarroel, A.; Iancu, A.-V. Innovative Fermented Soy Drink with the Sea Buckthorn Syrup and the Probiotics Co-Culture of Lactobacillus Paracasei ssp. Paracasei (L. Casei® 431) and Bifidobacterium Animalis ssp. Lactis (Bb-12®). Fermentation 2023, 9, 806. [Google Scholar] [CrossRef]
  11. Russo, D. Flavonoids and the structure-antioxidant activity relationship. J Pharmacogn Nat Prod. 2018, 4. [Google Scholar] [CrossRef]
  12. Amić, D.; Davidović-Amić, D.; Bešlo, D.; Trinajstić, N. Structure-radical scavenging activity relationships of flavonoids. Croat. Chem. Acta. 2003, 76, 55–61. [Google Scholar]
  13. Pietta, P.-G. Flavonoids as antioxidants. J. Nat. Prod.. 2000, 63, 1035–1042. [Google Scholar] [CrossRef] [PubMed]
  14. Lu, W.; Shi, Y.; Wang, R.; Su, D.; Tang, M.; Liu, Y.; et al. Antioxidant activity and healthy benefits of natural pigments in fruits: A review. Int. J. Mol. Sci.. 2021, 22, 4945. [Google Scholar] [CrossRef] [PubMed]
  15. Mandal, S.; Hazra, B.; Sarkar, R.; Biswas, S.; Mandal, N. Assessment of the antioxidant and reactive oxygen species scavenging activity of methanolic extract of Caesalpinia crista leaf. Evidence-Based Complementary and Alternative Medicine. 2011, 2011, 173768. [Google Scholar] [CrossRef] [PubMed]
  16. Humulescu, I.; Flutur, M.-M.; Cioanca, O.; Mircea, C.; Robu, S.; Marin-Batir, D.; et al. Comparative chemical and biological activity of selective herbal extracts. Farmacia. 2021, 69. [Google Scholar] [CrossRef]
  17. LUNGUII.; MARIN-BATÎRD.; PANAINTEA.; MIRCEAC.; TUCHILUȘ, C.; ȘTEFANACHEA; et al CATECHIN-ZINC-COMPLEX: SYNTHESIS.; CHARACTERIZATION AND BIOLOGICAL ACTIVITY ASSESSMENT. Farmacia. 2023, 71. [CrossRef]
  18. Dinis, T.C.; Maderia, V.M.; Almeida, L.M. Action of phenolic derivatives (acetaminophen, salicylate, and 5-aminosalicylate) as inhibitors of membrane lipid peroxidation and as peroxyl radical scavengers. Arch Biochem Biophys. 1994, 315, 161–169. [Google Scholar] [CrossRef] [PubMed]
  19. Jeong, Y.; Lim, D.W.; Choi, J. Assessment of Size-Dependent Antimicrobial and Cytotoxic Properties of Silver Nanoparticles. Adv. Mater. Sci. Engineering. 2014, 2014, 763807. [Google Scholar] [CrossRef]
  20. Wang, Z.; Luo, D. Antioxidant activities of different fractions of polysaccharide purified from Gynostemma pentaphyllum Makino. Carbohydr. Polymers. 2007, 68, 54–58. [Google Scholar] [CrossRef]
  21. Malterud, K.E.; Rydland, K.M. Inhibitors of 15-lipoxygenase from orange peel. J Agric Food Chem. 2000, 48, 5576–5580. [Google Scholar] [CrossRef] [PubMed]
  22. Shang, X.; Zhang, M.; Hu, J.; Zhang, Y.; Yang, L.; Hou, X. Chemical Compositions, Extraction Optimizations, and In Vitro Bioactivities of Flavonoids from Perilla Leaves (Perillae folium) by Microwave-Assisted Natural Deep Eutectic Solvents. Antioxidants. 2023, 12, 104. [Google Scholar] [CrossRef] [PubMed]
  23. Chen, M.L.; Wu, C.H.; Hung, L.S.; Lin, B.F. Ethanol Extract of Perilla frutescens Suppresses Allergen-Specific Th2 Responses and Alleviates Airway Inflammation and Hyperreactivity in Ovalbumin-Sensitized Murine Model of Asthma. Evid Based Complement Altern. Med. 2015, 2015, 324265. [Google Scholar]
  24. Zhao, Y.; Li, H.; Zhang, Z.; Ren, Z.; Yang, F. Extraction, preparative monomer separation and antibacterial activity of total polyphenols from Perilla frutescens. Food Funct. 2022, 13, 880–890. [Google Scholar] [CrossRef] [PubMed]
  25. Deguchi, Y.; Ito, M. Caffeic acid and rosmarinic acid contents in genus Perilla. J Nat Med. 2020, 74, 834–839. [Google Scholar] [CrossRef] [PubMed]
  26. Fujiwara, Y.; Kono, M.; Ito, A.; Ito, M. Anthocyanins in perilla plants and dried leaves. Phytochemistry. 2018, 147, 158–166. [Google Scholar] [CrossRef] [PubMed]
  27. Li, Y.; Zhang, Y.; Wang, Y.; Li, X.; Zhou, L.; Yang, J.; et al. Metabolites and chemometric study of Perilla (Perilla frutescens) from different varieties and geographical origins. J Food Sci. 2022, 87, 5240–5251. [Google Scholar] [CrossRef] [PubMed]
  28. Peng, Y.; Ye, J.; Kong, J. Determination of phenolic compounds in Perilla frutescens L. by capillary electrophoresis with electrochemical detection. J Agric Food Chem. 2005, 53, 8141–8147. [Google Scholar] [CrossRef] [PubMed]
  29. Valentão, P.; Fernandes, E.; Carvalho, F.; Andrade, P.B.; Seabra, R.M.; Bastos, M.L. Hydroxyl radical and hypochlorous acid scavenging activity of small centaury (Centaurium erythraea) infusion. A comparative study with green tea (Camellia sinensis). Phytomedicine. 2003, 10, 517–522. [Google Scholar] [CrossRef] [PubMed]
  30. Heim, K.E.; Tagliaferro, A.R.; Bobilya, D.J. Flavonoid antioxidants: chemistry, metabolism and structure-activity relationships. J Nutr Biochem. 2002, 13, 572–584. [Google Scholar] [CrossRef] [PubMed]
  31. Yang, C.S.; Landau, J.M.; Huang, M.T.; Newmark, H.L. Inhibition of carcinogenesis by dietary polyphenolic compounds. Annu Rev Nutr. 2001, 21, 381–406. [Google Scholar] [CrossRef] [PubMed]
  32. Croft, K.D. The chemistry and biological effects of flavonoids and phenolic acids. Ann N Y Acad Sci. 1998, 854, 435–442. [Google Scholar] [CrossRef] [PubMed]
  33. Parr, A.; Bolwell, G.P. Phenols in the plant and in man. The potential for possible nutritional enhancement of the diet by modifying the phenols content or profile. J. Sci. Food Agriculture. 2000, 80, 985–1012. [Google Scholar] [CrossRef]
  34. Sultana, B.; Anwar, F.; Ashraf, M. Effect of extraction solvent/technique on the antioxidant activity of selected medicinal plant extracts. Molecules. 2009, 14, 2167–2180. [Google Scholar] [CrossRef] [PubMed]
  35. Kwon, S.J.; Lee, J.H.; Moon, K.D.; Jeong, I.Y.; Ahn, D.U.; Lee, M.K.; et al. Induction of apoptosis by isoegomaketone from Perilla frutescens L. in B16 melanoma cells is mediated through ROS generation and mitochondrial-dependent, -independent pathway. Food Chem Toxicol. 2014, 65, 97–104. [Google Scholar] [CrossRef] [PubMed]
  36. Cho, B.O.; Jin, C.H.; Park, Y.D.; Ryu, H.W.; Byun, M.W.; Seo, K.I.; et al. Isoegomaketone induces apoptosis through caspase-dependent and caspase-independent pathways in human DLD1 cells. Biosci Biotechnol Biochem. 2011, 75, 1306–1311. [Google Scholar] [CrossRef] [PubMed]
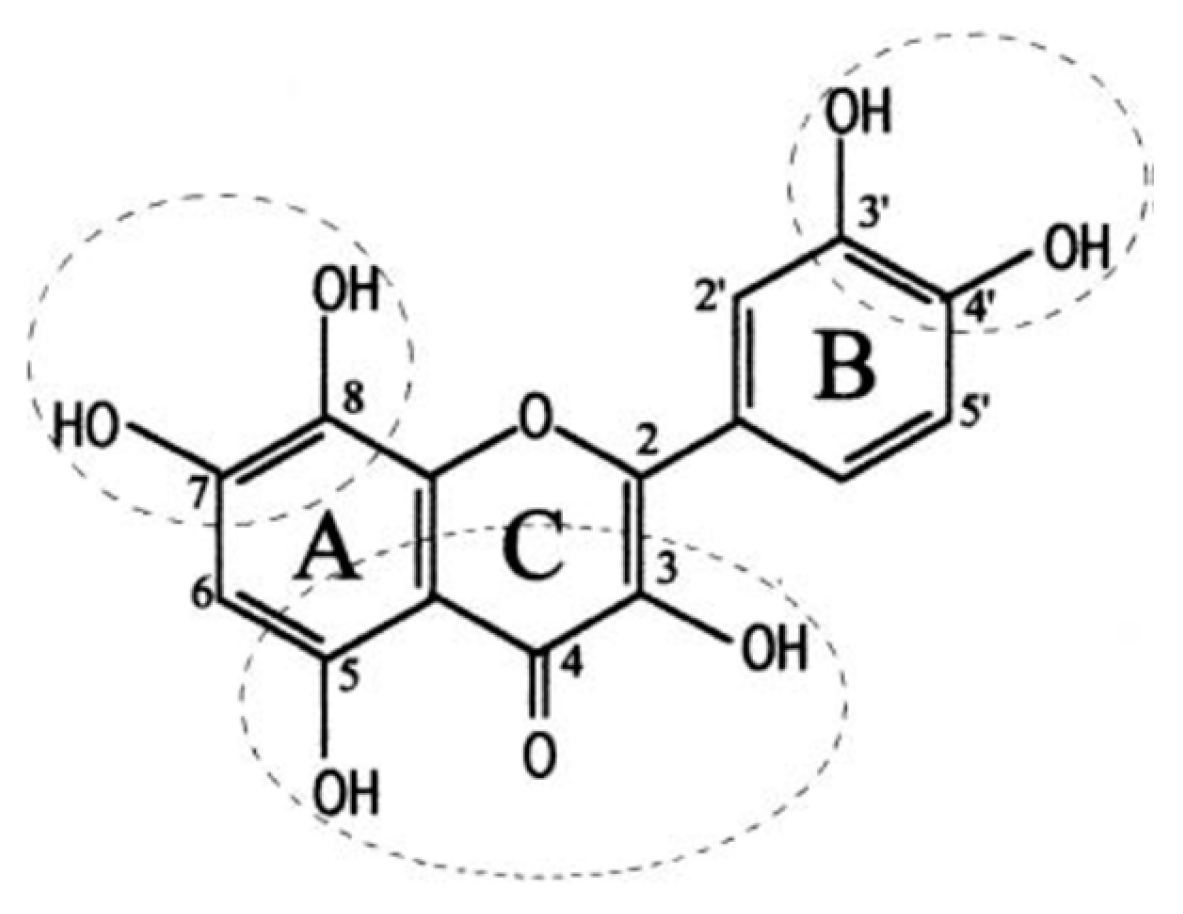
 
Figure 1. Structural elements of the flavone molecule, important for the antioxidant action (Adapted after Amic et al., [12]).
Preprints 91327 g001
Figure 2. Graphical representation of the iron chelation capacity considering various concentrations of Perilla frutescens extracts.
Preprints 91327 g002
Figure 3. The scavenging activity of hydroxyl radical in the analyzed Perilla frutescens extracts.
Preprints 91327 g003
Figure 4. The graphical representation of the scavenging capacity of superoxide anion radicals in the analyzed Perilla frutescens extracts.
Preprints 91327 g004
Figure 5. The graphical representation of the capacity of Perilla leaves extracts to inhibit lipoxygenase.
Preprints 91327 g005
Figure 6. Mg-63 viability (%) in contact with E1 – E3 Perilla frutescens extracts.
Preprints 91327 g006
Figure 7. Mg-63 viability (%) in contact with A1 – A3 Perilla frutescens extracts and Perillyl alcohol.
Preprints 91327 g007
Figure 8. A431 viability (%) in contact with E1 – E3 Perilla frutescens extracts.
Preprints 91327 g008
Figure 9. A431 viability (%) in contact with A1 – A3 Perilla frutescens extracts.
Preprints 91327 g009
Figure 10. The structure and morphology of MG-63 cells cultured with extract A1 – A3, E1 – E3, perillyl alcohol, and the control (marked or not with Calcein-AM).
Preprints 91327 g010
Figure 11. The structure and morphology of A431 cells cultured with extract E1 – E3, A1 – A3, perillyl alcohol, and the control (marked or not with Calcein-AM).
Preprints 91327 g011
Table 1. The coding of the extracts and their extraction yield.
Solvent Perilla frutescens Species Variety Extract Code Extraction Yield
70% Ethanol Perilla frutescens var. crispa f. purpurea E1 58.22%
70% Ethanol Perilla frutescens var. frutescens f. viridis E2 58.79%
70% Ethanol Perilla frutescens var. frutescens f. crispidiscolor E3 48.32%
Acetone:Ethanol (7:3) + Citric Acid Perilla frutescens var. crispa f. purpurea A1 38.51%
Acetone:Ethanol (7:3) + Citric Acid Perilla frutescens var. frutescens f. viridis A2 34.84%
Acetone:Ethanol (7:3) + Citric Acid Perilla frutescens var. frutescens f. crispidiscolor A3 44.47%
Table 2. Total phenols, flavonoids and anthocyanins quantification from ethanolic and ethanol: acetone extracts.
Sample Total Phenols
(µg gallic acid /mL extract)
P value Total Flavonoids (µg rutoside /mL extract) P value Anthocyanins (µg cyanidol/mL extract) P value
E1 2253 0.002 194.8621 0.35 103 0.79
E2 1475 98.7271 8.8
E3 2142 125.7352 84
A1 350 128.0261 98
A2 174 84.5071 -
A3 301 109.8420 64
Legend: E- ethanolic extract; A- ethanol: acetone extracts.
Table 3. Quantification of various compounds from Perilla frutescens extracts using UPLC.
Compound Identified compound (µg/mL extract) Pvalue
E1 E2 E3 A1 A2 A3
gallic acid 0.249 0.235 0.095 - 0.225 0.103 0.72
catechin 1.526 2.025 1.672 1.388 1.355 1.581 0.14
chlorogenic acid 1.15 0.388 4.448 0.376 0.633 0.331 0.28
caffeic acid 109.714 55.12 81.306 8.582 12.022 7.108 0.01
epi-catechin 1.014 0.870 0.912 0.769 0.653 1.030 0.39
syringic acid 129.323 244.033 232.475 20.57 35.109 19.603 0.008
p-coumaric acid 11.163 10.069 7.097 2.222 2.25 3.788 0.007
ferulic acid 2.423 2.429 2.551 - 0.538 0.722 0.007
ellagic acid 9.930 5.865 4.807 3.421 3.677 2.731 0.08
cinnamic acid 70.465 - 22.698 16.544 11.494 25.218 0.56
rosmarinic acid 67.665 10.351 14.871 1.098 3.177 9.004 0.22
quercitin 19.663 3.912 16.828 - - 12.243 0.21
kaemferol 36.45 38.12 41.09 22.05 26.15 19.47 0.002
isorhamnetin 1.194 0.805 0.745 0.138 0.101 0.263 0.007
apigenin 3.400 8.361 10.656 2.677 4.061 1.313 0.10
pinostrobin 31.827 28.35 24.081 23.601 - 24.320 0.21
pinocembrin 2.323 0.972 2.302 0.387 0.447 0.424 0.03
crysin 1.11 4.214 3.239 1.449 1.354 0.56 0.14
Table 4. Determination of the in vitro antioxidant action of Perilla frutescens extracts.
Iron Chelation Capacity Assessment
Samples Concentration of the solution Pvalue
0.15625 mg 0.3125 mg 0.625 mg 1.25 mg 2.5 mg 5 mg 10 mg IC50 (μg/mL final solution)
E1 16.42 ± 0.11 25.10 ± 0.02 30.60 ± 0.12 77.64 ± 0.01 90.83 ± 0.01 97.50 ± 0.02 99.53 ± 0.01 166.36 ± 0.18 <0.001
E2 5.76 ± 0.06 10.79 ± 0.04 17.61 ± 0.06 34.84 ± 0.05 58.99 ± 1.31 80.92 ± 0.02 92.78 ± 0.03 386.69 ± 9.36
E3 13.30 ± 0.01 19.22 ± 0.11 22.20 ± 0.01 44.29 ± 0.03 67.26 ± 0.05 97.55 ± 0.04 98.45 ± 0.06 297.01 ± 0.31
A1 3.03 ± 0.08 4.46 ± 0.08 7.11 ± 0.08 12.82 ± 0.08 29.18 ± 0.14 58.95 ± 0.04 84.90 ± 0.02 811.88 ± 1.32
A2 2.81 ± 0,06 6.68 ± 0.11 7.20 ± 0.09 12.50 ± 0.05 25.05 ± 0.07 47.48 ± 0.01 91.01 ± 0.02 1040.93 ± 0.17
A3 2.87 ± 0,09 5.74 ± 0.04 7.69 ± 0.31 14.14 ± 0.06 29.92 ± 0.01 57.35 ± 0.05 71.79 ± 0.03 830.49 ± 0.82
Gallic acid 6.91 ± 0.07 12.86 ± 0.11 17.29 ± 0.09 24.82 ± 0.12 31.45 ± 0.28 45.19 ± 0.07 67.25 ± 0.08 1163.15±2.63
Determination of Hydroxyl Radical Scavenging Capacity
Samples Concentration of the solution Pvalue
0.15625 mg 0.3125 mg 0.625 mg 1.25 mg 2.5 mg 5 mg 10 mg IC50 (μg/mL final solution)
E1 11.41 ± 0.41 17.69 ± 0.35 27.39 ± 0.26 47.79 ± 0.11 64.61 ± 0.31 81.40 ± 0.26 84.86 ± 0.15 122.62±0.74 <0.001
E2 10.34 ± 0.53 14.31 ± 0.05 26.46 ± 0.19 42.00 ± 0.10 60.10 ± 0.03 73.91 ± 0.02 80.02 ± 0.08 154.58±0.41
E3 9.27 ± 0.64 16.55 ± 0.12 19.84 ± 0.08 45.64 ± 0.08 55.79 ± 0.28 69.87 ± 0.14 84.55 ± 0.16 153.16±1.11
A1 8.39 ± 0.34 10.15 ± 0.07 17.63 ± 0.13 30.83 ± 0.08 37.90 ± 0.12 43.31 ± 0.69 57.76 ± 0.15 156.96±3.57
A2 6.28 ± 0.17 8.89 ± 0.11 13.14 ± 0.62 21.13 ± 0.56 24.14 ± 0.43 30.71 ± 0.64 42.60 ± 1.05 -
A3 9.09 ± 0.15 12.06 ± 0.14 17.04 ± 0.52 24.00 ± 0.69 30.27 ± 0.15 39.93 ± 0.74 46.55 ±0.47 -
Gallic acid 14.26 ± 0.18 19.89 ± 0.08 28.32 ± 0.21 37.14 ± 0.09 57.69 ± 0.11 60.54 ± 0.15 68.69 ± 0.20 177.29±0.66
Determination of Superoxide Anion Scavenging Capacity
Samples Concentration of the solution Pvalue
0.15625 mg 0.3125 mg 0.625 mg 1.25 mg 2.5 mg 5 mg 10 mg IC50 (μg/mL final solution)
E1 12.58 ± 0,09 19.87 ± 0.25 29.97 ± 0.66 49.53 ± 0.47 60.90 ± 0.36 73.10 ± 0.75 83.37 ± 0.51 321.60±9.12 <0.001
E2 8.44 ± 0.19 16.52 ± 0.34 28.64 ± 0.17 42.66 ± 0.43 52.63 ± 0.48 64.46 ± 0.45 72.76 ± 0.74 520.79±16.90
E3 11.48 ± 0.06 18.64 ± 0.11 29.43 ± 0.42 43.71 ± 0.24 54.39 ± 0.24 67.43 ± 0.14 75.76 ± 0.62 470.08±7.32
A1 5.38 ± 0.29 8.02 ± 0.23 14.50 ± 0.39 26.24 ± 0.53 38.70 ± 1.50 56.19 ± 0.75 63.28 ± 0.89 977.47±39.37
A2 6.31 ± 0.09 7.86 ± 0.29 13.32 ± 0.32 18.37 ± 0.31 25.50 ± 0.41 35.46 ± 0.42 42.03 ± 0.79 -
A3 4.98 ± 0.47 7.58 ± 0.28 12.66 ± 0.44 19.54 ± 0.26 31.71 ± 0.19 44.68 ± 0.28 55.80 ± 0.27 1741.66±29.87
Gallic acid 10.43 ± 0.42 17.78 ± 0.11 32.24 ± 0.14 40.70 ± 0.43 52.36 ± 0.49 69.92 ± 0.73 80.13 ± 0.76 543.38±15.43
Determination of the lipoxygenase inhibition capacity
Samples Concentration of the solution Pvalue
0.15625 mg 0.3125 mg 0.625 mg 1.25 mg 2.5 mg 5 mg 10 mg IC50 (μg/mL final solution)
E1 9.58 ± 0.38 14.50 ± 0.18 20.31 ± 0.58 28.11 ± 0.38 38.08 ± 0.77 48.99 ± 0.68 71.47 ± 1.11 85.99±1.85 <0.001
E2 6.51 ± 0.16 9.28 ± 0.99 12.21 ± 0.52 16.59 ± 0.56 20.21 ± 1.03 32.54 ± 1.15 57.70 ± 0.46 134.77±2.49
E3 9.24 ± 0.46 12.34 ± 0.65 20.35 ± 0.57 25.81 ± 0.79 35.27 ± 1.16 43.50 ± 1.34 63.85 ± 1.61 104.10±5.05
A1 3.21 ± 0.14 6.49 ± 0.36 9.28 ± 0.11 14.01 ± 0.76 16.52 ± 1.12 27.90 ± 0.47 40.27 ±0.59 -
A2 4.28 ± 0.16 6.62 ± 0.27 7.90 ± 0.17 12.20 ± 0.42 17.04 ± 0.21 24.74 ± 0.34 31.71 ± 0.97 -
A3 3.37 ± 0.40 6.45 ± 0.46 9.56 ± 0.28 14.34 ± 0.30 19.95 ± 0.57 25.60 ± 0.75 37.58 ± 0.49 -
Gallic acid 15.02 ± 0.25 20.84 ± 0.19 30.29 ± 0.78 43.26 ± 0.69 57.59 ± 0.38 69.25 ± 0.54 83.06 ± 0.95 28.85±0.76
Table legend: IC50- Half maximal inhibitory concentration.
Disclaimer/Publisher’s Note: The statements, opinions and data contained in all publications are solely those of the individual author(s) and contributor(s) and not of MDPI and/or the editor(s). MDPI and/or the editor(s) disclaim responsibility for any injury to people or property resulting from any ideas, methods, instructions or products referred to in the content.
Copyright: This open access article is published under a Creative Commons CC BY 4.0 license, which permit the free download, distribution, and reuse, provided that the author and preprint are cited in any reuse.
Prerpints.org logo

Preprints.org is a free preprint server supported by MDPI in Basel, Switzerland.

Subscribe

© 2024 MDPI (Basel, Switzerland) unless otherwise stated