Submitted:
23 November 2023
Posted:
23 November 2023
You are already at the latest version
Abstract
Short-form video has taken over social media and attracted attention from advertisers. As brands shift their advertising spending to short-form video social platforms, doubts remain about the advertising efficacy on these platforms, especially given the skyrocketing advertising costs in recent years. In a large-scale randomized experiment on ByteDance in collaboration with an automobile brand, we show a significant effect of the advertising campaign on ByteDance, compared with effects reported in other studies. Exposed users are eight times more likely to convert from outside than from within ByteDance, which raises the importance of information sharing between the platform and brands. When considering conversions outside ByteDance, the average cost per conversion, which brands commonly use to evaluate the cost of campaigns, shrinks by 5 or 25 times, depending on the methods used to calculate it. Information sharing can also affect a brand’s targeting strategy. While commonly used demographic variables by the automobile brand are effective for target marketing with only platform data, they are not when considering conversions outside ByteDance. Instead, a behavioral variable proposed herein (prior brand home page visits) effectively moderates the advertising effect but has no effect when including only platform data in the analysis.
Keywords:
digital advertising
; ad platform
; ad spillover
; advertising effect
1. Introduction
Short-form videos have taken over social media in recent years, popularized by TikTok and quickly copied by Instagram Reels and YouTube Shorts. These videos, which are bite-sized, digestible, highly addictive, and often under 60 seconds long, easily catch the attention of time-strapped audiences. They are also readily sharable and easy to create, which makes them popular in social network. As of 2023, short-form video platforms such as YouTube Shorts had 1.5 billion monthly active users, and TikTok and Instagram Reels had more than 2 billion combined (Shore 2023).
Brands have quickly recognized the value of short-form videos. According to HubSpot (2023), 73% of consumers prefer to watch a short-form video to learn about a product or service. In addition, 58% of viewers indicate that they will watch an entire business video if it is less than 60 seconds long, because they view short-form videos as 2.5 times more engaging than long-form ones (Vidyard 2023). As a result, brands have shifted much of their advertising budget to short-form video platforms. In a survey among more than 1000 global marketers, 33% plan to invest most in short-form video platforms such as TikTok and Instagram Reels (HubSpot 2023).
However, some brands are skeptical about the effectiveness of short-form video platforms. For example, they experience lower conversion rates on these platforms than in other outlets, such as in our case. Thus, advertising’ effectiveness on digital ad platforms continues to be a concern (Aral 2021). In past years, firms such as General Motors and Procter & Gamble have pulled back ad spending on big digital platforms, citing minimal impact on consumers’ purchases (Terlep et al. 2012, Vranica 2018). Research studies also reveal relatively low advertising effects through randomized experiments. For example, Blake et al. (2015) found that Google search engine marketing had a small and nonsignificant effect on sales in a large-scale experiment. Johnson et al. (2017b) reported the median lift in conversion as 17% for site visits and 8% for conversions in 432 experiments on the Google Display Network. Gordon et al. (2023) found that the median lift in conversion was only 9% among 663 randomized controlled trials with a mix of display and video ads1 run on Facebook. Will the same problem happen on short-form video platforms? This question is particularly important for brands planning to double down on these social platforms. At the same time, short-form video platforms also want to know the answer to justify their skyrocketing advertising prices in recent years. For example, reports estimate that the cost per thousand (CPM) on TikTok increased by 92% from 2020 to 2021 (Rosenfeld 2022).
However, research on the advertising effect of short-form videos is scant; an exception is Yang et al. (2021), who assess influencer video advertising on TikTok. Although influencer video advertising is a fast-growing market, sponsor ads directly made by advertisers constitute the majority of short-form video advertising.2 In this study, we aim to examine the advertising effectiveness on a short-form video platform. Considering the difficulty in measuring digital advertising effects (Gordon et al. 2021), we follow recent studies (Gordon et al. 2019, 2023) and conduct a large-scale randomized field experiment on ByteDance in collaboration with an automobile brand. The brand has invested heavily in ByteDance and plans to shift all its digital advertising budget to ByteDance; at the same time, however, it is skeptical of the effectiveness of advertising on the platform. More than 84 million users were randomly assigned to control and treatment groups, and only those in the treatment groups were exposed to the short-form video ads. Conversion refers to whether users provided personal information (e.g., names, cellphone numbers) to the brand. The experiment lasted for seven weeks and took another one and half months for completion of conversions. To address its question (i.e., the effect if the brand advertises only on ByteDance), the automobile brand ceased all digital advertising campaigns other than that during the experiment and conversion periods. We matched the ByteDance users in the experiment and the brand’s converted customers using their cellphone numbers. This enabled us to identify the conversions within and outside ByteDance for users in the experiments.
The results show a significant effect of the short-form video advertising campaign on ByteDance. The advertising effect measured by ATT (average treatment effect on the treated) is 0.082‰, and the ATT lift on conversion is 1.1226, which is much higher than the advertising effects reported in various experiments with mostly display ads (Johnson et al. 2017b; Gordon et al. 2023). Of note, most of the advertising effect comes from conversions outside ByteDance. In the experiment, the exposed users are more than eight times likely to convert from outside than within ByteDance. Considering the conversion outside ByteDance, the advertising effect measured by ATT is four times that calculated using only platform data (conversions within ByteDance). As social platforms and brands typically do not share their customer information, this finding calls for caution by brands when calculating the advertising costs. In our context, brands often use cost per conversion (CPC) for the economic evaluation of advertising campaigns. Using brands’ commonly adopted method to calculate CPC, we show that it shrinks by 25 times when considering conversion outside ByteDance. When calculating CPC with the ATT, a conceptually correct method, CPC reduces to one-fifth when including the outside conversion.
Surprisingly, we find that sharing information between the platform and brand also has a profound implication for the target marketing strategy. In China, automobile brands often rely on several key demographic variables for targeting to reach a wide range of customers. Our results show that these variables are effective when using only platform data for analysis. However, when including conversions outside ByteDance, those variables are no longer effective. This finding implies a misinformed targeting strategy if the platform and brand do not share customer information. To assist the brand, we propose the use of behavioral variables for targeting and demonstrate that with users’ prior brand home page visits on Douyin (the Chinese version of TikTok). We show that this variable moderates the advertising effect when complete conversion information is used and thus can be used for targeting. Of note, when we include only platform data for analysis, this variable becomes ineffective for targeting.
These findings are managerially important, as they not only mitigate brands’ concerns about the advertising effect on short-form video platforms but also help these platforms better communicate with their clients. Furthermore, they stress the importance of information sharing between the platform and brands. Without that, neither the platform nor the brands can correctly evaluate the advertising effect or design a proper targeting strategy. The commonly used “conversion pixel” (Johnson et al. 2017b, Gordon et al. 2023), which is a piece of code ad platforms provide for brands to insert in specific web pages to record users’ page views, is of limited use when conversions happen in channels out of a brand’s control, because the brand cannot force those channels to insert the conversion pixel on their own web pages.
2. Institutional Details
2.1. Advertising on ByteDance
ByteDance is a global leading internet company headquartered in China. It has two prominent applications in China, Douyin and Toutiao. Douyin is the Chinese counterpart of TikTok, and Toutiao is a news aggregator similar to Google News. In a typical advertising campaign on ByteDance, ads often appear on both Douyin and Toutiao.
On ByteDance, ads can be either display (i.e., images) or short-form videos. In recent practice, the majority of ads on ByteDance are short-form videos. Thus, the ads used in our experiment refer only to short-form video ads. On ByteDance, ads appear either in newsfeeds or on open screens. Newsfeed ads are included in streams of short videos or text newsfeeds, while open-screen ads appear at the launch of the app. The newsfeed ads are typically 10 to 30 seconds long, while the open-screen ads are typically 3 or 5 seconds long. The price of ads can be either fixed or determined by auction. A fixed price is an agreement-based contract in which the advertiser and the platform negotiate on several critical elements before the campaign, such as the campaign period, total exposure, and price. Auction entails a real-time bidding process, which is commonly used on most internet platforms. During the period of our experiment, ByteDance used a fixed price for open-screen ads and either a fixed price or auction for newsfeed ads.
Figure 1a is an example of an open-screen video ad on Douyin for an automobile advertiser.3 The left panel is a screen shot of the short-form video played when users launch the Douyin app. Users can skip the ad by clicking on the upper-right-hand button or simply let the video finish, after which they will enter the app’s main page. If users swipe up the ad for more details, they will be directed to the middle panel, from which an additional swipe-up will lead them to the landing page, shown in the right panel. On the landing page, users can book an appointment with a dealer by filling out the form with their names and cellphone numbers for sales agents to contact them afterward.4
Douyin serves users with a stream of short-form videos according to its recommendation algorithm, and some slots are reserved for advertisements. Figure 1b illustrates an example of a newsfeed video ad on Douyin for an automobile advertiser. The left panel is a screen shot of the short-form video commercial. Users can either swipe up to skip the ad and watch the next video or click on the associated button for more details, which will then direct them to the middle panel. For another swipe-up, they will go to the landing page, as shown in the right panel, where they can book an appointment by filling out the form. Similarly, Figure 1c illustrates video ads placed in the newsfeed on Toutiao for an automobile advertiser.
2.2. Ad Delivery Process on ByteDance
Advertisers first select their targeting criteria so that ads will only be sent to the relevant users. In the automobile industry in China, rather than using targeting strategies with many fine-grained variables, advertisers typically focus on a few demographic variables to ensure a broad reach to users on the platform. The commonly used targeting variables include gender, tier of city, and age. Ads will then be delivered to users satisfying the criteria set by the advertiser.
The ad delivery process for open-screen ads differs from that for newsfeed ads. The actual process is complicated, involving technical details such as optimization of data transfer, mobile cache usage, and waiting time that are proprietary to the company. Thus, what we describe herein is somewhat conceptually equivalent to the actual engineering process.
The delivery of open-screen ads follows four stages: preload, trigger, selection, and display. In the preload stage, a batch of ads are selected and preloaded to users’ cache to minimize the waiting time. The selection of ads is mainly determined by user and ad features, as well as contract specifics, such as price. When a user launches the app, an advertising slot—the open screen—is triggered. Then, the platform selects an ad from the batch of preloaded ads. In most cases, the selection is random with equal probabilities. Finally, in the display stage, the selected ad from the previous stage is retrieved from the cache and displayed to the user.
By contrast, the sequence of actions in the delivery process of newsfeed ads is trigger, selection, preload, and display. Whenever a user swipes for more content, it triggers an advertising slot. The platform will load certain types of content (e.g., videos on Douyin, news on Toutiao); one slot is typically reserved for an advertisement, and the others are called “natural content.” In the selection stage, a winning ad will be chosen from the pool of fixed-price ads randomly with equal probability. At the same time, another winning ad will be determined by auction for ads offering bids. The final winning ad will be decided between these two ads primarily depending on their prices. Afterward, the algorithm will rank the content (one ad + several natural content) to optimize user experience and preload the content to the user’s cache. Finally, the ad will be displayed when the user browses to its position. However, if the user leaves the app before reaching the ad slot, the ad will not be displayed, and the cache will be cleared.
3. Experimental Design
In line with Gordon et al. (2023), the ad exposure on ByteDance is endogenously determined by selections induced by user activity, targeting, and competition. Therefore, we conduct a large-scale randomized experiment to estimate the effects of a short-form video advertising campaign on ByteDance. As mentioned previously, the experiment is in collaboration with ByteDance and a leading automobile brand.5 In the Chinese market, the automobile industry contributed more than 10% of advertising expenditure in 2022.6 Given the limited number of firms, automobile brands are generally key accounts for advertising platforms. The brand has invested heavily on ByteDance and was considering shifting all its digital advertising budget to ByteDance. However, the brand was also concerned about the effectiveness of advertising on ByteDance because it observed a lower conversion rate on ByteDance than in other advertising channels, such as vertical automobile websites. This is especially concerning given the much higher advertising price on ByteDance than in the other channels.
The experiment was managed by “Ocean Engine,” the digital marketing service division of ByteDance. In the experiment, the brand was promoting a new sedan on ByteDance. The campaign was run on both Douyin and Toutiao and used only short-form video ads.
In our context, a user refers to a real person. While some users may have multiple accounts, ByteDance is able to identify these users through proprietary methods. Notably, the brand’s main objective in the experiment was to identify the advertising effect if it concentrated all its digital advertising budget on ByteDance. Thus, the brand ceased all digital advertising campaigns other than that used in the experiment, according to the following schedule:
- Stage 1 (August 13, 2020–September 30, 2020): experiment on ByteDance, no digital advertising campaign outside ByteDance.
- Stage 2 (October 1, 2020–October 14, 2020): no digital advertising campaign within or outside ByteDance.
We randomized the focal advertiser’s targeted users into either the treatment or control group. After that, Ocean Engine executed the ad delivery process to deliver the focal ads to these targeted users. In each group, the focal ads may not have been preloaded to the cache for some users. For example, this happened in newsfeed ads when the focal ads were not chosen in the selection stage. However, after the focal ads were chosen to be preloaded, the algorithm intervened at this stage according to the experimental design. For users in the control group, the focal ads were blocked in the preloading stage. Specifically, for open-screen ads, when the focal ad was selected to be preloaded to users’ cache, the system simply blocked it from the batch of the selected ads. For newsfeed ads, if the focal ad won in the selection stage, the system reran the selection stage without the focal ad to find a new winner. By contrast, for users in the treatment group, ad preloading was not interrupted. As the system keeps the complete log of outcomes for the preload stage, for all the targeted users, we know whether they were preloaded with the focal ads in the treatment condition or supposed to be preloaded with the focal ads in the control condition.
In terms of exposure, users in the control group were not exposed to the focal ads by design. However, users in the treatment group may or may not have been exposed, owing to the compliance problem. For example, for open-screen ads, the eventual display of the focal ads depends on the usage frequency of the apps (i.e., frequent usage leads to a greater chance of exposure); for newsfeed ads, if users do not browse to the focal ad’s position, the ad will not be displayed. As compliance is endogenous, a direct comparison between the exposed users in the treatment group and the entire control group would yield biased estimates for the advertising effects.
Finally, the conversion in our experiment is acquiring customer leads, which entails users filling out the form with their personal information (e.g., names, cellphone numbers). In China, automobile brands often treat acquiring customer leads as conversion in the advertising campaign. That is, for them, the main purpose of advertising is to drive customers to the dealer. After customers are in the store, the eventual purchase is determined by the product quality, sales effort, and customer service, rather than the early advertising. Therefore, automobile brands use customer leads as the key metric to evaluate the advertising campaign, rather than final sales.
Conversion could happen either on ByteDance, when users click on the link in the focal ads and fill out the form, or in other digital channels, when users search for the car information later. In reality, the majority of conversions outside ByteDance happen in the automobile-specialized apps in the China market; the major ones are Autohome, DongCheDi, and Yiche. These apps provide various automobile-related content and extensive automobile-listing information to consumers and therefore are the first stop for consumers who are interested in cars or want to purchase one. Take Autohome as an example. When consumers search for car information and land on the page of a specific car model, as illustrated in Figure 2, they can click on the associated button to contact a sales representative. Because Autohome users need to register with their cellphone numbers to enable such a live-chat function, the brand acquires their cellphone numbers upon initiation of a live-chat session. In that case, a conversion occurs. Alternatively, a conversion event can occur when users consult the floor price for this model by providing their names and cellphone numbers. The process is similar in other automobile-specialized apps.
4. Analysis of the Experiment
We first develop the causal framework of the advertising effect for our experiment. The estimation method mainly follows that of Imbens and Augrist (1994) and Gordon et al. (2019).
4.1. Definitions and Assumptions
We denote Zi {0, 1} as the treatment status of user i, where 0 is the control and 1 is the treatment, and denote PLi(Zi) {0, 1} as the preload status of user i, which depends on the treatment status. In our experimental procedure, we have PLi(1) {0, 1}; that is, if user i is assigned to the treatment group, the focal ad may or may not preload to his or her cache; however, PLi(0) = 0, because if user i is assigned to the control group, the focal ad will never be preloaded to his or her cache. We also denote Wi(Zi, PLi) {0, 1} as an indicator of whether the focal ad was eventually displayed to user i. Moreover, Wi(0, PLi(0)) = Wi(0, 0) = 0 for all i; that is, users in the control group are not exposed to the focal ad because the ad is not preloaded to their cache. In addition, when PLi(1) = 0, we have Wi(1, PLi(1)) = Wi(1, 0) = 0; that is, users in the treatment group who are not preloaded are not exposed to the focal ad. However, when PLi(1) = 1, Wi(1, PLi(1)) = Wi(1, 1) {0, 1}; that is, users in the treatment group who are preloaded are either exposed to the ad or not. Finally, we denote Yi(Zi, PLi, Wi) {0, 1} as the potential conversion outcome, where 1 is conversion and 0 otherwise. For example, Yi(1, 1, 1) = 1 indicates that if a user i is assigned to the treatment group, preloaded and exposed to the focal ad, he or she could convert during the conversion period.
We make three standard assumptions for valid inference. First, stable unit treatment value assumption means that a user can receive only one version of the treatment, and this does not interfere with another user’s outcomes. Second, random assignment means that the assignment of the treatment is random across users, or independent of all potential outcomes, preload status, and exposure conditions; that is, , , . Third, exclusion restriction means that the assignment affects the outcome only through the ad exposure; that is, .
In our experiment, ByteDance’s ability to identify each user ensures a single treatment to each user in the experiment. As the experiment was unknown to the users, it is unlikely that they exchanged information on this subject. If the exposed users in the treatment group indeed shared ads to the users in the control group, the test of the advertising effect would be a conservative one (Gordon et al. 2019). The randomization of the treatment is untestable because we do not observe all potential outcomes, preloading status, and exposure conditions. We performed randomization checks and found no evidence against proper randomization. Finally, the exclusion restriction indicates that what truly matters to the user’s conversion is ad exposure, not the assignment into the treatment or control group.
4.2. Advertising Effect
Following the literature on digital advertising (Johnson et al. 2017a, Gordon et al. 2019), we define the advertising effect as the average treatment effect on the treated (ATT),
where W(1, PL(1)) = 1 means that the ATT is conditional on users who end up exposed to the focal ad had they been assigned to the treatment group. According to our previous discussion, Equation (1) is equivalent to
This is because the necessary condition for W(1, PL(1)) = 1 is PL(1) = 1; that is, the focal ad must first be preloaded to the user’s cache to be displayed. Following Imbens and Rubin (2015), we can reexpress the ATT in Equation (2) in the following way. We first define the intent to treat conditional on preload (ITTPL) as
Then, we have
where is the compliance ratio, or the probability that users end up exposed to the focal ad had they been assigned to the treatment group and preloaded with the focal ad. The first equality of Equation (4) holds by definition. The third holds because of the exclusion restriction assumption; that is, Y(1, PL(1), 0) = Y(0, PL(0), 0). In summary, we have
Finally, we define the ATT lift, , as
The ATT lift measures the advertising effect (i.e., ) as a proportion to the baseline, which is the conversion without ad exposure.
Regarding the advertising effect, several points are worth further explanation. First, the reason to focus on users to whom the brand’s ad would be preloaded and exposed had the brand ran the campaign on the platform is as follows: for most campaigns on the platform (including the one run in our study), the advertiser pays only for ad exposures. Therefore, companies naturally adopted the ATT, which involves the ad effect (the “treatment effect”) on a group of users (the “treated”), as the criterion for their business assessment.
Second, in line with Johnson et al. (2017a), the definition of ATT delivers the correct strategic baseline because the potential outcome, Y0, represents users’ behavior if the focal advertiser does not run the campaign. Specifically, Y0 involves the behavior conditional on what other ads the users would have seen had the focal advertiser not run the campaign (e.g., users could see ads from its competitor, which may lower their conversion with the focal advertiser). This is exactly the strategic baseline against which the advertiser wanted to measure its advertising effect.
Finally, rather than measuring the effect of a particular ad creative, the ATT measures the effect of the whole advertising campaign, which is a collection of ad creatives. The main reason is that measuring the overall effect of the advertising campaign is of primary importance in the industry, including our industry partner. While measuring the effect of a single ad creative is important to optimize an advertising campaign, this issue is beyond the scope of our study.
4.3. Estimation and Inference
The estimation of ATT is based on Equation (5). We denote as the observed preload status, as the observed ad exposure, and as the observed conversion outcome, for user i. We have
where
The first item in Equation (8) can be estimated using users in the treatment condition who end up being preloaded with the focal ad. For the second item, because we do not observe users in both the treatment and control conditions, we estimate this item with users in the control condition who would be preloaded with the focal ad had they been assigned to the treatment group. Suppose there are N1 treatment users who were preloaded with the ad and N0 control users who were supposed to be preloaded with the ad but were not because of experimental intervention. Then, we can estimate Equation (8) as
We also have
Because users are randomized into treatment or control groups, is a consistent estimate of , and is a consistent estimate of . Therefore, in Equation (9) is a consistent estimate of the ITTPL defined in Equation (3). Similarly, in Equation (10) is a consistent estimate of . Therefore, the estimate of ATT, defined in Equation (7), is a consistent estimate of the advertising effect (i.e., the ATT) defined in Equation (2). Imbens and Angrist (1994) refer to the ATT as the local average treatment effect (LATE) and demonstrate that its estimate, as defined in Equation (7), is equivalent to the instrumental variable (IV) regression in which the independent variable is ad exposure or not and the IV is the treatment assignment. Similarly, the estimate for the ATT lift, , is
where
For inference, we use the bootstrap method to calculate the confidence intervals for and . Specifically, in bootstrap sample b, we randomly draw a sample of N= N1 + N0 users from the original sample with replacement. We estimate the ATT and ATT lift using this bootstrap sample, denoted as and , respectively. We repeat this procedure B times to have a series of bootstrapped estimates of ATT and ATT lift, that is, . We calculate the confidence intervals on the basis of this bootstrap sample.
5. Data
5.1. Estimation Sample
As discussed in Section 4.3, the estimation of the advertising effect in our context requires a sample of users who were in the treatment group and ended up being preloaded with the focal ad and also users who were in the control group and supposed to be preloaded with the focal ad but were not. The company provided us with this sample in accordance with our request. Hereinafter, the treatment and control groups refer only to those in our analysis sample.
The experiment covered more than 84 million users who were preloaded (in the treatment condition) or supposed to be preloaded (in the control condition) with the focal ads. The exposures were 44% on Douyin and 56% on Toutiao. For an exposed user, the average number of exposures was 2.2. Following the brand’s common practice, we counted conversions as those that occurred at the start of the campaign to one and half months after the campaign ended. Hereinafter, we refer to this period as the conversion period.
In addition to the experiment data, the brand provided the complete list of conversions during the conversion period. For each conversion, also included in the data were consumers’ cellphone numbers (encrypted to protect privacy) and the channel (within or outside ByteDance) on which the conversion happened. The brand’s data were matched with the experiment data using the encrypted cellphone numbers, which generated complete information about users’ conversion behavior within and outside ByteDance. According to ByteDance, most of the conversions outside ByteDance happened in automobile-specialized apps, though the data do not provide specifics for this information. While all the online conversions were well tracked, the information cannot be acquired by the brand if a user directly visits a dealer. However, such incidence is rare according to the brand.
The final data contain each user’s treatment status (treatment vs. control), exposure condition (exposed to the focal ad or not), and conversion outcome. If a user converts, the data records whether the conversion happened on ByteDance or other places. ByteDance also provided key user demographics the brand used as its targeting criteria, including gender, city tiers (tiers 1 and 2 vs. tiers 3–5),7 and age (≥31 years vs. <31 years). In practice, these three demographics are also the most common variables ByteDance communicates to other automobile brands for targeting.
5.2. Summary Statistics
First, we checked the equivalence between the treatment and control groups in terms of demographic composition.8 Following Huang et al. (2020), we conducted two one-sided t-tests to investigate whether the difference between the two groups is sufficiently small. The tests, reported in Table 1, show that the null hypotheses are rejected, and thus we conclude that the mean values of the demographics between the two groups are no greater than a small threshold.
Second, as shown in Table 2, we have roughly 42 million users each in the treatment and control groups. Among converted users, 75% converted just once, 22% converted twice, and the rest (3%) converted three times or more. For users with multiple conversions, 98.2% converted only in one channel (within or outside ByteDance), and only 1.8% converted from both within and outside ByteDance. In the table, “conversion within ByteDance” indicates whether a user ever converted from within ByteDance; if a user did this more than once, we treat the conversion as just one when calculating this number. The same principle applies to “conversion outside ByteDance.” “Overall conversion” indicates whether a user ever converted in the experiment. Therefore, we treat multiple conversions as just one conversion when calculating this number. This process explains why the sum of conversions within and outside ByteDance sometimes exceeds the overall conversion.
For the control group, the conversion rate within ByteDance is zero due to no exposure. However, 0.0281‰ of users in this group converted from outside ByteDance. In the treatment group, only 8.2% of users were exposed to the focal ads. The overall conversion rate of the exposed treatment users is roughly seven times that of unexposed treatment users. Notably, for the exposed treatment users, the conversion rate outside ByteDance is more than eight times that within ByteDance. Prior research has found similar spillover patterns; for example, the majority of the sales increase driven by online advertising happens in offline channels (Chan et al. 2011, Lewis and Reiley 2014).
6. Estimation
6.1. Advertising Effect and Economic Evaluation of Advertising Campaign
Table 3 shows the main estimation results. The ATT and lift for overall conversion are 0.0820‰ and 1.1226, respectively, and both are significant. This advertising effect is much higher than the reported experiments on Google and Facebook. For example, Gordon et al. (2023) examined 663 randomized controlled trials with a mix of display and video ads run on Facebook in the United States in 2020. They found that the median lift on conversion in these experiments is only 9%. In addition, Johnson et al. (2017b) report a similar median lift in conversion (17% for site visits and 8% for conversions) in 432 experiments with display ads on Google Display Network.
This advertising effect is mainly driven by the conversions outside ByteDance. If we include only the conversions inside ByteDance, as brands commonly do, the ATT is 0.0171‰, which is statistically significant at the 5% level. As for conversion within ByteDance (i.e., no conversion within ByteDance in the control condition), the associated ATT lift is ill-defined. However, simply for conversions outside ByteDance, the associated ATT is 0.0684‰ with a lift of 0.9362; both are significant at the 5% level.
These findings raise a serious question for brands conducting economic evaluations of short-form advertising on ByteDance. As mentioned previously, brands often complain about ByteDance’s high price but low efficacy. In the Chinese advertising market, brands commonly use the CPC to economically evaluate their advertising campaigns. In current practice, for a campaign to run on an ad platform such as ByteDance, the brand calculates the CPC using only conversions within the platform, which we call a “naive partial CPC” and define as
where AdExpense is the total campaign expense, N is the number of users in the campaign, and rPlatform is the conversion rate on the ad platform. If, however, the brand includes conversions outside the ad platform, the “naive complete CPC” is
where r is the overall conversion rate. Thus, if we use the overall conversion rate and the conversion rate within ByteDance in Table 2, the ratio of CPCnaivecomplete to CPCnaivepartial is 0.0402; that is, incorporating the conversions outside ByteDance reduces the average CPC nearly 25 times. This reduction significantly lowers the quality-adjusted advertising price and increases the brand’s economic evaluation of the advertising campaign.
However, this commonly adopted method is conceptually problematic, as the correct economic evaluation of the advertising campaign should be based on the treatment effect, such as ATT, which we label as CPCATTcomplete and define as
where , as defined previously, is the exposure ratio and is the overall ATT. However, if the brand ignores the conversion outside the platform, it may calculate the CPC only on the basis of the ATT on the platform:
where is the ATT on the ad platform. Using the ATTs reported in Table 2 and Table 3, we find that the ratio of to is 0.2085, indicating that inclusion of the conversions outside ByteDance shrinks the CPC to one-fifth.
6.2. Targeting Strategy in Advertising Campaign
On ByteDance, advertising campaigns for automobile brands are often large in scale, in an effort to reach a wide range of consumers. Therefore, instead of selecting many user features for targeting, which may result in coverage of only some niche groups, brands often rely on several key features in ByteDance’s advertising system. As noted previously, gender, city tiers, and age are the most common targeting features ByteDance provides to automobile clients.
6.2.1. Heterogeneous Treatment Effects
We first analyze the advertising effect across these three variables. We present the estimation results of ATT and ATT lift for the segments by each demographic variable in Table 4. The advertising effects on conversion are all significantly positive for each segment. The conversion rate outside ByteDance is often several times that within ByteDance, which suggests that the overall effects are driven mainly by the conversions outside ByteDance.
We further examine whether the treatment effects differ between segments within each demographic variable. For example, is advertising more effective for men or women? In line with Imbens and Rubin (2015), our estimator of ATT is equivalent to a two-stage least squares (2SLS) regression with conversion as the dependent variable, exposure as the independent variable, and the treatment assignment as the IV. Thus, we run the following 2SLS regression:
where i refers to the user, refers to the conversion during the conversion period, denotes the observed ad exposure, is a dummy variable for gender (male: 1; female: 0), is a dummy variable for the type of city (tiers 1 and 2: 1; otherwise: 0), and is a dummy variable for age (older than 30 years: 1; otherwise: 0). The IVs include Zi, Zi·Malei, Zi·Tier1or2Cityi, and Zi·AgeAbove30i, where Zi refers to the treatment status.
We report the results in Table 5. Overall, ad exposure has no significant effect between segments within each demographic variable, which suggests that the typically used demographic variables are ineffective for targeting. However, if we include only the conversion within ByteDance in the analysis, male and younger users appear more affected by the advertising, which could incorrectly lead the brand to allocate more budget to these segments. This finding again shows the importance of exchanging information between platforms and brands, which aids not only the economic evaluation of the advertising campaign but also the targeting strategy.
6.2.2. Behavioral Targeting
While we did not find any heterogeneous ad effects for the three most commonly used demographic variables, behavioral differences may moderate these effects. Thus, we requested additional information from ByteDance on users’ prior visits to the brand’s home page on Douyin. The automobile brand considers home page visits an important measure of brand engagement. Such visits suggest that users are more familiar with and interested in the brand. We thus examine whether this behavior moderates the advertising effects on conversion.
For all users in the experiment, we collected information on whether they had visited the brand’s home page on Douyin within one month before the experiment.9 For each user, we ran the following IV regression:
where i refers to the user, refers to conversion, denotes the observed ad exposure, and is a dummy variable indicating whether the user visited the brand’s home page within a month before the experiment (visit: 1; no visit: 0). The IVs include Zi and Zi·PriorVisiti, where Zi refers to the treatment status.
We report the results in Table 6. As before, ad exposure increases users’ likelihood of conversion. While prior visits to the brand’s home page do not make a significant difference in terms of conversion likelihood, the advertising effect is greater for those with prior visits. When we include only conversions within ByteDance, we find no difference in the advertising effect between users with and without prior visits. Thus, a decision based on the conversion information within ByteDance will incorrectly lead the brand not to rely on the behavior information of prior home page visits.
A question is whether the effect of prior visits is robust after we include the demographic information. To address this, we run the following IV regression including demographic variables:
where all the variables are defined the same as previously and the IVs include Zi, Zi·Malei, Zi·Tier1or2Cityi, Zi·AgeAbove30i, and Zi·PriorVisiti. We report the results in Table 7, which shows that all the previous findings are robust. The advertising effects are homogeneous across the demographic variables but are moderated by prior visits to the brand’s home page.
7. Discussion
We examine the effect of an advertising campaign on a short-form video social media platform. In a large-scale randomized experiment on ByteDance, we show a significant effect of the advertising campaign, compared with effects reported in prior research. Advertising spillover plays a pivot role in the advertising campaign. The number of exposed users converted from outside the ad platform is more than eight times that from within the ad platform. This raises the importance of information sharing between the platform and brands. In our case, ignoring the conversion outside ByteDance will significantly underestimate the advertising effect and lead to an unfavorable economic evaluation of the advertising campaign. In addition, ignoring advertising spillover can mislead a brand’s targeting strategy. We show that the demographic variables commonly used for targeting do not work when considering advertising spillover. Instead, behavioral variables such as prior brand home page visits may be more effective for targeting. However, if relying only on the conversion within the ad platform, the data will incorrectly suggest that this behavioral variable does not work. These findings are practically important; they not only help mitigate brands’ concerns to a certain extent and assist the ad platform in better communicating with the brand but also provide new insights into targeting strategies when brands carry out marketing campaigns on ad platforms.
References
- Aral S (2021) What digital advertising gets wrong. Harvard Business Rev. (February 19). https://hbr.org/2021/02/what-digital-advertising-gets-wrong.
- Blake T, Nosko C, Tadelis S (2015) Consumer heterogeneity and paid search effectiveness: A large-scale field experiment. Econometrica 83(1):155-174.
- Chan T, Wu C, Xie Y (2011) Measuring the lifetime value of customers acquired from google search advertising. Marketing Sci. 30(5):837–850.
- Gordon BR, Jerath K, Katona Z, Narayanan S, Shin J, Wilbur KC (2021) Inefficiencies in digital advertising markets. J. Marketing 85(1):7-25.
- Gordon BR, Moakler R, Zettelmeyer F (2023) Close enough? A large-scale exploration of non-experimental approaches to advertising measurement. Marketing Sci. 42(4):768-793.
- Gordon BR, Zettelmeyer F, Bhargava N, Chapsky D (2019) A comparison of approaches to advertising measurement: Evidence from big field experiments at Facebook. Marketing Sci. 38(2):193–226.
- Gutelle S (2022) TikTok’s share of the U.S. influencer marketing industry is surpassing Facebook’s. Tubefilter (August 2).
- https://www.tubefilter.com/2022/08/02/insider-intelligence-influencer-marketing-instagram-tiktok/.
- Huang S., S. Aral, Y.J. Hu, E. Brynjolfsson (2020) Social advertising effectiveness across products: A large-scale field experiment. Marketing Sci. 39(6):1142-1165.
- HubSpot (2023) Global social media trends report. https://offers.hubspot.com/social-media-trends-report.
- Imbens G, Angrist J (1994) Identification and estimation of local average treatment effects. Econometrica 62(2):467–475.
- Imbens G, Rubin D. (2015) Causal Inference for Statistics, Social, and Biomedical Sciences (Cambridge University Press, New York).
- Johnson G, Lewis R, Nubbemeyer E (2017a) Ghost ads: Improving the economics of measuring online ad effectiveness. J. Marketing Res. 54(6):867-884.
- Johnson G, Lewis R, and Nubbemeyer E (2017b) The online display ad effectiveness funnel & carryover: Lessons from 432 field experiments. Working paper, Questrom School of Business.
- Lewis R, Reiley D (2014) Online ads and offline sales: Measuring the effects of retail advertising via a controlled experiment on Yahoo! Quantitative Marketing and Econ. 12:235–266.
- Rosenfeld B (2022) How marketers are fighting rising ad costs. Forbes (November 14). https://www.forbes.com/sites/forbescommunicationscouncil/2022/11/14/how-marketers-are-fighting-rising-ad-costs/?sh=5933c0622829.
- Shore V (2023) Evolution of short form video marketing. Storyblocks (July 24). https://blog.storyblocks.com/marketing/evolution-of-short-form-video-marketing/.
- Terlep S, Vranica S, Raice S (2012) GM says Facebook ads don’t pay off. The Wall Street Journal (May 16). https://www.wsj.com/articles/SB10001424052702304192704577406394017764460.
- Vidyard (2023) Video in business benchmark report. https://www.vidyard.com/business-video-benchmarks/.
- Vranica, S (2018) P&G Contends too much digital ad spending is a waste. The Wall Street Journal (March 1). https://www.wsj.com/articles/p-g-slashed-digital-ad-spending-by-another-100-million-1519915621.
- Winter D (2023) TikTok Ad Revenue: How Much Are Brands Spending on TikTok? Shopify (July 14). https://www.shopify.com/blog/tiktok-ad-spending.
- Yang, J, Zhang J, and Zhang Y (2021) First law of motion: Influencer video advertising on TikTok. Working paper, Harvard University.
Figure 1.
Example of Ads on ByteDance.
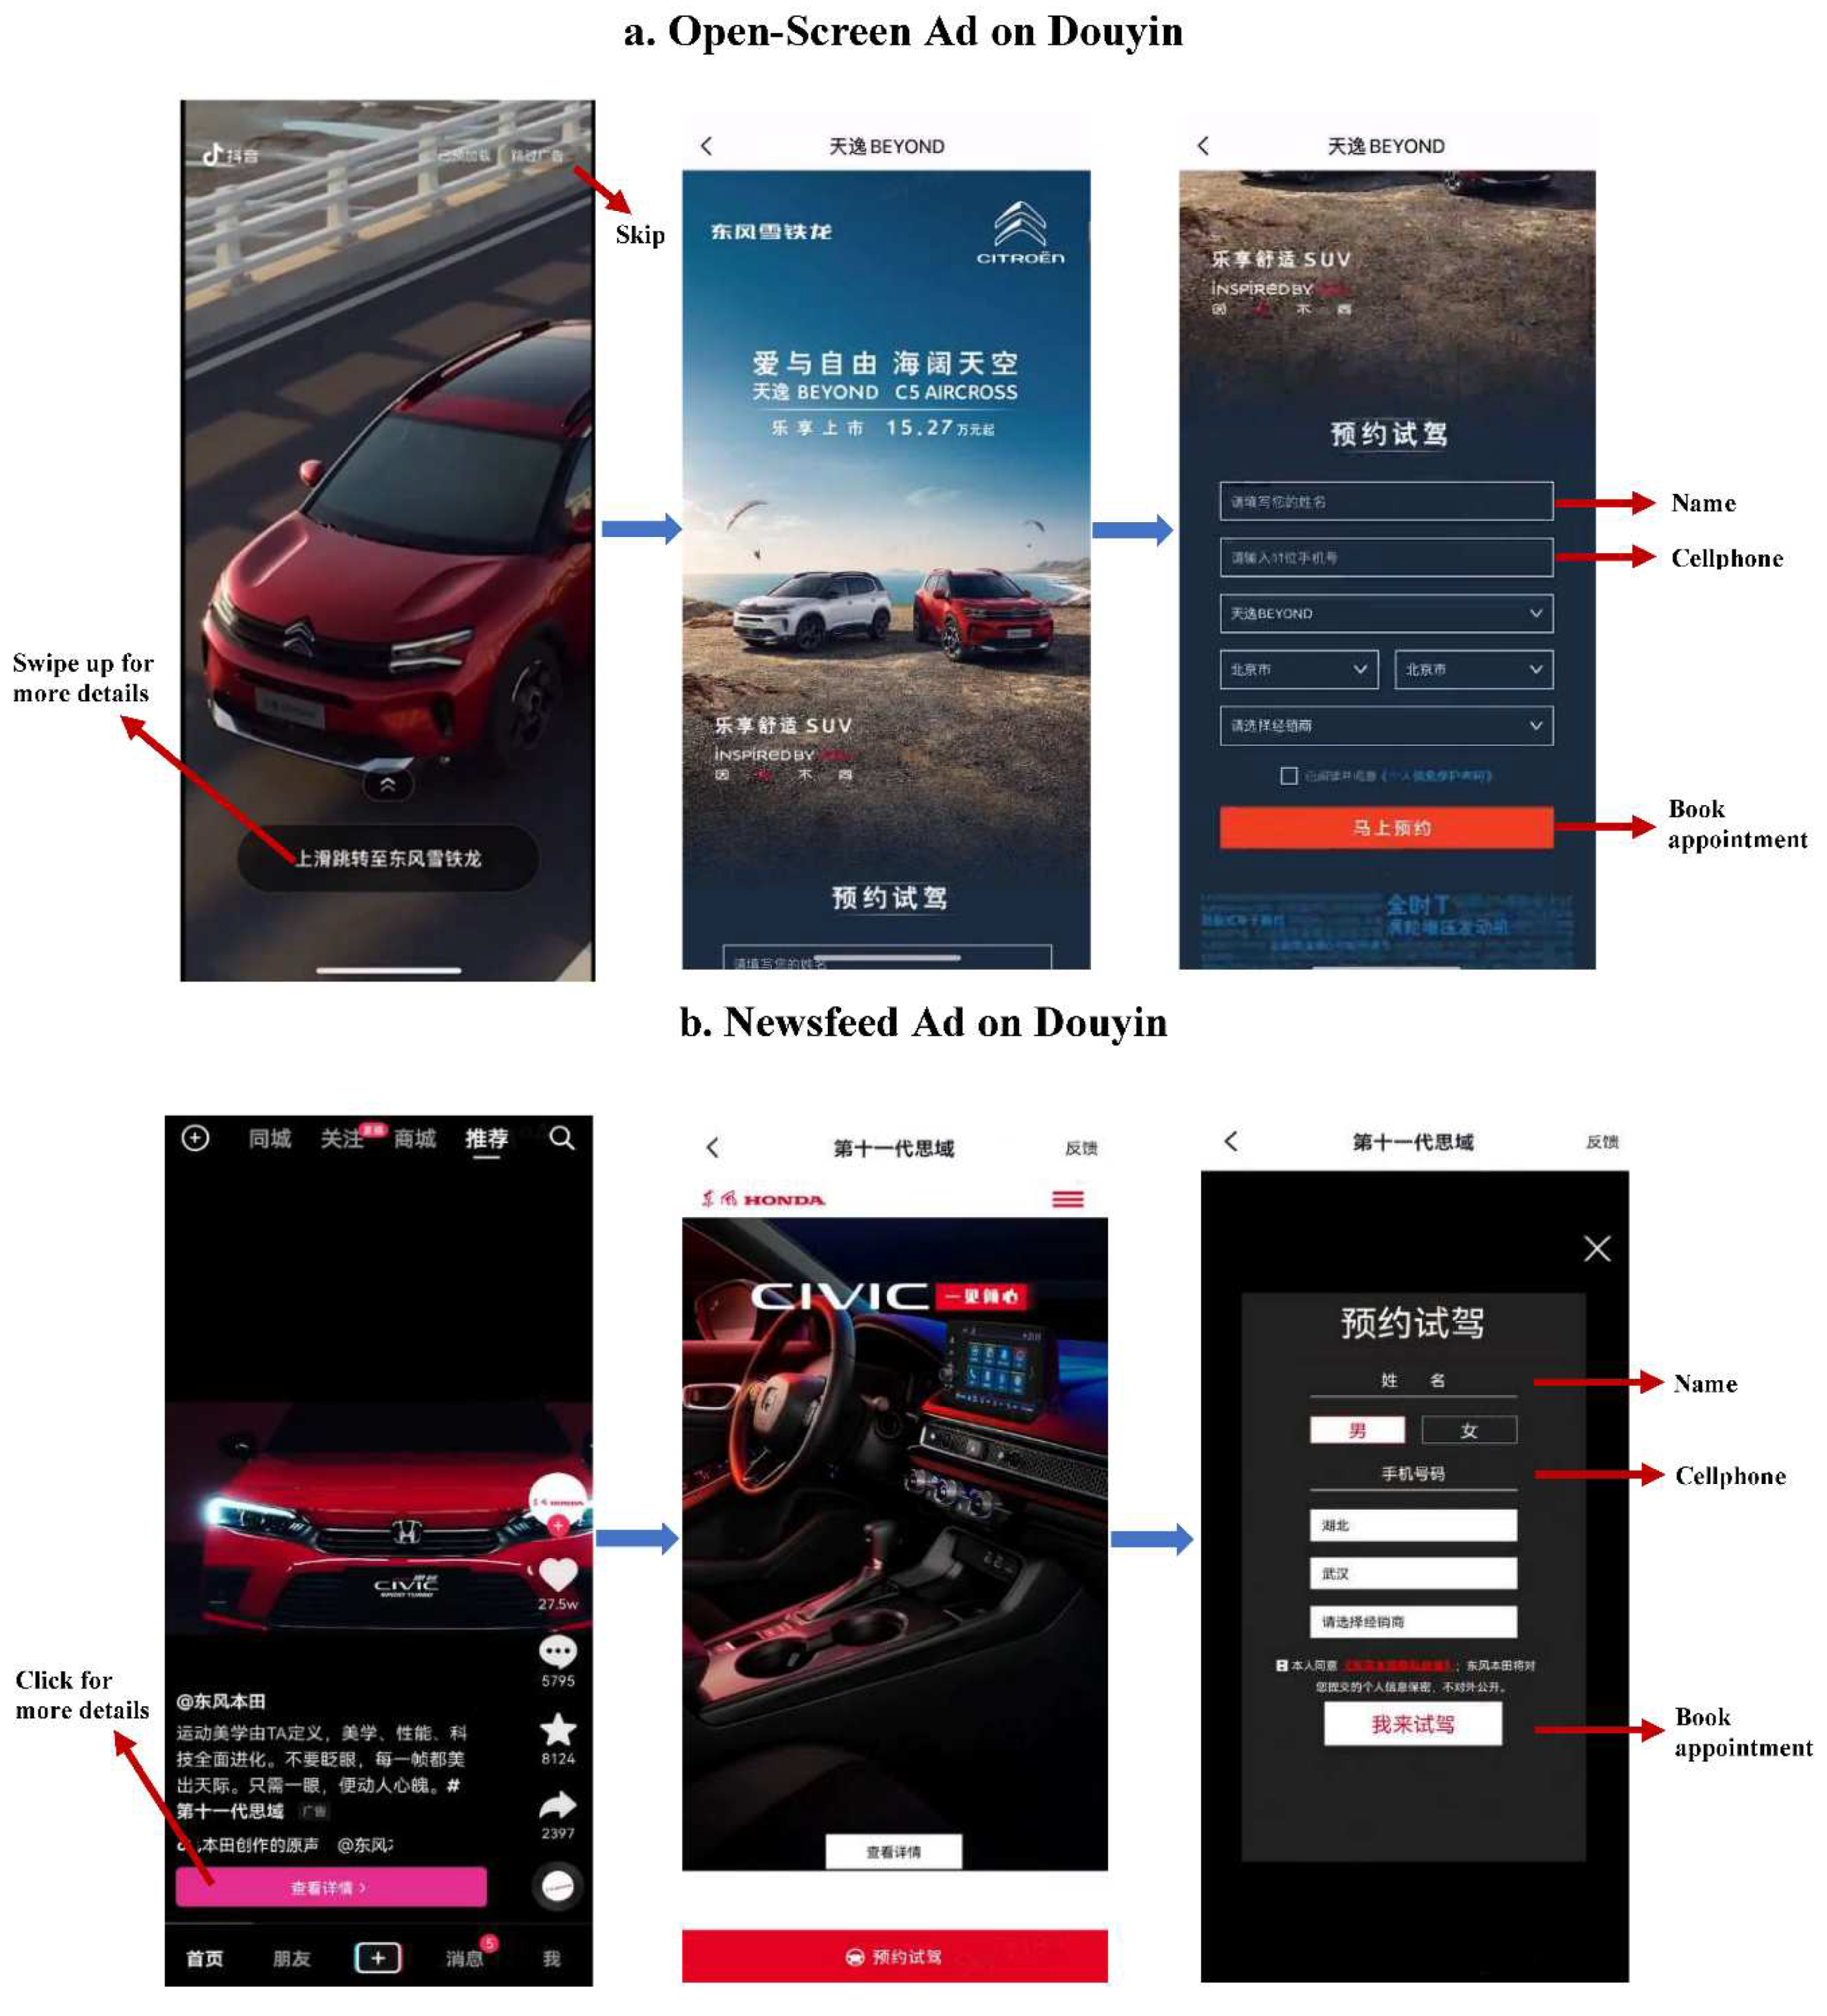
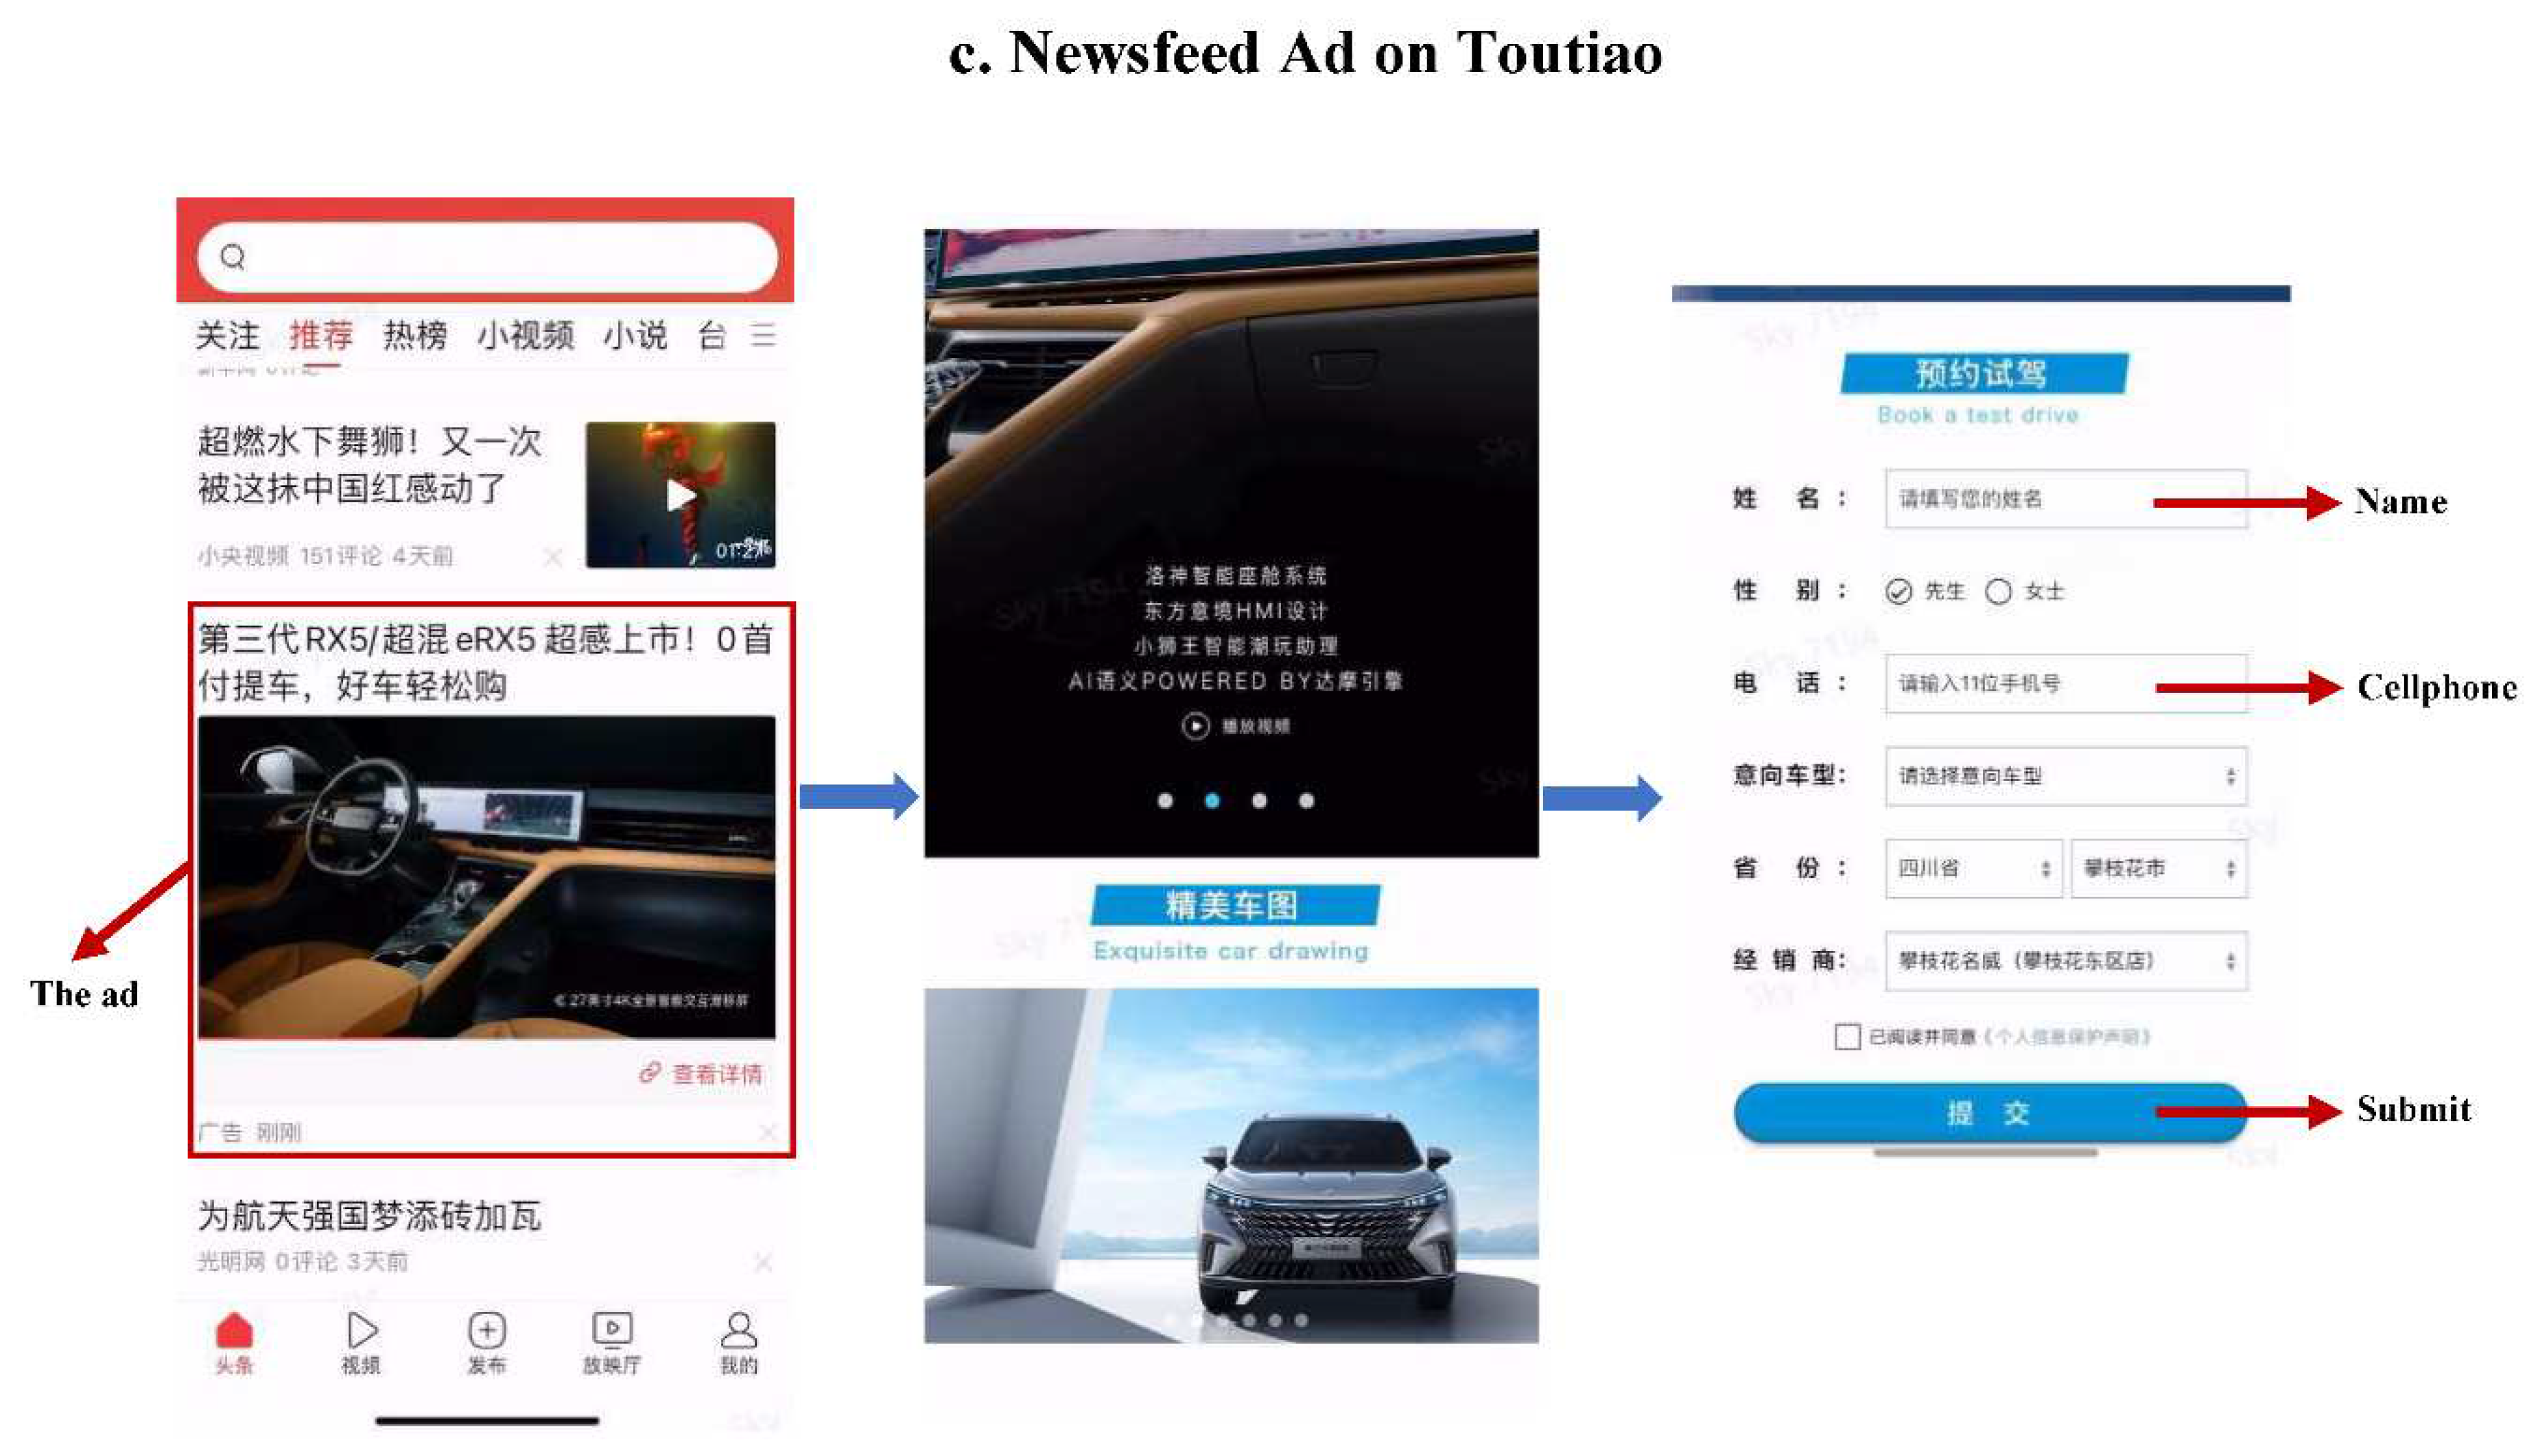
Figure 2.
Example of Conversion in Autohome (Outside ByteDance).
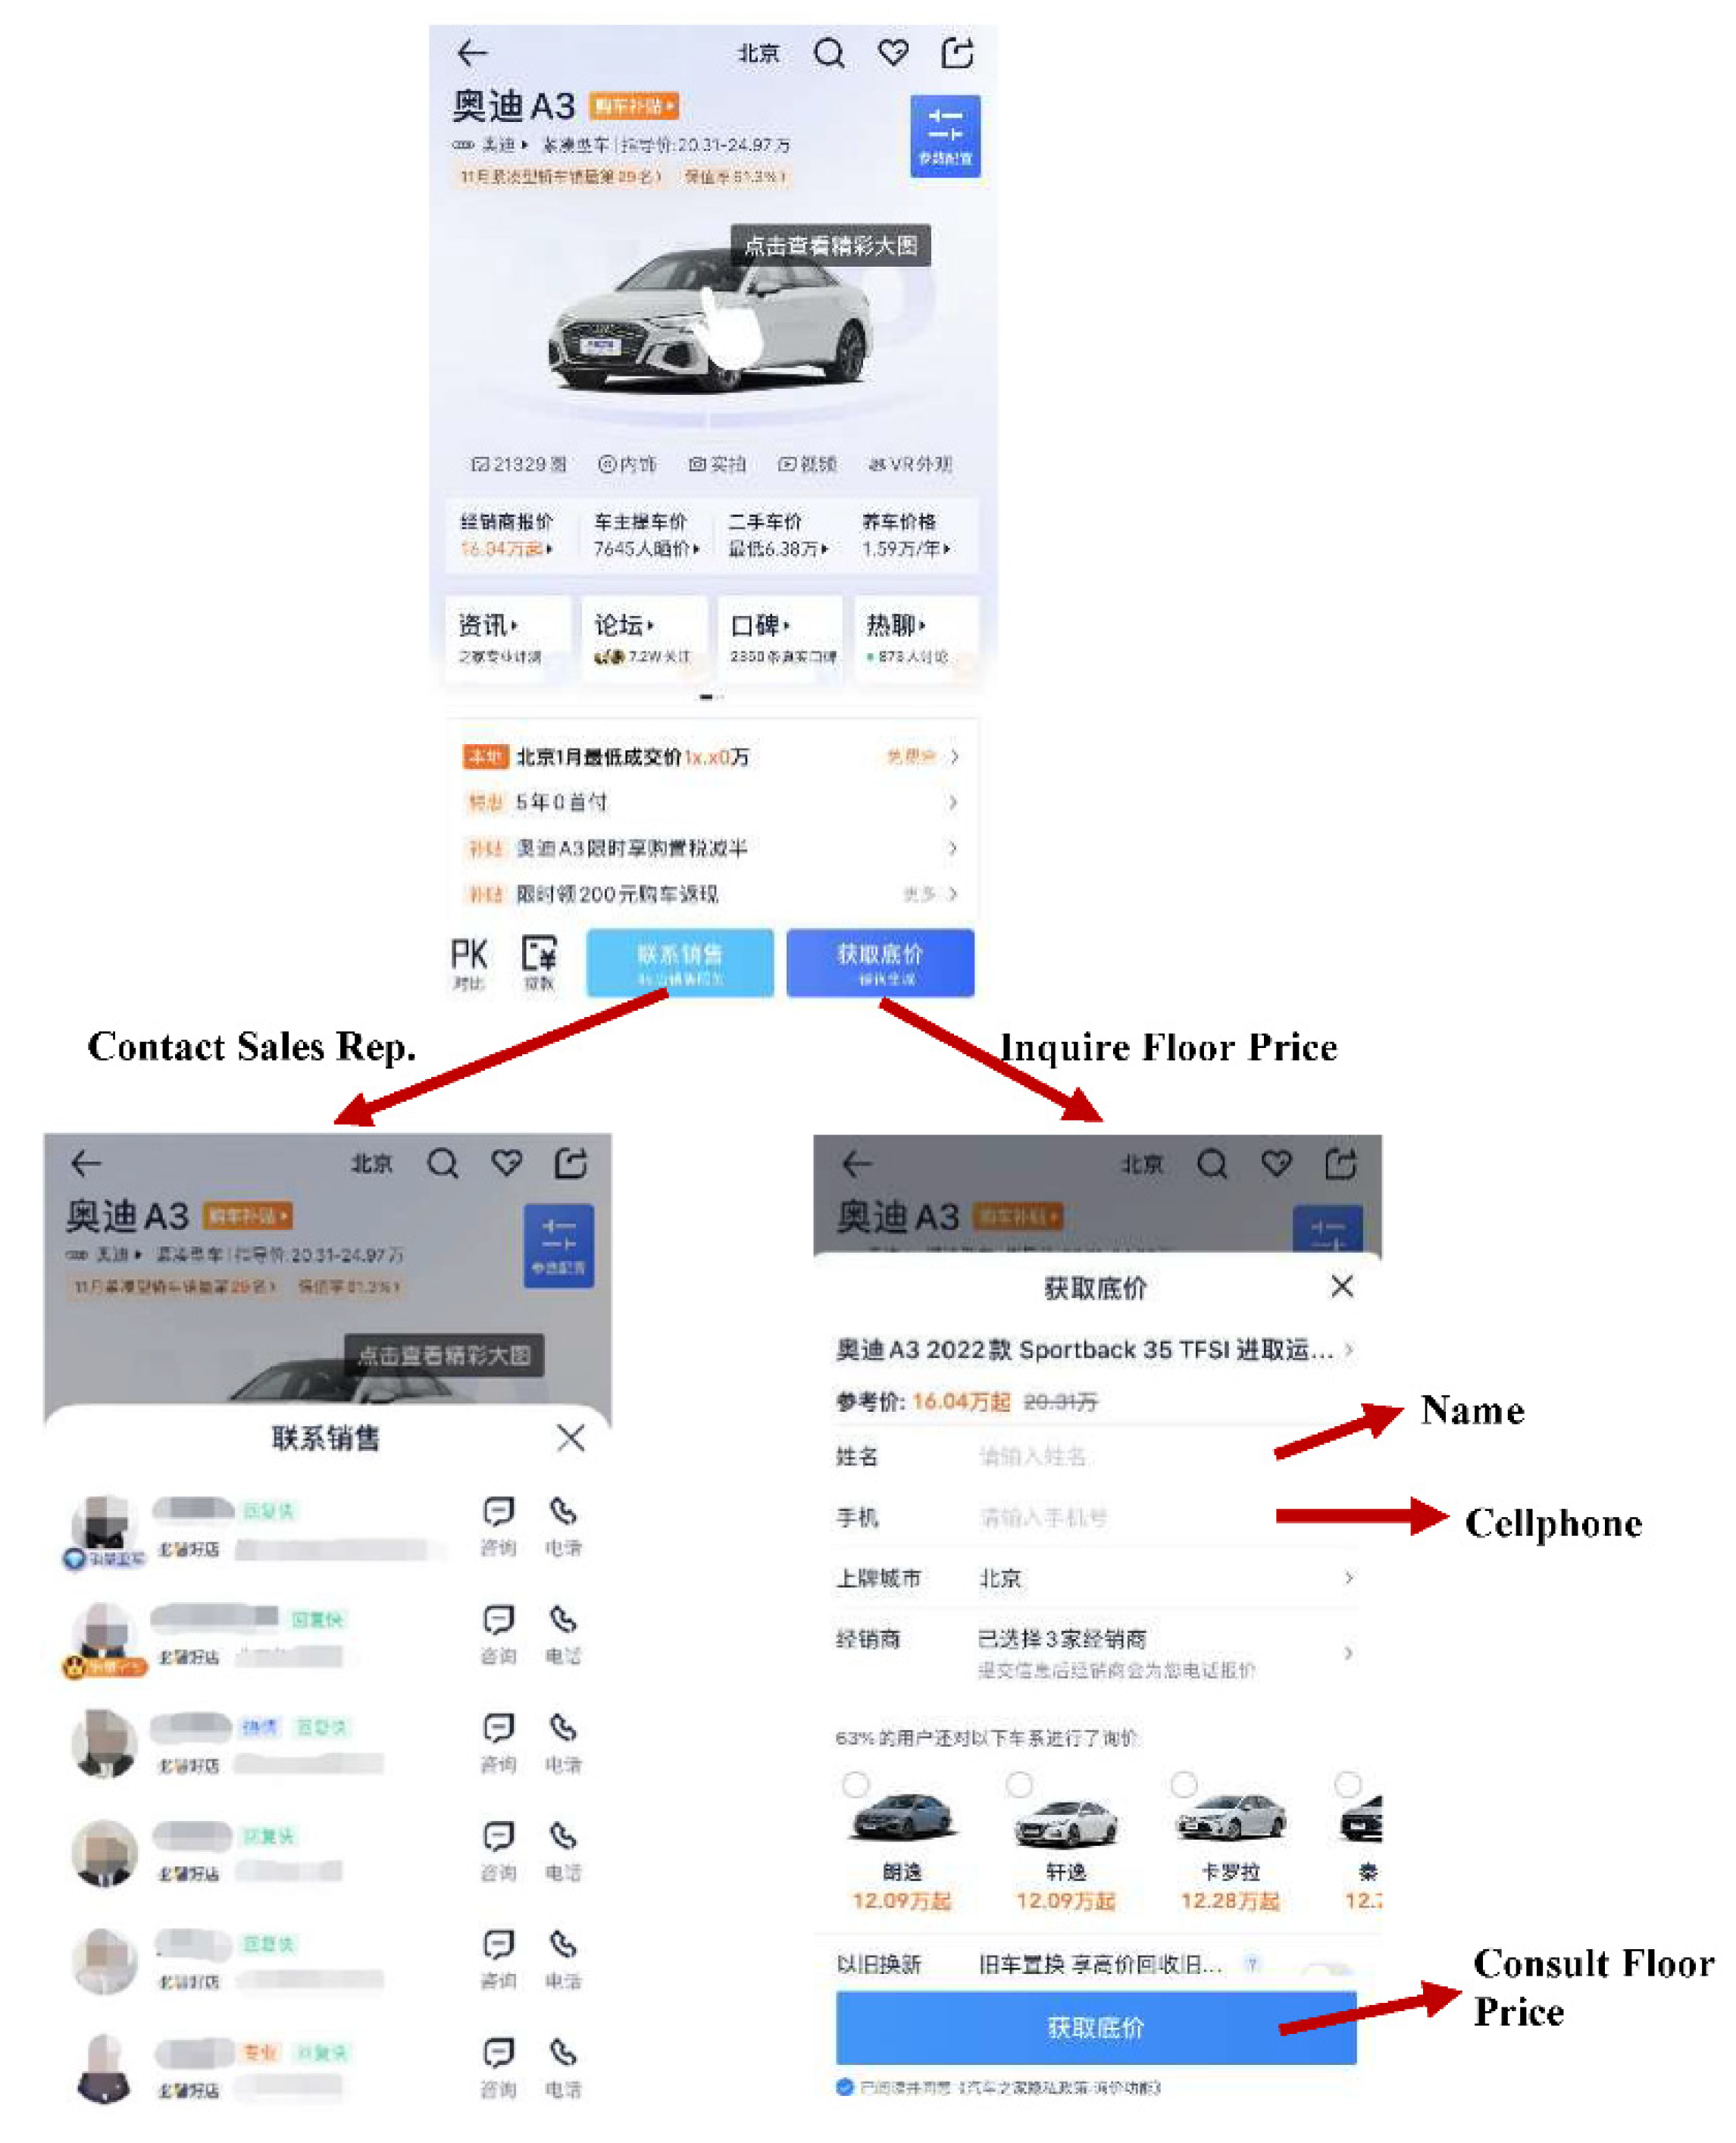

Table 1.
Balance in Demographics.
| t-stat for TOST | ||
| H0: μc – μt < –Δ | H0: μc – μt > Δ | |
| Male | 20.4909 | -30.4542 |
| City tier 1 or 2 | 20.7221 | -20.3276 |
| Age ≥31 | 25.7473 | -41.7289 |
Notes. We ran equivalence test H0: |μc – μt| > Δ, where Δ = 0.5% × treatment (Huang et al. 2020), which is two one-sided t-tests (TOST). The H0 of the first t-test is μc – μt < –Δ against H1: μc – μt ≥ –Δ, while the second H0 is μc – μt > Δ against H1: μc – μt ≤ Δ. All tests in this table show significant results and therefore are rejected at the 5% level, concluding that |μc – μt| ≤ Δ.
Table 2.
Summary Statistics.
| Control | Treatment | |||
| Total | Exposed | Unexposed | ||
| No. users | 42,135,109 | 42,136,733 | 3,451,204 | 38,685,529 |
| Exposure rate | ------ | 0.0819 | ------ | ------ |
| Conversion (‰) | ||||
| Overall | 0.0281 | 0.0348 | 0.1550 | 0.0240 |
| Within ByteDance | ------ | 0.0014 | 0.0171 | ------ |
| Outside ByteDance | 0.0281 | 0.0337 | 0.1414 | 0.0240 |
Table 3.
ATT and Lift.
| ATT (‰) | ATT lift | |
| Conversion: | ||
| Overall | 0.0820 * [0.0530, 0.1119] |
1.1226 * [0.5398, 2.3001] |
| Within ByteDance | 0.0171 * [0.0130, 0.0214] |
------ |
| Outside ByteDance | 0.0684 * [0.0396, 0.0971] |
0.9362 * [0.4033, 2.0104] |
Notes. The bias-corrected bootstrap 95% confidence intervals are in brackets (B = 2000). * Sig. at the 5% level.
Table 4.
Heterogeneous Treatment Effects.
| Gender | City | Age | ||||
| Male | Female | Tiers 1 and 2 | Tiers 3–5 | ≤30 | ≥31 | |
| Conversion: ATT (‰) | ||||||
| Overall | 0.0822 * [0.0449, 0.1206] |
0.0814 * [0.0426, 0.1149] |
0.0845 * [0.0490, 0.1204] |
0.0790 * [0.0295, 0.1257] |
0.1022 * [0.0395, 0.1655] |
0.0740 * [0.0416, 0.1070] |
| Within ByteDance | 0.0196 * [0.0145, 0.0257] |
0.0130 * [0.0076, 0.0199] |
0.0179 * [0.0121, 0.0243] |
0.0161 * [0.0103, 0.0225] |
0.0222 * [0.0151, 0.0333] |
0.0150 * [0.0102, 0.0199] |
| Outside ByteDance | 0.0658 * [0.0286, 0.1042] |
0.0722 * [0.0348, 0.1041] |
0.0702 * [0.0361, 0.1059] |
0.0661 * [0.0167, 0.1116] |
0.0850 * [0.0224, 0.1474] |
0.0618 * [0.0296, 0.0939] |
| Conversion: ATT lift | ||||||
| Overall | 0.8048 * [0.3413, 1.7570] |
3.1660 * [0.7164, 63.2652] |
1.4160 * [0.5535, 4.1144] |
0.8842 * [0.2125, 2.5609] |
1.0344 * [0.2601, 3.9399] |
1.1836 * [0.4699, 2.9162] |
| Within ByteDance | ------ | ------ | ------ | ------ | ------ | ------ |
| Outside ByteDance | 0.6449 * [0.2147, 1.5048] |
2.8089 * [0.5834, 58.6065] |
1.1771 * [0.4130, 3.6985] |
0.7404 * [0.1291, 2.3355] |
0.8606 * [0.1556, 3.6655] |
0.9887 * [0.3438, 2.5351] |
Notes. The bias-corrected bootstrap 95% confidence intervals are in brackets (B = 2000). * Sig. at the 5% level.
Table 5.
2SLS Regression.
| Conv. overall | Conv. within ByteDance | Conv. outside ByteDance | |
| Intercept | 0.0264 *** (0.0020) |
------ | 0.0264 *** (0.0020) |
| Dummy (male) | 0.0184 *** (0.0017) |
------ | 0.0184 *** (0.0017) |
| Dummy (city tiers 1 and 2) | -0.0031 * (0.0017) |
------ | -0.0031 * (0.0017) |
| Dummy (age ≥ 31) | -0.0105 *** (0.0019) |
------ | -0.0105 *** (0.0018) |
| AdExposure | 0.0991 ** (0.0422) |
0.0172 *** (0.0045) |
0.0871 ** (0.0418) |
| AdExposure × dummy (male) | 0.0004 (0.0318) |
0.0065 * (0.0034) |
-0.0067 (0.0315) |
| AdExposure × dummy (city tiers 1 and 2) | 0.0049 (0.0306) |
0.0016 (0.0032) |
0.0037 (0.0303) |
| AdExposure × dummy (age ≥ 31) | -0.0282 (0.0340) |
-0.0070 ** (0.0036) |
-0.0233 (0.0337) |
| N | 84,271,842 | 84,271,842 | 84,271,842 |
***p < 0.01, **p < 0.05, *p < 0.1. Notes. The IV is the indicator for the treatment group. All estimates and SE are multiplied by 1000, so that their interpretation is consistent with the unit of ‰ for the ATTs in the previous tables.
Table 6.
Advertising Effect on Conversion by Prior Visit.
| Dummy dependent variables | |||
| Conv. overall | Conv. within ByteDance | Conv. outside ByteDance | |
| Intercept | 0.0281*** (0.0009) |
------ | 0.0281*** (0.0009) |
| PriorVisit | 0.0005 (0.0134) |
------ | 0.0005 (0.0133) |
| AdExposure | 0.0780*** (0.0149) |
0.0172*** (0.0016) |
0.0643*** (0.0148) |
| AdExposure × PriorVisit | 0.8376*** (0.2067) |
-0.0172 (0.0217) |
0.8513*** (0.2048) |
| N | 84,271,842 | 84,271,842 | 84,271,842 |
***p < 0.01, **p < 0.05, *p < 0.1. Notes. The IV is the indicator for the treatment group. All estimates and SE are multiplied by 1000.
Table 7.
Advertising Effect on Conversion by Prior Visit: Control for Demographics.
| Dummy dependent variables | |||
| Conv. overall | Conv. within ByteDance | Conv. outside ByteDance | |
| Intercept | 0.0264*** (0.0020) |
------ | 0.0264*** (0.0020) |
| Male | 0.0184*** (0.0017) |
------ | 0.0184*** (0.0017) |
| City Tiers 1 and 2 | -0.0031* (0.0017) |
------ | -0.0031* (0.0017) |
| Age ≥ 31 | -0.0105*** (0.0019) |
------ | -0.0105*** (0.0018) |
| PriorVisit | -0.0003 (0.0134) |
------ | -0.0003 (0.0133) |
| AdExposure | 0.0943** (0.0422) |
0.0173*** (0.0045) |
0.0821** (0.0419) |
| AdExposure × male | 0.0004 (0.0318) |
0.0065* (0.0034) |
-0.0067 (0.0315) |
| AdExposure × (city tiers 1 and 2) | 0.0047 (0.0306) |
0.0016 (0.0032) |
0.0035 (0.0303) |
| AdExposure × (age ≥ 31) | -0.0267 (0.0340) |
-0.0071** (0.0036) |
-0.0219 (0.0337) |
| AdExposure × PriorVisit | 0.8357*** (0.2067) |
-0.0177 (0.0217) |
0.8498*** (0.2048) |
| N | 84,271,842 | 84,271,842 | 84,271,842 |
***p < 0.01, **p < 0.05, *p < 0.1. Notes. The IV is the indicator for the treatment group. All estimates and SE are multiplied by 1000.
Disclaimer/Publisher’s Note: The statements, opinions and data contained in all publications are solely those of the individual author(s) and contributor(s) and not of MDPI and/or the editor(s). MDPI and/or the editor(s) disclaim responsibility for any injury to people or property resulting from any ideas, methods, instructions or products referred to in the content. |
| 1 | This information came from one of the authors. |
| 2 | In 2022, the US influencer marketing spending on TikTok was $774.8 million (Gutelle 2022), and TikTok’s US ad revenue was $9.9 billion (Winter 2023). |
| 3 | Owing to confidentiality agreements, all figural examples shown herein do not come from the brand studied. They are for illustration purposes only. |
| 4 | Such practice is common in the China market. However, owing to the privacy concern, most users only provide their last names rather than their full names. |
| 5 | Confidentiality agreement prevents us from revealing the brand’s identity. |
| 6 | |
| 7 | The lower the tier, the more economically developed the city is. |
| 8 | ByteDance’s privacy concerns prevent us from reporting the distribution of the demographics for the treatment and control groups. |
| 9 | ByteDance’s privacy concerns prevent us from reporting the distribution of this information. However, the two one-sided t-test is rejected at the 5% level, indicating that this variable is balanced between the treatment and control groups. |
© 2023 by the authors. Licensee MDPI, Basel, Switzerland. This article is an open access article distributed under the terms and conditions of the Creative Commons Attribution (CC BY) license (http://creativecommons.org/licenses/by/4.0/).
Copyright: This open access article is published under a Creative Commons CC BY 4.0 license, which permit the free download, distribution, and reuse, provided that the author and preprint are cited in any reuse.


