1. Introduction
Concrete Filled Steel Tubular (CFST) arch bridge has light weight, high bearing capacity and good seismic performance. Because it better solves the problem of arch bridge design and construction, it is one of the more competitive bridge types in the large-span bridge so far. With the continuous innovation of the design concept and construction technology of concrete filled steel tube arch bridge, the bridge span is more and more gentle, so it is particularly important to carry out accurate reliability analysis.
Considering the complexity of the tubular structure and the influence of the dual nonlinearity of the large-span bridge, the limit state function of the structure in a specific failure mode is likely to be a nonlinear equation of height. Therefore, it is difficult to get the accurate display expression, and it is impossible to directly solve the reliability index by using the traditional primary second moment method. Although the Monte Carlo method, the random finite element method and the response surface method can solve this problem, they all have their own shortcomings. The stochastic finite element method needs special finite element software, which is very difficult to compile and difficult to apply and popularize in practical engineering. The response surface method uses polynomial functions (usually quadratic polynomials) to approximate the structural limit state function instead of deterministic finite element analysis [
1].However, the analysis shows that [
2]: polynomial function cannot approximate any nonlinear map with any precision.
In recent years, the rapidly developed artificial neural network has provided new ideas for the reliability analysis of complex bridge structure. Neural network has efficient nonlinear mapping ability and generalization prediction ability, which can accurately approximate the mapping relationship of random variables and response quantity of complex structure, which just makes up for the deficiency of the traditional response surface method. The problem of solving the limit state function explicitly can be solved through the neural network, while another key problem in the reliability analysis of the CFRP arch bridge is the solution of the reliability index. When the explicit structure limit state equation is known, the reliability index is often solved by the JC method. Reference [
3] points out that the JC method is difficult to converge if the function is high, which is not applicable in this case. However, the limit state function of large-span CFST arch bridge is generally highly nonlinear, and the accurate reliability index cannot be obtained by using JC method. As an emerging group intelligence evolution algorithm, the PSO algorithm has outstanding advantages in the extremum optimization of nonlinear functions, so it is very practical to extend it to the field of complex structure reliability solution.
2. BP neural network
2.1. Basic concepts
BP neural network [
4] is an adaptive nonlinear structure connected by a large number of simple computing elements (neurons) according to certain rules. It simulates the process of processing, processing and associative memory information in the human nervous system, which is similar to the human nervous system and has strong learning, prediction and nonlinear mapping capabilities. It is a multi-layer feedforward neural network, compared with the traditional neural network, its main advantages in addition to the signal from the initial input layer to the middle hidden layer, but also can be in the output cannot meet the requirements of the error of the error, according to the error between the weights and prediction, so that the prediction gradually meet the expected requirements.
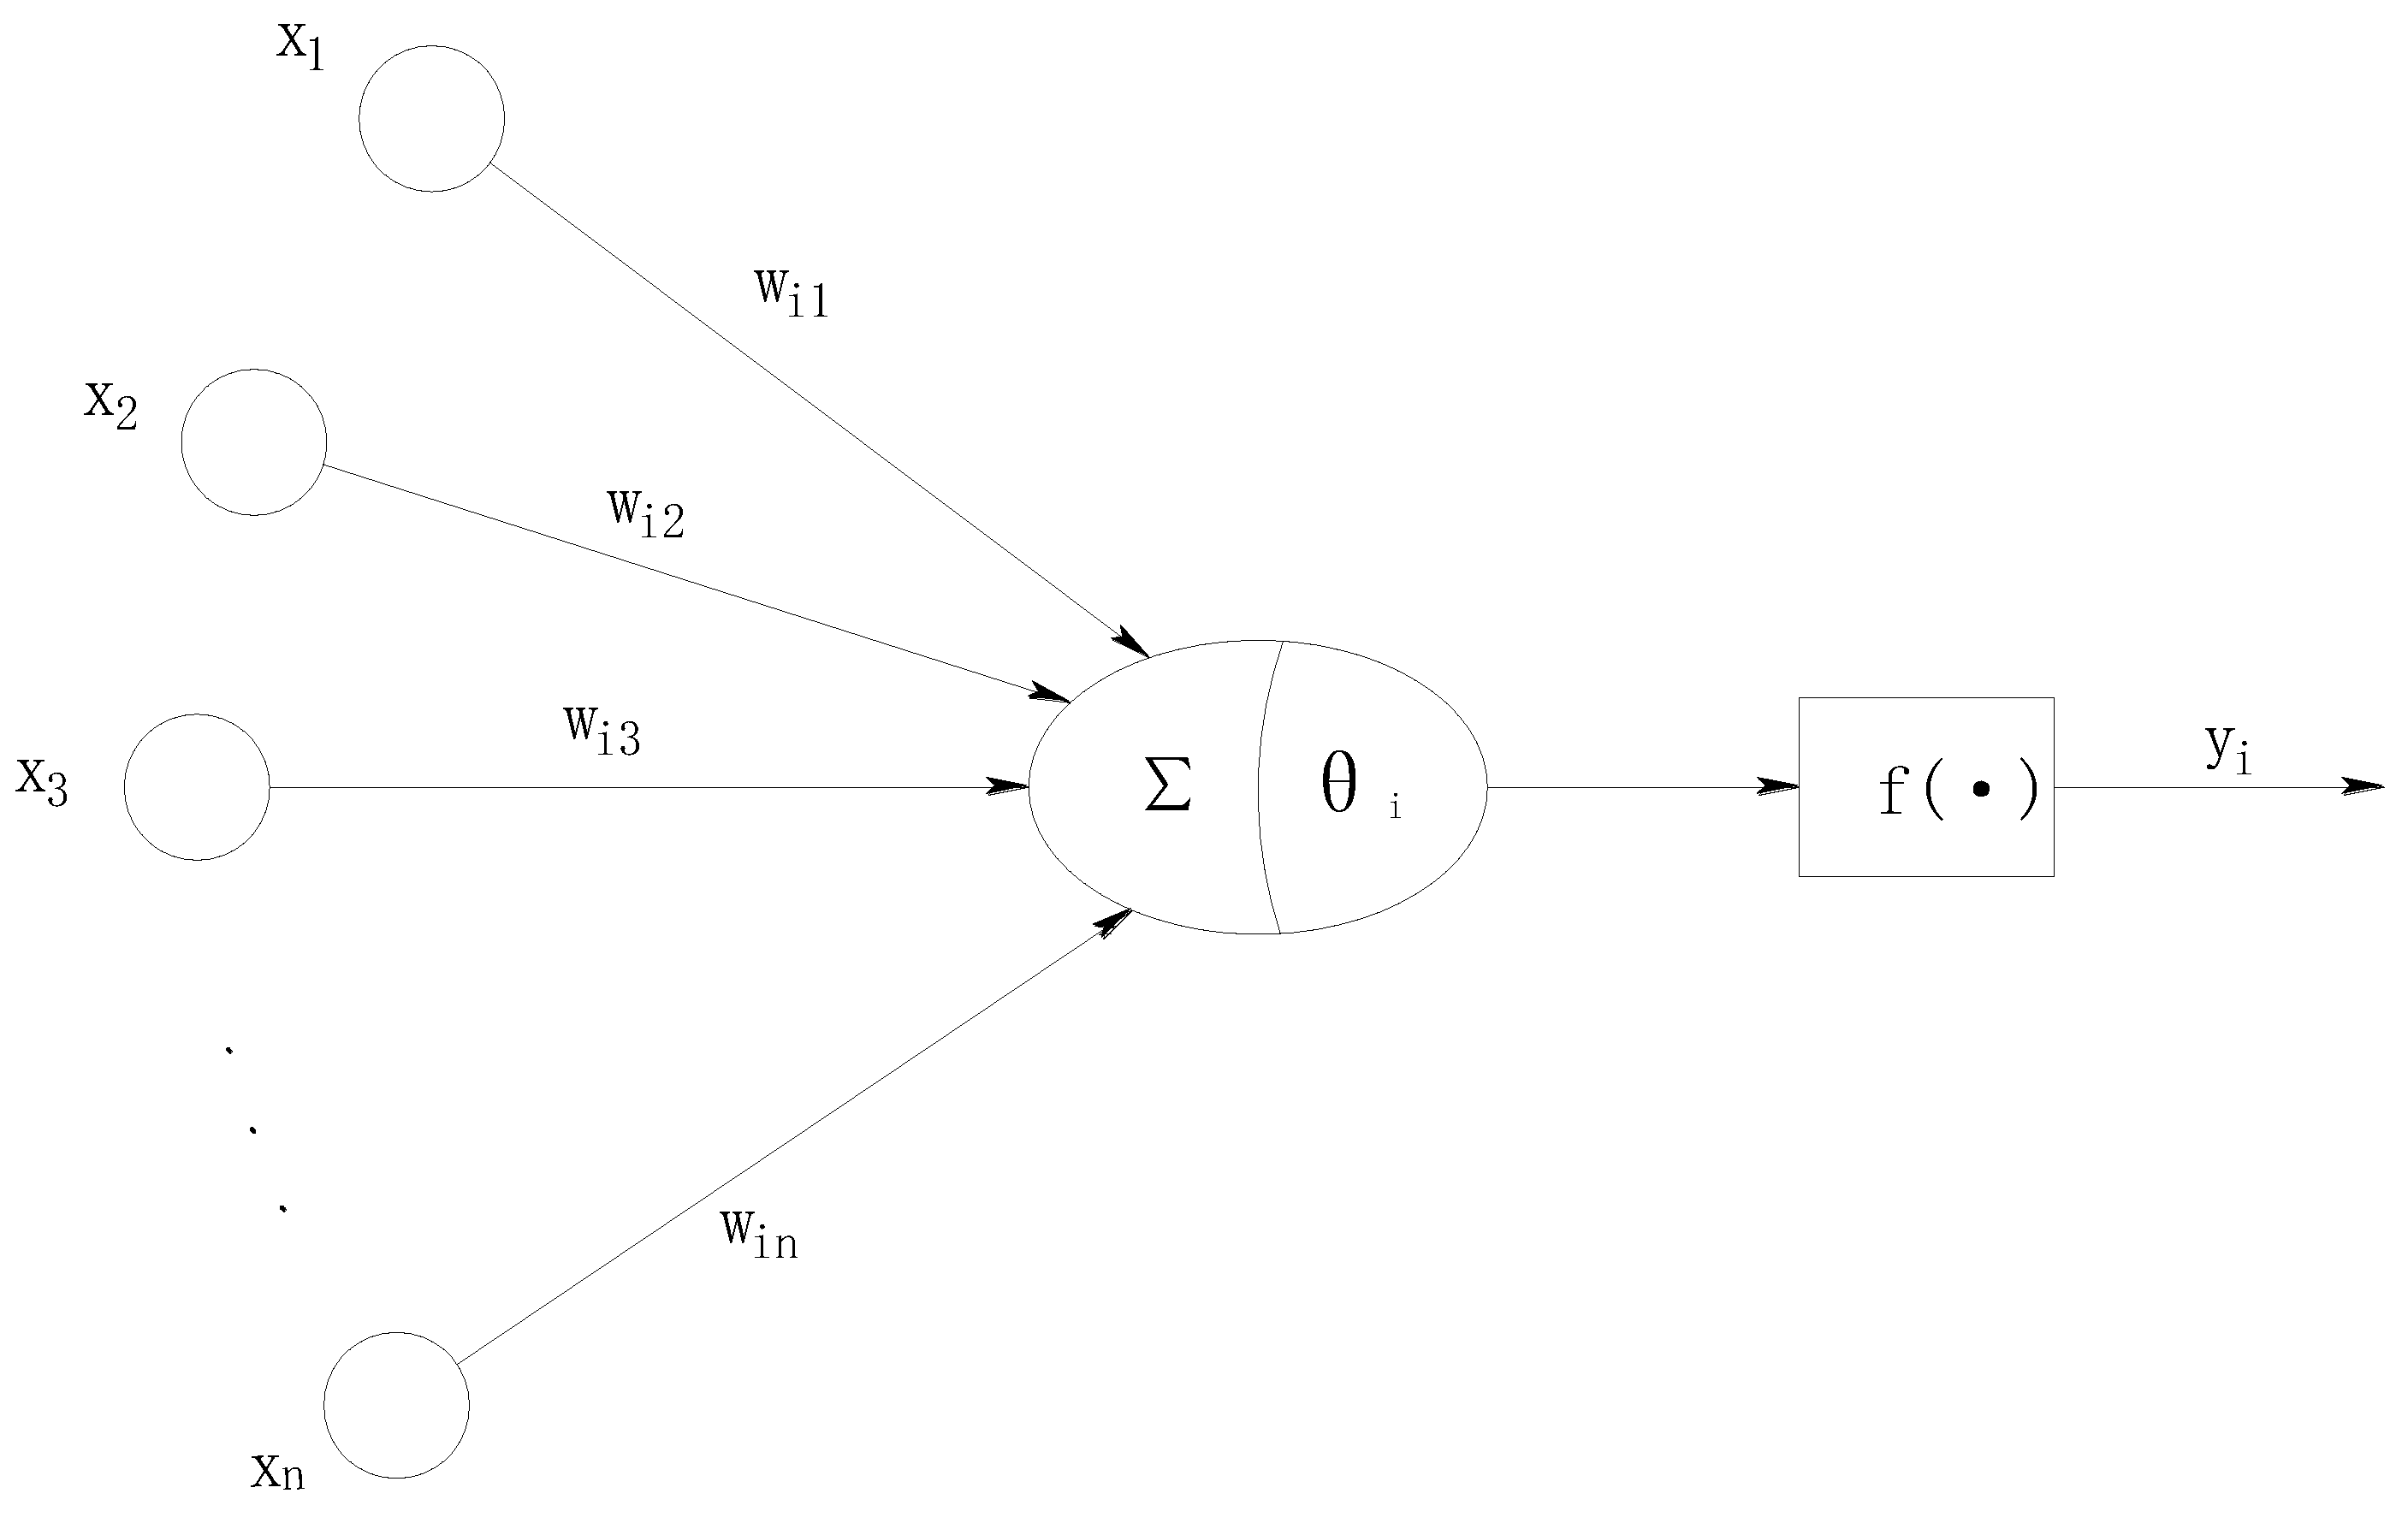
The single-layer BP neural network is taken as an example and expressed in a mathematical model, and its basic structure is shown in
Figure 1. Individual neurons can be expressed as follows:
In formula: f (*)——transfer function
——input values of the neurons
——output values of the neurons
,——weights and thresholds of BP neural network
There are three common forms of transfer functions:
2.2. Parameter determination
Using BP neural network to fit the limit state function of complex structure, it is first necessary to determine the neural network structure parameters, including: the number of neural network layers, the number of neurons in each layer and the transmission function.
The study proves that [
5], as long as there is a sufficient number of hidden layer neurons, a three-layer BP neural network can approximate the nonlinear function with arbitrary accuracy. Considering the convenience of calculation and the accuracy of the results, a three-layer BP neural network is generally used for structural reliability analysis.
The number of neurons in the input layer is determined according to the design random variables of the structure (e.g., area, elastic modulus, etc.), and the number of neurons in the output layer is determined by the structural response amount (internal force, displacement, etc.). The hidden layer neurons do not have such intuitive and physically meaningful expression, and their number can only be determined by trial. Referring to the relevant literature, the initial value h of the number of neurons in the hidden layer can be determined by formula (5), and then the number of neurons in the hidden layer is adjusted according to the prediction error of the network.
In formula: m——the number of neurons in the input layer
In general, the implied layer and the output layer transfer functions choose the logsig function and the purelin function, respectively.
2.3. Sample point selection and processing
In structural reliability analysis, the training samples of BP neural networks need to be obtained through deterministic structural finite element analysis. For the complex structural form of CFST arch bridge, it takes a very long time to conduct the finite element calculation, and it is of great significance to minimize the sample size under the premise of satisfying the solution accuracy.
Uniform design method[
6], in the theory of number theory applied to multivariate statistics, through reasonable design to the uniform distribution of sample point test range, generally used in experimental design, make the selected sample point with better representative, which can use the least sample point as sufficient as possible system information, the method is proposed by Fang [
6]. Among them, the uniform design table can be generated through the mathematical statistical system DPS, the specific method can refer to the reference[
7], this paper will not be repeated.
Because the value of each random variable in the structure varies greatly, if it is directly taken as a training sample, the neural network learning will be submerged by large numbers due to too large weight adjustment, and then lead to learning failure. Therefore, the training samples should be normalized or standardized before being used for neural network learning.
3. PSO algorithm
3.1. Basic concepts
Kennedy and Eberhart [
8] proposed a PSO algorithm based on population intelligence. The process of parameter optimization adopts a dynamic optimization method, which originates from the foraging thinking of birds in nature. It compares particles to birds and treats them as a basic individual. The speed, position and fitness represent the group characteristics of each basic individual. In the extreme value optimization problem, the speed and position of each particle are constantly and dynamically adjusted according to its own moving experience of other particles, so as to achieve the purpose of approaching the extreme value faster.
It is described mathematically as follows: in a D-dimensional search space composed of functional solutions containing
d independent variables, randomly distributed
n particles that can move freely, including particle position is
and velocity is
,the dynamic adjustment equation is as follows:
In formula:
——number of particles
——dimensions of particles
——inertial weight
——the current number of iterations
——acceleration factor, whose value is not negative
——random factors, whose values are located at [0,1]
——the position corresponding to individual optimal value of particle
——the position corresponding to optimal value of entire particle population
In order to prevent the blind search of particles in the search space and the detachment boundary of particle position velocity, the optimization efficiency is further improved, to impose certain constraints on the position and velocity of free particles.Generally, the position of particle is confined to the interval , and the particle velocity is limited to the interval .
3.2. Algorithm optimization
Although PSO algorithm has strong versatility and fast convergence, there are still problems of local optimal results and low efficiency of late iteration [
9,
10]. Therefore, this paper optimizes PSO algorithm from these two aspects.
Causes for the precocious occurrence of PSO algorithm:as the iteration process goes on, the particle swarm search space continuously shrinks to a certain limited local range due to the initialization value of the variable, so only the optimal result in the local range, rather than the optimal result in the whole search space.In order to improve this defect, we refer to the mutation principle in the genetic algorithm during the iterative calculation process, so that some variables are no longer limited to an initial value, and can have a certain opportunity to reinitialize and increase the particle population diversity. The variant operation substantially broadens the population search space during computation, raising the possibility of finding the optimal solution by the particle swarm algorithm while maintaining the original population diversity.
For the problem of low late iteration efficiency of PSO algorithm, this paper improves the iteration efficiency by optimizing the inertial weight
based on the basic algorithm. Inertial weights characterize the level of particle inheritance to the previous velocity, which largely determines the rate of particle evolution (i.e., iterative efficiency). Studies have shown that a large inertial weight is favorable for the global search, while a smaller inertial weight is favorable for the local search. To achieve full potential of global search and local search, linear decreasing inertial weights are introduced, i.e.:
In formula: ——initial inertia weight
——inertial weight at iteration to maximum number
——number of current iterations
——maximum iterative algebra
3.3. Mathematical model for reliability index solution
Before calculating the structure reliability index using PSO algorithm, a mathematical model adapted to PSO algorithm is needed first.
are the n independent random variables in the model analysis, the limit state function represented by them is
, and the non-normal random variables are standard-normalized to obtain equivalent normally distributed random variables
. According to the geometric significance of the reliability index
β [
11]: the shortest distance between the central point and the failure boundary in the standard normal space, the solution of β is converted into finding the extreme value of the constrained function:
In formula:is design variable vector after standard normality.
3.4. Algorithm process
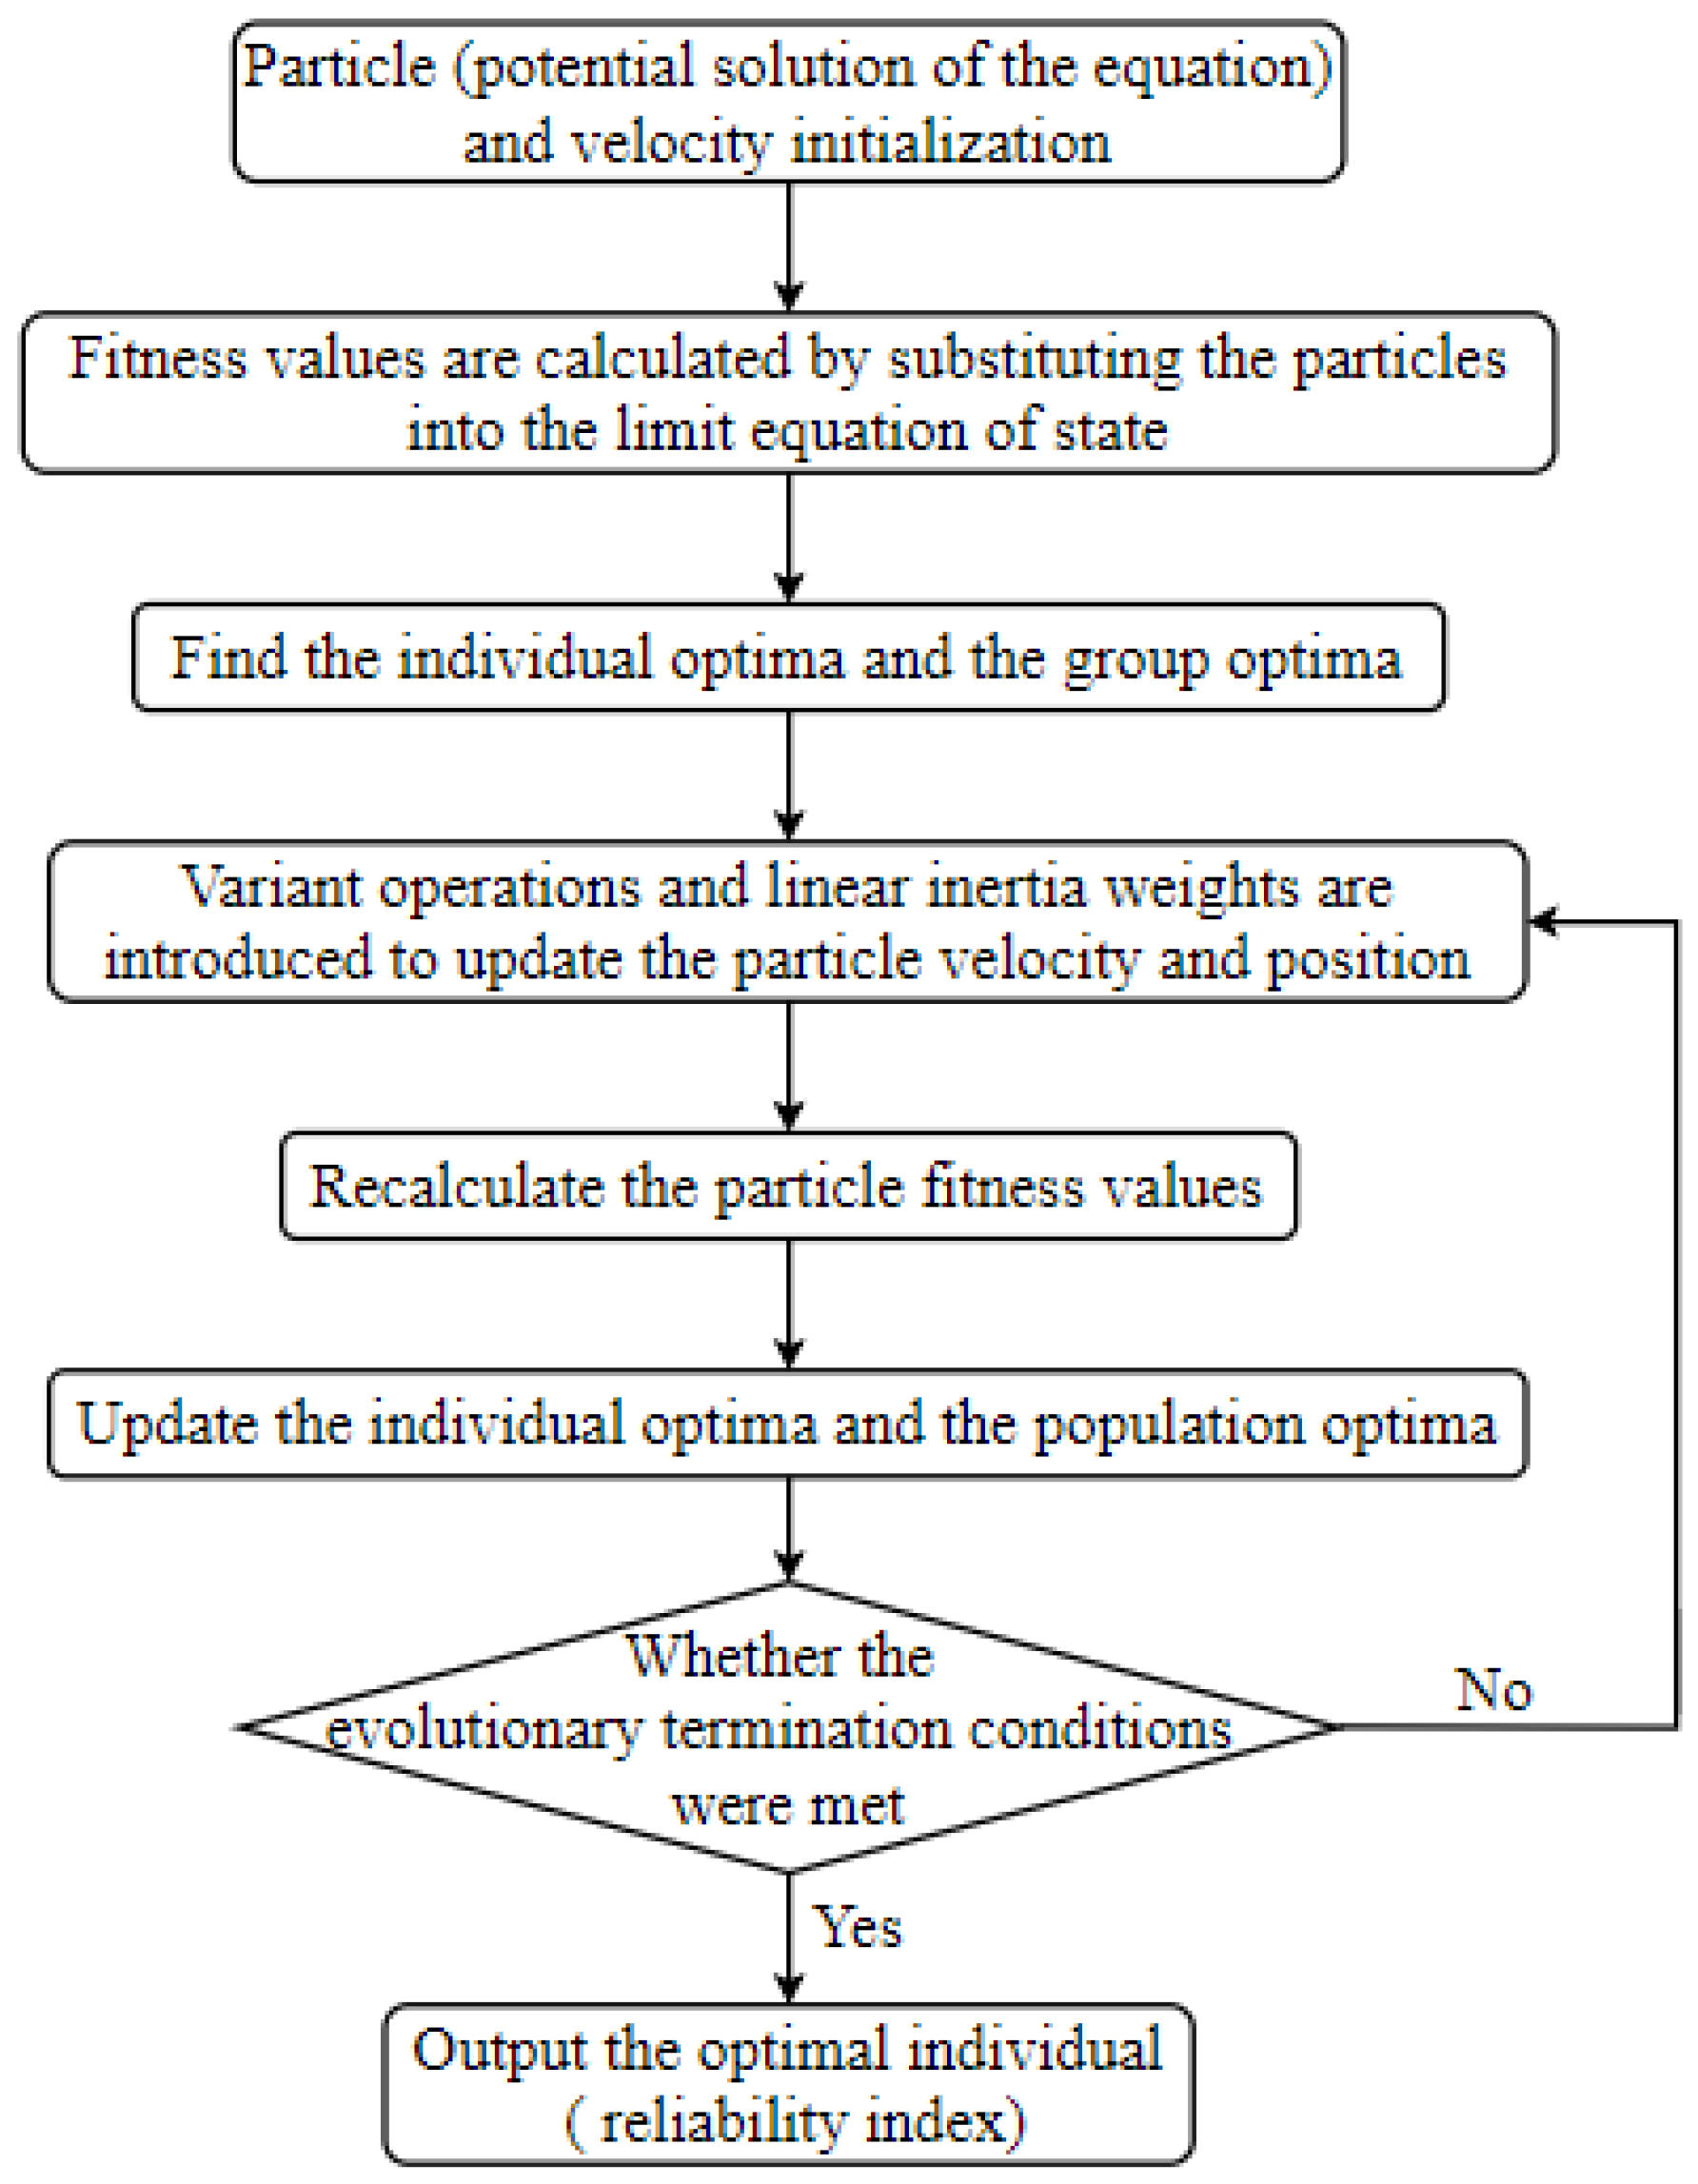
After obtaining the mathematical model of the structure reliability index, it is solved by PSO algorithm. The solution process is shown in
Figure 2.
4. Reliability analysis
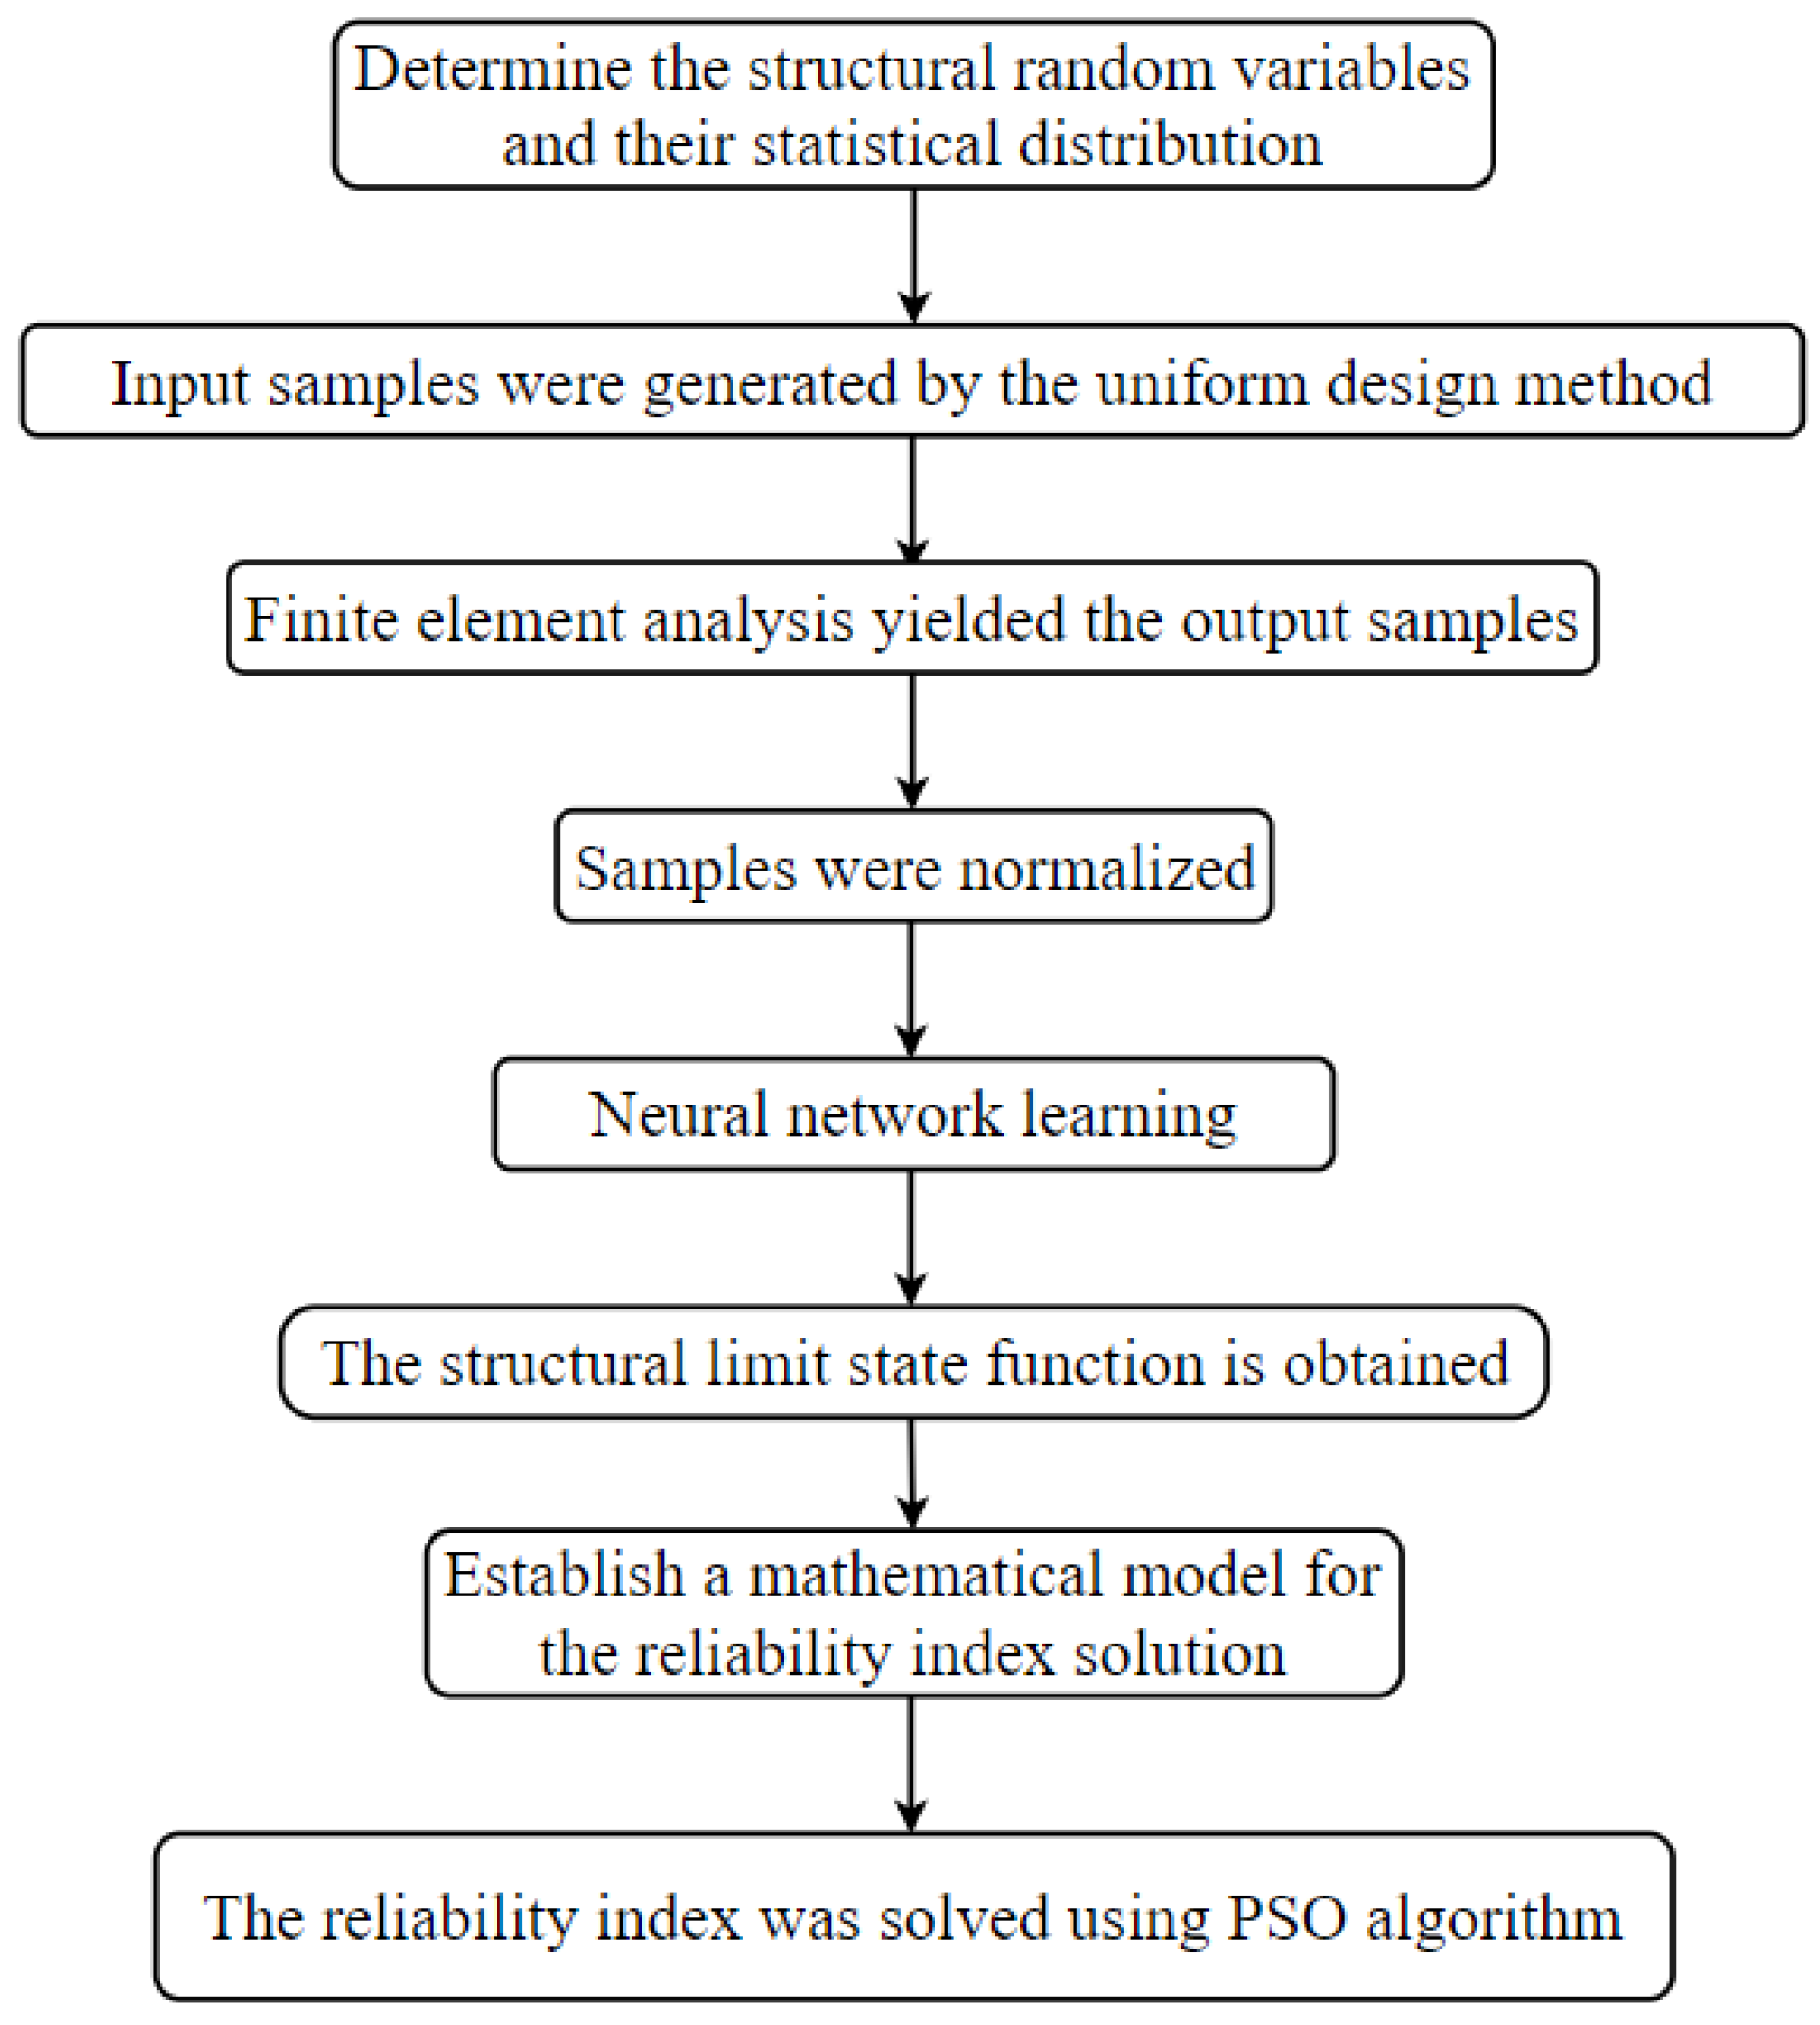
The structure limit state function can be obtained by the BP neural network fitting, and then the structure reliability index can be solved by using PSO algorithm. The reliability analysis process of CFST arch bridge based on BP neural network and PSO algorithm is as follows:
Step 1: The random variables and the corresponding statistical distribution characteristics of CFST arch bridge structure were determined, and then the neural network input samples were generated using the uniform design method.
Step 2: The structural finite element model is established according to the input sample, and the neural network output sample (structural internal force, displacement, etc.) is obtained by conducting the structural certainty analysis through the finite element software.
Step 3: The input and output samples were normalized to substitute the normalized samples into the neural network for learning, and the explicit structural limit state function was obtained according to the method of reference [
12].
Step 4: Non-normal random variables are standard normalized to establish a mathematical model for solving structural reliability index.
Step 5: The structure reliability index is finally obtained by using the optimized PSO algorithm.
The specific calculation flow is shown in
Figure 3:
Considering the powerful neural network module of MATLAB, combining the algorithm process of
Figure 2 and
Figure 3, the reliability analysis method for CFST arch bridge proposed in this paper can be implemented based on MATLAB platform programming.
5. Symmetrical reliability theory
The inverse problem of structural reliability analysis as follows:
Using the Taylor expansion, the reliability index at the point can be expressed as:
where,
K is the design parameter,
j was the iteration times.
The iterative formula for the design parameter (such as the safety factor, the deterministic design value) can be expressed as:
Where, the index reliability index could use the PSO algorithm.
In order to achieve the iteration results for the design parameter. The convergence criterion is as follows:
So, the deterministic value such as the safety factor or arch bridges, could use the symmetrical reliability theory to assess the safety performance of the long span arch bridges, using the POS algorithm to calculate the forward reliability index and using the safety factors could be use the inverse reliability theory.
6. Probabilistic safety factors of arch bridges
The performance function is
where

was the basic random variable.
The limit state function of arch bridges can be expressed as:
where,
K was the safety factor of arch bridges,
Mr and
Ms were resistance and action effect, respectively.
7. Example validation
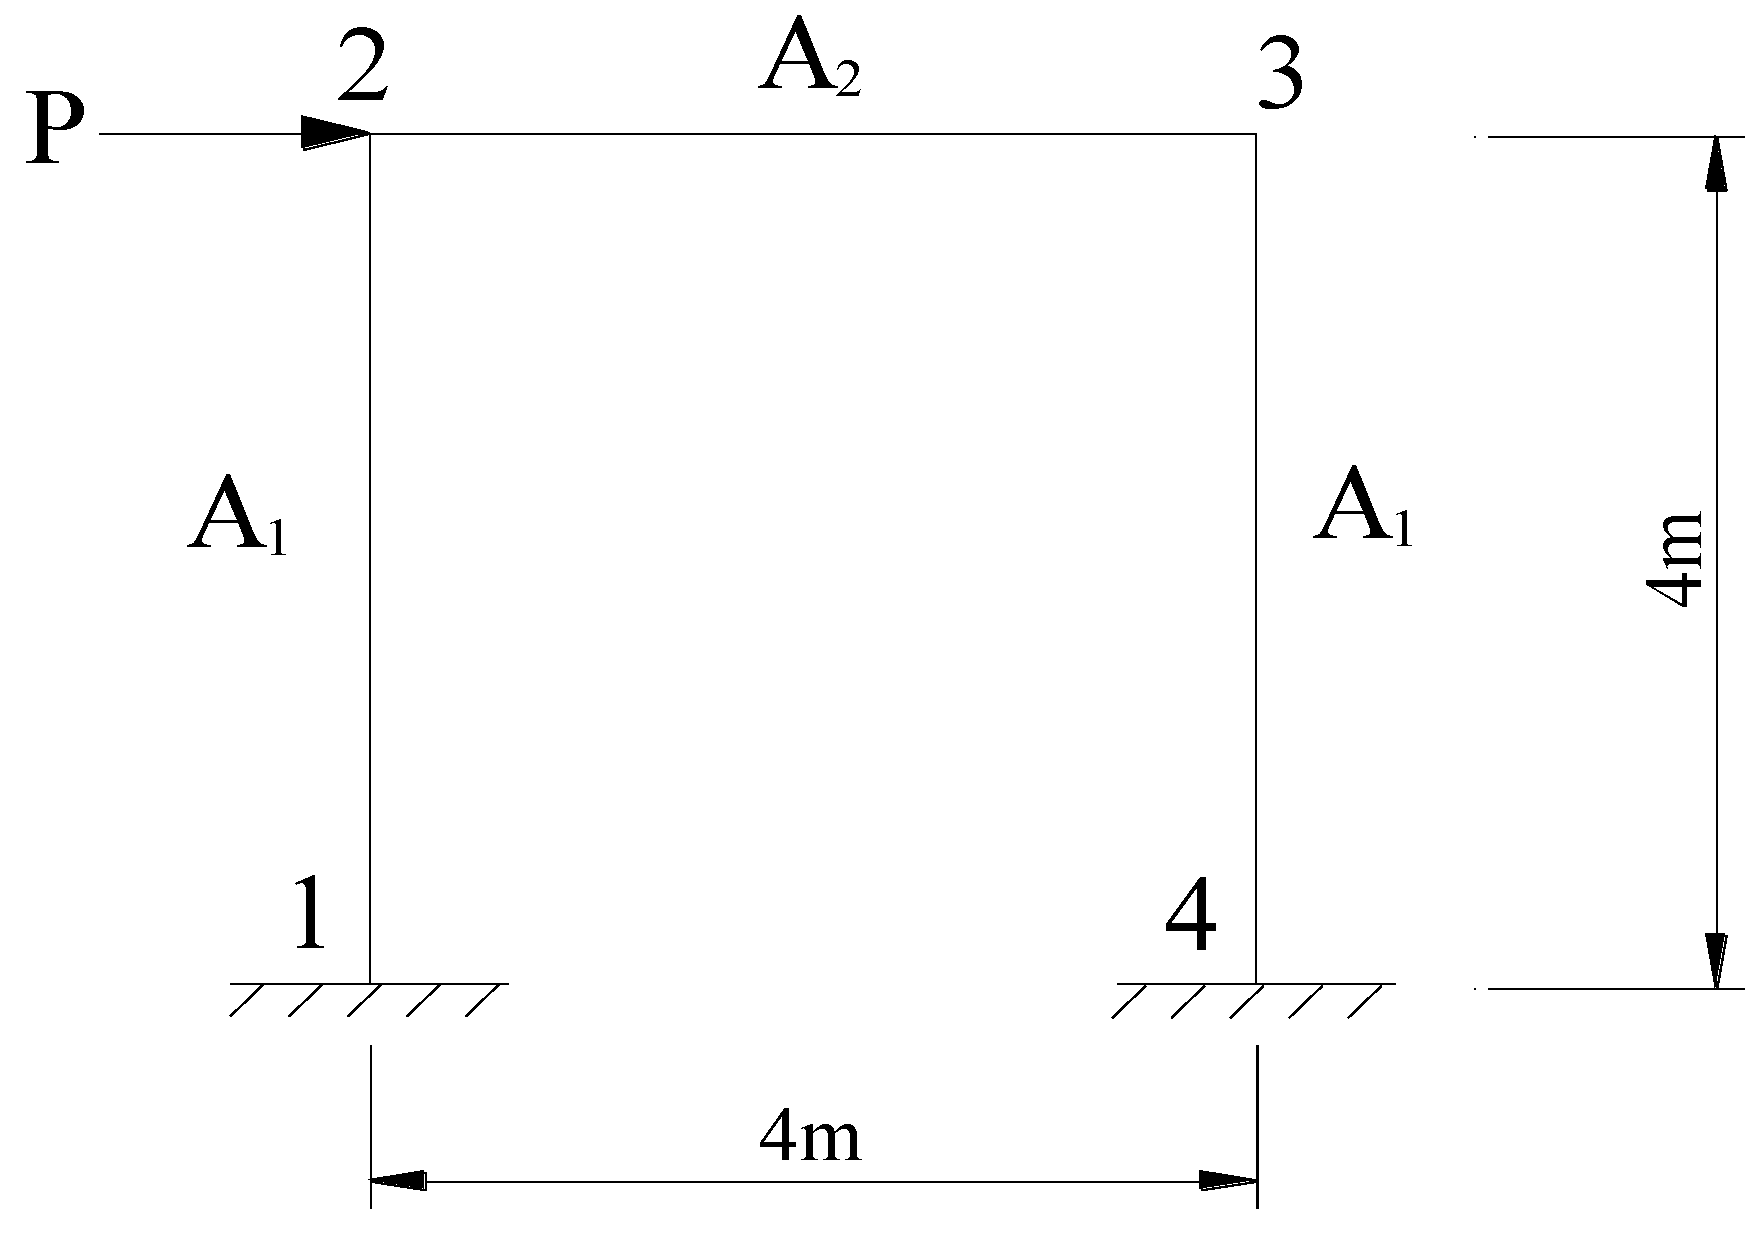
The example is a framework structure, shown in
Figure 4. Structural limit state equation is
.
represents the horizontal displacement of vertex 3, depending on three basic random variables, namely the cross-sectional area of column and beam
(obey log-normal distribution) and load
(obey extreme type I distribution), whose average value and standard deviation are
,
;
,
;
,
; elastic modulus is
, beam and column moment of inertia are
and
respectively.
There are two training sample collection methods. One randomly generates 100 training samples according to the distribution law. For example [
12], BP neural network with 3 units of input layer, implied layer and 1 unit of output layer, obtaining relatively reliability index, and the other uses the uniform design method to take 15 samples based on the uniform design table
of 3-factor and 5 levels. In the second method, we also obtained a more reliable reliability index. The results are shown in
Table 1. According to the data analysis about
Table 1, the calculation result of reliability analysis by the method presented here in the framework structure is accurate and reliability, and the calculation accuracy can well meet the engineering requirements.
In order to conduct the effectiveness and accuracy of the proposed approach related to the safety factor of arch bridges, the deterministic value about the framework structure can be use the allowance displacement as follows,
To determine the maximum allowable displacement of node 3
, it can be used as a design parameter, the corresponding target reliability index is taken as
(the probability of failure is
). The initial iteration value of the design parameters is taken, and the convergence error is taken as 0.0001. For simplicity, the partial derivatives of the limit state function for random variables can be calculated using finite difference method and deterministic calculation method. The calculation results of design parameters are shown in
Table 2. From the analysis in
Table 2, it can be seen that the analysis results of calculating the maximum allowable displacement of node 3 using the reliability back analysis method recommended in this article are accurate and reliable, and can meet the requirements of engineering applications.
8. Engineering application and analysis
8.1. Project Overview
The Shimen Bridge is a special bridge across the National Highway 319 and the Shimen Reservoir, its facade layout is arranged in
Figure 5.The structure type of the main bridge is a medium-bearing CFST truss arch bridge, using transverse double boom system, the calculated span is 248m,vector span ratio of 1/4, arch axis is
cantilever line. The boom is drawn by
cable(
steel stranded) with longitudinal spacing of 10m.The beam is connected with the arch rib by the boom and column. The height of the beam is 2.2m.The bridge deck system adopts longitudinal "T" type running lane beam, forming a longitudinal and transverse orthogonal beam lattice system, and the span is constantly open. The arch foundation adopts the combined base of expanded foundation and base pile.
8.2. Serviceability limit state
Structural geometry nonlinearity is obvious in the long-span bridge, which has a great effect on the structure effect, and often cannot be ignored in the calculation and analysis of the structure. In order to explore the effect of geometric nonlinearity on the reliability of long-span CFST arch bridge in normal use, two models were built by using finite element software , without considering and considering geometric nonlinearity respectively, and expressed by model 1 and 2.In the finite element model, the CFST structure is simulated through by means of common units of nodes, and the boom selected units, the rest structures were established using units.
Considering that the failure mode in the normal use state of the structure is the displacement failure mode, the limit state equation is established from the perspective of the displacement limit criterion, so the structure limit state function can be expressed as:
In formula: is the maximum vertical allowable displacement of the arch bridge as specified in the specification for live load, its value is L/1000=248/1000=0.248m; are random variables for the structure.
The primary random variables affecting the failure pattern of the structure and their basic statistical parameters are shown in
Table 2.
8.3. Reliability analysis
Since the structure involves a total of 10 random variables, the DPS system was used to generate the
uniform design table and then obtain 100 input samples. The finite element model was established separately according to the input samples, and the output samples were obtained by deterministic finite element analysis. The number of structural hidden layer neurons was determined as 11, a three-layer BP neural network of 11-11-1 was established, and the normalized samples were replaced into the neural network for learning, then the display limit state function was obtained according to the method of reference[
12], and finally, the PSO algorithm was used to solve the reliability index in the two cases respectively.
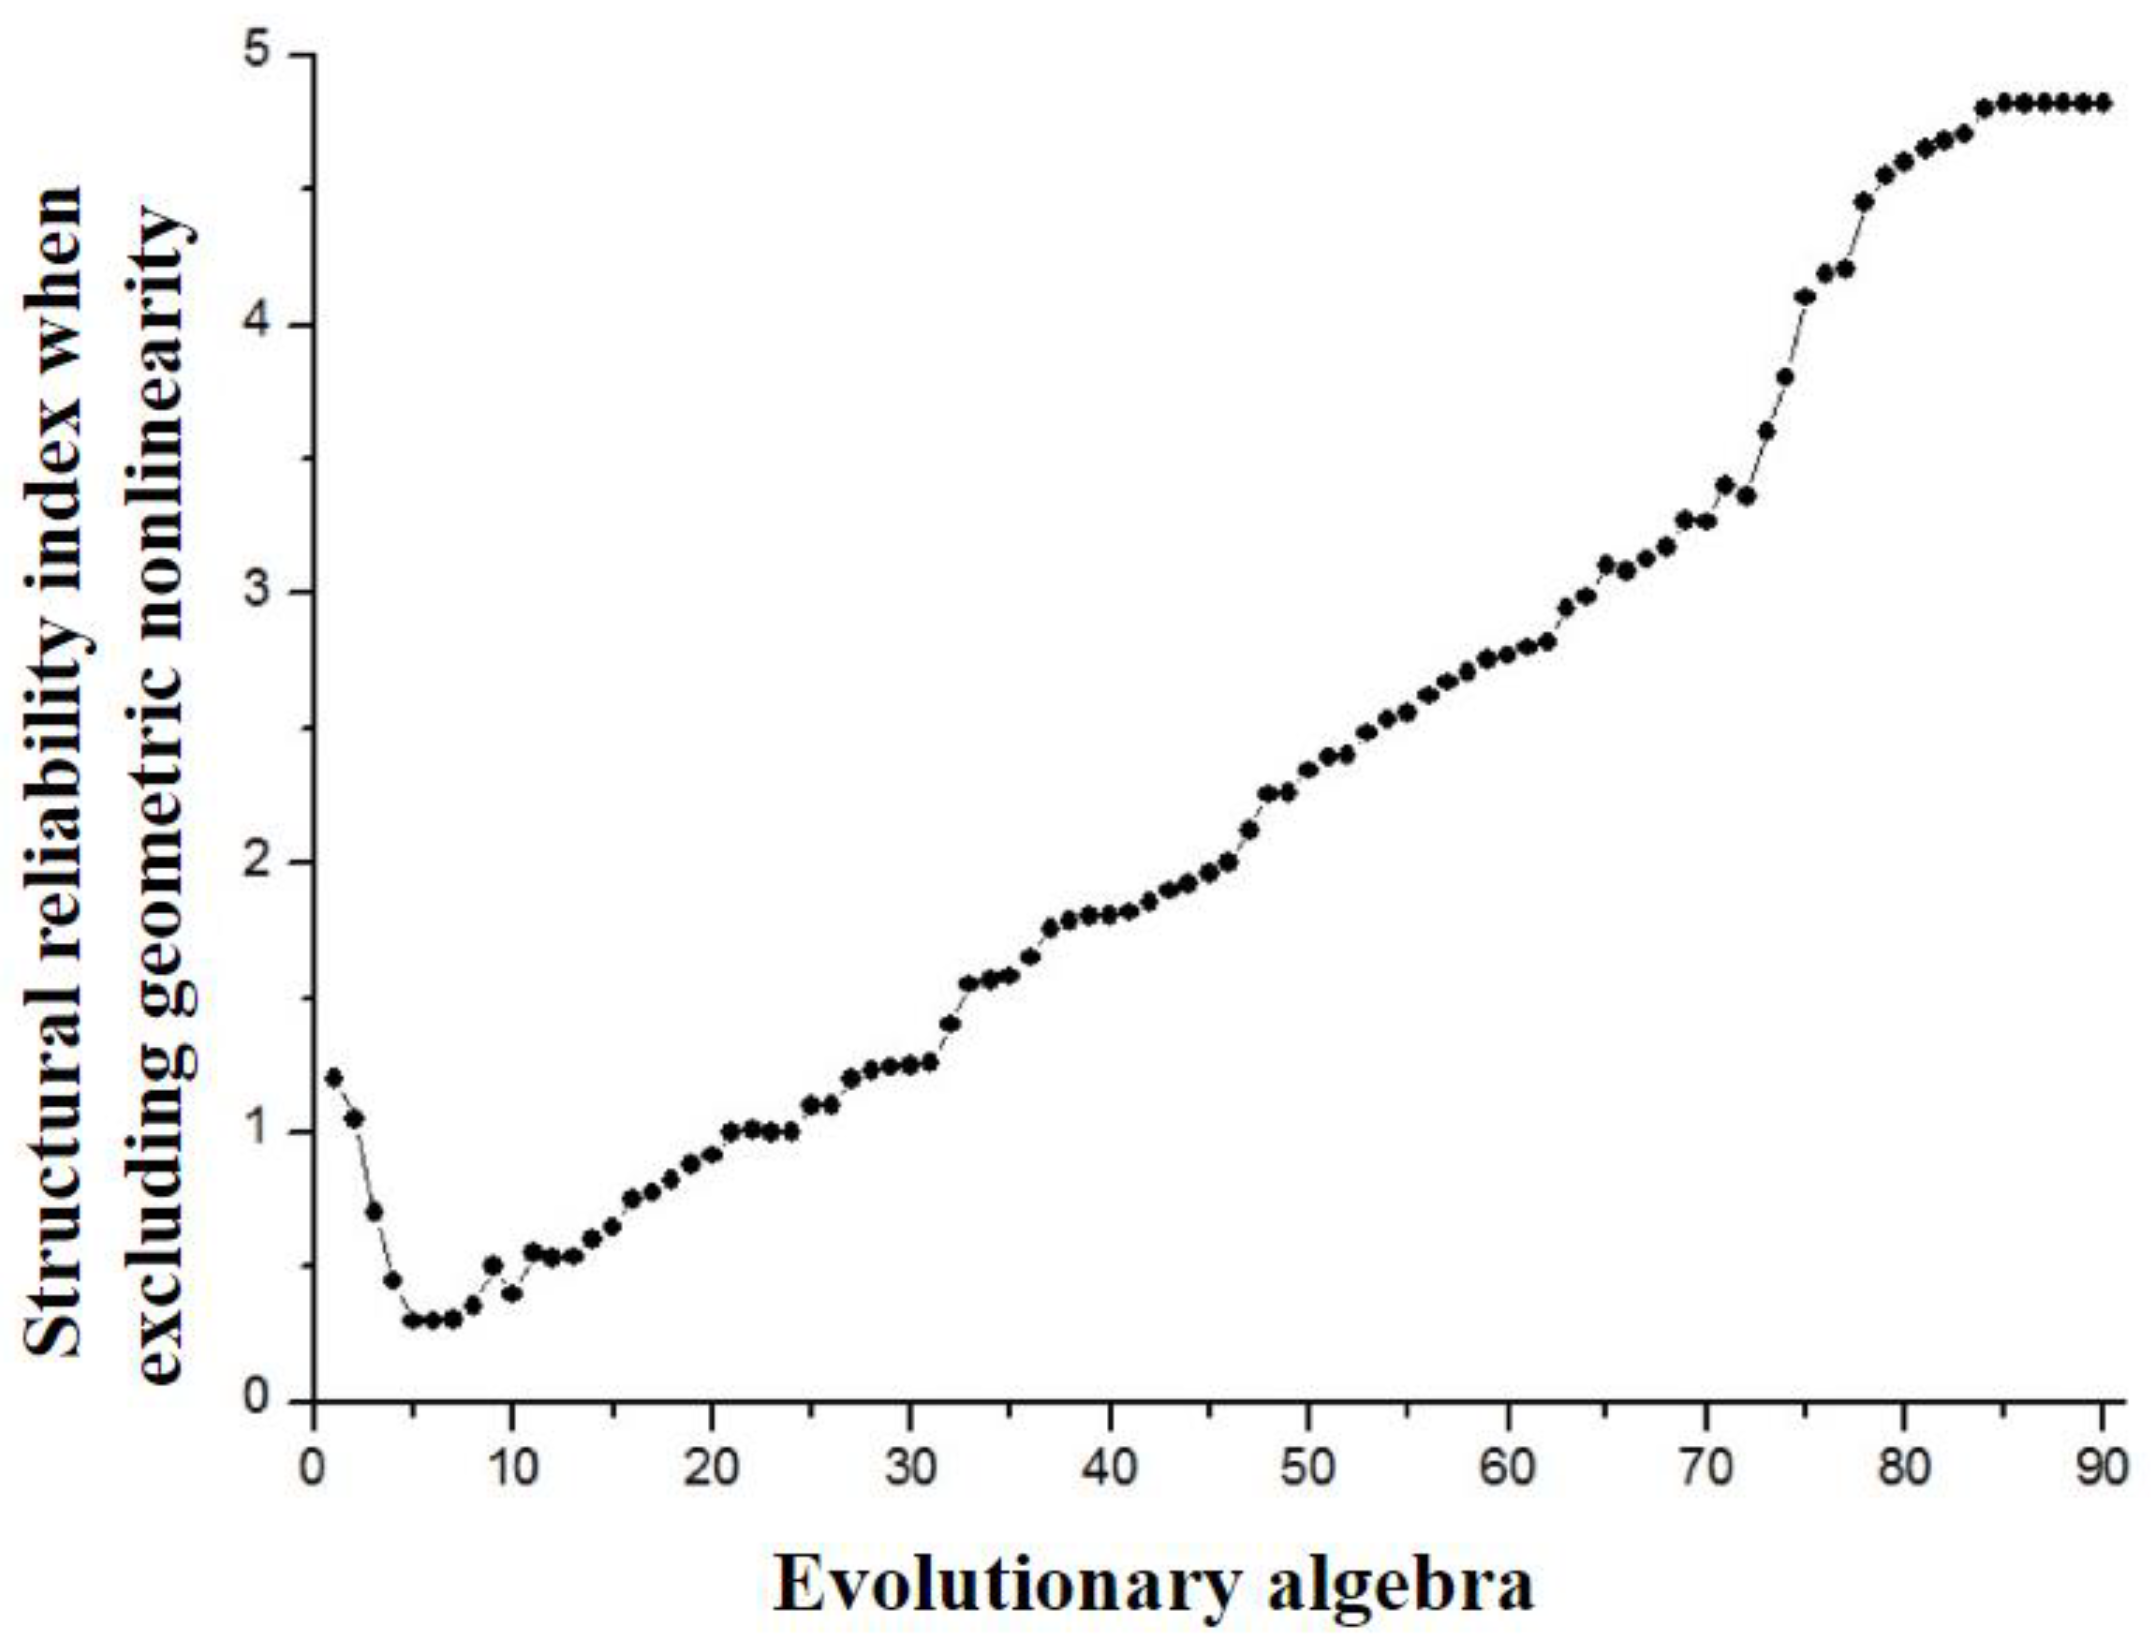
The variation of structural reliability index with evolutionary algebra when excluding geometric nonlinearity is shown in
Figure 6.
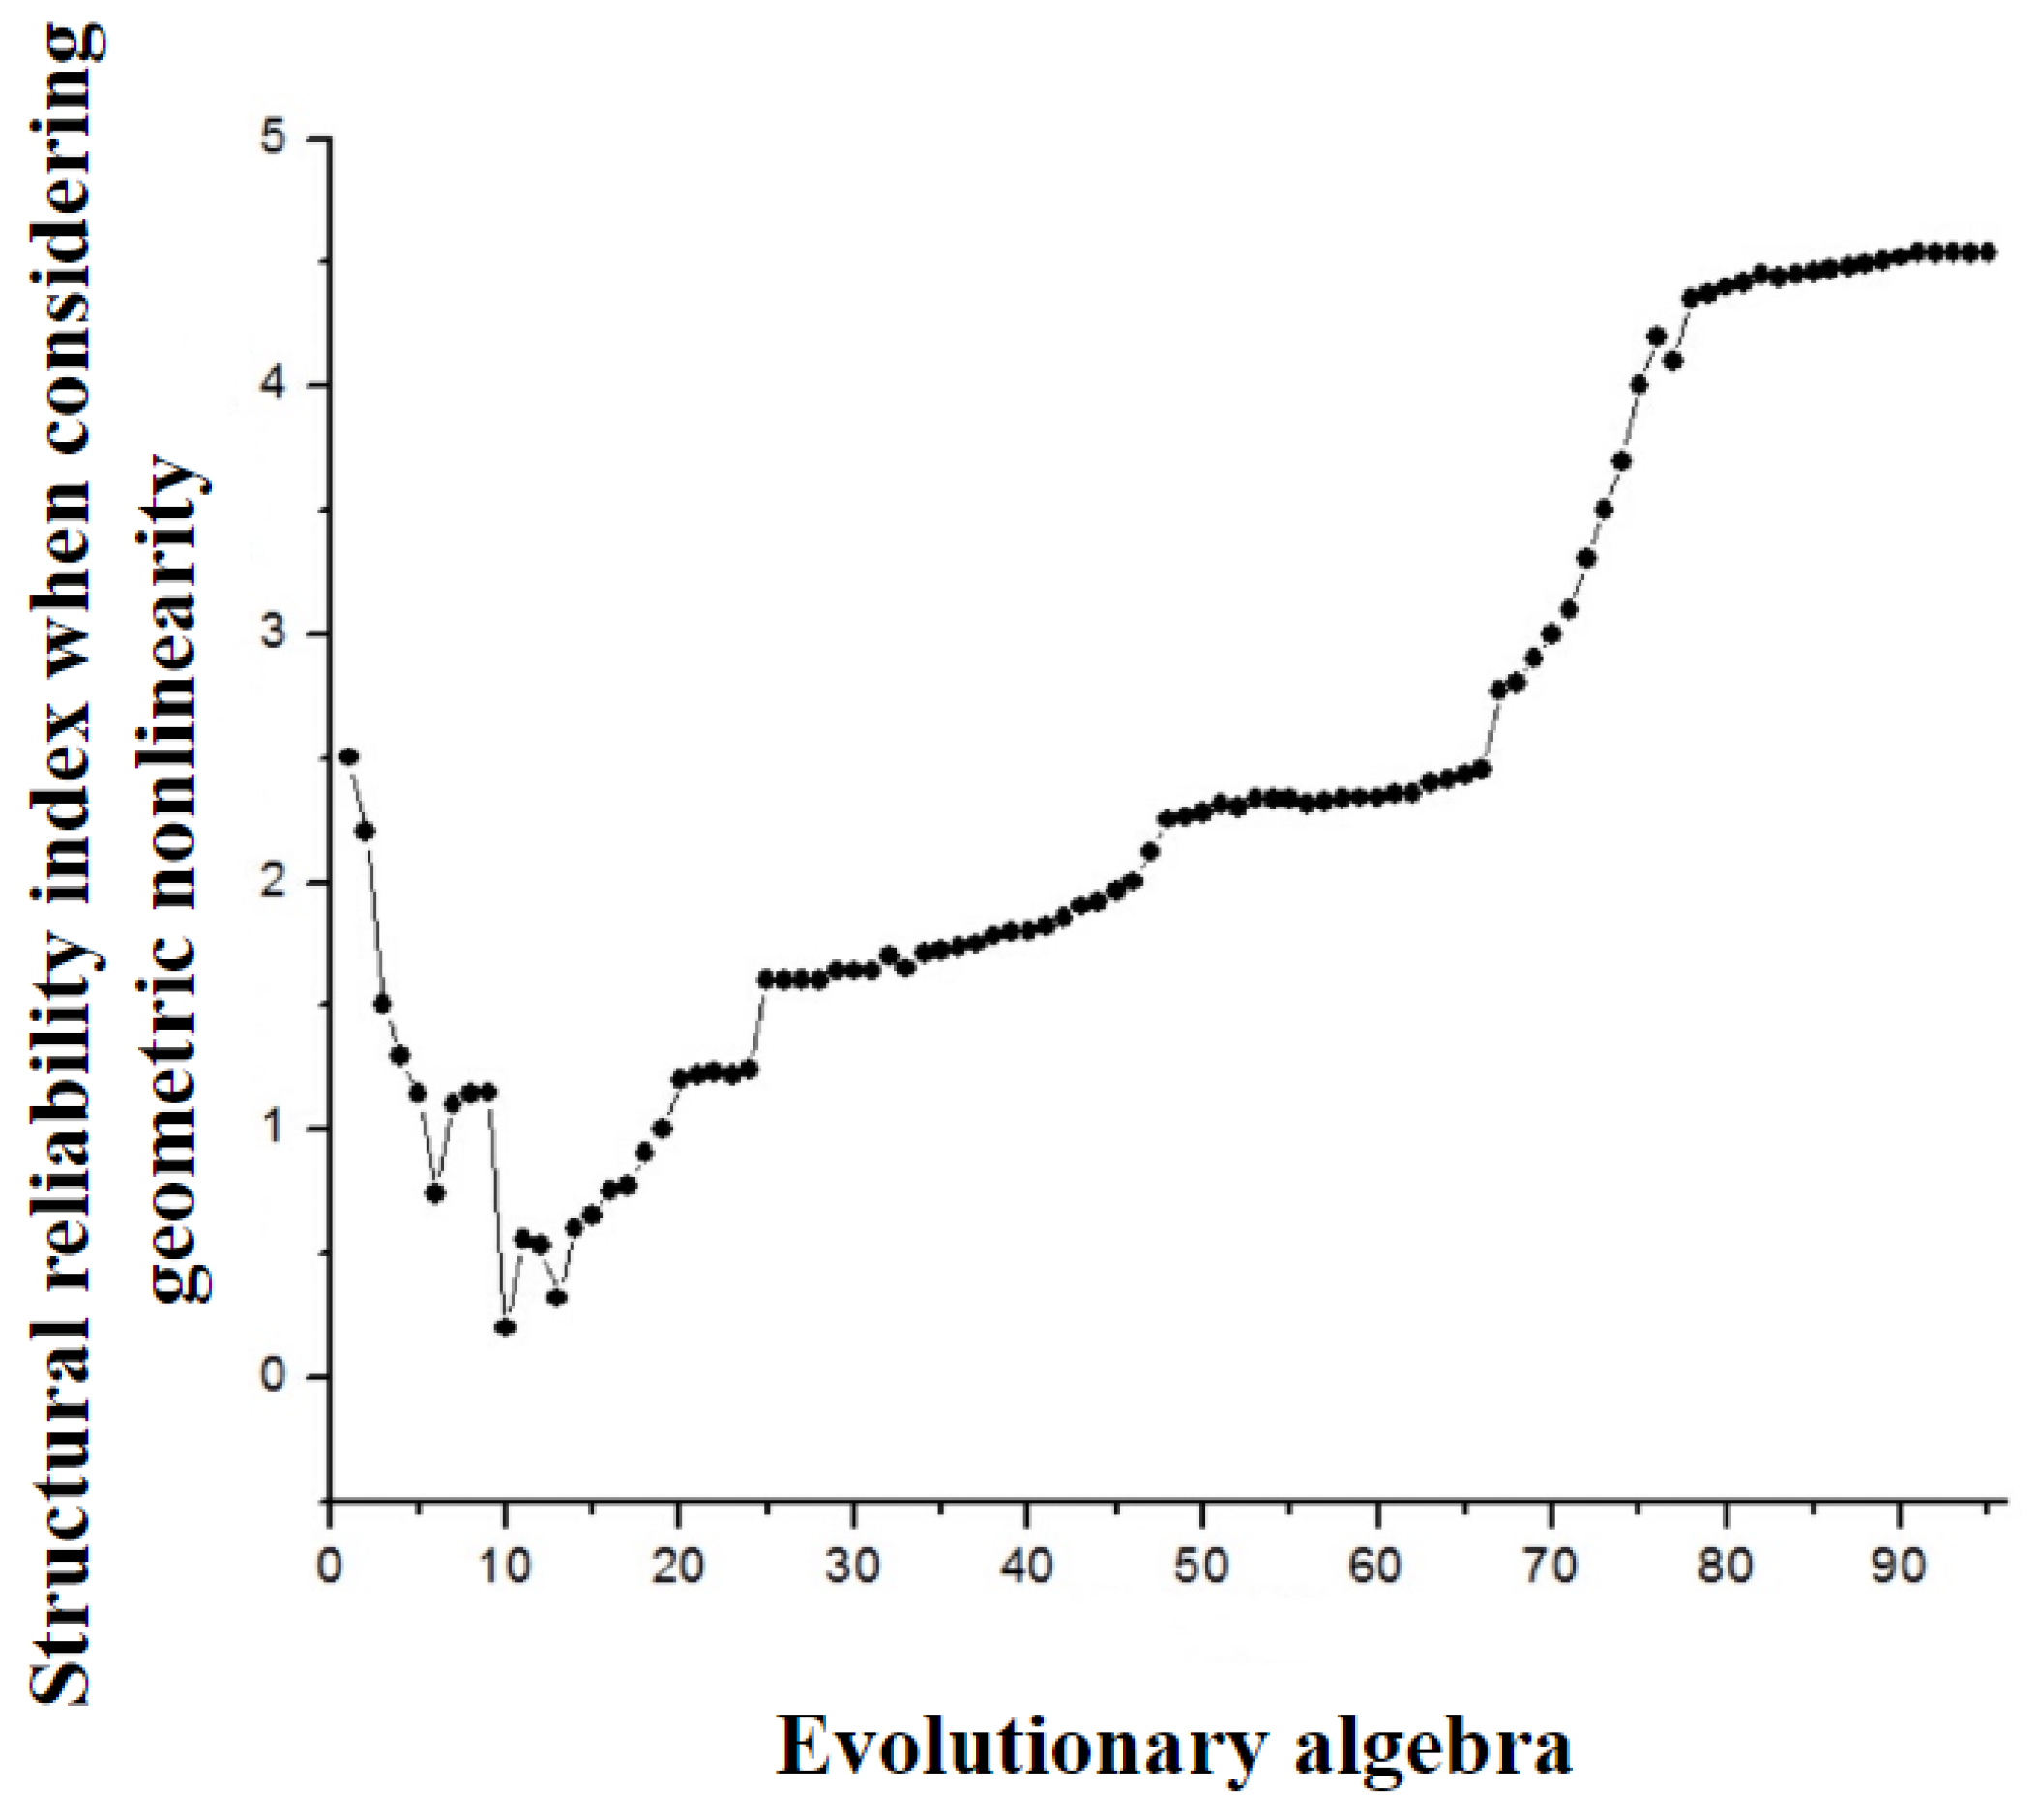
When considering geometric nonlinearity, the variation of structural reliability index with evolutionary algebra is shown in
Figure 7.
As is shown from
Figure 6 and
Figure 7,excluding geometric nonlinearity, the structural reliability index has stabilized after 85 generations of evolution, the corresponding reliability index shows
, failure probability at this time is
; when the geometric nonlinearity is considered, the structural reliability index stabilizes after 92 generations of evolution, and the corresponding reliability index shows
, the failure probability shows
.
The results show that the reliability of long-span CFST arch bridge is reduced by 6.15% without considering the geometric nonlinearity. Therefore, when calculating the reliability of the structure, if the accuracy requirement is relatively high, we must consider the geometric nonlinearity of the structure.
In addition, when calculating the bearing capacity of long-span CFST arch bridge, the influence of material nonlinearity on the strength plays the main role, and geometric nonlinearity has little influence on the bearing capacity of CFST arch bridge [
13].The reliability index in the carrying capacity limit state of the bridge is also calculated by the method of this article, excluding geometric nonlinearity of this case, the corresponding reliability index shows
, when considering the geometric nonlinearity, the corresponding reliability index shows
, the difference is just 0.59%.Therefore, the influence of geometric nonlinearity can be ignored in the reliability analysis about the carrying capacity of CFST arch bridges.
8.4. Ultimate limit state
The stability design method of steel tube concrete arch based on reliability back analysis essentially uses reliability back analysis to solve the stability safety factor of the arch under the premise of given target reliability indicators. The limit state design expression is:
When the target reliability index of the arch bridge is set to 3.5, the stability safety factor of the arch bridge calculated using the safety factor evaluation method based on reliability back analysis proposed in this article is 3.2124. The stability safety coefficient of the arch bridge calculated based on the deterministic model is 3.5316. Comparing the reliability back analysis method with the stability safety factor of arch bridges calculated based on deterministic models, it can be concluded that the stability safety factor of arch bridges calculated using reliability back analysis method is significantly smaller than that calculated based on deterministic models, indicating that parameter uncertainty has a significant impact on the stability safety factor of arch bridges, If parameter uncertainty is ignored during calculation, the stability safety factor of large-span arch bridges will be overestimated, which may lead to the structure being unsafe.
The evaluation of arch bridge stability safety coefficient based on reliability back analysis is to reverse calculate the arch bridge stability safety coefficient at a certain level of reliability. There is a corresponding relationship between the target reliability index and the arch bridge stability safety coefficient. Therefore, it is necessary to study the impact of the target reliability index on the arch bridge stability safety coefficient and the qualitative relationship between them. In order to study the impact of target reliability indicators on the stability safety coefficient of arch bridges, target reliability indicators were taken as 2.5, 3.0, 3.5, and 4.0, respectively. The specific calculation results of the stability safety coefficient of arch bridges are shown in
Table 3.
From the analysis in
Table 3, the stability safety coefficient of the arch bridge shows a decreasing trend with the target reliability index increases. This indicates that as the target reliability index increases, the stability safety coefficient of the arch bridge gradually decreases, the actual required stability performance of the arch bridge gradually increases, and the safety reserve for the stability of the arch bridge gradually decreases; The stability safety coefficients of arch bridges calculated based on the reliability back analysis method under each target reliability index are all lower than those calculated based on the deterministic model, indicating that parameter uncertainty has a significant impact on the stability safety coefficient of arch bridges. Ignoring parameter uncertainty will overestimate the stability safety coefficient of arch bridges.
9. Conclusion
Based on the current situation of structural reliability research, the BP neural network and PSO algorithm are applied to the reliability analysis of CFST arch bridges, the reliability in the normal use limit state of CFST arch bridges is studied, and the following conclusions are obtained:
- (1)
BP neural networks have obvious advantages in reconstructing structural limit state functions. Even with high nonlinearities in the structural limit state function, BP neural network can accurately approximate this mapping relationship, which greatly improves the accuracy of the conventional response surface method.
- (2)
The powerful extra-value optimization function of PSO algorithm can adapt well to the problem of reliability index of complex structure. The results show that the reliability index calculated by the PSO algorithm is very close to the exact Monte Carlo method, and the error is much lower than the conventional JC method.
- (3)
The reliability analysis results of the long-span CFST arch bridge based on BP neural network and PSO algorithm show that, in the normal use limit state, geometric nonlinearity has a great impact on the reliability, and geometric nonlinear effect must be included in the accurate reliability analysis; in the carrying capacity limit state, geometric nonlinearity has little influence on reliability, and the influence of geometric nonlinearity cannot be considered in reliability analysis and design.
- (4)
The randomness of parameters has a significant impact on the reliability index and safety factor of CFST arch bridges, and ignoring the randomness of parameters may lead to the stability of the structure being biased towards insecurity. In the actual engineering of large-span CFST arch bridges, the randomness of parameters can be controlled in a targeted manner to ensure the safety of large-span CFST arch bridges.
Author Contributions
Data curation, X.Z.; Formal analysis, X.Z. and D.F.; Investigation, D.F. and X.Z.; Methodology, D.F. and Z.Z.; Writing—Original draft, X.Z.; Writing—Review and editing, D.F.. All authors have read and agreed to the published version of the manuscript.
Funding
The Natural Science Foundation of Jiangsu Province (Grant No. BK20200793) and the Natural Science Foundation of the Jiangsu Higher Education Institutions of China (Grant No. 19KJB560017).
Data Availability Statement
The data used to support the findings of this study are available from the corresponding author upon request.
Acknowledgments
The authors wish to express their sincere thanks to the Natural Science Foundation of Jiangsu Province (Grant No. BK20200793) and the Natural Science Foundation of the Jiangsu Higher Education Institutions of China (Grant No. 19KJB560017) for their financial support. Furthermore, they also want to express great thanks to the researchers of the Civil Engineering Laboratory at Nanjing Forestry University for their support during this research program.
Conflicts of Interest
The authors declare no conflict of interest.
References
- Gui Jinsong, Kang Haigui. A Global Response Face Method for Structural Reliability Analysis [J]. Journal of Architectural Architecture, 2004 (04): 100-105. [CrossRef]
- Dong Cong, Liu Xila. Reliability theory of nonlinear structure systems and its simulation algorithm [J]. Civil Engineering Journal, 1998 (01): 33-43.
- Gong Jinxin. A new iterative method for solving structure-reliable indicators [J]. Computational Structural Mechanics and Its Applications, 1995 (03): 369-373.
- Rumelhart D.E., Hinton G.E. and Williams R.J. Learning Internal Representation by Error Propagation. Parallel Distributed Processing, 1984 (1): 348-362.
- Gong Chun collar. Risk Analysis and Countermeasures of of-span cable-stayed Bridge [D]. Tongji University, 2006.
- Fang Kaitai, Ma Changxing. Orthogonal and uniform experimental design [M]. Beijing: Science Press, 2001.
- Su Hong. Analysis method of long-span suspension bridge structure reliability [D]. Shanghai: School of Civil Engineering, Tongji University, 2009.
- Yang Yan, Jin Fan, Kamel M. Current research status and progress of microparticle group optimization algorithm [J]. Computer Engineering, 2004,30 (21): 3-9. [CrossRef]
- Ratnaweera A, Halgamuge S K, Watson H C. Self-organizing hierarchical particle swarm optimizer with time-varying acceleration coefficients[C]. IEEE Trans on Evolutionary Computation, 2004,8(3):240-255. [CrossRef]
- Liang Jun, Cheng Can. Improved particle swarm optimization algorithm [J]. Computer Engineering and Design, 2008,29 (11): 2893-2896.
- Zhang Jianren, Liu Yang, Xu Fuyou. Structural Reliability Theory and Its Application in Bridge Engineering [M]. Beijing: People’s Communications Publishing House, 2003.
- Su Hong, Cheng Jin. Application of Neural Network Technology in the Reliability Analysis of Prestressed Concrete Bridge [J]. Structural Engineer, 2009,25 (2): 71-76. [CrossRef]
- Feng Longcheng, Luo Xiaohua. Nonlinear analysis of the ultimate bearing capacity in the reinforced concrete arch bridge deck [J]. Journal of Civil Engineering, 2002,35 (3): 20-24. [CrossRef]
|
Disclaimer/Publisher’s Note: The statements, opinions and data contained in all publications are solely those of the individual author(s) and contributor(s) and not of MDPI and/or the editor(s). MDPI and/or the editor(s) disclaim responsibility for any injury to people or property resulting from any ideas, methods, instructions or products referred to in the content. |
© 2023 by the authors. Licensee MDPI, Basel, Switzerland. This article is an open access article distributed under the terms and conditions of the Creative Commons Attribution (CC BY) license (https://creativecommons.org/licenses/by/4.0/).


 was the basic random variable.
