1. Introduction
One of the main challenges for the air transportation industry is to reduce the CO2, gas emissions and noise levels produced by aircrafts. For that purpose, one of the most innovative technologies that is being considered is related to breakthroughs in propulsion systems. New configurations such as the Counter-Rotating Open Rotor (CROR) and the Ultra High Bypass Ratio (UHBR) are destined to bring these benefits. These new engines are more efficient but also bigger, so it is necessary to readapt other components of the aircraft so that they can be installed. One of these components are the heat exchangers.
Among other issues, the heat exchangers need to be inspected carefully since they are subjected to harsh conditions. In this context, it is highly relevant to gain knowledge on the deterioration and the predominant damage mechanisms of these components [
1,
2]. Multiphysics and multilevel simulation tools are being considered where damage laws are integrated to reliably predict heat exchangers behavior. One of the relevant aspects in the validation process of these simulations is to have tools that identify damage at an early stage. In this manner, the simulation suitability in the design process is verified. Failures as leakage may cause undesirable damages that need to be avoided. Therefore, inspection systems are of crucial importance for these components. One of the major challenges these components impose to the inspection systems is the need to identify defects that may appear in the inner side of the heat exchanger. That is, in difficult to access areas. Besides, these systems must also withstand harsh conditions such and high temperatures because defects are to be detected in operation [
3,
4].
The heat exchangers are composed of a periodically brazed structure of plates and fins. The thickness of the plates and fins are 0.5mm and 0.05-0.25mm, respectively. The shape of the fins is rectangular in order to withstand the internal pressure and increase the heat transfer surface area. Heat exchangers must withstand a maximum temperature of 850 ◦C, a maximum pressure of 5 MPa, and the cyclic thermal stresses caused by the temperature variation during operation. The materials used for the heat exchanger manufacturing are materials with high temperature resistance and good corrosion performance such as Ni alloys and stainless steels. One of the critical stages of their manufacturing is the brazing of plates and fins. Large number of fin-plate joints can be found in a conventional heat exchanger. For this reason, is essential to guarantee the strength and reliability of these joints [
5,
6,
7,
8]. Many efforts have been focused on detect and identify the defects that appear in these brazed joints since they are critical for a proper heat exchanger performance during operation [
9,
10].
It is important to consider the main requirements for the inspection of the heat exchanger. This formed the basis to select the most suitable technologies that meet these requirements. In this context, damage initiation will be defined as a permanent loss of integrity that will reduce heat exchangers capacity to withstand loads and thus, this will lead the part to failure after some cycles. The sooner this damage is identified the better, because this gives wider margin-in terms of number of cycles to failure-to the sample before it fails. Therefore, experimental techniques capable of early identifying damage are crucial. By damage, any defect that jeopardizes structures integrity (such as cracks, debonding etc.) are considered as such. Within the scope of this work, the target defects are the following: fins breaking or fins debonding. One of the major challenges these target defects imposes are the need to identify defects that may not be visible. That is, ruptures that may occur in the inner side of the heat exchanger and this won´t be able to be detected by imaging systems, for instance. Another requirement relates to the need to identify the defects once they occur so that early detection is ensured. This requires systems with real-time measurement capability. In addition to that, the system should withstand high temperature operations as a result of the hot heat flow. This limits the use of monitoring systems to non-contact methods or at least methods capable of withstanding high temperature for long periods of time.
With respect to the literature, non-destructive testing has been in practice for long time. Techniques such as Eddy Current has been used in heat exchanger tubes in industrial pressure vessels for periodic inspections. Some authors [
11] used it to identify circumferential cracks during maintenance inspection with good results. Remote visual inspection by videoscope is another common practice. In this case, at the tip of the videoscope there is an small chip that can be introduced inside difficult to access areas. Images are sent to a screen where an inspector may identify the presence of defects. When it comes to aircraft heat exchangers, instead of tubes, the structures are sandwich structures like, composed of an alternating stack of layers in which respectively pass the hot air flow (hot fins) and the cold air flow (cold fins). The spacing among the fins may be as tight as some few millimeters. This will normally be smaller than the smallest videoscope tip diameter making the inspection of these components difficult. In relation to Eddy Current testin , this inspection is performed during maintenance periods while the component is out of operation.
During the last years some innovative techniques have irrupted into the aerospace industry and some of them are already being employed in certain application [
12]. When it comes to aircraft heat exchanger inspection technologies such as X-ray Computed Tomography or Active Thermography are being studied. In the case of X-ray, this is difficult to be implemented during a heat exchanger fatigue testing whereas Active Thermography only provides surface damage related information. In this work, two complementary technologies, Digital Image Correlation and Acoustic Emission. were employed to face the challenge of detecting damage in complex structures while these are being tested with the goal of better understanding the mechanical failure mechanism of the heat exchangers investigated and providing insight for the future simulations of these phenomena. Both technologies have capabilities to be implemented in high temperature applications [
13,
14] due to their non-contact nature, but for the sake of simplicity the temperature variable was not introduced in these tests. Regarding techniques, acoustic emission was employed by introducing optical microphones. Being a non-contact measurement method, this can be positioned in the vicinity of the heat exchanger. The underlying physical phenomenon is based on the acoustic wave emitted after a surface breaking effect. Part of the released energy is transmitted through the air as a pressure change. And this is identified by the microphone. Even hidden ruptures could be detected provided that the distance and the resulting sound attenuation are low enough to capture sufficient signal level [
15].Within a conventional approach structure borne methods such as the piezoelectric are commonly employed, however, in this particular case and considering the complex geometry of the part (it has to highlight that fins thickness is as low as 100 um making the installation of AE sensors impossible),contact methods can not be applied. Air-coupled membrane free microphones from XARION were employed instead. On the other hand, Digital Image Correlation (DIC) is an image based system that compares consecutive images painted with an stochastic pattern and defines the displacement field as well as the strain field that the component underwent. In spite of being a surface based measurement (that is, no inner phenomenon may be captured), it allows measuring local strains unlike conventional extensometers. In this case, strain redistributions may be measured which are considered as signs of damage. As a result, it was identified that AE served as early damage indicator as the cumulative number of events was in good agreement with the severity of the damage. With respect to classification two clear clusters ascribed to different type of events were identified. In the case of DIC, strain redistributions gave clear indications of damage or deterioration but at a later stage compared to AE.
2. Materials and Methods
2.1. Samples and Fatigue testing
The selected samples represented part of the core of the heat exchanger. As stated in the introduction, the core is composed of an alternating stack of layers in which respectively pass the hot air flow (hot fins) and the cold air flow (cold fins). To ensure the tightness between these layers, they are separated by parting sheets. Unlike in standard heat exchangers these samples do not include the closure bar, and therefore not all the failure modes can be simulated Nonetheless, fins breaking and debonding was replicated without any inconvenience.
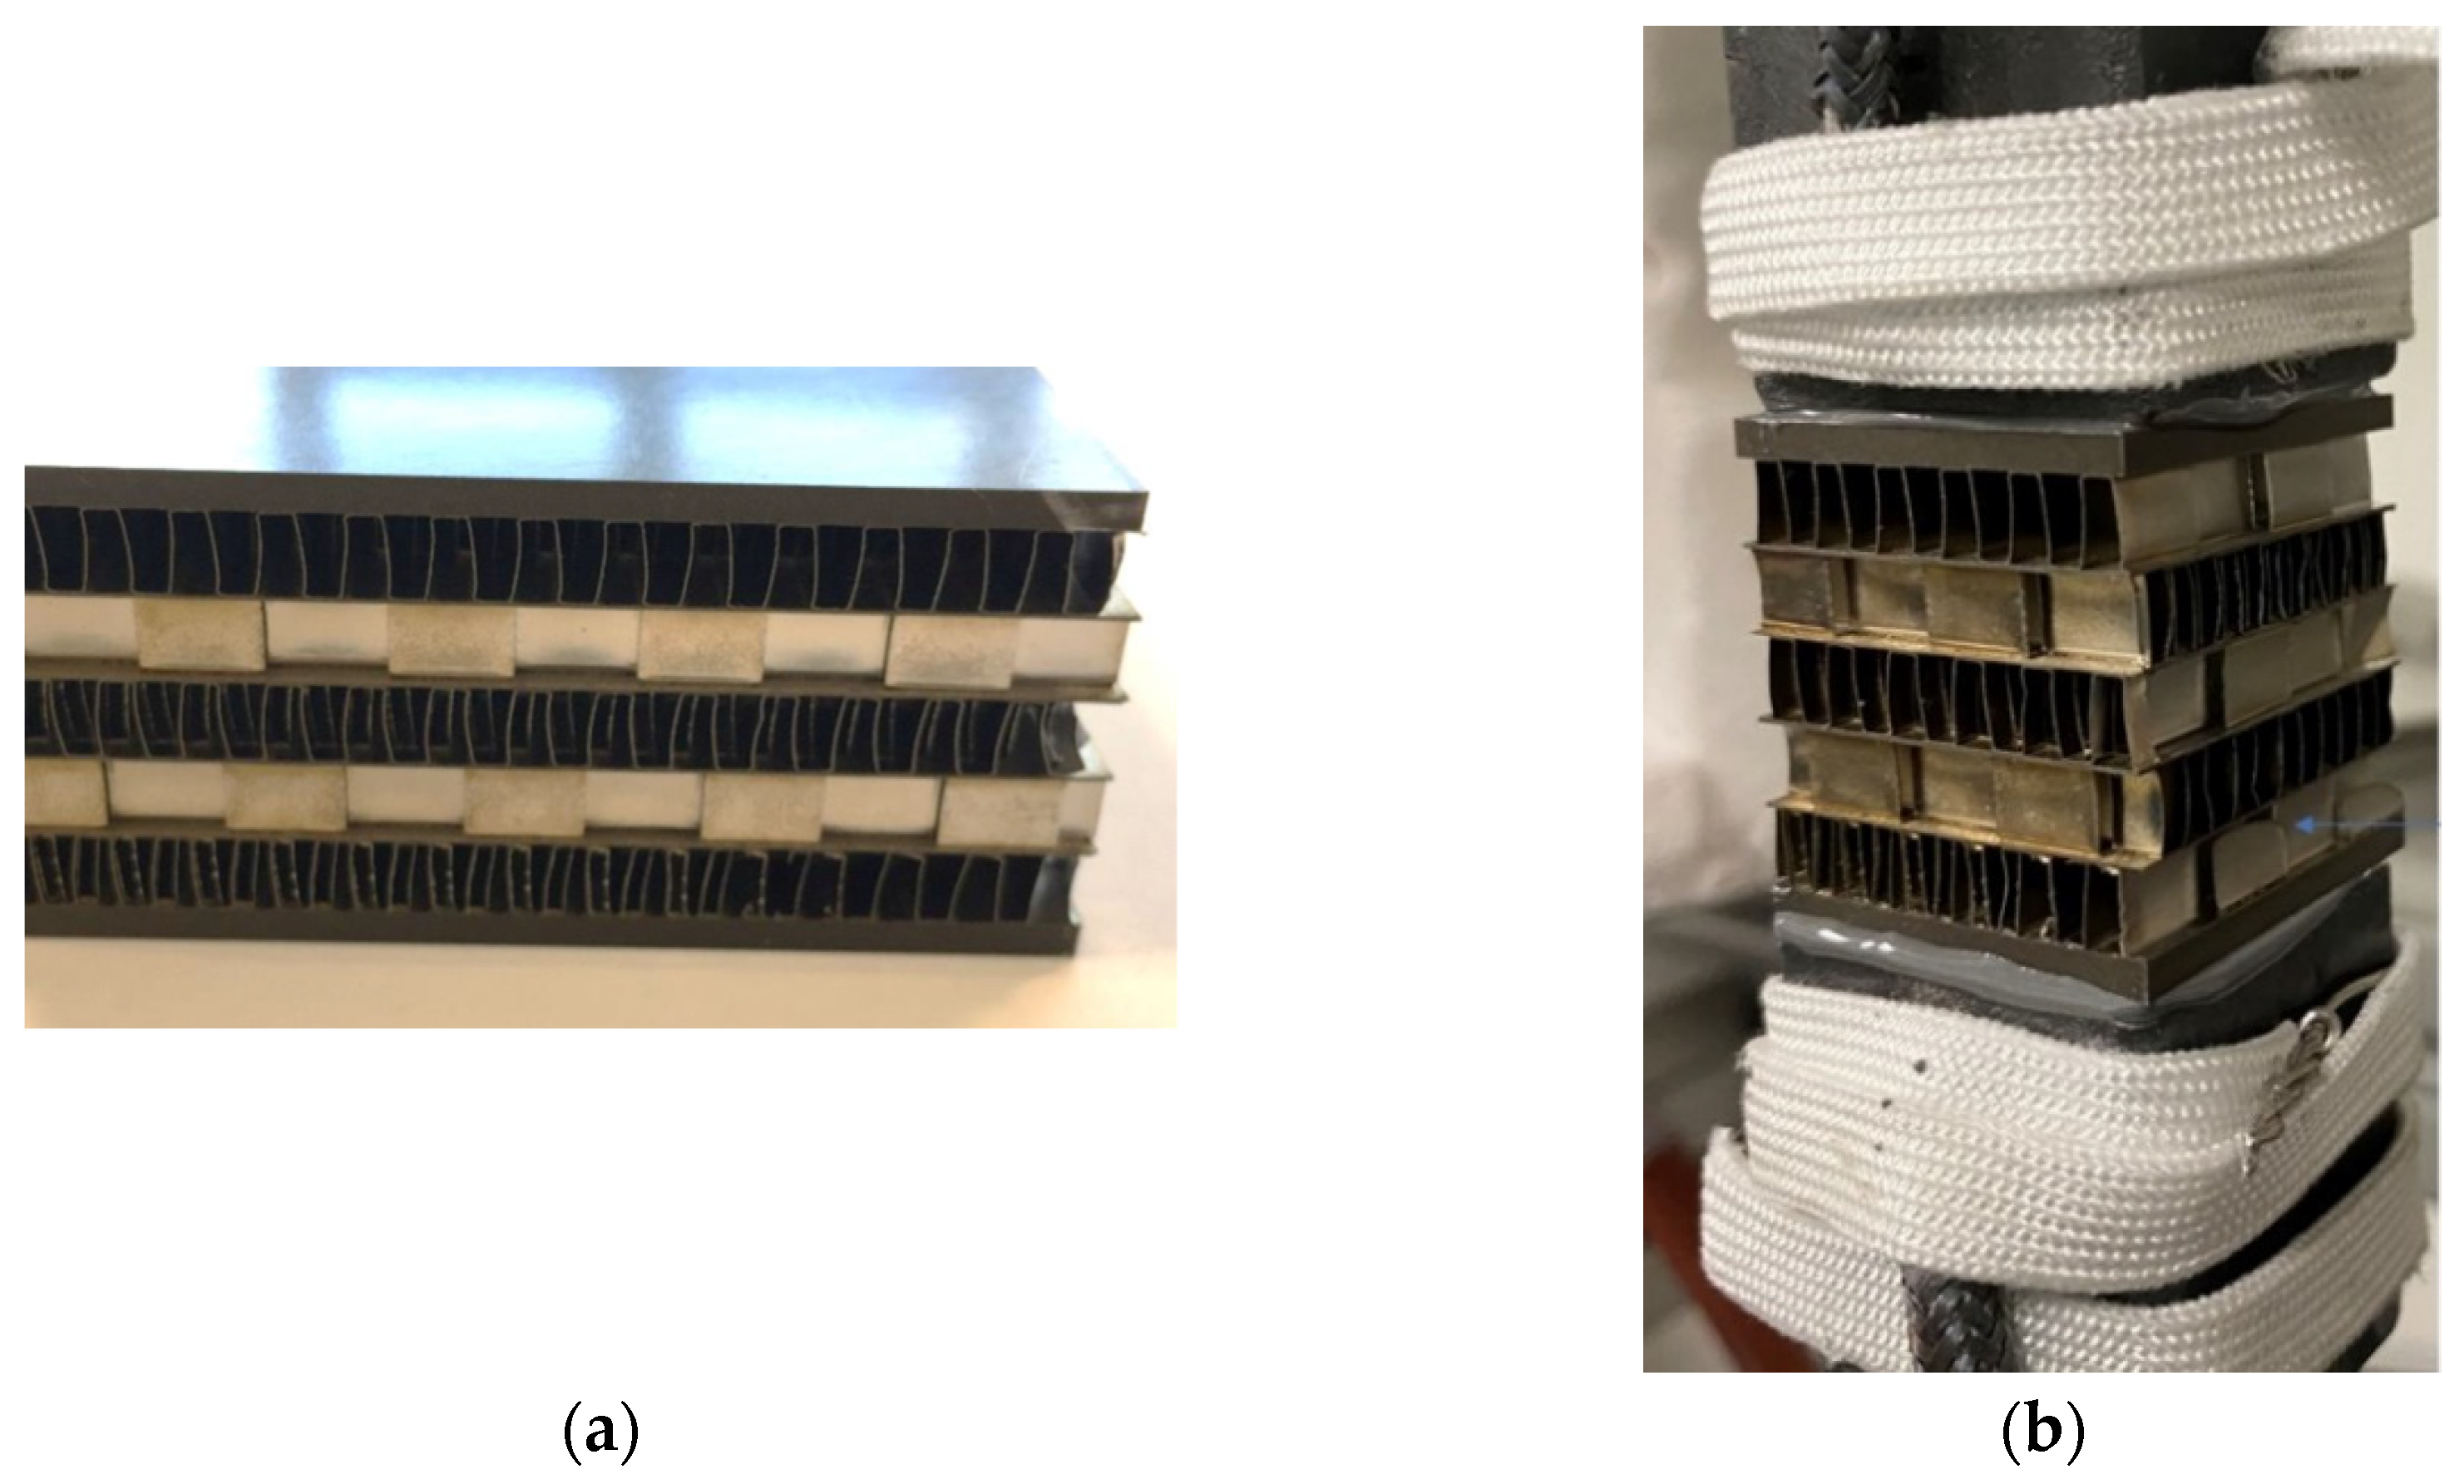
Three different samples were tested all of them with the same geometrical features. Samples were of square section of 25 mm while the height was of 30 mm. The core consists of 5 different layers as illustrated in the next figure:
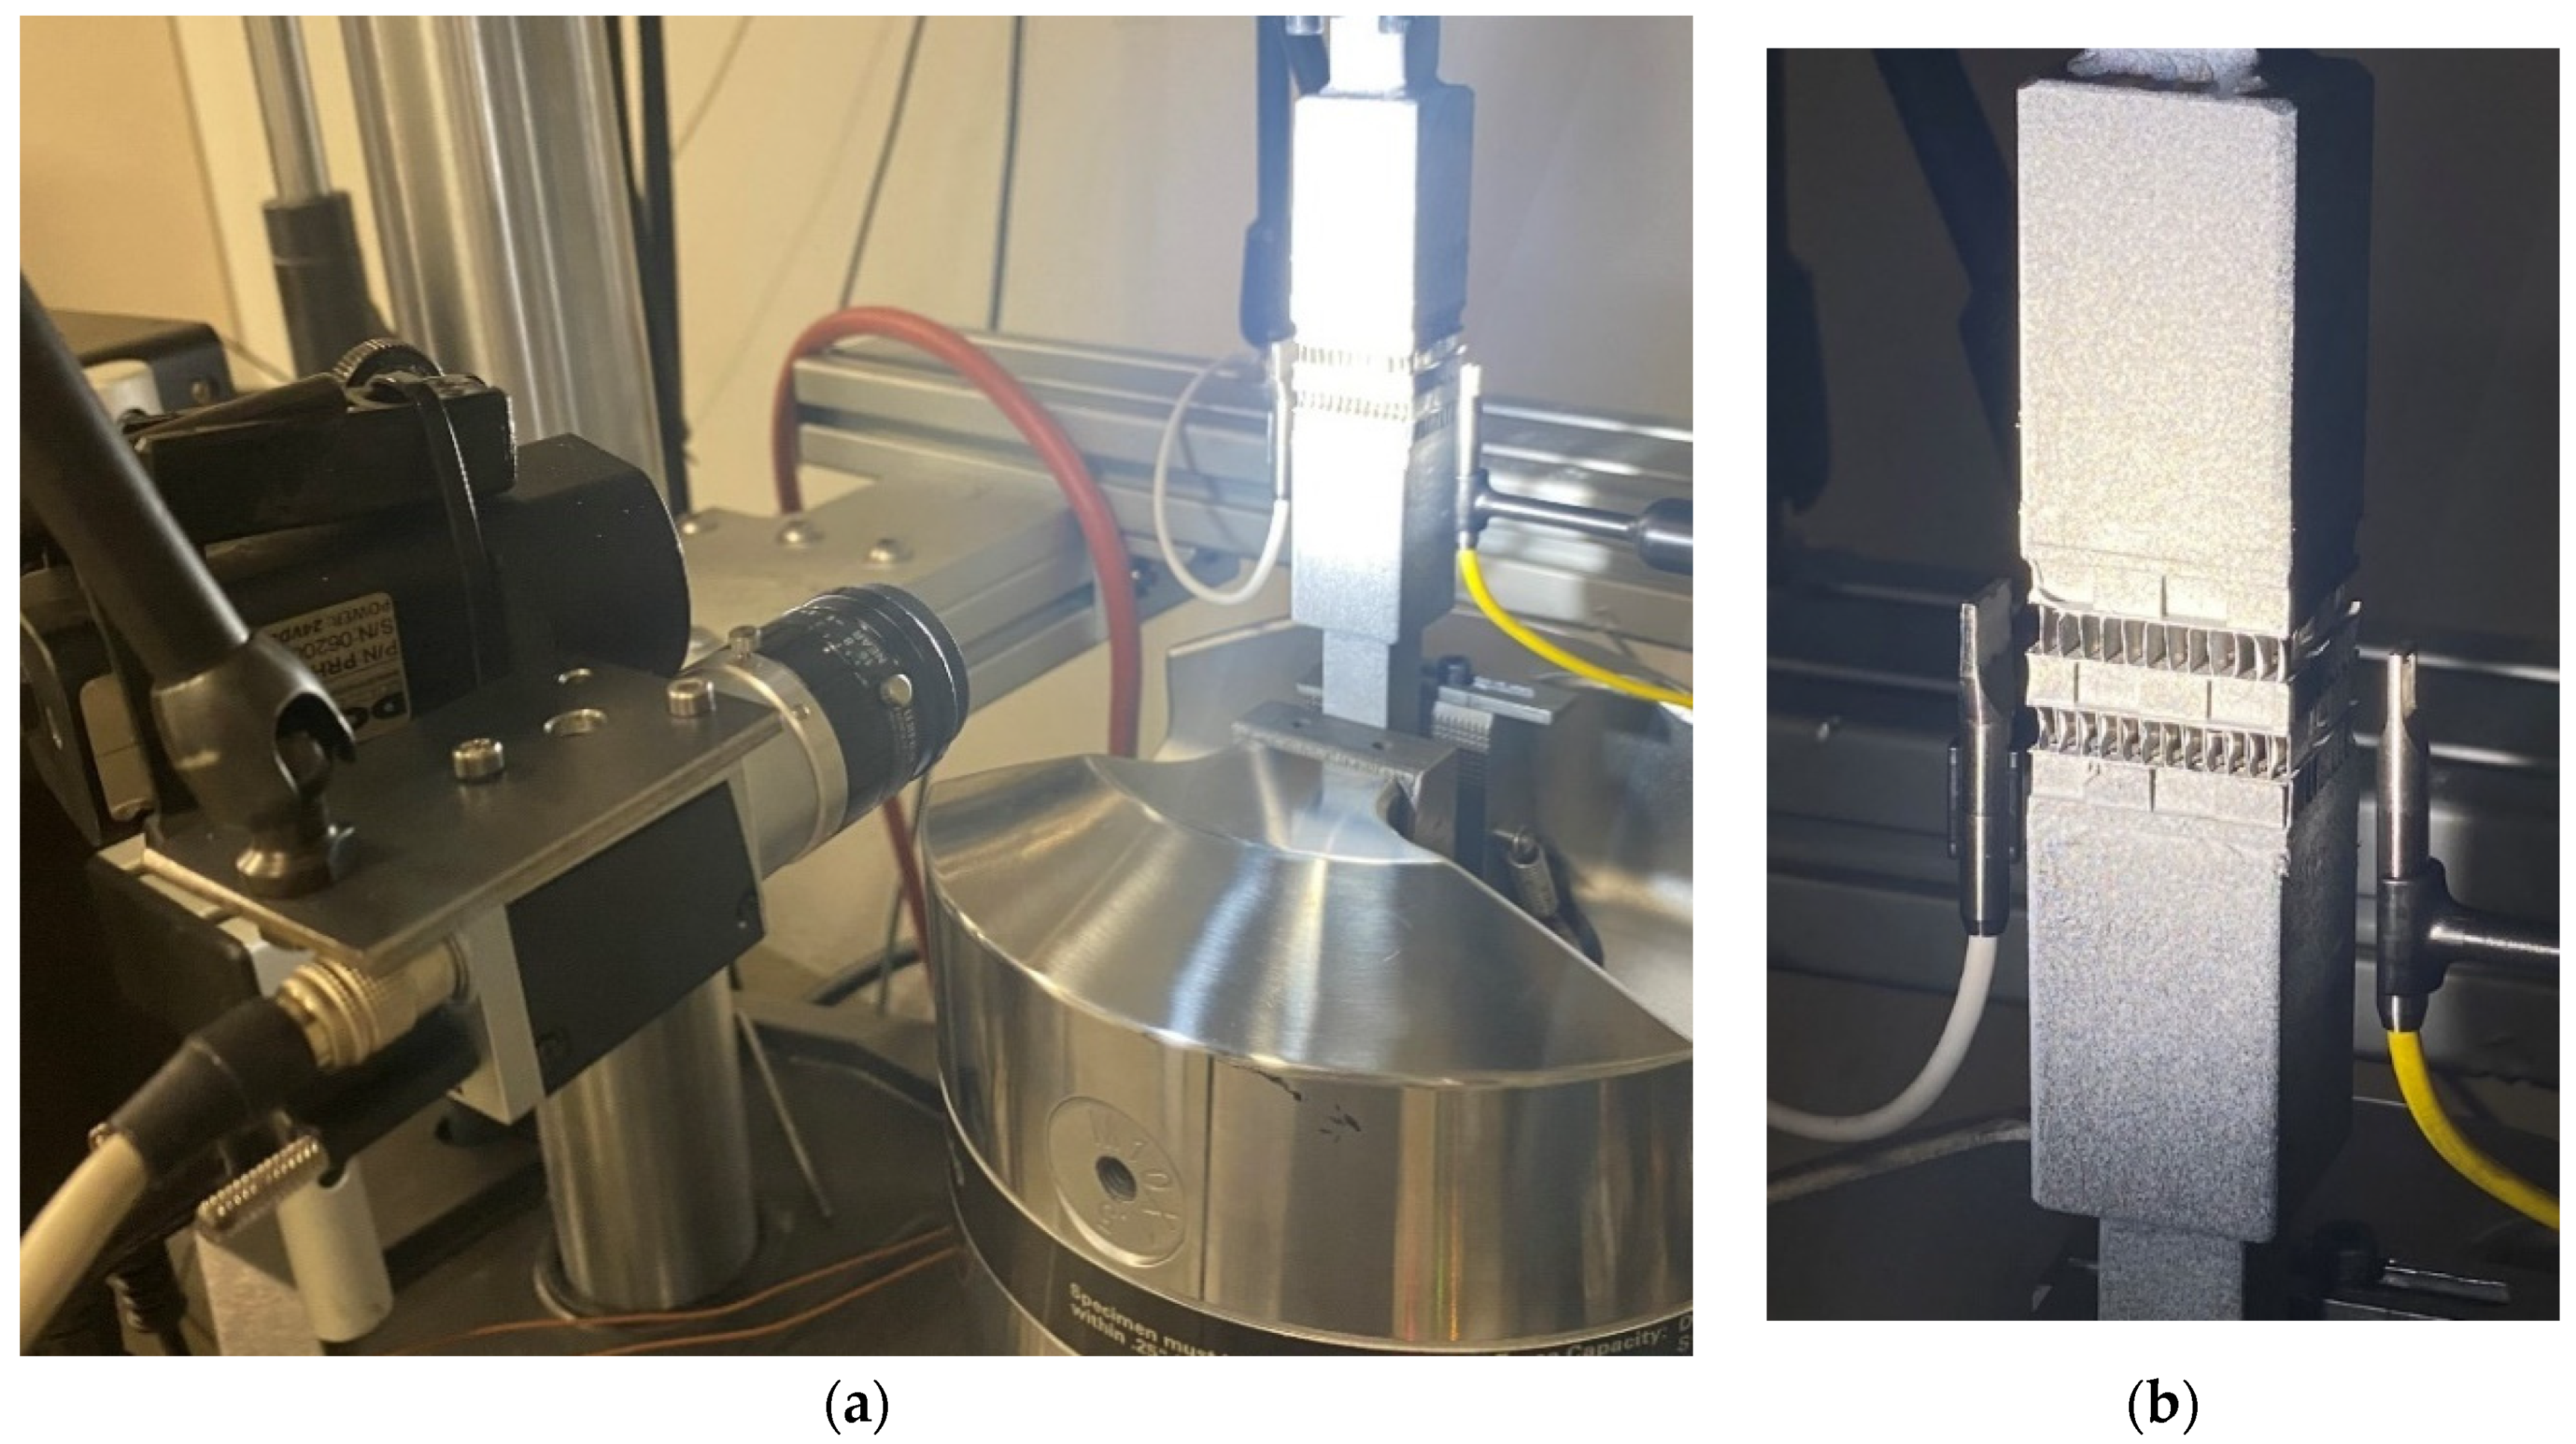
This part of core was arranged so that it could be attached to the machine´s grip. To this end, some blocks had to be glued at the upper and lower parting sheets. And these were attached to the machine (see
Figure 1b).
Regarding fatigue testing, an MTS Landmark Servohydraulic Test System machine with 100 kN capacity has been used to apply uniaxial forces in this component. The upper column of the machine remains fixed during the test and the cylinder that holds the lower part of the specimen applies the defined load depending on the type of test (accelerated fatigue or non-accelerated fatigue).
Three different fatigue tests were run, each one of them with a different purpose as stated in the table below:
Table 1.
Testing campaign.
Table 1.
Testing campaign.
| Test Nº |
Test description |
Load conditions |
Purpose |
| 1 |
Accelerated fatigue test |
Max Load=1,300 N, f=10 Hz, R=0.1. |
Understand sensor´s behavior in a fast test (few hours) |
| 2 |
Non-accelerated fatigue test |
Max Load=600 N, f=10 Hz, R=0.1 |
Study the behavior of DIC and optical microphone under less severe and realistic loads |
| 3 |
Damage Tolerance |
Max Load=600 N, f=10 Hz, R=0.1. Final increased load=1,200N |
Study the damage propagation phenomenon |
2.2. Acoustic Emission and Digital Image Correlation systems data acquisition
Digital Image Correlation is an optical method based on tracking and image registration. It is widely used to measure full-field displacements and strain during mechanical testing. Compared to conventional methods of measuring strain (extensometer), it provides both local and average information of the strain field.
In this section the procedure is explained. The system consists of a digital camera (Basler acA1300-75gm model), 30 mm focal length lens to cover the gauge length, external white light illumination and an image acquisition system that captures and records images in a PC. The camera was synchronized with the testing machine to ensure the simultaneous data acquisition of load values with strain values to be retrieved from the images.
Figure 2.
Image of the set-up. Heat exchanger gripped in the testing machine with the Non-destructive systems installed; (a) two microphones at the heat exchanger sides and (b)the camera with the illumination system.
Figure 2.
Image of the set-up. Heat exchanger gripped in the testing machine with the Non-destructive systems installed; (a) two microphones at the heat exchanger sides and (b)the camera with the illumination system.
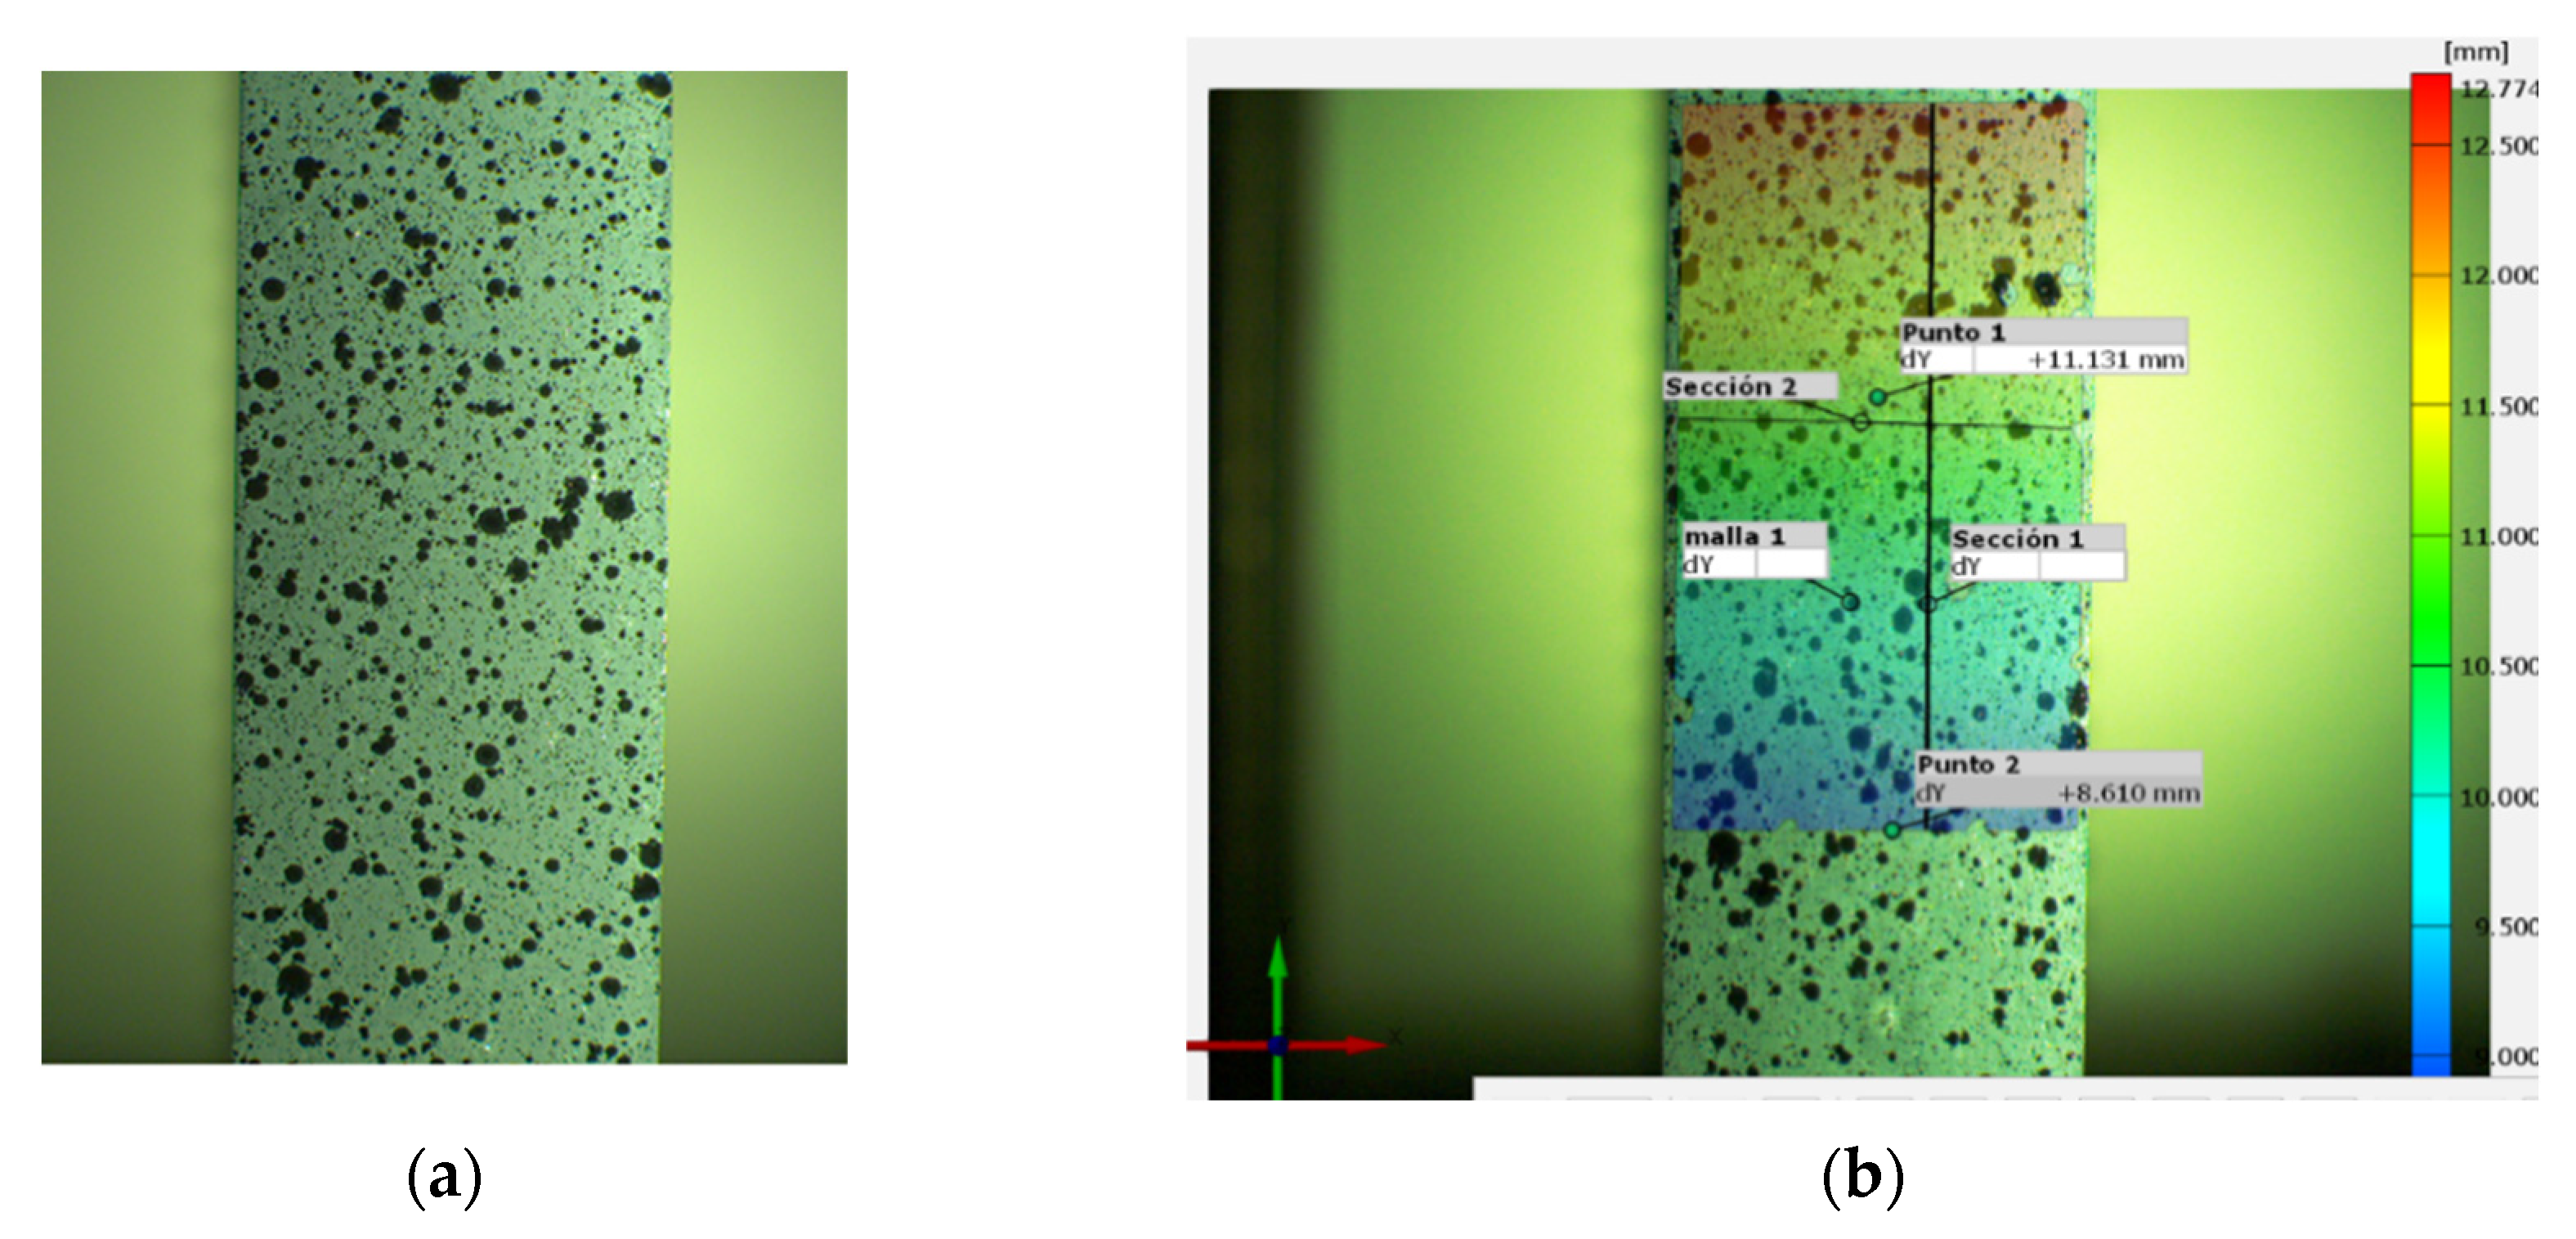
A random pattern has to be created in the sample. In this particular case two different sprays were employed; first the whole gauge length is painted with a white spray and afterwards black droplets are sprayed to obtain a stochastic pattern as shown in
Figure 3 for a flat surface (as an example). For the case of high temperature testing, a special spray has to be employed that withstands the testing conditions but as previously mentioned this test is not covered in this work. Once the pattern is applied, the sample is fixed in the testing machine to carry out the fatigue test and record a sequence of images at 20 frames per second.
The evaluation of the images is performed via subsets, which are square groups of pixels. Each particular subset has its own pattern distribution and this is the representative feature that serves to correlate images. More precisely, this pattern is sought in subsequent images to determine the displacement and the strain. For that purpose, a correlation software was employed. The subset size was set in 20 pixels which proved to be small enough to provide sufficient spatial resolution and low noise level. With regard to point distance between subsets, the value was set in 10 pixels with which displacement field was captured with sufficient resolution. In order to mimic the behavior of the extensometer, displacement values are exported from the program and from there, strain evolution is computed. This is explained in more detailed in
Section 2.3.
The second method used in this work is measuring the acoustic emissions using a membrane-free optical microphone. As shown in
Figure 2, there are two microphones placed at either side of the heat exchanger. The microphone on the right side (with a yellow cable) is an Eta250 Ultra while the one on the left (with a white cable) is an Eta450 Ultra by XARION Laser Acoustics GmbH. These novel ultrasound microphones are capable of measuring airborne acoustic signals in a very broadband frequency range up to 1 MHz with the Eta250 Ultra and 2 MHz with the Eta450 Ultra.
The measurement principle of these membrane-free optical microphones is based on a Fabry-Pérot laser interferometer. In general, acoustic waves are local pressure changes of the traversed medium, which is air in this case. These pressure changes also lead to variations of the refractive index in the air. The Fabry-Pérot interferometer, which is located in the sensor head of the optical microphone, can measure these alterations of the refractive index and convert it to the corresponding sound pressure changes. This method allows for acquiring acoustic signals with an almost linear frequency response. The general design of the optical microphone consists of a tiny sensor head (as seen in
Figure 2), which contains the interferometer, and a signal conditioning unit (SCU), which consists of the laser and all the electronics for processing the signal. In this testing campaign the signals were recorded with a sampling frequency of 3 MHz.
Figure 4.
Principle of the membrane-free optical microphone.
Figure 4.
Principle of the membrane-free optical microphone.
2.3. Image and Signal Processing
For Digital Image Correlation, the camera for image acquisition was synchronized with testing machine so that both commence at the same time. Frame rate was set in 20 Hz to capture the 10 Hz testing frequency. This leads to a high number of images by test. In the case of the largest test more than 100,000 images were recorded. These were stored in a computer for their analysis, that is, at this stage the development is based on an off-line analysis while for its further implementation an on-line analysis will be required. This is not included in this paper.
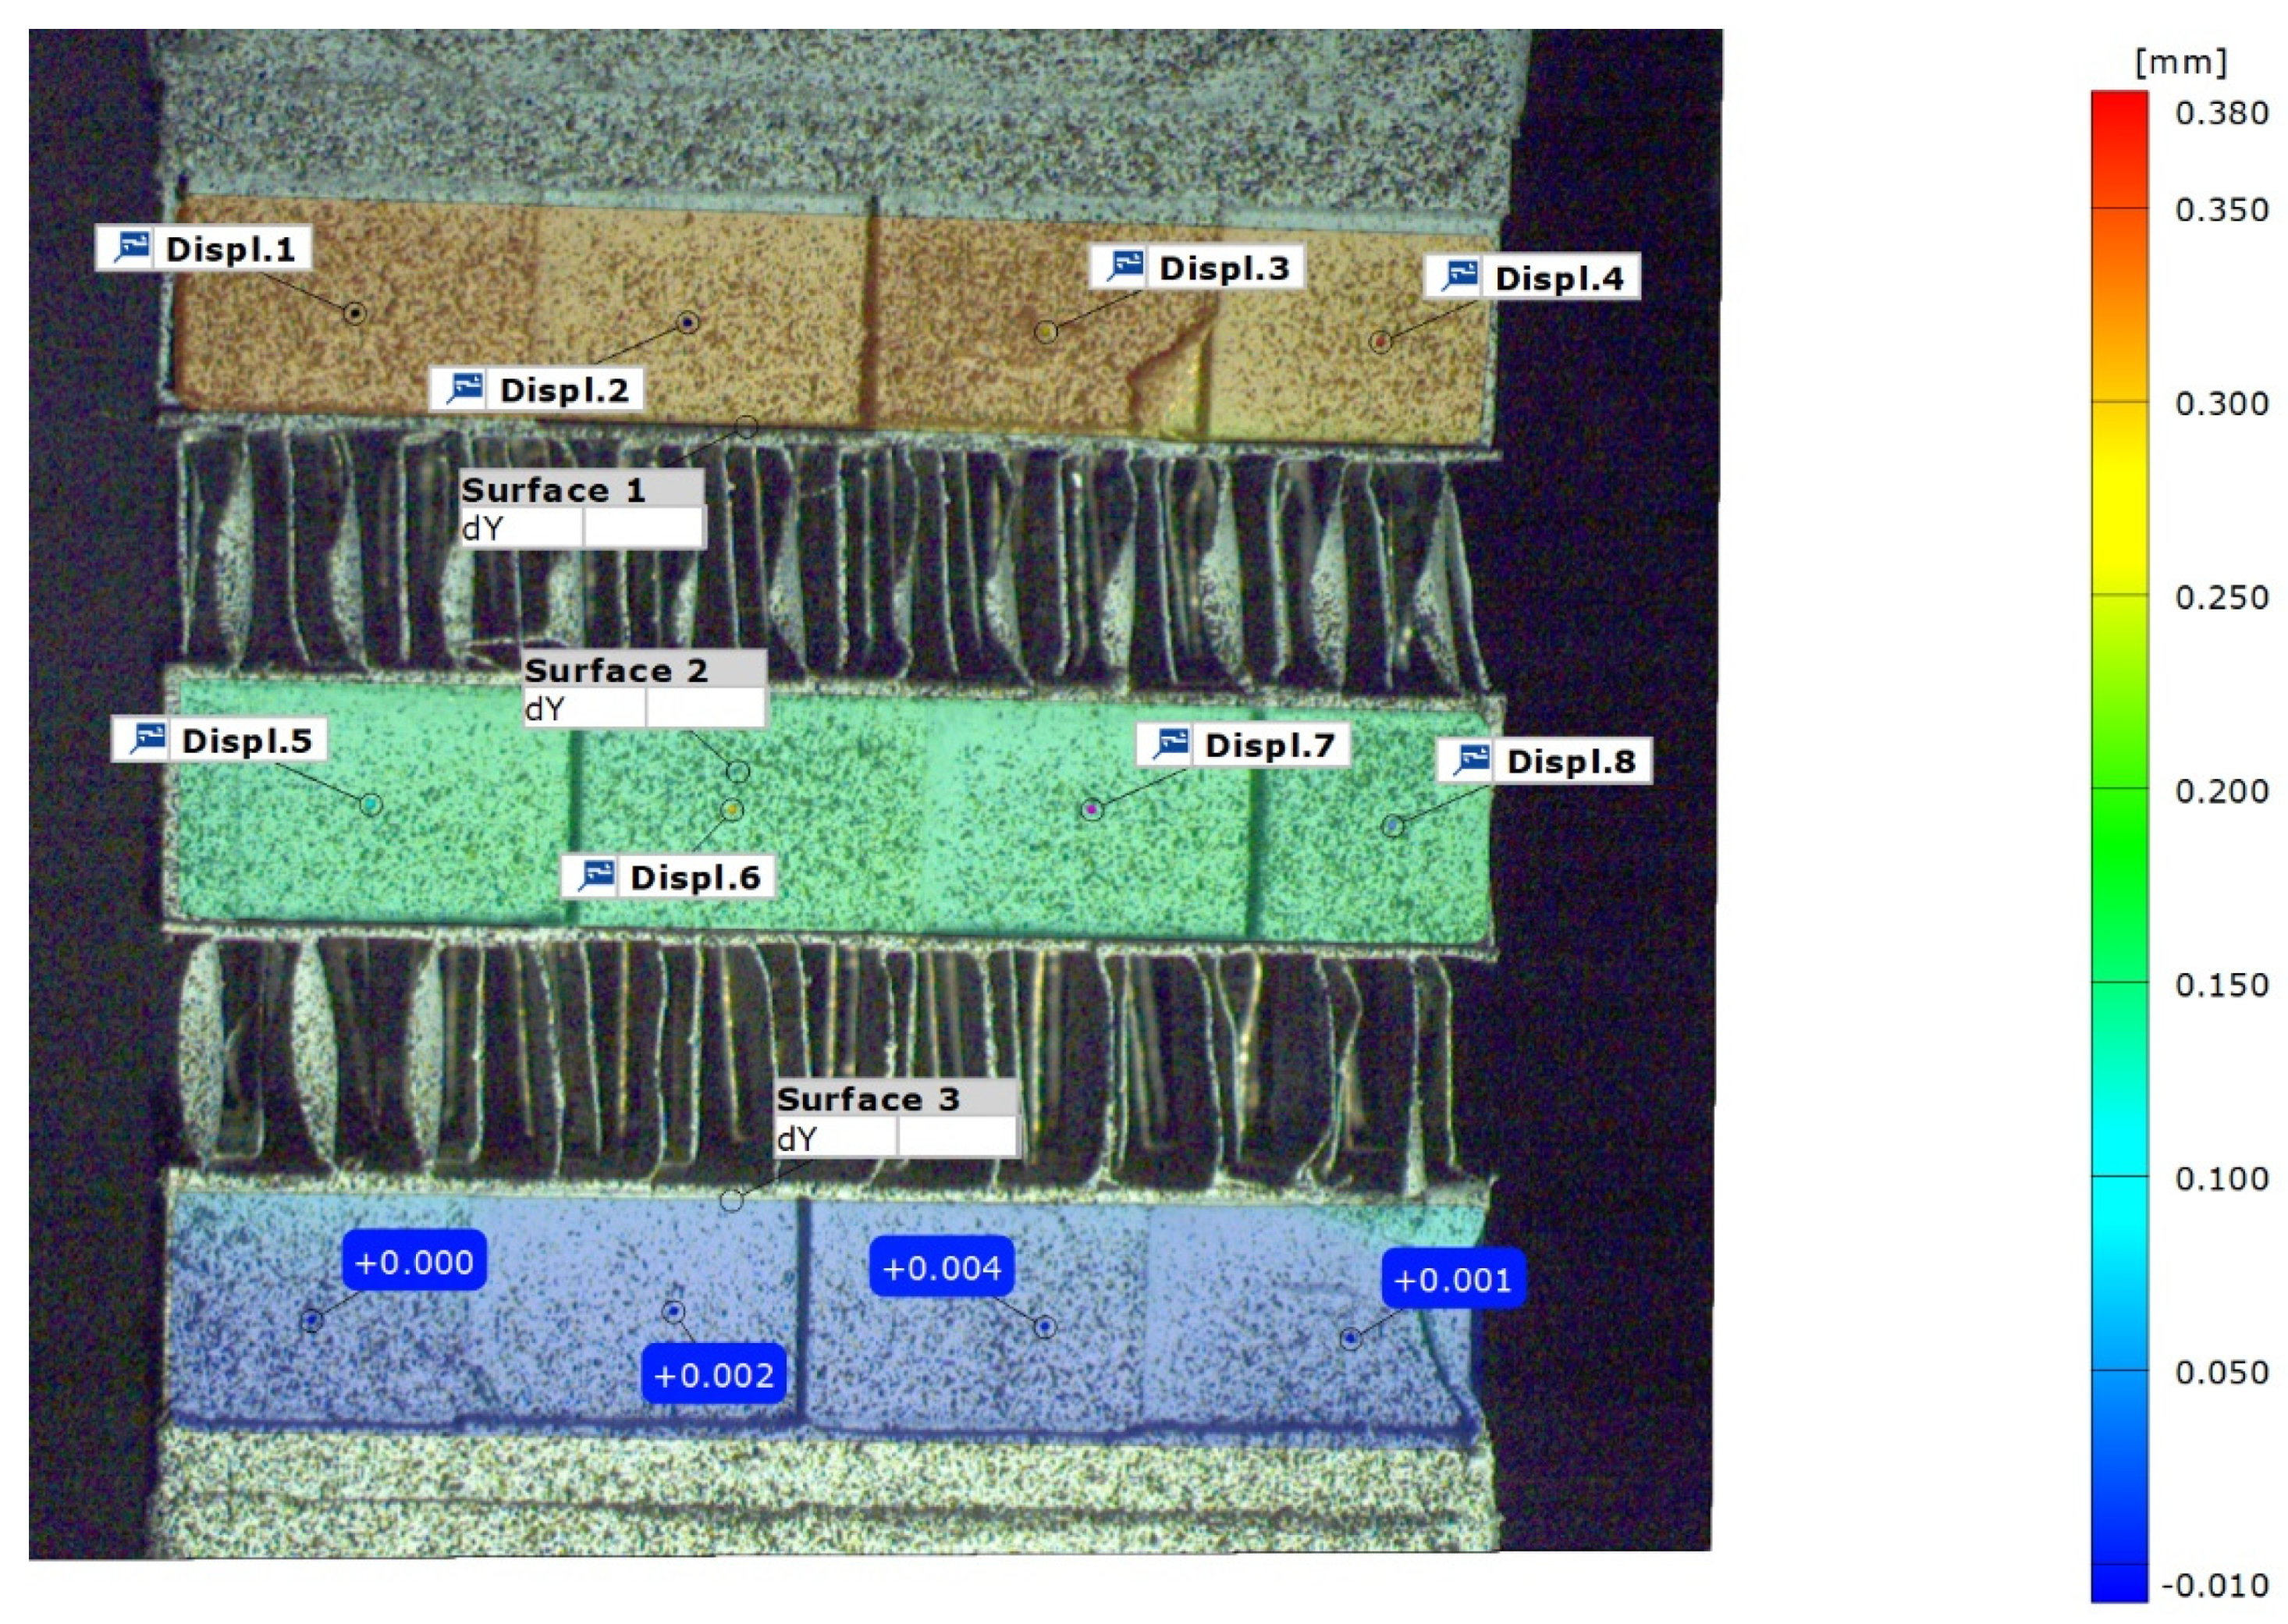
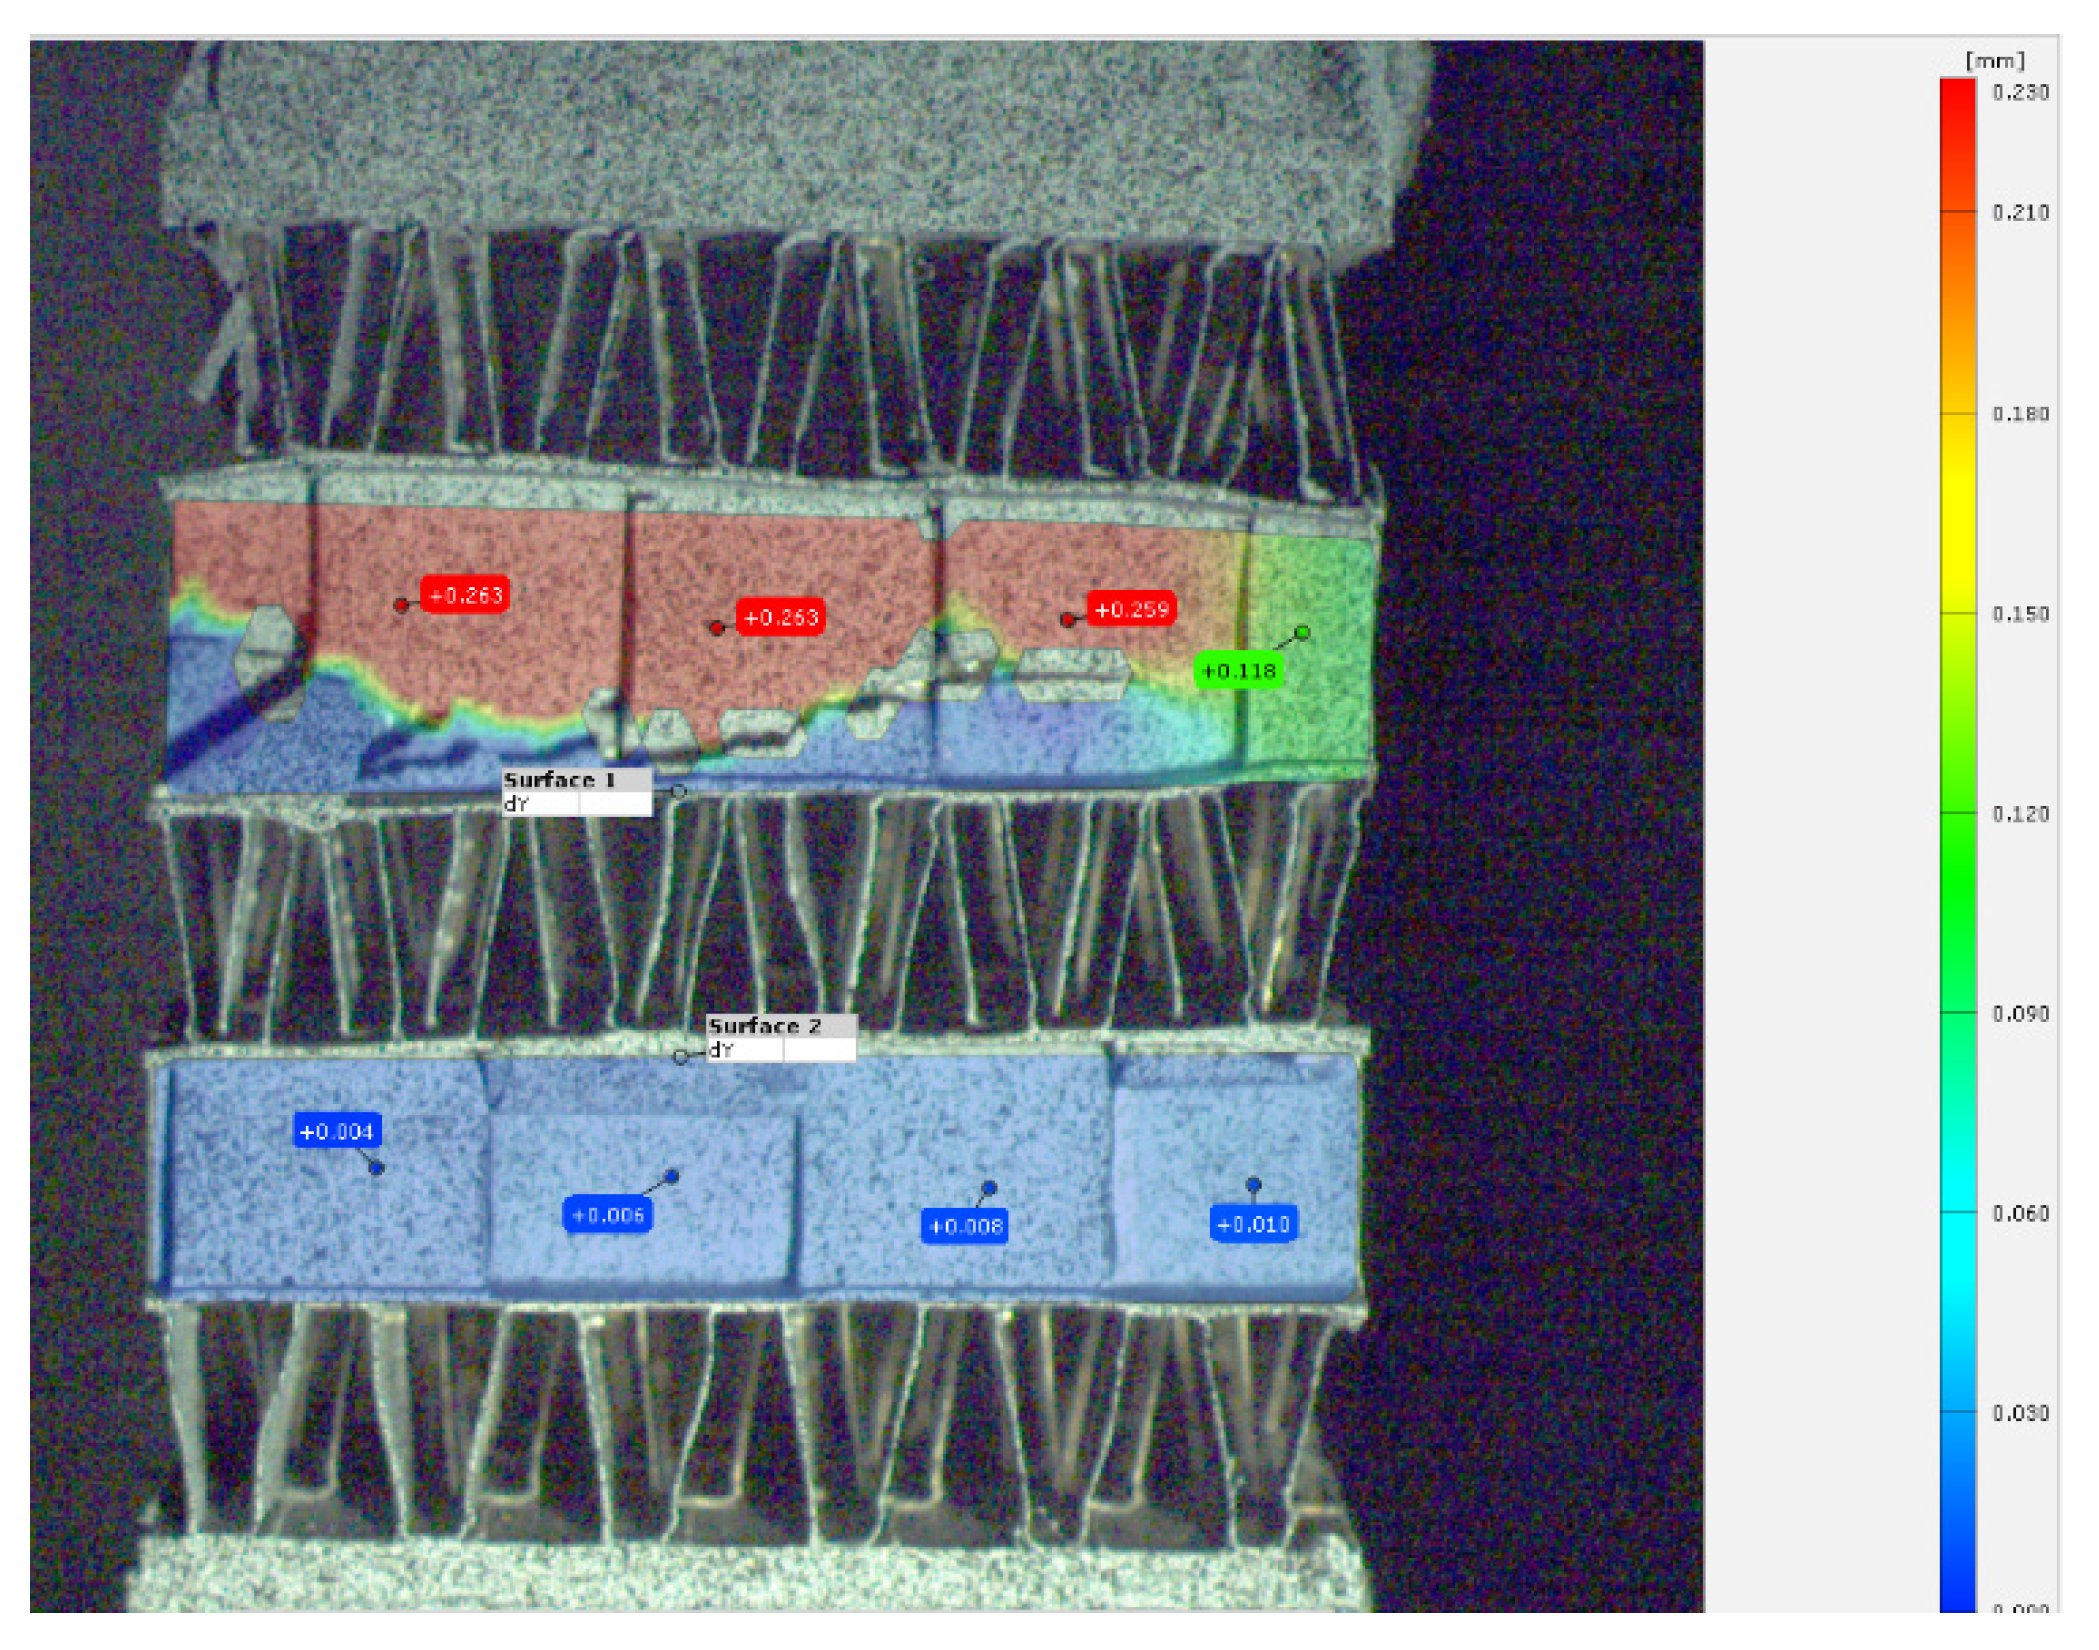
The analysis of the images was based on a commercial Image Correlation algorithm by using GOM correlate software. Since testing implies uniaxial loading, displacement field in the longitudinal direction is employed as the main magnitude. It has to be mentioned that due to the heat exchanger geometrical nature, only the side face of the fins may be monitored because of their thickness (100 um). Obviously no stochastic pattern may be supplied and observed in such a tiny surface. Therefore, in the sandwich structure like geometries, only the side face of the fins are monitored as illustrated in the next image. This image illustrates the longitudinal displacement in the axial direction where load is applied with the corresponding values. The final computed magnitude is strain component in the longitudinal direction by using the following formula:
where
L is the distance between the surface´s centre This formula is similarly applied to
Displ. 2- Displ. 6,
Displ.3- Disp. 7 and
Displ.4-Displ.8 respectively. This approach assess the strain between two consecutive layer at different locations. Under perfect uniaxial conditions, all the strain values should be equal. This holds true during the most part of the test until local ruptures appears. For early damage identification this approach has shown to be valid as at this stage uniaxial conditions are kept.
Figure 5.
DIC image of a test showing three main surfaces being monitored.
Figure 5.
DIC image of a test showing three main surfaces being monitored.
Therefore, the evolution of this magnitude has been employed as the representative parameter to identify damage. For the sake of brevity, not all the images are processed but some intervals are taken in order to assess in which interval the damage occurred. Thus, in the results section, strain evolution is depicted by intervals instead of a continuous curve.
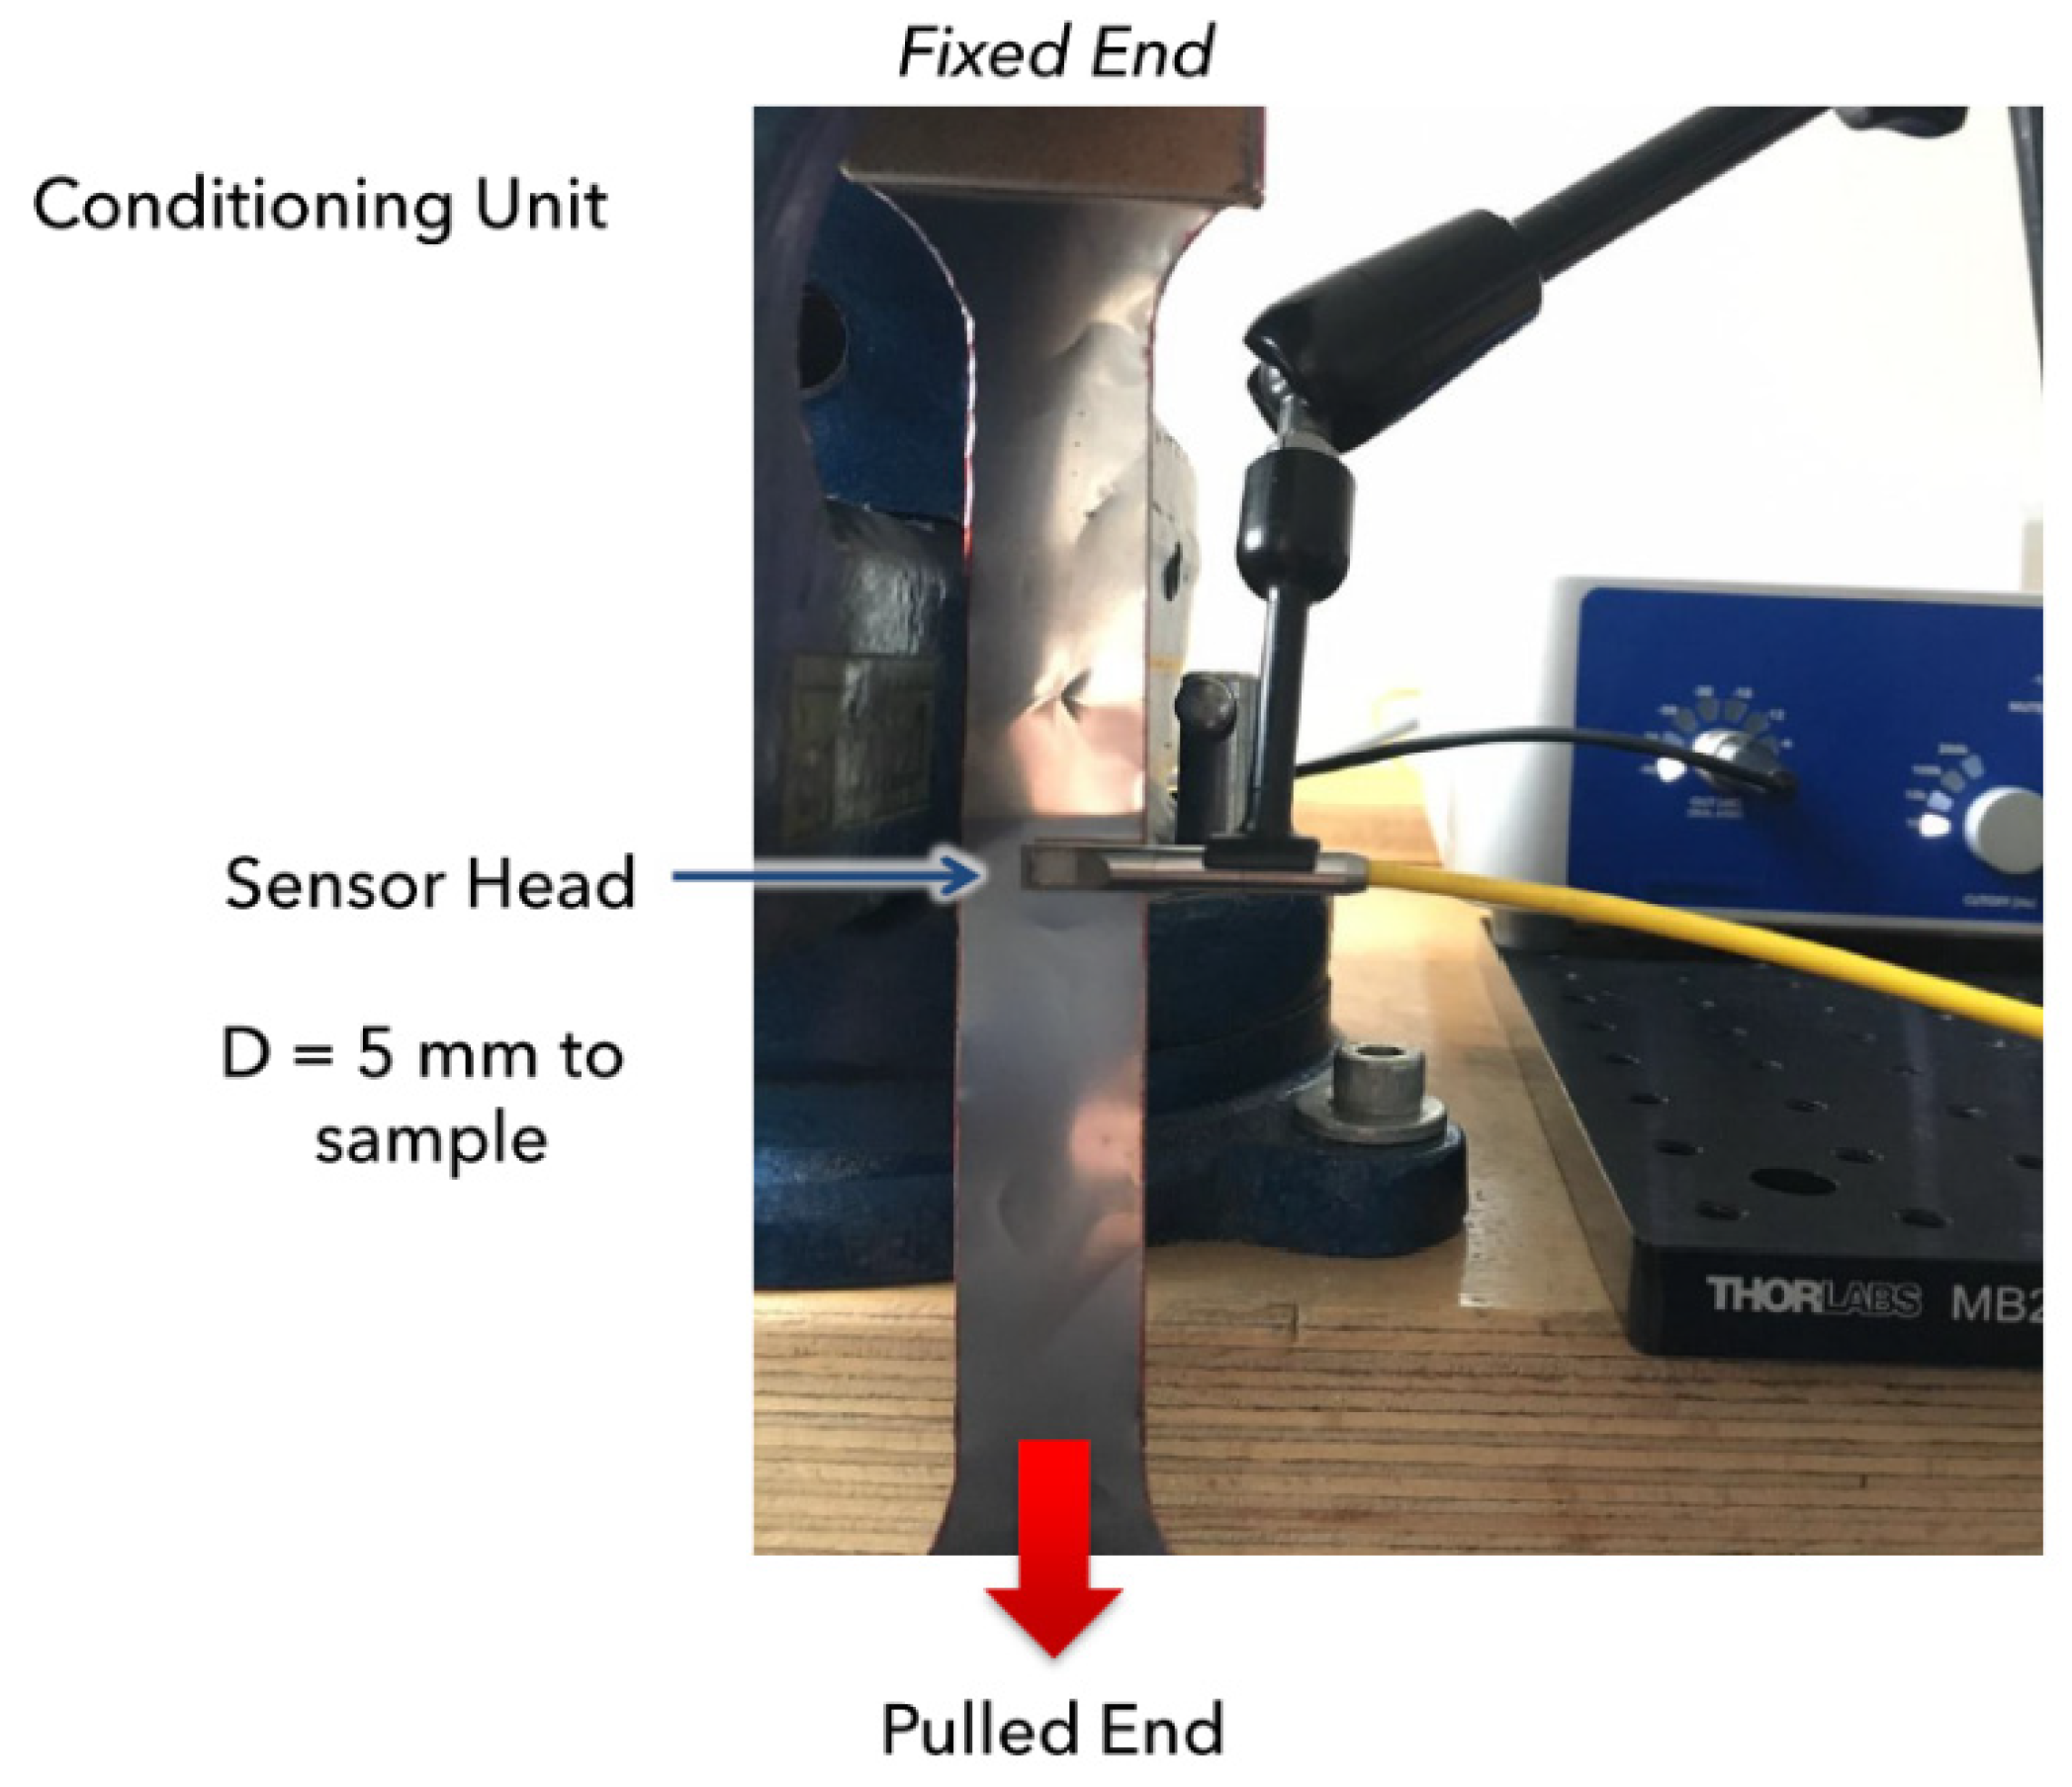
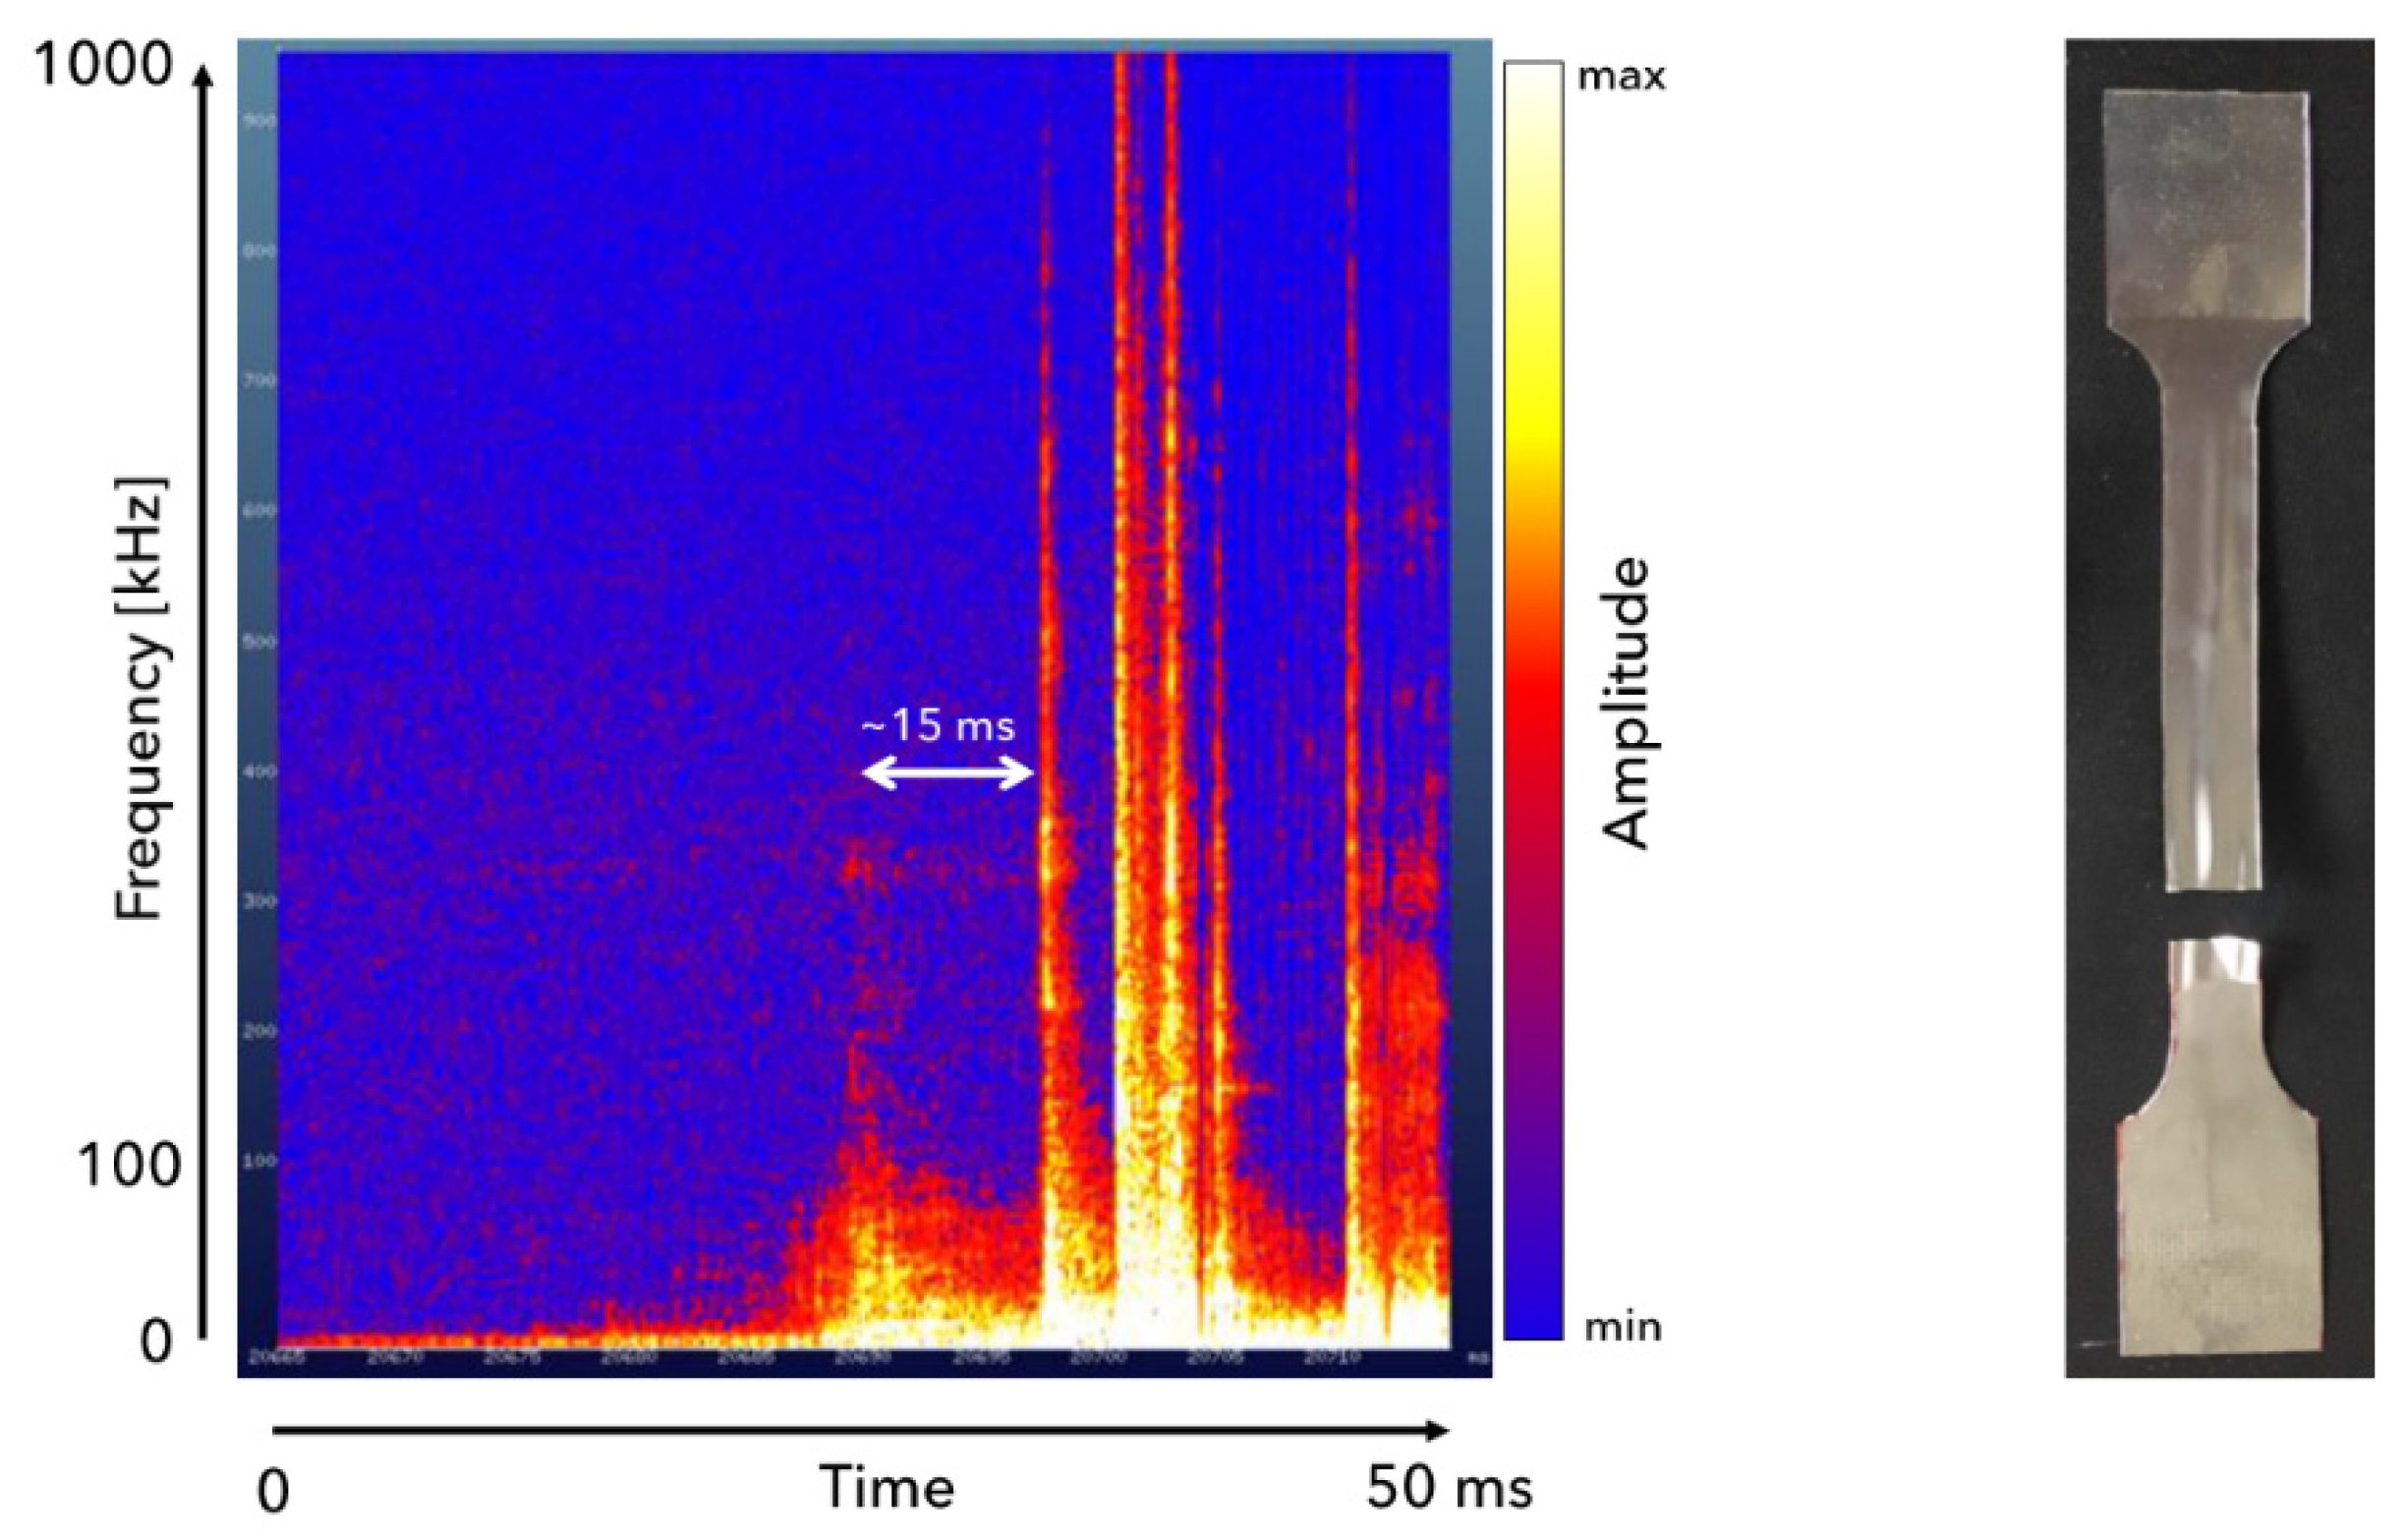
Concerning the optical microphone, before starting the fatigue tests a proof of concept was carried out. This was done to properly evaluate the best mounting configuration of the sensor heads and calibrate the settings of the signal conditioning unit (SCU) for this application. For this procedure a tensile test was performed with the sensor heads of the microphones placed at 5 mm from the sample to capture properly any possible small cracks.
Figure 6.
Experimental set-up employed for tensile test during Acoustic Emission testing.
Figure 6.
Experimental set-up employed for tensile test during Acoustic Emission testing.
As mentioned earlier the signals were recorded with a sampling frequency of 3MHz for all experiments. To analyze them a spectrogram is calculated. A spectrogram is a two-dimensional representation showing the spectral acoustic energy of the signal over time and frequency. For its calculation the time signal of the acoustic process emissions is split into overlapping chunks and a Fourier-transformation is applied to every chunk. The result is presented in
Figure 7 with time being assigned to the horizontal axis, frequency assigned to the vertical axis and the respective acoustic energy amplitude is represented as color.
In the illustrated spectrogram the following aspects may be highlighted. The graph shows a 50 ms length tests, where at the beginning no signals are observed except for the low frequency background noise. At the end of the test, several high amplitude and high frequency signals are observed most likely related to the metallic sheet rupture phenomenon. What is interesting to highlight is the smaller peak 15 ms prior to rupture that could be related to the small crack (that did not lead to rupture). This aspect is important because in the real application small cracks are to be identified instead of complete ruptures. Besides, the released energy is proportional to the broken area. Obviously, the thinner the sample (as in this case) the lower the signal. In spite of that, signal was clearly captured proving the concept.
This measurement concept was translated to the fatigue tests by introducing two microphones as close as possible to the heat exchanger (see
Figure 2) in order to reduce the signal attenuation level to the minimum. The signal processing procedure was as follows. It has to be highlighted that due to the long lasting nature of fatigue tests and the high frequency acquisitions rate of the microphone, acoustic signals are recorded in separate files each one of them containing 60 seconds recording in binary format.
The files containing acoustic recording are read and concatenated.
Spectograms are depicted to assess the spectral response of the signals.
Pre-processing: a high pass filter is applied to reduce the low frequency noise that is not related to the heat exchanger’s behavior. For that purpose, a Butterworth high-pass filter is employed with a cutoff frequency of 0.05 (in normalized frequency, equivalent to a 50 kHz cutoff frequency).
Root mean square of the signal is computed to determine the energy of the acoustic events. From these values, high energy events may be identified and distinguish from the low ones.
A threshold value is stablished in order to discard the acoustic events that will not be considered for the analysis. This was stablished in 1000 (auxiliary units) with which acoustic events were selected.
The selected event’s acoustic signals are retrieved from the original recording. The total length of the signal, 4 milliseconds, was stablished based on the observation of several acoustic events and in particular the ones with longest duration. The 4 milliseconds were divided as follows; 1 millisecond before the peak value and 3 after.
From these individual acoustic signals, 6 main features were extracted for further analysis: a.) maximum signal amplitude, b.) rise time (computed as the time interval between maximum value and the instant where signals exceeds threshold value),c.) total signal duration, d.) energy assessed as the root mean square of the signal, e.) counts as the number of zero crossings within the signal segment and f.) peak frequency of the signal using the Fast Fourier Transform (FFT).
All data values are normalized to apply a Principal Component Analysis. This indicates the distribution of the data in terms of variability and the main components that explain this variability. This also eliminates the effects of redundant information.
Isolation Forest algorithm [
16,
17] is applied in order to distinguish acoustic events of different nature. The basic assumption is that most of the event’s source may not stem from cracking events. The suggested strategy considers that those events with different behavior, that is outliers, are related to cracking events. This is backed on the evidence that there are much more events than fins in the heat exchanger, suggesting that scratching between loose fins may be an acoustic source. This may happen because during sample preparation after the manufacturing process some loose fins may remain. Based on the assumption made, the choice of Isolation Forest algorithm is straightforward. This machine learning algorithm is particularly effective in identifying outliers in data, because unlike many other anomaly detection methods, Isolation Forest doesn’t rely on any distance or density measure to detect anomalies. Instead, it isolates anomalies by randomly selecting a feature and then randomly selecting a split value between the maximum and minimum values of the selected features. This process is repeated recursively, and as a result, anomalies are isolated closer to the root of the tree, since they have attribute values that are more distinct than normal points.
3. Results and discussion
In this section both inspection system methods results are illustrated following a common scheme. In the case of Acoustic Emission signals, machine learning methods has been implemented over the set of data generated in the previous section (section 2): This contains all the acoustic events without considering their source. Thus, a classification algorithm was developed in order to distinguish acoustic events stemming from damage in the heat exchanger with respect to other sources such as scratches due to lose fins. In the case of DIC analysis, strain evolution graphs are depicted and analyzed. Results from both systems are compared afterwards. The analysis is divided based on three different tests, each one of them related to an operation mode; accelerated test -where high acoustic loads were applied to reduce the number of cycles to failure- non-accelerated tests and finally a test devoted to damage tolerance where a heat exchanger with a cracking fin is analyzed.
3.1. Accelerated fatigue tests
Accelerated fatigue tests were carried out with the purpose of creating an understanding of the nature of the signals that stem from such a test. This was carried out at high loads (3,000 N) at a frequency of 10 Hz and a ratio -R- equal to 0.1 to avoid compressive loads that the heat exchanger may not withstand.
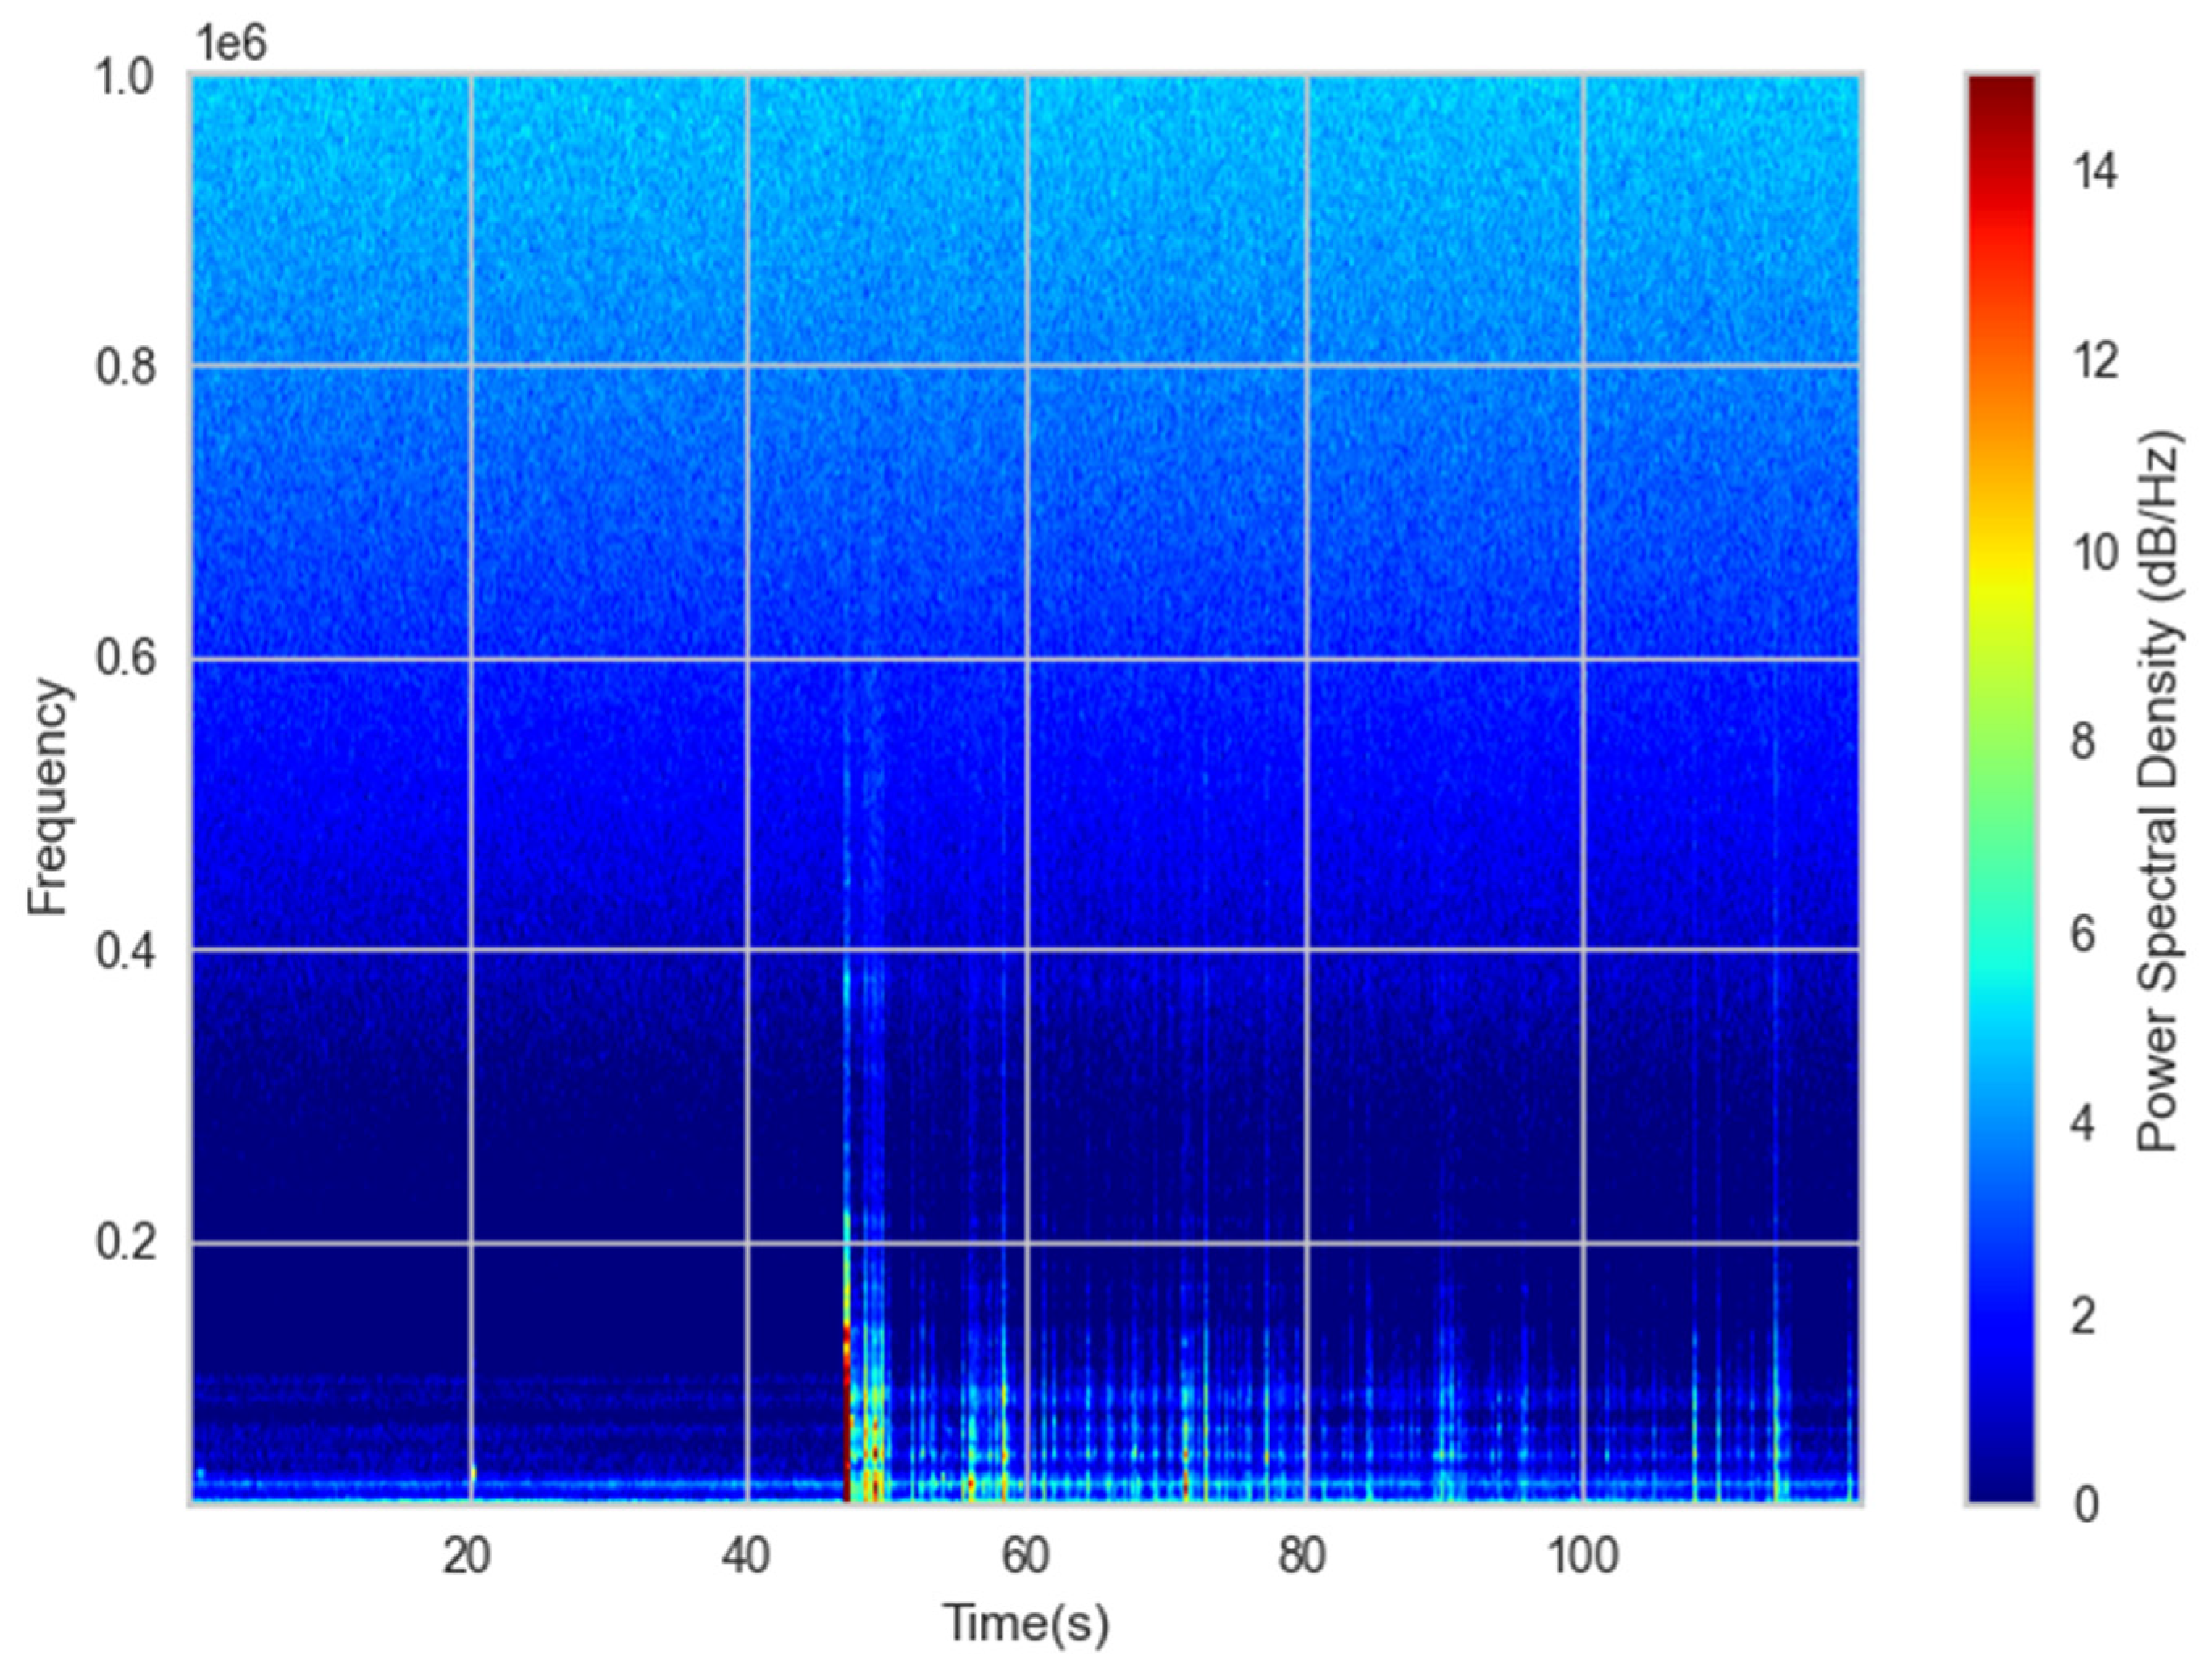
Due to this high load values -much higher than those appearing in real operation- acoustic signals appear at a very early stage. In the
Figure 8, the spectrogram corresponding to the first 120 seconds of the test is illustrated. This shows the absence of events during the initial cycles (from 0 seconds to 45 seconds) except for the low frequency background noise. From that moment on, high amplitude and frequency events are clearly visible indicating that the initial damage has already occurred. The frequency of the observed events slightly differs from the cracking phenomenon studied in
Figure 7. In particular the achieved maximum frequency is lower in the case of the heat exchanger testing (600 kHz with respect to the 1,000 kHz during the tensile test). This may be due to the fact that during tensile testing more abrupt ruptures occur with respect to fatigue testing, and this may explain the differences in amplitude and frequency. Nevertheless, in both cases, the spectrograms contain high frequency content. This is in good agreement with other author´s findings in their studies with the optical microphone [
18]. Fischer highlights that ultra-high frequency range is of relevance for process monitoring.
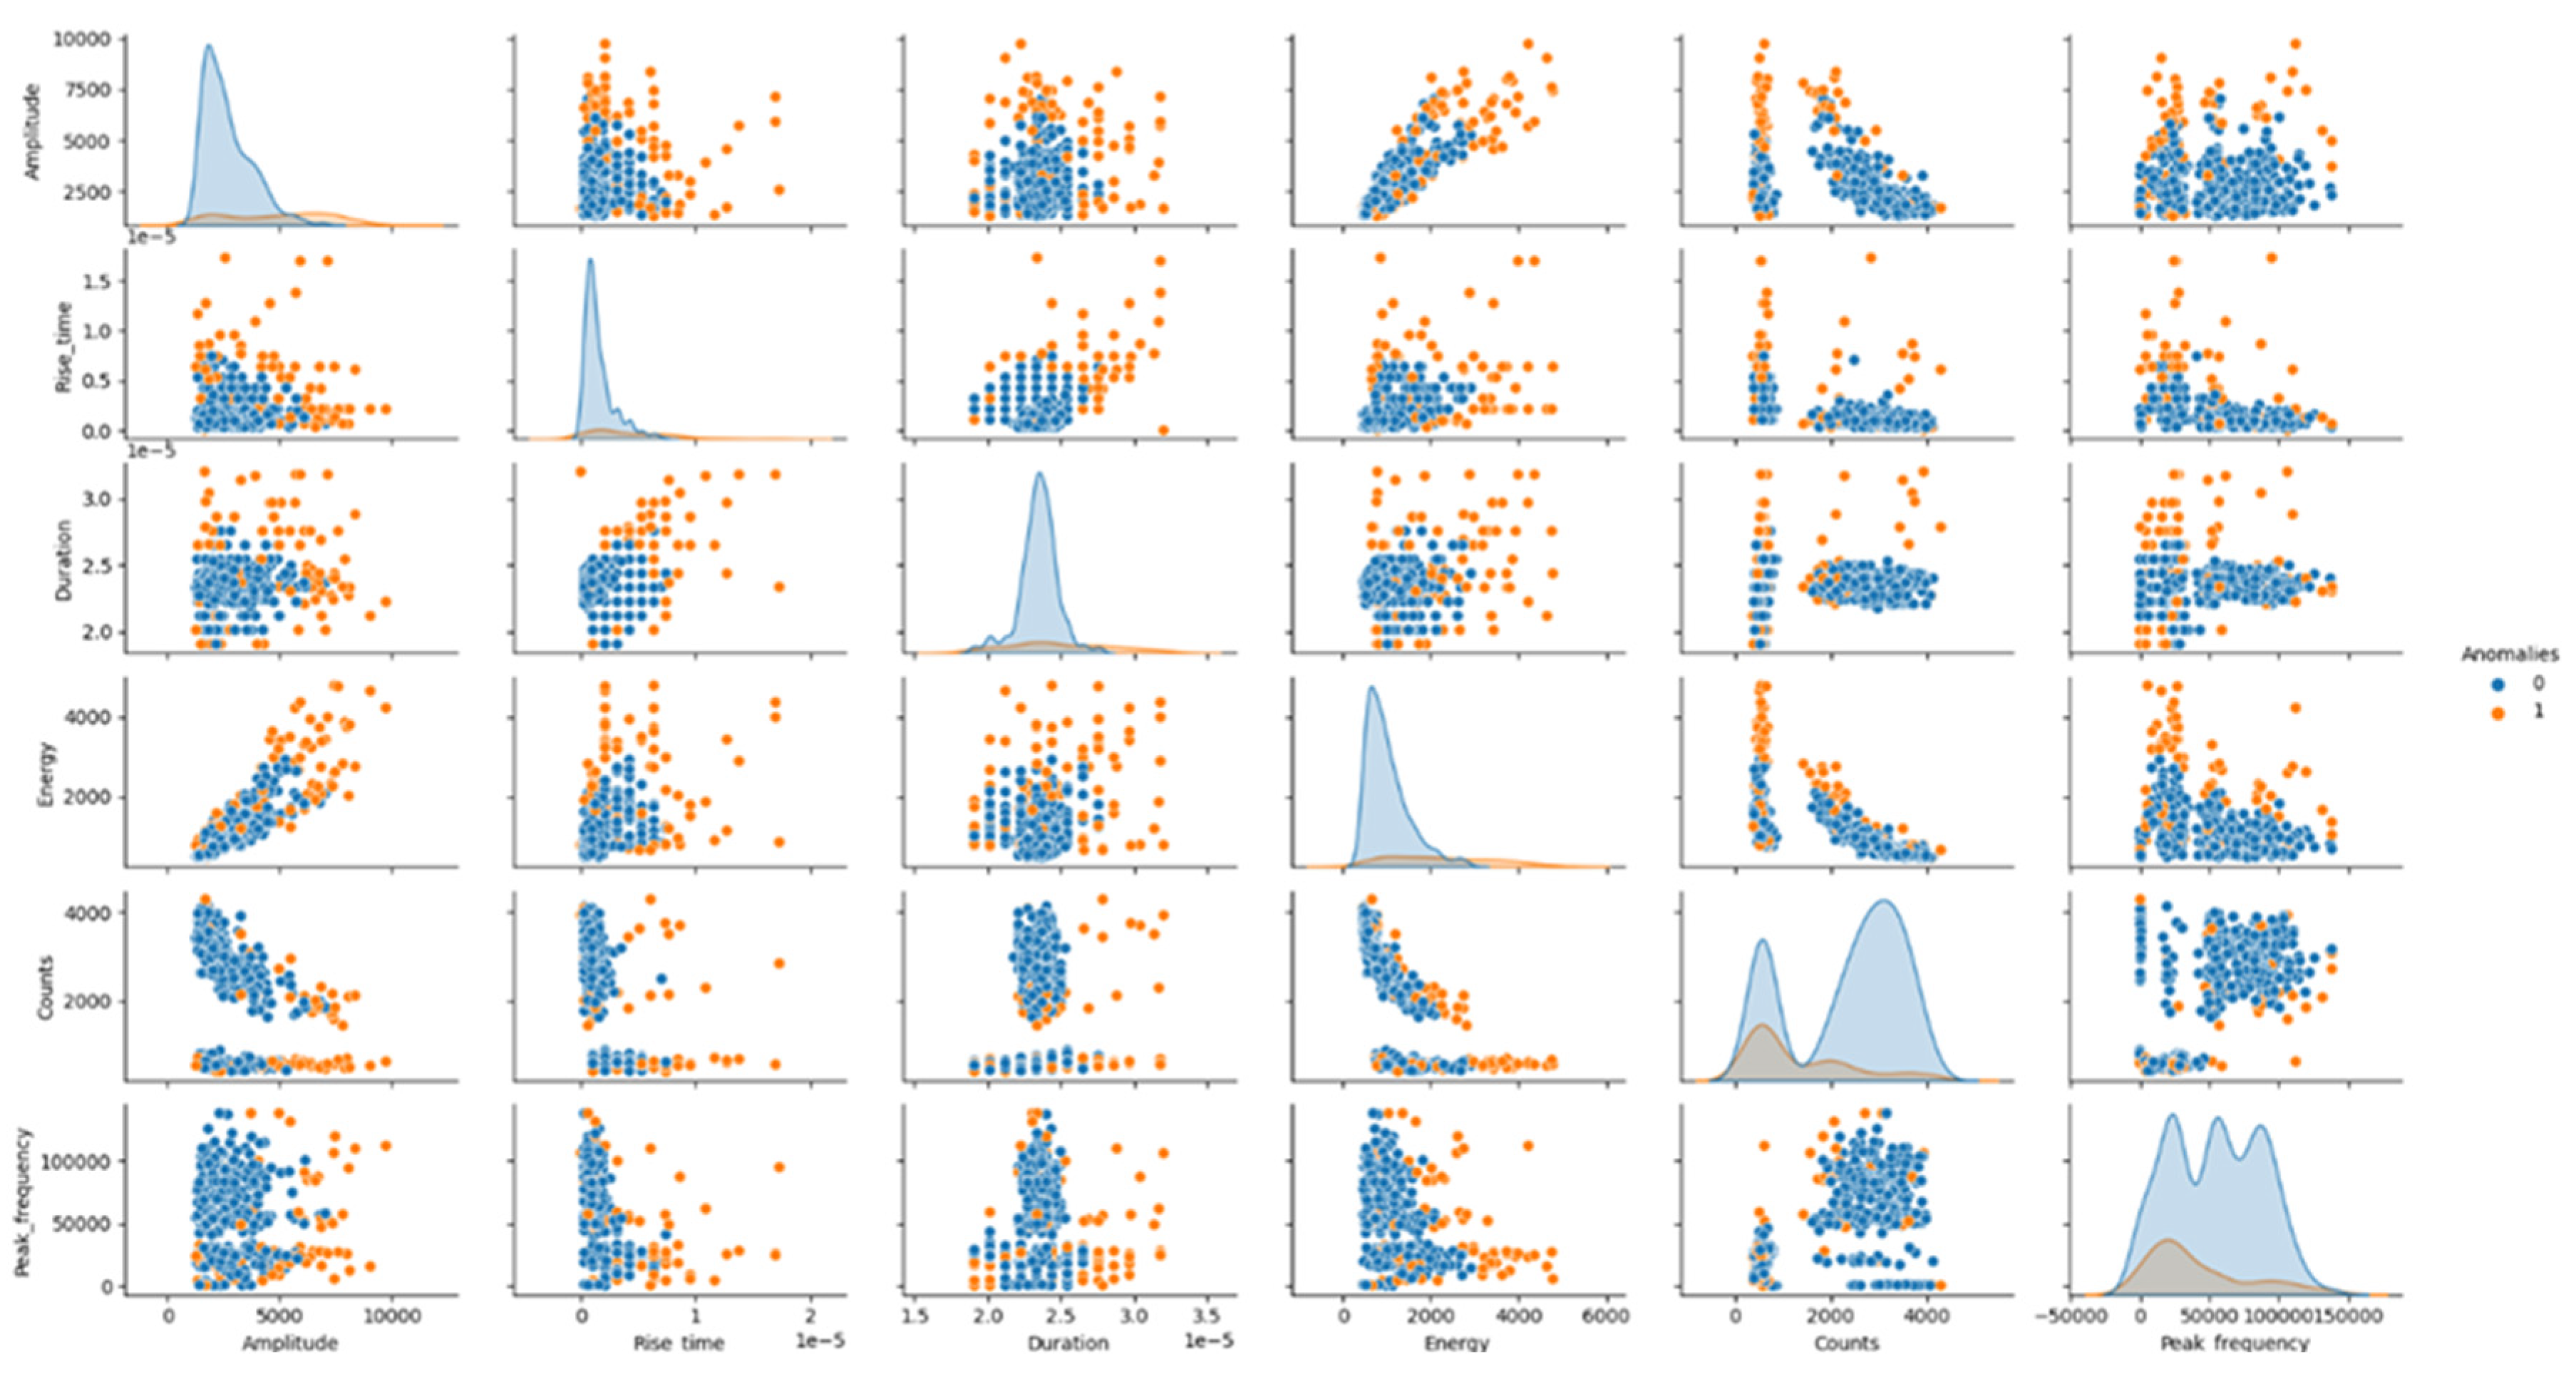
Such events appeared randomly during the whole test duration until the final stage of the test where the density of the events increased considerably prior to rupture. All these events, that appeared during the 37 minutes that lasted the fatigue test, were analyzed following the procedure explained in section 2.3. As previously mentioned, not all of them were studied but a threshold in the energy values was established so as to discard those that may be related to noise rather than a damage in the heat exchanger. With this discrimination criterion, a total of 910 events were identified with which the machine learning based classification was carried out based on the isolation forest algorithm. Six main acoustic features are employed for this classification (amplitude, rise time, duration, acoustic energy, counts and peak frequency). Results are illustrated in the form of pair plots using Seaborn library from Python. In the graph below, outliers (cracking events are considered as outliers) are marked in orange while blue ones represent other sources of noise such as scratching. The features that more distinguish cracks from other sources according to the study are: amplitude, rise time, duration and energy. On the other hand, no apparent differences are observed in relation to the number of counts and peak frequency while higher frequencies would be expected from cracking events. For instance, some authors identified peak frequency as the main relevant feature for different cracking mechanisms classification during corrosion phenomenon [
19]. Some others found out that frequencies above 350 kHz are strongly correlated with crack counts in some industrial processes like cladding [
20].
Figure 9.
Pair plot illustrating features that distinguish cracking events from other sources.
Figure 9.
Pair plot illustrating features that distinguish cracking events from other sources.
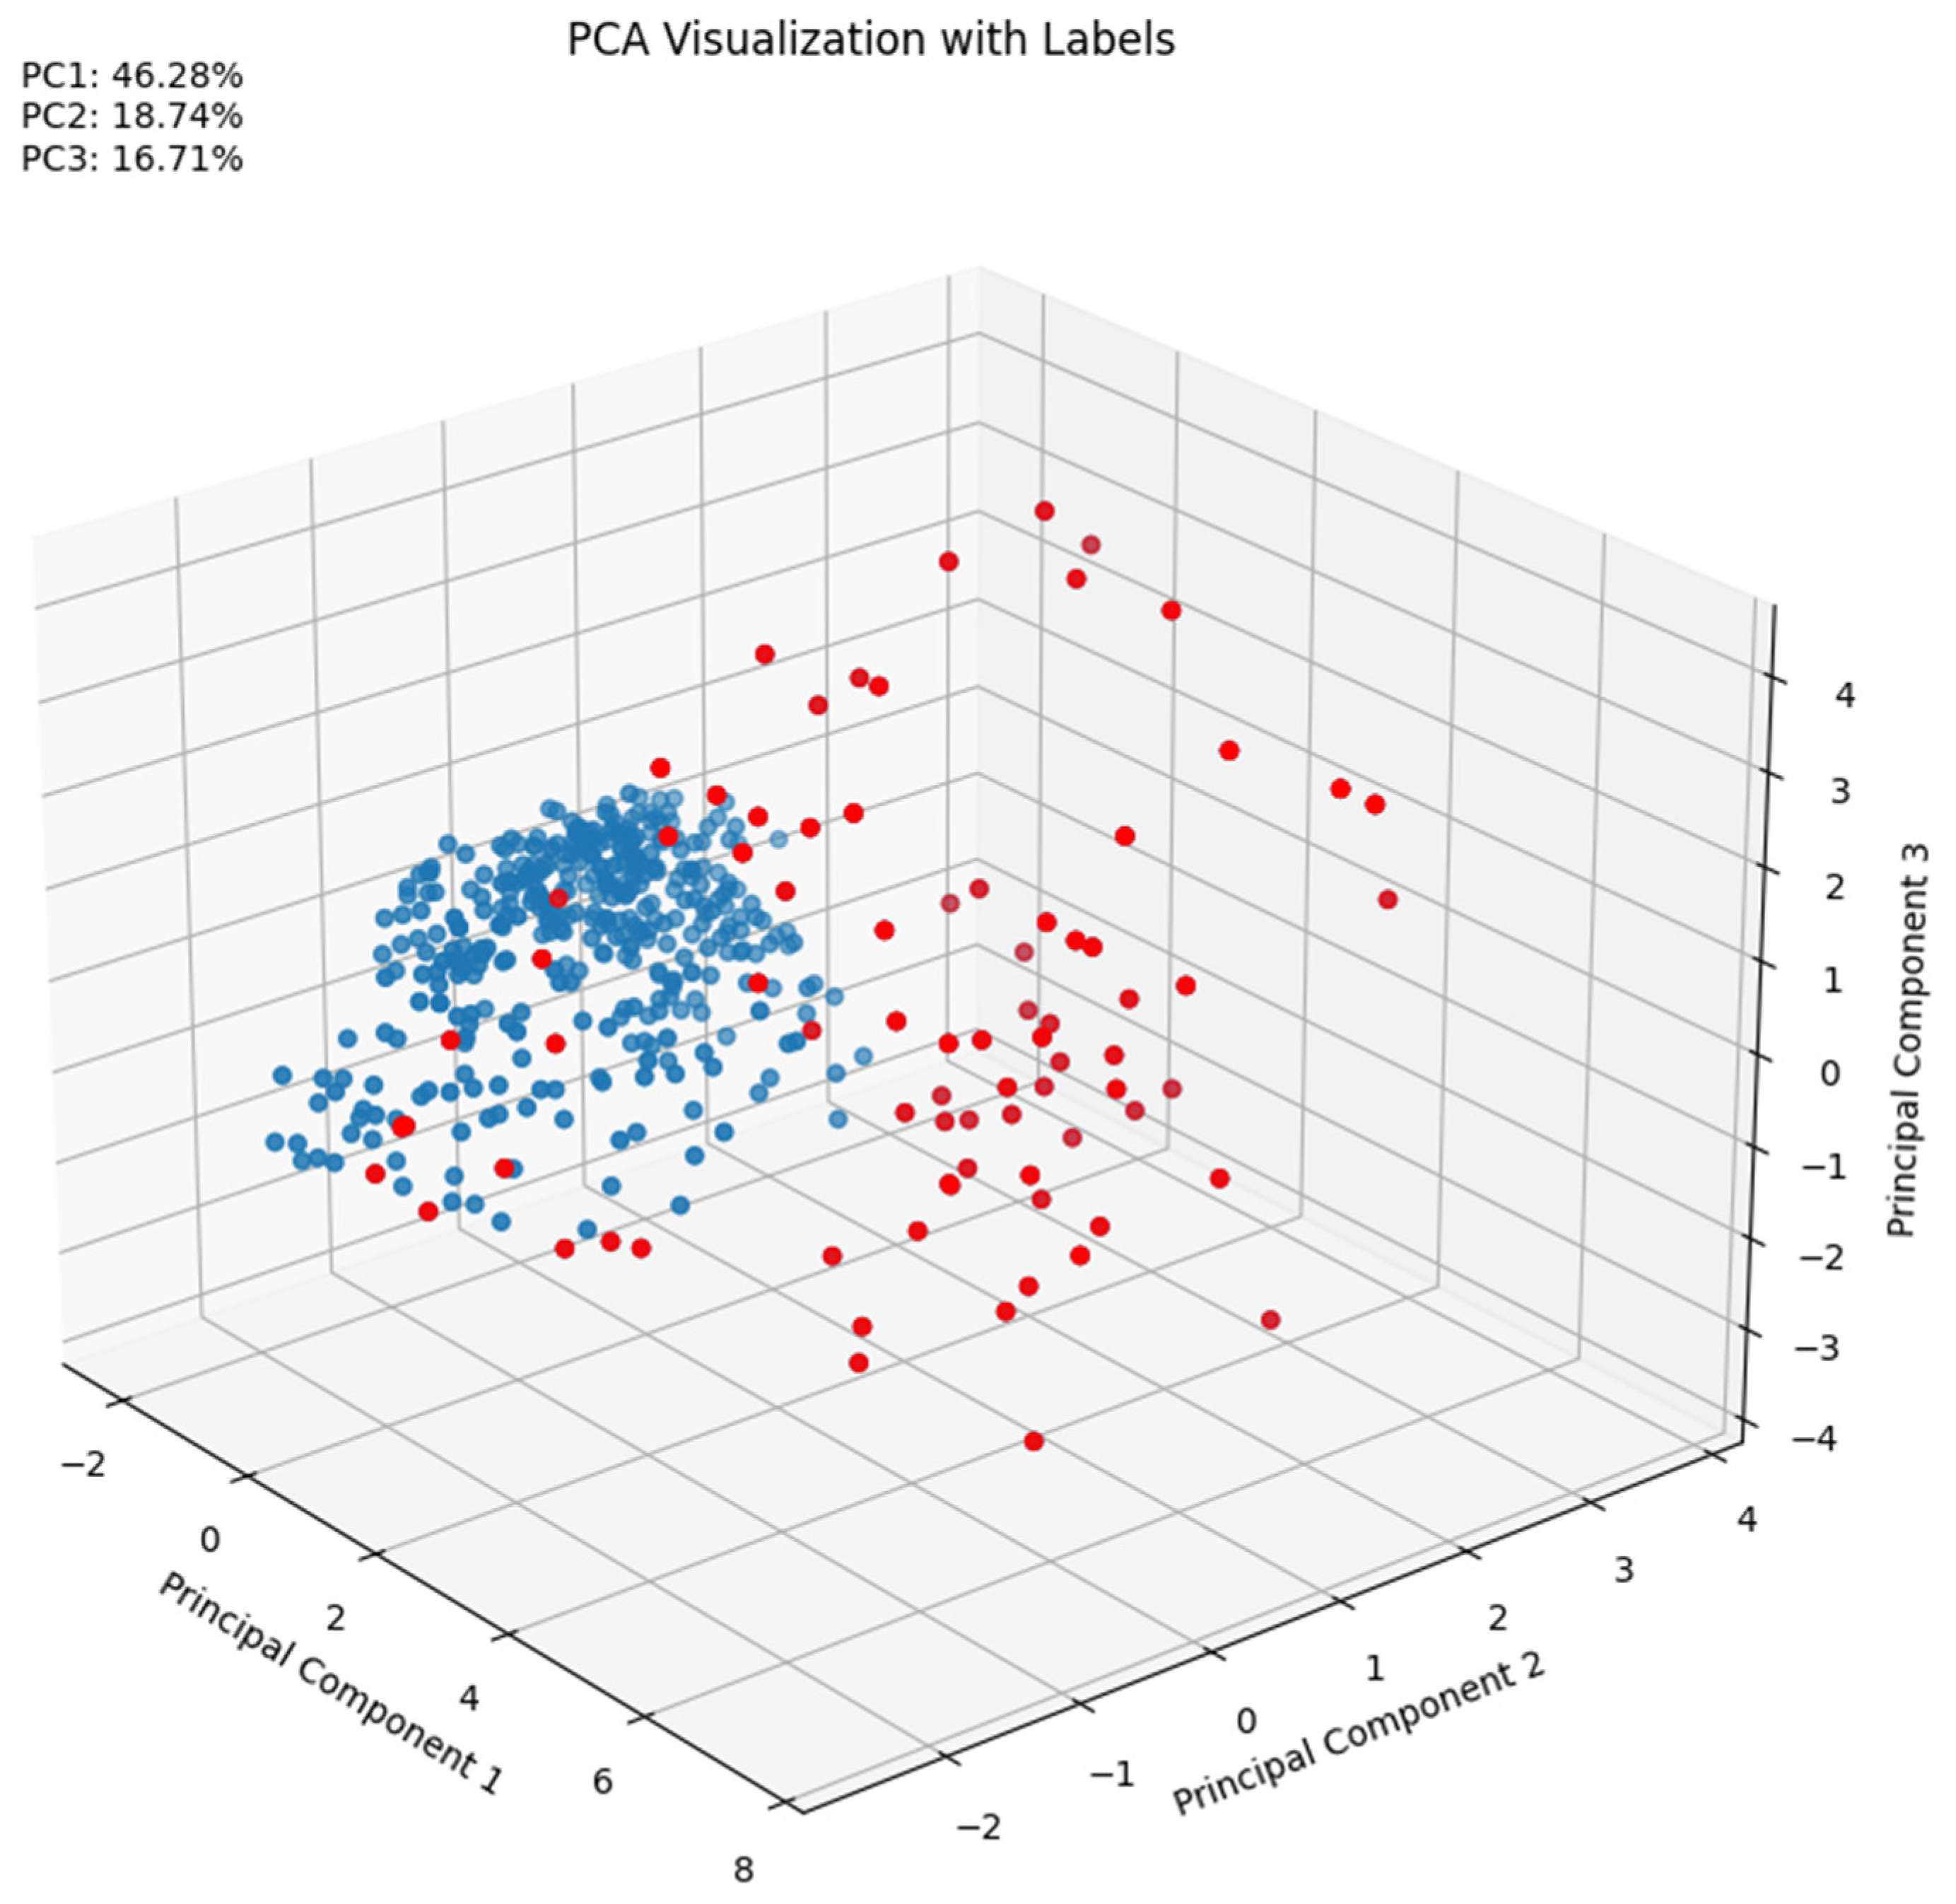
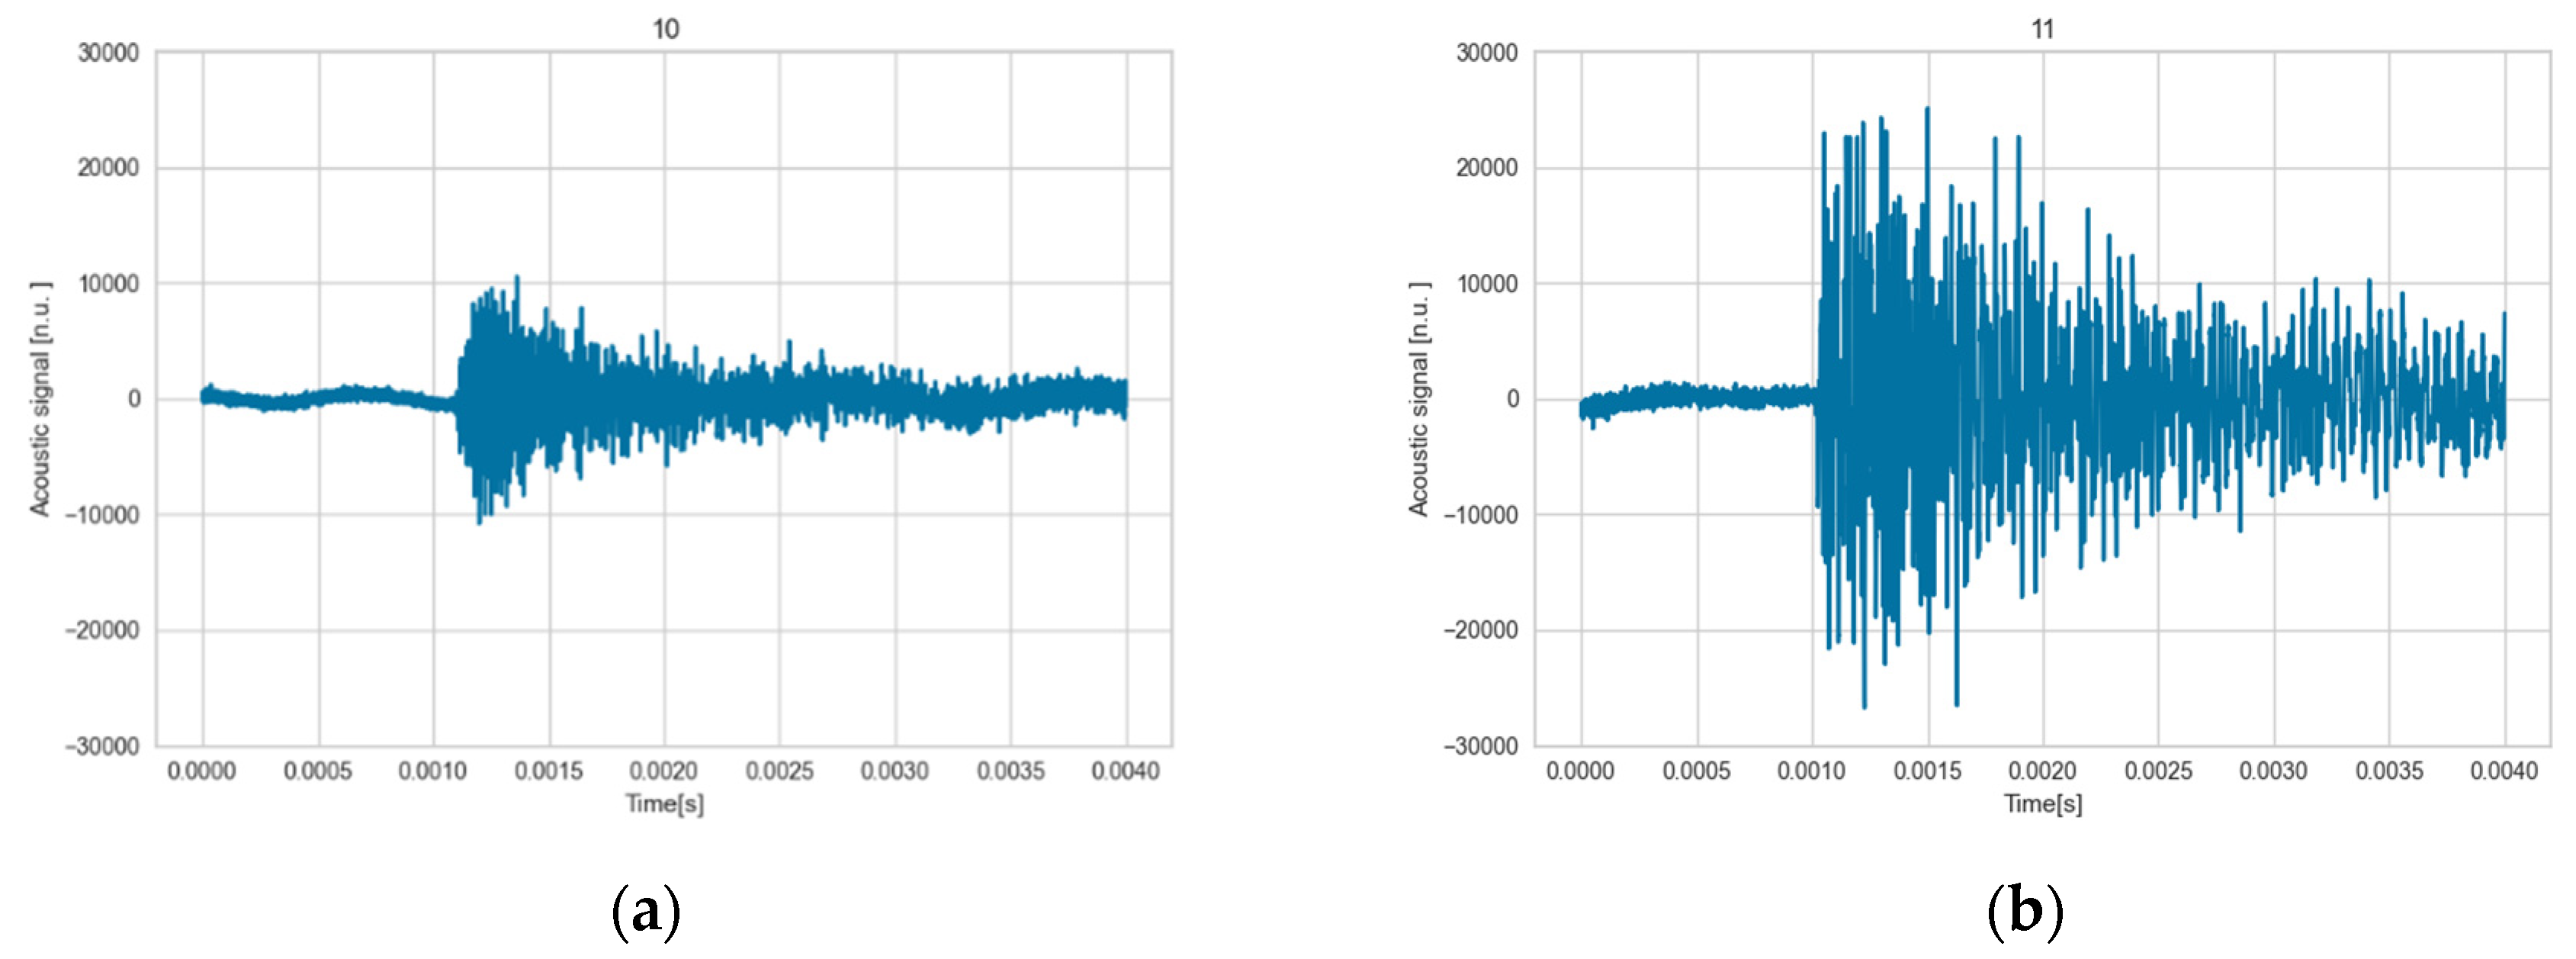
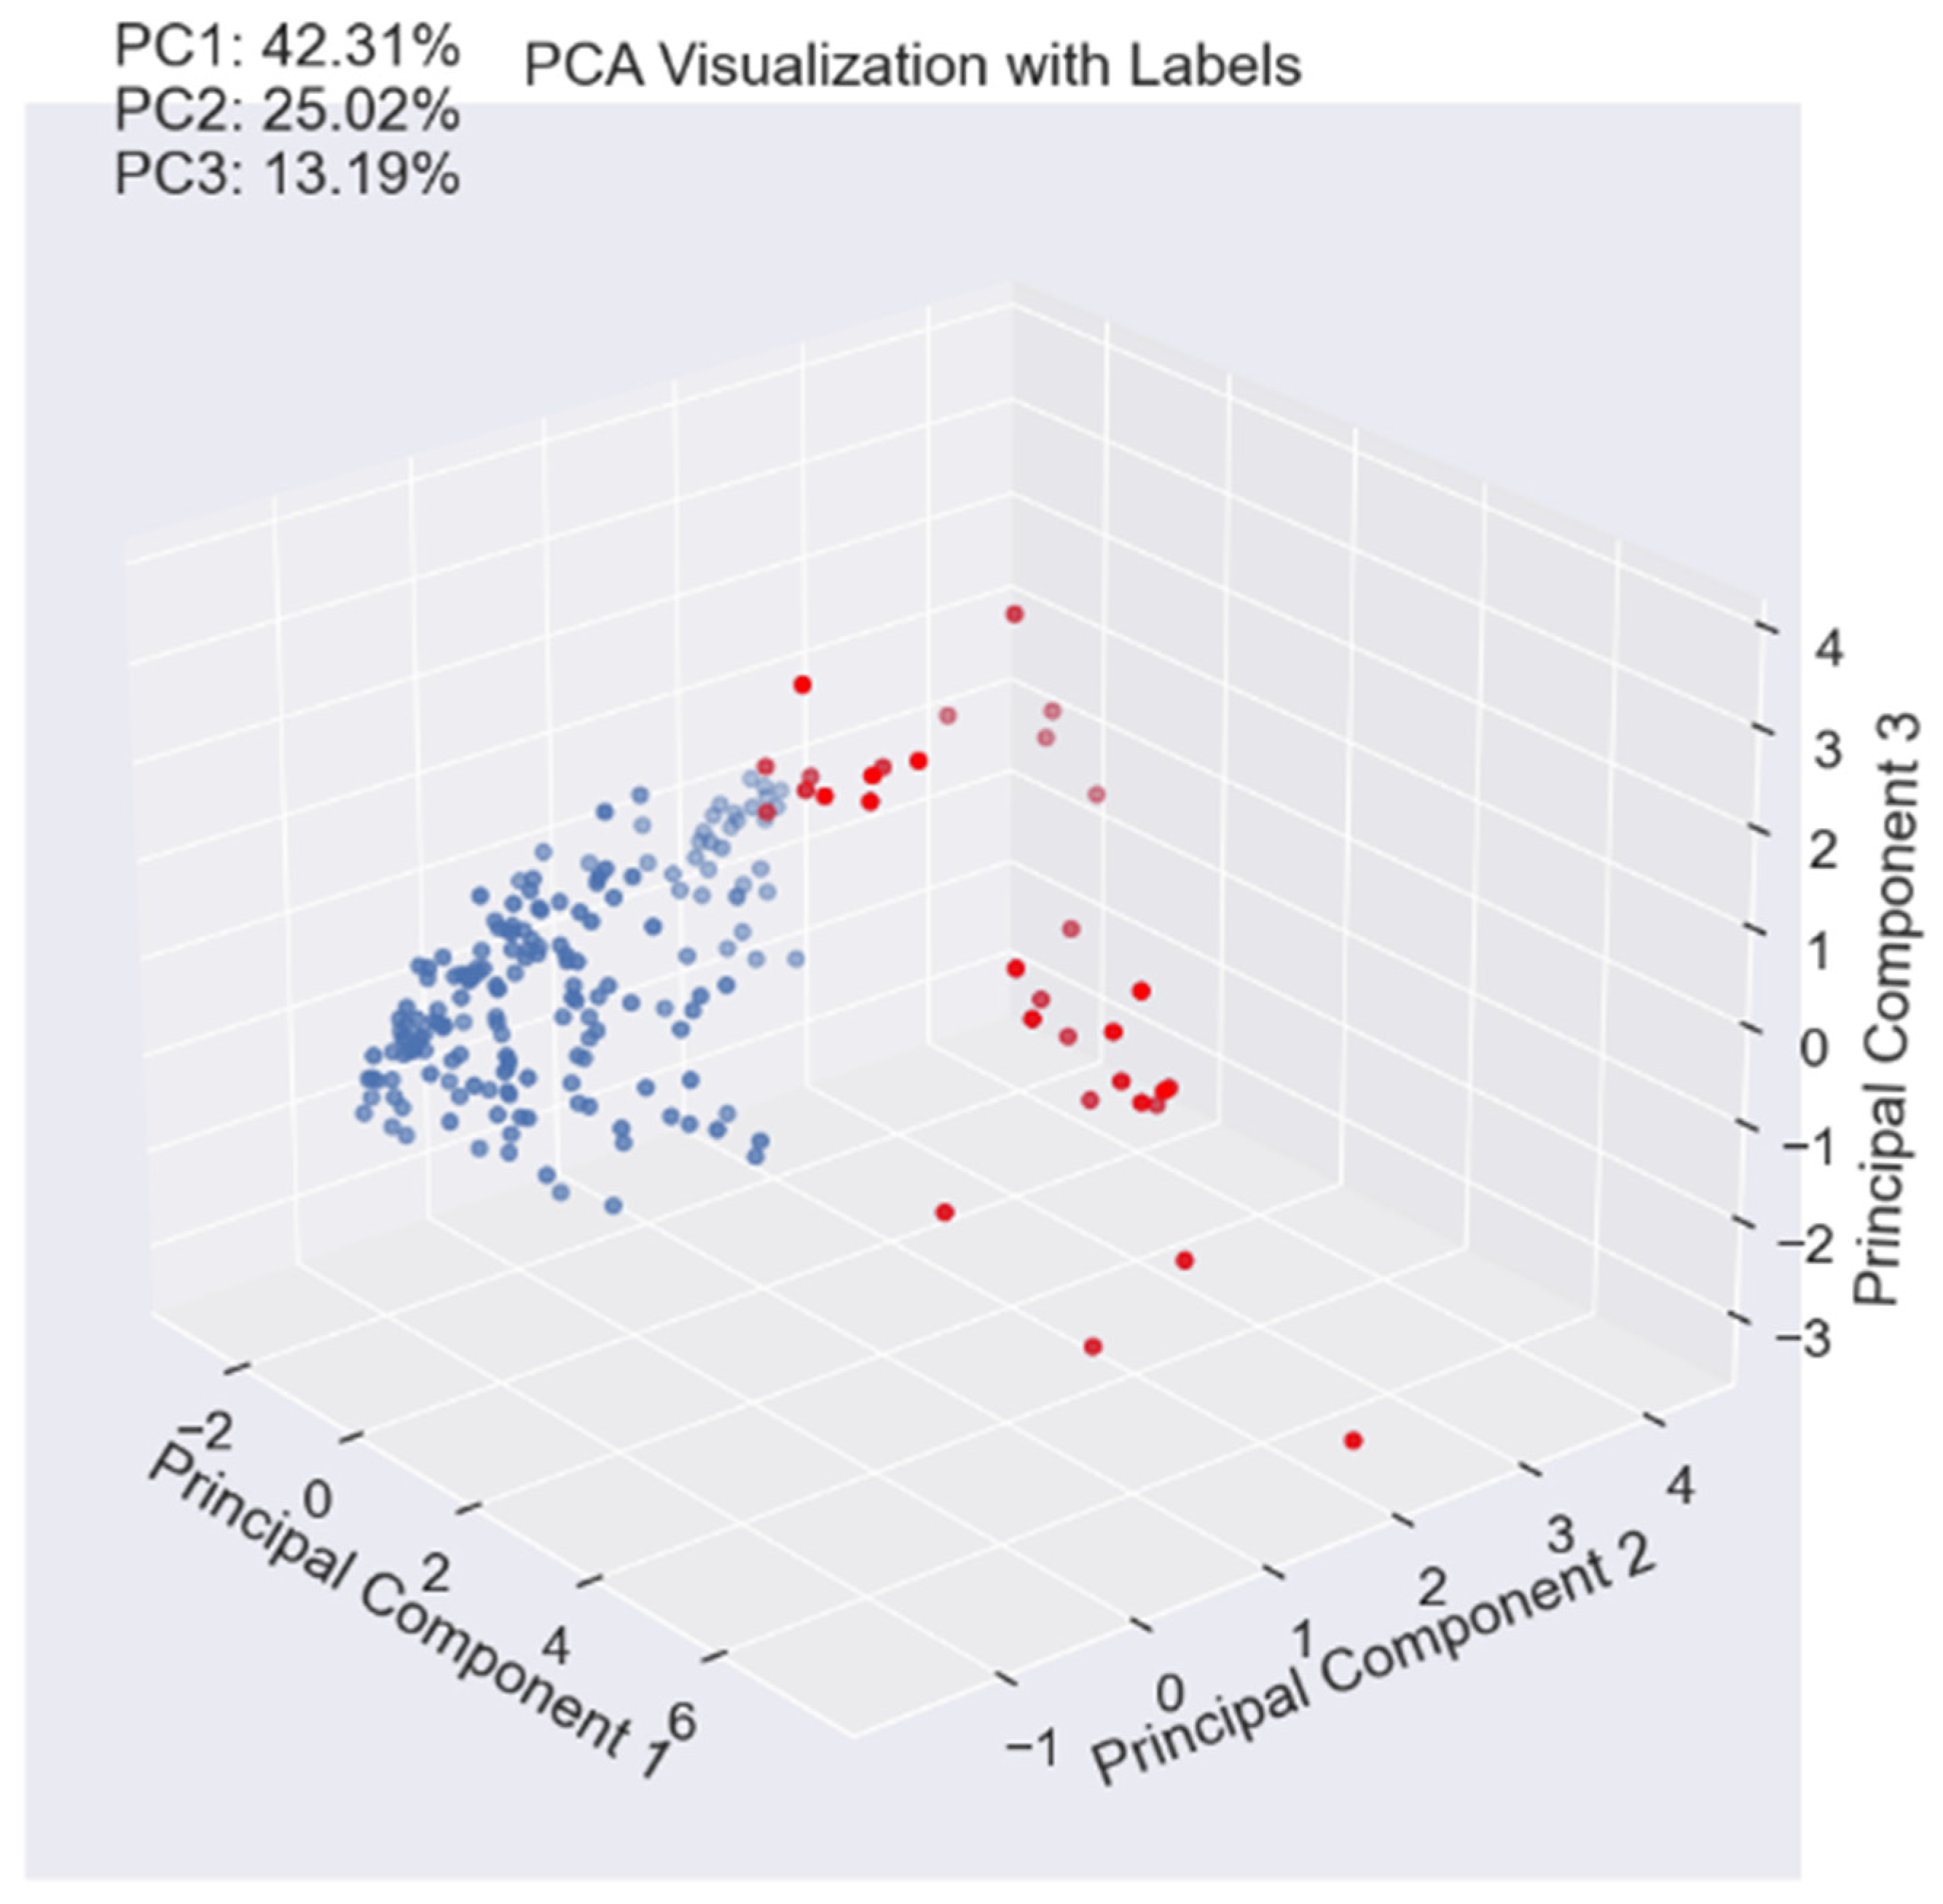
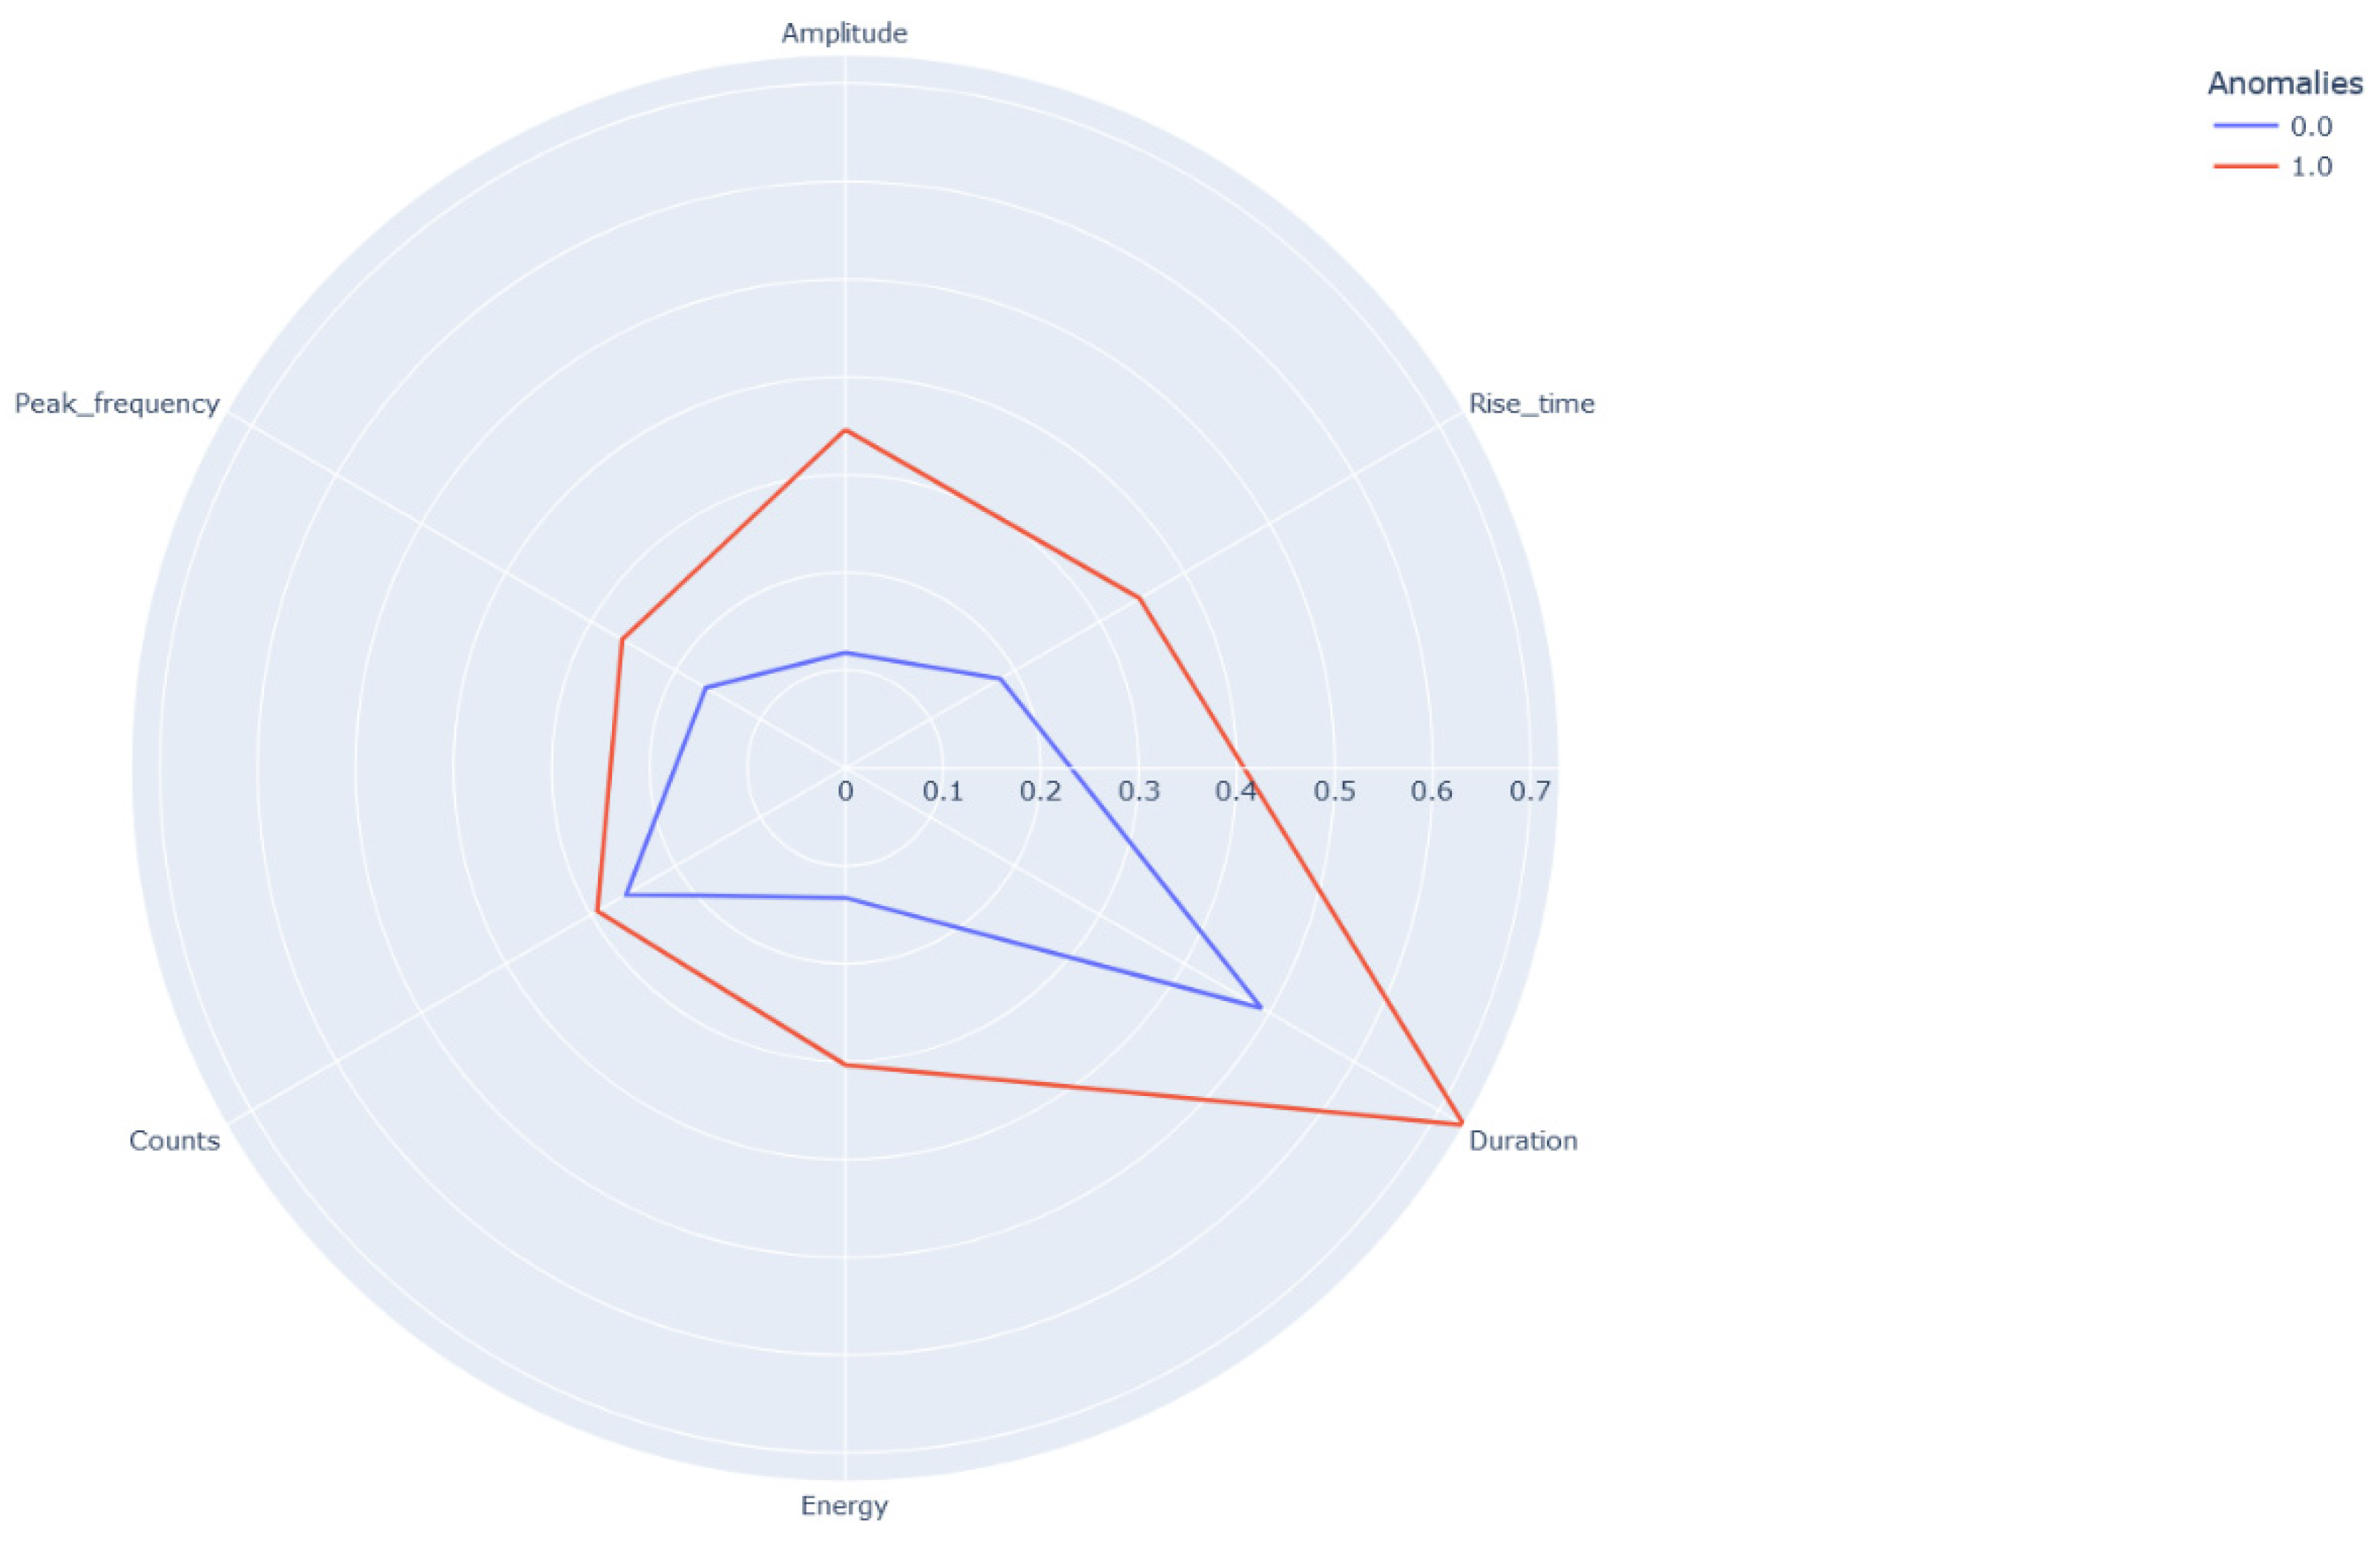
If this classification is represented based on a Principal Component Analysis, it is observed that the main three components explain 80 % of the variability and the two classes (red -cracking- and blue -other sources of noise-) are clearly visible. This means that both types of signals may be distinguished. As an example, in the following figure a representative sample of each one of the signals is illustrated showing that outliers (image on the right side) contain higher amplitude signals with higher energy, rise-time and duration that the others (image on the left side).
Figure 10.
PCA analysis and the two classes that are distinguished.
Figure 10.
PCA analysis and the two classes that are distinguished.
Figure 11.
Comparison between outlier signal (cracking event on (a)) with rest of the signals (b) showing different amplitude and duration.
Figure 11.
Comparison between outlier signal (cracking event on (a)) with rest of the signals (b) showing different amplitude and duration.
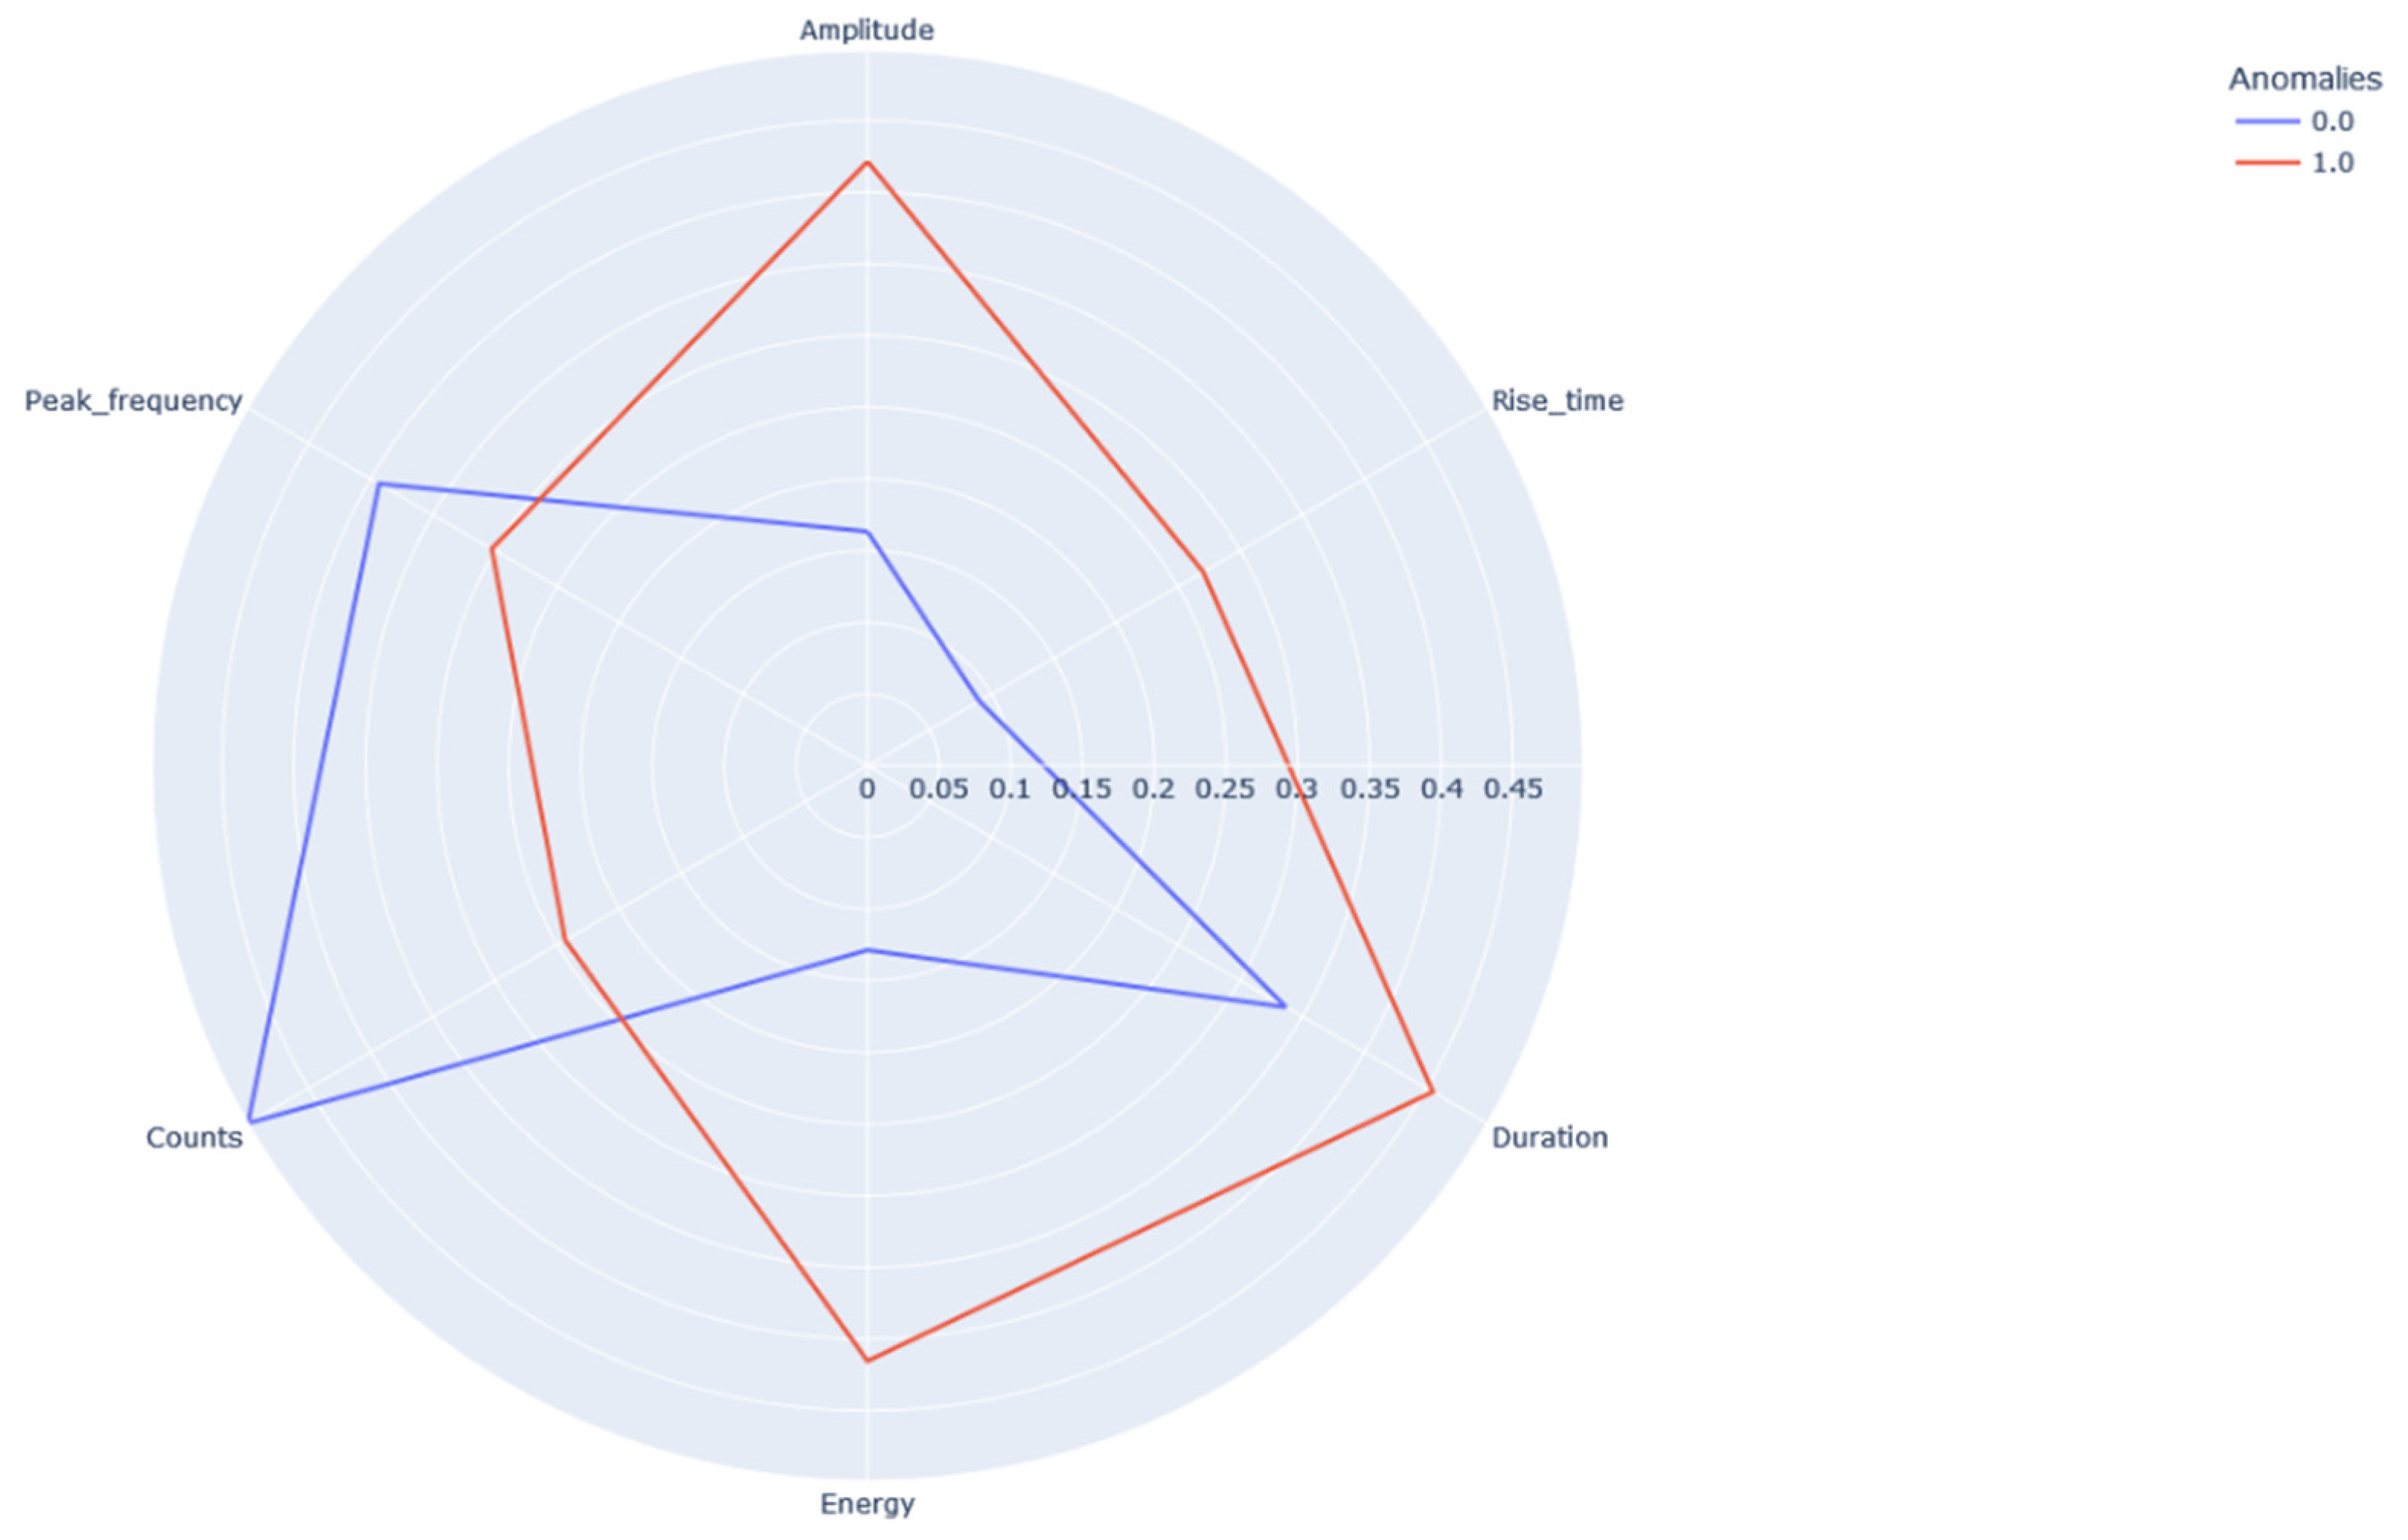
Figure 12.
Polar graph representing the average values of the two classes.
Figure 12.
Polar graph representing the average values of the two classes.
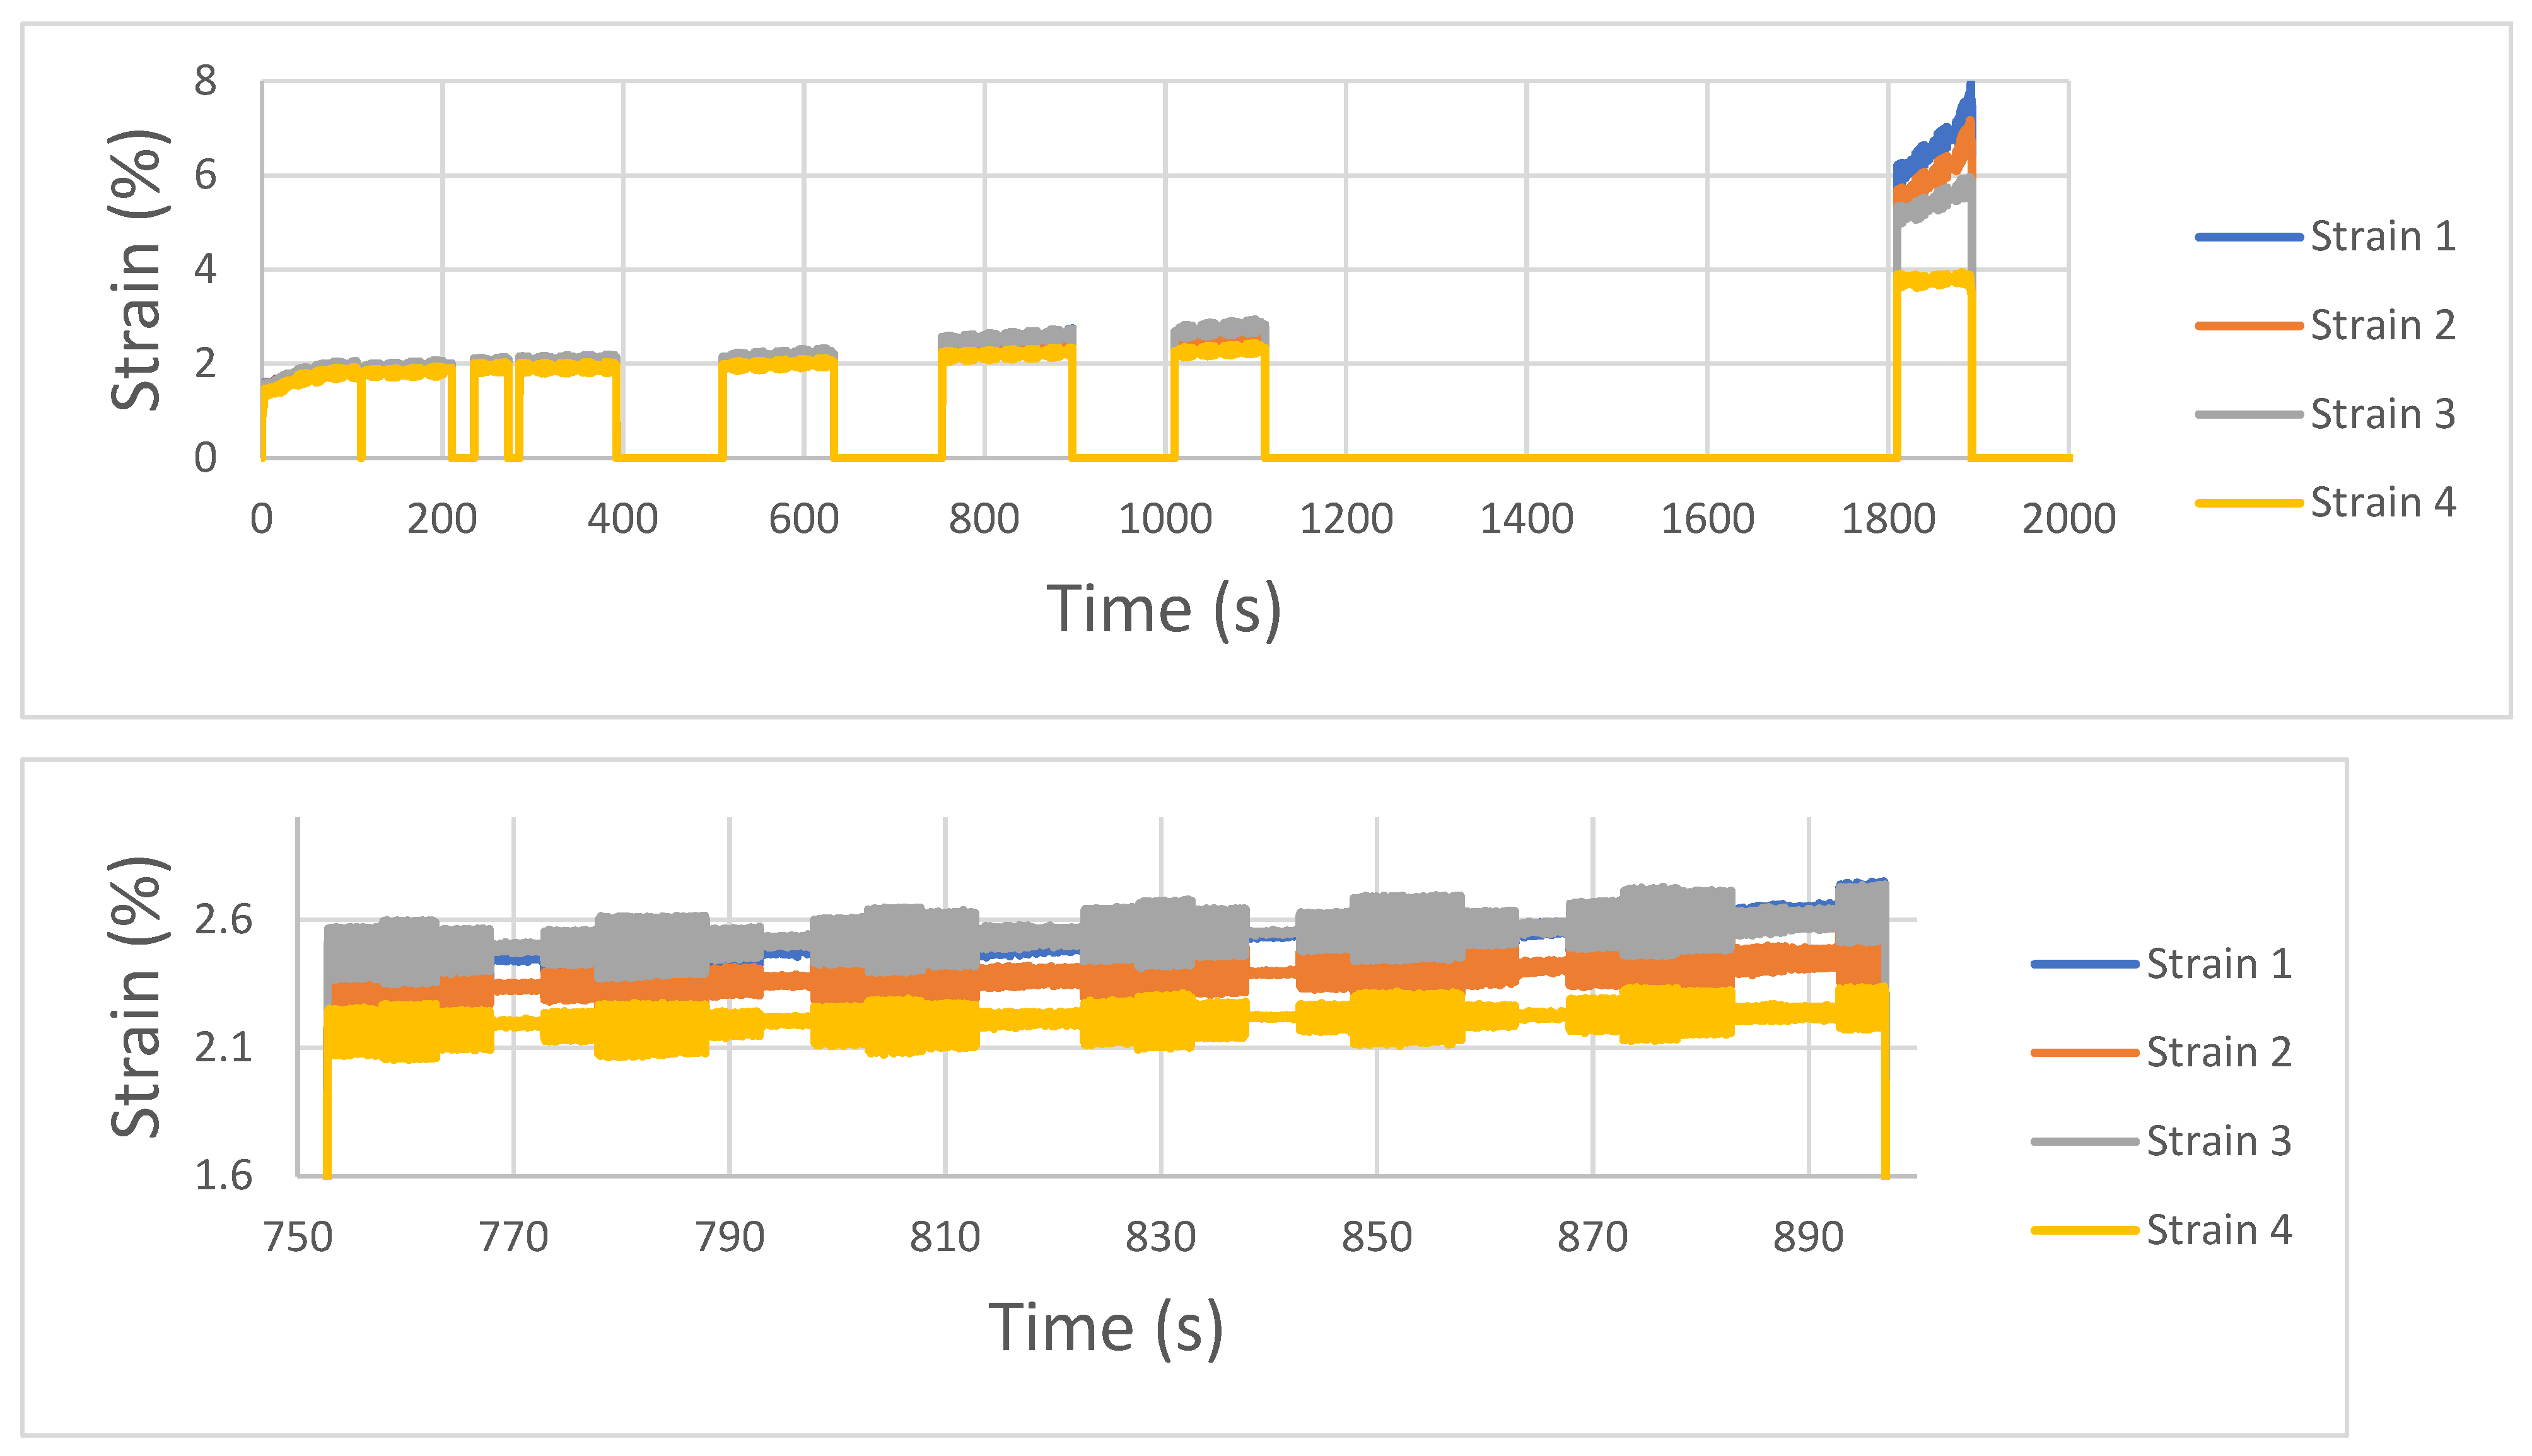
With respect to the DIC analysis, the following graph shows the strain evolution of 4 different points present in the heat exchanger corresponding to the same position in the longitudinal axis as illustrated in
Figure 5. This way of representing data helps understand any strain redistributions that may be ascribed to inner defects. Under normal conditions, with no existing damage, the four strain values should report the same level meaning that strain is distributed homogeneously. On the contrary, under the presence of a damaged fin a redistribution of the strain would happen as some part of the heat exchanger is not able to transmit the same load. In particular, in the following graph the mentioned evolution is illustrated. It is observed that from the 750 second on, a redistribution of the strain is observed, as strain 1 to 3 values are higher than 4, located at the right side of the component. This indicates that damage occurred at the left side of the heat exchanger where higher deformation levels are achieved. In fact, heat exchanger broke from that exact location. Therefore, the damage was effectively identified by the DIC approach. If this indication is compared to the one given by the microphone, it may be stated that damage is identified at a later stage with DIC system. This may be due to the fact that a cracking event -correctly captured by the microphone-does not generate sufficient strain redistribution to be captured by the DIC and more ruptures have to occur to create identifiable damage. On the other hand, DIC system does not require any classification to distinguish between noise and real events as the real magnitude -strain- is measured. Besides, this measurement is quantitative as it is given by the degree of strain redistribution.
Figure 13.
Different locations strain along the whole tests. Signal discontinuities represent sequences that were not analyzed due to the high number of images.
Figure 13.
Different locations strain along the whole tests. Signal discontinuities represent sequences that were not analyzed due to the high number of images.
3.2. Non accelerated fatigue tests
With respect to non-accelerated tests, where loads were much lower, initial acoustic events appear at a later state of the test this suggest that damage is not generated until several cycles are run as expected. In the spectrogram the absence of events during the first minutes of the test is observed unlike in the accelerated test. When it comes to events classification, a similar behavior compared to accelerated tests is observed. This is clearly illustrated in the polar graph. One can observe that in average all the features are considerably higher for cracking events except for the counts and peak frequency (see
Figure 14). This is in good agreement with the finding the in the accelerated test. One of the main differences is that the total number of events identified during the test was reduced to 207 instead of the 910 counts in the accelerated test. This is also aligned with the damage level suffered by each one of the components, which was obviously much more severe for the case of accelerated test.
In the case of the strain evolution from DIC system, the level keeps constant until the last stages of the tests where a clearly noticeable redistribution is observed. In this particular case, strain 3 and strain 4 levels are kept at a lower level while strain 1 and strain 2 levels increases dramatically until rupture. This again indicates that failure occurred at the left side of the sandwich structure. Similar to the accelerated test, the strain redistribution was captured later than the first acoustic events.
Figure 16.
Different locations strain along the whole tests; non-accelerated test.
Figure 16.
Different locations strain along the whole tests; non-accelerated test.
3.3. Damage Tolerance tests
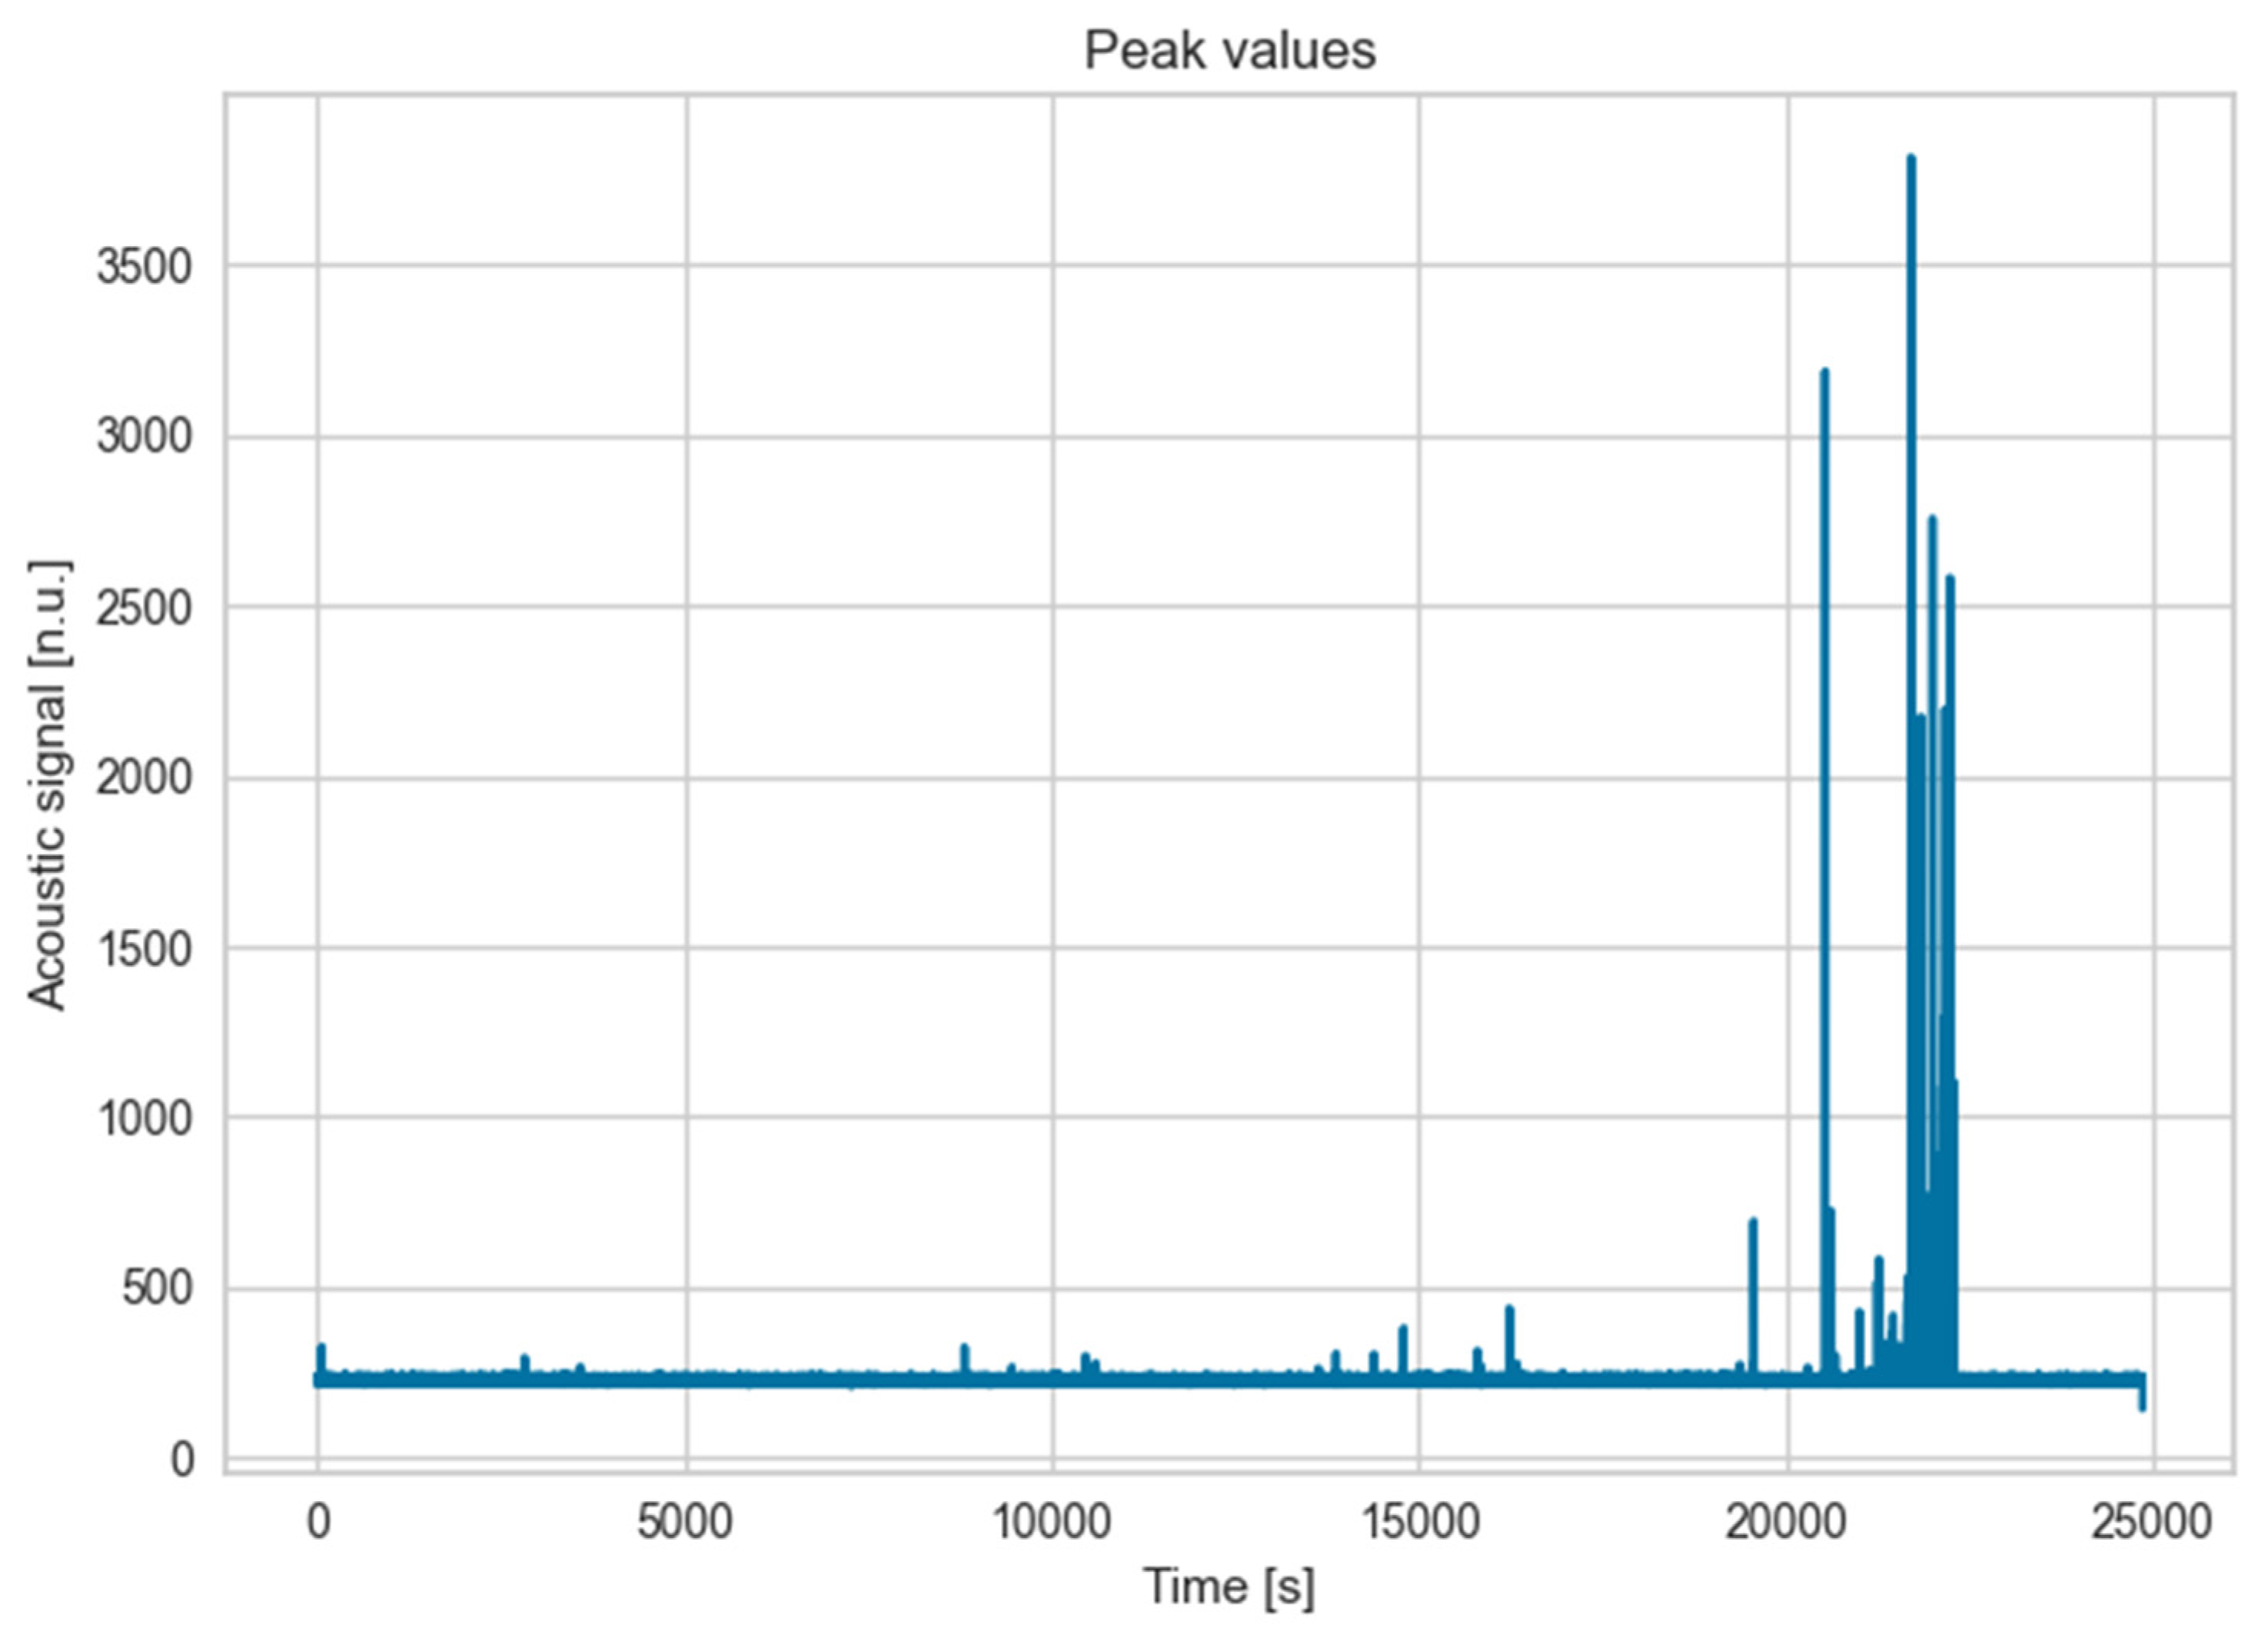
For the damage tolerance assessment, one of the fins was cut in order to create a crack from which damage could propagate. The purpose of this experiment was to identify whether crack propagation in such a thin fin can be captured. For that aim, a load range between 100-1,000 N with a fatigue ratio R equal to -1. After several cycles (>20,000 cycles) the load was increased to 120-1,200 due to the absence of any propagation of the crack and not long after (,.000 cycles) acoustic signals emerged prior to the heat exchanger rupture. As illustrated in the image, high acoustic signals were revealed at the end of the tests while few or insignificant events (in terms of acoustic energy) were observed before that point. It has to be mentioned that rupture did not occur from the cracked fin but from multiple initiation points which was proved in the fracture surface. The cracked fin broke at the final stage of the test together with the rest and therefore, the signal footprint ascribed to the crack propagation may be masked by the abrupt acoustic signals of multiple cracking.
Figure 17.
Acoustic signals increase at the final stage of the test.
Figure 17.
Acoustic signals increase at the final stage of the test.
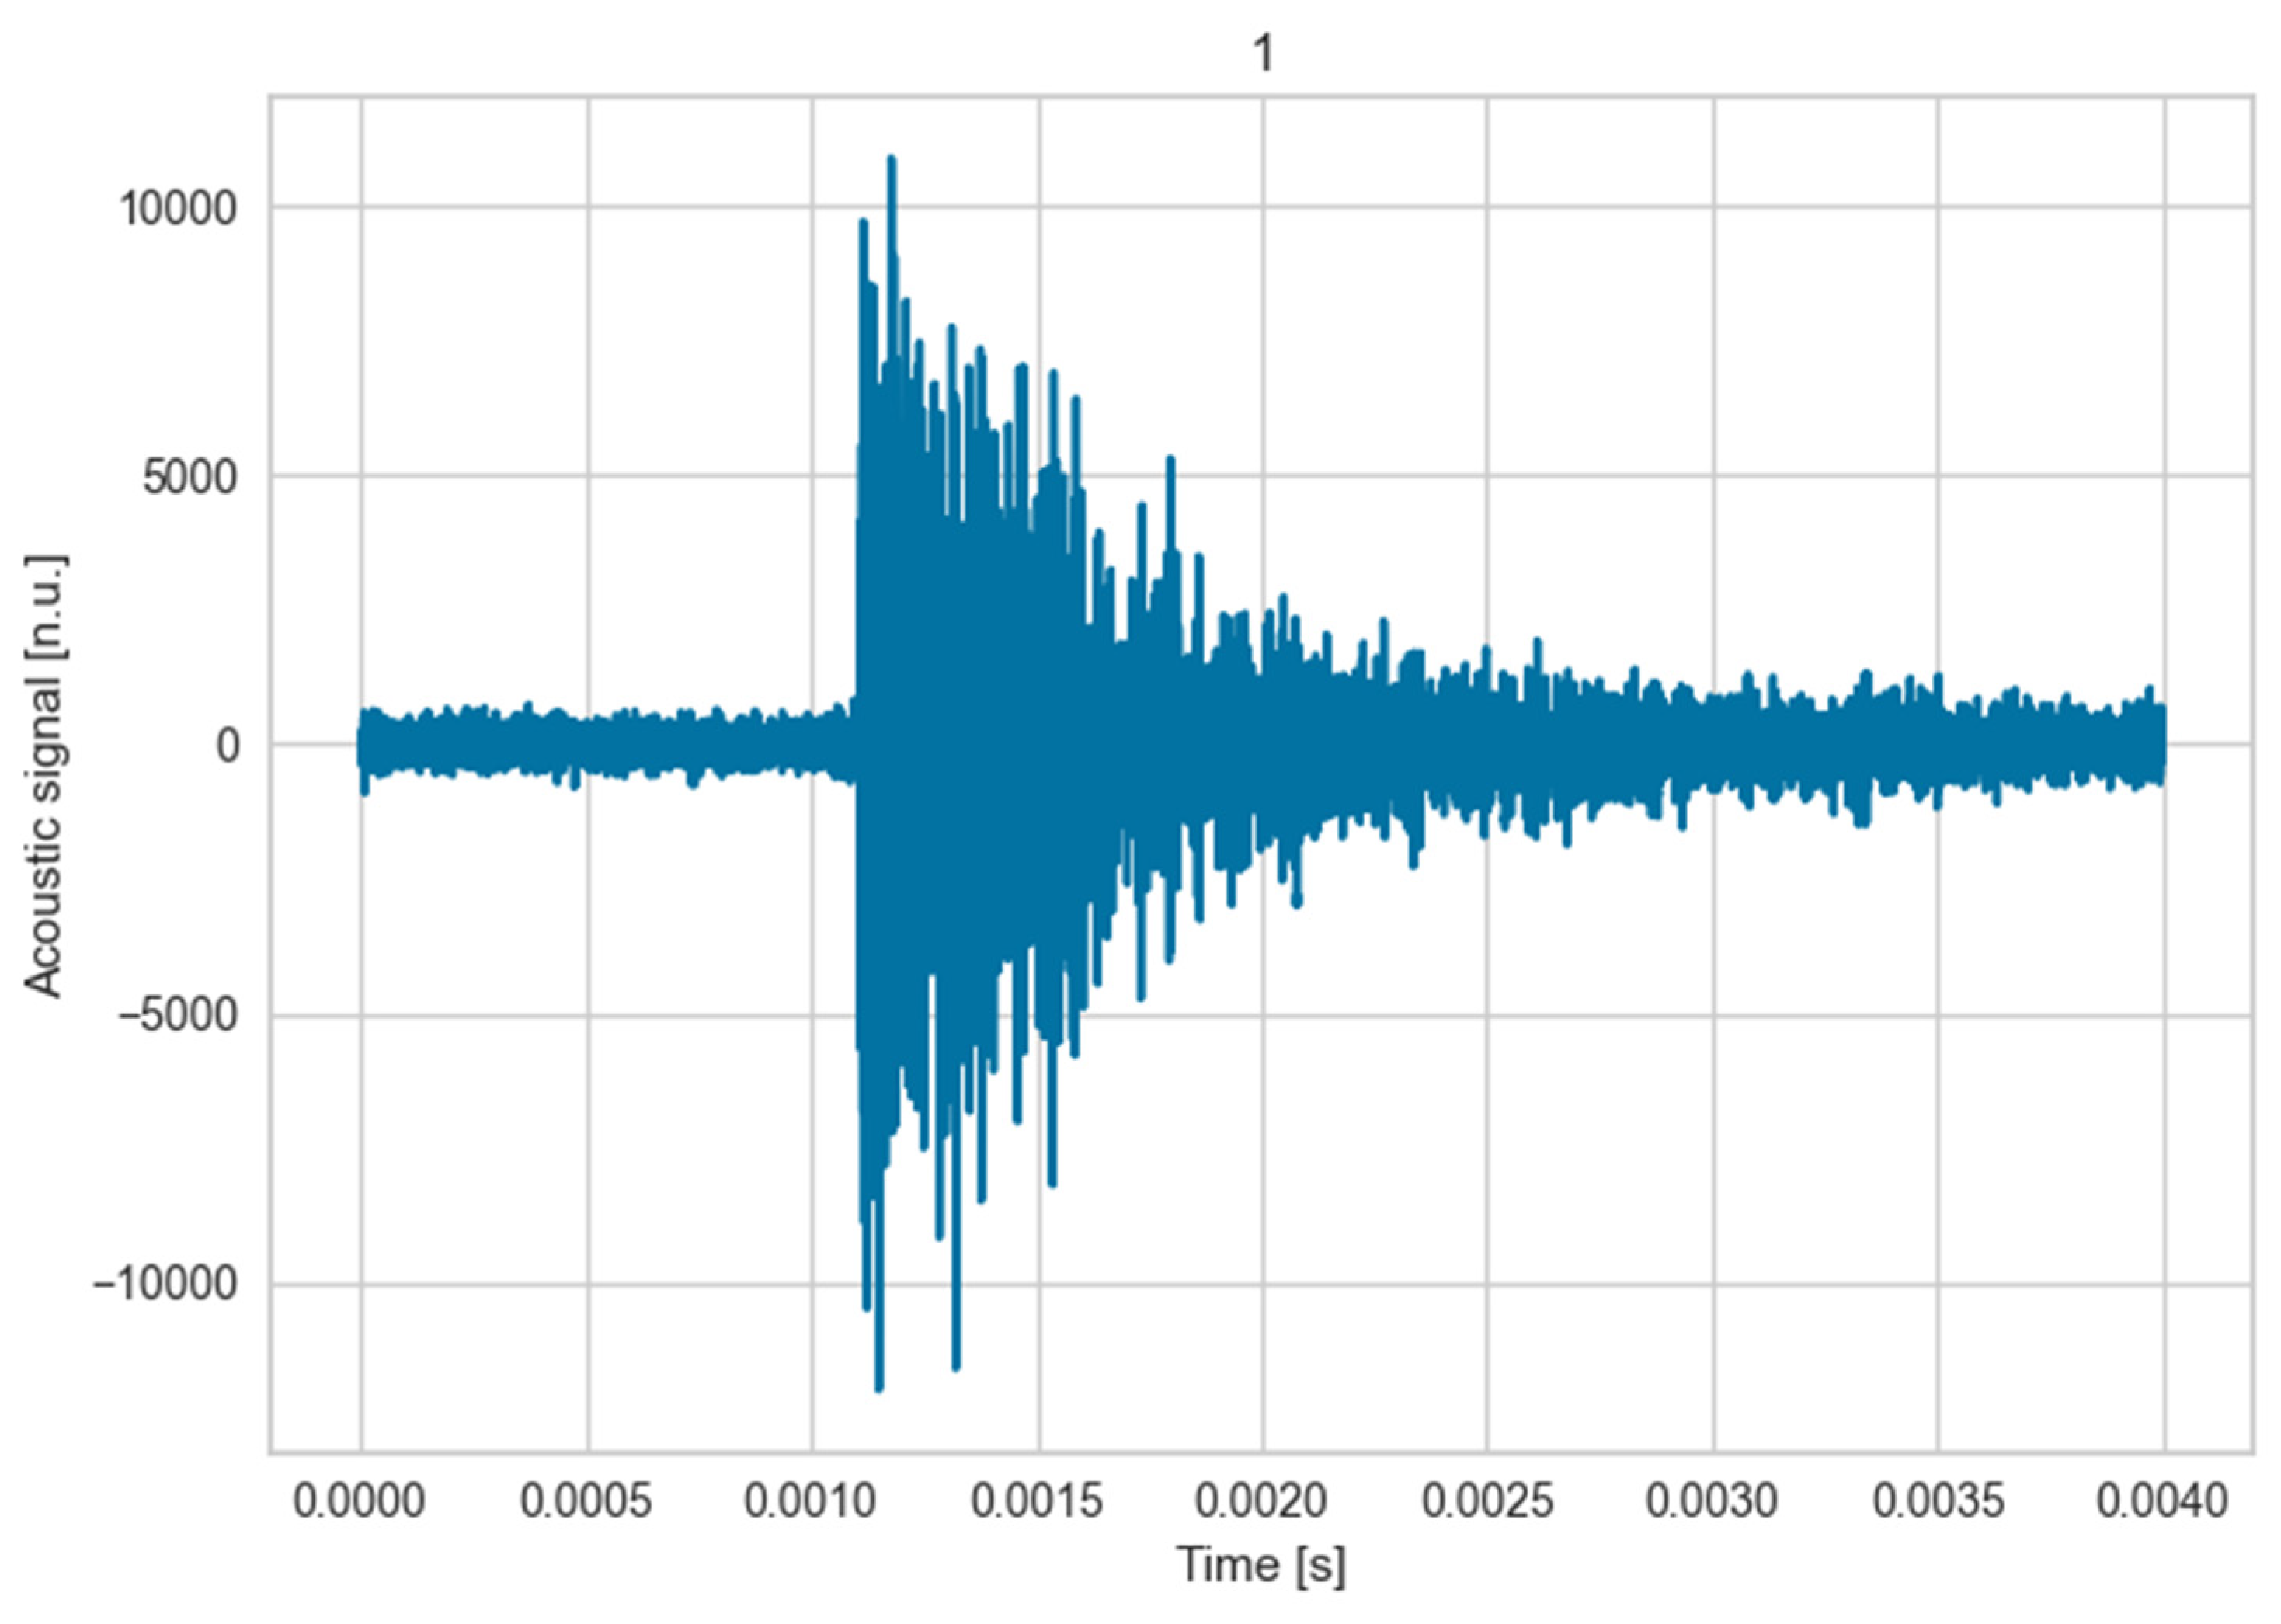
With respect to signals classification, the resulting number of events were low to apply the same machine learning algorithm than in the two previous cases. However, the type of signals had similar features as the ones corresponding to cracks as it may be observed in the following figure:
Figure 18.
Acoustic event example from the damage tolerance test.
Figure 18.
Acoustic event example from the damage tolerance test.
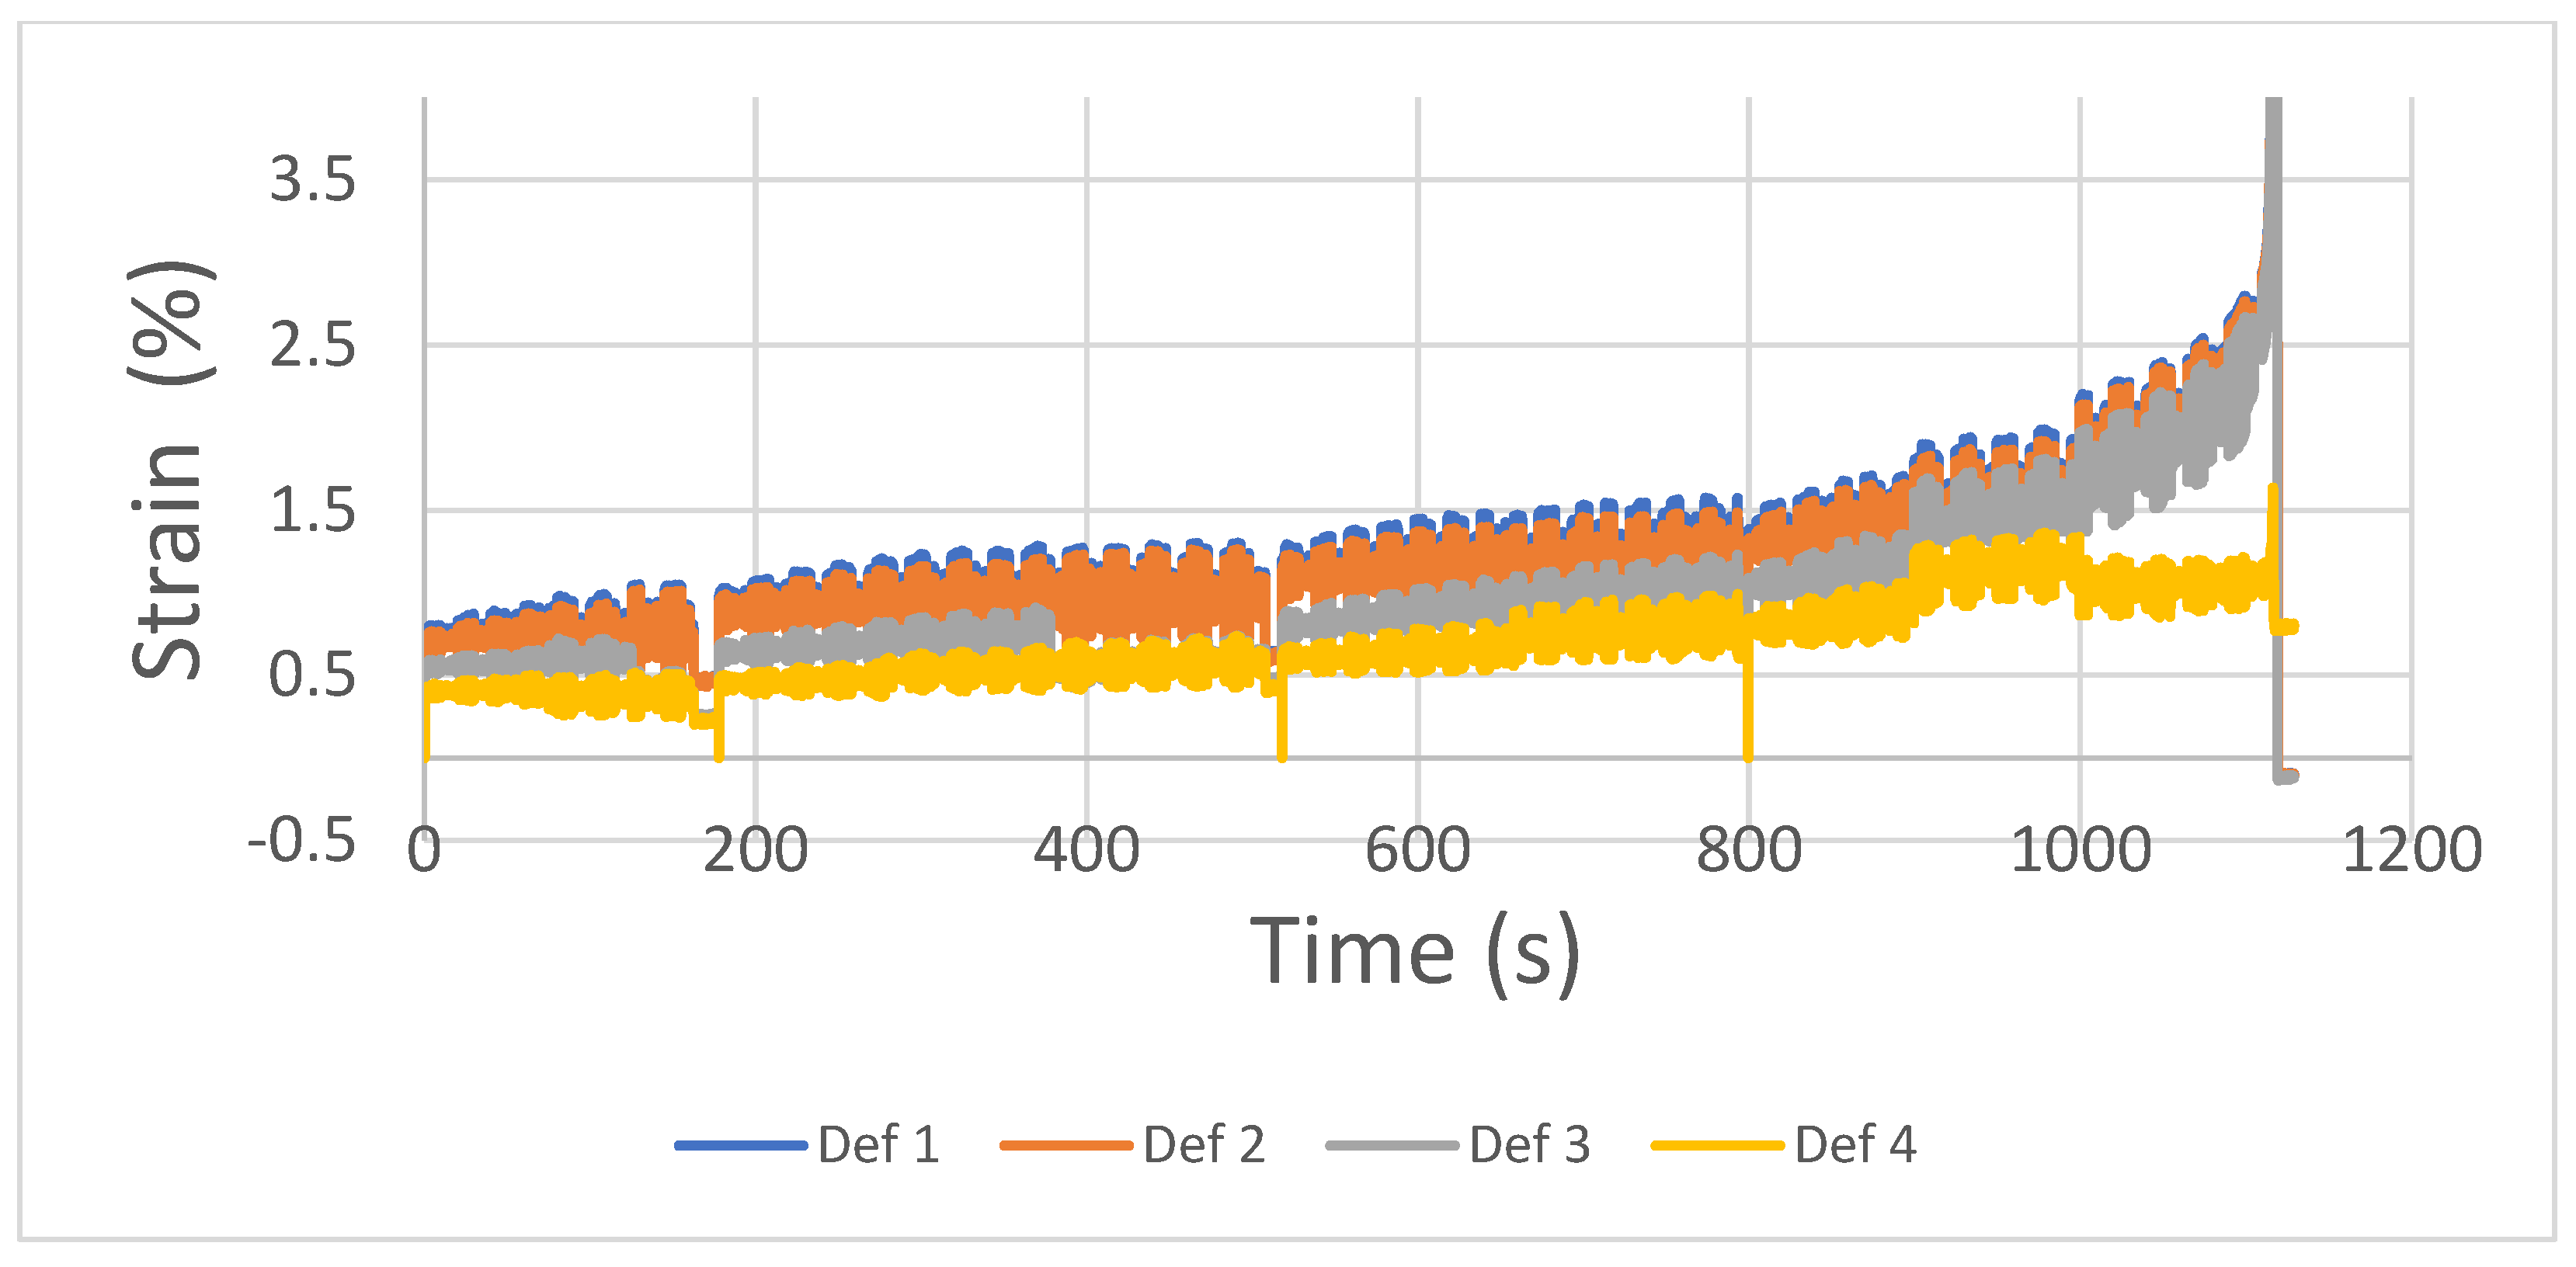
Finally, the strain evolution showed similar behavior as the two abovementioned cases. That is, strain 4 level was kept at a lower level while the rest of the values increased considerably as a symptom of a rupture on the left side of the heat exchanger as it deforms much more under the same loading conditions. The image of the final rupture is illustrated in
Figure 20.
Figure 19.
Different locations strain along the whole tests during damage tolerance test.
Figure 19.
Different locations strain along the whole tests during damage tolerance test.
Figure 20.
Final condition of the heat exchanger after damage tolerance testing.
Figure 20.
Final condition of the heat exchanger after damage tolerance testing.
5. Conclusions
After completing this work, the following conclusions may be drawn:
Two different methods were employed for damage initiation identification during heat exchanger testing; AE and DIC.
On the one hand, acoustic emission by means of non-contact optical microphone proved to be a useful tool to identify events at an early stage. It identified damage due to some heat exchanger part rupture as sound waves travelling through air.
The increased number of cumulative events was in good agreement with the severity of the damage in the different tests.
The main downside of the technique is related to other sources of acoustic events that may be mixed up with cracks but are not, in reality. A classification method based on isolation forest machine learning algorithm was developed. Time domain features were found to be the most relevant ones in this classification while frequency domain features were expected to play a more important role to have a clear physical explanation. This aspect requires further research.
DIC based system was employed as measurement of the damage. Strain evolution and its re-distribution were evaluated providing a clear indication of damage.
On the contrary, these indications were identified at a much later stage than AE. This may be due to the fact that a cracking event does not generate sufficient strain redistribution to be captured by the DIC and more ruptures have to occur to create identifiable damage. On the other hand, DIC system does not require any classification to distinguish between noise and real events as the real magnitude -strain- is measured.
Author Contributions
Conceptualization, Aitor García de la Yedra; methodology, Aitor García de la Yedra and Oier Zubiri; software, Igor Erro and Aitor García de la Yedra.; formal analysis, Aitor García de la Yedra.; investigation, Javier Vivas.; resources, Oier Zubiri and Ryan Sommerhurber.; data curation, Igor Erro, Ryan Sommerhurber and Matthias Kettner .; writing—original draft preparation, Aitor García de la Yedra.; writing—review and editing, Javier Vivas, Xabier Zurutuza, Oier Zubiri and Matthias Kettner.; project administration, Aitor Garcia de la Yedra. All authors have read and agreed to the published version of the manuscript.
Funding
This research was funded by European Commission under grant number 831798 within the H2020-EU.3.4.- SOCIETAL CHALLENGES program part of the Clean Sky 2.
Data Availability Statement
The data presented in this study are available on request from the corresponding author. The data are not publicly available due to confidential non-disclosure agreement.
Acknowledgments
Thanks are given to LIEBHERR AEROSPACE for the support and the provided materials.
Conflicts of Interest
The authors declare no conflict of interest The funders had no role in the design of the study; in the collection, analyses, or interpretation of data; in the writing of the manuscript; or in the decision to publish the results.
References
- Kawashima, F.; Igari, T.; Miyoshi, Y.; Kamito, Y.; Tanihira, M. High Temperature Strength and Inelastic Behavior of Plate–Fin Structures for HTGR. Nuclear Engineering and Design 2007, 237, 591–599. [CrossRef]
- Mizokami, Y.; Igari, T.; Kawashima, F.; Sakakibara, N.; Tanihira, M.; Yuhara, T.; Hiroe, T. Development of Structural Design Procedure of Plate-Fin Heat Exchanger for HTGR. Nuclear Engineering and Design 2013, 255, 248–262. [CrossRef]
- Addepalli, S.; Eiroa, D.; Lieotrakool, S.; François, A.-L.; Guisset, J.; Sanjaime, D.; Kazarian, M.; Duda, J.; Roy, R.; Phillips, P. Degradation Study of Heat Exchangers. Procedia CIRP 2015, 38, 137–142. [CrossRef]
- Thakre, P.B.; Pachghare, P.R. Performance Analysis on Compact Heat Exchanger. Materials Today: Proceedings 2017, 4, 8447–8453. [CrossRef]
- Luo, Y.; Zhang, Q.; Jiang, W.; Zhang, Y.; Hao, M.; Tu, S.-T. The Microstructure, Mechanical Properties and Fracture Behavior of Hastelloy C276-BNi2 Brazed Joint. Materials & Design 2017, 115, 458–466. [CrossRef]
- Gong, J.; Jiang, W.; Fan, Q.; Chen, H.; Tu, S.T. Finite Element Modelling of Brazed Residual Stress and Its Influence Factor Analysis for Stainless Steel Plate-Fin Structure. Journal of Materials Processing Technology 2009, 209, 1635–1643. [CrossRef]
- Tu, S.; Zhou, G. Creep of Brazed Plate-Fin Structures in High Temperature Compact Heat Exchangers. Front. Mech. Eng. China 2009, 4, 355. [CrossRef]
- Jiang, W.; Gong, J.; Tu, S.T. A Study of the Effect of Filler Metal Thickness on Tensile Strength for a Stainless Steel Plate-Fin Structure by Experiment and Finite Element Method. Materials & Design (1980-2015) 2010, 31, 2387–2396. [CrossRef]
- Stewart, M.; Lewis, O.T. Chapter 3 - Tubular Heat Exchanger Inspection, Maintenance, and Repair. In Heat Exchanger Equipment Field Manual; Stewart, M., Lewis, O.T., Eds.; Gulf Professional Publishing: Boston, 2013; pp. 253–419 ISBN 978-0-12-397016-9.
- Thekkuden, D.T.; Mourad, A.-H.I.; Bouzid, A.-H. Failures and Leak Inspection Techniques of Tube-to-Tubesheet Joints: A Review. Engineering Failure Analysis 2021, 130, 105798. [CrossRef]
- Yu, Z.; Fu, Y.; Jiang, L.; Yang, F. Detection of Circumferential Cracks in Heat Exchanger Tubes Using Pulsed Eddy Current Testing. NDT & E International 2021, 121, 102444. [CrossRef]
- Namkung, M.; Wincheski, B.; Padmapriya, N. NDT in the Aircraft and Space Industries. In Reference Module in Materials Science and Materials Engineering; Elsevier, 2016 ISBN 978-0-12-803581-8.
- García de la Yedra, A.; Pfleger, M.; Aramendi, B.; Cabeza, M.; Zubiri, F.; Mitter, T.; Reitinger, B.; Scherleitner, E. Online Cracking Detection by Means of Optical Techniques in Laser-Cladding Process. Structural Control and Health Monitoring 2019, 26, e2291. [CrossRef]
- Pan, B.; Wu, D.; Wang, Z.; Xia, Y. High-Temperature Digital Image Correlation Method for Full-Field Deformation Measurement at 1200 °C. Meas. Sci. Technol. 2010, 22, 015701. [CrossRef]
- Authier, N.; Touzet, E.; Lücking, F.; Sommerhuber, R.; Bruyère, V.; Namy, P. Coupled Membrane Free Optical Microphone and Optical Coherence Tomography Keyhole Measurements to Setup Welding Laser Parameters. In Proceedings of the High-Power Laser Materials Processing: Applications, Diagnostics, and Systems IX; SPIE, March 2 2020; Vol. 11273, pp. 41–52.
- Liu, F.T.; Ting, K.M.; Zhou, Z.-H. Isolation Forest. In Proceedings of the 2008 Eighth IEEE International Conference on Data Mining; December 2008; pp. 413–422.
- Liu, F.T.; Ting, K.M.; Zhou, Z.-H. Isolation-Based Anomaly Detection. ACM Trans. Knowl. Discov. Data 2012, 6, 3:1-3:39. [CrossRef]
- Fischer, B.; Rohringer, W.; Panzer, N.; Hecker, S. Acoustic Process Control for Laser Material Processing. Laser Technik Journal 2017, 14, 21–25. [CrossRef]
- Abarkane, C.; Florez-Tapia, A.M.; Odriozola, J.; Artetxe, A.; Lekka, M.; García-Lecina, E.; Grande, H.-J.; Vega, J.M. Acoustic Emission as a Reliable Technique for Filiform Corrosion Monitoring on Coated AA7075-T6: Tailored Data Processing. Corrosion Science 2023, 214, 110964. [CrossRef]
- Prieto, C.; Fernandez, R.; Gonzalez, C.; Diez, M.; Arias, J.; Sommerhuber, R.; Lücking, F. In Situ Process Monitoring by Optical Microphone for Crack Detection in Laser Metal Deposition Applications. 11th CIRP Conference on Photonic Technologies 2020.
|
Disclaimer/Publisher’s Note: The statements, opinions and data contained in all publications are solely those of the individual author(s) and contributor(s) and not of MDPI and/or the editor(s). MDPI and/or the editor(s) disclaim responsibility for any injury to people or property resulting from any ideas, methods, instructions or products referred to in the content. |
© 2023 by the authors. Licensee MDPI, Basel, Switzerland. This article is an open access article distributed under the terms and conditions of the Creative Commons Attribution (CC BY) license (http://creativecommons.org/licenses/by/4.0/).
