Submitted:
17 November 2023
Posted:
21 November 2023
You are already at the latest version
Abstract
Keywords:
1. Introduction
2. Materials and Methods
2.1. Substrates and Chemicals
2.2. Characterization of Glass Fibes
2.3. Immobilization
2.4. Hydrolysis of Lactose by Immobilized β-Galactosidase
2.5. Analysis Procedure
2.5. Bradford Analysis Procedure
3. Results and Discussion
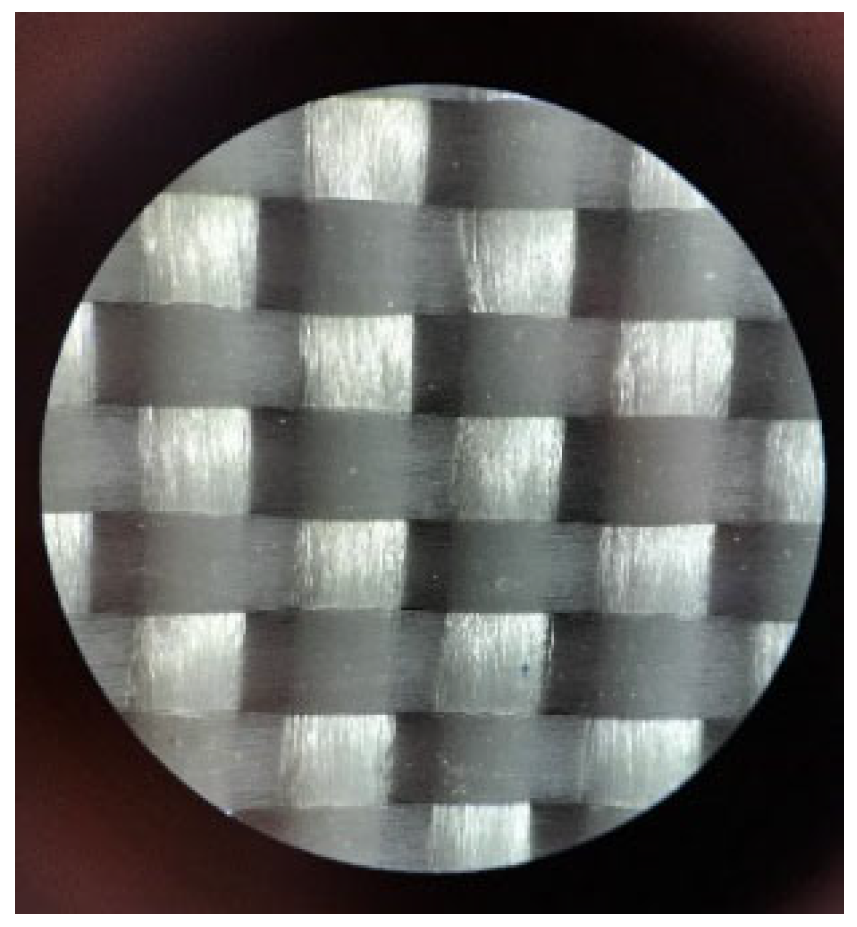
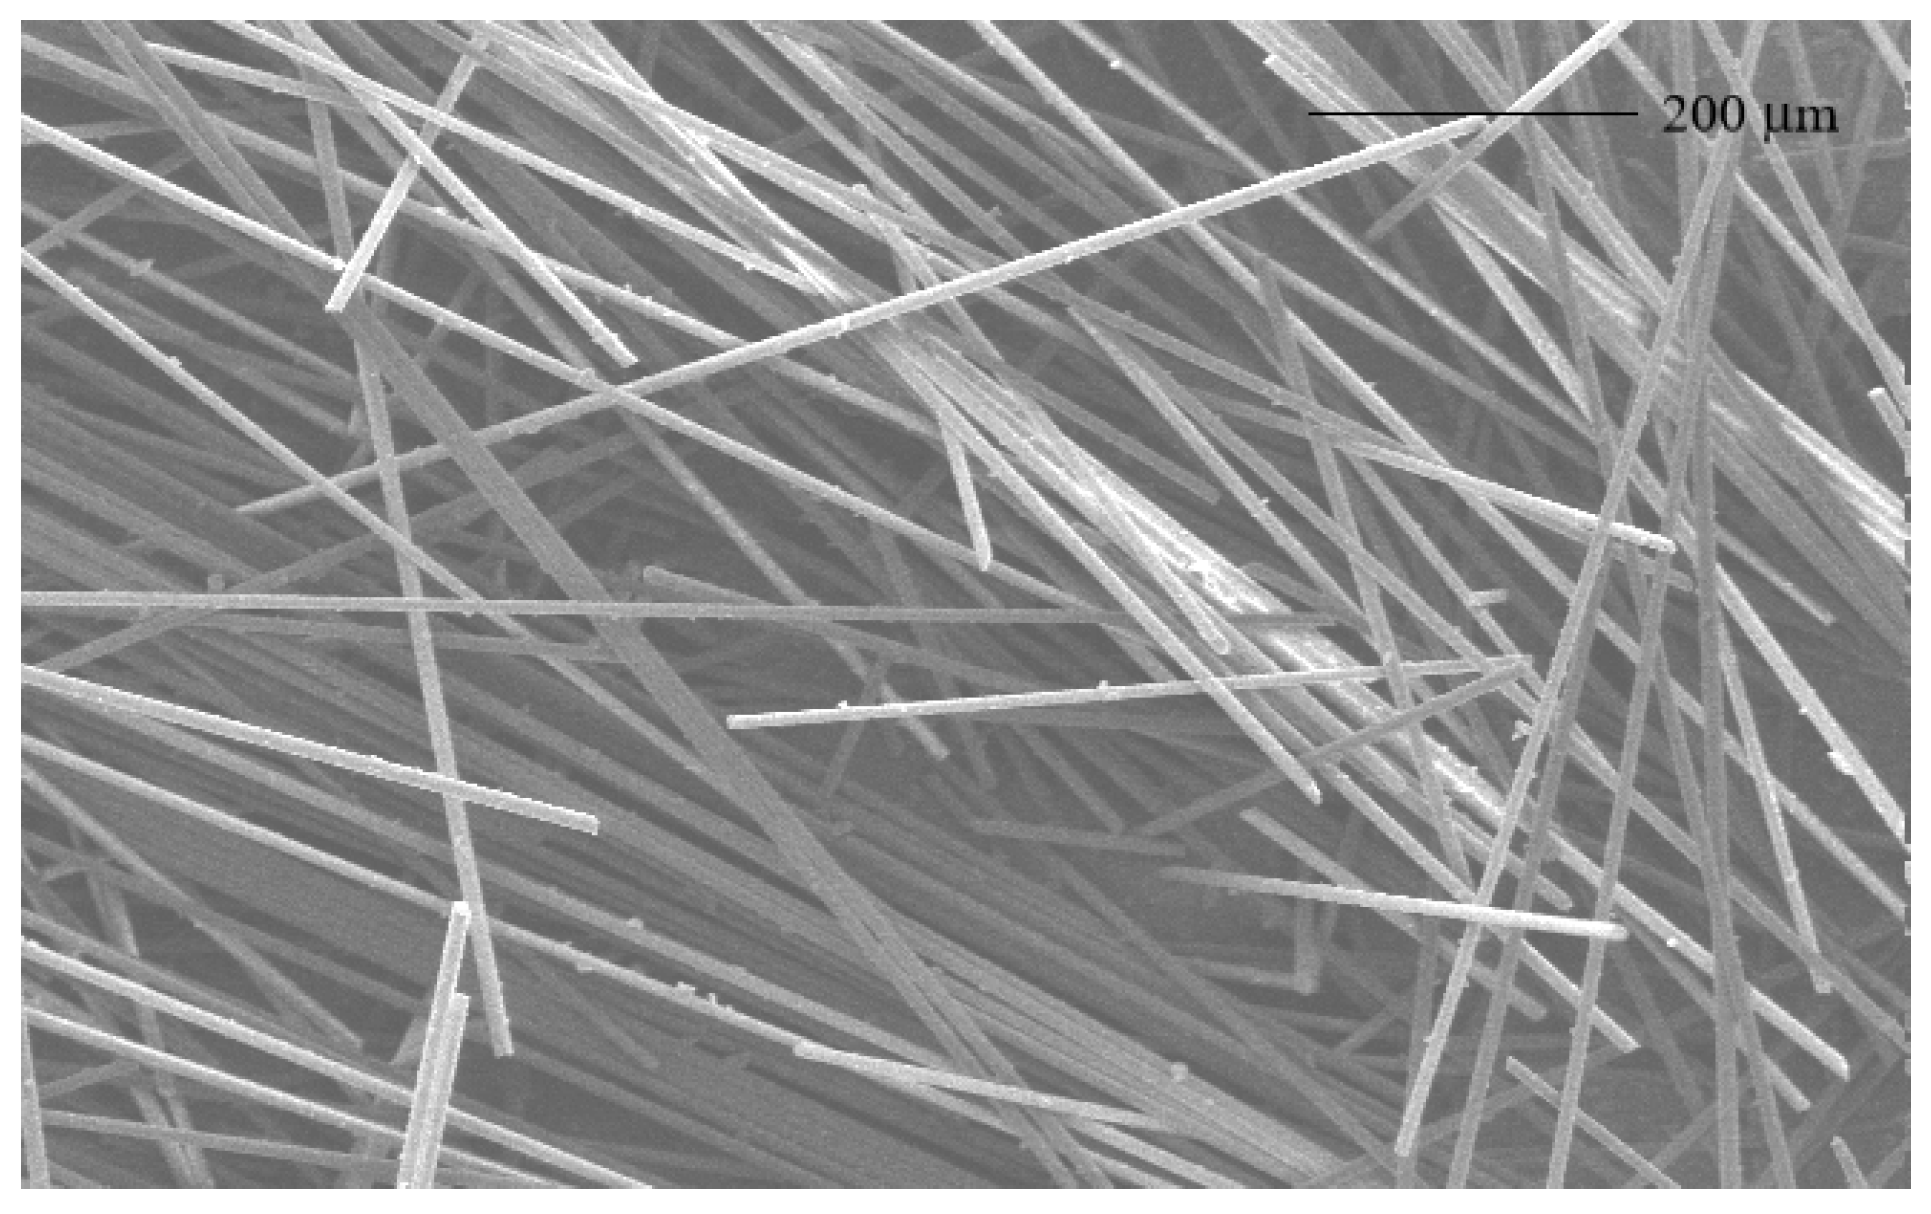
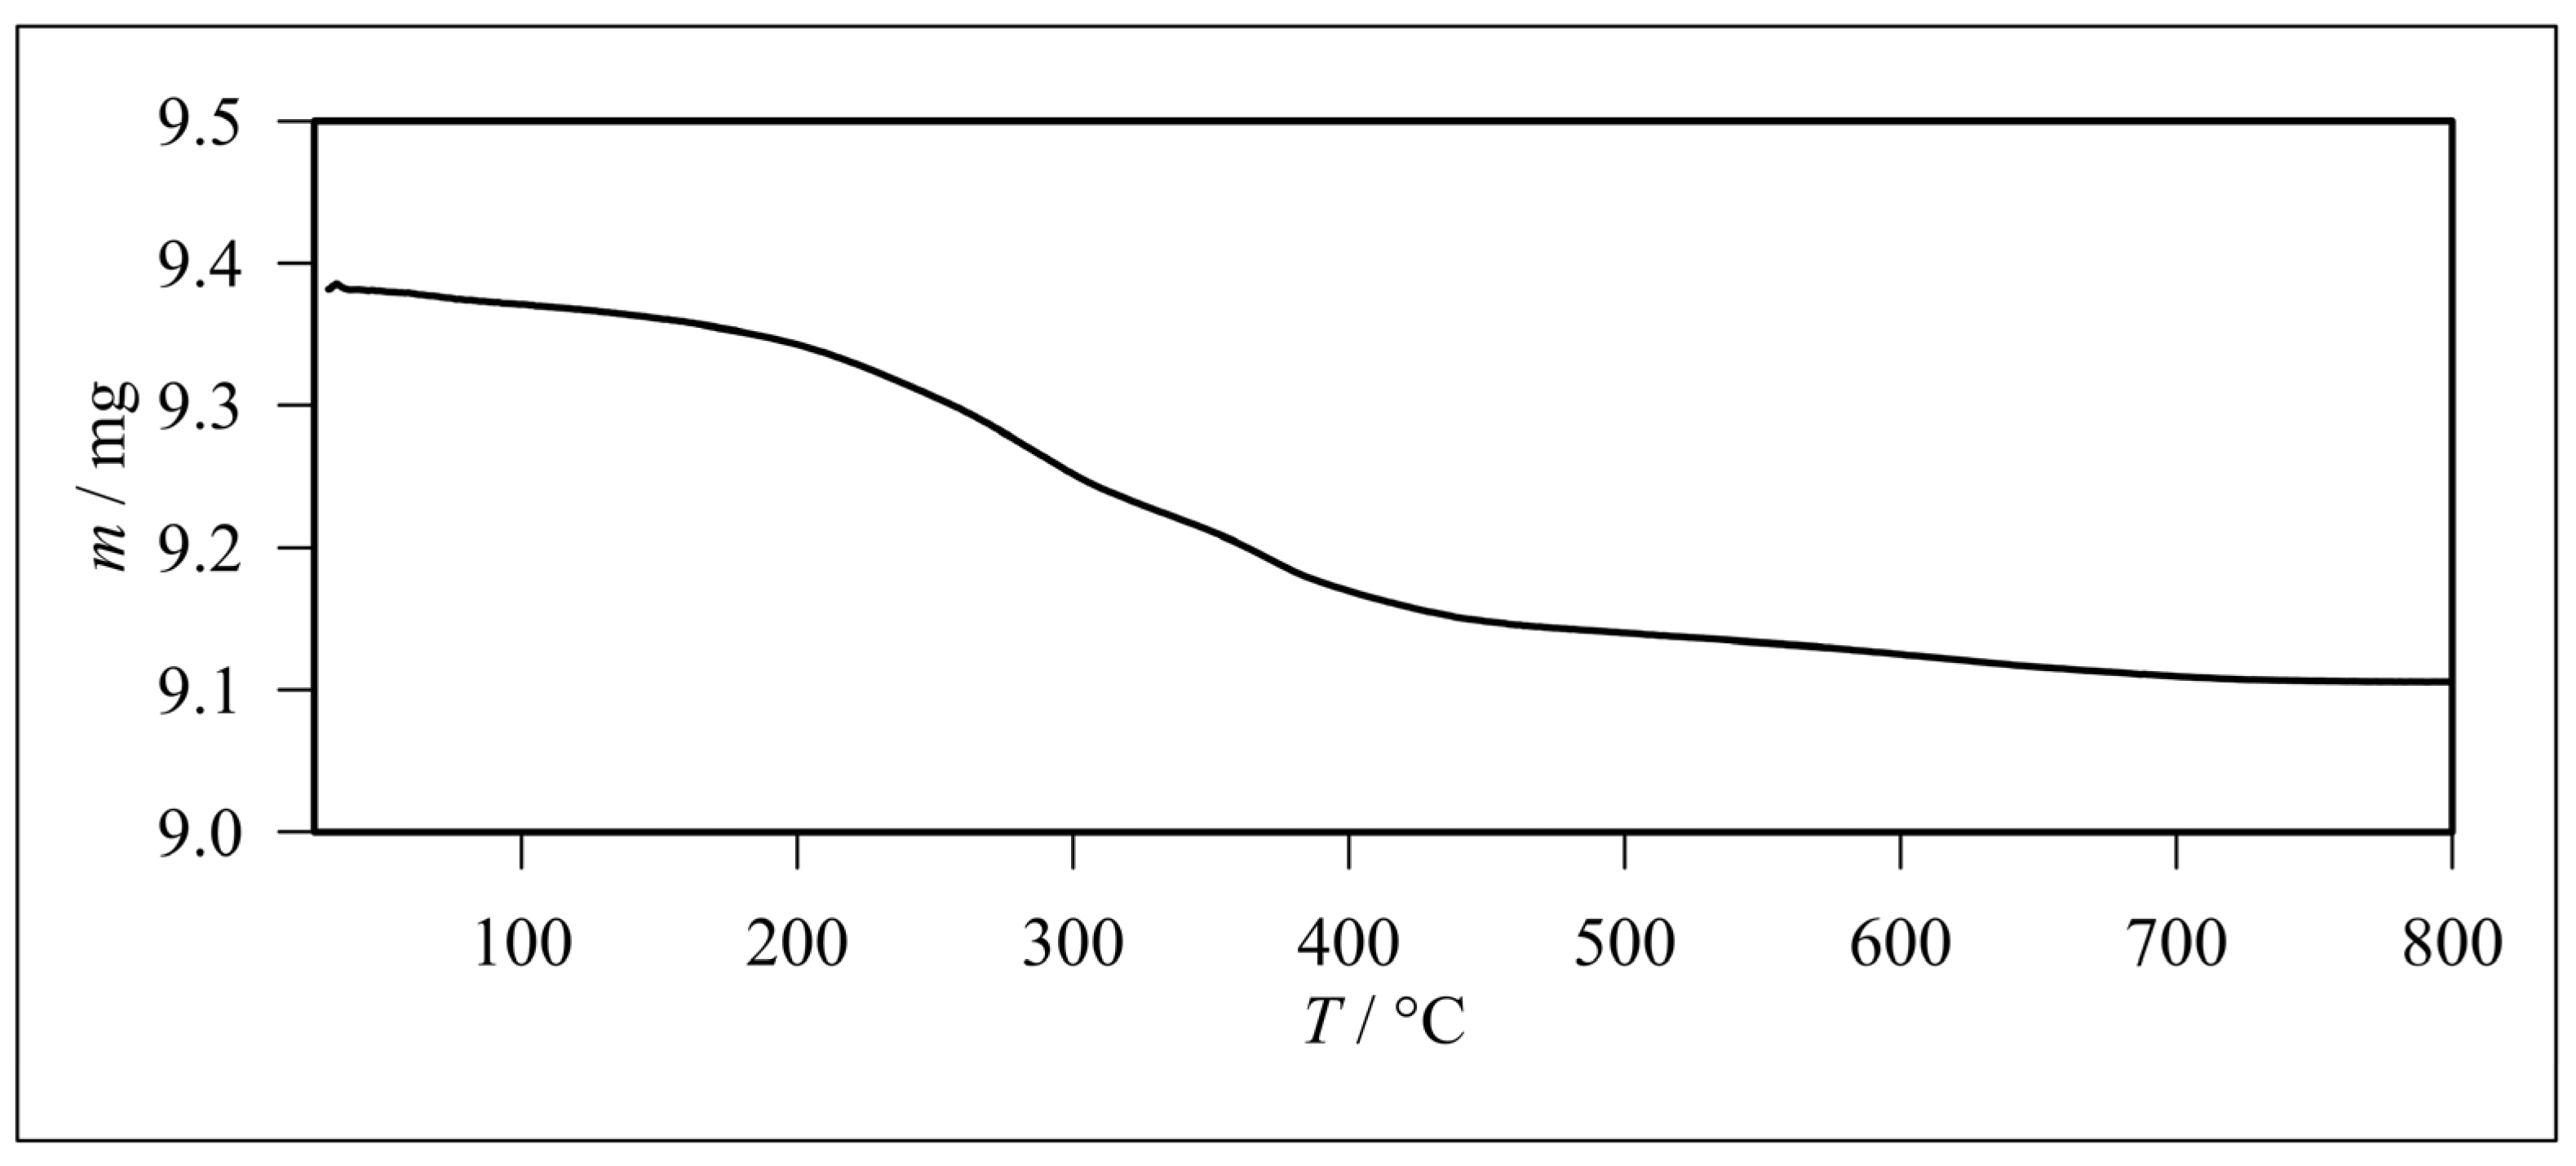
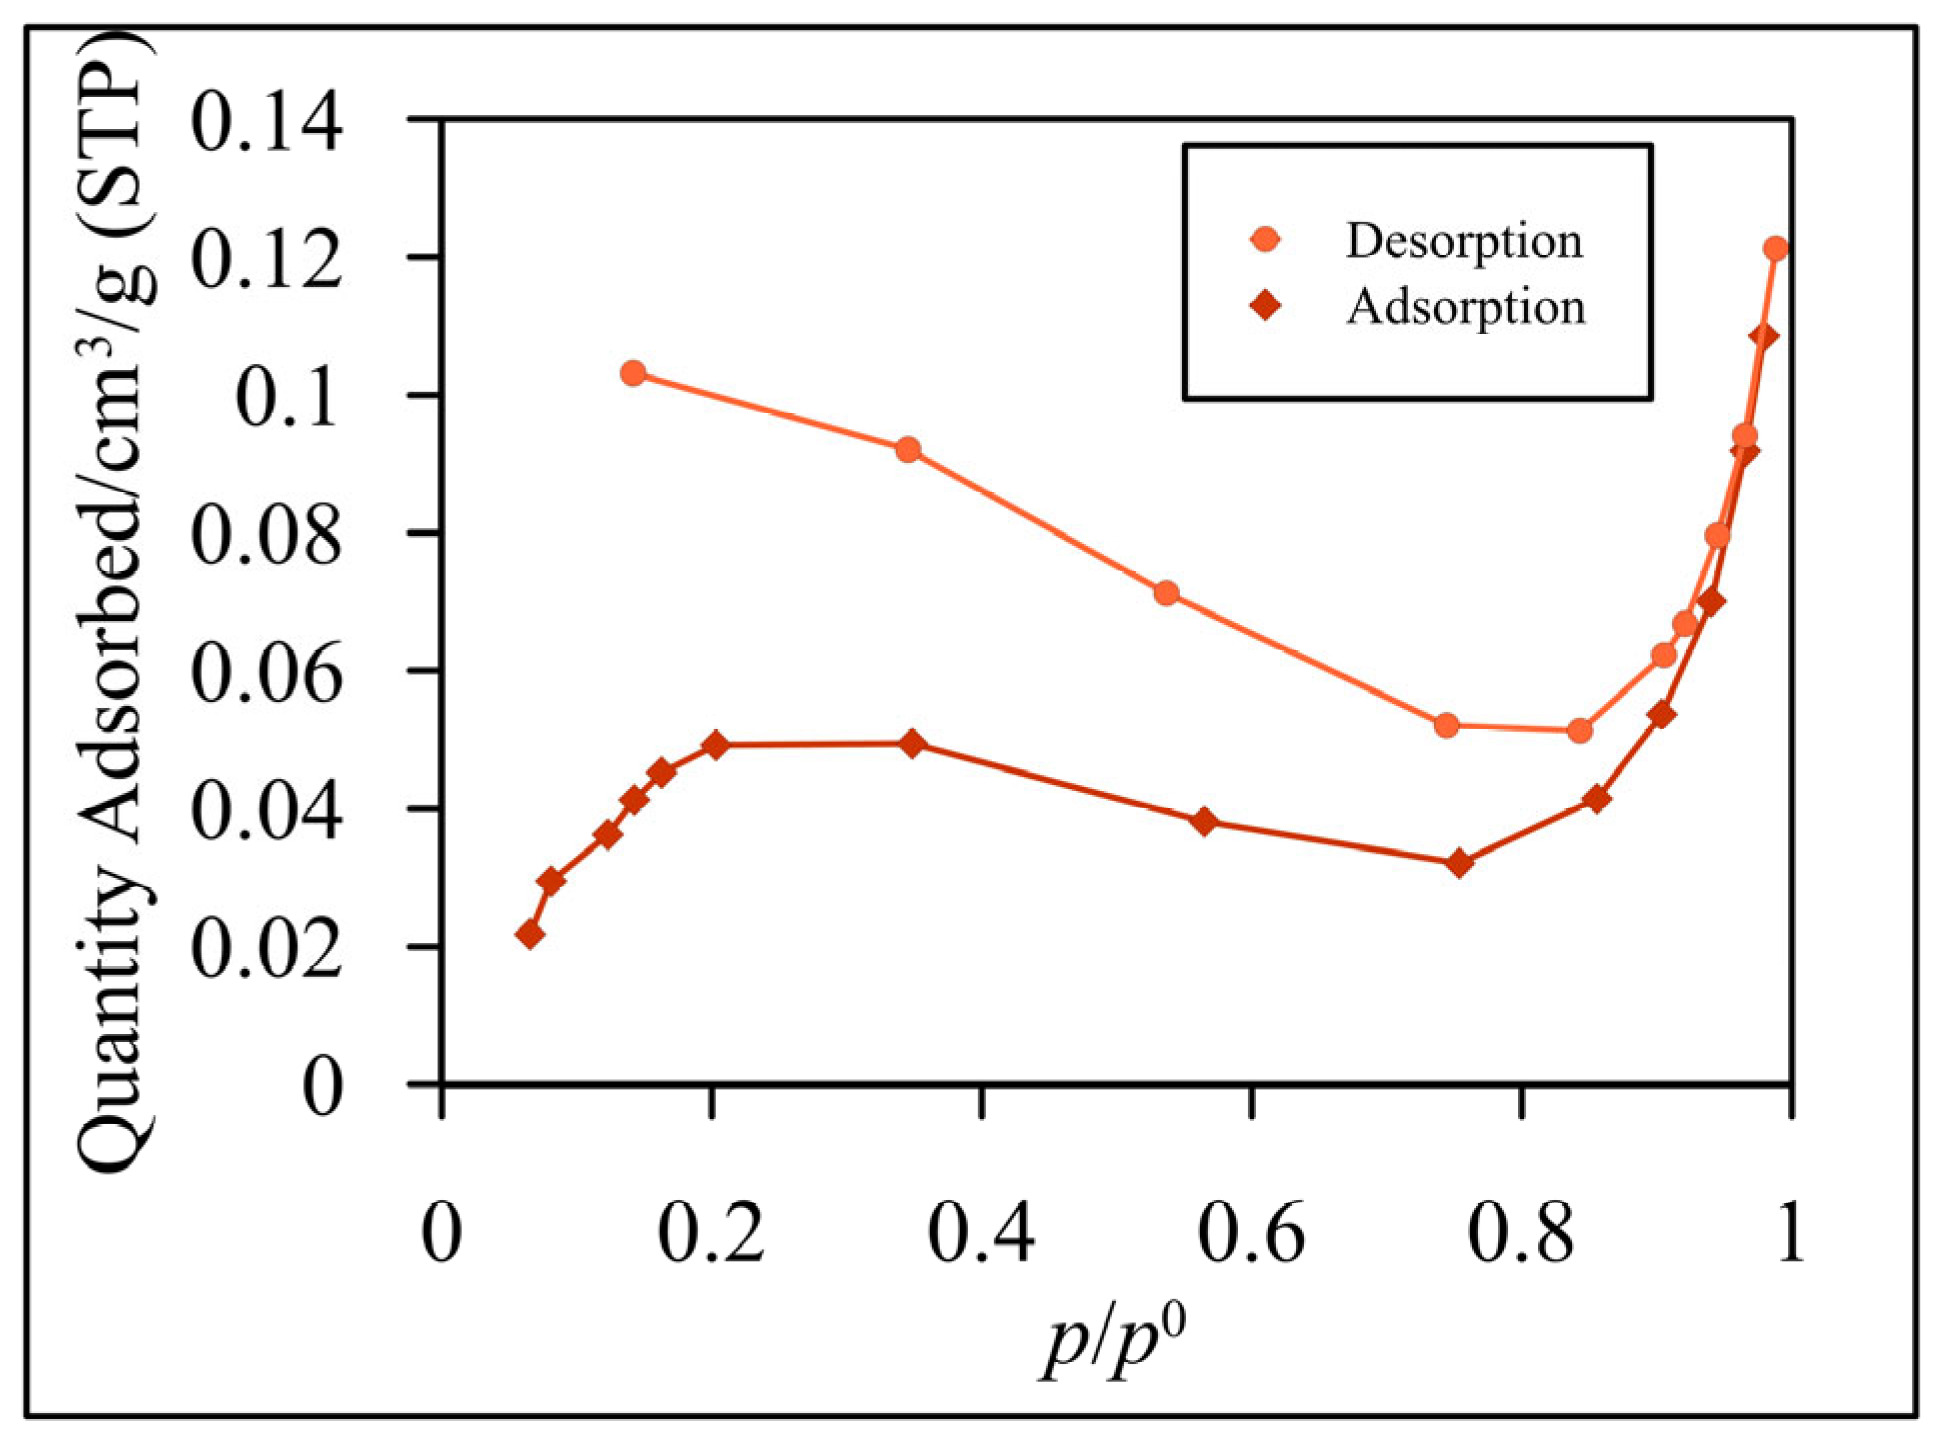
3.1. Characterization of Glass Fibers
3.2. Hydrolysis of Lactose
4. Conclusions
Acknowledgments
References
- Argenta, A.B.; Nogueira, A.; de, P. Scheer, A. Hydrolysis of whey lactose: Kluyveromyces lactis β-galactosidase immobilisation and integrated process hydrolysis-ultrafiltration. International Dairy Journal 2021, 117, 105007. [Google Scholar] [CrossRef]
- Mohamad, N.R.; Marzuki, N.H.C.; Buang, N.A.; Huyop, F.; Wahab, R.A. An overview of technologies for immobilization of enzymes and surface analysis techniques for immobilized enzymes. Biotechnol Biotechnol Equip 2015, 29, 205–220. [Google Scholar] [CrossRef] [PubMed]
- Panesar, P.S.; Kumari, S.; Panesar, R. Potential Applications of Immobilized β-Galactosidase in Food Processing Industries. Enzyme Res 2010, 2010, 473137–473137. [Google Scholar] [CrossRef]
- Souza, C.J.F.; Garcia-Rojas, E.E.; Souza, C.S.F.; Vriesmann, L.C.; Vicente, J.; de Carvalho, M.G.; Petkowicz, C.L.O.; Favaro-Trindade, C.S. Immobilization of β-galactosidase by complexation: Effect of interaction on the properties of the enzyme. International Journal of Biological Macromolecules 2019, 122, 594–602. [Google Scholar] [CrossRef] [PubMed]
- Wolf, M.; Tambourgi, E.B.; Paulino, A.T. Stability of β-D-galactosidase immobilized in polysaccharide-based hydrogels. Colloids and Surfaces A: Physicochemical and Engineering Aspects 2021, 609, 125679. [Google Scholar] [CrossRef]
- González-Delgado, I.; Segura, Y.; Martín, A.; López-Muñoz, M.-J.; Morales, G. β-galactosidase covalent immobilization over large-pore mesoporous silica supports for the production of high galacto-oligosaccharides (GOS). Microporous and Mesoporous Materials 2018, 257, 51–61. [Google Scholar] [CrossRef]
- Salvi, H.M.; Yadav, G.D. Surface functionalization of SBA-15 for immobilization of lipase and its application in synthesis of alkyl levulinates: Optimization and kinetics. Biocatalysis and Agricultural Biotechnology 2019, 18, 101038. [Google Scholar] [CrossRef]
- Soares, C.M.F.; Barbosa, M.S.; Santos, S.B.; Mattedi, S.; Lima, Á.S.; Pereira, M.M.; Tecelão, C.; Ferreira-Dias, S. Production of Human Milk Fat Substitutes by Lipase-Catalyzed Acidolysis: Immobilization, Synthesis, Molecular Docking and Optimization Studies. Catalysts 2023, 13, 825. [Google Scholar] [CrossRef]
- Ansari, S.A.; Husain, Q. Lactose hydrolysis from milk/whey in batch and continuous processes by concanavalin A-Celite 545 immobilized Aspergillus oryzae β galactosidase. Food and Bioproducts Processing 2012, 90, 351–359. [Google Scholar] [CrossRef]
- Xu, M.; Ji, D.; Deng, Y.; Agyei, D. Preparation and assessment of cross-linked enzyme aggregates (CLEAs) of β-galactosidase from Lactobacillus leichmannii 313. Food and Bioproducts Processing 2020, 124, 82–96. [Google Scholar] [CrossRef]
- Heinks, T.; Montua, N.; Teune, M.; Liedtke, J.; Höhne, M.; Bornscheuer, U.T.; Fischer von Mollard, G. Comparison of Four Immobilization Methods for Different Transaminases. Catalysts 2023, 13, 300. [Google Scholar] [CrossRef]
- de Freitas, L.A.; de Sousa, M.; Ribeiro, L.B.; de França, Í.W.L.; Gonçalves, L.R.B. Magnetic CLEAs of β-Galactosidase from Aspergillus oryzae as a Potential Biocatalyst to Produce Tagatose from Lactose. Catalysts 2023, 13, 306. [Google Scholar] [CrossRef]
- de Carvalho-Silva, J.; da Silva, M.F.; de Lima, J.S.; Porto, T.S.; de Carvalho, L.B.; Converti, A. Thermodynamic and Kinetic Investigation on Aspergillus ficuum Tannase Immobilized in Calcium Alginate Beads and Magnetic Nanoparticles. Catalysts 2023, 13, 1304. [Google Scholar] [CrossRef]
- Costa, G.P.; Queiroz, L.B.; Manfroi, V.; Rodrigues, R.C.; Hertz, P.F. Immobilization of Alpha Acetolactate Decarboxylase in Hybrid Gelatin/Alginate Support for Application to Reduce Diacetyl Off-Flavor in Beer. Catalysts 2023, 13, 601. [Google Scholar] [CrossRef]
- Bayramoglu, G.; Cimen, A.G.; Arica, M.Y. Immobilisation of β-galactosidase onto double layered hydrophilic polymer coated magnetic nanoparticles: Preparation, characterisation and lactose hydrolysis. International Dairy Journal 2023, 138, 105545. [Google Scholar] [CrossRef]
- Pottratz, I.; Müller, I.; Hamel, C. Potential and Scale-Up of Pore-Through-Flow Membrane Reactors for the Production of Prebiotic Galacto-Oligosaccharides with Immobilized β-Galactosidase. Catalysts 2022, 12, 7. [Google Scholar]
- Elnashar, M.M.; Awad, G.E.; Hassan, M.E.; Mohy Eldin, M.S.; Haroun, B.M.; El-Diwany, A.I. Optimal Immobilization of <i>β</i>-Galactosidase onto <i>κ</i>-Carrageenan Gel Beads Using Response Surface Methodology and Its Applications. The Scientific World Journal 2014, 2014, 571682. [Google Scholar] [CrossRef]
- Urrutia, P.; Bernal, C.; Wilson, L.; Illanes, A. Use of chitosan heterofunctionality for enzyme immobilization: β-galactosidase immobilization for galacto-oligosaccharide synthesis. International Journal of Biological Macromolecules 2018, 116, 182–193. [Google Scholar] [CrossRef] [PubMed]
- Zhang, S.; Gao, S.; Gao, G. Immobilization of β-Galactosidase onto Magnetic Beads. Applied Biochemistry and Biotechnology 2010, 160, 1386–1393. [Google Scholar] [CrossRef]
- Poletto, M.; Parascandola, P.; Saracino, I.; Cifarelli, G. Hydrolysis of Lactose in a Fluidized Bed of Zeolite Pellets Supporting Adsorbed ß - Galactosidase. 2005; 3. [Google Scholar] [CrossRef]
- Silva, R.C.; Trevisan, M.G.; Garcia, J.S. ²-galactosidase Encapsulated in Carrageenan, Pectin and Carrageenan/Pectin: Comparative Study, Stability and Controlled Release. Anais da Academia Brasileira de Ciências 2020, 92.
- Yassin, M.A.; Naguib, M.; Abdel Rehim, M.H.; Ali, K.A. Immobilization of β-galactosidase on Carrageenan Gel via bio-inspired Polydopamine Coating. Journal of Textiles, Coloration and Polymer Science 2018, 15, 85–93. [Google Scholar] [CrossRef]
- El-Masry, M.M.; De Maio, A.; Martelli, P.L.; Casadio, R.; Moustafa, A.B.; Rossi, S.; Mita, D.G. Influence of the immobilization process on the activity of β-galactosidase bound to Nylon membranes grafted with glycidyl methacrylate: Part 1. Isothermal behavior. Journal of Molecular Catalysis B: Enzymatic 2001, 16, 175–189. [Google Scholar] [CrossRef]
- Klein, M.P.; Nunes, M.R.; Rodrigues, R.C.; Benvenutti, E.V.; Costa, T.M.H.; Hertz, P.F.; Ninow, J.L. Effect of the Support Size on the Properties of β-Galactosidase Immobilized on Chitosan: Advantages and Disadvantages of Macro and Nanoparticles. Biomacromolecules 2012, 13, 2456–2464. [Google Scholar] [CrossRef] [PubMed]
- Ricardi, N.C.; de Menezes, E.W.; Valmir Benvenutti, E.; da Natividade Schöffer, J.; Hackenhaar, C.R.; Hertz, P.F.; Costa, T.M.H. Highly stable novel silica/chitosan support for β-galactosidase immobilization for application in dairy technology. Food Chemistry 2018, 246, 343–350. [Google Scholar] [CrossRef]
- Tanriseven, A.; Doğan, Ş. A novel method for the immobilization of β-galactosidase. Process Biochemistry 2002, 38, 27–30. [Google Scholar] [CrossRef]
- Mariotti, M.P.; Yamanaka, H.; Araujo, A.R.; Trevisan, H.C. Hydrolysis of whey lactose by immobilized ²-Galactosidase. Brazilian Archives of Biology and Technology 2008, 51, 1233–1240. [Google Scholar] [CrossRef]
- Yeon, J.H.; Jung, K.H. Repeated-batch operation of immobilized β-galactosidase inclusion bodies-containing Escherichia coli cell reactor for lactose hydrolysis. J Microbiol Biotechnol 2011, 21, 972–978. [Google Scholar] [CrossRef]
- Jurado, E.; Camacho, F.; Luzón, G.; Vicaria, J.M. Kinetic and enzymatic adsorption model in a recirculation hollow-fibre bioreactor. Bioprocess and Biosystems Engineering 2005, 28, 27–36. [Google Scholar] [CrossRef]
- Ladero, M.; Santos, A.; Garcı́a-Ochoa, F. Kinetic modeling of lactose hydrolysis with an immobilized β-galactosidase from Kluyveromyces fragilis. Enzyme and Microbial Technology 2000, 27, 583–592. [Google Scholar] [CrossRef]
- Song, Y.S.; Shin, H.Y.; Lee, J.Y.; Park, C.; Kim, S.W. β-Galactosidase-immobilised microreactor fabricated using a novel technique for enzyme immobilisation and its application for continuous synthesis of lactulose. Food Chemistry 2012, 133, 611–617. [Google Scholar] [CrossRef]
- Limnaios, A.; Tsevdou, M.; Tsika, E.; Korialou, N.; Zerva, A.; Topakas, E.; Taoukis, P. Production of Prebiotic Galacto-Oligosaccharides from Acid Whey Catalyzed by a Novel β-Galactosidase from Thermothielavioides terrestris and Commercial Lactases: A Comparative Study. Catalysts 2023, 13, 1360. [Google Scholar] [CrossRef]
- Al-Harbi, S.A.; Almulaiky, Y.Q. Cu-trimesic acid-based metal organic frameworks for improved ß-galactosidase immobilization: Enhanced stability, reusability and lactose hydrolysis. Journal of Molecular Liquids 2023, 392, 123456. [Google Scholar] [CrossRef]
- Shi, X.; Wu, D.; Xu, Y.; Yu, X. Engineering the optimum pH of β-galactosidase from Aspergillus oryzae for efficient hydrolysis of lactose. Journal of Dairy Science 2022, 105, 4772–4782. [Google Scholar] [CrossRef] [PubMed]
Disclaimer/Publisher’s Note: The statements, opinions and data contained in all publications are solely those of the individual author(s) and contributor(s) and not of MDPI and/or the editor(s). MDPI and/or the editor(s) disclaim responsibility for any injury to people or property resulting from any ideas, methods, instructions or products referred to in the content. |
© 2023 by the authors. Licensee MDPI, Basel, Switzerland. This article is an open access article distributed under the terms and conditions of the Creative Commons Attribution (CC BY) license (http://creativecommons.org/licenses/by/4.0/).


