
Submitted:
15 November 2023
Posted:
16 November 2023
You are already at the latest version
Abstract
This study investigates the impact of inoculating Torulaspora delbrueckii (Td) strains during the initial phase of Carbonic Maceration (CM) vinification, aiming to enhance the fermentative process and unique characteristics of CM wines. CM is a winemaking technique where whole bunches (without destemming and crushing) are enclosed in tanks filled with carbon dioxide, inducing intracellular fermentation. The study compares the effects of two Td strains on the MLF performance and sensory characteristics of CM wines, using both inoculated and spontaneous MLF strategies. Although general physicochemical parameters remained consistent across conditions, organoleptic attributes showed significant differences due to T. delbrueckii presence. T. delbrueckii introduction during CM resulted in wines with increased anthocyanin content and a particular volatile profile. Isoamyl acetate, a key aroma in CM wines, was notably elevated, especially in the TdP strain. Sensory evaluations also revealed distinctions, with TdV wines displaying more pronounced aromas of red fruit, banana, and grass. Regarding MLF, T. delbrueckii presence notably enhanced performance, particularly in spontaneous MLF cases, accelerating fermentation completion. Inoculating the Oenococcus oeni strain OoVP41 also shortened MLF duration. These findings highlight the potential of Td strains to improve MLF efficiency and sensory attributes in CM wines. Employing T. delbrueckii strains strategically enables winemakers to optimize MLF and improve sensory profiles, offering an opportunity to produce higher-quality CM wines.
Keywords:
Oenococcus oeni
; carbonic maceration
; anthocyanins
1. Introduction
Carbonic maceration (CM) vinification is a specific winemaking technique that is characterized by not crushing or destemming the grapes. Instead, the whole bunches are placed in tanks, which are then filled with carbon dioxide (CO2) to create an anaerobic environment [1]. Within the grapes, an anaerobic fermentative metabolism initiates, known as intracellular fermentation, causing the berries to undergo physicochemical changes. As a result, the grapes begin to break down, releasing some of the juice or must, which accumulates at the bottom of the tank and undergoes alcoholic fermentation (AF) through the action of wild yeasts, present in the skin of the grapes [1]. Furthermore, this process also triggers other metabolic processes, including the extraction of phenolic compounds from the grape skins, the release of volatile compounds and a partial degradation of L-malic acid [1]. These grape berries would result in a wine with improved organoleptic characteristics, due to intra-berry metabolic pathways. Finally, the second part of the process takes place, where the free-run wine and the press-wine finish the AF, mixed or separated depending on the oenologist decision [1,2].
CM vinification process offers a wide range of possibilities, as it can be varied at different points, for instance using rotating tanks to homogenise the whole grains with the free-run juice or prolonging the maceration after the AF [1]. During the first part of the process, there may be a biochemical decarboxylation of L-malic acid in the free-run fermenting must through malolactic fermentation (MLF), depending on the population of lactic acid bacteria (BAL) present in the grape must. Consequently, if MLF has already begun in the first step in the free-run fermenting must, it is advisable to vinify the two wine fractions separately. This separation is important because the higher sugar content in the grape berry can potentially lead to lactic spoilage if both fractions are combined. In this context, AF is usually fast, between 2 or 7 days, and then takes place the MLF, however sometimes due to improper management both fermentations may occur simultaneously [1].
The distinctive organoleptic characteristics of CM wines, which have a lot of consumer appreciation, have contributed to the growing interest in studying this winemaking method [2,3,4,5]. These wines are known for having a higher content of esters, especially acetates, which increase their fruity aroma [3,5]. Specially, literature highlights the higher concentration of isoamyl acetate and ethyl cinnamate compared to wines produced using traditional fermentation methods [1,3]. Additionally, in regard to colour characteristics, CM wines have been found to have lower or higher levels of phenolic compounds and colour intensity, it depends on the grape variety, the grape ripeness, the vintage or the winemaking conditions [2,5,6].
Recent studies have focused on exploring the high diverse autochthonous microbial population present in CM wines, with a large presence of non-Saccharomyces in the early stages [7,8]. The utilization of non-Saccharomyces commercial yeast presents an interesting prospect to maintain these special characteristics and have a better microbiological control. For instance, the use of the species Torulaspora delbrueckii, commercialized as starter culture, has been studied in sequential fermentation with Saccharomyces cerevisiae in white wines [9,10] red wines [11,12], rosé wines [13] or even in botrytized wines [14] owing to its impact on the organoleptic properties. The utilization of T. delbrueckii in winemaking has been found to have significant effects on the composition of volatile profile. The presence of this species leads to an increase in specific volatile compounds, such as fusel alcohols [10,15,16,17]. Additionally, the presence of T. delbrueckii during fermentative maceration in red wines has been associated with a greater release of phenolic compounds [11,12].
Furthermore, several research studies have focused the potential of T. delbrueckii in enhancing the performance of malolactic fermentation (MLF) by the main LAB in wine, Oenococcus oeni [15,18,19,20,21]. In CM context, it has been recently studied how the yeast species inoculation affect to the bacterial population [22]. As described above, in the case of CM vinification MLF may occur spontaneously which can significantly impact the wine’s flavor profile. Besides, it is important to note that a population of 106 CFU/mL and optimal conditions for LAB are necessary to carry out the MLF. In cases where this does not occur, the inoculation of LAB starter cultures and the use of T. delbrueckii could enhance the complete and successful L-malic acid degradation.
In summary, the objective of this research is to investigate the oenological implications of inoculating T. delbrueckii during the initial stage of CM vinification with the aim of improve the fermentative process and distinctive character of these wines. The study compares the effects of two different strains of this species on both the organoleptic characteristics and the performance of inoculated and spontaneous MLF.
2. Materials and Methods
2.1. Carbonic Maceration and Alcoholic Fermentation
The study evaluated three yeast species: one strain of Saccharomyces cerevisiae, CLOS YSEO (from now on referred as Sc), obtained from Lallemand Inc. (Montreal, Canada), and two strains of Torulaspora delbrueckii: Viniflora Prelude (Td-P), obtained from Chr. Hansen Holding AS (Hoersholm, Denmark), and Viniferm NS Td (Td-V), obtained from Agrovin (Alcázar de San Juan, Spain). The yeast strains were inoculated from Dry Active Yeast and rehydrated following the manufacturer’s instructions. The S. cerevisiae strain was rehydrated at 37 °C for 30 minutes, while the T. delbrueckii strains were rehydrated at 30 °C for the same duration.
The fermentations were conducted using Grenache grape variety (Vitis vinifera L.) supplied by the cellar Mas dels Frares of Rovira i Virgili University, which belongs to the AOC Tarragona. The grapes were harvested and processed in this experimental winery of the university. Semi-industrial scale fermentations were performed in 15 L food-grade plastic container, maintaining a constant temperature of 22 °C. Initially, uncrushed grape berries, without stems, were placed in the tanks. The Control condition involved no inoculation during carbonic maceration (CM) and was left with the endogenous microbiota. The sequential conditions were inoculated with the two strains of T. delbrueckii at an initial concentration of 2 × 10⁶ cells/mL. After yeast inoculation, CO2 was pumped inside to create an anaerobic environment, and the tanks were hermetically closed. After five days of CM, the grapes were pressed, and the two must fractions (free-run must and press must) were mixed. The resulting fermenting must from each condition was transferred to another tanks, and S. cerevisiae was inoculated in all three conditions at a concentration of 2 x 10⁶ cells/mL to finish AF. Thus, three different conditions were tested: Control, TdP, and TdV.
Samples after CM (CM point) and at the final of AF (Final AF point) were stored to analyse them. In addition, final wines were bottled to perform the sensory analysis.
Two media were used to determine inocula and population dynamics by plating a 1:10 serial dilution. For total yeast was used YPD agar (10 g/L yeast extract, 20 g/L peptone, 20 g/L glucose, 17 g/L agar (Panreac Química SLU, Barcelona, Spain)) and for non-Saccharomyces yeasts the selective medium Lysine (Difco Laboratories, Detroit, MI, USA).
An electronic densimeter (Densito 30PX Portable Density Meter (Mettler Toledo, Spain) was used for monitoring AF by measuring density each day. AF was considered finished when reductive sugars were under 2 g/L of residual concentration. Residual glucose and fructose were determined by an enzymatic autoanalyzer Y15 Enzymatic Autoanalyzer (Biosystems S.A, Barcelona, Spain).
2.2. Malolactic Fermentation
After completing AF, replicates of each condition were mixed, and the resulting wines were divided into three conditions for MLF. The wines were stored at 4 ºC for one week to stabilize them. The two strains of Oenococcus oeni used for inoculation were Lalvin VP41 (Oo-VP41) Lallemand Inc. and Viniflora CH11 (Oo-CH11) Chr. Hansen Holding AS. These strains were inoculated from commercial lyophilized products and rehydrated following the manufacturer’s recommendations. O. oeni strains were rehydrated in wine at 20 °C for 15 minutes. Furthermore, a spontaneous MLF was performed (Sp).
As a result, the initial three AF conditions were expanded to a total of nine MLF conditions: Control, TdP, and TdV, each with their respective MLF condition of OoVP41, OoCH11, and Sp, with triplicate samples for each condition.
The MLF inoculations were performed at a population of 2 x 10⁷ cell/mL. MLF was carried out in 1 L volumes at a temperature of 20 ºC under anaerobic and static conditions. The progress of L-malic acid consumption was monitored daily until it reached a concentration below 0.1 g/L using the Y15 Enzymatic Autoanalyzer (Biosystems S.A, Barcelona, Spain).
The inoculum and populations of LAB were controlled by plating on modified MRS medium [23] (Difco Laboratories, Detroit, MI, USA) following the modification described in [24]. The medium was adjusted to a pH 5 and supplemented with 4 g/L DL-malic acid (Sigma-Aldrich), 5 g/L D-fructose (Panreac), 100 mL/L of tomato juice (Aliada, Madrid, Spain), 100 mg/L of nystatin (Panreac) to prevent yeast growth, and 25 mg/L of sodium azide (BioSciences, St. Louis MO, USA) to prevent acetic acid bacteria growth. The plates were incubated at 27 ºC in a 10% CO2 atmosphere.
2.3. Area Under the Curve (AUC)
The area under the curve (AUC) was calculated to assess significant differences in the AF performance. This was achieved by analyzing the decrease in density during AF and then integrating the values between two consecutive time points. The formula used for the calculation involved summing the areas of consecutive data points as follows: Σ [((d2 + d1)/2) ∗ (t2 − t1) + … + ((dn + dn−1)/2) ∗ (tn − tn−1)], where d1, d2, ..., dn−1, dn represent the at times 1, 2, n−1, and n, respectively.
2.4. Physicochemical Analysis
2.4.1. General Oenological Parameters
The pH of the wines was determined using a Crison micro pH 2002 pH-meter (Hach Lange Spain, L’Hospitalet, Spain). The content of citric acid, glycerol, and ethanol was determined following the procedure described in [25] using an Agilent 1100 HPLC system (Agilent Technologies, Waldbronn, Germany). Prior to injection, the wine samples were filtered using 0.22 μm pore filters (Merck). The HPLC system was equipped with a Hi-Plex H column (300 mm x 7.7 mm) inside a 1260 MCT (Infinity II Multicolumn Thermostat). Two detectors were coupled: a MWC detector (Multi-wavelength detector, Agilent Technologies) and a RID detector (1260 Infinity II refractive index detector, Agilent Technologies).
The concentrations of acetic acid and L-malic acid were enzymatically determined using the Y15 Enzymatic Autoanalyzer (Biosystems S.A, Barcelona, Spain). Succinic acid was analyzed using a manual enzymatic method (Megazyme, Wicklow, Ireland) with the UV-Vis spectrometer POLARstar Omega (BMG LABTECH, Ortenberg, Germany).
To estimate the mannoprotein content, a precipitation with 95% ethanol followed by an acid hydrolysis at 90 °C was performed following the procedure described in [26]. The resulting mannoproteins were quantified in terms of mannose equivalents using a D-mannose and D-glucose enzymatic assay kit (Megazyme).
2.4.2. Volatile Composition
In the present study, the volatile composition of the wines was extracted using a liquid/liquid extraction method, 400 μL of dichloromethane, in the presence of 2.5 g of ammonium sulphate (NH4)2SO4, was used. Two internal standards (IS), 4-methyl-2-pentanol (0.8 g/L) and heptanoic acid (0.7 g/L), were employed. The extraction method used was based on the protocol described by [27] with modifications as outlined by [28]. After the extraction, the organic phase was collected. Subsequently, 2 μL of the organic phase was injected into a gas chromatograph coupled to a FID detector (Flame Ionization Detector) (Agilent Technologies, Germany) using a FFAP column with dimensions of 30 m × 0.25 mm × 0.25 μm. The injection was performed in split mode with a split ratio of 10:1 and a flow rate of 30 mL/min. The volatile compounds identified were the following: fusel alcohol acetates (isobutyl acetate, isoamyl acetate, 2-phenyletanol acetate), fusel alcohols (2-metil-propanol, 1-propanol, isoamyl alcohol, 1-pentanol, 1-hexanol, cis-3-hexen-1-ol, 2-phenylethanol), other alcohols (2-butanol, 1-butanol), ethyl esters of FA (Ethyl butanoate, ethyl octanoate, ethyl decanoate, diethyl butanoate, ethyl dodecanoate, ethyl hexanoate), short-chain fatty acids (SCFA) (propionic, isobutyric, butyric, butyric acids), medium-chain fatty acids (MCFA) (octanoic, decanoic and dodecanoic acids). All reagents were analytical grade from Sigma-Aldrich (Barcelona, Spain).
2.4.3. Colour and Anthocyanins Analysis
The following colour parameters were determined: CIELab coordinates, Colour Intensity and Total Polyphenolic Index (TPI). CIELab coordinates were determined as describe [29]. The colorimetric coordinates were calculated with MSCV software, including the red-greenness (a*) and yellow-blueness (b*) and their derivate magnitudes: hue (H), lightness (L) and Chroma (C). The Colour Intensity (CI) was calculated from the sum of absorbances at 420, 520 and 620 nm, measured in a spectrophotometer, using the method described by [30]. The content of free anthocyanins, non-acylated and acylated anthocyanins as well as pyranoanthocyanins, was determinate in two points of AF: after MC and after the AF. Samples from final AF were only filtered with a 0.22 μm pore filters (Merck) before injection. However, samples from the final of CM were pre-treated by using PVPP (Sigma-Aldrich) columns in order to eliminate sugars which could interfered in the HPLC measure. Then both batches of samples were analyzed by using was analyzed with an Agilent 1200 series liquid chromatograph (HPLC–diode array detection) using an Agilent Zorbax Eclipse XDB-C18 column (4.6 mm x 250 mm x 5 μm, Agilent Technologies) with the procedure described by [31].
The total anthocyanin content was determined by spectrophotometry using the method described by [32].
2.5. Sensory Analysis
After the AF and MLF, sensory analyses were conducted by a trained tasting panel consisting of 12 tasters. First, the panel compared three wines through a blind triangle test to identify any noticeable differences between them. Subsequently, a descriptive test was performed on wines that were found to be significantly different in the triangle test. In the descriptive test, tasters evaluated the intensity of five attributes using a numerical scale (from 0 to 5): acidity, red fruit aroma, banana aroma, grass aroma, and global perception.
2.6. Statistical Analysis
All the fermentations were performed in triplicate to improve the consistency of the results. Statistical analysis of data was done by using the ANOVA and Tukey test with XLSTAT 2021.2.3 software (Addinsoft, Paris, France). A p-value of less than 0.05 was considered statistically significant. A principal component analysis (PCA) was used to describe the volatile composition of wines after MC and AF. Panel check V1.4.2.2012 was used for sensory data.
3. Results
3.1. Alcoholic Fermentation
As it has been described, CM offers several possibilities for conducting the vinification process. The following vinification process was carried out: after undergoing five days of CM under anaerobic conditions, the free-run must and press must were blended to observe and analyze the complete wine produced during CM, comparing samples with and without the presence of T. delbrueckii.
Subsequently, various parameters of the resulting wines were analyzed at two stages: after CM and AF. The initial parameters in the grape must were as follows: pH 3.3, titratable acidity 4.85 g/L, α-amino nitrogen 121 mg/L and ammonium 87 mg/L. The initial density was 1085.3 g/L and as the yeast started the AF in the free-run must the density gradually decreased. In the Control condition with spontaneous yeasts, the density only decreased to 1081.2 ± 0.4 g/L. However, in the CM condition with T. delbrueckii, the decrease was significantly more pronounced. Specifically, for TdP, the density decreased to 1063.6 ± 3.0 g/L, and for TdV, it decreased to 1067.3 ± 2.8 g/L (Figure 1). This reduction in initial density facilitated a shorter duration of AF in wines containing T. delbrueckii. The TdP condition lasted for 13 days, while the TdV condition lasted for 14 days. In contrast, the control condition with S. cerevisiae alone extended for a duration of 17 days.
The AUC (Area Under the Curve) values were calculated for wines sampled at the end of the CM and sampled at the end of AF (Table 1). Significant differences were observed in the CM samples, where the presence of T. delbrueckii resulted in significantly lower AUC values compared to the CM Control, indicating a faster AF during CM. However, after the inoculation of S. cerevisiae and the performance of AF, Control wines exhibited higher AUC values than wines with T. delbrueckii (TdP and TdV). This indicates that despite T. delbrueckii consuming sugars during CM, S. cerevisiae alone leads to a faster AF, which aligns with previous studies that have reported S. cerevisiae to have faster AF compared to sequential or coinoculated fermentations with non-Saccharomyces species due to the competition between species [12,33].
In terms of yeast populations, it was observed that the presence of non-Saccharomyces yeasts, detected in lysine medium, was higher in wines that were inoculated with T. delbrueckii as expected. It has been previously reported that when T. delbrueckii is used in sequential fermentation with S. cerevisiae, there is a high percentage of T. delbrueckii observed at the end of AF [21,33].
Few differences were observed in the general oenological parameters analyzed. A slight production of ethanol was observed after CM, between 1 and 3% (v/v), as stated in literature [1]. However, in this sampling point, the ethanol content was higher in the musts inoculated with T. delbrueckii (TdP and TdV) than in the Control condition. This was predictable since the AF in the free-run must were less advanced in Control condition due to the absence of inoculated yeast, producing only a 1.06% (v/v) of ethanol. Besides, there was a decreasing trend in ethanol production after AF in TdP and TdV wines compared to Control. Many authors have stated that ethanol decreases in sequential AF with the use of T. delbrueckii [17,34,35]. However, this decrease depends on the vinification conditions [16]; thus, the reduction was not significant in these CM conditions, No significant differences were observed in glycerol, pH, citric acid, or succinic acid among the samples. However, L-malic acid was more consumed in Td wines than in the Control wines after AF. This could be explained as slight consumption of L-malic acid has been observed in yeast for their metabolism [36]. It has been reported that the consume is higher in T. delbrueckii fermentations [15,37,38]. Variations were found in acetic acid levels, with a noticeable increasing trend in the Control samples at both the CM and AF stages. In sequential AF with T. delbrueckii and S. cerevisiae has been observed a reduction of acetic acid to a greater or lesser degree depending on the strain and winemaking conditions [12,14,19].
Furthermore, in terms of nitrogen content at the end of CM, wines fermented with T. delbrueckii exhibited significantly higher consumption compared to the Control, which can be attributed to a larger yeast population. However, the Control wine after AF showed complete consumption of ammonia and slightly higher consumption of α-amino nitrogen compared to TdP and TdV wines. It is worth noting that after CM, TdP wine displayed higher consumption of α-amino nitrogen compared to TdV wine. Additionally, there was an increase in mannoproteins presence at the end of AF, consistent with previous reports [21,26,39], indicating higher nitrogen concentration availability in TdP and TdV wines after AF.
3.2. Volatile Composition
In order to examine the impact of both T. delbrueckii strains on the volatile composition of wines, a Principal Component Analysis (PCA) was conducted (Figure 2). The identified volatile compounds were categorized into the following families: Ethyl esters, fusel alcohols acetates, fusel alcohols, MCFA, SCFA and other alcohols (Table S2).
On one hand Figure 2A shows that PC1 separated the wines in two groups. The samples after CM and Control wines after AF (AF control) are separated in a group, while wines with T. delbrueckii after AF (AF TdP and AF TdV) are grouped in another group. On the other hand, PC2 separate wines with T. delbrueckii regarding the strain used (AF TdP and AF TdV). The Control condition with spontaneous yeast during CM did not undergo changes during the completion of AF, with the exception of some compounds. Instead, it remained similar to samples after CM being positively correlated with the other alcohols and MCFA variables, and negatively correlated with the rest (Figure 2). Only few compounds showed a significant increase after the completion of AF in all conditions, such as 1-propanol, 2-methyl propanol, ethyl dodecanoate and 2-phenylethanol (Table S2). Previous studies have reported that a wide range of aromatic compounds in carbonic maceration wines are formed in the initial stage of the process (CM), which occurs under a CO2 atmosphere [5,40]. Some differences were observed in relation to the presence or not of T. delbrueckii after CM phase. Ethyl butanoate, 2-methyl propanol, ethyl dodecanoate and 2-phenyletanol were increased significantly (Table S2) in CM TdP and CM TdV wines, regardless the strain.
However, as shown in Figure 2, it is evident that several volatile compounds showed an increase only after AF in T. delbrueckii conditions (AF TdP and AF TdV), positively correlated with ethyl esters, fusel alcohols, SCFA and fusel alcohol acetates. This implies that the final wines in the presence of T. delbrueckii after the entire process have higher concentrations of these volatile families. These compounds include: 1-propanol, 2-methyl-propanol, isoamyl acetate, 2-phenylethanol acetate, ethyl decanoate, ethyl dodecanoate, and isopropanol, volatile compounds characterized by alcohol, wine, banana, roses, grape and leave descriptors, respectively [41] (Table S2).
The modulation of aroma due to the presence of T. delbrueckii showed in this work confirmed previous results in red [17,38] and white wines [10], or even in rosé wine [13,42]. This effect has been also associated to an increase in esters and fusel alcohols, in spite that this impact depends on the strain and wine. Regarding the results of this study TdP strain increase significatively more than TdV strain the concentrations of 2-phenlyethanol, 2-methyl propanol and isoamyl acetate (Table S2). Isoamyl acetate is a characteristic aromatic compound found in CM wines [1], characterized for its banana descriptor (41). However, after CM the concentration of isoamyl acetate in these wines only reached concentrations of 0.62 mg/L (Control), 0.63 mg/L (TdP) and 0.47 mg/L (TdV) (Table S2) without significant differences, maybe due to the grape cultivar. However, it is worth noting that TdP and TdV increased significantly this isoamyl concentration in wine after AF, reaching a concentration of 3.37 mg/L and 1.32 mg/L, respectively, compared to the AF Control wine with a concentration of 0.58 mg/L. Previous studies have reported that CM vinification process leads to higher concentrations of this volatile compound compared to traditional vinification methods, with differences between cultivars and types of wines. For instance, in French wines from blend of cultivars [3] observed concentrations of 3.20 mg/L in CM wines compared to 0.51 mg/L in traditional young red wines, however [5] described concentrations of 2.78 mg/L in CM wines compared to 1.14 mg/L in traditional red wines.
In addition, it worth to highlight that the negative correlation of AF TdP and AF TdV with MCFA was due to a trend on a decrease of this family (Figure 2), especially associated to decanoic acid. It has been reported that the presence of T. delbrueckii during AF leads to a reduce in MCFA. This reduction has been associated with a detoxification due to the presence of more mannoproteins in T. delbrueckii wines (Table 1). These findings indicate that the presence of T. delbrueckii during CM not only changes the volatile composition during the CM phase but also carries its influence throughout the AF process, especially with TdP.
3.3. Colour Parameters and Anthocyanins Composition
In which refers to anthocyanins and colour composition interesting difference were found between conditions. Table 2 presents the results of anthocyanins composition and colour parameters. It is evident that the concentration of anthocyanins is relatively low, which could be attributed to the grape cultivar [43] or maybe to the young age of the Grenache vines from which the grapes were harvested. It is noteworthy than anthocyanins content and colour characteristics in CM differs between different studies, some authors described these wines with high phenolic content and greater or similar colour intensity than conventional wines [5]. However traditionally CM wines has been described as wines with less intense colour and less total phenolic compounds and anthocyanins [2].
In terms of microbiological treatments, the presence of T. delbrueckii during the CM phase significantly increased the concentration of anthocyanins in wines, particularly in TdV wines. This effect could be related with an oxidation of anthocyanins in Control wines due to the fact that the AF took longer to start (Figure 1). Furthermore, the high anthocyanins content of wines fermented in presence of T. delbrueckii have been previously documented in traditional red wines with this specific TdV strain [12], as well as with other strains [11,37,44]. This phenomenon may be attributed to the elevated pectolytic activity observed in certain non-Saccharomyces yeast, such as Metschnikowia pulcherrima, [45] however it has not been proved in T. delbrueckii.
After AF the wines produced with TdP and TdV still maintained a higher proportion of free anthocyanins compared to the Control wine (Table 2). However, when comparing the concentration of anthocyanins after CM and after AF, it had a decreasing trend in the presence of T. delbrueckii, with a higher reduction observed in TdV wine. This effect was not observed in Control wine after AF. As it has been previously reported, an AF with T. delbrueckii without the presence of grape skins can lead to a decrease in anthocyanin levels, as observed in rosé wines [42]. This reduction could be attributed to the formation of aglycones from anthocyanins, which are susceptible to oxidation [46], or it could be due to the high β-glucosidase activity of certain T. delbrueckii strains [47]. Additionally, it could be related to the absorption of pigments by the yeast walls, which has been shown to vary depending on the yeast species or strain [48,49].
Anthocyanidin-3-O-monoglucosides and other free anthocyanin concentrations, determined by HPLC-DAD, exhibited a similar trend to that reported for total anthocyanins measured using spectrophotometry. This correlation was anticipated, as spectrophotometric analysis includes the detection of other pigments, potentially leading to an overestimation of the total anthocyanin concentration. Conversely, HPLC-DAD methods solely detect free anthocyanins [50].
In terms of pyranoanthocyanins (Vitisin A and Vitisin B), significant differences were observed. In Control samples at the end of CM were not detect any pyranoanthocyanins, while they were detected in TdP and TdV samples after CM. However, after AF, pyranoanthocyanins were detected in all wines, with a higher concentration in TdP and TdV wines. It was also observed that Td wines after AF, the concentration decreased in comparison to Td samples after CM. It worth noting that in rosé wines it has been observed previously a higher proportion of pyranoanthocyanins in wines fermented with T. delbrueckii compared to wines fermented with S. cerevisiae [42]. These pigments derived contribute to improved colour stability in wines, as they are less affected by changes in pH and are less likely to experience discoloration due to the presence of sulphur dioxide [51].
At the CM stage, there were no significant differences in CI among the different conditions, although there was a slight decreasing trend observed in the Control CM sample. However, after the completion of AF, Control wine exhibited a significant reduction in CI (Table 2). In this context, it was observed that Control wines exhibited significantly higher L* values and lower C* values compared to Td wines. This suggests that wines fermented with T. delbrueckii, regardless of the strain used, had a more intense and vibrant colour than the control samples, which is related to the higher concentration of anthocyanins. Regarding the H* coordinate, Control samples showed higher values than Td wines, indicating a more pronounced yellowish tone. This, along with the lower concentration of anthocyanins observed, is likely associated with an anthocyanin oxidation. Conversely, the Td wines exhibited the opposite trend. In terms of the a* coordinate, Td wines had higher values compared to the Control wines, indicating a stronger red component in both after CM and after AF, which could be also related with the higher concentration of anthocyanins. However, in terms of the b* coordinate, Td wines had lower values after CM, resulting in yellowish hues which agrees with high H* values. Nevertheless, there were no differences in the b* coordinate after AF.
3.4. Malolactic Fermentation
After the end of CM and AF, three MLF strategies were implemented: inoculation with O. oeni strains OoVP41 and OoCH11, and spontaneous fermentation. At the end of AF, the initial LAB concentration was low to become a MLF (2·103 CFU/mL) and the consumption of L-malic acid was also small (Table 1), suggesting that MLF did not have commenced yet. The purpose of inoculating the O. oeni starter cultures was to observe their potential under competitive pressure of endogenous LAB.
Figure 3 shows the MLF kinetics of the three wine conditions with their respective MLF strategies. The inoculation of OoVP41 resulted in a shorter MLF duration compared to OoCH11 and spontaneous MLF. Wines TdP and TdV, which underwent MLF in the presence of OoVP41, completed MLF two days earlier (8 days) than the control wines with the same MLF starter culture (10 days). Previous studies conducted under laboratory conditions [21] have also described OoVP41 as a highly efficient fermentative strain. This study further demonstrates its successful performance under competitive conditions. The effect of T. delbrueckii on MLF was also observed with the use of the OoCH11 starter culture. However, in this case, the MLF duration was only reduced by one day (11 days vs. 12 days) without differences between strains.
The greater differences were found in spontaneous MLF, in the case of control wines they took to start the MLF 7 days while TdP took 4 days and TdV only 3 days. Regarding the total time MLF TdP and TdV were also shorter, Td P lasted 15 days and TdV 16 days, notably less time that the control, which lasted 20 days. It has been reported an interesting effect on spontaneous MLF. Furthermore, the most underlining differences were observed in spontaneous MLF. Control wines took 7 days to initiate MLF, whereas TdP took 4 days and TdV only took 3 days. Apart from bring forward the beginning of MLF, the total duration was also shorter in TdP (15 days) and TdV (16 days) compared to the control, which lasted 20 days.
The presence of T. delbrueckii has been associated with various factors that contribute to the enhanced efficiency of O. oeni. These factors include the reduction of inhibitory compounds such as succinic acid, SO2, or MCFA, the mitigation of stressful conditions such as low pH or high ethanol content, and the increase of beneficial compounds like mannoproteins. However, in the present study, no differences were observed in ethanol levels or pH under these conditions. Therefore, the improved performance of MLF may be attributed to the reduction of MCFA (Figure 2), which is known to be toxic to O. oeni [52] or the increase in ammonia and mannoproteins (Table 1). Apart of a nutritional intake the increase of mannoproteins could be associated to the reduction of MCFA, since they could absorb these lipids detoxifying the media [53]. In addition, previous research has linked increased mannoprotein levels to improved MLF performance, being observed that the relative expression of certain O. oeni genes involved in mannose uptake and other sugars was elevated in T. delbrueckii wines [26]. These authors also described that the metabolism of mannoproteins is more active under stressful conditions. Therefore, it is possible that in this study, the metabolism of mannoproteins was more activated due to the high concentrations of anthocyanins compared to the Control. Certain phenolic compounds can impose stress on O. oeni, but not all of them do. Interestingly, previous studies have reported an improvement in MLF even under higher polyphenolic conditions than the control in traditional red winemaking methods [12]. Thus, it is noteworthy that the inoculation of T. delbrueckii in CM wines also promotes MLF, assisting O. oeni in adapting to challenging conditions.
3.5. Organoleptic Characteristics
To better understand the effects of T. delbrueckii treatment during CM on wines, a sensory analysis was conducted after AF and MLF. Initially, a triangle test was performed, comparing Control wines to TdP, Control wines to TdV, and TdP to TdV. The results revealed significant differences between Control and TdP, as well as between Control and TdV. However, the panel of tasters was unable to distinguish between TdP and TdV. Regarding the MLF comparison, the three MLF conditions (Spontaneous, OoVP41, and OoCH11) were evaluated for each AF condition, but the tasters were unable to differentiate between the three MLF conditions in any of the wines. Consequently, a descriptive test was conducted exclusively on wines after AF.
The PCA represented in Figure 5A shows a discrimination of the three wines according of the results obtained in the descriptive test. All variables are correlated positively with T. delbrueckii strains, especially with TdV.
In Figure 5B the same trend in some of the analyzed parameters is observed. For instance, TdV exhibited pronounced red fruit aroma, grass aroma, banana aroma, and higher values in overall perception. In the case of TdP, the red fruit and grass aromas were similar to those of the control wines, while the banana aroma and overall perception were improved compared to the Control wine. Among these parameters, the banana aroma was the only one that showed a significant difference between T. delbrueckii wines and Control wine (Figure 5B). Thus, it can be concluded that consumers associated a stronger banana aroma with the presence of T. delbrueckii during CM. It is noticeable that testers had preference for TdV wines [54].
4. Conclusions
In this study, we investigated the impact of two T. delbrueckii strains (TdP and TdV) on the MLF performance and sensory characteristics in carbonic maceration wines. Then three strategies of MLF were tested: the inoculation of two O. oeni strains (OoVP41 and OoCH11) and a spontaneous MLF. While the general physicochemical parameters did not exhibit significant differences between conditions, the organoleptic parameters showed noteworthy changes with the presence of T. delbrueckii. When this species was introduced during CM, it resulted in wines with enhanced anthocyanin content and a distinct volatile profile. Notably, T. delbrueckii strains contributed to significantly higher levels of the aroma compound isoamyl acetate, a key aroma in carbonic maceration wines. The TdP strain, in particular, led to even higher concentrations of this aroma compared to the TdV strain. A sensory evaluation panel also discerned differences between the treatments, with TdV wines exhibiting more pronounced aromas of red fruit, banana and grass.
Regarding MLF, the presence of T. delbrueckii significantly improved the performance, especially in cases of spontaneous MLF, where the fermentation started earlier and required less time to complete. Moreover, the inoculation of OoVP41 also contributed to a two-day reduction in MLF duration. These findings underscore the potential benefits of utilizing T. delbrueckii strains for enhancing MLF efficiency and overall sensory attributes in CM wines. In regions with increased acidity due to climate change, particularly in the new north regions, the inoculation of LAB becomes crucial to ensure complete malic acid degradation and maintain the desired wine quality. This is of particular importance in the context of CM vinification. By strategically employing these strains, winemakers can optimize the MLF process and enrich the sensory profile of carbonic maceration wines, providing an avenue for producing wines of enhanced quality and distinctive characteristics.
Supplementary Materials
The following supporting information can be downloaded at the website of this paper posted on Preprints.org. Table S1: Citric and acetic acid analyzed after MLF; Table S2: Total volatile compounds analyzed (mg/L).
Author Contributions
Candela Ruiz-de-Villa: Investigation, Methodology & Original draft preparation. Jordi Gombau: Investigation, Methodology & Data curation. Montse Poblet.: Investigation, Methodology & Data curation. Albert Bordons: Supervision, Reviewing & Visualization. Joan Miquel Canals: Supervision & Reviewing. Fernando Zamora: Methodology & Original draft preparation. Cristina Reguant: Supervision, Writing, Reviewing & Funding acquisition. Nicolas Rozès: Supervision, Writing, Reviewing and Editing.
Funding
This work was supported by grant PGC2018-503 101852-B-I00 awarded by the Spanish Research Agency. CRV is grateful for the predoctoral fellowship from the Catalan Government (2020FI).
Conflicts of Interest
The authors declare that they have no known competing financial interests or personal relationships that could have appeared to influence the work reported in this paper.
References
- Tesnière, C.; Flanzy, C. Carbonic maceration wines: Characteristics and winemaking process. In Advances in Food and Nutrition Research Academic Press Inc. 2011, Vol. 63, pp. 1–15. [CrossRef]
- Portu, J.; Gutiérrez-Viguera, A.R.; González-Arenzana, L.; Santamaría, P. Characterization of the color parameters and monomeric phenolic composition of ‘Tempranillo’ and ‘Graciano’ wines made by carbonic maceration. Food Chemistry 2023, 406, 134327. [Google Scholar] [CrossRef] [PubMed]
- Antalick, G.; Perello, M.C.; de Revel, G. Esters in wines: New insight through the establishment of a database of french wines. American Journal of Enology and Viticulture 2014, 65, 293–304. [Google Scholar] [CrossRef]
- Etaio, I.; Meillon, S.; Pérez-Elortondo, F.J.; Schlich, P. Dynamic sensory description of Rioja Alavesa red wines made by different winemaking practices by using Temporal Dominance of Sensations. Journal of the Science of Food and Agriculture 2016, 96, 3492–3499. [Google Scholar] [CrossRef] [PubMed]
- González-Arenzana, L.; Santamaría, R.; Escribano-Viana, R.; Portu, J.; Garijo, P.; López-Alfaro, I.; López, R.; Santamaría, P.; Gutiérrez, A.R. Influence of the carbonic maceration winemaking method on the physicochemical, colour, aromatic and microbiological features of tempranillo red wines. Food Chemistry 2020, 319, 126569. [Google Scholar] [CrossRef]
- Chinnici, F.; Sonni, F.; Natali, N.; Galassi, S.; Riponi, C. Colour Features and Pigment Composition of Italian Carbonic Macerated Red Wines. Food Chem 2009, 113, 651–657. [Google Scholar] [CrossRef]
- Guzzon, R.; Malacarne, M.; Larcher, R.; Franciosi, E.; Toffanin, A. The impact of grape processing and carbonic maceration on the microbiota of early stages of winemaking. Journal of Applied Microbiology 2022, 128, 209–224. [Google Scholar] [CrossRef]
- Gutiérrez, A.R.; Santamaría, P.; Olarte, C.; López-Alfaro, I.; Garijo, P.; González-Arenzana, L.; Sanz, S. Influence of microbial population on the characteristics of carbonic maceration wines. LWT 2022, 166, 113783. [Google Scholar] [CrossRef]
- Renault, P.; Coulon, J.; de Revel, G.; Barbe, J.C.; Bely, M. Increase of fruity aroma during mixed T. delbrueckii/S. cerevisiae wine fermentation is linked to specific esters enhancement. International Journal of Food Microbiology 2015, 207, 40–48. [Google Scholar] [CrossRef]
- Azzolini, M.; Tosi, E.; Lorenzini, M.; Finato, F.; Zapparoli, G. Contribution to the aroma of white wines by controlled Torulaspora delbrueckii cultures in association with Saccharomyces cerevisiae. World Journal of Microbiology and Biotechnology 2015, 31, 277–293. [Google Scholar] [CrossRef]
- Chen, K.; Escott, C.; Loira, I.; del Fresno, J.M.; Morata, A.; Tesfaye, W.; Calderon, F.; Suárez-Lepe, J.A.; Han, S.; Benito, S. Use of non-Saccharomyces yeasts and oenological tannin in red winemaking: Influence on colour, aroma and sensorial properties of young wines. Food Microbiology 2018, 69, 51–63. [Google Scholar] [CrossRef]
- Balmaseda, A.; Rozès, N.; Bordons, A.; Reguant, C. Torulaspora delbrueckii promotes malolactic fermentation in high polyphenolic red wines. LWT 2021, 148. [Google Scholar] [CrossRef]
- Muñoz-Redondo, J.M.; Puertas, B.; Cantos-Villar, E.; Jiménez-Hierro, M.J.; Carbú, M.; Garrido, C.; Ruiz-Moreno, M.J.; Moreno-Rojas, J.M. Impact of Sequential Inoculation with the Non- Saccharomyces T. delbrueckii and M. pulcherrima Combined with Saccharomyces cerevisiae Strains on Chemicals and Sensory Profile of Rosé Wines. Journal of Agricultural and Food Chemistry 2021, 69, 1598–1609. [Google Scholar] [CrossRef] [PubMed]
- Bely, M.; Stoeckle, P.; Masneuf-Pomarède, I.; Dubourdieu, D. Impact of mixed Torulaspora delbrueckii-Saccharomyces cerevisiae culture on high-sugar fermentation. International Journal of Food Microbiology 2008, 122, 312–320. [Google Scholar] [CrossRef] [PubMed]
- Ruiz-de-Villa, C.; Poblet, M.; Cordero-Otero, R.; Bordons, A.; Reguant, C.; Rozès, N. Screening of Saccharomyces cerevisiae and Torulaspora delbrueckii strains in relation to their effect on malolactic fermentation. Food Microbiology 2023, 112. [Google Scholar] [CrossRef] [PubMed]
- Benito, S. The impact of Torulaspora delbrueckii yeast in winemaking. Applied Microbiology and Biotechnology 2018, 102, 3081–3094. [Google Scholar] [CrossRef] [PubMed]
- Belda, I.; Navascués, E.; Marquina, D.; Santos, A.; Calderon, F.; Benito, S. Dynamic analysis of physiological properties of Torulaspora delbrueckii in wine fermentations and its incidence on wine quality. Applied Microbiology and Biotechnology 2015, 99, 1911–1922. [Google Scholar] [CrossRef] [PubMed]
- Balmaseda, A.; Rozès, N.; Leal, M.Á.; Bordons, A.; Reguant, C. Impact of changes in wine composition produced by non-Saccharomyces on malolactic fermentation. International Journal of Food Microbiology 2021, 337. [Google Scholar] [CrossRef] [PubMed]
- Martín-García, A.; Balmaseda, A.; Bordons, A.; Reguant, C. Effect of the inoculation strategy of non-Saccharomyces yeasts on wine malolactic fermentation. Oeno One 2020, 54, 101–108. [Google Scholar] [CrossRef]
- Ferrando, N.; Araque, I.; Ortís, A.; Thornes, G.; Bautista-Gallego, J.; Bordons, A.; Reguant, C. Evaluating the effect of using non-Saccharomyces on Oenococcus oeni and wine malolactic fermentation. Food Research International 2020, 138. [Google Scholar] [CrossRef]
- Ruiz-de-Villa, C.; Poblet, M.; Bordons, A.; Reguant, C.; Rozès, N. Comparative Study of Inoculation Strategies of Torulaspora Delbrueckii and Saccharomyces Cerevisiae on the Performance of Alcoholic and Malolactic Fermentations in an Optimized Synthetic Grape Must. Int J Food Microbiol 2023, 404. [Google Scholar] [CrossRef]
- Gutiérrez, A.R.; Santamaría, P.; González-Arenzana, L.; Garijo, P.; Olarte, C.; Sanz, S. Yeasts Inoculation Effect on Bacterial Development in Carbonic Maceration Wines Elaboration. Foods 2023, 12, 2755. [Google Scholar] [CrossRef]
- De Man, J.C.; Rogosa, M.; Sharpe, M.E. A medium for the cultivation of Lactobacilli. Journal of Applied Bacteriology 1960, 23, 130–135. [Google Scholar] [CrossRef]
- Margalef-Català, M.; Felis, G.E.; Reguant, C.; Stefanelli, E.; Torriani, S.; Bordons, A. Identification of variable genomic regions related to stress response in Oenococcus oeni. Food Research International 2017, 102, 625–638. [Google Scholar] [CrossRef]
- Quirós, M.; Rojas, V.; Gonzalez, R.; Morales, P. Selection of non-Saccharomyces yeast strains for reducing alcohol levels in wine by sugar respiration. International Journal of Food Microbiology 2014, 181, 85–91. [Google Scholar] [CrossRef] [PubMed]
- Balmaseda, A.; Aniballi, L.; Rozès, N.; Bordons, A.; Reguant, C. Use of yeast mannoproteins by Oenococcus oeni during malolactic fermentation under different oenological conditions. Foods 2021, 10. [Google Scholar] [CrossRef]
- Ortega, C.; Lopez, R.; Cacho, J.; Ferreira, V. Fast analysis of important wine volatile compounds Development and validation of a new method based on gas chromatographic-flame ionisation detection analysis of dichloromethane microextracts. Journal of Chromatography A 2001, 923, 205–214. [Google Scholar] [CrossRef] [PubMed]
- Balmaseda, A.; Rozès, N.; Leal, M.Á.; Bordons, A.; Reguant, C. Impact of Changes in Wine Composition Produced by Non-Saccharomyces on Malolactic Fermentation. Int J Food Microbiol 2021, 337. [Google Scholar] [CrossRef]
- Ayala, F.; Echavarri, J.F.; Negueruela, A.I. A New Simplified Method for Measuring the Color of Wines. I. Red and Ros Wines. American Journal of Enology and Viticulture 1997, 48, 357–363. [Google Scholar] [CrossRef]
- Glories, Y. La couleur des vins rouges. 2ème partie: Mesure, origine et interprétation. Connaissance Vigne Vin 1984, 18, 253–271. [Google Scholar]
- Gil, M.; Kontoudakis, N.; González, E.; Esteruelas, M.; Fort, F.; Canals, J.M.; Zamora, F. Influence of Grape maturity and maceration length on color, polyphenolic composition, and polysaccharide content of Cabernet Sauvignon and Tempranillo Wines. Journal of Agricultural and Food Chemistry 2012, 60, 7988–8001. [Google Scholar] [CrossRef]
- Niketic-Aleksic, G.K.; Hrazdina, G. Quantitative analysis of the anthocyanin content in grape juices and wines. Lebensm. Wiss. Technol. 1972, 5163. [Google Scholar]
- Roca-Mesa, H.; Delgado-Yuste, E.; Mas, A.; Torija, M.J.; Beltran, G. Importance of micronutrients and organic nitrogen in fermentations with Torulaspora delbrueckii and Saccharomyces cerevisiae. International Journal of Food Microbiology 2022, 381. [Google Scholar] [CrossRef] [PubMed]
- Contreras, A.; Hidalgo, C.; Henschke, P.A.; Chambers, P.J.; Curtin, C.; Varela, C. Evaluation of non-Saccharomyces yeasts for the reduction of alcohol content in wine. Applied and Environmental Microbiology 2014, 80, 1670–1678. [Google Scholar] [CrossRef] [PubMed]
- Zhu, X.; Navarro, Y.; Mas, A.; Torija, M.J.; Beltran, G. A rapid method for selecting non-Saccharomyces strains with a low ethanol yield. Microorganisms 2020, 8. [Google Scholar] [CrossRef]
- Ribéreau-Gayon, Pascal. (2006). Handbook of enology. John Wiley.
- Escribano-Viana, R.; Portu, J.; Garijo, P.; López, R.; Santamaría, P.; López-Alfaro, I.; Gutiérrez, A.R.; González-Arenzana, L. Effect of the sequential inoculation of non-Saccharomyces/Saccharomyces on the anthocyans and stilbenes composition of Tempranillo wines. Frontiers in Microbiology 2019, 10. [Google Scholar] [CrossRef]
- Balmaseda, A.; Rozès, N.; Bordons, A.; Reguant, C. Modulation of a defined community of Oenococcus oeni strains by Torulaspora delbrueckii and its impact on malolactic fermentation. Australian Journal of Grape and Wine Research 2022, 28, 374–382. [Google Scholar] [CrossRef]
- Domizio, P.; Liu, Y.; Bisson, L.F.; Barile, D. Use of non-Saccharomyces wine yeasts as novel sources of mannoproteins in wine. Food Microbiology 2014, 43, 5–15. [Google Scholar] [CrossRef]
- Salinas, M.R.; Alonso, G.L.; Navarro, G.; Pardo, F.; Jimeno, J.; Huerta, M.D. Evolution of the Aromatic Composition of Wines Undergoing Carbonic Maceration Under Different Aging Conditions. Am J Enol Vitic 1996, 47134–47144. [Google Scholar] [CrossRef]
- Sumby, KM.; Grbin, P.R.; Jiranel, V. Microbial modulation of aromatic esters in wine: Current knowledge and future prospects. Food Chemistry 2010, 121, 1–16. [Google Scholar] [CrossRef]
- Ruiz-de-Villa, C.; Poblet, M.; Bordons, A.; Reguant, C.; Rozès, N. Screening of Saccharomyces cerevisiae and Torulaspora delbrueckii strains in relation to their effect on malolactic fermentation. LWT 2024, 112. [Google Scholar]
- Gombau, J.; Pons-Mercadé, P.; Conde, M.; Asbiro, L.; Pascual, O.; Gómez-Alonso, S.; García-Romero, E.; Miquel Canals, J.; Hermosín-Gutiérrez, I.; Zamora, F. Influence of grape seeds on wine composition and astringency of Tempranillo, Garnacha, Merlot and Cabernet Sauvignon wines. Food Science and Nutrition 2020, 8, 3442–3455. [Google Scholar] [CrossRef] [PubMed]
- Minnaar, P.; Nyobo, L.; Jolly, N.; Ntushelo, N.; Meiring, S. Anthocyanins and polyphenols in Cabernet Franc wines produced with Saccharomyces cerevisiae and Torulaspora delbrueckii yeast strains: Spectrophotometric analysis and effect on selected sensory attributes. Food Chemistry 2018, 268, 287–291. [Google Scholar] [CrossRef] [PubMed]
- Belda, I.; Conchillo, L.B.; Ruiz, J.; Navascués, E.; Marquina, D.; Santos, A. Selection and Use of Pectinolytic Yeasts for Improving Clarification and Phenolic Extraction in Winemaking. Int J Food Microbiol 2016, 223, 1–8. [Google Scholar] [CrossRef] [PubMed]
- Vidana Gamage, G.C.; Lim, Y.Y.; Choo, W.S. Sources and relative stabilities of acylated and nonacylated anthocyanins in beverage systems. Journal of Food Science and Technology 2022, 59, 831–845. [Google Scholar] [CrossRef]
- Maturano, Y.P.; Rodríguez Assaf, L.A.; Toro, M.E.; Nally, M.C.; Vallejo, M.; Castellanos de Figueroa, L.I.; Combina, M.; Vazquez, F. Multi-enzyme production by pure and mixed cultures of Saccharomyces and non-Saccharomyces yeasts during wine fermentation. International Journal of Food Microbiology 2012, 155, 43–50. [Google Scholar] [CrossRef]
- Morata, A.; Gómez-Cordovés, M.C.; Suberviola, J.; Bartolomé, B.; Colomo, B.; Suárez, J.A. Adsorption of anthocyanins by yeast cell walls during the fermentation of red wines. Journal of Agricultural and Food Chemistry 2003, 51, 4084–4088. [Google Scholar] [CrossRef]
- Tofalo, R.; Suzzi, G.; Perpetuini, G. Discovering the Influence of Microorganisms on Wine Color. Frontiers in Microbiology 2021, 12. [Google Scholar] [CrossRef] [PubMed]
- Rivas-Gonzalo, J.C.; Gutierrez, T.; Hebrero, E.; Santos-Buelga, C. Comparisons of Methods for the Determination of Anthocyanins in Red Wines. American Journal of Enology and Viticulture 1992, 43, 210–214. [Google Scholar] [CrossRef]
- Fulcrand, H.; Benabdeljalil, C.; Rigaud, J.; Cheynier, R.; Moljtounet, M. A new class of wine pigments generated by reaction between pyruvic acid and grape anthocyanins. Phytochemistry 1997, 47, 1401–1407. [Google Scholar] [CrossRef]
- Capucho, I.; San Romão, M.V. Effect of ethanol and fatty acids on malolactic activity of Leuconostoc oenos. Appl. Microbiol. Biotechnol. 1994, 42, 391–395. [Google Scholar] [CrossRef]
- Lafon-Lafourcade, S.; Geneix, C.; Ribéreau-Gayon, P. Inhibition of Alcoholic Fermentation of Grape Must by Fatty Acids Produced by Yeasts and Their Elimination by Yeast Ghosts. Applied and Environmental Microbiology 1984, 47. [Google Scholar] [CrossRef] [PubMed]
- Verdugo-Vásquez, N.; Orrego, R.; Gutiérrez-Gamboa, G.; Reyes, M.; Zurita Silva, A.; Balbontín, C.; Gaete, N.; Salazar-Parra, C. Trends and climatic variability in the Chilean viticultural production zones: three decades of climatic data (1985-2015). OENO One 2023, 57, 345–362. [Google Scholar] [CrossRef]
Figure 1.
Kinetic of alcoholic fermentation after five days of carbonic maceration. Control corresponds to the pure fermentation with S. cerevisiae CLOS; TdP and TdV corresponds to the fermentations with S. cerevisiae and CM with T. delbrueckii Prelude or T. delbrueckii Viniferm, respectively. All data is expressed as the arithmetic average of three biological replicates ± standard deviation (n = 3).
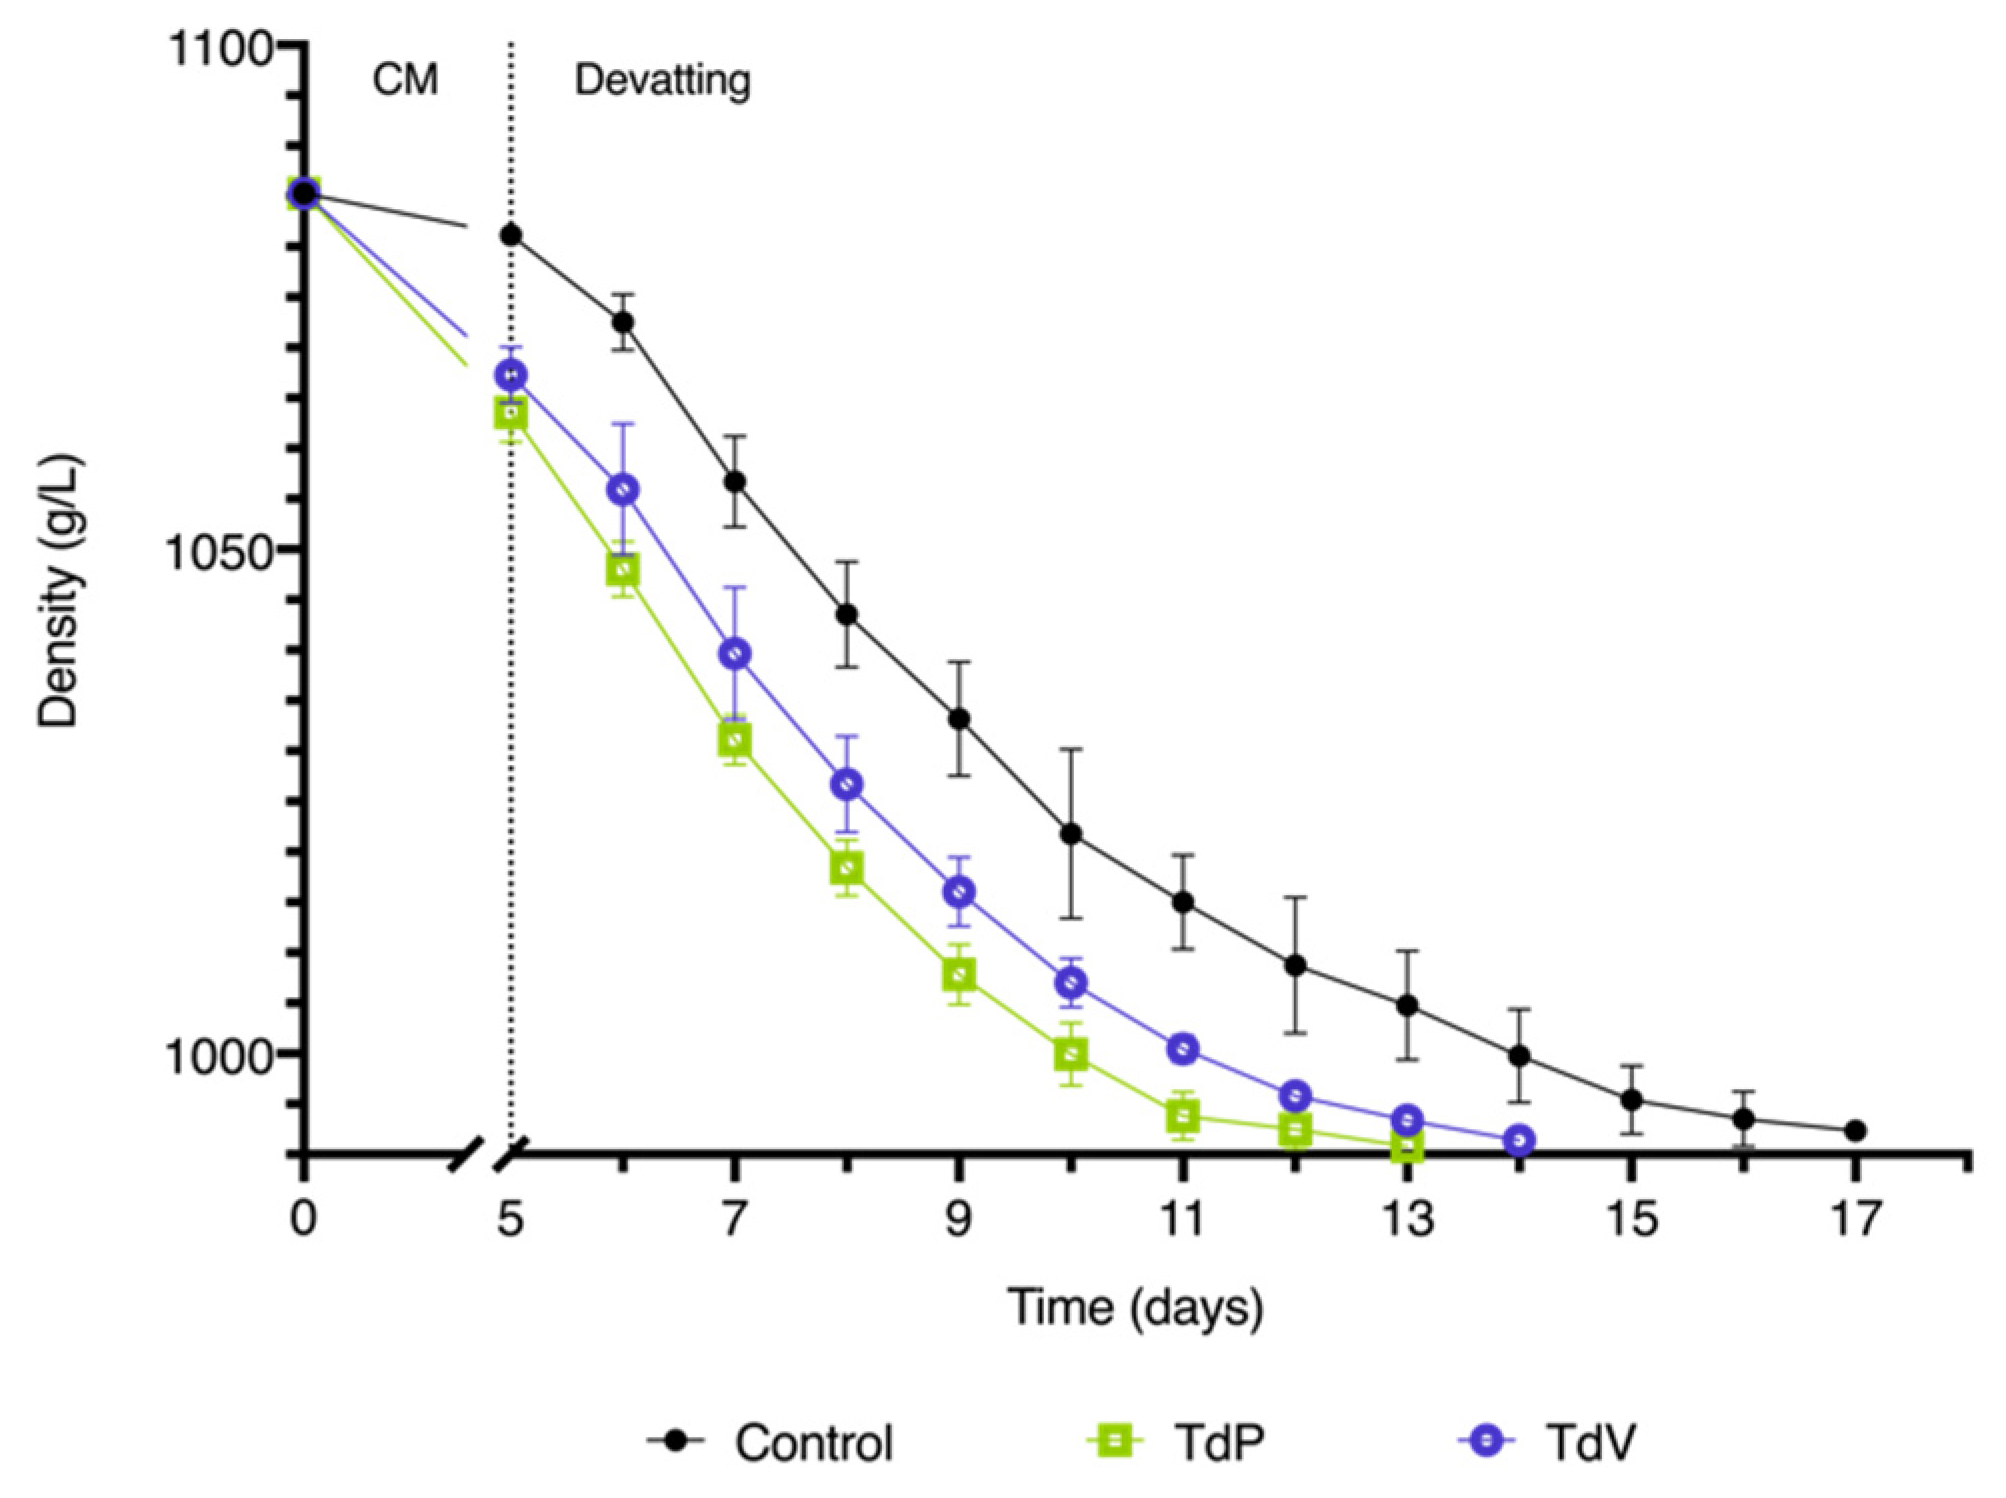
Figure 2.
Principal component analysis biplot built from the following variables: Ethyl esters, fusel alcohols acetates, fusel alcohols, MCFAs, SCFAs and other alcohols. The samples are the followings: CM Control: corresponds to control condition at the end of Carbonic maceration; CM TdP and CM TdV which corresponds to conditions inoculated with T. delbrueckii Prelude or T. delbrueckii Viniferm, respectively, at the end of carbonic maceration; Control: corresponds to control condition at the end of alcoholic fermentation; TdP and TdV: corresponds to conditions inoculated with T. delbrueckii Prelude or T. delbrueckii Viniferm, respectively, at the end of alcoholic fermentation.
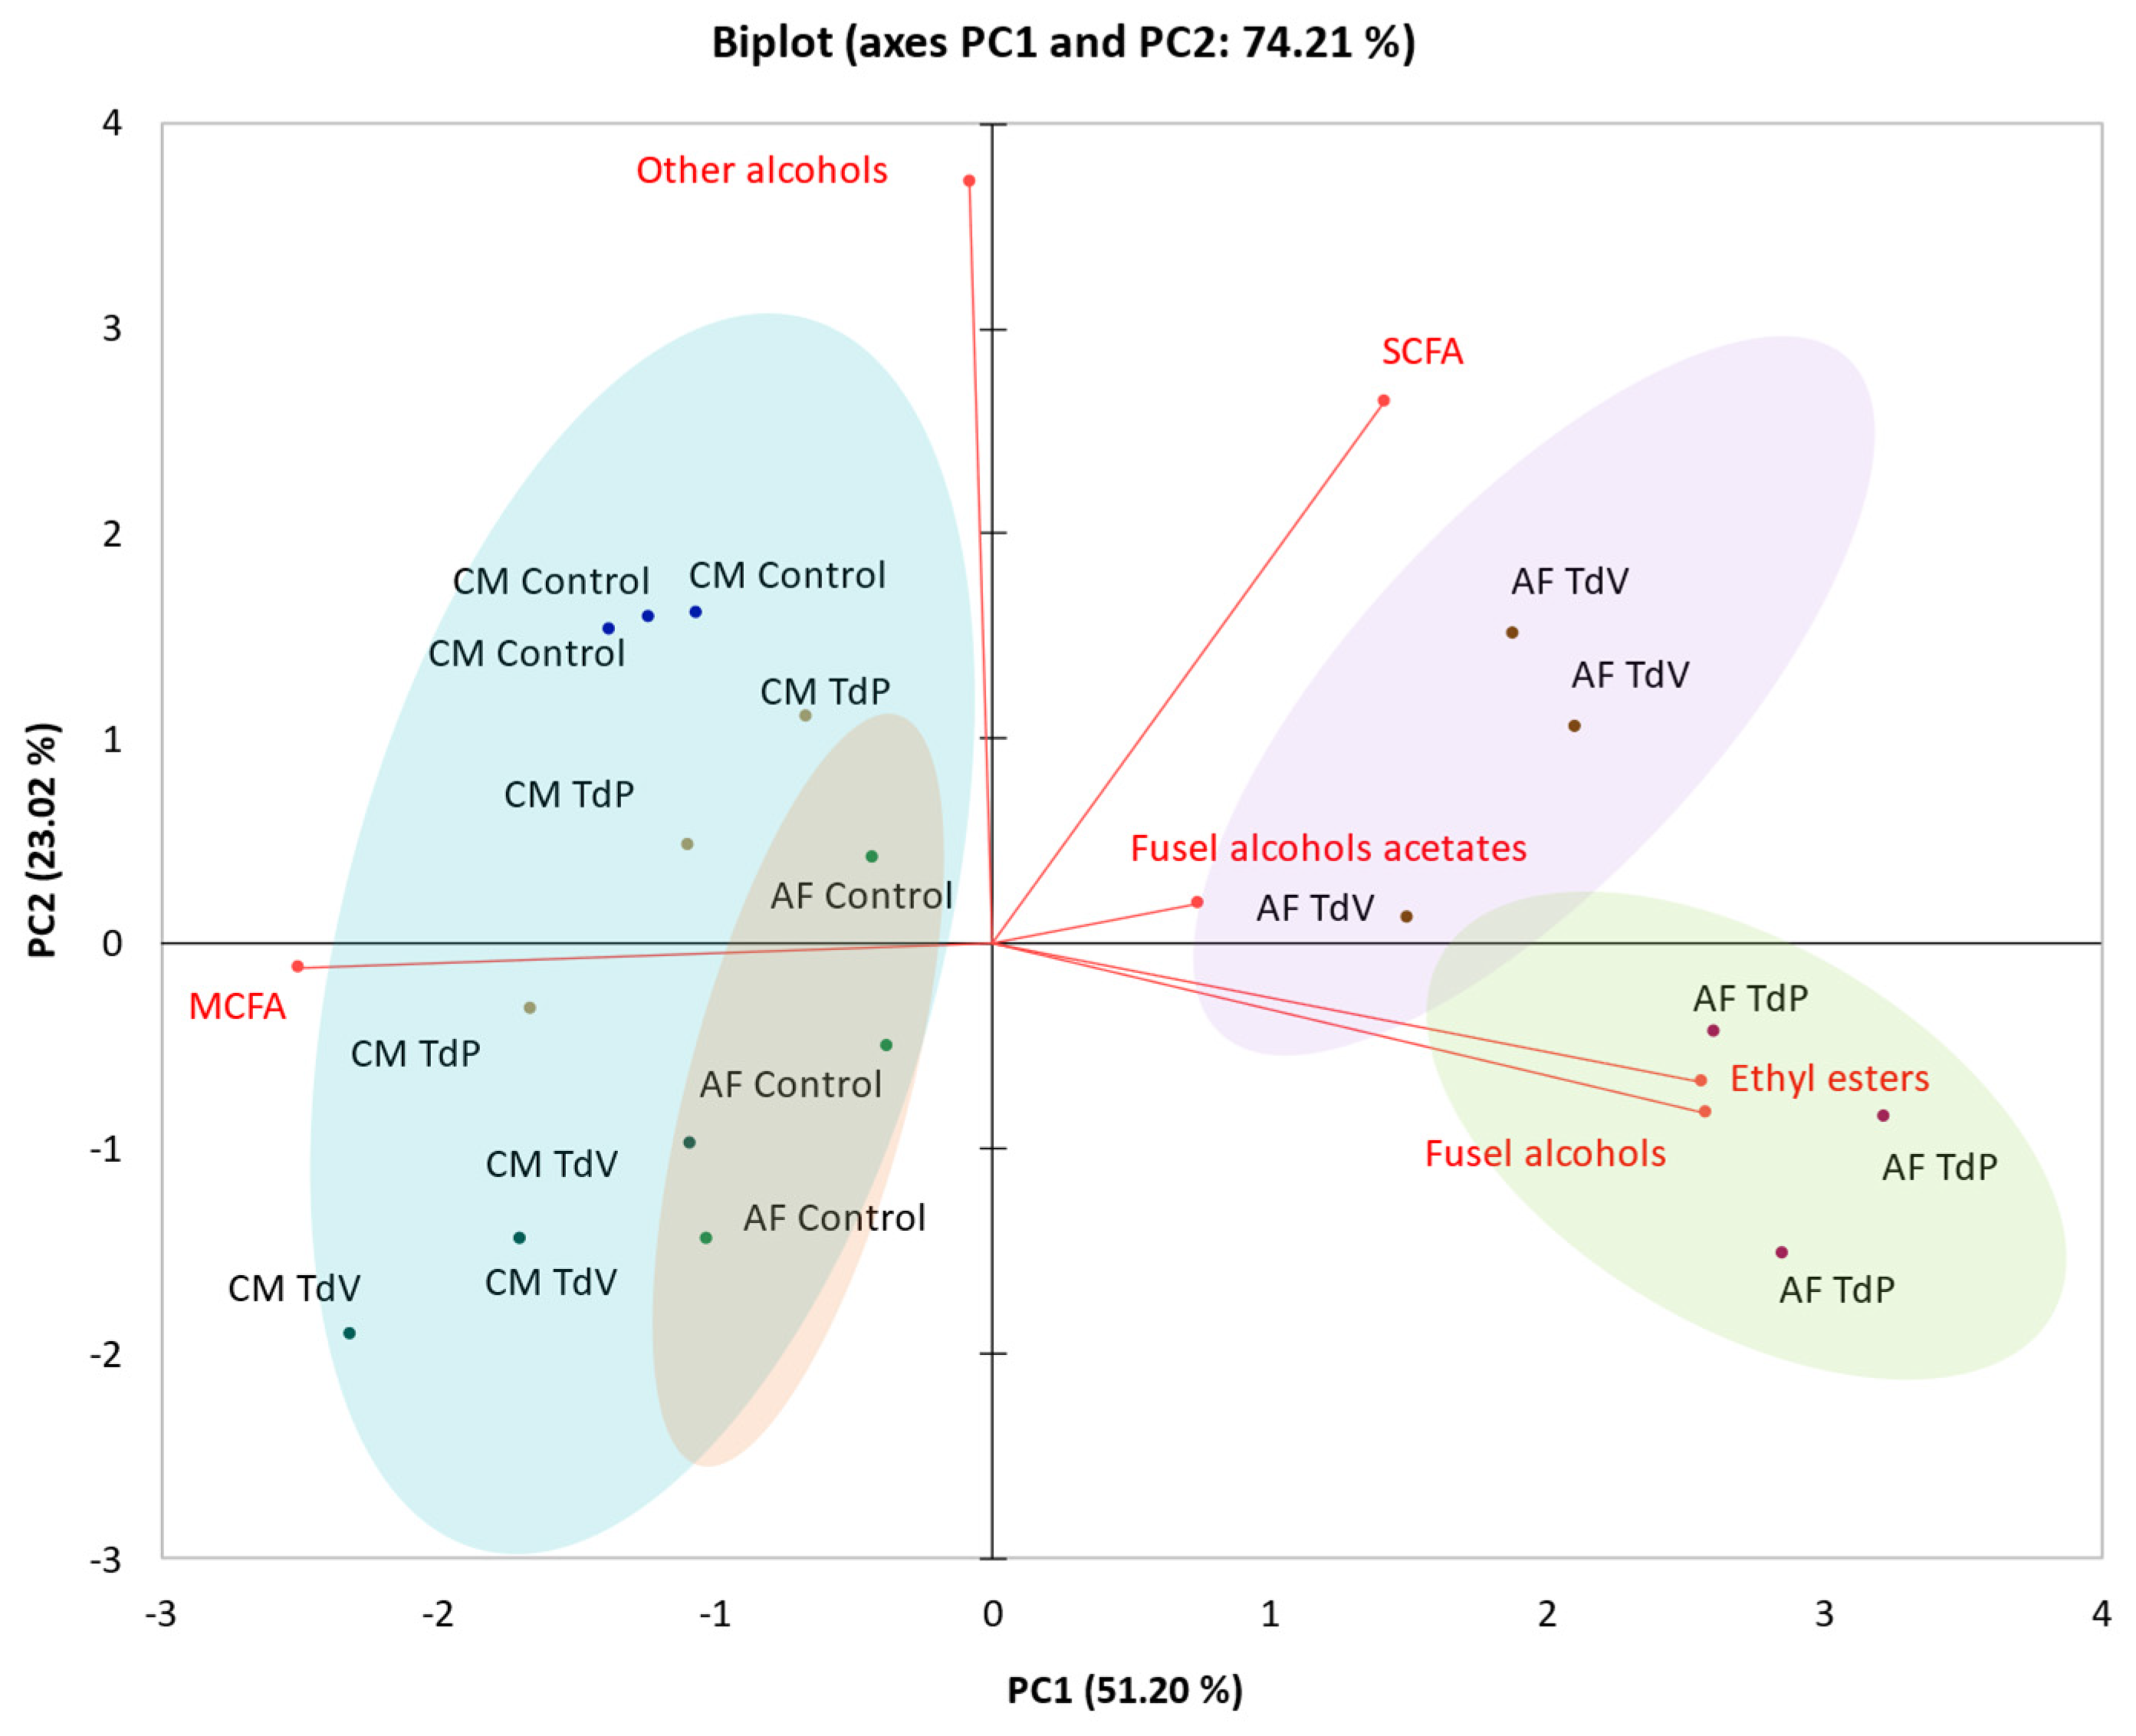
Figure 3.
Consumption of L-malic acid during malolactic fermentation. (A) corresponds to OoVP41 MLF; (B) corresponds to OoCH11 MLF, and (C) corresponds to Spontaneous MLF. Control corresponds to control condition only fermented with Sc, TdP and TdV corresponds to the fermentations with T. delbrueckii Prelude and Viniferm, respectively. All data is expressed as the arithmetic average of three biological replicates ± standard deviation (n = 3).
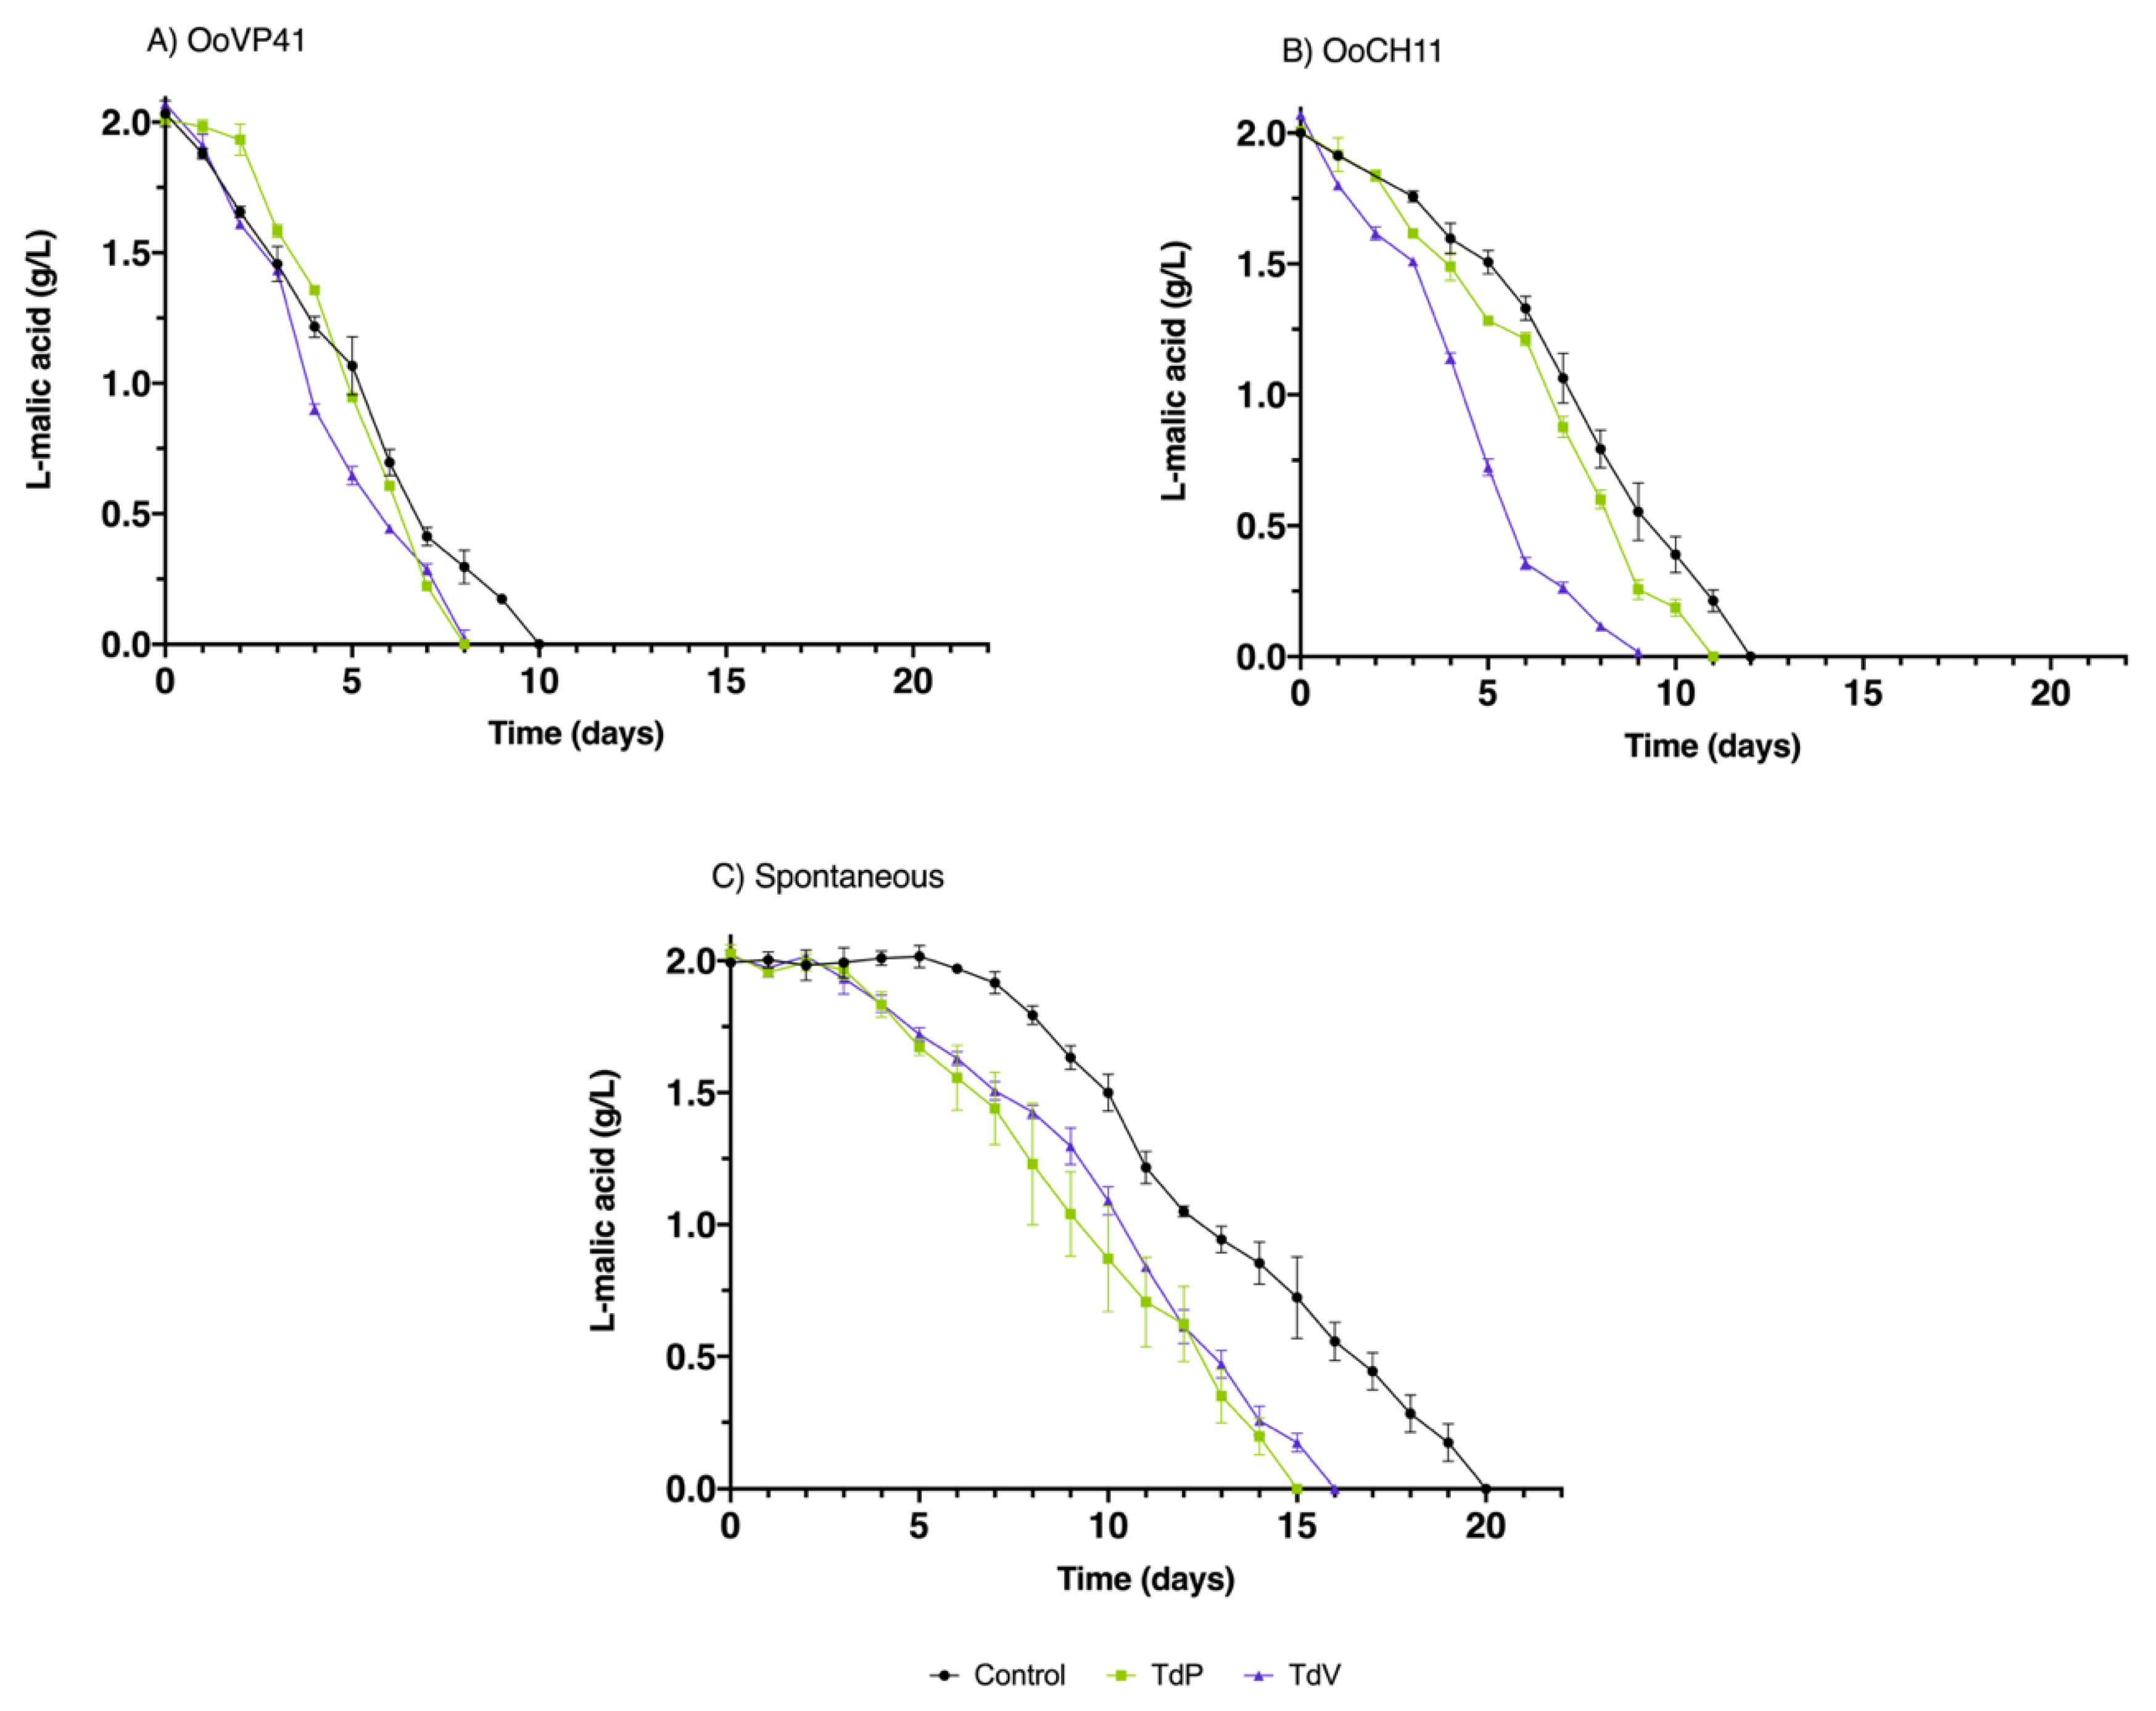
Figure 5.
(A) Principal component analysis biplots built from the following variables: Red fruit, grass, banana, acidity and global perception. (B) Spiderweb diagram for sensory analysis of CM wines after AF. Asterisks (*) indicate attributes that showed significant differences (p-value < 0.05). The samples correspond to wines after alcoholic fermentation. Control corresponds to control condition at the end of alcoholic fermentation; TdP and TdV correspond to conditions inoculated with T. delbrueckii Prelude or T. delbrueckii Viniferm, respectively.
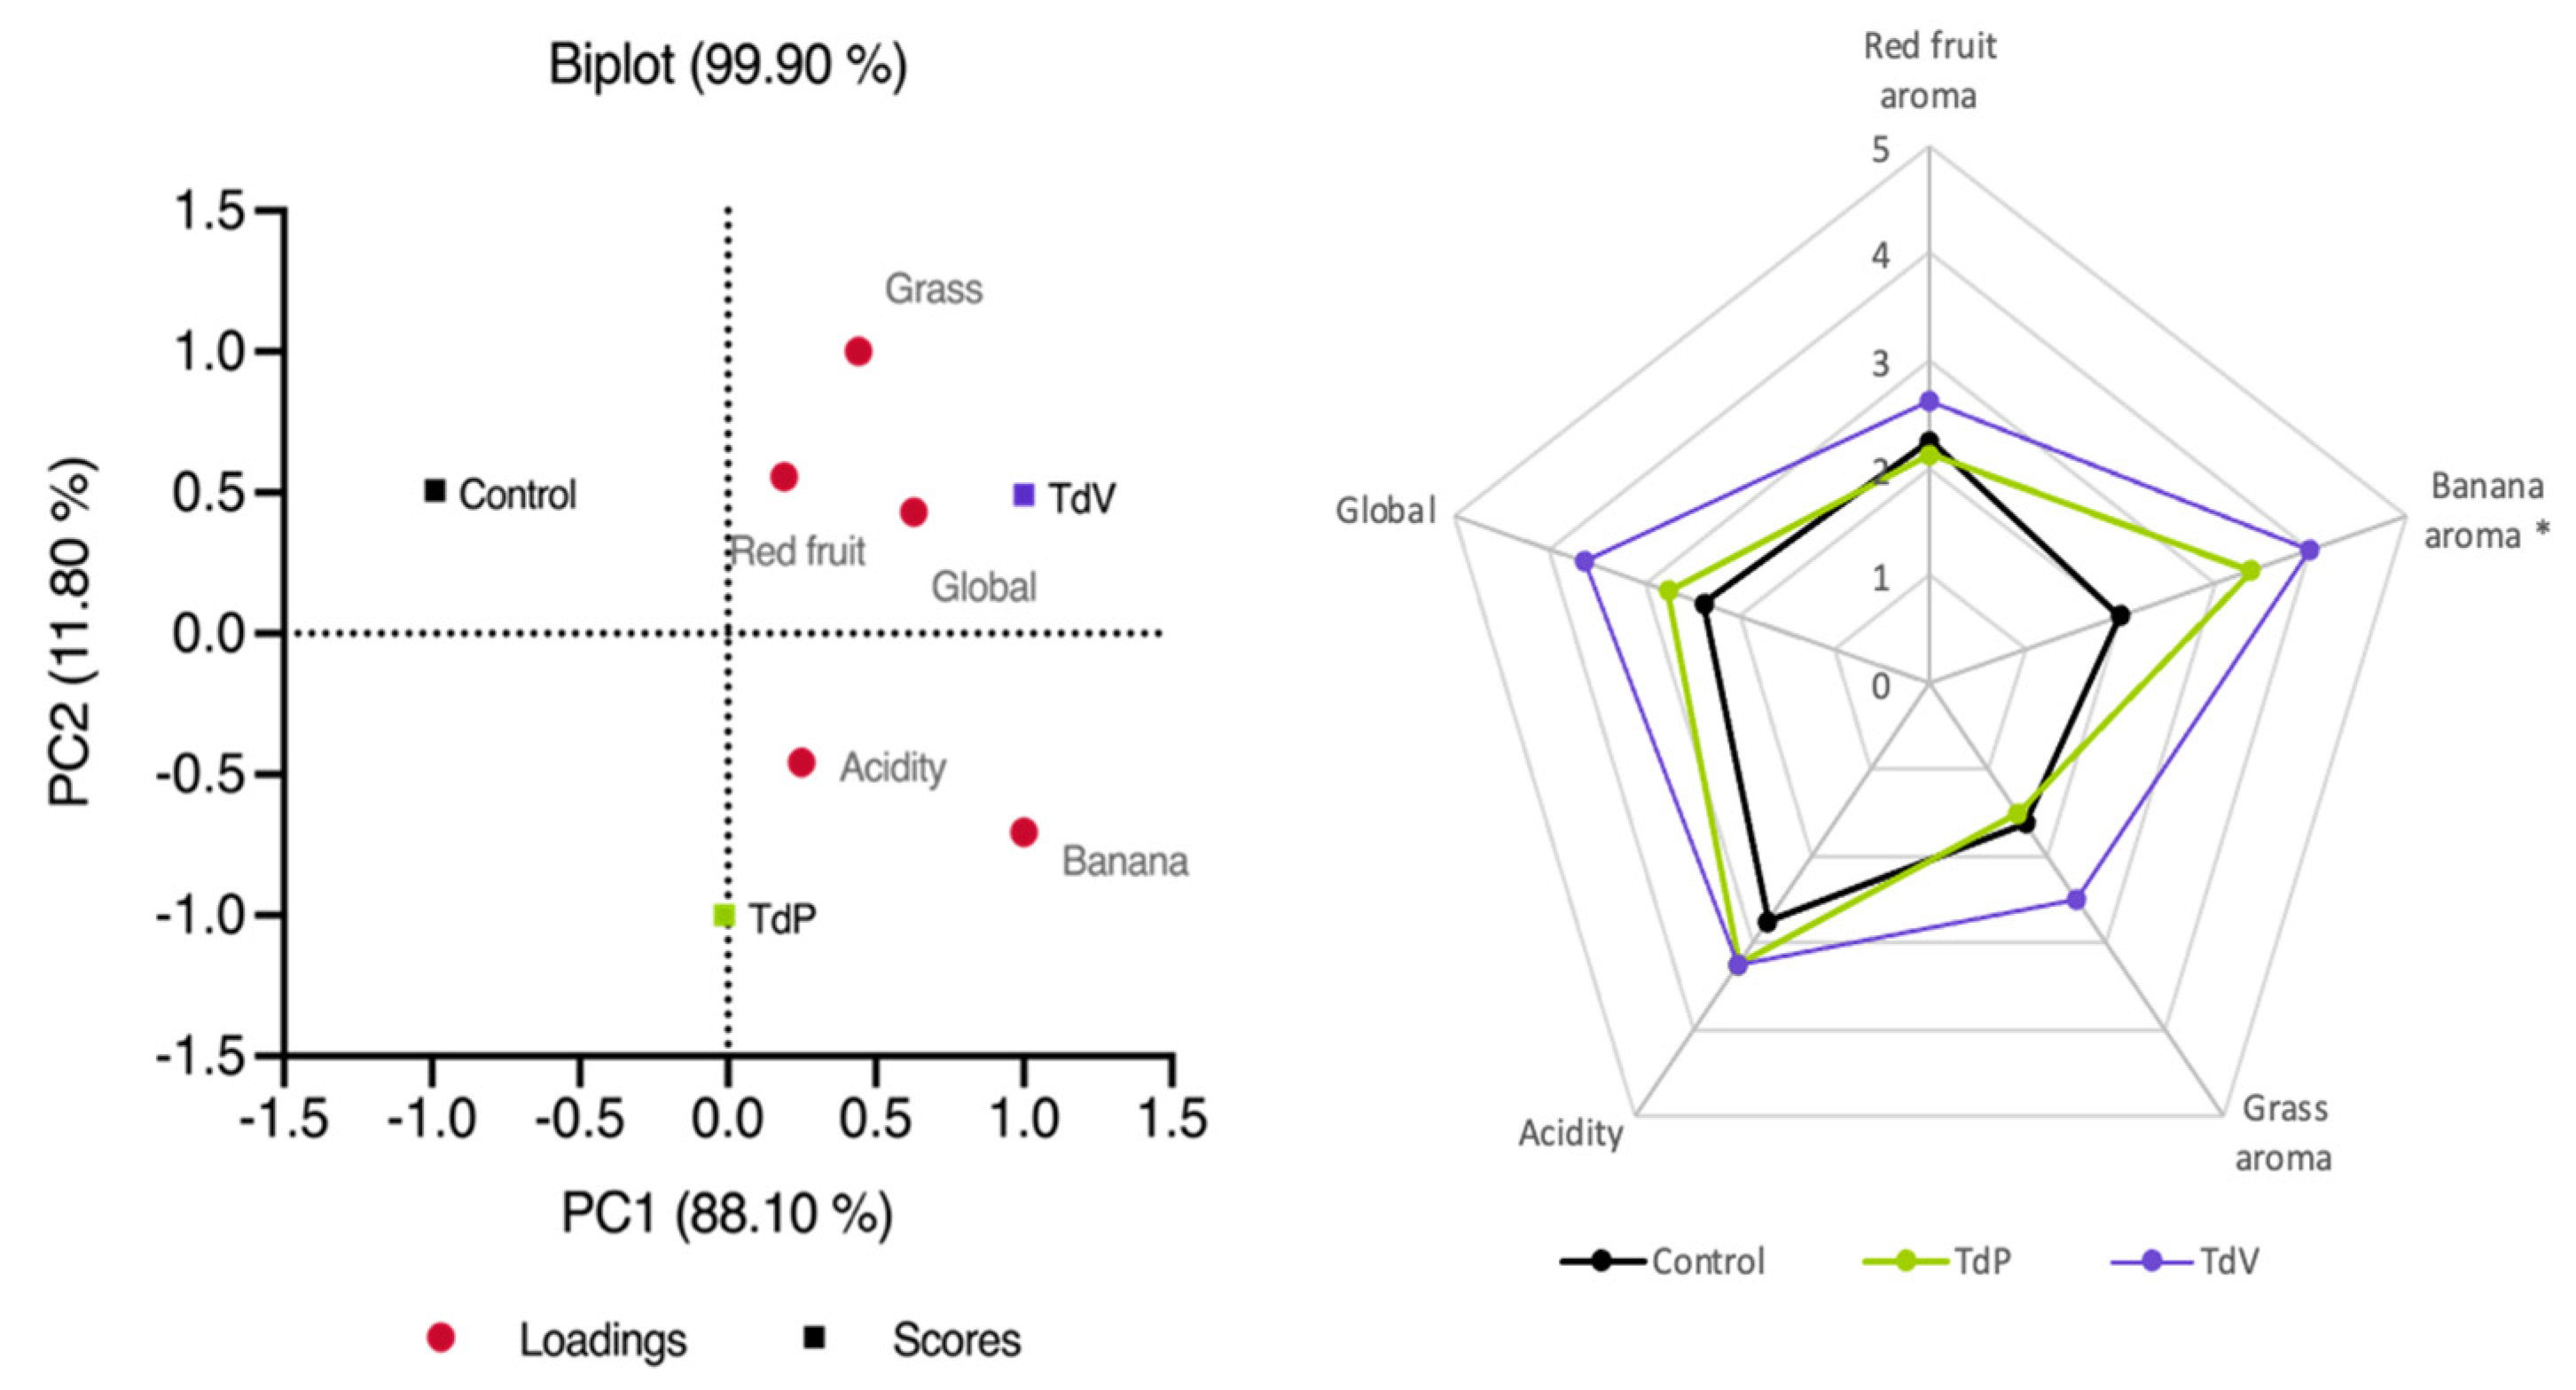

Table 1.
Oenological parameters analyzed. End of CM corresponds to the sampling after carbonic maceration, before to inoculate S. cerevisiae, and End of AF corresponds to the sampling after alcoholic fermentation. Control corresponds to the control fermentation; TdP and TdV corresponds to the fermentations with T. delbrueckii Prelude or T. delbrueckii Viniferm, respectively. AUC, Area Under the Curve.
| General oenological parameters | End of CM | End of AF | ||||
|---|---|---|---|---|---|---|
| CM Control | CM TdP | CM TdV | AF Control | AF TdP | AF TdV | |
| AUCs | 5416 ± 1 a | 5372 ± 7 b | 5381 ± 7 b | 11287 ± 49 B | 8119 ± 17 A | 9165 ± 28 A |
| Glycerol (g/L) | 2.04 ± 0.12 a | 3.43 ± 0.79 a | 3.38 ± 0.55 a | 7.51 ± 0.76 AB | 6.56 ± 0.59 A | 7.55 ± 0.09 B |
| Ethanol (% v/v) | 1.06 ± 0.04 a | 2.99 ± 0.28 b | 2.84 ± 0.16 b | 11.06 ± 0.21 A | 11.58 ± 0.16 A | 11.70 ± 0.09 A |
| Ammonia (mg/L) | 68 ± 9 b | 40 ± 11 a | 46 ± 6 a | n.d | 11 ± 4 B | 7 ± 5 AB |
| a-amino nitrogen (mg/L) | 109 ± 3 b | 60 ± 7 a | 97 ± 7 b | 19 ± 7 A | 27 ± 4 A | 22 ± 3 A |
| Succinic acid (g/L) | 0.42 ± 0.02 b | 0.27 ± 0.07 a | 0.31 ± 0.10 ab | 0.34 ± 0.04 A | 0.31 ± 0.05 A | 0.29 ± 0.03 A |
| Citric acid (g/L) | 0.26 ± 0.04 a | 0.34 ± 0.10 a | 0.28 ±0.04 a | 0.23 ±0.02 A | 0.25 ± 0.03 A | 0.25 ± 0.05 A |
| Acetic acid (g/L) | 0.34 ± 0.07 b | 0. ± 0.02 a | 0.61 ± 0.06 ab | 0.54 ± 0.10 A | 0.47 ± 0.05 A | 0.31 ± 0.06 A |
| L-malic acid (g/L) | n.a | n.a | n.a | 1.73 ± 0.04 A | 1.64 ± 0.04 B | 1.58 ± 0.04 C |
| pH | n.a | n.a | n.a | 3.21 ± 0.03 A | 3.25 ± 0.03 A | 3.27 ± 0.04 A |
| Eq. mannose (mg/L) | n.a | n.a | n.a | 114 ± 13 A | 301 ± 7 B | 311 ± 8 B |
Different lowercase letters indicate the existence of significant difference between samples at the end of CM (p-value < 0.05). Different uppercase letters indicate the existence of significant difference between samples at the end of AF (p-value < 0.05). All data is expressed as the arithmetic average of three biological replicates ± standard deviation (n = 3). n.a., not analyzed; n.d., not detected.
Table 2.
Phenolic compounds and color parameters analyzed. End of CM corresponds to the sampling after carbonic maceration, before to inoculate S. cerevisiae, and End of AF corresponds to the sampling after alcoholic fermentation. Control corresponds to the control fermentation; TdP and TdV corresponds to the fermentations with T. delbrueckii Prelude or T. delbrueckii Viniferm, respectively.
| Phenolic compounds and colour parameters |
End of CM | End of AF | ||||
|---|---|---|---|---|---|---|
| CM Control | CM TdP | CM TdV | AF Control | AF TdP | AF TdV | |
| Total anthocyanins (mg/L) quantified by spectrophotometry |
61 ± 2 a | 106 ± 4 b | 118 ± 3 b | 49 ± 3 a | 114 ± 17 b | 112 ± 7 b |
| Free anthocyanins (mg/L) Quantified by HPLC |
20 ± 7 a | 85 ± 13 bc | 97 ± 23 c | 24 ± 2 a | 69 ± 3 bc | 66 ± 7 c |
| Pyranoanthocyanins (mg/L) | n.d | 2.43 ± 0.10 d | 2.46 ± 0.12 d | 1.76 ± 0.01 b | 2.08 ± 0.06 c | 2.06 ± 0.03 c |
| L* | 53 ± 2 bc | 45 ± 1 a | 45 ± 3 a | 59 ± 1 c | 48 ± 2 ab | 48 ± 4 ab |
| C* | 48 ± 2 b | 51 ± 1 b | 53 ± 5.63 b | 33 ± 3 a | 53 ± 4 b | 52 ± 3 b |
| H* | 46.2 ± 4.8 c | 22.5 ± 6.4 b | 23.0 ± 1.9 b | 17.9 ± 0.4 ab | 12.6 ± 1.7 a | 11.1 ± 1.6 a |
| a* | 33 ± 3 a | 47 ± 3 b | 50 ± 4 b | 33 ± 2 a | 49 ± 7 b | 51 ± 3 b |
| b* | 34.6 ± 2.8 c | 19.3 ± 4.9 b | 21.2 ± 0.1 b | 10.6 ± 0.4 a | 10.8 ± 1.9 a | 9.9 ± 0.8 a |
| CI | 2.45 ± 0.18 b | 2.79 ± 0.09 b | 2.76 ± 0.13 b | 1.48 ± 0.34 a | 2.55 ± 0.26 b | 2.52 ± 0.23 b |
Different lowercase letters indicate the existence of significant difference between samples at the end of CM (p-value < 0.05). Different uppercase letters indicate the existence of significant difference between samples at the end of AF (p-value < 0.05). All data is expressed as the arithmetic average of three biological replicates. n.d., not detected.
Disclaimer/Publisher’s Note: The statements, opinions and data contained in all publications are solely those of the individual author(s) and contributor(s) and not of MDPI and/or the editor(s). MDPI and/or the editor(s) disclaim responsibility for any injury to people or property resulting from any ideas, methods, instructions or products referred to in the content. |
© 2023 by the authors. Licensee MDPI, Basel, Switzerland. This article is an open access article distributed under the terms and conditions of the Creative Commons Attribution (CC BY) license (http://creativecommons.org/licenses/by/4.0/).
Copyright: This open access article is published under a Creative Commons CC BY 4.0 license, which permit the free download, distribution, and reuse, provided that the author and preprint are cited in any reuse.


