1. Introduction
The increase in corn yield is related to fertilization management [
1], with emphasis on nitrogen as it is more demanding, as it participates in biochemical processes (constituent of enzymes, coenzymes and chlorophyll), composition of chlorophyll molecule and the enzymes nitrate reductase, nitrite reductase and glutamine synthetase [
2,
3], directly affecting vegetative development and corn yield [
4].
The amount of N available to plant is directly related to vegetative development and yield [
5]. However, nitrogen fertilization is influenced by factors such as management, rates, sources, time of application, edaphoclimatic conditions and soil microbiota [
6].
Despite the benefits of applying N to corn, it is not possible to define a universal rate, as each location requires a different rate influenced by soil and climate conditions [
7]. To define the N rate to be applied, all conditions must be considered, as if the rate is underestimated, losses in grain production will occur and if it is overestimated, the excess or what is not absorbed by root system may contaminate groundwater (leached nitrate) and atmosphere (volatilized ammonia), unnecessary expenses and reduced profit [
8].
The management of nitrogen fertilizers is one of most complex, resulting from problems in efficiency of N use, in which the nitrogen sources available in Brazil, urea and ammonium sulfate, are the most used in corn cultivation [
9]. Urea [CO(NH
2)
2] has been the source of N most used by corn producers in Brazil, corresponding to 60% of nitrogen fertilizers [
10], mainly due to lower cost of fertilizer and higher percentage of N (± 45%), however, more subject to losses due to ammonia volatilization [
11], since with the hydrolysis of urea through the urease enzyme found in soil, the NH
2 radical absorbs electrons from H+ from the medium converting into ammonium (NH
4+), with a reduction in pH around the urea granule, favoring the oxidation of NH
4+ into ammonia (NH
3), which is likely to volatize [
12].
While, ammonium sulfate [(NH
4)2SO
4] has the composition of N (± 21%) and S (± 24%) [
13], being affected by nitrate leaching [
14], through dissolution it generates ammonium ions, which can be oxidized to nitrate through nitrification [
15].
The time of application is an important factor for greater fertilization efficiency, through the phenological stages of plants it has been possible to identify the periods of greatest plant deficiency, allowing the availability of nutrient in period of greatest demand for the crop [
16]. According to Gott et al. [
17] the choice of N application time is an important strategy to reduce nitrogen losses, which is intrinsically related to N use efficiency [
5], since application time it can influence use of N by crop, due to low absorption in first 30
th days, but from the V
4 stage onwards the plant shows considerable absorbent hairs and branches and a greater demand for N [
18].
Thus, research into edaphoclimatic conditions in corn grain producing region is of great importance, as it favors the use of N rates with better efficiency and guarantees the rationalization of costs and an increase in yield [
19]. The aims of study was to evaluate the effects of rates, sources and timing of nitrogen application under cover of transgenic corn yield cultivated in Amazon Biome.
2. Material and Methods
2.1. Experimental Site
The experiment was conducted under field conditions at Centro Tecnológico de Apoio à Agricultura Familiar – CETAF, in Parauapebas city, State of Pará, Brazil (06º 03' 30” S and 49º 55' 15” W), 184 m from altitude. The installation and conduct of experiment occurred during the 2016/2017 and 2017/2018 years.
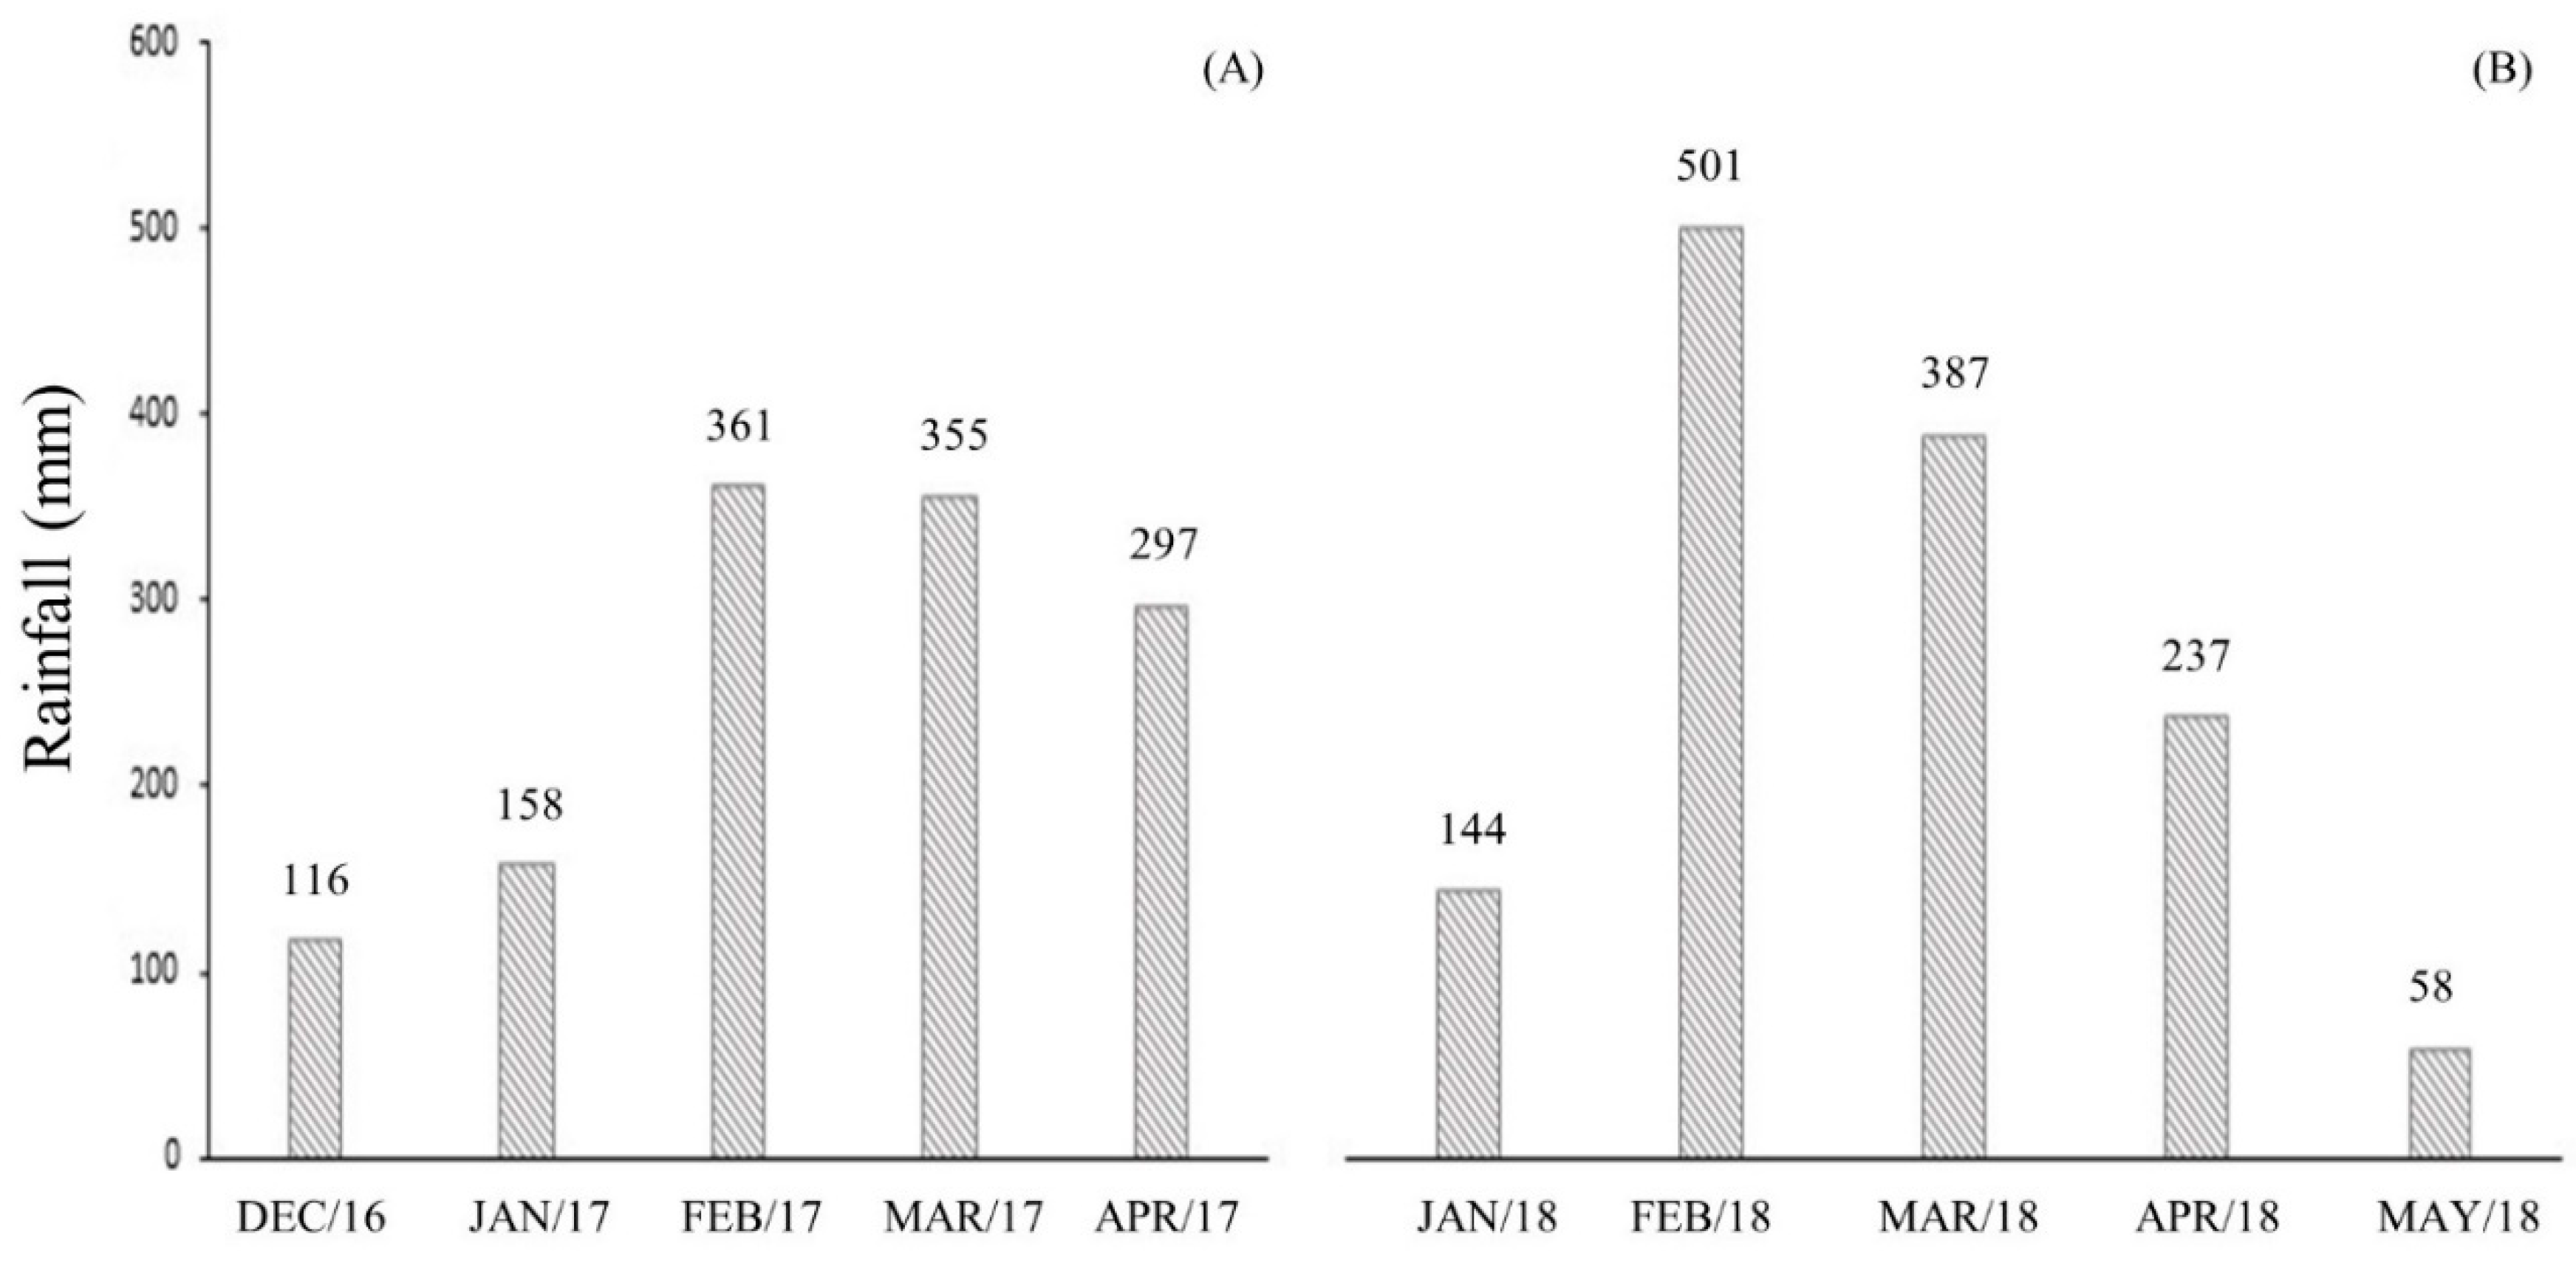
The values of precipitation and average temperature observed during the period during which the experiment was conducted in 2016/2017 and 2017/2018 years are showed in
Figure 1, collected at the meteorological station of the Universidade Federal Rural da Amazônia.
The precipitation and average temperature values observed during experimental period in 2016/2017 and 2017/2018 years are showed in
Figure 1, collected at meteorological station of Universidade Federal Rural da Amazônia.
The soil was classified as Red-Yellow Argisol [
20], with a clayey texture (sand: 200 g kg
-1; silt: 294 g kg
-1; clay: 506 g kg
-1). Before installing the experiments, soil samples were collected in 0.00 to 0.20 m layer, the results of the chemical analyzes are showed in (
Table 1).
2.2. Experimental Design
The experimental design used was in randomized blocks, in a 5x2x2 factorial scheme, consisting of five nitrogen rates (0; 45; 90; 135; and 180 kg ha-1), two nitrogen sources (urea and ammonium sulfate) and two application times (phenological stage V4 and V8), in two years (2016/2017 and 2018), with four replications.
Soil preparation was carried out conventionally through two plowings and one harrowing. Sowing was carried out on December 23
th, 2016 (1st year) and on January 30
th, 2018 (2nd year), using a fertilizer seeder with four individual lines, with transgenic hybrid Bt and RR being sown, normal cycle and use for silage and grains. For furrow fertilization, 240 kg ha
-1 of NPK (09-25-15) were applied, as recommended by Brasil et al. [
21]. The application of N in coverage occurred in two periods, at 20
th days after sowing (DAS) in V
4 phenological stage of corn, and at 36
th DAS in V
8 phenological stage [
22].
2.3. Data Collection
The vegetative components were collected at 64
th DAS, during the period of full flowering, evaluating plant height (PH), ear height (EH), stem diameter (ST), leaf area index (LAI), index leaf dry mass (ILDM), and total dry mass (DM) [
4,
23,
24]. The productivity components were obtained during the harvest period, carried out at 102
th DAS, manually, through the evaluation of mass of thousand grains (MTG) and yield (YIELD) [
4,
23].
2.4. Statistical Analysis
Initially, experimental data from each year were subjected to Shapiro-Wilks (p>0.01) and Levene (p>0.01) tests to verify residual normality and homoscedasticity, respectively. Subsequently, having met the assumptions, individually in each year, analysis of variance was carried out for the treatment means (p<0.05), using the software SISVAR [
25]. The effects of N rates applied in coverage were studied using polynomial regression analysis, observing the results of F test (p<0.05) of analysis of variance and Student's t test (p<0.05), for the coefficients of determination. The effects of N sources and application times were studied using F test, at 5% probability, which for two factor levels is conclusive.
3. Results
3.1. Growth and Plant Development Characteristics
The applied N sources, urea and ammonium sulfate, showed a statistical difference for total dry mass, and N rates factor was significant for plant height, while for variables ear height, stem diameter, leaf area index, and index leaf dry mass, no statistical differences were observed, regardless of source or N rates factor (Table 2).
In 2017/2018 year, N sources did not influence the vegetative growth of corn grown in Amazon Biome (
Table 2). Meanwhile, the application time factor showed better results with application of N at V4 phenological stage, providing values of 217.52 cm (plant height), 116.53 cm (ear height), 18.87 mm (stem diameter), 5.40 (leaf area index), 300.33 g (total dry mass) and 8.58 g (index leaf dry mass).
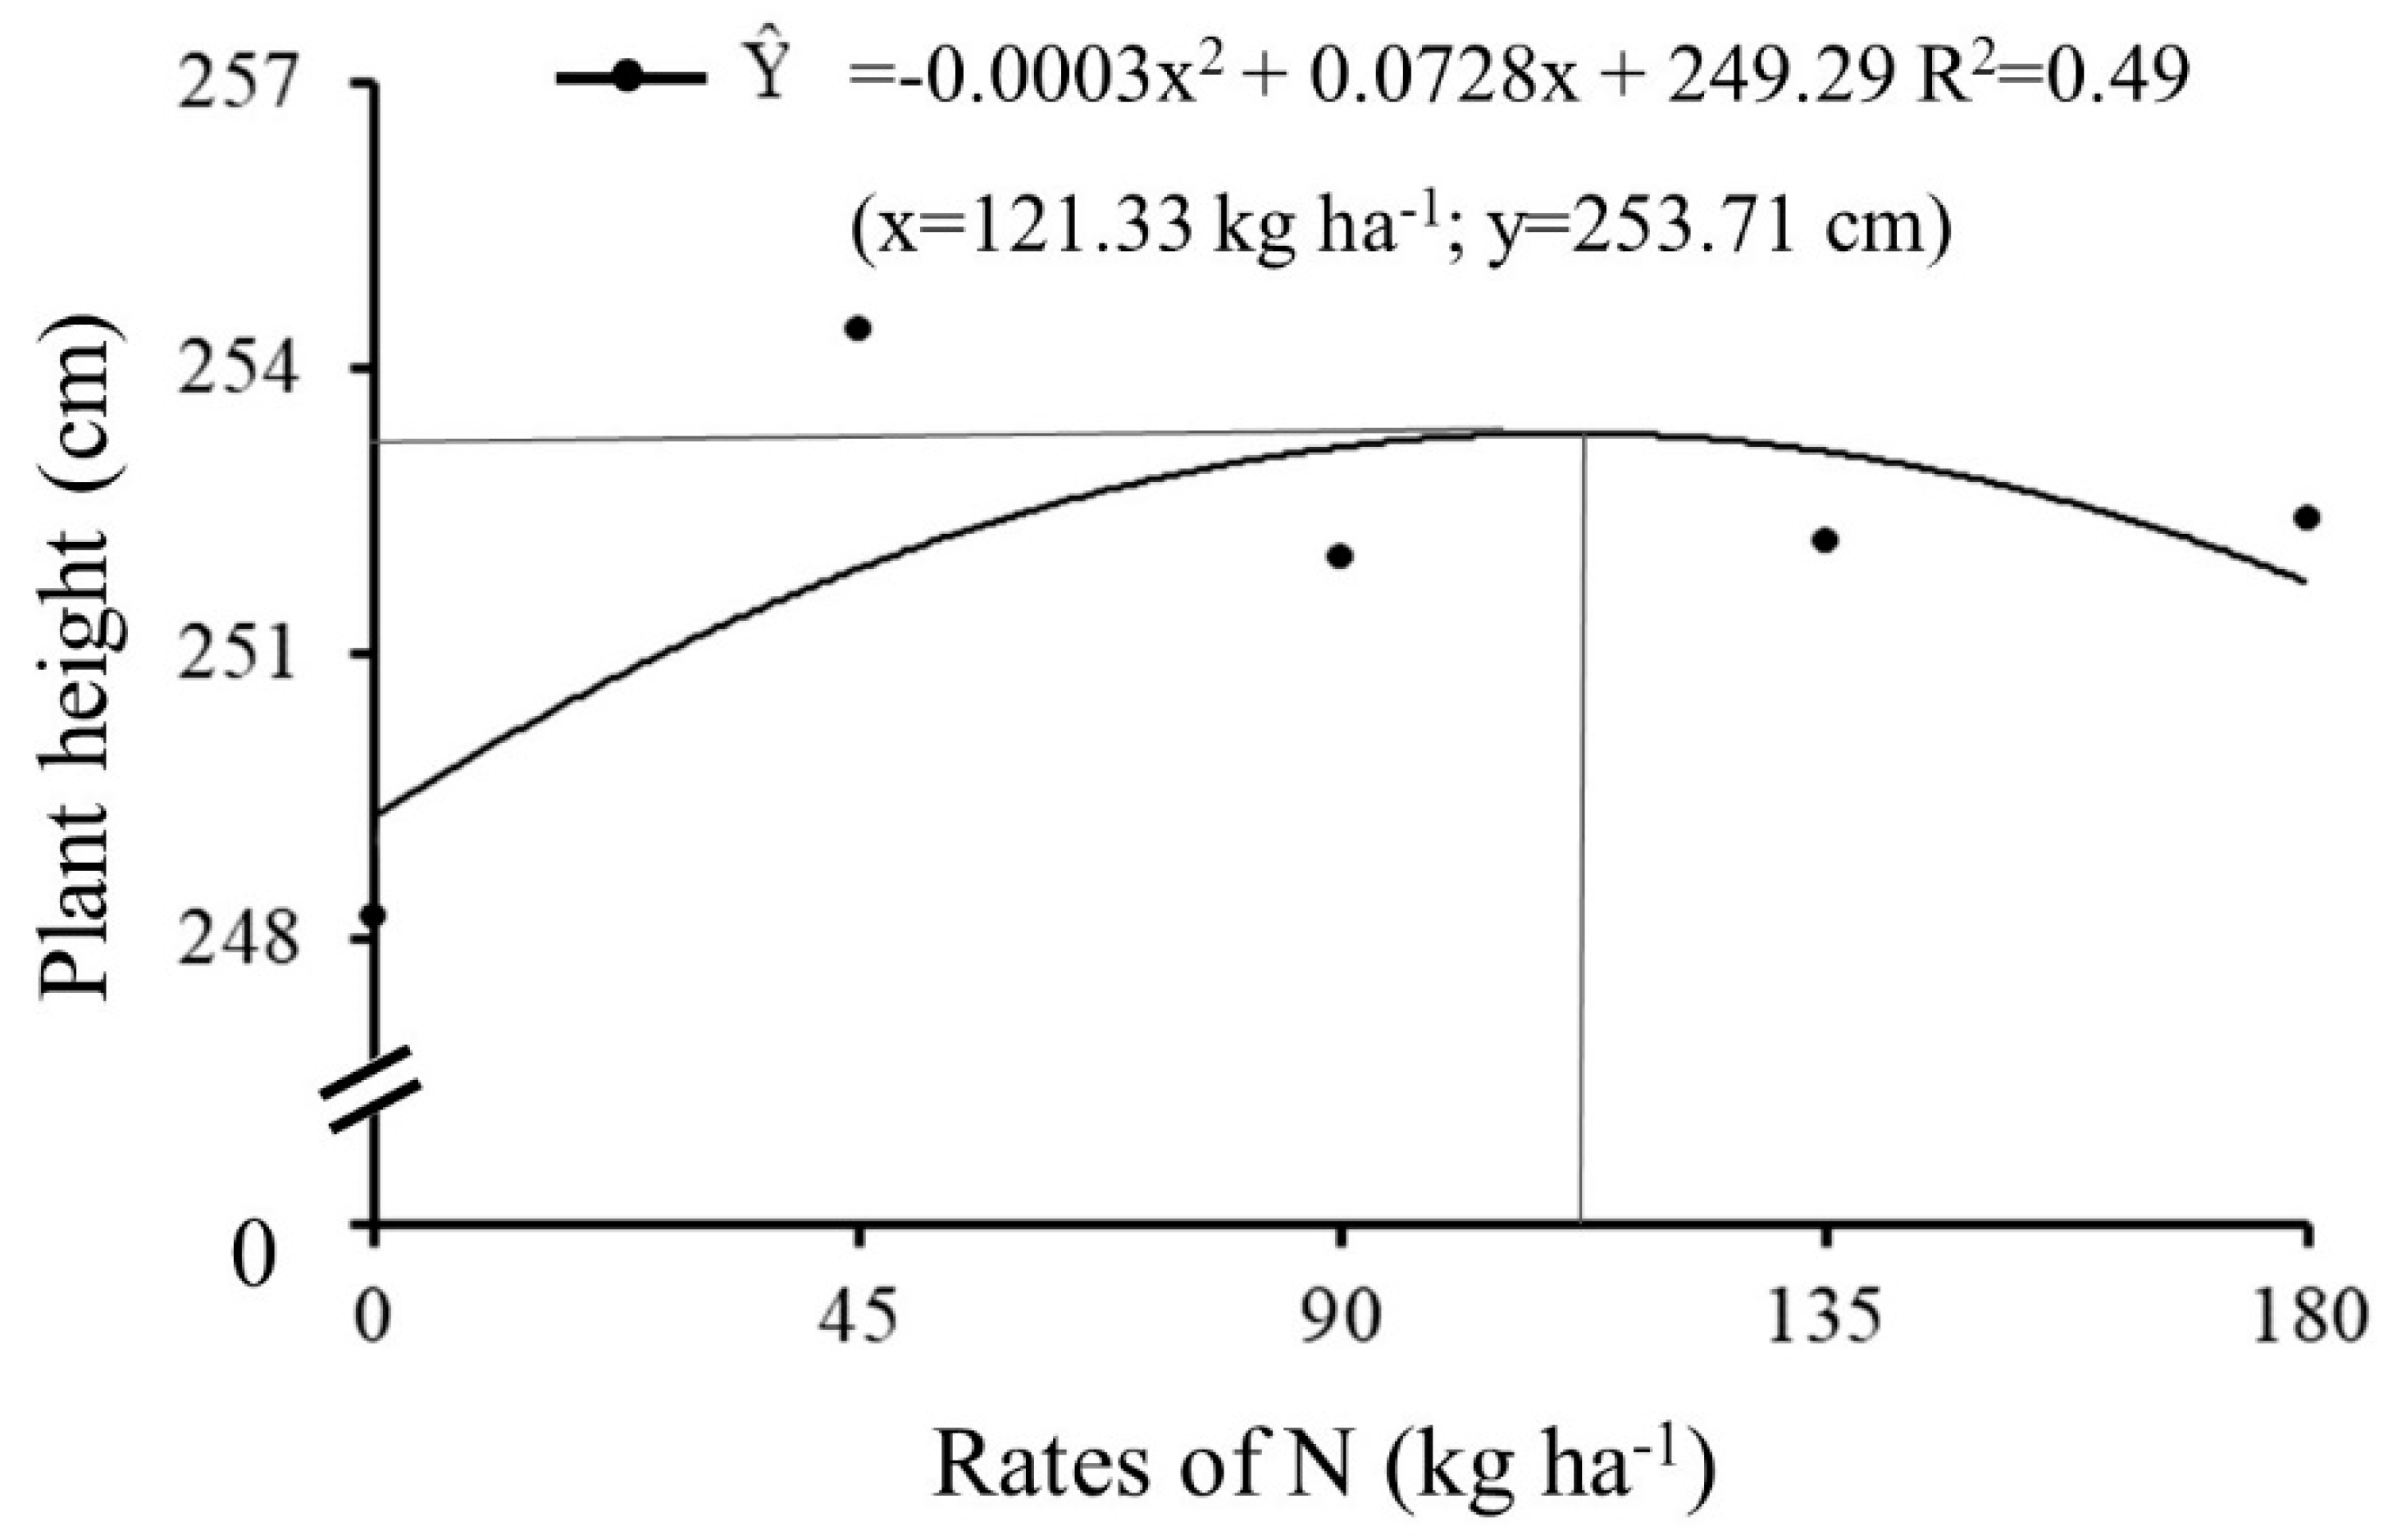
For plant height, a significant result was observed with application of N rates in 2016/2017 year, regardless of source and time of application, showing a better fit for quadratic equation (ŷ = -0.0003x
2 + 0.0728x + 249.29), reaching 253.71 cm in plant height with rate of maximum technical efficiency corresponding to application of 121.33 kg ha
-1 of N (
Figure 2).
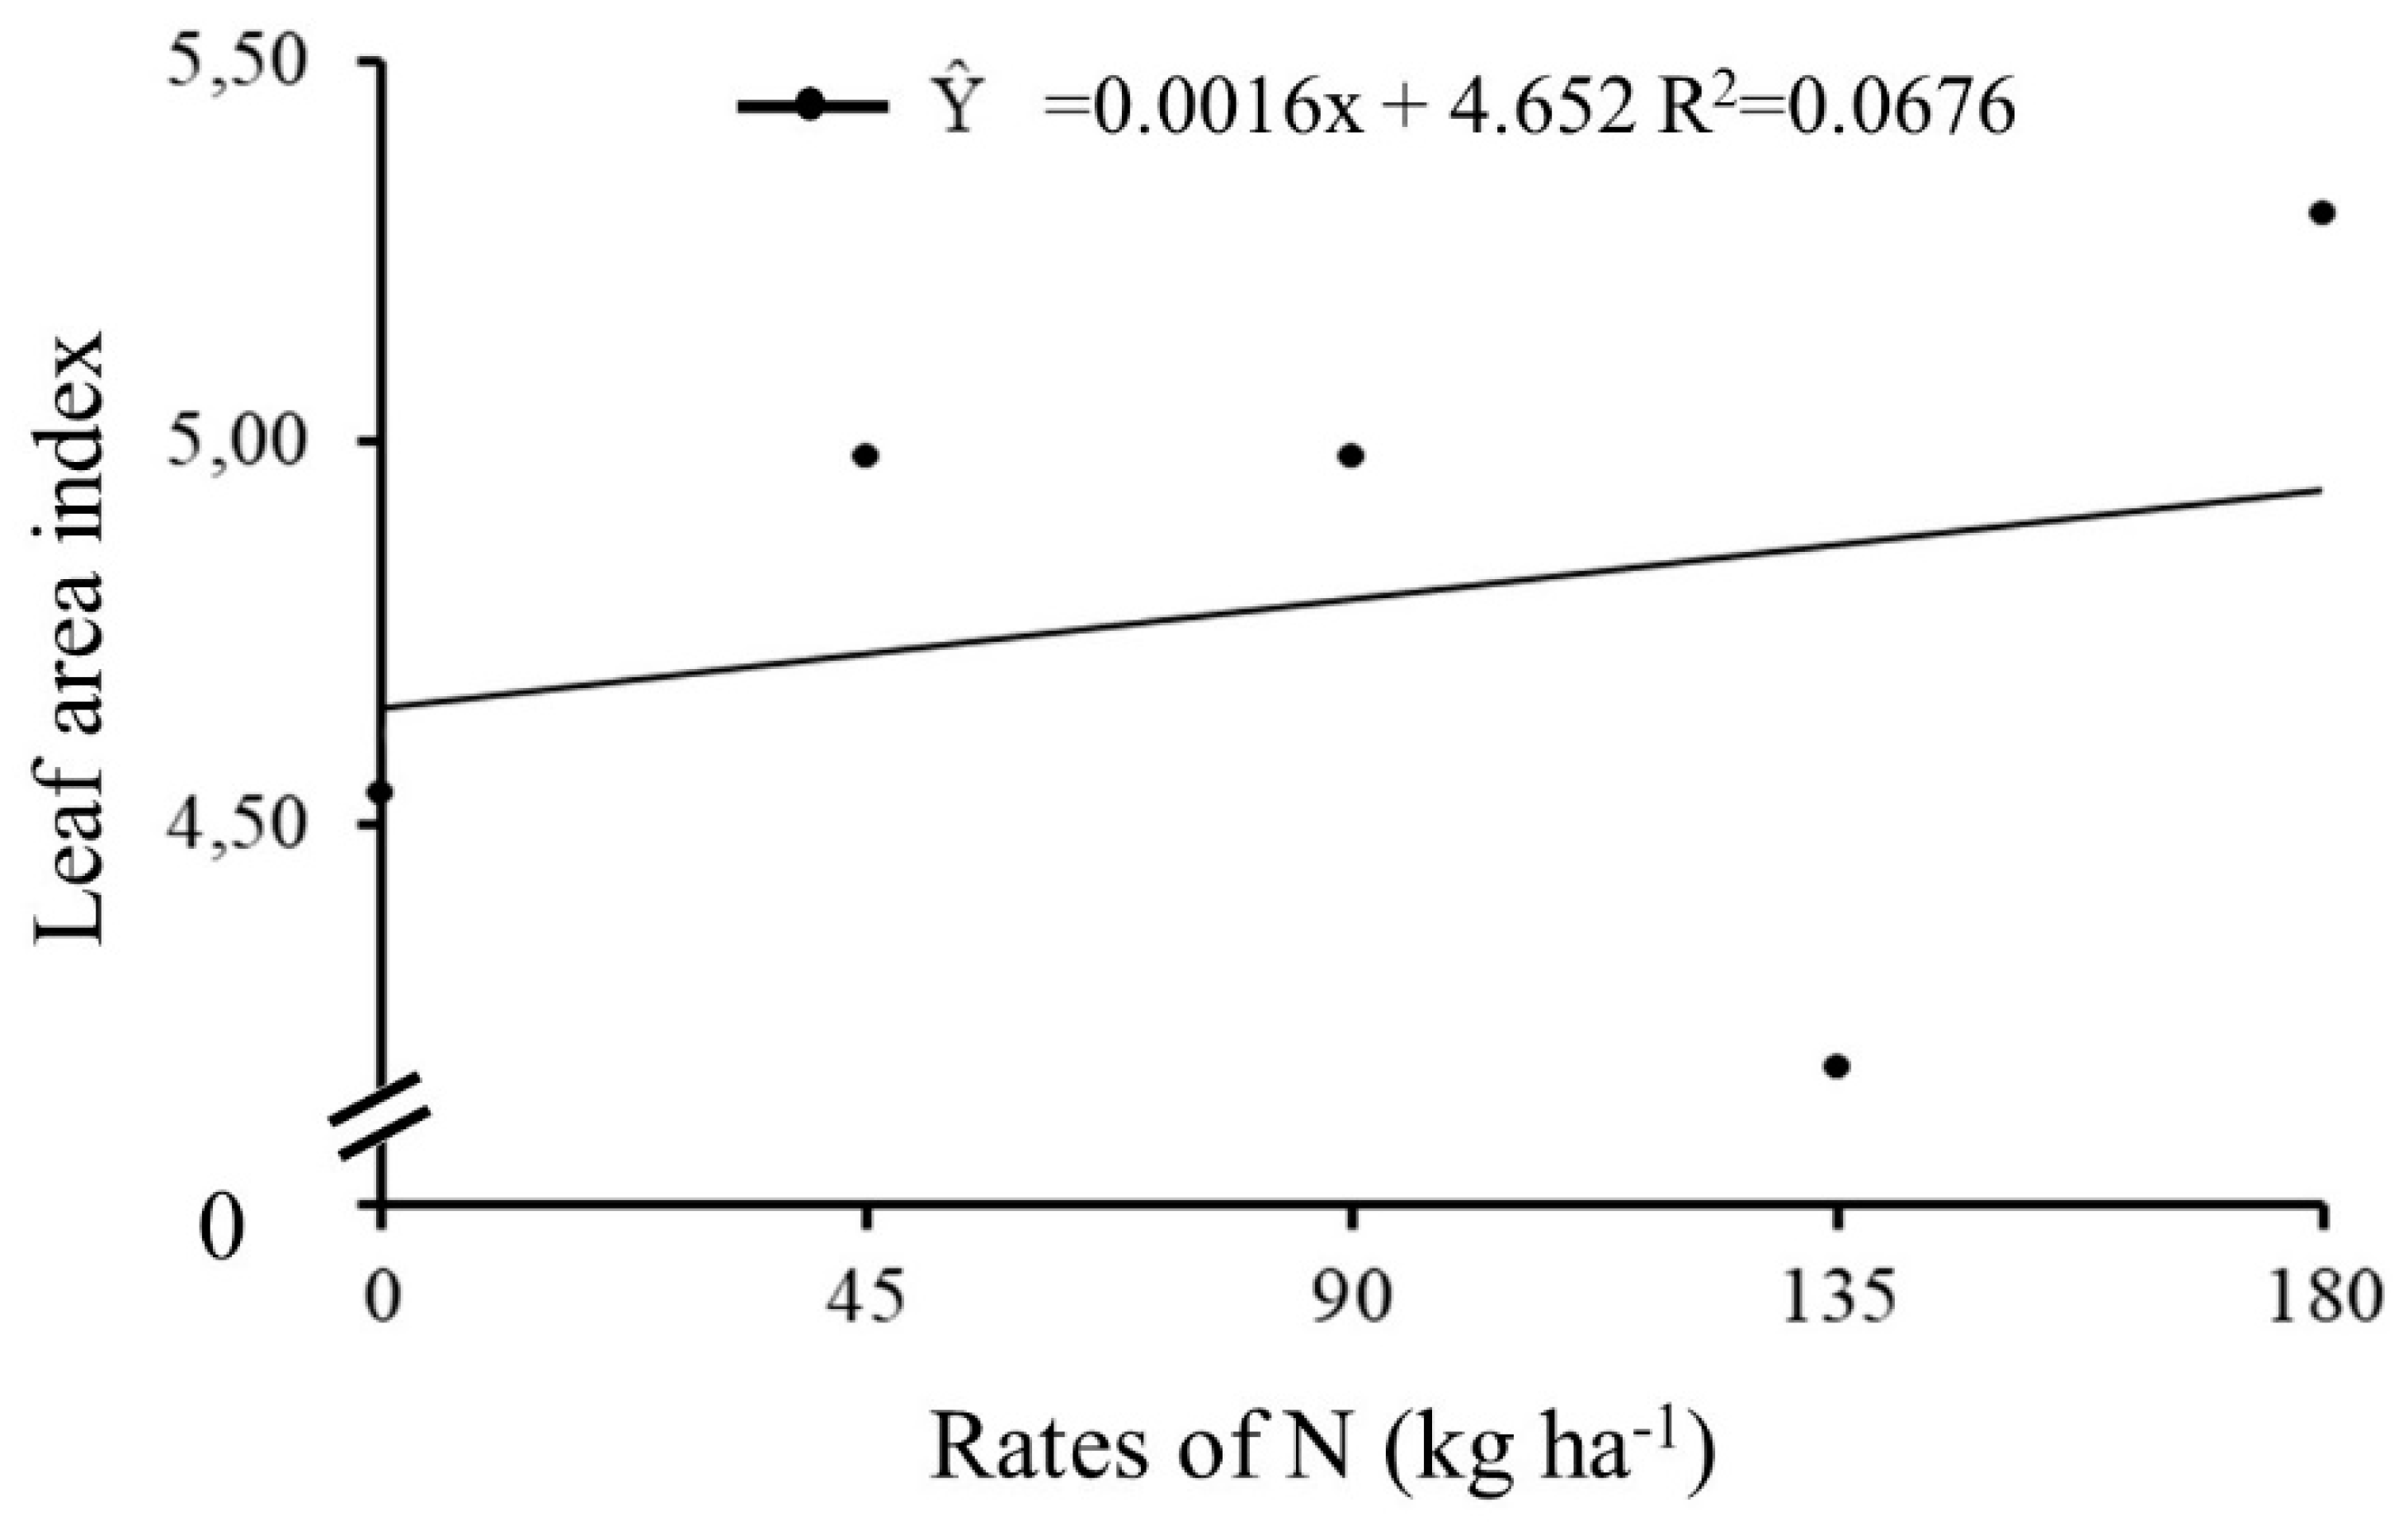
The increase in N rates in 2017/2018 year provided an increase in plant leaf growth, with an adjustment for positive linear equation (
Figure 3).
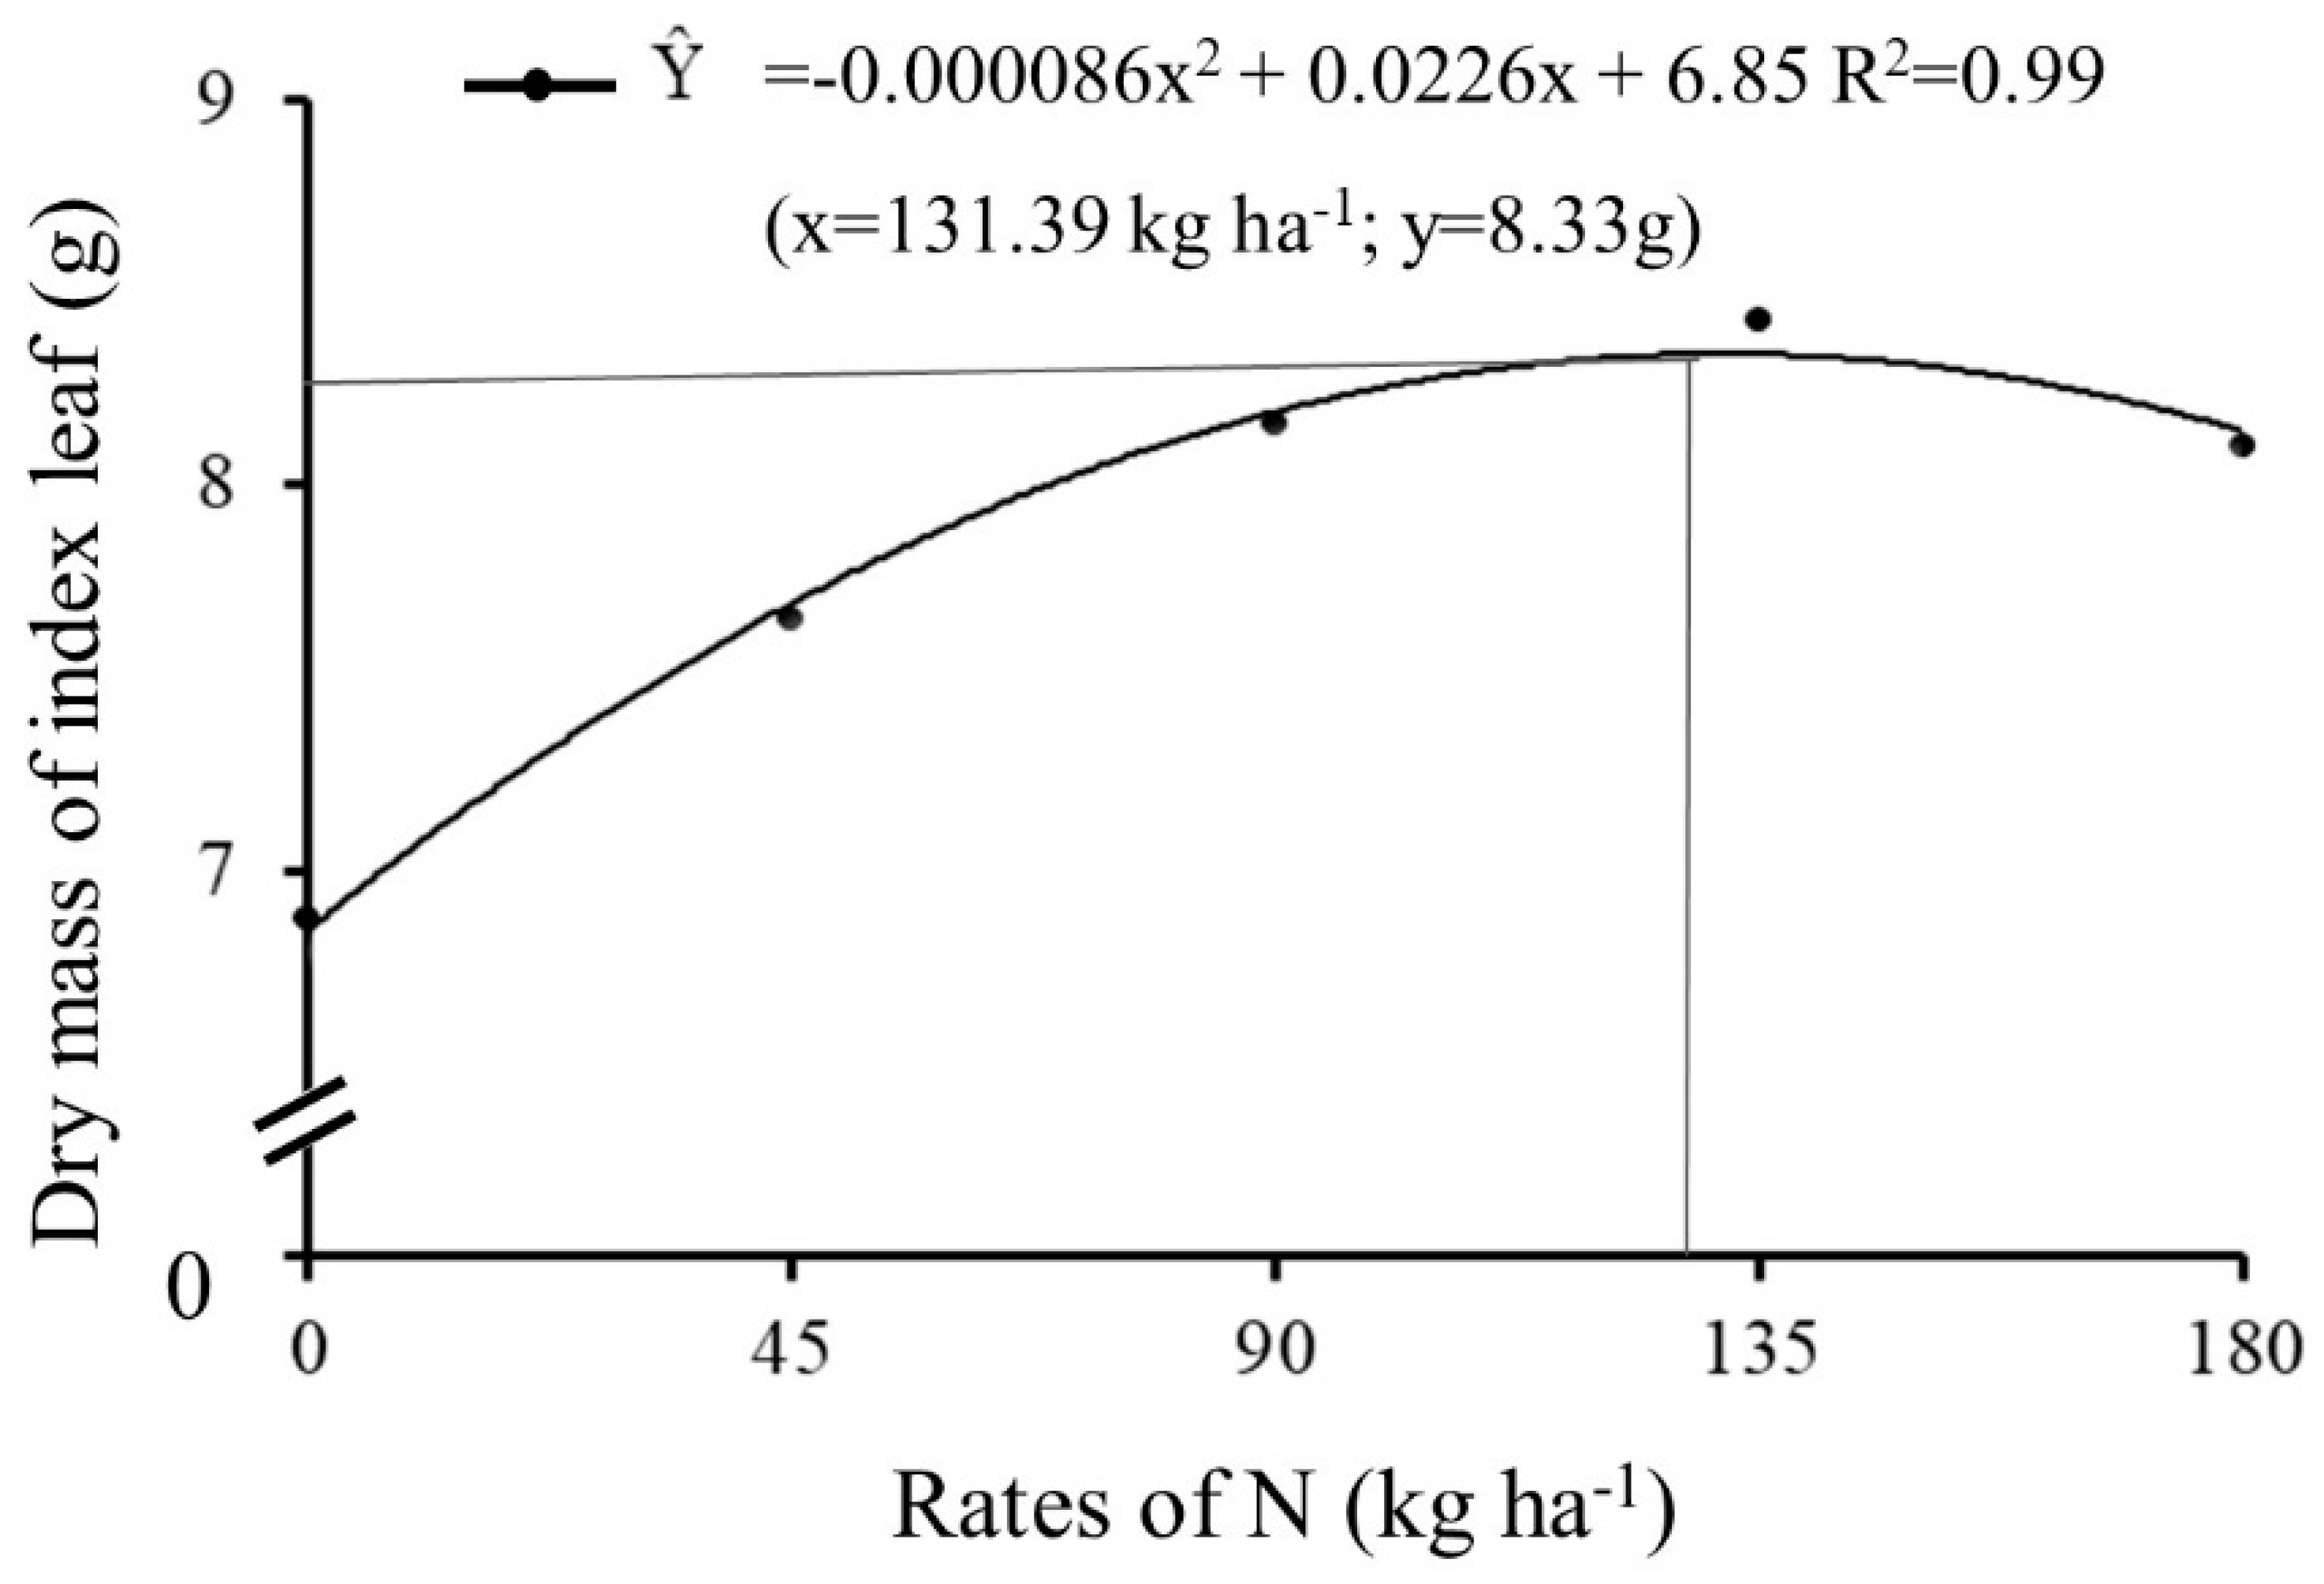
The index leaf dry mass, in 2017/2018 year, showed a quadratic adjustment (ŷ = -0.000086x
2 + 0.0226x + 6.85) with maximum technical efficiency at 131.39 kg ha
-1 of N (
Figure 4), relating to increase observed for LAI.
3.2. Production Componentes and Corn Yield
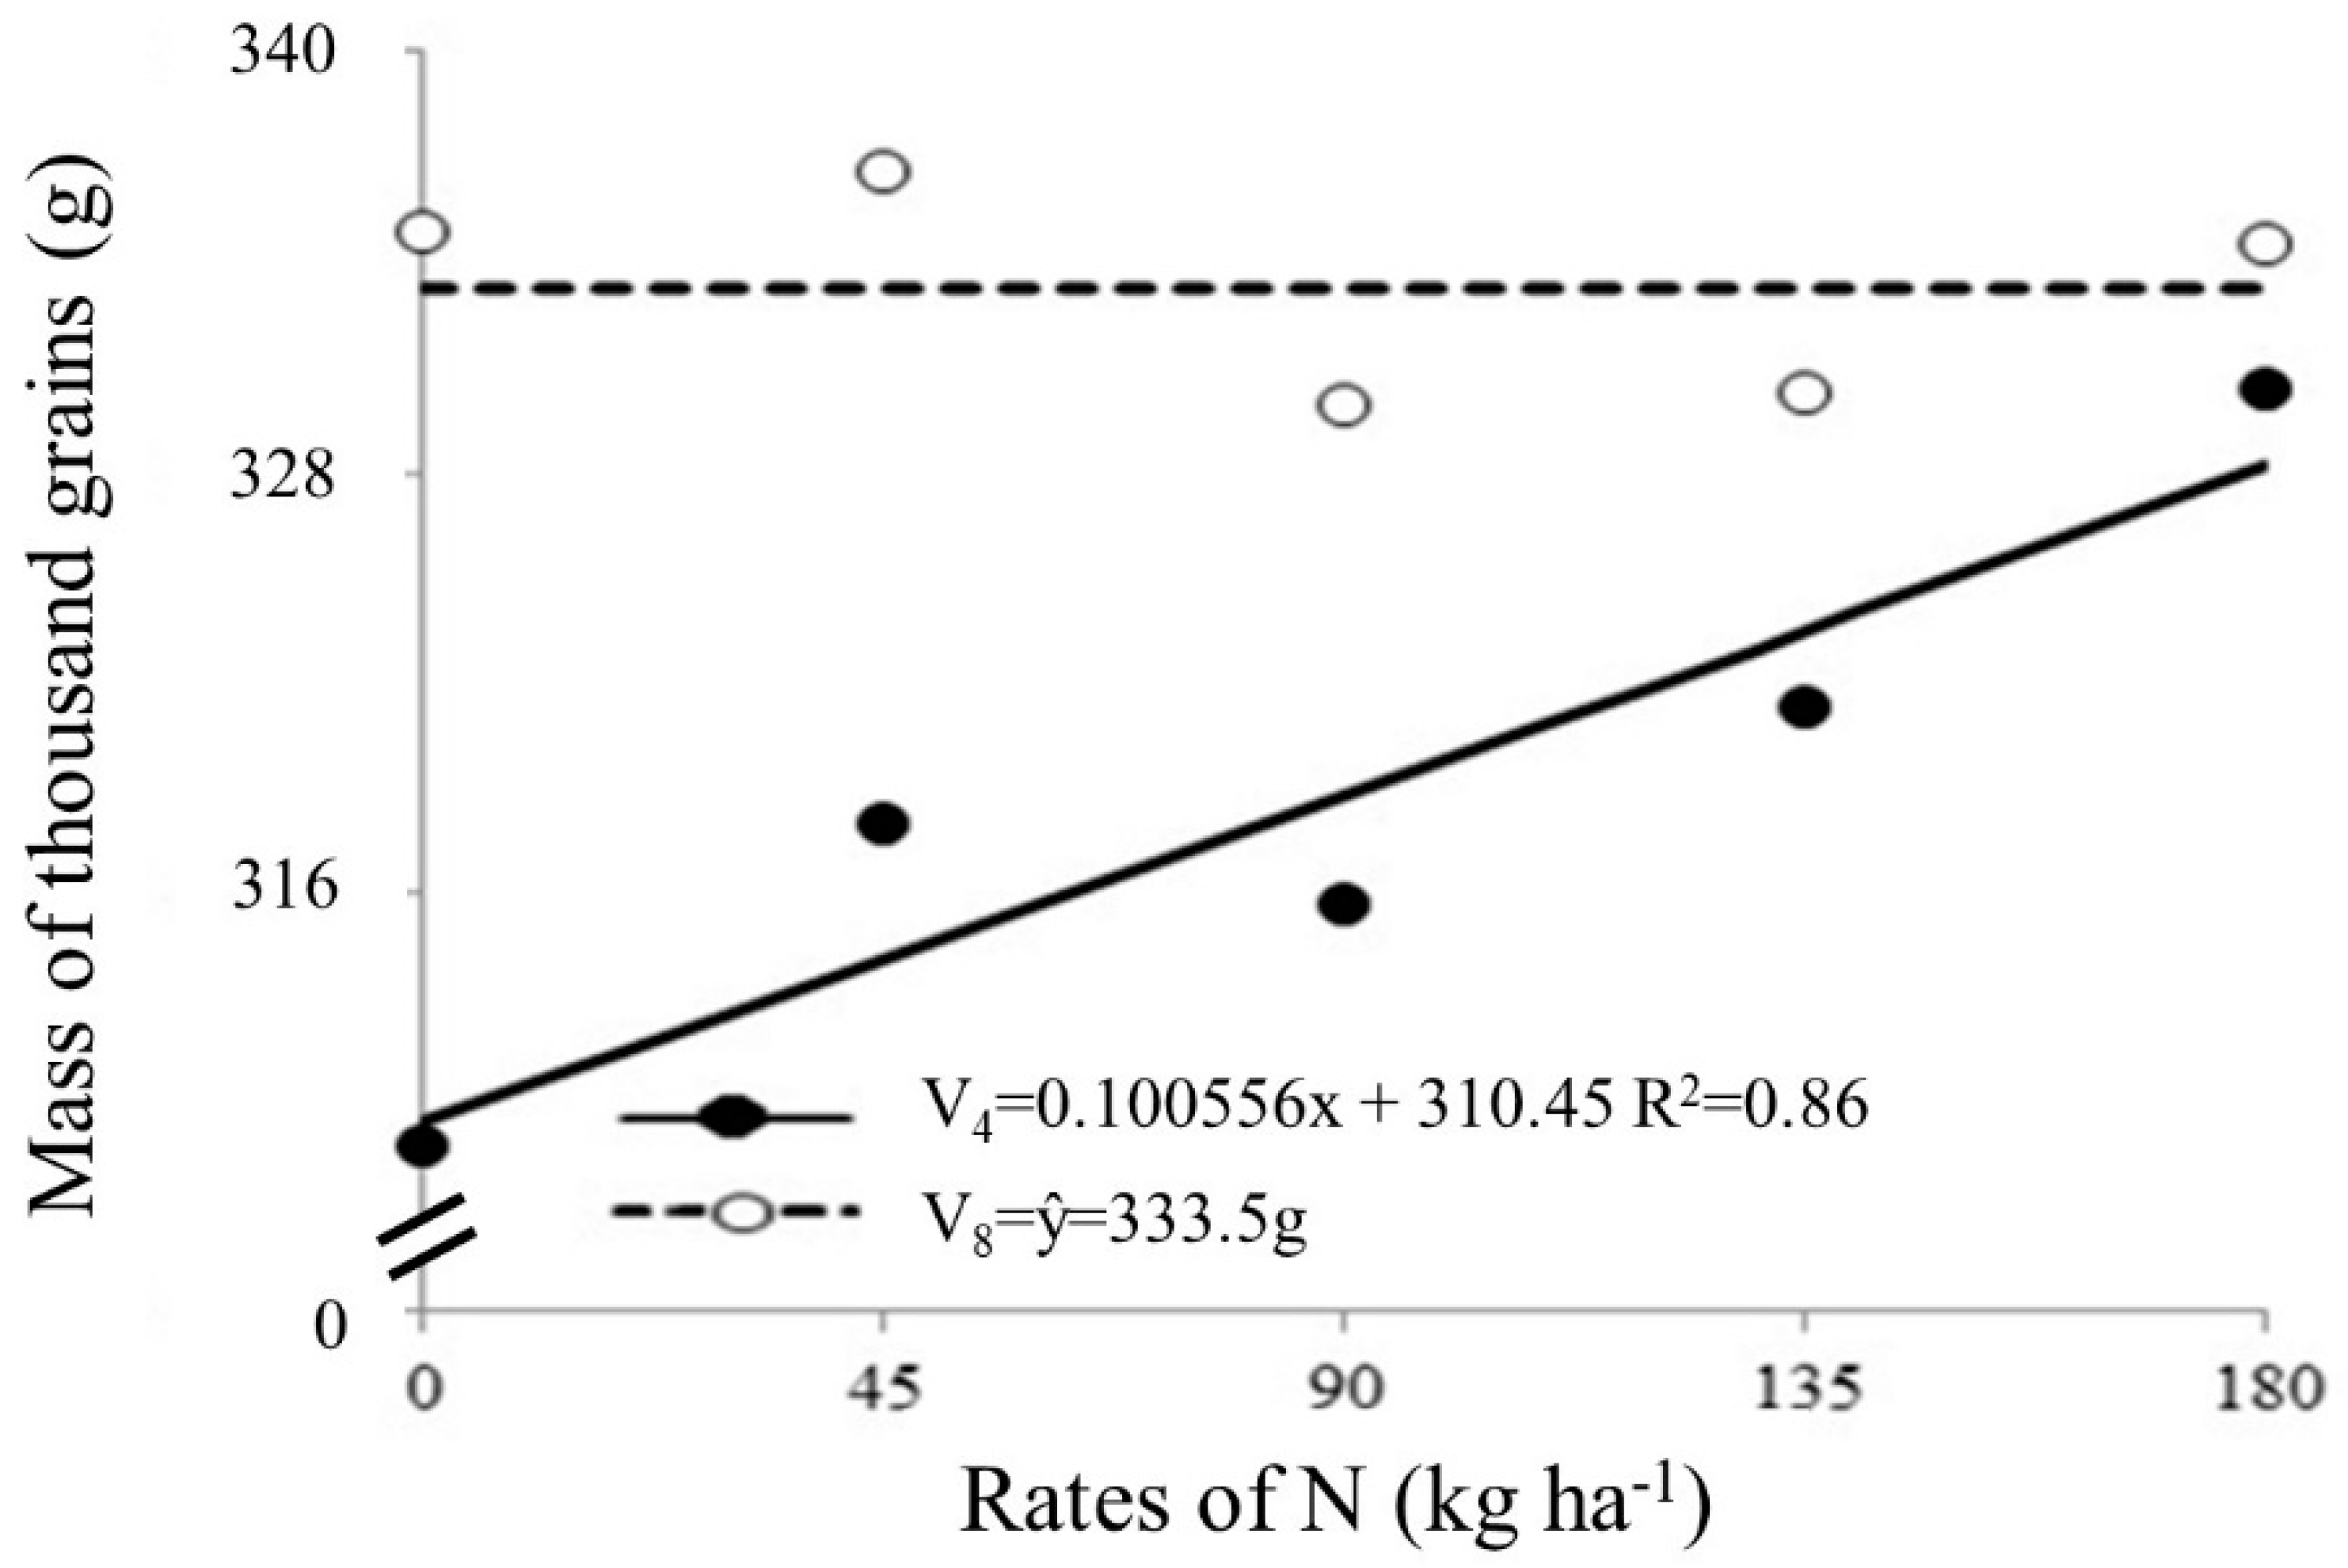
The mass of thousand grains and yield were significant, regardless of whether the source used was urea or ammonium sulfate. With regard to thousand grain mass, the effect of interactions between N rates and application times and N rates and years of cultivation was observed. For the interaction between rates and time of N application, there was a linear adjustment for V
4 stage. Thus, the application of maximum rate (180 kg ha
-1 of N) was not sufficient to reach the maximum mass of thousand grains with N application at V
4 phenological stage (
Figure 5). In V
8 phenological stage, no significant effect was observed, with an average of 333.65 g.
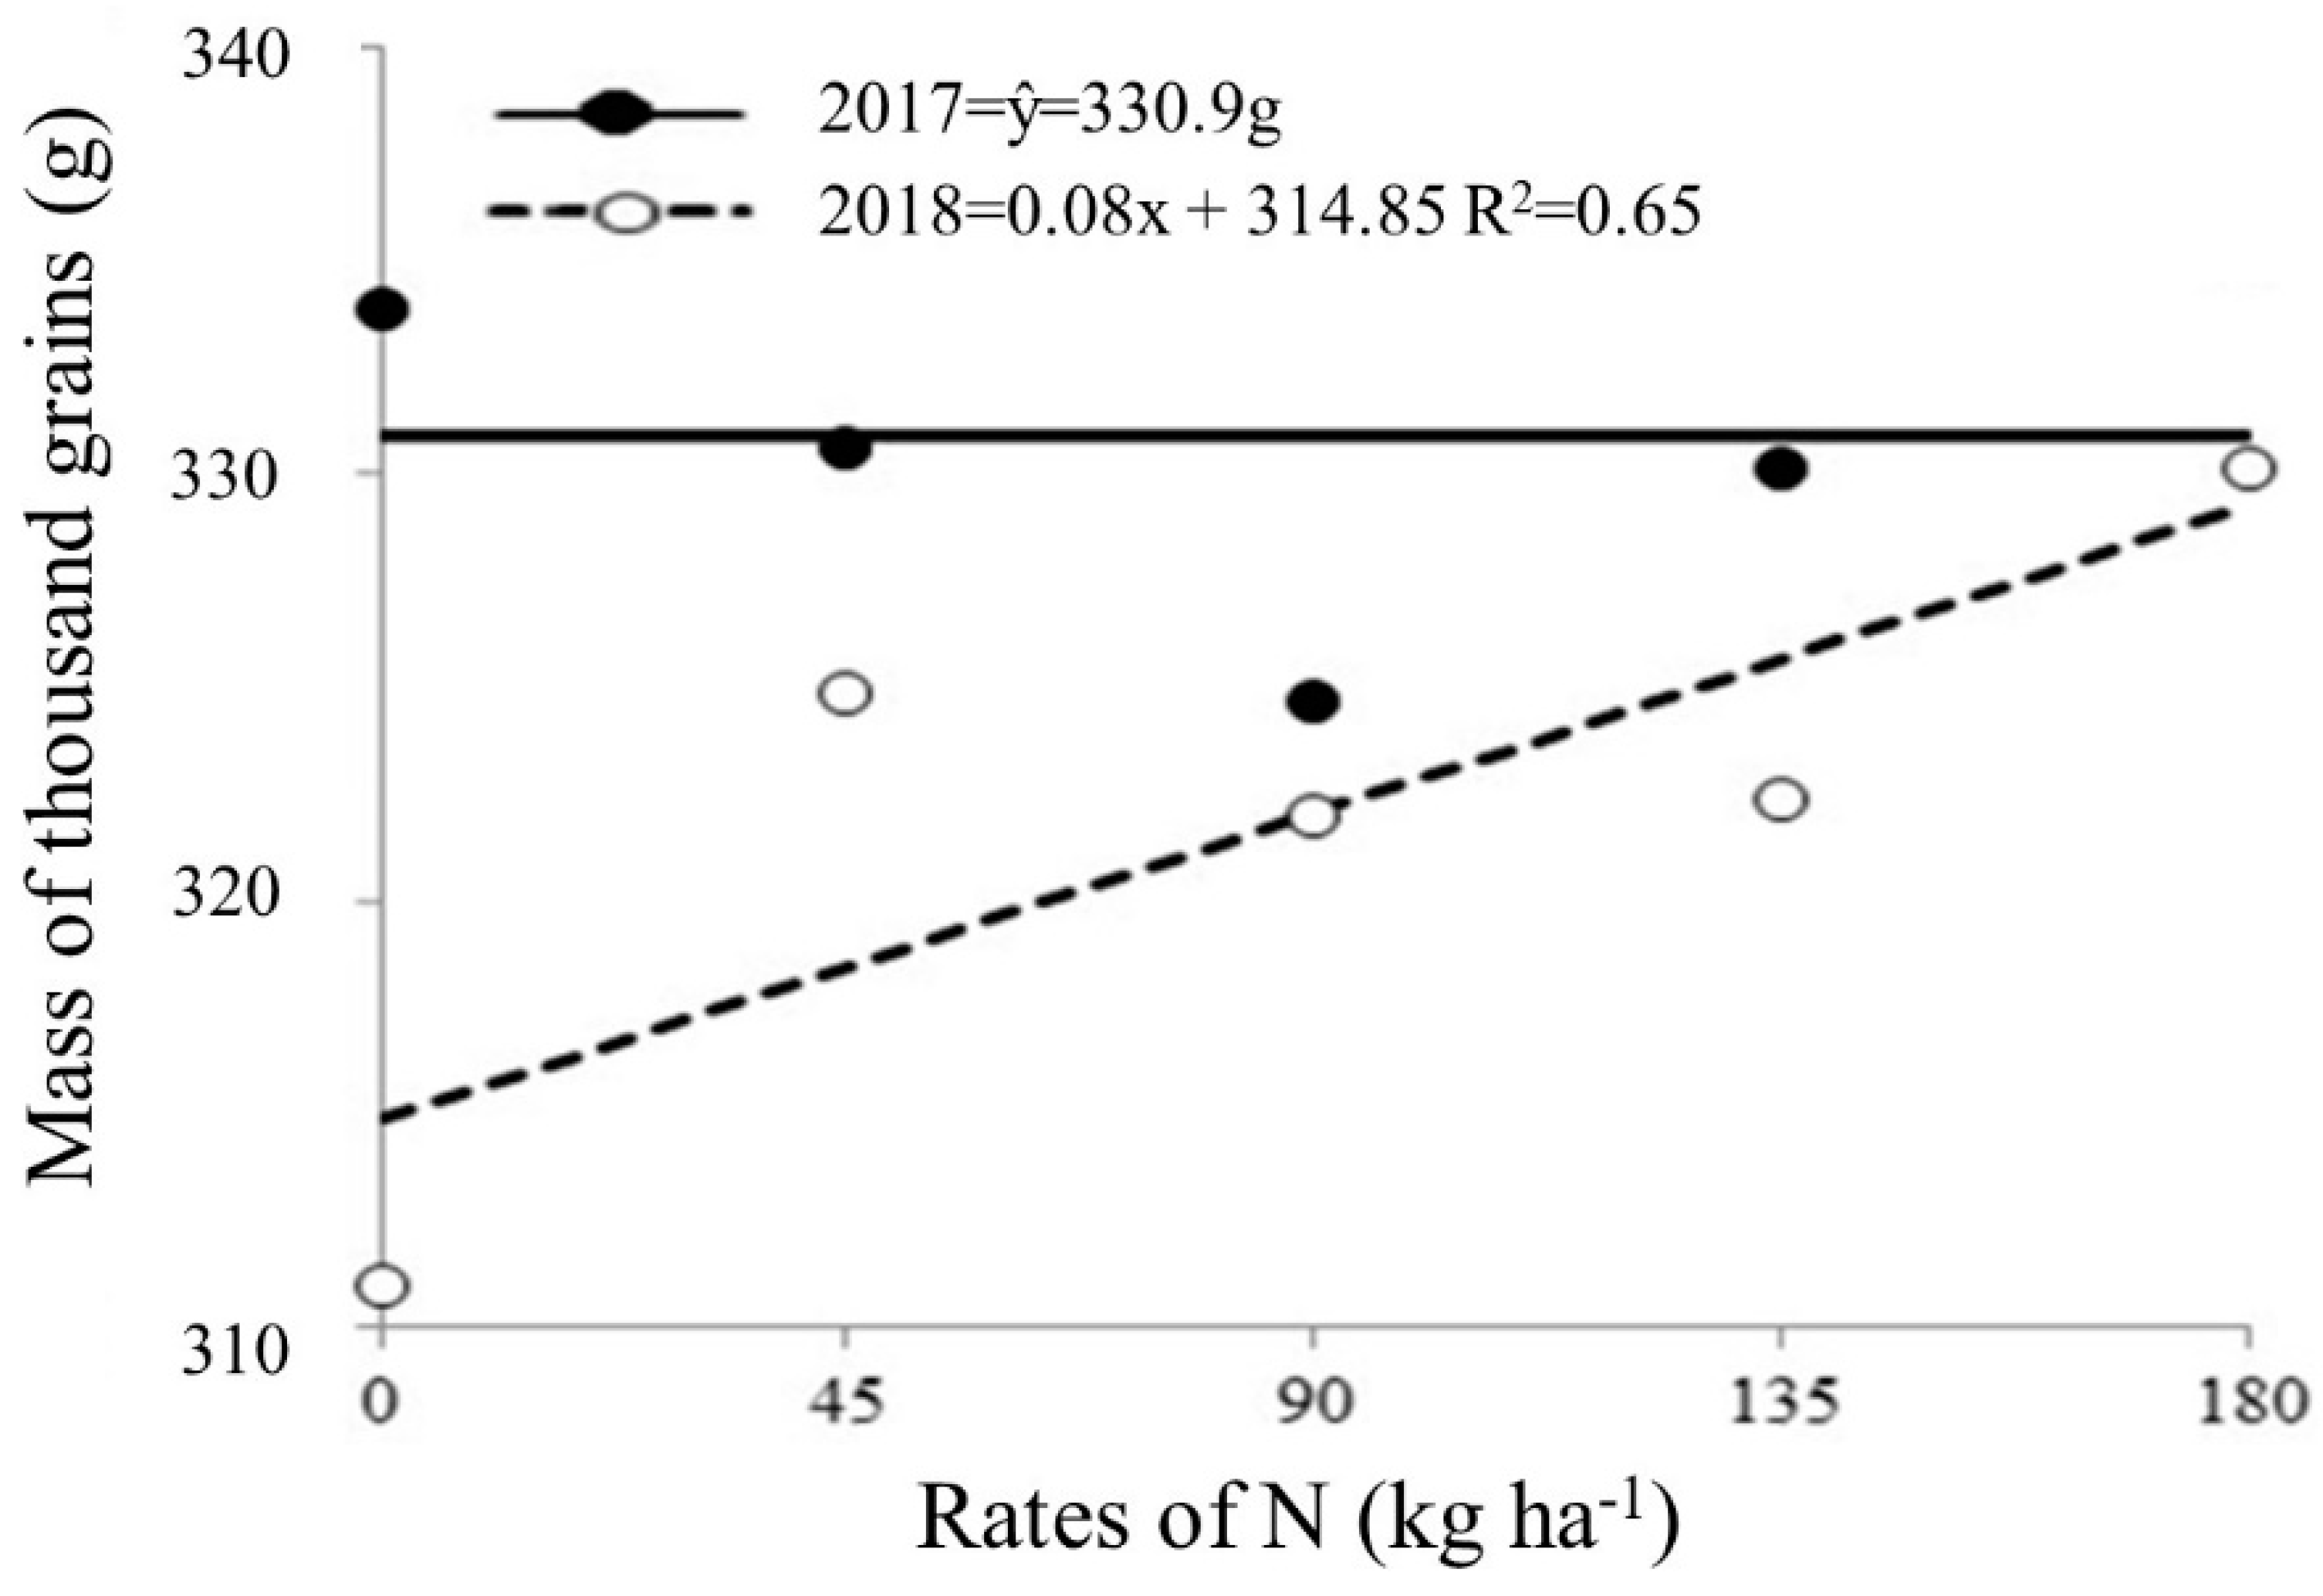
For N rates factor within the year, there was a linear adjustment for mass of thousand grains in 2071/2018 years, verifying that the increase in N rates significantly increased the grain mass, regardless of time of N application. The similar averages founded in cultivation of 2016/2017 showed that there was no significant effect for the application of N rates (
Figure 6).
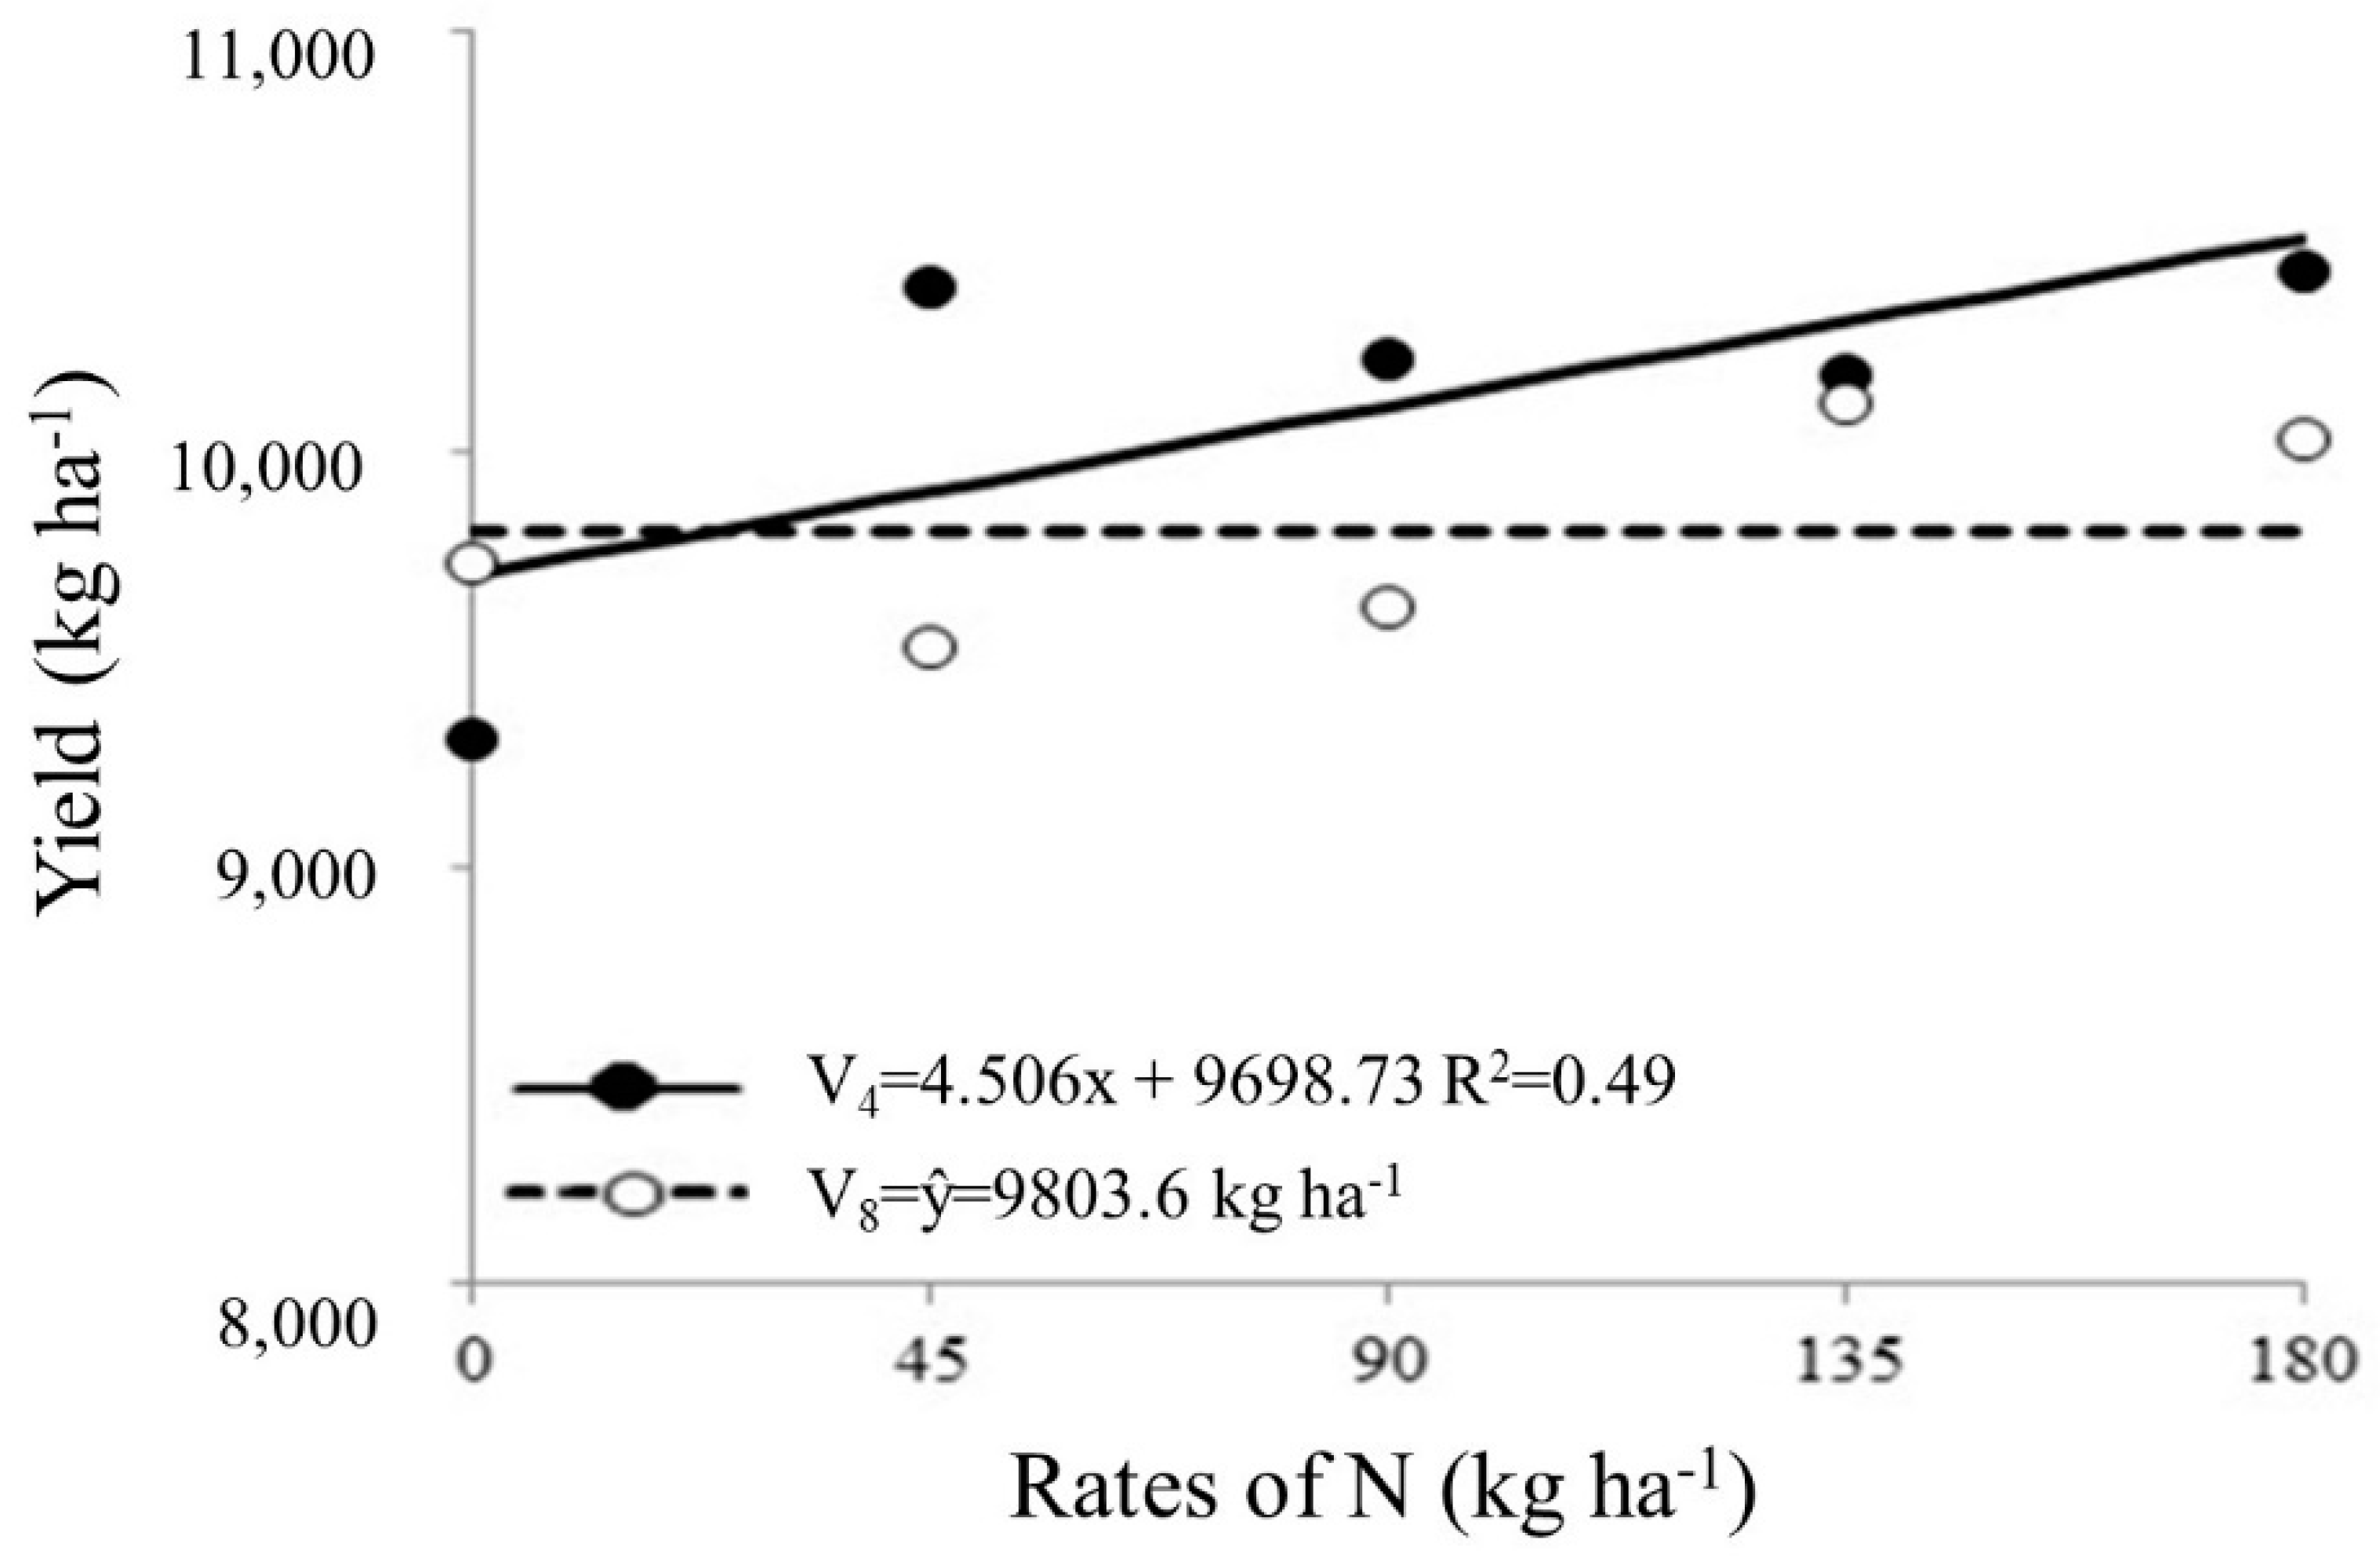
For productivity component, a significant effect was observed for interactions between N rates and application times and N rates and agricultural years. Through the developments, it was verified that yield showed a better adjustment to linear equation with increase in N rates, obtaining approximately 10,500 kg ha
-1 with the maximum rates of 180 kg ha
-1 of N applied in V
4 stage, with no significant effect for application at V
8 stage (
Figure 7).
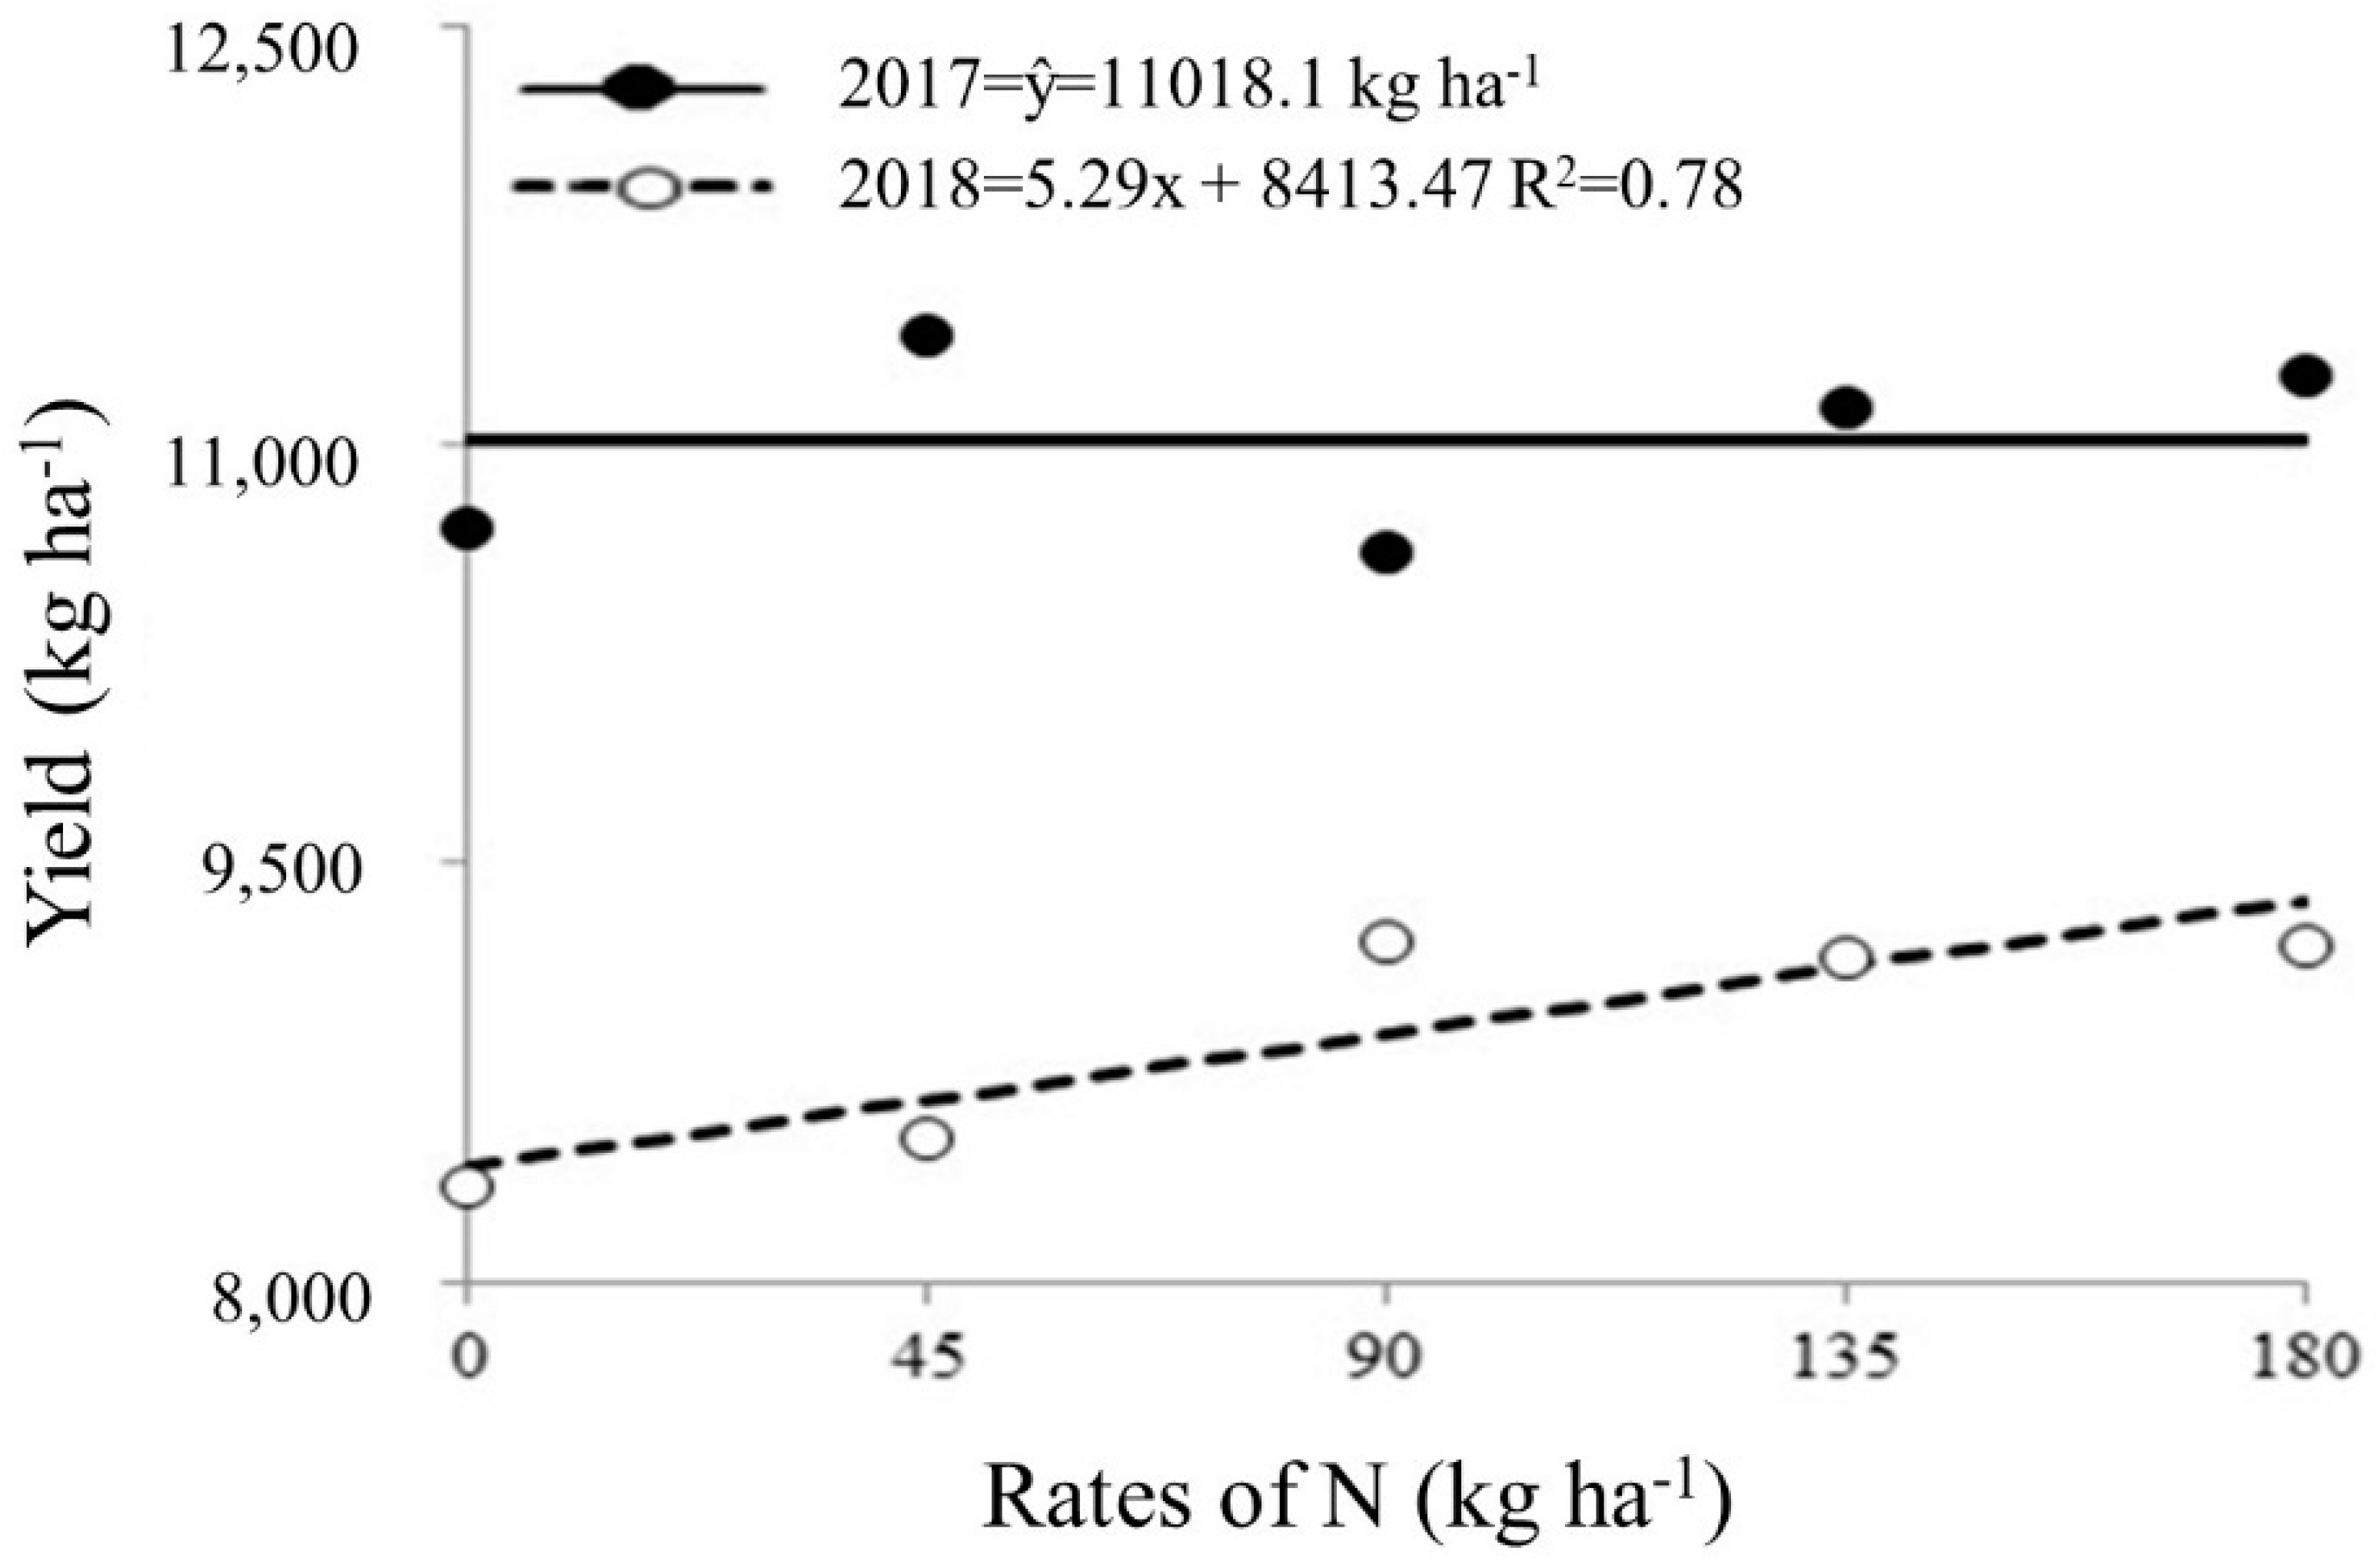
The highest production (11,018.12 kg ha
-1) was obtained in 2016/2017 year (
Figure 8). However, the application of N rates did not promote significant increases in 1st year, as the control showed similar averages to other treatments. The high yield of control may be related to availability of N at planting and through the mineralization of organic matter.
In the 2017/2018 year, corn yield showed a linear effect with application of N rates, even with decrease in grain production compared to previous year, a yield of 9,365.67 kg ha-1 was achieved with application of 180 kg ha-1 of N.
4. Discussion
The rainfall that occurred in two years (2016/2017 and 20172018) was considered greater than the crop's needs, despite the uneven rainfall distribution throughout the cycle, the crop's productive performance was not affected by water deficit in soil (
Figure 1), since the water requirement of corn can vary between 410 and 640 mm [
26], which can cause damage to production per area if it occurs during the flowering period, directly affecting grain production [
27].
The application of N in V
4 stage in 2016/2017 year occurred on dry soil and there was no rain in subsequent four days, while in V
8 stage there was accumulated precipitation greater than 46 mm in four days after the application of N sources, which may have promoted the loss of N both through leaching and laminar erosion [
12], since Argisol soils show abrupt texture changes in layers of soil profile that promote the occurrence of laminar erosion [
20].
Gott et al. [
17], studying nitrogen fertilization in corn, observed that application at V
4 phenological stage promoted better use of nutrient, due to the plant's faster growth during this period, which increases the requirement for N [
26], justified due to participation of N in composition of chlorophyll, amino acids, and proteins [
2].
The increase in PH (
Figure 2) can be explained by the fact that N participates in structure and is deposited in plant tissues, directly influencing cell division [
28]. Cell expansion resulting from increasing rates of N promoted vegetative development of plant [
4,
29].
According to Sangoi et al. [
30] (2014), nitrogen stimulates the regeneration of leaves from possible damage, delaying leaf senescence, which allows an active photosynthetic area for a longer period [
31] and consequently, the increase in LAI promotes improvements in production of assimilated through photosynthesis [
32], providing greater absorption of CO
2 for reduction and assimilation of nitrate [
33].
The mass of thousand grains is a component that directly contributes to yield and may be related to higher N contents in leaves (
Figure 5 and
Figure 6), favoring greater grain filling [
34]. This can be explained by greater photosynthetic activity of plants promoted by rates of N ensuring greater accumulation of carbohydrates [
35].
Carmo et al. [
36], evaluating the effects of N sources and rates applied in coverage on development and yield of corn crops, founded that nitrogen fertilization responded positively, regardless of N source used, which reinforces that fertilization time combined with rates of N are extremely important factors to obtain greater corn yields.
Similar results (
Figure 7 and
Figure 8) were founded by Silva et al. [
37], evaluating times of N application, founded higher corn yields (7,165 kg ha
-1) with the application of N at V
4 stage, since the supply of N in the initial period of crop favored yield, possibly due to occurrence of nutrient immobilization in the initial phase, leaving the nutrient readily available for other stages.
N is extremely necessary for good yield of corn crop, however, the performance of crop to obtain high yield depends on rates provided in fertilization, for a yield of 9,000 kg ha
-1, they can be up to 190 kg ha
-1 of N are required [
38].
The variation in yield of approximately 1,700 kg ha-1 between agricultural years may be related to specific differences in distribution of water regime throughout the crop development period. The total precipitation occurred in 2016/2017 year was 977.2 mm compared to 2017/2018 year which showed around 1,210.55 mm.
5. Conclusions
In the edaphoclimatic conditions of Amazon Biome, regardless of source of urea or ammonium sulfate, the recommended rates of 121 to 131 kg ha-1 of N and time of application of nutrient corresponds to the V4 phenological stage to promote greater vegetative development of corn.
Nitrogen fertilization provides significant increases in mass of thousand grain and yield. The maximum rate of 180 kg ha-1 of N, regardless of the source used, urea or ammonium sulfate, promotes greater grain weight and greater yield with application of N in coverage at V4 phenological stage under the conditions of Amazon Biome.
Author Contributions
Conceptualization, V.M.A. and R.S.O.; formal analysis, D.C.M.; investigation, R.P.M., C.F.O.N. and I.J.M.V.; methodology, A.A.N.F. and A.J.S.P.; writing – original draft preparation, D.C.M., C.F.O.N. and A.A.N.F.; writing – review and editing, I.J.M.V. and R.S.O.; supervision, R.S.O. All authors have read and agreed to the published version of the manuscript.
Funding
This work was supported by the National Council for Scientific and Technological Development (CNPq); Fundação de Amparo à Pesquisa do Estado do Pará (Fapespa).
Data Availability Statement
The data presented in this study are available upon request from the corresponding author.
Acknowledgments
The authors would like to thank the National Council for Scientific and Technological Development (CNPq) and Fundação de Amparo à Pesquisa do Estado do Pará (Fapespa) for the financial support given to the conclusion of this work.
Conflicts of Interest
The authors declare no conflict of interest.
References
- Lu: J.; Hu, T.; Zhang, B.; Wang, L.; Yang, S.; Fan, J.; Yan, S.; Zhang, F. Nitrogen fertilizer management effects on soil nitrate leaching, grain yield and economic benefit of summer maize in Northwest China. Agric. Water Manag. 2021, 247, 106739. [CrossRef]
- Baslam, M.; Mitsui, T.; Sueyoshi, K.; Ohyama, T. Recent advances in carbon and nitrogen metabolism in C3 plants. Int. J. Mol. Sci. 2021, 22, 318. [CrossRef]
- Prado, R.M. Mineral nutrition of tropical plants. Springer Nature, 2021.
- Okumura, R. S.; Mota, F. F. A.; Ferraz, Y. T.; Mariano, D. C.; Oliveira Neto, C. F.; Viégas, I. J. M.; Vieira, A. L. M.; Brito, A. E. A.; Franco, A. A. N.; Pedroso, A. J. S. Corn hybrids response to nitrogen rates at multiple locations in Brazilian Amazon. J. Agric. Sci. 2018, 10, 233-242. [CrossRef]
- Demari, G. H.; Carvalho, I. R.; Szareski, V. J.; Follmann, D. N.; Souza, V. Q.; Basso, C. J. Fontes e parcelamento do nitrogênio em híbridos de milho geneticamente modificado. Rev. Ciênc. Agrovet. 2018, 17, 325-335. [CrossRef]
- Martínez-Dalmau, J.; Berbel, J.; Ordóñez-Fernández, R. Nitrogen fertilization. A review of the risks associated with the inefficiency of its use and policy responses. Sustainability 2021, 13, 5625. [CrossRef]
- Qin, W.; Hu, C.; Oenema, O. Soil mulching significantly enhances yields and water and nitrogen use efficiencies of maize and wheat: a meta-analysis. Sci. Rep. 2015, 5, 1-13. [CrossRef]
- Rosolem, A. C.; Ritz, K.; Cantarella, H.; Galdos, M. V.; Hawkesford, M. J.; Whalley, W. R.; Mooney, S. J. Enhanced plant rooting and crop system management for improved N use efficiency. Adv. Agron. 2017, 146, 205-239. [CrossRef]
- Lucas, F.T.; Borges, B.M.M.N.; Coutinho, E.L.M. Nitrogen fertilizer management for maize production under Tropical climate. Agron. J. 2019, 111, 2031-2037. [CrossRef]
- Kaneko, F. H.; Arf, O.; Sabundjian, M. T.; Ferreira, J. P.; Gitti, D. C.; Leal, A. J. F.; Nascimento, V. Fontes e modos de aplicação de nitrogênio na cultura do milho em sistema de plantio direto. Braz. J. Biosystems Eng. 2015, 9, 191-196. [CrossRef]
- Zhang, W.; Liang, Z.; He, X.; Wang, X.; Shi, X.; Zou, C.; Chen, X. The effects of controlled release urea on maize productivity and reactive nitrogen losses: A meta-analysis. Environ. Pollut. 2019, 246, 559-565. [CrossRef]
- Li, T.; Wang, Z.; Wang, C.; Huang, J.; Feng, Y.; Shen, W.; Zhou, M.; Yang, L. Ammonia volatilization mitigation in crop farming: A review of fertilizer amendment technologies and mechanisms. Chemosphere 2022, 303, 134944. [CrossRef]
- Szymanska, M.; Sosulski, T.; Szara, E.; Was, A.; Sulewski, P.; Pruissen, G.W.P.; Cornelissen, R.L. Ammonium sulphate from a bio-refinery system as a fertilizer – Agronomic and economic effectiveness on the farm scale. Energies 2019, 12, 4721. [CrossRef]
- Allende-Montalbán, R.; Martín-Lammerding, D.; Delgado, M.M.; Porcel, M.A.; Gabriel, J.L. Nitrate leaching in maize (Zea mays L.) and wheat (Triticum aestivum L.) irrigated cropping systems under nitrification inhibitor and/or intercropping effects. Agriculture 2022, 12, 1-18. [CrossRef]
- Sheikhi, J.; Hosseini, H.M.; Etessami, H.; Majidi, A. Nitrification and abundance of nitrifier bacterial as effected by inhibitor 3,4-Dimethylpyrazole phosphate (DMPP) in five different soils. J. Soil Manag. Sustain. Prod. 2020, 9, 25-46. [CrossRef]
- Okumura, R.S.; Mariano, D.C.; Zaccheo, P.V.C. Uso de fertilizante nitrogenado na cultura do milho: uma revisão. Appl. Res. Agrotech. 2011, 4, 226-244. [CrossRef]
- Gott, R. M.; Sichocki, D.; Aquino, L. A.; Xavier, F. O.; Santos, L. P. D.; Aquino, R. F. B. A. Fontes e épocas de aplicação de nitrogênio no milho safrinha. Rev. Bras. Milho Sorgo 2014, 13, 24-34. [CrossRef]
- Fancelli, A. L. Cultura do milho: A importância da tecnologia. Informações Agron. 1997, 78, 4-6.
- Bastos, E.A.; Cardoso, J.M.; Melo, F. B.; Ribeiro, V.Q.; Andrade Júnior, A.S. Doses e formas de parcelamento de nitrogênio para a produção de milho sob plantio direto. Rev. Ciênc. Agron. 2008, 39, 275-280.
- Embrapa. Sistema Brasileiro de Classificação de Solos. 5.ed. Brasília: Centro Nacional de Pesquisa de Solos, 2018.
- Brasil, E.C.; Cravo, M.S.; Viégas, I.J.M. Recomendações de calagem e adubação para o estado do Pará. 2.ed. Brasília: Embrapa, 2020.
- Ritchie, S. W.; Hanway, J. J.; Benson, G. O. How a corn plant develops. Ames: Iowa State University of Science and Technology. Cooperative Extension Service, 1993.
- Souza, L.C.; Monteiro, G.G.T.N.; Marinho, R.K.M.; Souza, E.F.L.; Oliveira, S.C.F.; Ferreira, A.C.S.; Oliveira Neto, C.F.; Okumura, R.S.; Silva, G.P. Growth and physiology of maize plants subjected to water deficit and to different brassinosteroid and Azospirillum concentrations. Aust. J. Crop Sci. 2022, 16, 357-364. [CrossRef]
- Palheta, J. G.; Okumura, R. S.; Albuquerque, G. D. P.; Sousa, D. J. P.; Teixeira, J. S. S.; Neves, M. G.; Lopes Filho, W. R. L.; Souza, L. C.; Oliveira Neto, C. F. Sources and doses of nitrogen associated with inoculation with Azospirillum brasilense modulate growth and gas exchange of corn in the Brazilian Amazon. Int. J. Agric. Biol. 2021, 26, 349-358. [CrossRef]
- Ferreira, D. F. Sisvar: A computer analysis system to fixed effects split plot type designs. Rev. Bras. Biom. 2019, 37, 529-535. [CrossRef]
- Fornasieri Filho, D. Manual da cultura do milho. Jabuticabal: FUNEP, 2007.
- Penariol, F.G.; Fornasieri Filho, D.; Coicev, L.; Bordin, L.; Farinelli, R. Comportamento de cultivares de milho semeadas em diferentes espaçamentos entre linhas e densidades populacionais, na safrinha. Rev. Bras. Milho Sorgo 2003, 2, 52-60. [CrossRef]
- Luo, L.; Zhang, Y.; Xu, G. How does nitrogen shape plant architecture. J. Exp. Bot. 2020, 71, 4415-4427. [CrossRef]
- Ochieng, I. O.; Gitari, H. I.; Mochoge, B.; Rezaei-Chiyaneh, E.; Gweyi-Onyango, J. P. Optimizing maize yield, nitrogen efficacy and grain protein content under different N forms and rates. J. Soil Sci. Plant Nutr. 2021, 21, 1867-1880. [CrossRef]
- Sangoi, L.; Picoli Junior, G. J.; Vargas, V. P.; Vieira, J.; Schmtt, A.; Zoldan, S. R.; Siega, E.; Carniel, G. Cobertura nitrogenada como estratégia para reduzir os prejuízos da desfolha em diferentes estádios fenológicos do milho. Semin. Ciênc. Agr. 2014, 35, 671-682. [CrossRef]
- Fu, W.; Wang, Y.; Ye, Y.; Zhen, S.; Zhou, B.; Wang, Y.; Hu, Y.; Zhao, Y.; Huang, Y. Grain yields and nitrogen use efficiencies in different types of stay-green maize in response to nitrogen fertilizer. Plants 2020, 9, 474. [CrossRef]
- Mu, X.; Chen, Y. The physiological response of photosynthesis to nitrogen deficiency. Plant Physiol. Biochem. 2021, 158, 76-82. [CrossRef]
- Silva, S. M.; Oliveirai, L. J.; Faria, F. P.; Reis, E. F.; Carneiro, M. A. C.; Silva, S. M. Atividade da enzima nitrato redutase em milho cultivado sob diferentes níveis de adubação nitrogenada e potássica. Ciênc. Rural 2011, 41, 1931-1937. [CrossRef]
- Biscaro, G.A.; Motomiya, A.V.A.; Ranzi, R.; Vaz, M.A.B.; Prado, E.A.F.; Silveira, B.L.R. Desempenho do milho safrinha irrigado submetido a diferentes doses de nitrogênio via solo e foliar. Rev. Agrarian 2011, 4, 10-19.
- Goes, R.J.; Rodrigues, R.A.F.; Takasu, A.T.; Arf, O. Fontes e doses de nitrogênio em cobertura para a cultura do milho em espaçamento reduzido. Rev. Agrarian 2014, 7, 257-263.
- Carmo, M.S.; Cruz, S.C.S.; Souza, E.J.; Campos, L.F.C.; Machado, C.G. Doses e fontes de nitrogênio no desenvolvimento e produtividade da cultura de milho doce (Zea mays convar. saccharata var. rugosa). Biosci. J. 2012, 28, 223-231.
- Silva, E. C. De; Buzetti, S.; Guimarães, G.L.; Lazarini, E.; Sá, M.E. Doses e épocas de aplicação de nitrogênio na cultura do milho em plantio direto sobre Latossolo vermelho. Rev. Bras. Ciênc. Solo 2005, 29, 353-362. [CrossRef]
- Lange, A. Manejo da adubação nitrogenada na cultura do milho após cultivo da soja em sistema semeadura direta no cerrado. Tese (Doutorado em Energia Nuclear na Agricultura) - Escola Superior de Agricultura Luiz de Queiroz, Universidade de São Paulo, Piracicaba, 2006.
|
Disclaimer/Publisher’s Note: The statements, opinions and data contained in all publications are solely those of the individual author(s) and contributor(s) and not of MDPI and/or the editor(s). MDPI and/or the editor(s) disclaim responsibility for any injury to people or property resulting from any ideas, methods, instructions or products referred to in the content. |
© 2023 by the authors. Licensee MDPI, Basel, Switzerland. This article is an open access article distributed under the terms and conditions of the Creative Commons Attribution (CC BY) license (http://creativecommons.org/licenses/by/4.0/).
