Submitted:
03 November 2023
Posted:
09 November 2023
You are already at the latest version
Abstract
Magnetic Resonance Imaging (MRI) is widely used in clinics and research due to its accurate disease identification and non-invasive nature. MRI is based on Nuclear Magnetic Resonance (NMR), which is also extensively employed in various fields. NMR and its modern versions involve intricate pre-processing steps before data analysis. These steps are initially processed in the time domain and subsequently in the frequency domain. While our previous review focused on time domain pre-processing (https://www.preprints.org/manuscript/202310.2032/v1), this review delves into the mathematical and statistical aspects of frequency domain pre-processing. We discuss essential pre-processing steps like phase error correction, baseline correction, solvent filtering, calibration and alignment, reference deconvolution, binning/bucketing and peak picking, peak fitting/deconvolution and compound identification, integration and quantification, normalization and transformation. Furthermore, we offer practical recommendations for each step.
Keywords:
NMR pre-processing
; phase error correction
; baseline correction
; reference deconvolution
; integration and quantification
; normalization and transformation
Introduction
Overview of MRI and NMR
Magnetic Resonance Imaging (MRI) is widely used in clinics for identifying diseases and disorders in the human body, offering high accuracy and safety compared to X-rays and other invasive radiation techniques. MRI-related research has been ongoing since the 1970s 1–4. Additionally, various magnetic imaging techniques have emerged, finding applications in multiple research fields and clinical settings. It is important to note that MRI, along with its new formats, fundamentally relies on Nuclear Magnetic Resonance (NMR) principles 2.
NMR Data Acquisition
In NMR, 1D 1H NMR is the most commonly used method for data acquisition. This technique generates one-dimensional NMR data, representing proton signals in the time domain. When a sample is exposed to radiofrequency (RF) radiation from an NMR spectrometer, one of the protons in the sample—think of it like tiny magnets—absorbs energy from the RF radiation. This energy is manifested in the form of vibrations, which causes the proton to 'vibrate' or 'spin' at a particular speed, referred to as its 'frequency.'
When the RF field is turned off, the proton returns to its original state, ceases vibrating, and releases the energy it absorbed. This emitted energy is what we detect and record as a signal. Each signal has its own unique frequency, allowing us to distinguish it from other signals.
The need for pre-processing in NMR data
Since time domain NMR data combines signals from the same sample, several pre-processing steps are necessary to identify the signals present before conducting data analysis. These pre-processing steps are performed in both the time domain and the transformed domain using mathematical transformations like the Fourier transform (FT). The FT separates the data by frequency and integrates it over time, generating NMR data in the frequency domain. This data can then be displayed as a spectrum, with each signal represented as a peak or a multiplet (a group of overlapping peaks).
Overview of the review
While our previous review focused on time domain pre-processing steps (https://www.preprints.org/manuscript/202310.2032/v1), this review delves into frequency domain pre-processing, shedding light on the remaining aspects of the NMR pre-processing pipeline. The following sections will be covered:
- (1)
- Identification of influential frequency domain pre-processing steps
- (2)
- Software products for frequency domain pre-processing
- (3)
- Rationales, algorithms, general comments, and suggestions for each pre-processing step
- (4)
- Summary and conclusions
By examining each of these sections, we aim to provide a comprehensive understanding of pre-processing for NMR frequency domain data.
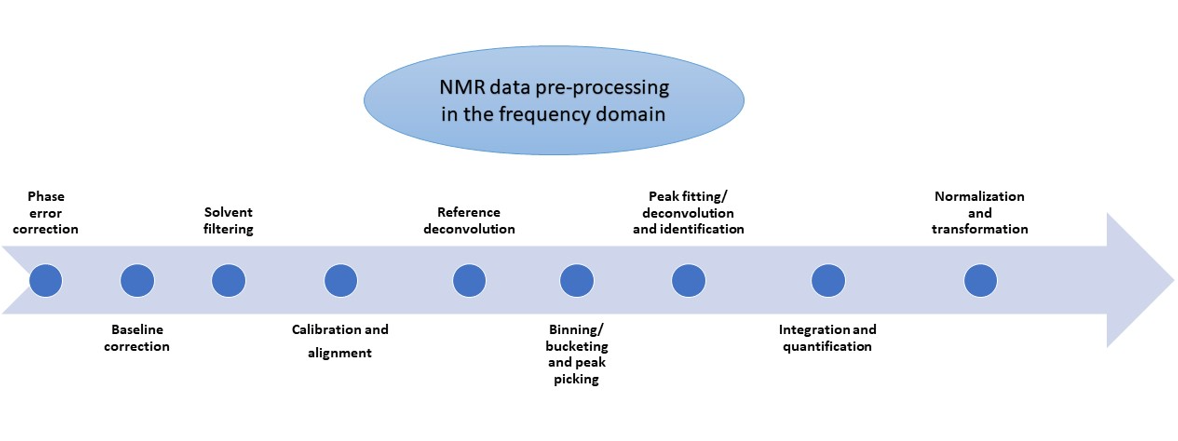
Brief overview of pre-processing steps in the NMR frequency domain
In the following sub-sections, we provide a list of the most influential frequency domain pre-processing steps, although their order may vary in different software.
Phase error correction
Phase in NMR signals tells us about the position or timing of the signal. Phase error is when what we measure doesn't match the true timing. Correcting phase errors is crucial because they can seriously distort the data, particularly in the frequency domain.
Baseline correction
Uncorrected or poorly corrected direct current (DC) offsets in the time domain can bias intensities away from a flat baseline in the frequency domain. These baseline biases, which can also result from phase errors, need to be corrected.
Solvent filtering
Eddy currents are circular electric currents within materials that can distort NMR signals by affecting magnetic fields. A prominent, intense solvent peak often captures most of this distortion, and it is typically removed during data analysis.
Calibration and alignment
To make NMR spectra comparable across different spectrometers, frequencies are expressed in parts per million (ppm) using the ratio of a signal's frequency to the spectrometer's frequency. Calibration sets the internal reference signal's ppm to zero by shifting the entire spectrum, while alignment adjusts peak chemical shifts to ensure the same signal aligns at the same ppm in different spectra.
Reference deconvolution
In reference deconvolution, the internal reference signal is reshaped to resemble a Lorentzian line, a specific mathematical function that describes the shape of an ideal peak. This transformation is also applied to all other signals to standardize their appearance as Lorentzian lines.
Binning/bucketing and peak picking
Binning or bucketing involves dividing a spectrum into fixed-width ranges. In contrast, peak picking, also known as intelligent binning, first identifies peaks and then groups them into ranges.
Peak fitting/deconvolution and compound identification
In this step, our goal is to identify molecules from the signals or "peaks" in the data. To achieve this, we employ two processes. Peak fitting involves precisely defining each peak's characteristics, such as shape, location, and intensity. Deconvolution, on the other hand, untangles overlapping peaks, allowing the separation of different molecules' contributions.
Integration and quantification
We use a process called integration to sum the 'intensities' within a specific range of each peak. This aids in quantification, where we determine concentration based on the peak's area under a curve, allowing us to assess the concentration of each molecule in the sample.
Normalization and transformation
Normalization is a technique used to standardize data for comparability, while transformation aligns data with specific necessary statistical assumptions.
The above nine frequency domain pre-processing steps are the most influential in current NMR practice. In the next section, we will present commonly used software products that provide these pre-processing steps.
Available frequency domain pre-processing choices in multiple software products
Several software products are commonly used for NMR frequency domain data pre-processing, they are TopSpin, SpinWorks, ACD/LABS, NMRPipe, rNMR, Mnova, and Chenomx NMR Suite 5–12. Mnova and Chenomx cover all nine frequency domain pre-processing steps while other software products don’t (Table 1).
Understanding NMR pre-processing steps in the frequency domain
In this section, we will delve deeper into the pre-processing steps in the frequency domain. Our aim is to demystify each NMR frequency pre-processing step by providing a detailed explanation and suggestions.
Understanding and correcting phase errors
Raw NMR signals in the time domain are complex numbers representing nuclei's energy changes along two orthogonal directions. After transforming into the frequency domain, they are still in complex numbers, with the real part called absorption and the imaginary part called dispersion.
Figure 1A shows simulated absorption values with three sharp, concentrated peaks in an absorption spectrum. Figure 1B displays simulated dispersion values with a different pattern. Phase, calculated as Phase, indicates the relationship between absorption and dispersion, and its corresponding plot is shown in Figure 1C. Figures 1A-C represent ideal signals with no phase errors, thus, Figure 1D shows a phase error plot with all values at 0.
However, NMR data always contain phase errors, which could cause significant change in all absorption, dispersion, phase and phase error plots as shown in Figures 1E-H. Therefore, data analysis based on peaks’ locations and areas under curves in the absorption plot (Figure 1E) is not reliable since it is so different from true peaks without phase error (Figure 1A). Therefore, phase error correction has to be done before any data analysis.
Unfortunately, phase error correction is one of the most challenging pre-processing steps in the frequency domain. Current NMR phase error correction approaches mainly rely on a simple linear model applied to the entire spectrum 13. This model searches for the intercept (zero-order parameter) and slope (first-order parameter) through an optimization process. Different algorithms employ various optimization functions 14–28. This simple linear model approach cannot deal with non-linear phase errors shown in Figure 1H. Although a more complex model with high-order terms might yield slightly better results 22,23, both models struggle to correct all phase errors. This is why manual phase error correction is still employed in recent research 29–31. However, manual phase error correction heavily relies on individual experience, leading to inconsistencies and a lack of inter-user reliability.
The key issue with current phase error correction approaches is the application of a single model to the entire spectrum. This strategy assumes that phase errors are only correlated to frequency or related scales such as index. However, this simple model cannot deal with non-linear phase errors, which are related to not only frequency but also signal peak area. Since each signal peak has its own frequency and peak area, it is reasonable to assume that phase errors have higher correlation within a signal than among signals. Therefore, we propose the use of a mixed model instead of a fixed linear model, while still utilizing all optimization functions:
: a phase value to be added to make phase correction at index i that belongs to a given signal j
: a global fixed effect intercept
: a random intercept for the jth signal
a fixed slope of an index function for the jth signal
a pre-defined function that depends on index i and belongs to the jth signal, which could be linear or nonlinear.
: a random error at the ith index that belongs to the jth signal
Alternatively, if achieving convergence with a mixed model proves challenging, we can consider using one linear phase error correction model for each signal separately.
A more efficient way to deal with all types of phase errors, whether constant, linear, or non-linear, is to start with phase error-free data such as magnitude and power spectra, which in theory should not contain any phase errors. Then, derive the phase error-free absorption spectrum as shown in Figure 1A.
Comment: Phase error correction is crucial in NMR data pre-processing. The current single fixed model often fails to correct all peaks. We propose a linear mixed model for better correction, considering spatial correlations within each signal. Alternatively, you can use a linear model for each signal. The most efficient approach, however, is deriving phase error-free absorption spectra from magnitude and power spectra.
Baseline correction techniques
Baseline distortion refers to a non-flat and non-zero baseline, primarily caused by uncorrected DC (direct current) offsets and phase errors. Baseline correction involves estimating the baseline bias and subtracting it from the spectrum data. Various algorithms exist for estimating baseline bias, and here are some examples:
1). Iterative polynomial fitting 13,30,32,33
2). Robust estimation procedure 32
3). Locally weighted scatter plot smoothing 32
4). Asymmetric least squares regression with penalized least square approach 32
5). B-spline fixed or mixed model with or without penalization 32
6). Continuous wavelet transform 34
Baseline bias estimation in all these algorithms is based on regions without signals 13. Most baseline correction methods are automated, although manual baseline correction methods also exist 35.
Comment: Baseline bias primarily results from DC offsets and phase errors, which should be addressed in earlier processing steps. If these issues remain uncorrected, baseline correction may become necessary. However, it's essential to note that baseline correction itself can introduce distortion and bias to the data as it is intertwined with noise modelling. Additionally, baseline correction can modify the intensity variance.
Let's denote s as the intensity variable of a spectrum and b as the baseline variable. After baseline correction, the intensity and its variance become s-z and var(s-b) respectively. Furthermore, we have the relationship:
In the simplest scenario where cov(s, b) = 0, we find:
This indicates that the baseline correction process actually increases the variance of the intensity when the baseline is not constant and not strongly correlated with intensity.
Even when baseline correction is performed with a constant value c, if you require the ratio of a signal's area (x-c) to an internal reference's area (y-c) for quantification, it's crucial to be aware that the ratio (x-c)/(y-c) might be significantly altered and may not correlate with the original ratio (x/y) at all (see Figure 2A: after baseline correction and Figure 2B: before baseline correction with a shift in the ratio). Therefore, caution is warranted when utilizing baseline-corrected data for quantification.
Solvent filtering methods
In cases where eddy current effects remain uncorrected in the time domain, and phase error correction does not rectify the resulting distortion, solvent peaks can become severely distorted. To address this issue, several commonly employed methods for solvent filtering are as follows:
1). Subtracting a solvent-only time domain data, known as the Free Induction Decay (FID), from the experimental FID of the biological or chemical sample. Subsequently, the solvent-filtered FID is transformed into the frequency domain, serving as one strategy for eddy current correction in the time domain.
2). Creating a pseudo solvent-only Free Induction Decay (FID) involves isolating the data within the solvent peak range from the frequency spectrum, setting all other data points to zero, and then transforming it into the time domain. This pseudo FID can then be processed using the method described in 1) 36.
3). Employing specialized filters that target the solvent's frequency range to eliminate the solvent signal 36.
4). Integrating solvent peak removal with baseline correction in the frequency domain 36
5). Zeroing out data points within the solvent peak data range or setting them to baseline values to effectively remove the solvent peaks.
6). Utilizing wavelet transformation as a means to remove the solvent signal 37.
Comment: If solvent peak distortion is not addressed during eddy current correction in the time domain and phase error correction in the frequency domain, it becomes necessary to filter out solvent peaks for further analysis. However, it is important to note that filtering solvent peaks may also inadvertently remove some true signals from their neighbouring components.
Methods and considerations for calibration and alignment
Calibration is to shift a whole spectrum to make an internal reference peak at 0 ppm, which is also called global alignment 13. Opposite to calibration, (local) alignment is to align each peak across a group of spectra to the same ppm position 13. Calibration can be applied without alignment; however, alignment should not be applied before calibration.
The following are example methods for alignment:
1). Internal correlated shifting with icoshift 38
2). Correlation optimized warping 39
3). Peak alignment by beam search 40
4). Fuzzy warping (Wu et al.) 41
5). Hierarchical cluster based peak alignment 40
More alignment methods can be found in the alignment review article 40.
During the alignment process, distance between two neighbour peaks might be increased or decreased, the latter could affect peak areas and quantification 32. Therefore, it was suggested that quantification should be processed on unaligned spectra to avoid this possible problem 32.
Comment: We recommend calibration as long as internal reference is phased well but not the (local) alignment.
Improving spectral lineshape: reference deconvolution techniques
Reference deconvolution involves using a reference signal to remove lineshape distortion from a whole spectrum. One commonly used approach for reference deconvolution is called FIDDLE: Free Induction Decay Deconvolution for Lineshape Enhancement 42–44. The process consists of the following sub-steps:
- (1)
- Select reference signal data points from a frequency spectrum and set the rest of the data points to 0, creating a reference-only spectrum (Aref).
- (2)
- Transform Aref into the time domain to obtain the reference-only FID (FIDref).
- (3)
- Use simulation to deconvolve FIDref and obtain an ideal reference FID with a Lorentzian lineshape (FIDideal_ref).
- (4)
- Calculate a ratio variable for each time point in the time domain:
ratioi = (FIDideal_ref, i)/(FIDref, i)
- (5)
- Multiply each time point of the original FID by the corresponding ratio variable to obtain the corrected whole FID:
FIDcorrected, i = ratioi * FIDfull,i
- (6)
- Transform FIDcorrected back into the frequency domain to obtain a reference-deconvoluted whole spectrum with an ideal lineshape.
The FIDDLE approach assumes that all signals are distorted in the same proportions as the internal reference signal and all signals have perfect Lorentzian lineshapes. However, these assumptions may not hold true in practice. Additionally, the FIDDLE approach does not work well for multiplets and 2D NMR data.
For 2D NMR data, a commonly used method that deals with a group of spectra is employed. This method not only unifies peaks with the same lineshape but also aligns peaks across spectra 45. This procedure differs from traditional reference deconvolution as it does not rely on an internal reference. Instead, it utilizes a "reference spectrum," often referred to as the "average spectrum," which is estimated using Principal Component Analysis (PCA) from multiple spectra. For each peak, the first principal component (PC1) is calculated and used to represent the peak in the "average spectrum." Ultimately, peaks are aligned across spectra, and their phase values match those in the PC1 "average spectrum."
Although this PCA-based method does not require a Lorentzian lineshape, the alignment process can lead to discontinuous baselines and distort overlapping peaks 46. Additionally, a strong assumption is necessary to set the same phases for peaks across spectra.
Some researchers have combined the FIDDLE and PCA-based methods 46, replacing the Lorentzian lineshape in FIDDLE with the average reference peak lineshape derived from PCA. This combined approach works on groups of spectra in 2D NMR data simultaneously. However, it still assumes that a group of aligned peaks across spectra in the same experiment share the same peak shape and location 46. While this assumption may hold well for Diffusion Ordered NMR Spectroscopy (DOSY) data, it is not suitable for general NMR data.
Interestingly, based on the aforementioned algorithms, we can observe that reference deconvolution primarily addresses lineshape distortion caused by phase errors, which are not corrected in the phase error correction step.
Comment: While this step makes all signals' lineshape in a spectrum serve as the reference signal and/or enforces lineshape comparability for a given signal across a group of spectra, it modifies the data with strong assumptions and can unduly influence all data analysis. Therefore, we recommend against applying reference deconvolution.
Binning, peak picking, and intelligent binning
This section focuses on the process of dividing spectra through binning or bucketing techniques and peak-picking methods.
While fixed width binning is commonly used, it has several potential problems that need to be addressed:
- (1)
- Signals can be split into multiple bins or combined into a single bin, resulting in non-meaningful bin summary data 32.
- (2)
- Fixed binning is not effective for handling overlapping peaks.
- (3)
- Bins are not comparable across spectra if alignment issues exist before binning 47.
Intelligent binning, also known as artificial intelligence (AI) binning, offers an automatic peak picking approach that generates more meaningful divided ranges compared to fixed width bins 48. AI binning utilizes techniques such as wavelet transformations, dynamic algorithms, and Gaussian or exponential functions to detect peak edges 32,34,49. This process can be applied to a group of spectra, allowing for small ppm adjustments across spectra 50. In cases where complex computations hinder the application of AI binning to the entire spectrum, it can be applied to each bin after fixed binning, using segments that cover the widest peaks 34.
One of the challenges in AI binning is peak screening or filtering, which involves differentiating between true signal peaks and noise. This step requires the definition of thresholds, taking into account factors such as signal-to-noise ratio and variance. Prior knowledge and manual intervention may also be necessary for effective peak screening 48.
Comment: Choosing peak picking or intelligent binning over fixed width binning is highly recommended, provided that careful consideration is given to selecting appropriate thresholds for peak filtering.
Peak fitting/deconvolution, and compound identification
The goal of this step is to deconvolute overlapping peaks when needed and identify compounds based on libraries that contain standard spectra with known signals or predict new compounds. Examples of libraries are Human Metabolomics Database (www.hmdb.ca) and Biological Magnetic Resonance Databank (www.bmrb.wisc.edu).
An example of a simple overlapping peak occurs when two molecules share the same peak. Assuming a Lorentzian function for each molecule's contribution in the absence of overlaps, deconvolution can be accomplished through an optimization process involving a specific loss function, such as the sum of the squares of the differences between the observed and estimated peaks 49. Deconvolution represents one of the most challenging pre-processing steps in the frequency domain, and it involves the application of various statistical models, including linear models and Bayesian hierarchical models 33,51.
Comment: It's important to acknowledge the complexity of deconvolution and its potential challenges. The subsequent compound identification phase may prove even more demanding. This is because experimental NMR data might undergo processing at different times, be handled by different individuals, or even originate from distinct laboratories compared to the existing NMR library data. As a result, direct comparability may be compromised, and we should remain vigilant about potential issues stemming from this NMR data-library data incompatibility during this step.
Integration and quantification
This step, relying on raw spectra or signals/peaks data, yields a matched compound list with concentrations in a spectrum 30. Integrating signals is conceptually straightforward, but the real challenge lies in intelligently defining signal edges, a task initiated in the peak picking and peak fitting/deconvolution steps. An arbitrary suggestion has been made to use a range of 24 times the signal width for integration 52, which may include unintended signals.
Quantification relies on factors such as a signal's area, the number of nuclei it represents (e.g., protons), a reference signal's area, the reference's number of nuclei, and, notably, the reference's concentration in the specimen. In the absence of an internal reference concentration, alternative methods include external references or electronic references 52. An internal reference generally offers more accurate concentration estimations, unless it interacts with other signals, leading to inaccuracies 48. When access to area is challenging, as in 13C NMR spectra, height may be used instead.
When multiple signals contribute to the concentration estimation of a compound, the choice can be to select the most stable and isolated peak or to calculate the mean value from multiple signals. In cases of multiple technical replicates, concentration estimation should be based on the mean value across these spectra 30.
At times, rather than using raw spectrum peaks (Figure 3A), Lorentzian lineshape fits (Figure 3B) are employed for quantification 45,46. While fit lines are symmetric and free from random errors, they deviate from observed spectrum data (Figure 3C), resulting in inaccurate peak areas and compound concentrations. Additionally, if the research goal is to identify significantly different peaks between two groups of spectra, using "error-free" numbers can reduce or underestimate variance between groups and increase the false positive rate.
Comment: Integration is a straightforward summation process, provided that peak edges have been intelligently defined in previous steps. We advise against using arbitrary multipliers of signal width for integration. The estimation of a molecule's concentration should ideally rely on an internal reference with a known concentration. Using fitted lines for quantification is discouraged to avoid bias and the underestimation of variation. While fitting is valuable for deconvolution and identification, once we have the proportions and edges of overlapping signals, it's best to derive integrals from the raw spectrum itself.
Normalization and transformation
This step aims to make data comparable or suitable for the assumptions needed in subsequent statistical analysis.
Normalization
Normalization is to make data comparable, which can be classified into spectrum-wise and location-wise normalization and can involve various approaches.
Spectrum-wise normalization
To make a group of spectra comparable, spectrum-wise normalization methods include dividing a variable, such as peak area, across various locations by the spectrum's total area, scaled by a predefined constant 48. However, this method hinges on the assumption that all spectra possess the same total signal quantity, an assumption that might not hold true in practice. An alternative spectrum-wise normalization method is to employ the area of an internal reference as a normalizing factor 32. In the case of NMR data being binned, the bin area can be utilized as a substitute for the peak area. Among these techniques, reference-based normalization, which relies on the presence of a spike-in internal reference with a known concentration, emerges as the most robust choice.
In addition to these methods, other less commonly used spectrum-wise normalization techniques also exist. Distribution-based normalization strategies like quantile normalization 54–56, histogram (matching) normalization 32, and spline normalization align data distributions. Quantile normalization orders and transforms values across spectra to achieve uniform distributions. Histogram normalization scales data based on minimum and maximum values from a reference spectrum 57. If you do not have a reference spectrum, the average or median spectrum across a group of spectra should work as well for histogram normalization. Spline normalization fits quantiles from experimental and reference spectra to a smooth cubic spline, which is then used to generate normalized data for the experimental spectrum 55,58. Similarly, the cubic spline can be replaced by Lowess to make Lowess normalization.
Location-wise normalization
Location-wise normalization is to make a variable at the different locations comparable. Although all methods in this section can also be applied to Section 3.4.9.1.1 Spectrum-wise normalization, methods in Section 3.4.9.1.1. are generally not applicable in the current section.
The simplest location-wise normalization is variable centering with variable mean or median 32. This is to subtract a variable’s mean or median across spectra for the same location and then add a pre-defined constant, which results in the same mean or median among different locations.
If we divide a variable with its mean at the same location across spectra, we will have level scaling 13,32. We can also divide a variable with its standard deviation at the same location across spectra to get unit variance scaling (auto-scaling), which is to make values at the different locations to have the same unit standard deviation. Vast scaling is to add one more step to unit variance scaling, which is to multiple unit variance scaled data with CV (coefficient of variation) that is variable mean over its standard deviation 32,59. Instead of standard deviation in unit variance scaling, square root of the standard deviation might also be used, which results in Pareto scaling. When range (maximum – minimum values) instead of standard deviation is used, the normalization method is called range scaling.
The most traditional normalization is the standardization, which is to minus mean first and then divide by standard deviation. However, in order to make all data to be positive, direct standardization is not applicable to NMR data, although its variation might work, for example, a procedure to minus mean, add a pre-defined constant, then divide by standard deviation.
Transformation
Transformation is to make data more suitable to assumptions required by a statistical method. It is applied to each item of a variable of NMR data.
The most commonly used transformation is log transformation, which is to increase normality and remove heteroscedasticity 32. Note that log transformation cannot be applied to non-positive numbers and it is a nonlinear transformation that might cause noise amplification. G-log transformation is generalized log transformation using the formula: ), or its variants 60–62. High values are still logarithm transformed without much change from regular log transformation while low values or noise are specially transformed to avoid noise amplification problems. This requires prior knowledge of high and low value thresholds to set the parameter λ in the G-log transformation formula 13,48.
Box-Cox transformation is to search for the best power transformation to get the optimal normalizing transformation 63. Its aim is also to decrease the effect of non-normality and remove heteroscedasticity 32.
Comment: Except for internal reference-based area spectrum-wise normalization, all other methods serve for statistical analysis, not molecule quantification. Different normalization methods can significantly impact results 59. Furthermore, location-wise normalization can inadvertently amplify noise or pseudo peaks, and it's essential to note that once data transformation occurs, reverting to the original scale for subsequent analyses is not straightforward.
Discussions and conclusion
In previous sections, we've explored the pre-processing steps in Table 1. Table 2 summarizes our key points. Now, let's delve further into these steps.
Phase error correction: Phase errors are common in NMR data and can have a substantial impact on results. Correcting these errors is undeniably necessary. However, conventional approaches often employ a single model for the entire spectrum, which may leave certain regions uncorrected. To enhance accuracy, we recommend implementing a linear mixed model for phase error correction, exploring multiple models for different signals, or deriving desired spectra from phase error-free magnitude and power spectra.
Baseline correction: Correcting baseline bias can be challenging, especially when significant phase errors remain. Additionally, baseline correction can complicate quantification. Our suggestion is to eliminate direct current offsets in the time domain, ensure thorough phase error correction, and, if possible, skip baseline correction.
Solvent filtering: Solvent filtering deals with distorted solvent peaks caused by the eddy current effect. If solvent peaks can be phased effectively, this step may be skipped. However, if phasing is problematic, removing solvent peaks is preferable, despite the need for vigilance regarding neighbouring peaks.
Calibration vs. alignment: We recommend calibration over alignment since alignment may affect peak areas and subsequent quantification.
Reference deconvolution: Reference deconvolution aims to remove lineshape distortion under the assumption that all peak distortions follow the same pattern as reference distortion. We find this assumption too stringent and advise against reference deconvolution.
Binning/bucketing: Binning is suitable for multivariate data analysis like pattern discovery. However, it's not ideal for molecule identification and quantification. In such cases, peak picking or intelligent binning is a better choice.
Peak deconvolution: Peak deconvolution aids in separating overlapping peaks for compound identification. Peak fitting, using theoretical lineshapes such as Lorentzian, is part of this process. While some researchers use peak fitting lines for quantification, we recommend using Lorentzian-fitted lines to obtain relative ratios for compounds from overlapping peaks and then estimate areas under curves from non-fit spectra for these compounds.
Normalization and transformation: These processes make data comparable and suitable for the required statistical assumptions, particularly beneficial for multivariate data analysis like pattern recognition. However, only internal reference area-based spectrum-wise normalized data is suitable for molecule quantification.
In summary, phase error correction and peak deconvolution are among the most challenging pre-processing steps in the frequency domain. Our overarching philosophy in pre-processing NMR data is to respect the data as much as possible. While each of these steps has its place in NMR practice, not all are suitable for every situation. It's essential to strike a balance between noise reduction and the preservation of valuable biological information. Our approach acknowledges the presence of some noise in processed data, which can be addressed during subsequent statistical analysis, ensuring that meaningful signals are retained. This balanced approach is preferable to overly processed data that risks losing vital information.
References
- Lauterbur, P. C. Paul C. Lauterbur Notebook, 1971, Box 1. https://digital.sciencehistory.org/works/0c483j46q.
- LAUTERBUR, P. C. Image Formation by Induced Local Interactions: Examples Employing Nuclear Magnetic Resonance. Nature 1973, 242, 190–191. [Google Scholar] [CrossRef]
- Fischer, C.; Miska, M.; Jung, A.; Weber, M.-A.; Saure, D.; Schmidmaier, G.; Weimer, A.; Moghaddam, A.; Doll, J. Posttraumatic Perfusion Analysis of Quadriceps, Patellar, and Achilles Tendon Regeneration With Dynamic Contrast-Enhanced Ultrasound and Dynamic Contrast-Enhanced Magnetic Resonance Imaging. Journal of Ultrasound in Medicine 2020, n/a (n/a). [Google Scholar] [CrossRef]
- Keddie, S.; Nagendran, A.; Cox, T.; Bomsztyk, J.; Jaunmuktane, Z.; Brandner, S.; Manji, H.; Rees, J.; Ramsay, A.; Rossor, A.; D’Sa, S.; Reilly, M.; Carr, A.; Lunn, M. Peripheral Nerve Neurolymphomatosis: Clinical Features, Treatment and Outcomes. Muscle & Nerve 2020, n/a (n/a). [Google Scholar] [CrossRef]
- TopSpin | NMR Data Analysis | Bruker. https://www.bruker.com/en/products-and-solutions/mr/nmr-software/topspin.html (accessed 2021-06-22).
- NMR Webpage - SpinWorks. https://home.cc.umanitoba.ca/~wolowiec/spinworks/ (accessed 2021-06-22).
- Chemistry Software for Analytical and Chemical Knowledge Management. https://www.acdlabs.com/ (accessed 2021-06-22).
- NMRPipe. https://spin.niddk.nih.gov/bax/software/NMRPipe/NMRPipe.html (accessed 2021-06-22).
- rNMR: Open Source Software for NMR Data Analysis. http://rnmr.nmrfam.wisc.edu/ (accessed 2021-06-22).
- mestrelab. Mestrelab Research S.L. - Analytical Chemistry Software Solutions. Mestrelab. https://mestrelab.com/ (accessed 2021-06-22).
- Chenomx Inc | Metabolite Discovery and Measurement. https://www.chenomx.com/ (accessed 2021-06-22).
- mestrelab. Mnova. Mestrelab. https://mestrelab.com/software/mnova/ (accessed 2021-06-22).
- Ebbels, T. M. D.; De Iorio, M. Statistical Data Analysis in Metabolomics. In Handbook of Statistical Systems Biology; John Wiley & Sons, Ltd, 2011; pp 163–180. [CrossRef]
- Ernst, R. R. Numerical Hilbert Transform and Automatic Phase Correction in Magnetic Resonance Spectroscopy. Journal of Magnetic Resonance (1969) 1969, 1, 7–26. [Google Scholar] [CrossRef]
- Herring, F. G.; Phillips, P. S. Automatic Phase Correction in Magnetic Resonance Using DISPA. Journal of Magnetic Resonance (1969) 1984, 59, 489–496. [Google Scholar] [CrossRef]
- Sotak, C. H.; Dumoulin, C. L.; Newsham, M. D. Automatic Phase Correction of Fourier Transform NMR Spectra Based on the Dispersion versus Absorption (DISPA) Lineshape Analysis. Journal of Magnetic Resonance (1969) 1984, 57, 453–462. [Google Scholar] [CrossRef]
- Wachter, E. A.; Sidky, E. Y.; Farra, T. C. Calculation of Phase-Correction Constants Using the DISPA Phase-Angle Estimation Technique. Journal of Magnetic Resonance (1969) 1989, 82, 352–359. [Google Scholar] [CrossRef]
- Brown, D. E.; Campbell, T. W.; Moore, R. N. Automated Phase Correction of FT NMR Spectra by Baseline Optimization. Journal of Magnetic Resonance (1969) 1989, 85, 15–23. [Google Scholar] [CrossRef]
- Montigny, F.; Elbayed, K.; Brondeau, J.; Canet, D. Automatic Phase Correction of Fourier-Transform NMR Data and Estimation of Peak Area by Fitting to a Lorentzian Shape. Anal. Chem. 1990, 62, 864–867. [Google Scholar] [CrossRef]
- Heuer, A. A New Algorithm for Automatic Phase Correction by Symmetrizing Lines. Journal of Magnetic Resonance (1969) 1991, 91, 241–253. [Google Scholar] [CrossRef]
- Hoffman, R. E.; Delaglio, F.; Levy, G. C. Phase Correction of Two-Dimensional NMR Spectra Using DISPA. Journal of Magnetic Resonance (1969) 1992, 98, 231–237. [Google Scholar] [CrossRef]
- Balacco, G. A New Criterion for Automatic Phase Correction of High-Resolution NMR-Spectra Which Does Not Require Isolated or Symmetrical Lines. Journal of Magnetic Resonance, Series A 1994, 110, 19–25. [Google Scholar] [CrossRef]
- Džakula, Ž. Phase Angle Measurement from Peak Areas (PAMPAS). Journal of Magnetic Resonance 2000, 146, 20–32. [Google Scholar] [CrossRef]
- Chen, L.; Weng, Z.; Goh, L.; Garland, M. An Efficient Algorithm for Automatic Phase Correction of NMR Spectra Based on Entropy Minimization. Journal of Magnetic Resonance 2002, 158, 164–168. [Google Scholar] [CrossRef]
- Larry Bretthorst, G. Automatic Phasing of MR Images. Part I: Linearly Varying Phase. Journal of Magnetic Resonance 2008, 191, 184–192. [Google Scholar] [CrossRef] [PubMed]
- de Brouwer, H. Evaluation of Algorithms for Automated Phase Correction of NMR Spectra. Journal of Magnetic Resonance 2009, 201, 230–238. [Google Scholar] [CrossRef] [PubMed]
- Hardy, E. H.; Hoferer, J.; Mertens, D.; Kasper, G. Automated Phase Correction via Maximization of the Real Signal. Magnetic Resonance Imaging 2009, 27, 393–400. [Google Scholar] [CrossRef]
- Bao, Q.; Feng, J.; Chen, L.; Chen, F.; Liu, Z.; Jiang, B.; Liu, C. A Robust Automatic Phase Correction Method for Signal Dense Spectra. Journal of Magnetic Resonance 2013, 234, 82–89. [Google Scholar] [CrossRef] [PubMed]
- Motegi, H.; Tsuboi, Y.; Saga, A.; Kagami, T.; Inoue, M.; Toki, H.; Minowa, O.; Noda, T.; Kikuchi, J. Identification of Reliable Components in Multivariate Curve Resolution-Alternating Least Squares (MCR-ALS): A Data-Driven Approach across Metabolic Processes. Sci Rep 2015, 5, 15710–15710. [Google Scholar] [CrossRef]
- Corol, D. I.; Harflett, C.; Beale, M. H.; Ward, J. L. An Efficient High Throughput Metabotyping Platform for Screening of Biomass Willows. Metabolites 2014, 4, 946–976. [Google Scholar] [CrossRef]
- del Campo, G.; Zuriarrain, J.; Zuriarrain, A.; Berregi, I. Quantitative Determination of Carboxylic Acids, Amino Acids, Carbohydrates, Ethanol and Hydroxymethylfurfural in Honey by (1)H NMR. Food Chem 2016, 196, 1031–1039. [Google Scholar] [CrossRef] [PubMed]
- Smolinska, A.; Blanchet, L.; Buydens, L. M. C.; Wijmenga, S. S. NMR and Pattern Recognition Methods in Metabolomics: From Data Acquisition to Biomarker Discovery: A Review. Analytica Chimica Acta 2012, 750, 82–97. [Google Scholar] [CrossRef] [PubMed]
- Cuperlovic-Culf, M.; Cormier, K.; Touaibia, M.; Reyjal, J.; Robichaud, S.; Belbraouet, M.; Turcotte, S. (1)H NMR Metabolomics Analysis of Renal Cell Carcinoma Cells: Effect of VHL Inactivation on Metabolism. Int J Cancer 2016, 138, 2439–2449. [Google Scholar] [CrossRef] [PubMed]
- Vu, T. N.; Valkenborg, D.; Smets, K.; Verwaest, K. A.; Dommisse, R.; Lemière, F.; Verschoren, A.; Goethals, B.; Laukens, K. An Integrated Workflow for Robust Alignment and Simplified Quantitative Analysis of NMR Spectrometry Data. BMC Bioinformatics 2011, 12, 405. [Google Scholar] [CrossRef] [PubMed]
- Zailer, E.; Diehl, B. W. K. Alternative Determination of Blood Alcohol Concentration by 1H NMR Spectroscopy. Journal of Pharmaceutical and Biomedical Analysis 2016, 119, 59–64. [Google Scholar] [CrossRef] [PubMed]
- Jiru, F. Introduction to Post-Processing Techniques. Eur J Radiol 2008, 67, 202–217. [Google Scholar] [CrossRef]
- Günther, U. L.; Ludwig, C.; Rüterjans, H. WAVEWAT-Improved Solvent Suppression in NMR Spectra Employing Wavelet Transforms. J Magn Reson 2002, 156, 19–25. [Google Scholar] [CrossRef] [PubMed]
- Savorani, F.; Tomasi, G.; Engelsen, S. B. Icoshift: A Versatile Tool for the Rapid Alignment of 1D NMR Spectra. Journal of Magnetic Resonance 2010, 202, 190–202. [Google Scholar] [CrossRef] [PubMed]
- Pravdova, V.; Walczak, B.; Massart, D. L. A Comparison of Two Algorithms for Warping of Analytical Signals. Analytica Chimica Acta 2002, 456, 77–92. [Google Scholar] [CrossRef]
- Vu, T. N.; Laukens, K. Getting Your Peaks in Line: A Review of Alignment Methods for NMR Spectral Data. Metabolites 2013, 3, 259–276. [Google Scholar] [CrossRef]
- Wu, W.; Daszykowski, M.; Walczak, B.; Sweatman, B. C.; Connor, S. C.; Haseldeo, J. N.; Crowther, D. J.; Gill, R. W.; Lutz, M. W. Peak Alignment of Urine NMR Spectra Using Fuzzy Warping. Journal of Chemical Information and Modeling 2006, 46, 863–875. [Google Scholar] [CrossRef] [PubMed]
- Gibbs, A.; Morris, G. A.; Swanson, A. G.; Cowburn, D. Suppression of T1 Noise in 2D NMR Spectroscopy by Reference Deconvolution. Journal of Magnetic Resonance, Series A 1993, 101, 351–356. [Google Scholar] [CrossRef]
- Morris, G. A.; Barjat, H.; Home, T. J. Reference Deconvolution Methods. Progress in Nuclear Magnetic Resonance Spectroscopy 1997, 31, 197–257. [Google Scholar] [CrossRef]
- Metz, K.; Lam, M.; Webb, A. Reference Deconvolution: A Simple and Effective Method for Resolution Enhancement in Nuclear Magnetic Resonance Spectroscopy. Concepts in Magnetic Resonance 2000, 12, 21–42. [Google Scholar] [CrossRef]
- Witjes, H.; Melssen, W. J.; in ‘t Zandt, H. J. A.; van der Graaf, M.; Heerschap, A.; Buydens, L. M. C. Automatic Correction for Phase Shifts, Frequency Shifts, and Lineshape Distortions across a Series of Single Resonance Lines in Large Spectral Data Sets. Journal of Magnetic Resonance 2000, 144, 35–44. [Google Scholar] [CrossRef] [PubMed]
- Huo, R.; Wehrens, R.; Buydens, L. M. C. Improved DOSY NMR Data Processing by Data Enhancement and Combination of Multivariate Curve Resolution with Non-Linear Least Square Fitting. J Magn Reson 2004, 169, 257–269. [Google Scholar] [CrossRef] [PubMed]
- Ebbels, T. M. D.; Lindon, J. C.; Coen, M. Processing and Modeling of Nuclear Magnetic Resonance (NMR) Metabolic Profiles. Methods Mol Biol 2011, 708, 365–388. [Google Scholar] [CrossRef] [PubMed]
- Puchades-Carrasco, L.; Palomino-Schätzlein, M.; Pérez-Rambla, C.; Pineda-Lucena, A. Bioinformatics Tools for the Analysis of NMR Metabolomics Studies Focused on the Identification of Clinically Relevant Biomarkers. Briefings in Bioinformatics 2016, 17, 541–552. [Google Scholar] [CrossRef] [PubMed]
- Morris, G. A. NMR Data Processing☆. In Encyclopedia of Spectroscopy and Spectrometry (Third Edition); Lindon, J. C., Tranter, G. E., Koppenaal, D. W., Eds.; Academic Press: Oxford, 2017; pp. 125–133. [Google Scholar] [CrossRef]
- De Meyer, T.; Sinnaeve, D.; Van Gasse, B.; Tsiporkova, E.; Rietzschel, E. R.; De Buyzere, M. L.; Gillebert, T. C.; Bekaert, S.; Martins, J. C.; Van Criekinge, W. NMR-Based Characterization of Metabolic Alterations in Hypertension Using an Adaptive, Intelligent Binning Algorithm. Anal. Chem. 2008, 80, 3783–3790. [Google Scholar] [CrossRef]
- Hao, J.; Astle, W.; De Iorio, M.; Ebbels, T. M. D. BATMAN—an R Package for the Automated Quantification of Metabolites from Nuclear Magnetic Resonance Spectra Using a Bayesian Model. Bioinformatics 2012, 28, 2088–2090. [Google Scholar] [CrossRef]
- Argyropoulos, D.; Avizonis, D. Electronic Referencing in Quantitative NMR. In eMagRes; American Cancer Society, 2010. [CrossRef]
- Betson, T. R.; Augusti, A.; Schleucher, J. Quantification of Deuterium Isotopomers of Tree-Ring Cellulose Using Nuclear Magnetic Resonance. Anal. Chem. 2006, 78, 8406–8411. [Google Scholar] [CrossRef] [PubMed]
- Luck, M.; Le Moyec, L.; Barrey, E.; Triba, M.; Bouchemal, N.; SAVARIN, P.; ROBERT, C. Energetics of Endurance Exercise in Young Horses Determined by Nuclear Magnetic Resonance Metabolomics. Frontiers in Physiology 2015, 6, 198. [Google Scholar] [CrossRef] [PubMed]
- Kohl, S. M.; Klein, M. S.; Hochrein, J.; Oefner, P. J.; Spang, R.; Gronwald, W. State-of-the Art Data Normalization Methods Improve NMR-Based Metabolomic Analysis. Metabolomics 2012, 8 (Suppl 1), 146–160. [Google Scholar] [CrossRef] [PubMed]
- Huang, Y.; Su, B.-N.; Ye, Q.; Palaniswamy, V. A.; Bolgar, M. S.; Raglione, T. V. Improving the Efficiency of Quantitative (1)H NMR: An Innovative External Standard-Internal Reference Approach. J Pharm Biomed Anal 2014, 88, 1–6. [Google Scholar] [CrossRef] [PubMed]
- Sun, X.; Shi, L.; Luo, Y.; Yang, W.; Li, H.; Liang, P.; Li, K.; Mok, V. C. T.; Chu, W. C. W.; Wang, D. Histogram-Based Normalization Technique on Human Brain Magnetic Resonance Images from Different Acquisitions. BioMedical Engineering OnLine 2015, 14, 73. [Google Scholar] [CrossRef] [PubMed]
- Workman, C.; Jensen, L. J.; Jarmer, H.; Berka, R.; Gautier, L.; Nielser, H. B.; Saxild, H.-H.; Nielsen, C.; Brunak, S.; Knudsen, S. A New Non-Linear Normalization Method for Reducing Variability in DNA Microarray Experiments. Genome Biol 2002, 3, research0048–research0048. [Google Scholar] [CrossRef] [PubMed]
- van den Berg, R. A.; Hoefsloot, H. C.; Westerhuis, J. A.; Smilde, A. K.; van der Werf, M. J. Centering, Scaling, and Transformations: Improving the Biological Information Content of Metabolomics Data. BMC Genomics 2006, 7, 142. [Google Scholar] [CrossRef] [PubMed]
- Rocke, D.; Lee, G. C.; Tillinghast, J.; Durbin-Johnson, B.; Wu, S. LMGene Software for Data Transformation and Identification of Differentially Expressed Genes in Gene Expression Arrays, 2012. http://www.bioconductor.org/packages//2.7/bioc/html/LMGene.html (accessed 2021-06-28).
- Durbin, B. P.; Hardin, J. S.; Hawkins, D. M.; Rocke, D. M. A Variance-Stabilizing Transformation for Gene-Expression Microarray Data. Bioinformatics 2002, 18 (suppl_1), S105–S110. [Google Scholar] [CrossRef] [PubMed]
- Huber, W.; von Heydebreck, A.; Sültmann, H.; Poustka, A.; Vingron, M. Variance Stabilization Applied to Microarray Data Calibration and to the Quantification of Differential Expression. Bioinformatics 2002, 18 (suppl_1), S96–S104. [Google Scholar] [CrossRef]
- Osborne, J. W. Improving Your Data Transformations: Applying the Box-Cox Transformation. Practical Assessment, Research and Evaluation 2010, 15, 12. [Google Scholar]
Figure 1.
Illustration of NMR Phase Errors. A time domain data example of three signals without phase error (A-D) and with errors (E-H). Real signal components are shown in A and E, while imaginary signal components are shown in B and F. Phase plots are located in C and G, while phase error plots can be found in D and H.
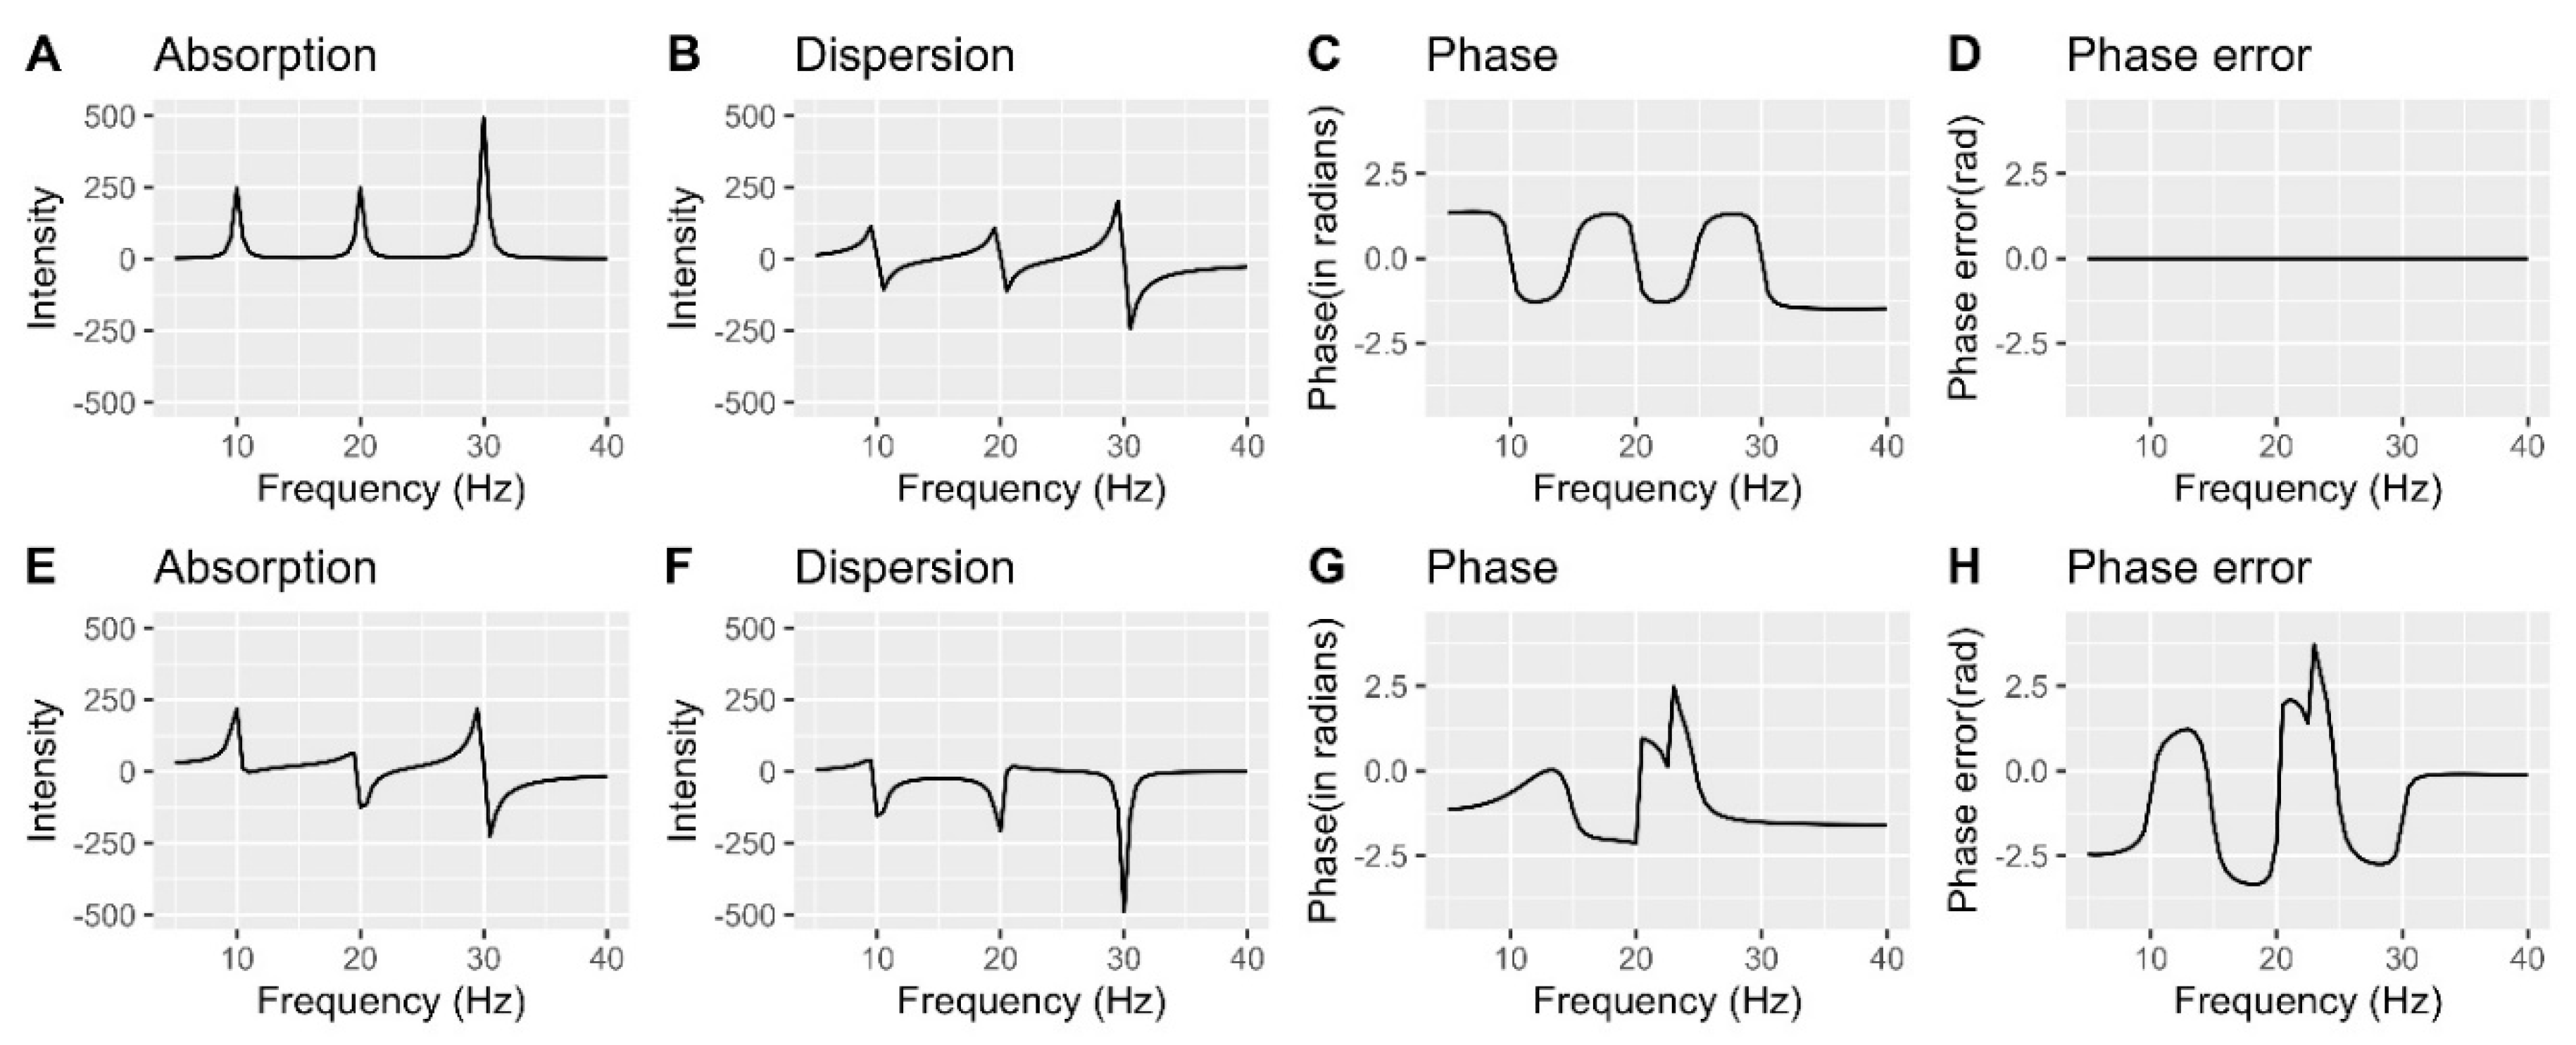
Figure 2.
A simulated example illustrating the impact of a constant baseline correction with 500 data points. A. Ratio-to-ratio plot of x/y to (x-c)/(y-c), where x ~ N(0,1), y ~ N(3,16), and c=5. B. Ratio-to-ratio plot of x/y and x/y-c.
Figure 2.
A simulated example illustrating the impact of a constant baseline correction with 500 data points. A. Ratio-to-ratio plot of x/y to (x-c)/(y-c), where x ~ N(0,1), y ~ N(3,16), and c=5. B. Ratio-to-ratio plot of x/y and x/y-c.
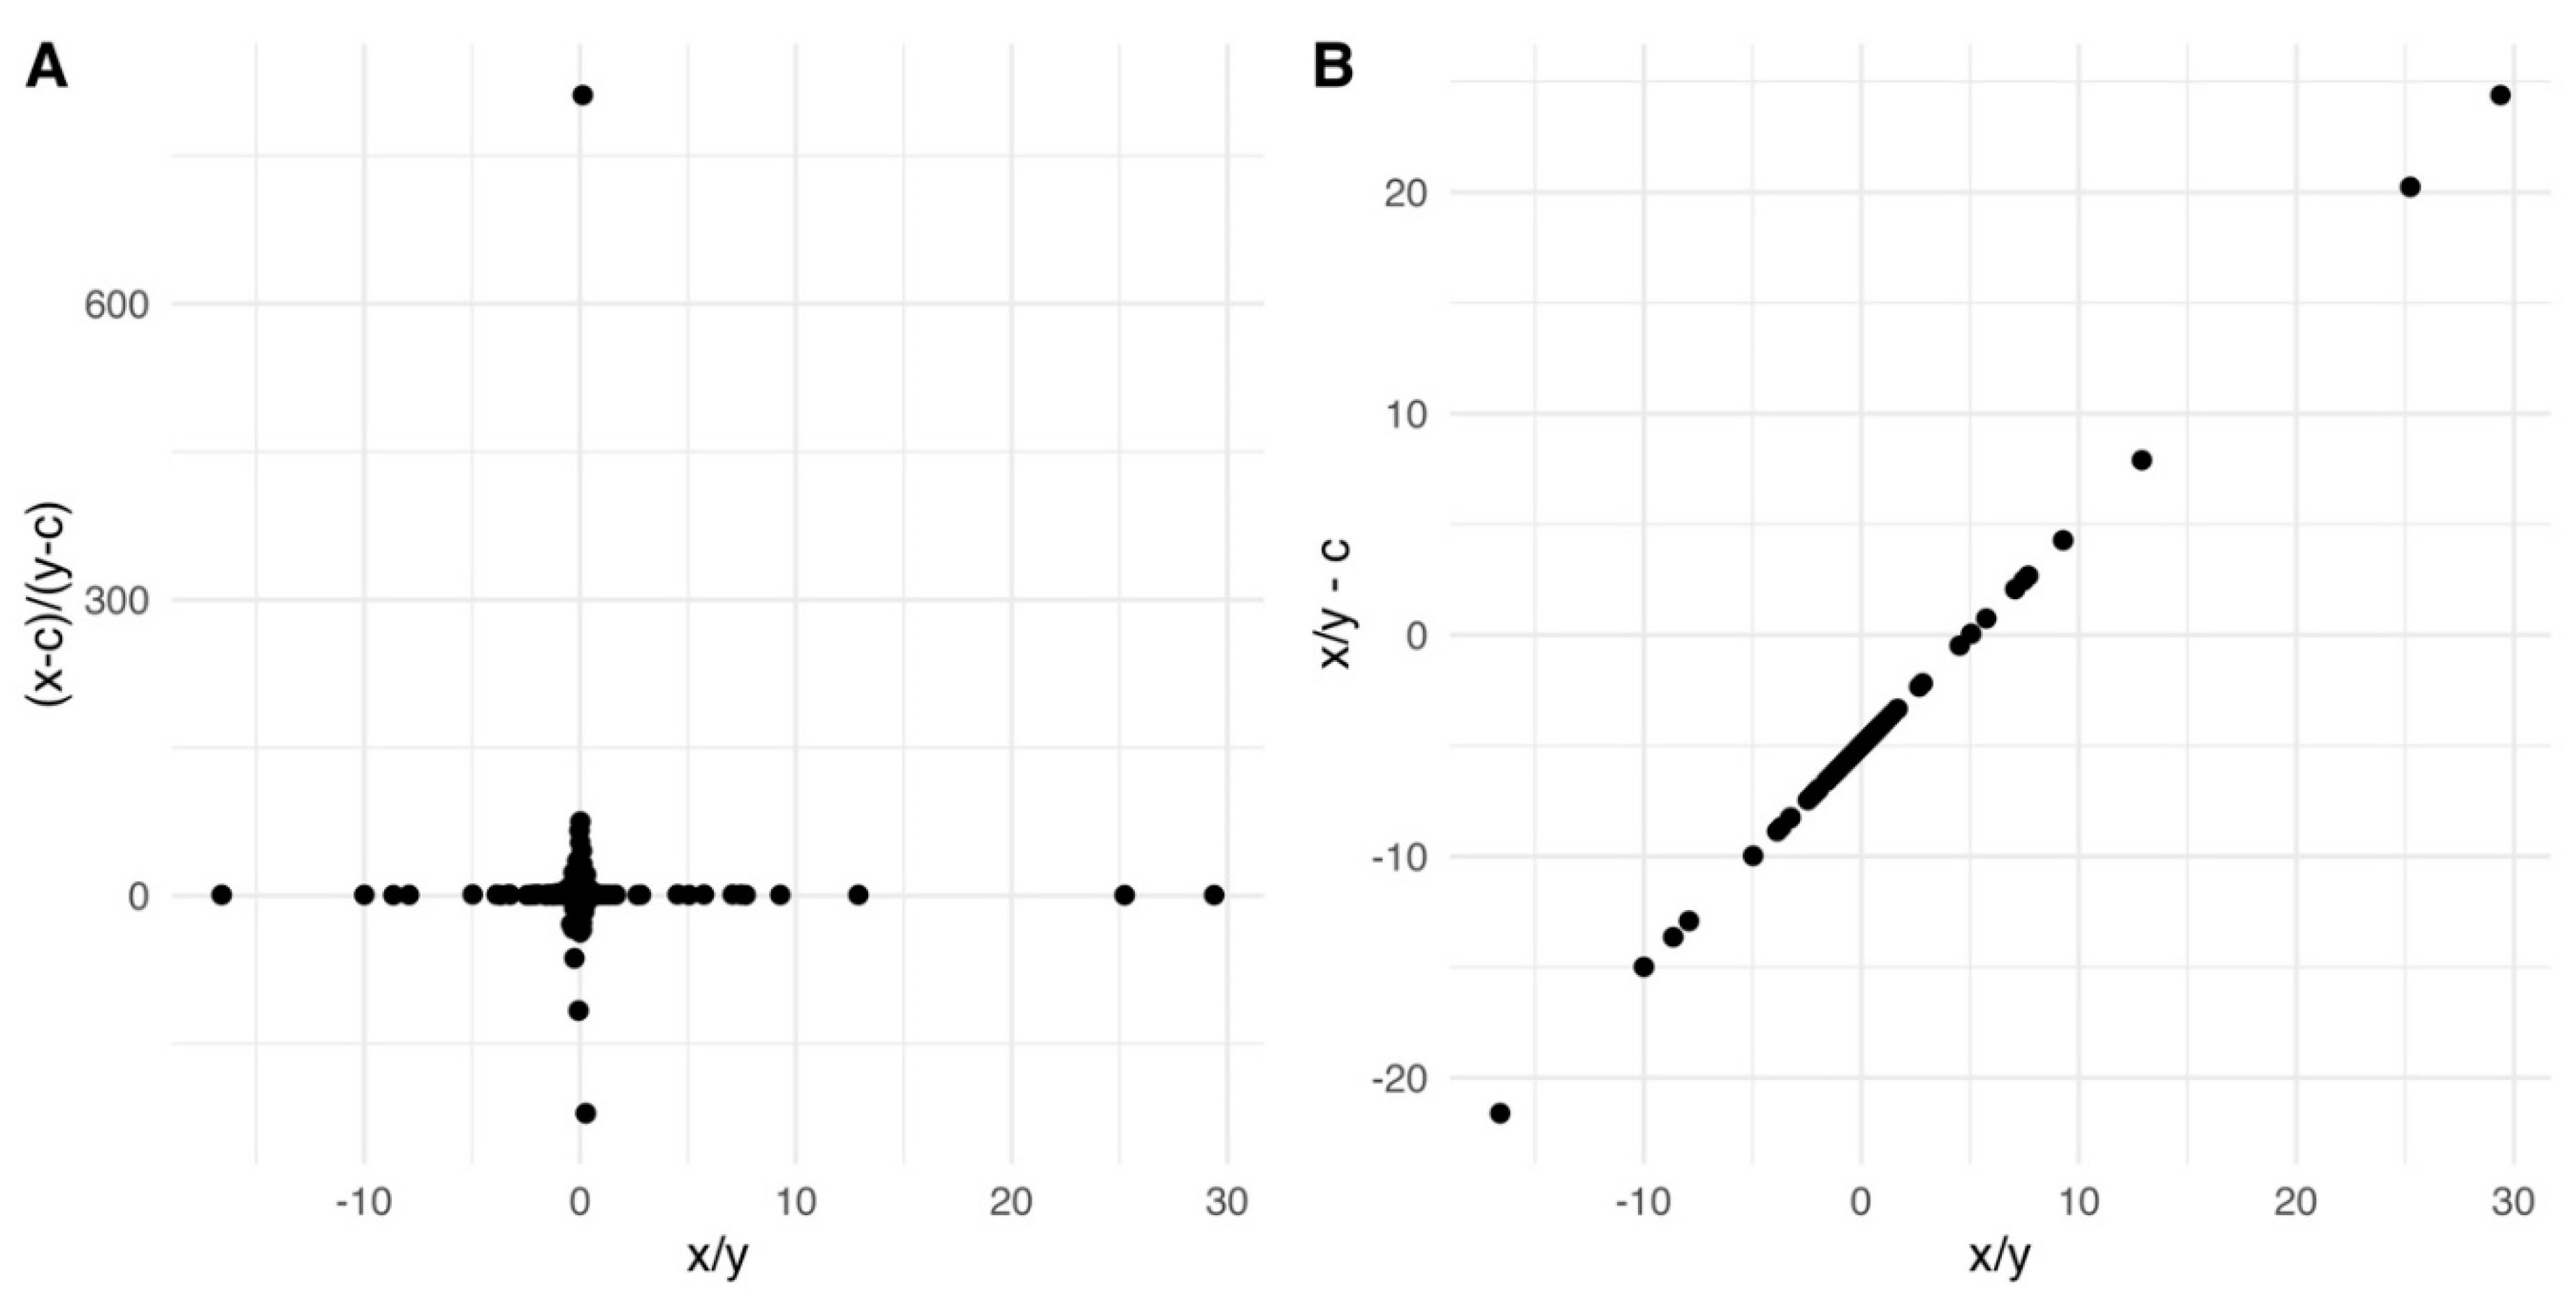
Figure 3.
Line shape fit of a deuterium NMR spectrum. A. deuterium NMR spectrum of derivative 3 showing one signal for each D isotopomer, B. line shape fit calculated by deconvolution, and C. difference between the spectrum and the fit, magnified five times 53.
Figure 3.
Line shape fit of a deuterium NMR spectrum. A. deuterium NMR spectrum of derivative 3 showing one signal for each D isotopomer, B. line shape fit calculated by deconvolution, and C. difference between the spectrum and the fit, magnified five times 53.
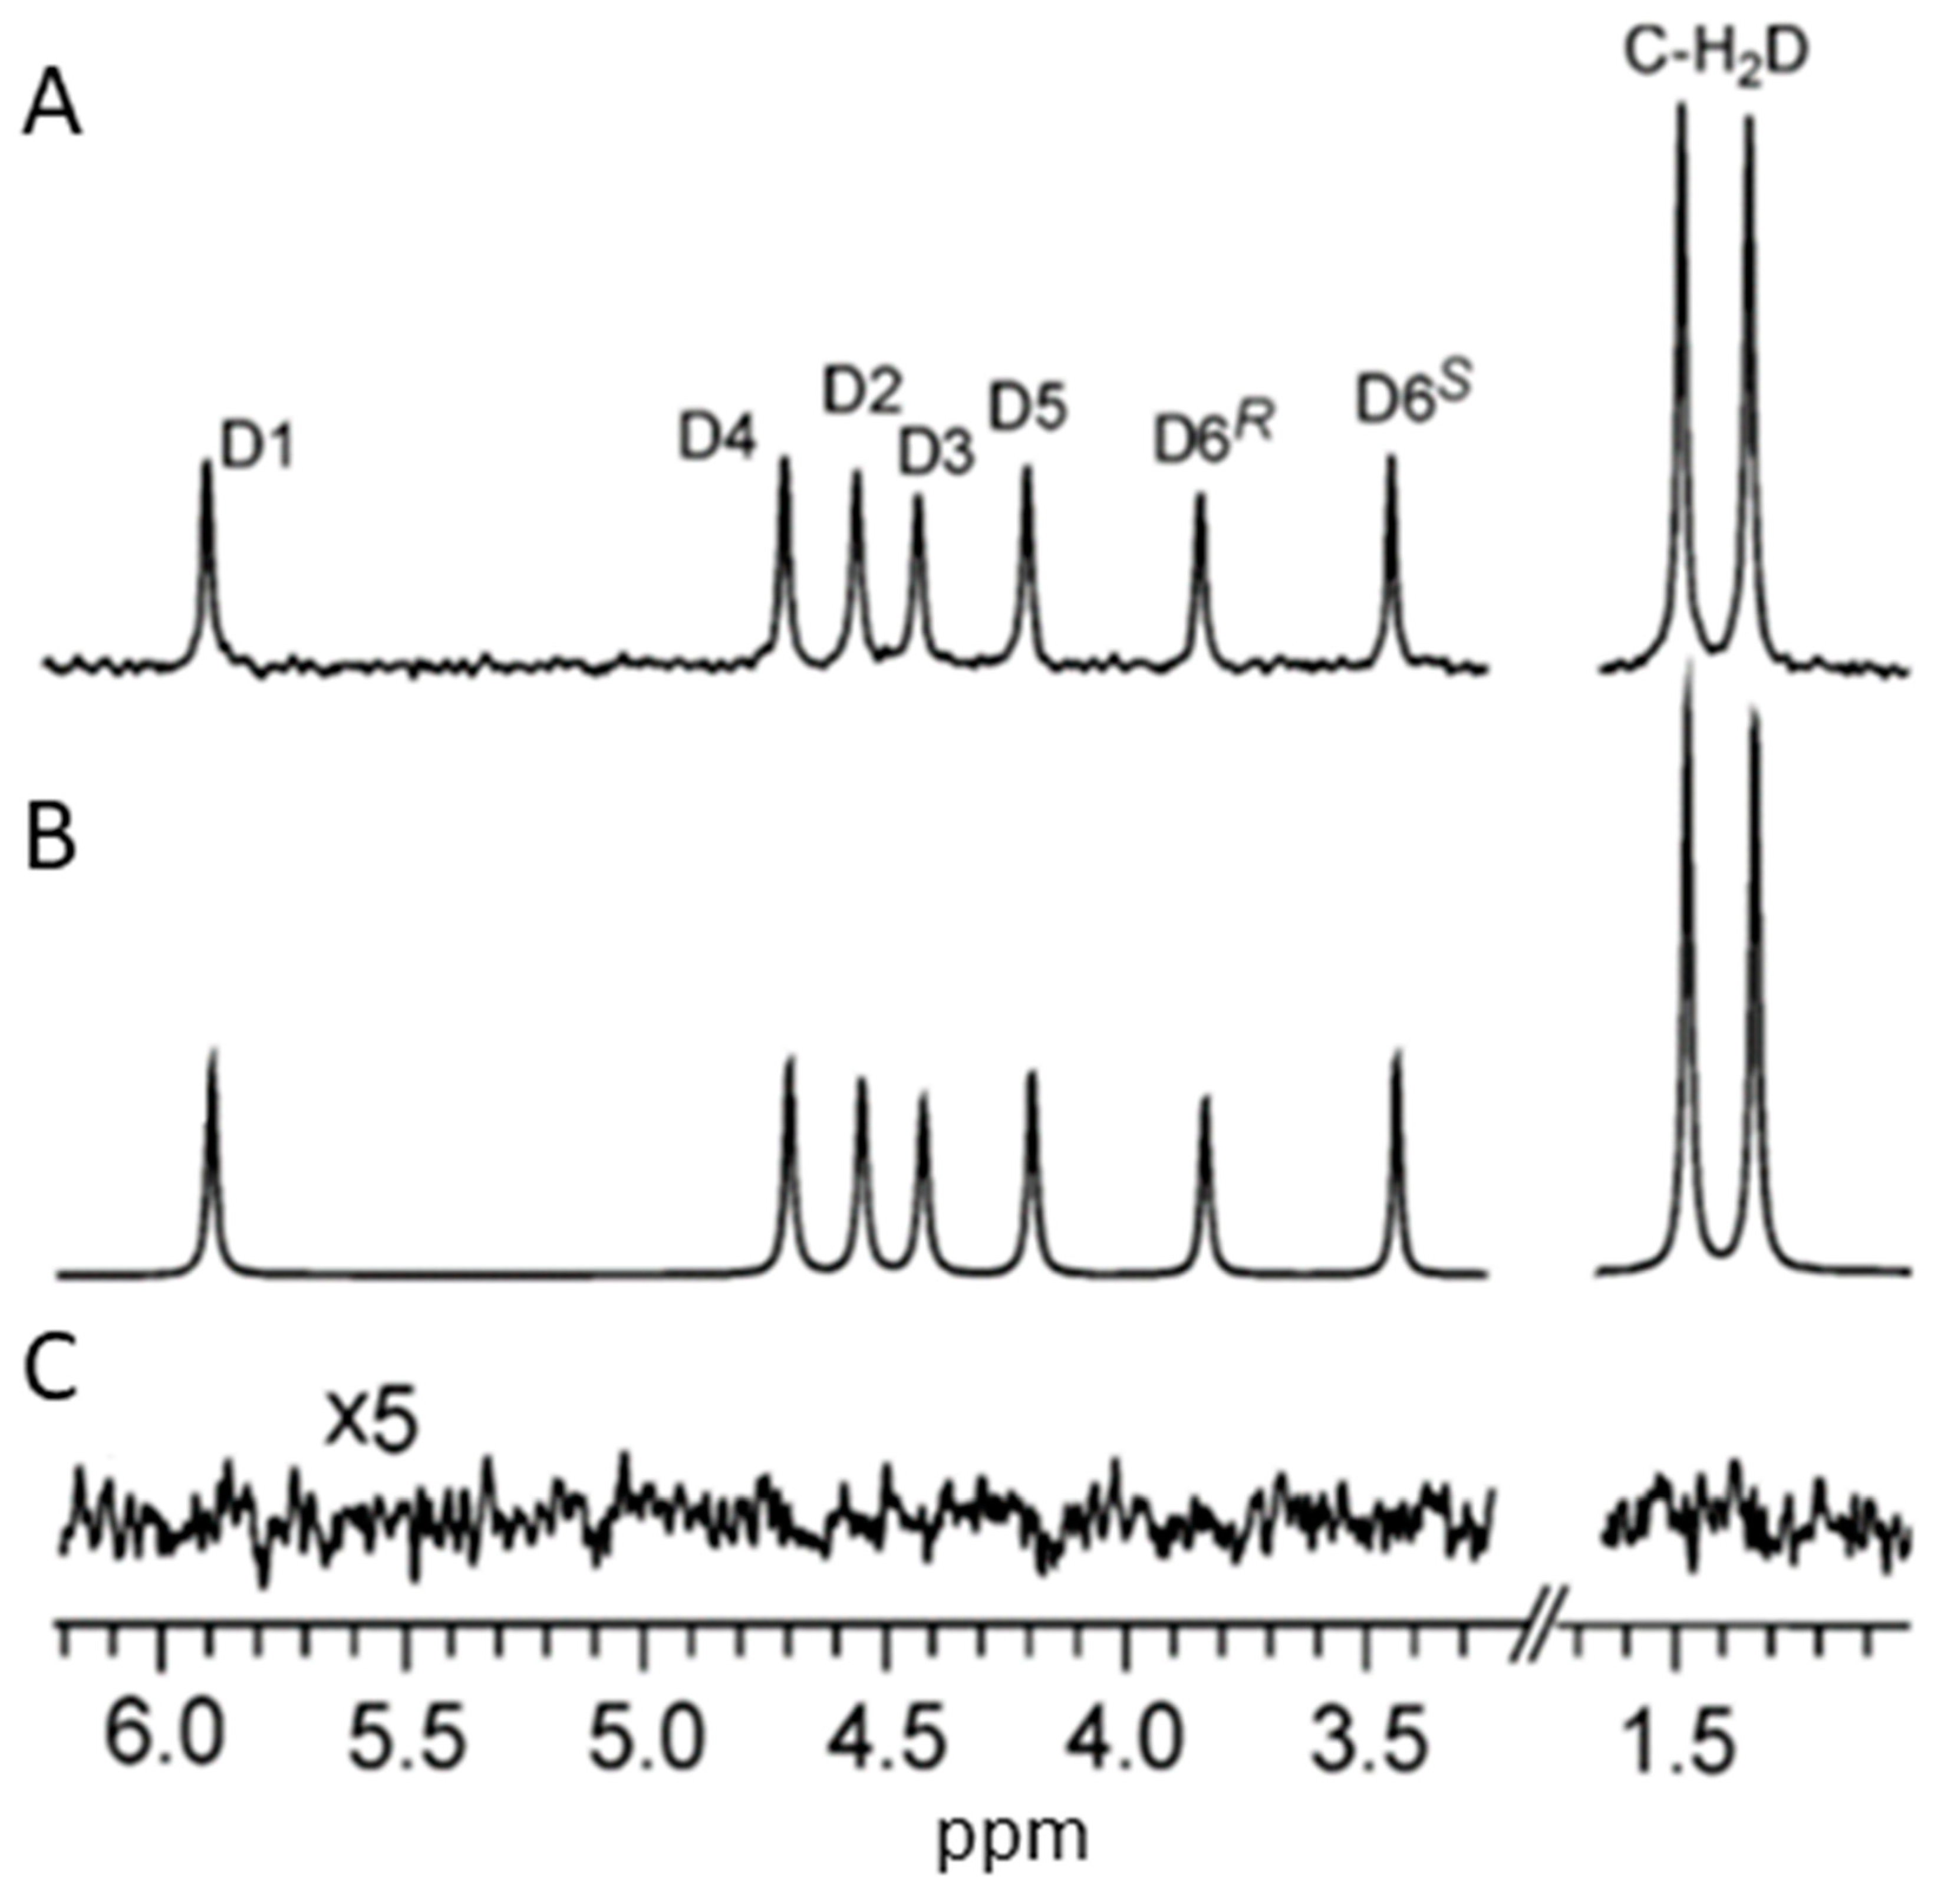

Table 1.
Frequency domain pre-processing choices in commonly used software products.
| TopSpin | SpinWorks | ACD/LABS | NMRPipe | rNMR | Mnova | Chenomx | |
| Phase error correction | ✓ | ✓ | ✓ | ✓ | ✓ | ✓ | ✓ |
| Baseline correction | ✓ | ✓ | ✓ | ✓ | ✓ | ✓ | ✓ |
| Solvent filtering | ✓ | ✓ | ✓ | ✓ | ✓ | ✓ | |
| Calibration and alignment |
✓ |
✓ |
✓ |
✓ |
✓ |
✓ |
✓ |
| Reference deconvolution | ✓ | ✓ | |||||
| Binning/bucketing and peak picking |
✓ |
✓ |
✓ |
✓ |
✓ |
✓ |
✓ |
| Peak fitting/deconvolution and identification |
✓ |
✓ |
✓ |
✓ |
✓ |
✓ |
|
| Integration and quantification |
✓ |
✓ |
✓ |
✓ |
✓ |
✓ |
✓ |
| Normalization and transformation |
✓ |
✓ |
✓ |
✓ |
✓ |
✓ |
Table 2.
Pre-processing steps in the frequency domain.
| Pre-processing | Purpose | Possible problems | Our recommendations |
| a). Phase error correction | Remove phase errors. | There might still be some obvious phase errors left. | Use a linear mixed model or multiple models to catch specific phase errors for individual signals. Derive desired spectra from phase error-free magnitude and power spectra |
| b). Baseline correction | Reset baseline. | We should be very careful when we use baseline corrected spectra for quantification. | Do baseline correction in the time domain (removal DC offsets), correct phase errors well, and skip this step. |
| c). Solvent filtering | Remove distorted solvent peaks. | Remove the solvent peaks might influence neighbour peaks. |
Do EC correction and phase correction well. If this step has to be processed, be aware of its neighbours. |
| d). Calibration and alignment | Adjust ppm values for a whole spectrum (calibration) and align each peak across spectra (alignment). | Alignment might affect peak areas and quantification. | Do calibration but not alignment. |
| e). Reference deconvolution | Use a reference signal to remove lineshape distortion. | Peaks are not necessarily distorted in the same way. Multiplets might not be distorted the same way as peaks. | Skip this step. |
| f). Binning/ bucketing and peak picking | Reduce high dimensions. | Fixed width bins might not contain complete peak information and cannot be used for compound identification and quantification. | Recommend peak picking or intelligent binning. |
| g). Peak fitting/ deconvolution and compound identification | Deconvolute signals and identify compounds. | Libraries might not be comparable to experimental spectra. | Find standard spectra from libraries with the closest conditions to an experimental condition. |
| h). Integration and quantification | Summarize spectrum data with compound lists and their concentrations. | Lorentzian fitted lines are good for identification but not quantification since it causes bias concentration estimation and variance under-estimation | Estimate compound concentrations from non-fit data. |
| i). Normalization, and transformation | Make data comparable, or suitable to assumptions needed for statistical analysis. | Spectrum-wise normalization might remove true differences between samples. Location-wise normalization removes true differences between signals and might even enlarge noise to the same levels of true signals. Analysis based on transformed data might not be easy to be transformed back. | Except internal reference area based spectrum-wise normalization, all other methods are not for molecules’ quantification but for further statistical analysis. |
Disclaimer/Publisher’s Note: The statements, opinions and data contained in all publications are solely those of the individual author(s) and contributor(s) and not of MDPI and/or the editor(s). MDPI and/or the editor(s) disclaim responsibility for any injury to people or property resulting from any ideas, methods, instructions or products referred to in the content. |
© 2023 by the authors. Licensee MDPI, Basel, Switzerland. This article is an open access article distributed under the terms and conditions of the Creative Commons Attribution (CC BY) license (http://creativecommons.org/licenses/by/4.0/).
Copyright: This open access article is published under a Creative Commons CC BY 4.0 license, which permit the free download, distribution, and reuse, provided that the author and preprint are cited in any reuse.


