Submitted:
08 November 2023
Posted:
09 November 2023
You are already at the latest version
Abstract
Keywords:
1. Introduction
2. Materials and Methods
2.1. Measurement and Equipment
2.2. VSP Model
3. Results and Discussion
3.1. Vehicle Models
3.2. Testing of Hybrid and VSP Vehicle Models in RDE, NEDC and WLTC Driving Cycles
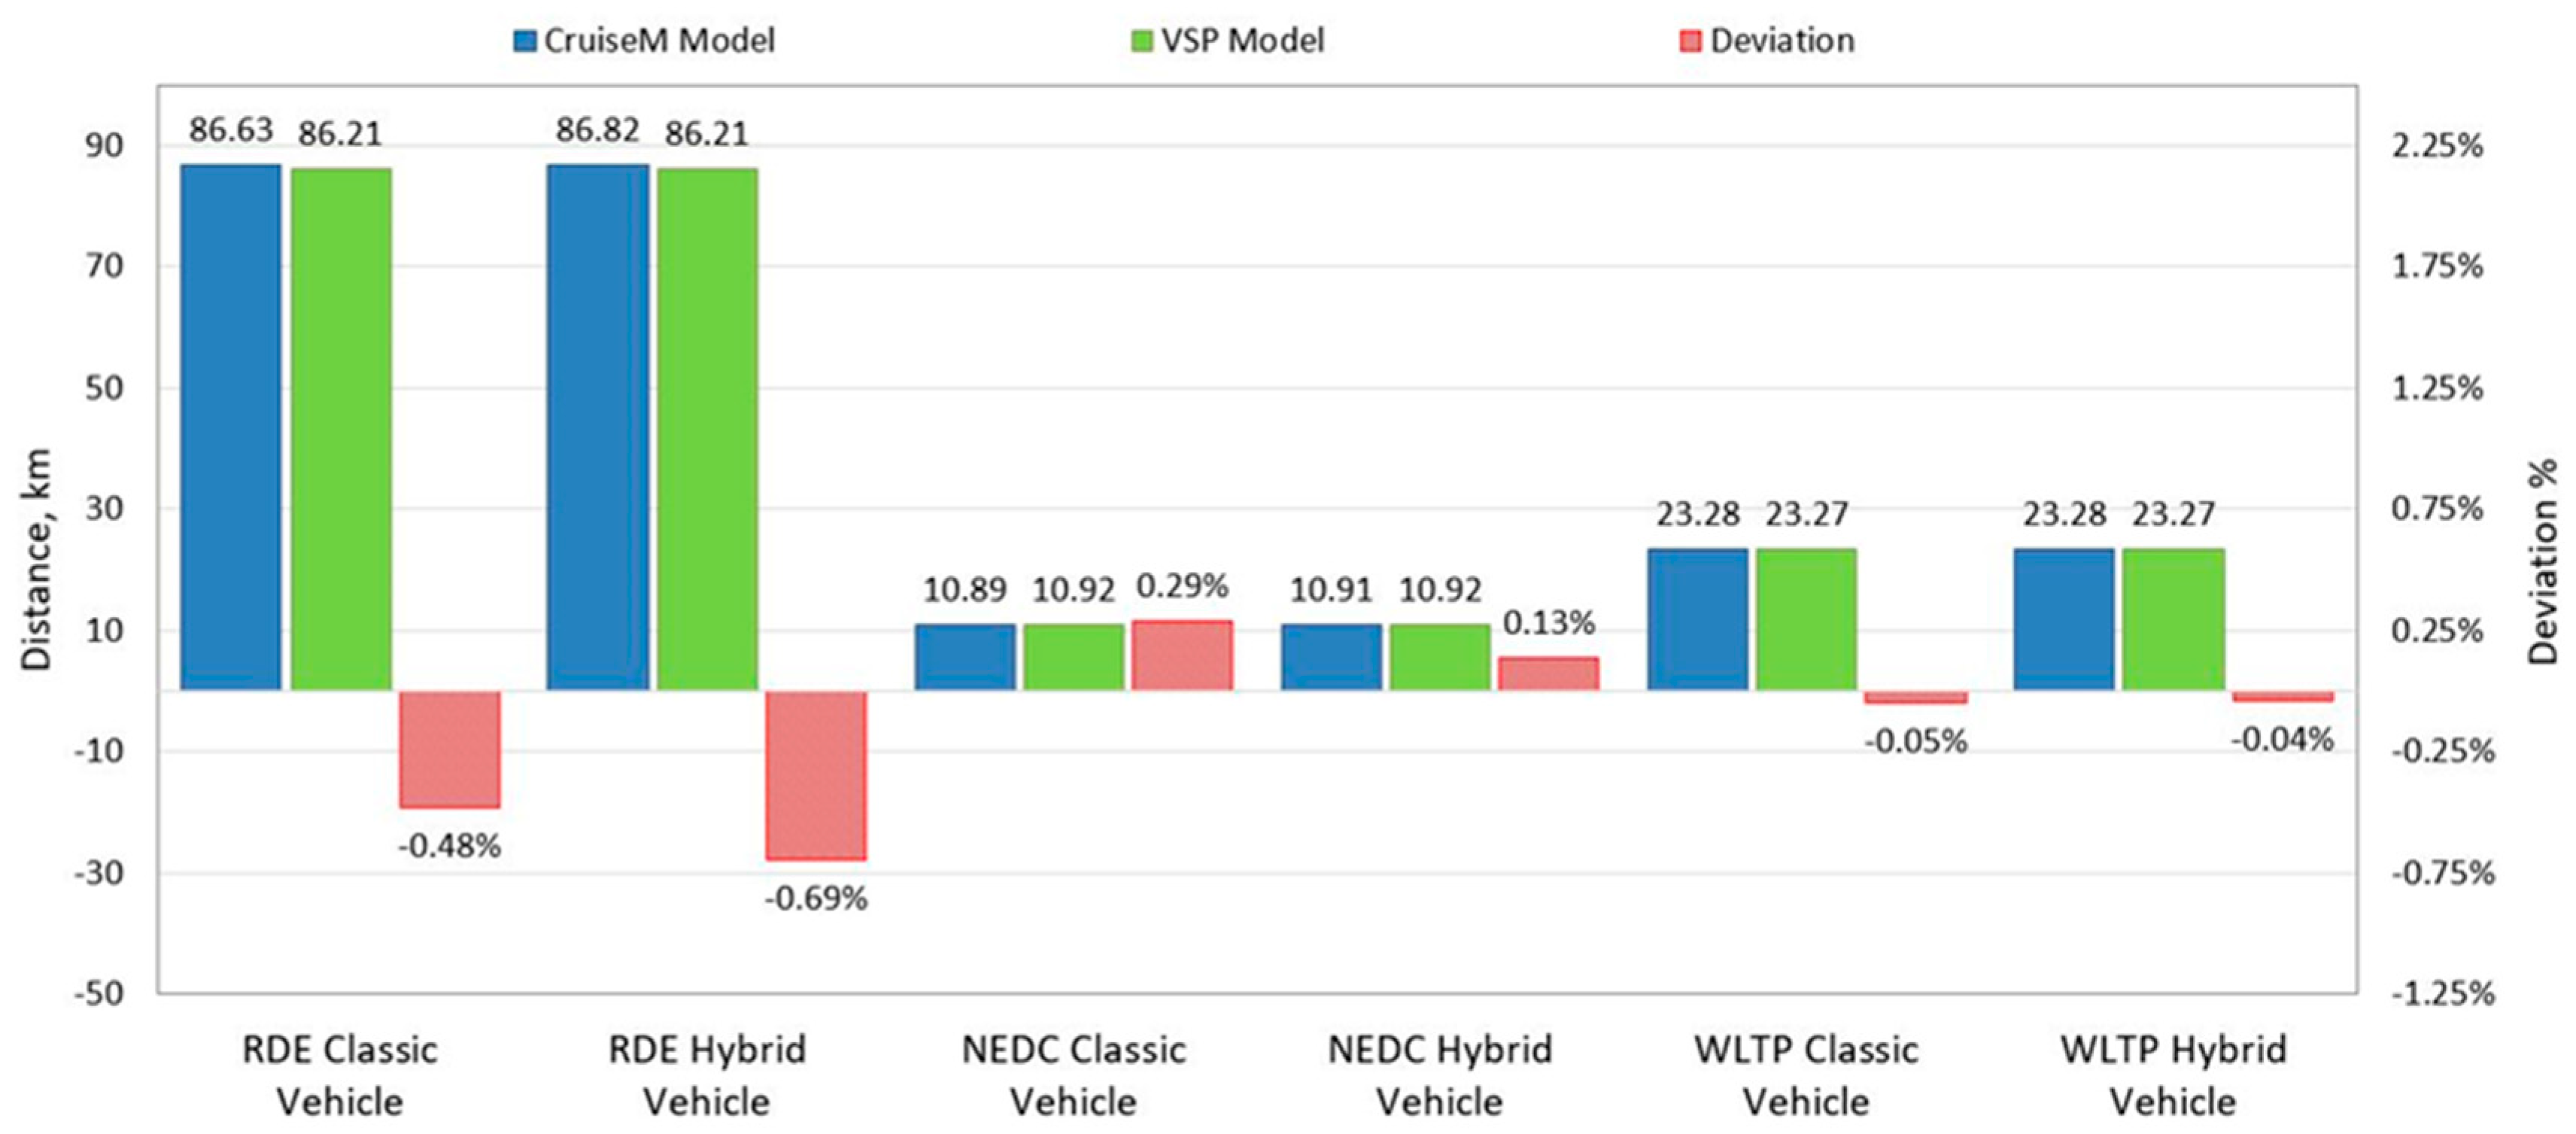
4. Conclusions
Author Contributions
Funding
Data Availability Statement
Acknowledgments
Conflicts of Interest
References
- E. P. News. "EU Ban on the Sale of New Petrol and Diesel Cars from 2035 Explained." https://www.europarl.europa.eu/news/en/headlines/economy/20221019STO44572/eu-ban-on-sale-of-new-petrol-and-diesel-cars-from-2035-explained (accessed 26. August 2023).
- B. Mali, A. Shrestha, A. Chapagain, R. Bishwokarma, P. Kumar, and F. Gonzalez-Longatt, "Challenges in the penetration of electric vehicles in developing countries with a focus on Nepal," Renewable Energy Focus, vol. 40, pp. 1-12, 2022. [CrossRef]
- M. A. Ktistakis, J. Pavlovic, and G. Fontaras, "Sampling approaches for road vehicle fuel consumption monitoring," Report EUR, vol. 30420, 2021. [CrossRef]
- (2019). Regulation (EU) 2019/631 of the European Parliament and of the Council of 17 April 2019 setting CO2 emission performance standards for new passenger cars and for new light commercial vehicles, and repealing Regulations (EC) No 443/2009 and (EU) No 510/2011. [Online] Available: http://data.europa.eu/eli/reg/2019/631/oj.
- T. Takaishi, A. Numata, R. Nakano, and K. Sakaguchi, "Approach to High Efficiency Diesel and Gas Engines," 2008.
- I. Pielecha, W. Cieślik, and A. Szałek, "Energy recovery potential through regenerative braking for a hybrid electric vehicle in a urban conditions," in IOP Conference Series: Earth and Environmental Science, 2019, vol. 214, no. 1: IOP Publishing, p. 012013. [CrossRef]
- 7. "Driving into 2025: The Future of Electric Vehicles." J.P. Morgan. (accessed 25 May, 2022).
- A. Kozina, G. Radica, and S. Nižetić, "Analysis of methods towards reduction of harmful pollutants from diesel engines," Journal of Cleaner Production, vol. 262, p. 121105, 2020. [CrossRef]
- S. Reshma, E. R. Samuel, and A. Unnikrishnan, "A Review of various internal combustion engine and electric propulsion in hybrid electric vehicles," in 2019 2nd International Conference on Intelligent Computing, Instrumentation and Control Technologies (ICICICT), 2019, vol. 1: IEEE, pp. 316-321. [CrossRef]
- S. S. Ravi, J. Mazumder, J. Sun, C. Brace, and J. W. Turner, "Techno-Economic assessment of synthetic E-Fuels derived from atmospheric CO2 and green hydrogen," Energy Conversion and Management, vol. 291, p. 117271, 2023. [CrossRef]
- A. Vučetić et al., "Real Driving Emission from Vehicle Fuelled by Petrol and Liquefied Petroleum Gas (LPG)," Cognitive Sustainability, vol. 1, no. 4, 2022. [CrossRef]
- U. K. Medževeprytė, R. Makaras, V. Lukoševičius, and S. Kilikevičius, "Application and Efficiency of a Series-Hybrid Drive for Agricultural Use Based on a Modified Version of the World Harmonized Transient Cycle," Energies, vol. 16, no. 14, p. 5379, 2023. [CrossRef]
- S. Schulze, G. Feyerl, and S. Pischinger, "Advanced ECMS for hybrid electric heavy-duty trucks with predictive battery discharge and adaptive operating strategy under real driving conditions," Energies, vol. 16, no. 13, p. 5171, 2023. [CrossRef]
- A. Kampker, C. Offermanns, H. Heimes, and P. Bi, "Meta-analysis on the Market Development of Electrified Vehicles," ATZ worldwide, vol. 123, no. 7, pp. 58-63, 2021. [CrossRef]
- M. Sabri, K. A. Danapalasingam, and M. F. Rahmat, "A review on hybrid electric vehicles architecture and energy management strategies," Renewable and Sustainable Energy Reviews, vol. 53, pp. 1433-1442, 2016. [CrossRef]
- K. Ç. Bayindir, M. A. Gözüküçük, and A. Teke, "A comprehensive overview of hybrid electric vehicle: Powertrain configurations, powertrain control techniques and electronic control units," Energy conversion and Management, vol. 52, no. 2, pp. 1305-1313, 2011. [CrossRef]
- P. Zhang, F. Yan, and C. Du, "A comprehensive analysis of energy management strategies for hybrid electric vehicles based on bibliometrics," Renewable and Sustainable Energy Reviews, vol. 48, pp. 88-104, 2015. [CrossRef]
- F. R. Salmasi, "Control strategies for hybrid electric vehicles: Evolution, classification, comparison, and future trends," IEEE Transactions on vehicular technology, vol. 56, no. 5, pp. 2393-2404, 2007. [CrossRef]
- A. M. Ali and D. Söffker, "Towards optimal power management of hybrid electric vehicles in real-time: A review on methods, challenges, and state-of-the-art solutions," Energies, vol. 11, no. 3, p. 476, 2018. [CrossRef]
- W. Liu, Introduction to hybrid vehicle system modeling and control. John Wiley & Sons, 2013.
- W. Enang and C. Bannister, "Modelling and control of hybrid electric vehicles (A comprehensive review)," Renewable and Sustainable Energy Reviews, vol. 74, pp. 1210-1239, 2017. [CrossRef]
- C. C. Chan, A. Bouscayrol, and K. Chen, "Electric, hybrid, and fuel-cell vehicles: Architectures and modeling," IEEE transactions on vehicular technology, vol. 59, no. 2, pp. 589-598, 2009. [CrossRef]
- S. Onori, L. Serrao, and G. Rizzoni, "Hybrid electric vehicles: Energy management strategies," 2016. [CrossRef]
- D.-D. Tran, M. Vafaeipour, M. El Baghdadi, R. Barrero, J. Van Mierlo, and O. Hegazy, "Thorough state-of-the-art analysis of electric and hybrid vehicle powertrains: Topologies and integrated energy management strategies," Renewable and Sustainable Energy Reviews, vol. 119, p. 109596, 2020. [CrossRef]
- I. Preda, D. Covaciu, and G. Ciolan, "Coast down test–theoretical and experimental approach," 2010.
- F. Zhang, L. Wang, S. Coskun, H. Pang, Y. Cui, and J. Xi, "Energy management strategies for hybrid electric vehicles: Review, classification, comparison, and outlook," Energies, vol. 13, no. 13, p. 3352, 2020. [CrossRef]
- J. L. Jimenez-Palacios, "Understanding and quantifying motor vehicle emissions with vehicle specific power and TILDAS remote sensing," Massachusetts Institute of Technology, 1998.
- J. Lee and D. J. Nelson, "Rotating inertia impact on propulsion and regenerative braking for electric motor driven vehicles," in 2005 IEEE Vehicle Power and Propulsion Conference, 2005: IEEE, p. 7 pp. [CrossRef]
- (2016). COMMISSION REGULATION (EU) 2016/427; amending Regulation (EC) No 692/2008 as regards emissions from light passenger and commercial vehicles (Euro 6).
- A. Kozina, G. Radica, and S. Nižetić, "Hybrid Vehicles Emissions Assessment," in 2021 6th International Conference on Smart and Sustainable Technologies (SpliTech), 2021: IEEE, pp. 1-5. [CrossRef]

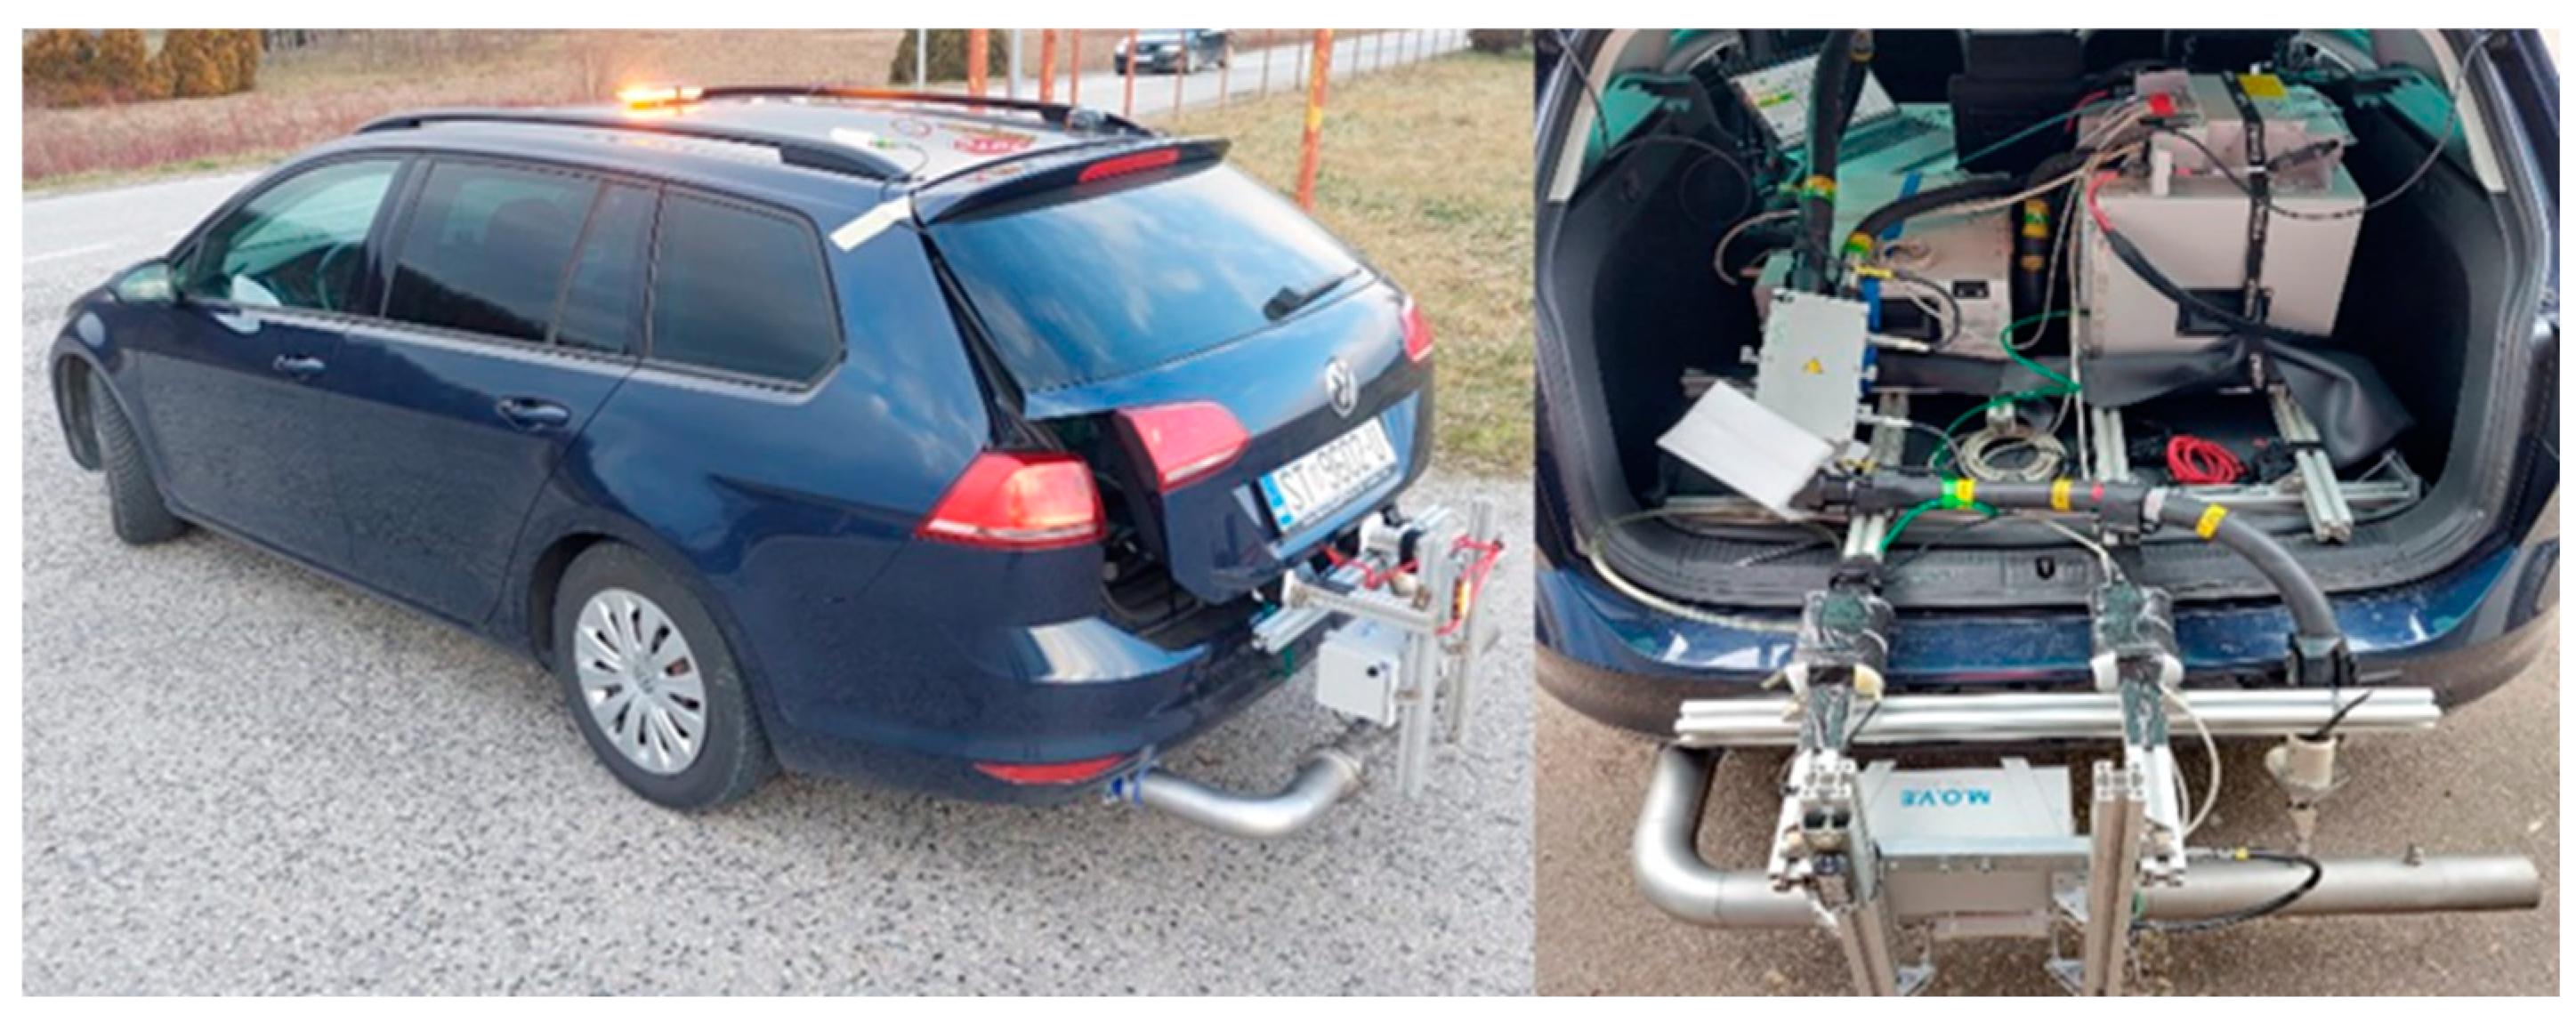
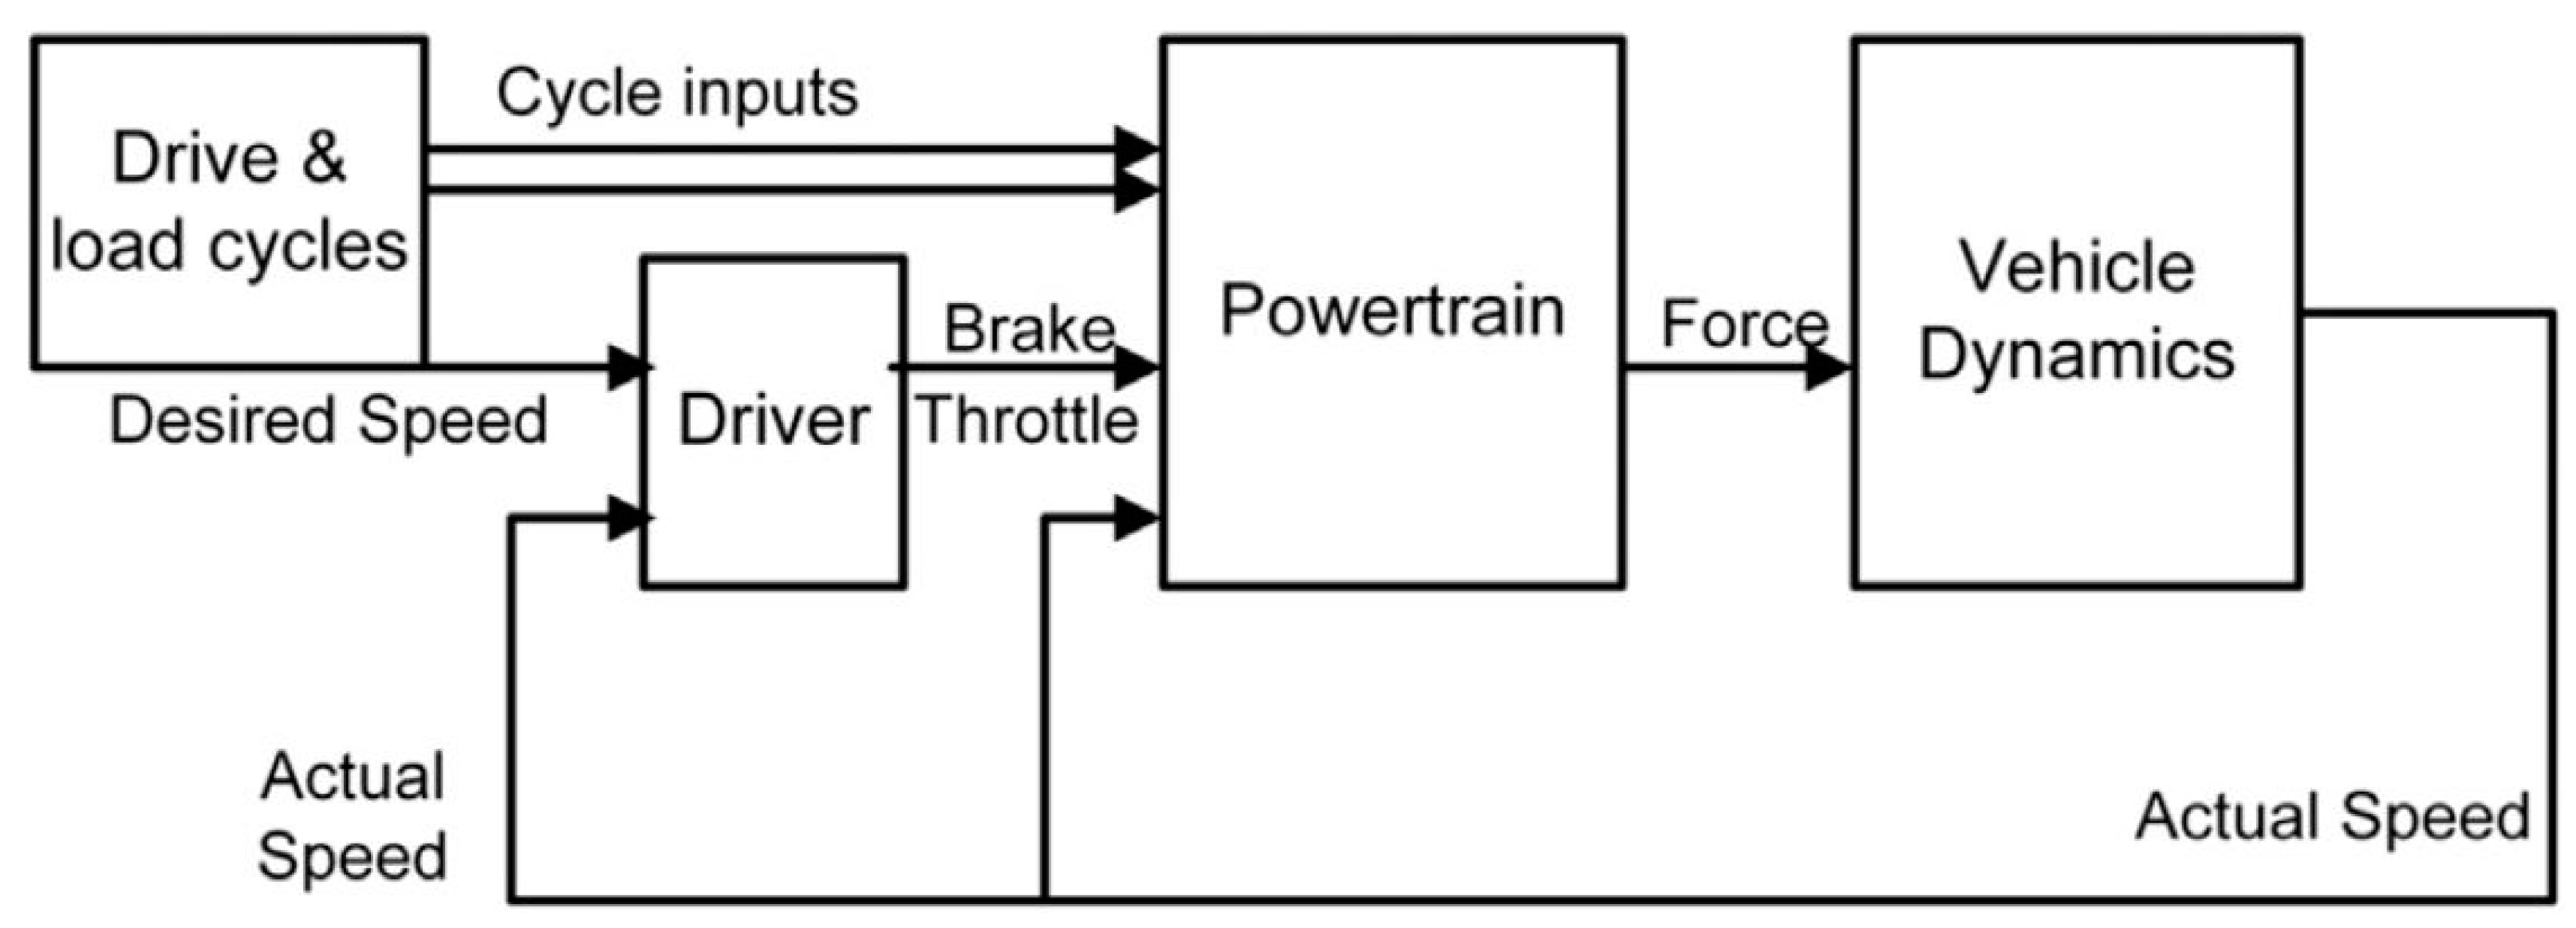
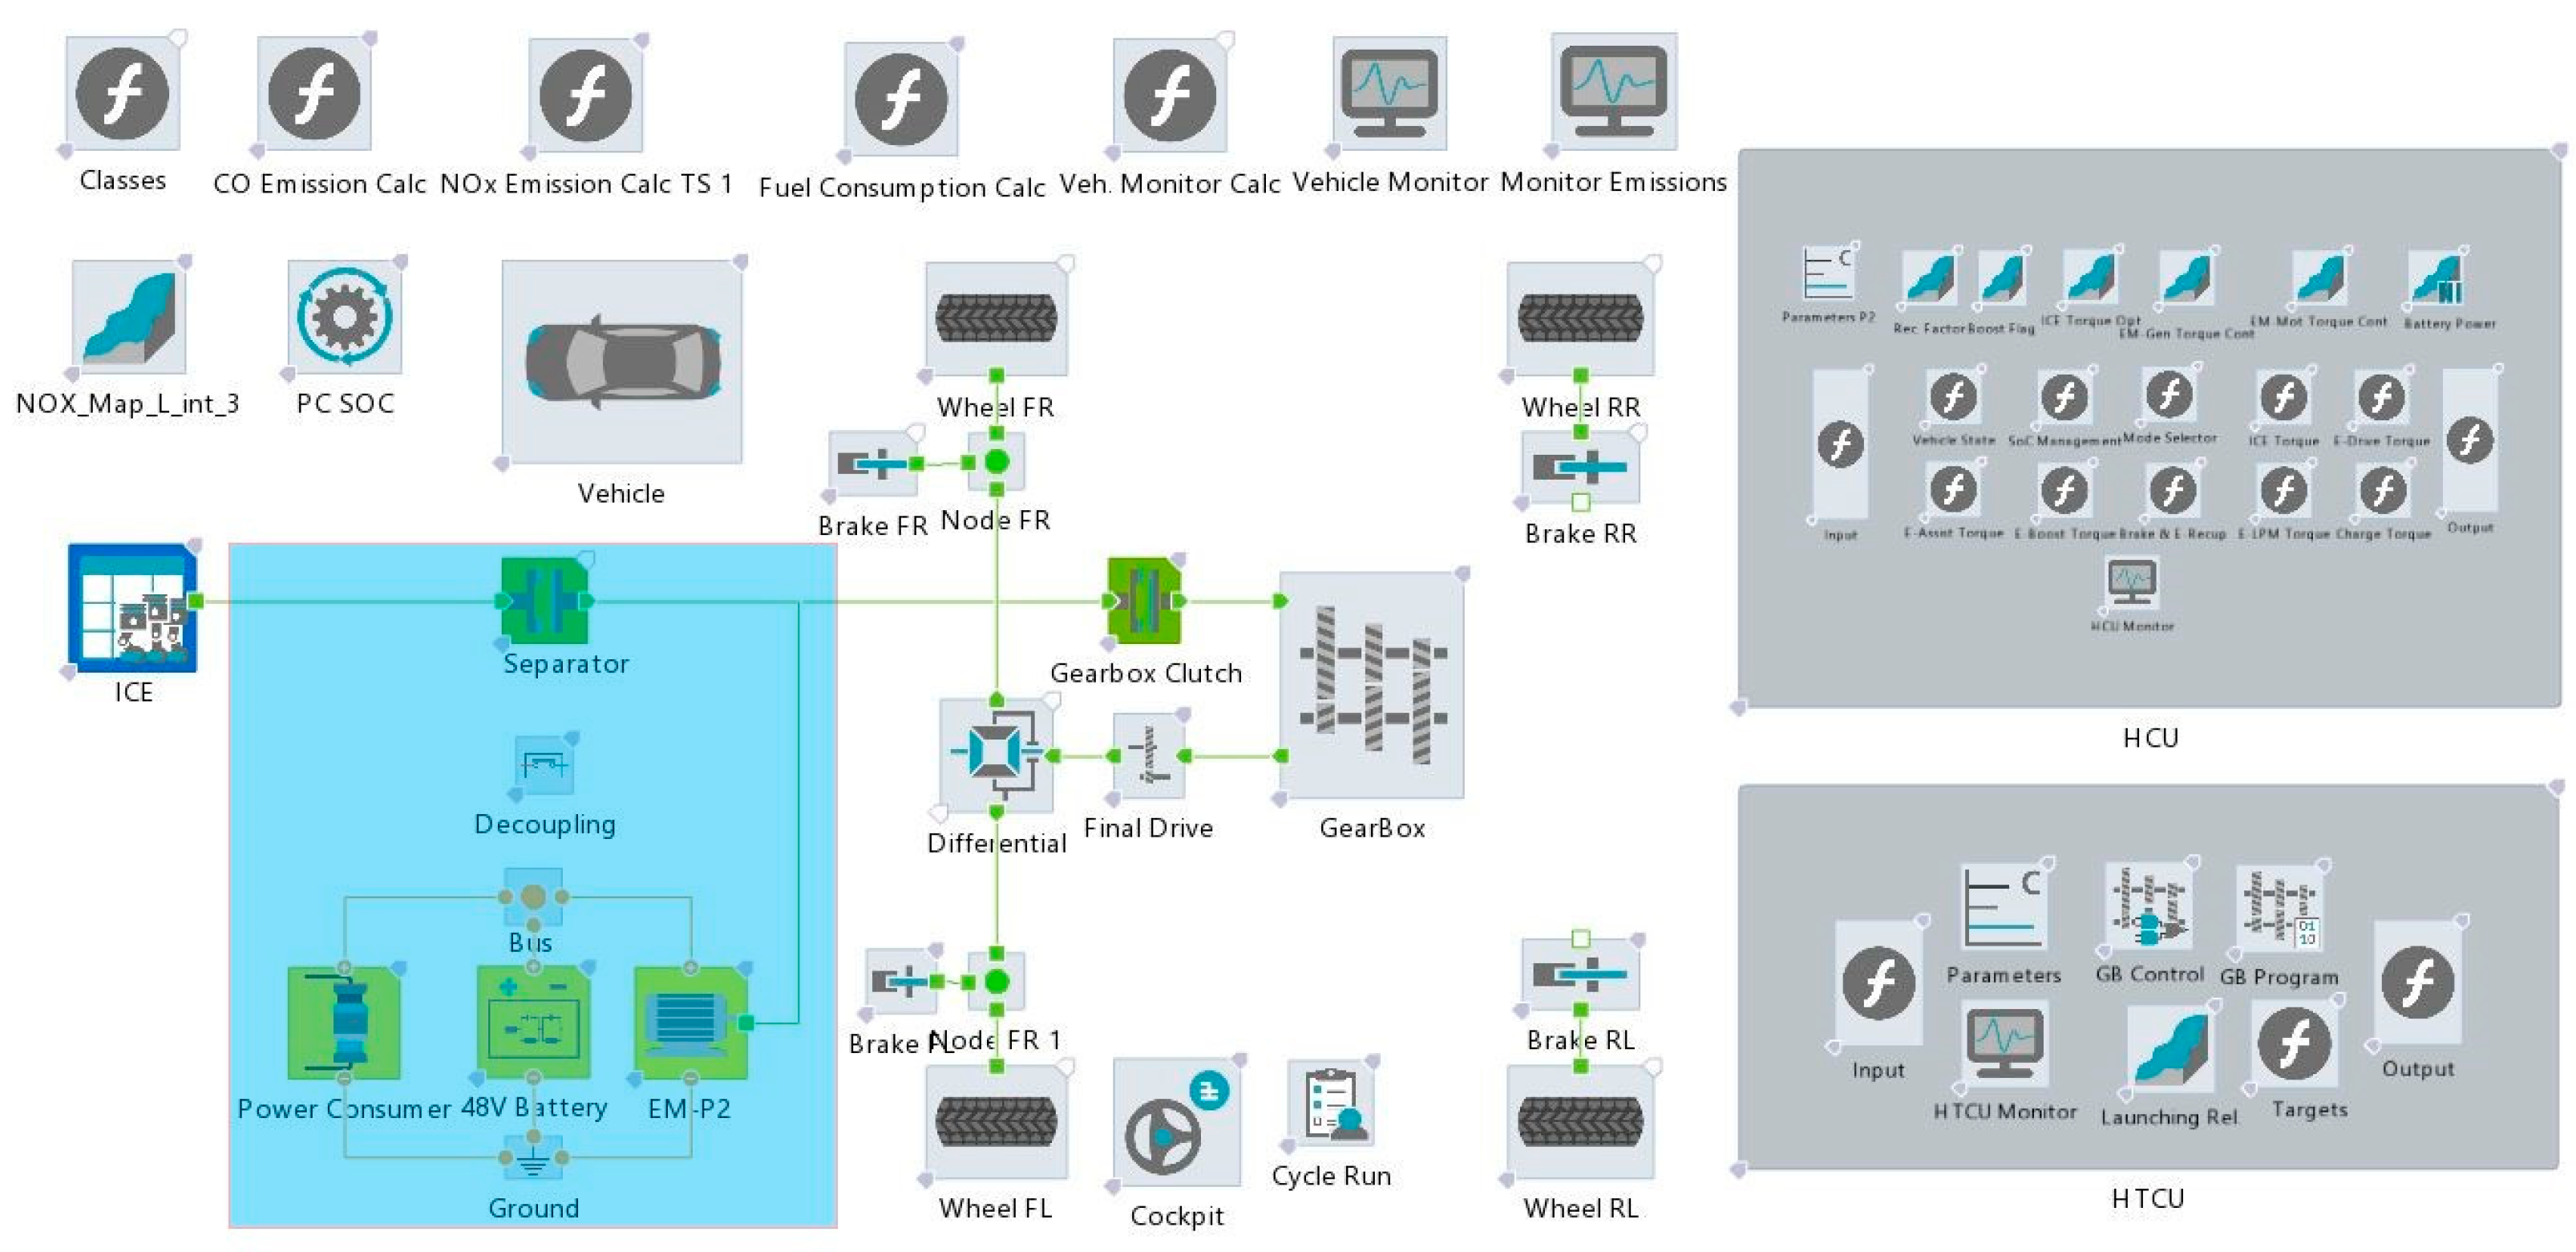

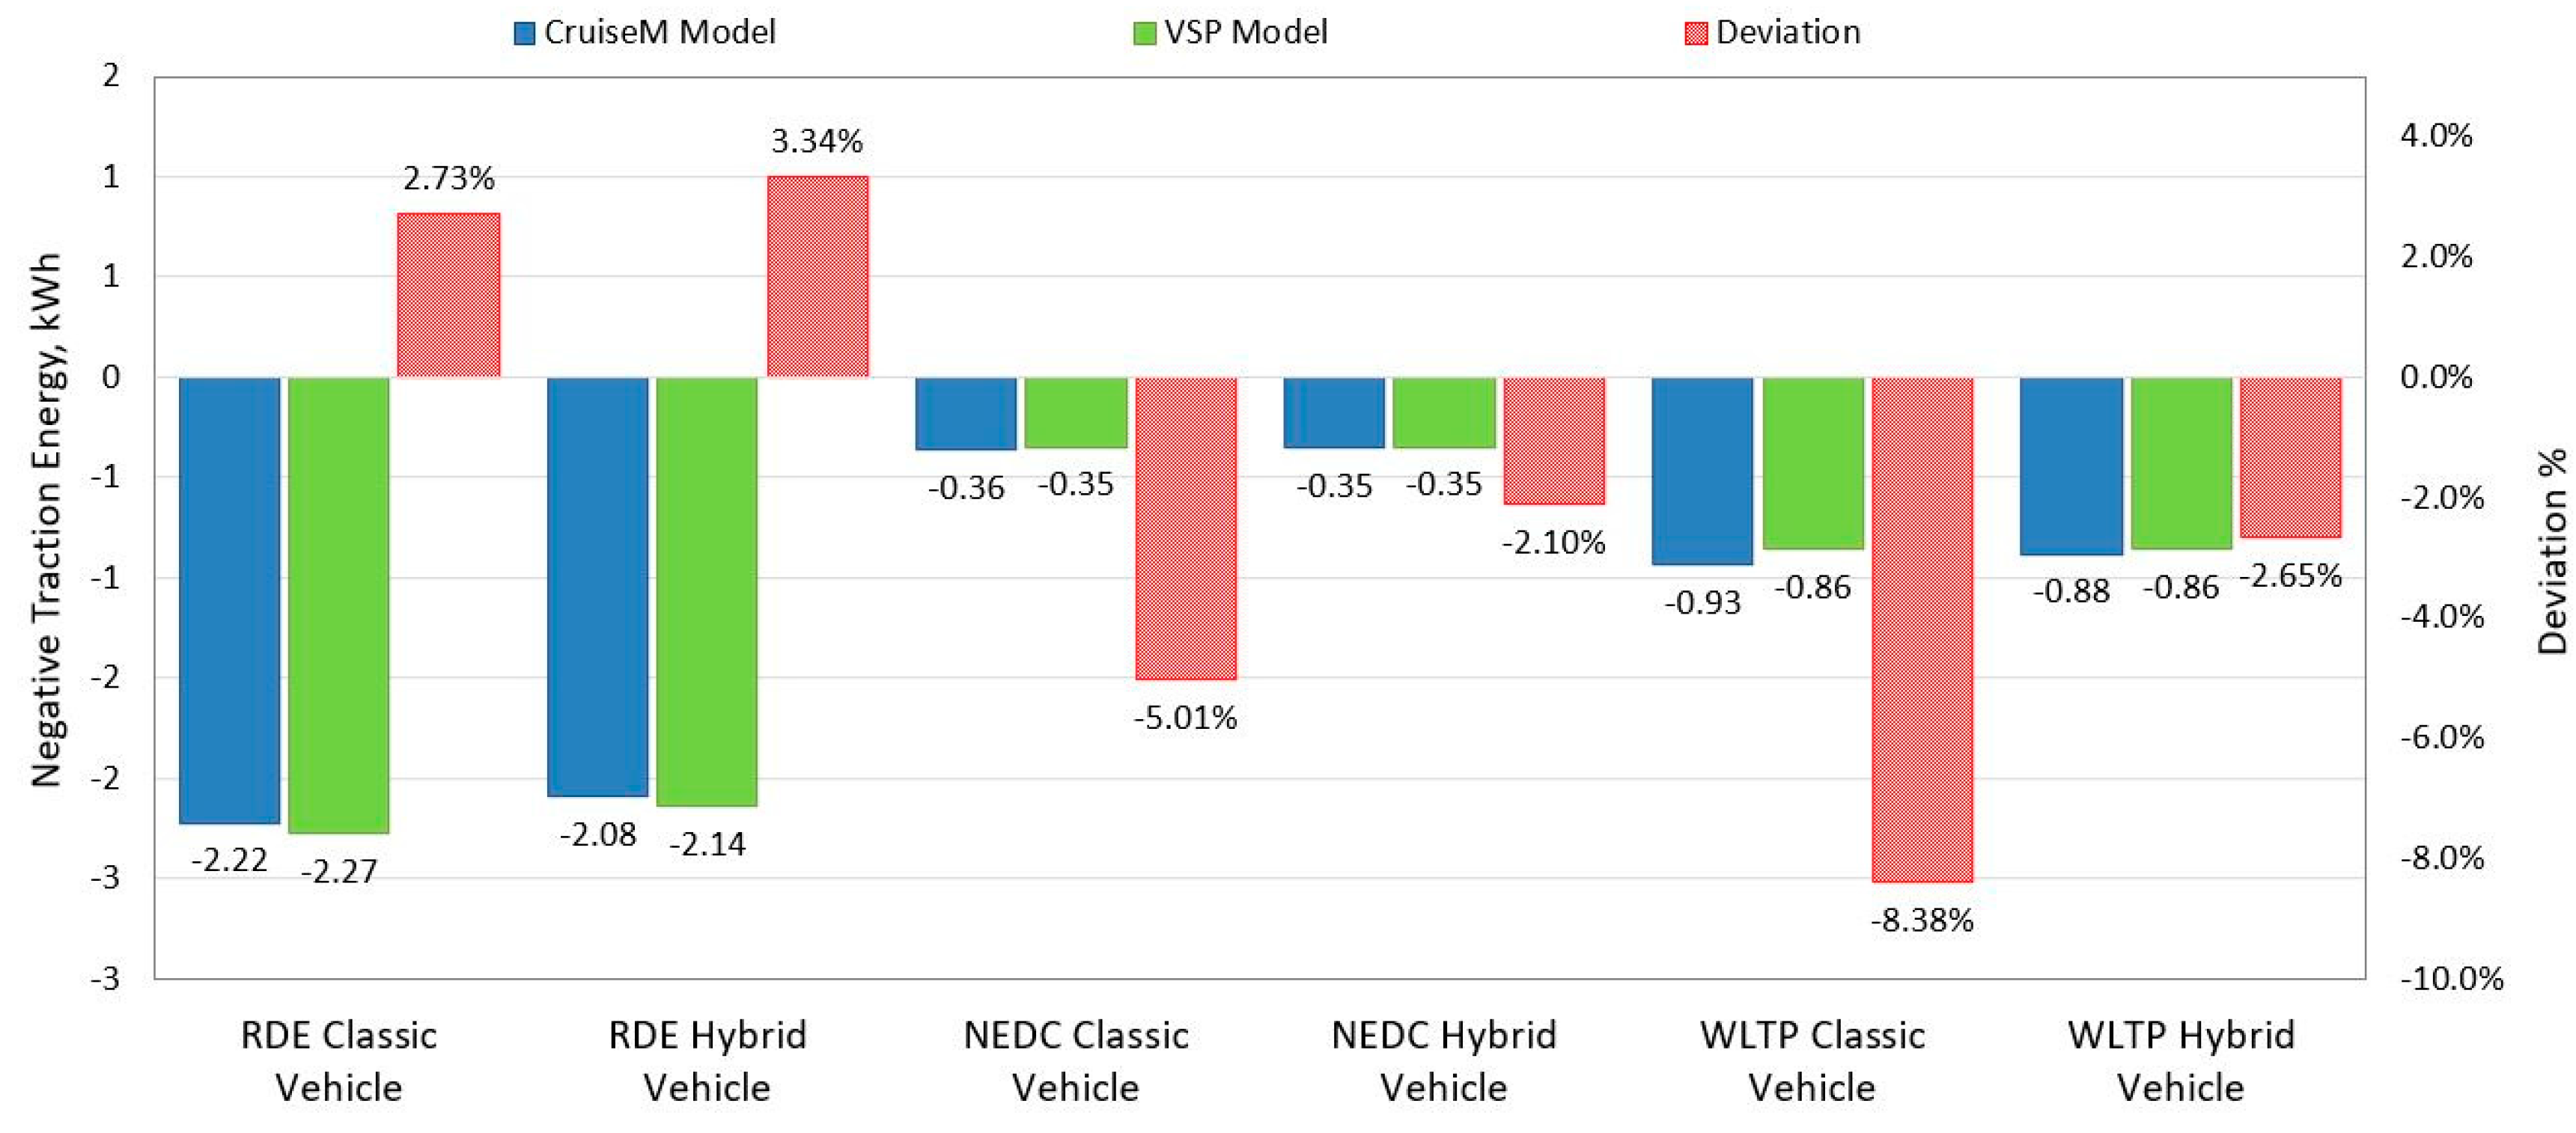
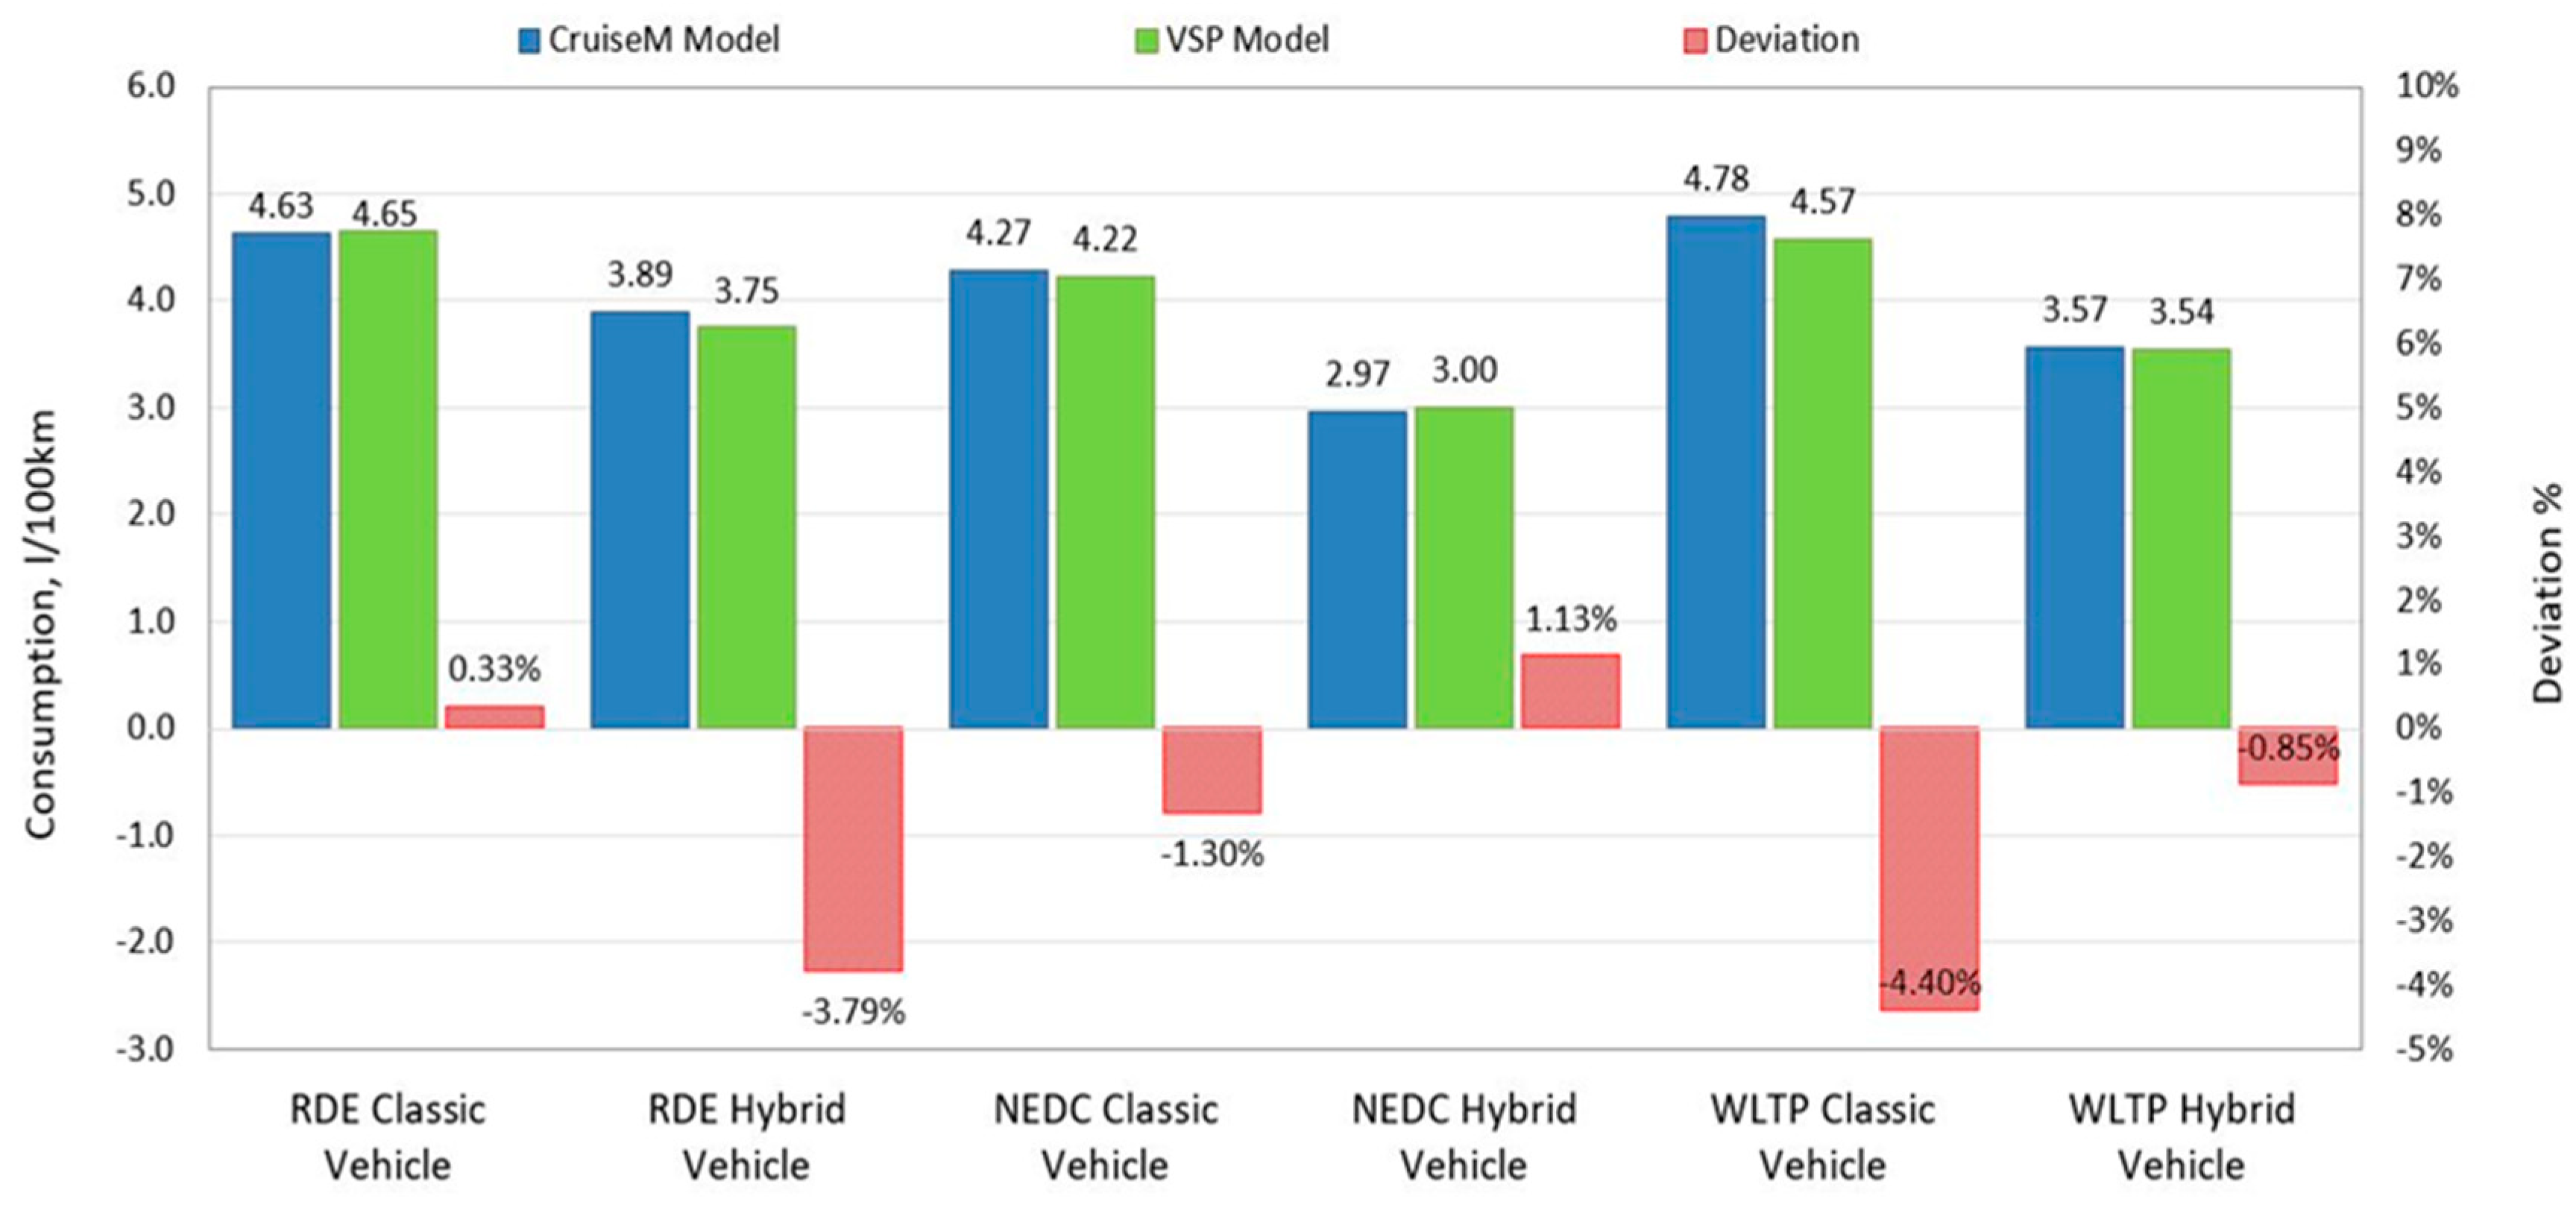
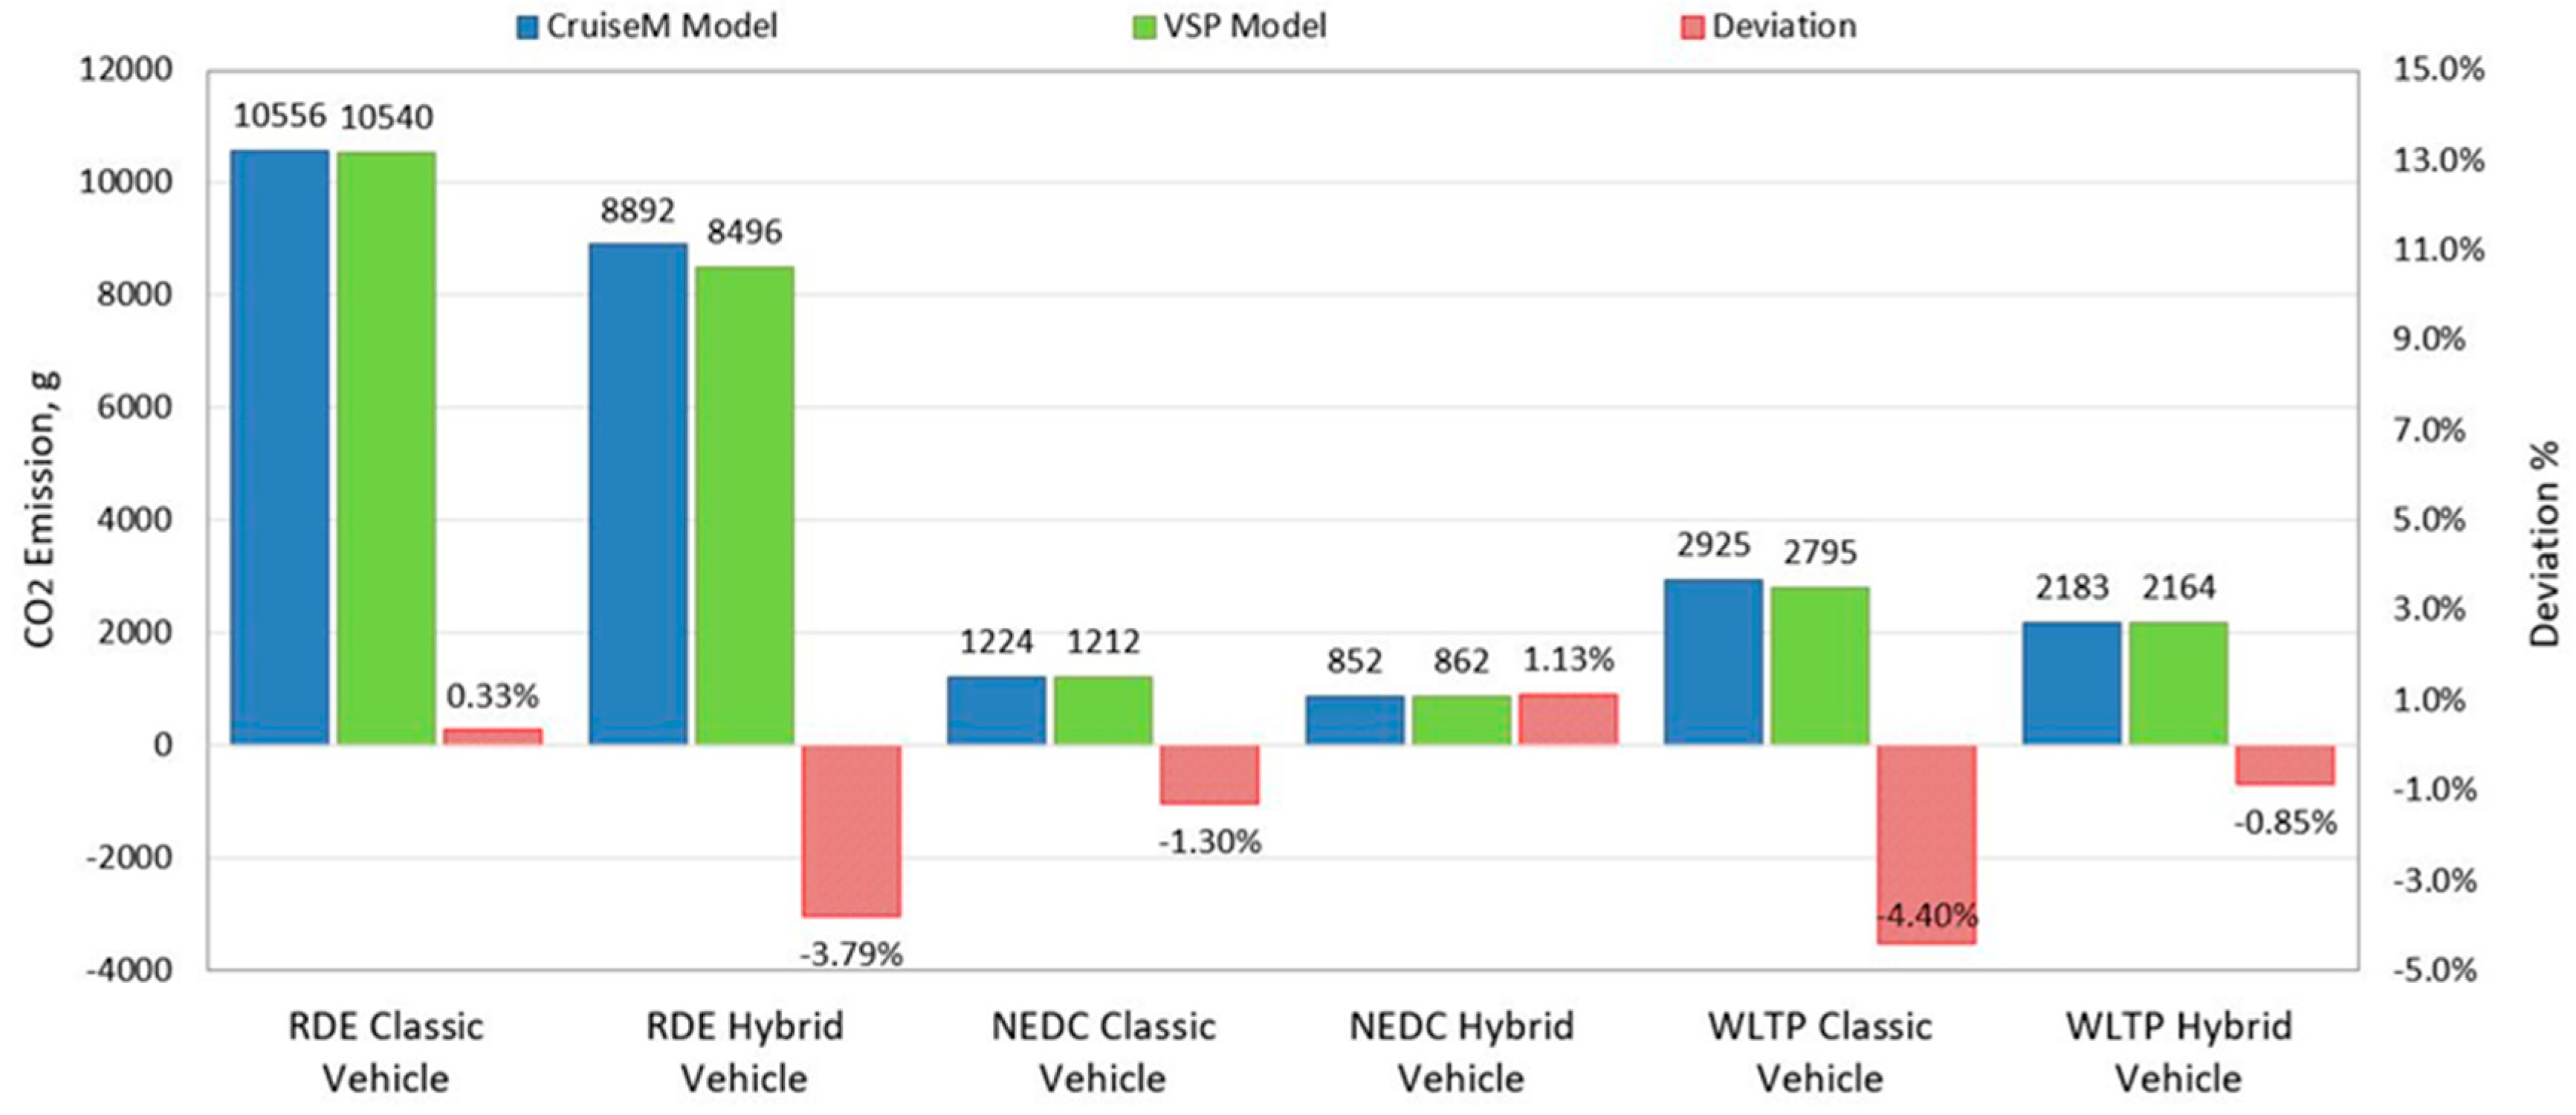
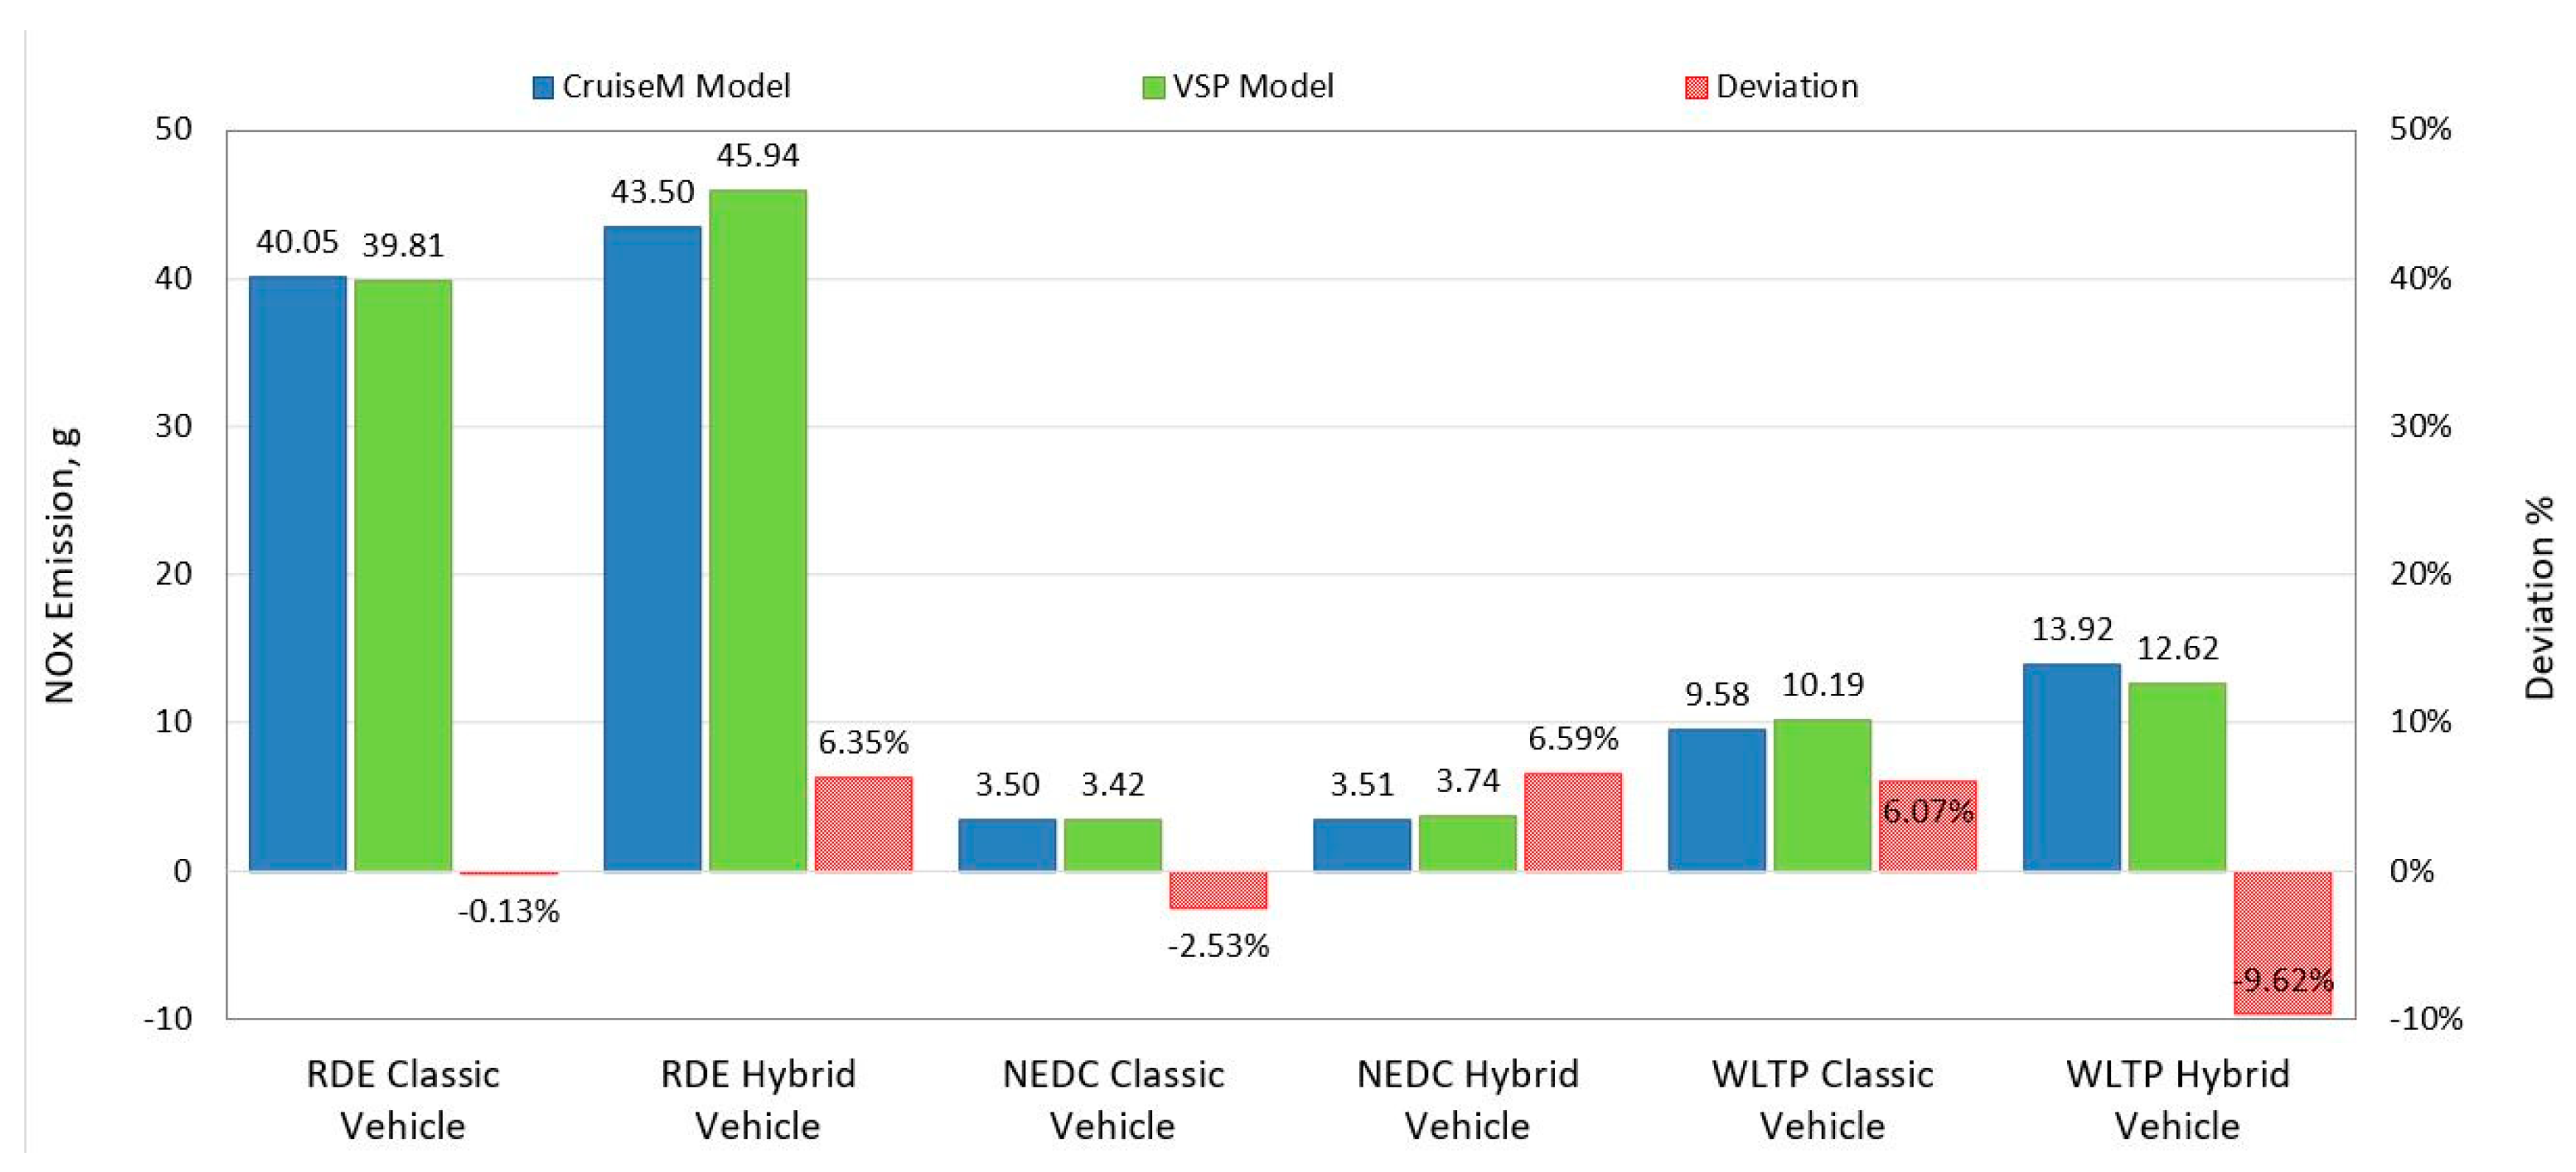
| Year of Production | Emission Norm | Engine Volume l | Max. Power kW/HP | Max. Engine Torque Nm | Anti pollution Systems | Fuel | Transmission | Weight kg |
|---|---|---|---|---|---|---|---|---|
| 2014 | Euro 6 | 1.6 | 77/105 | 250 | EGR, DOC, DPF | Diesel | Manual 5s | 1395 |
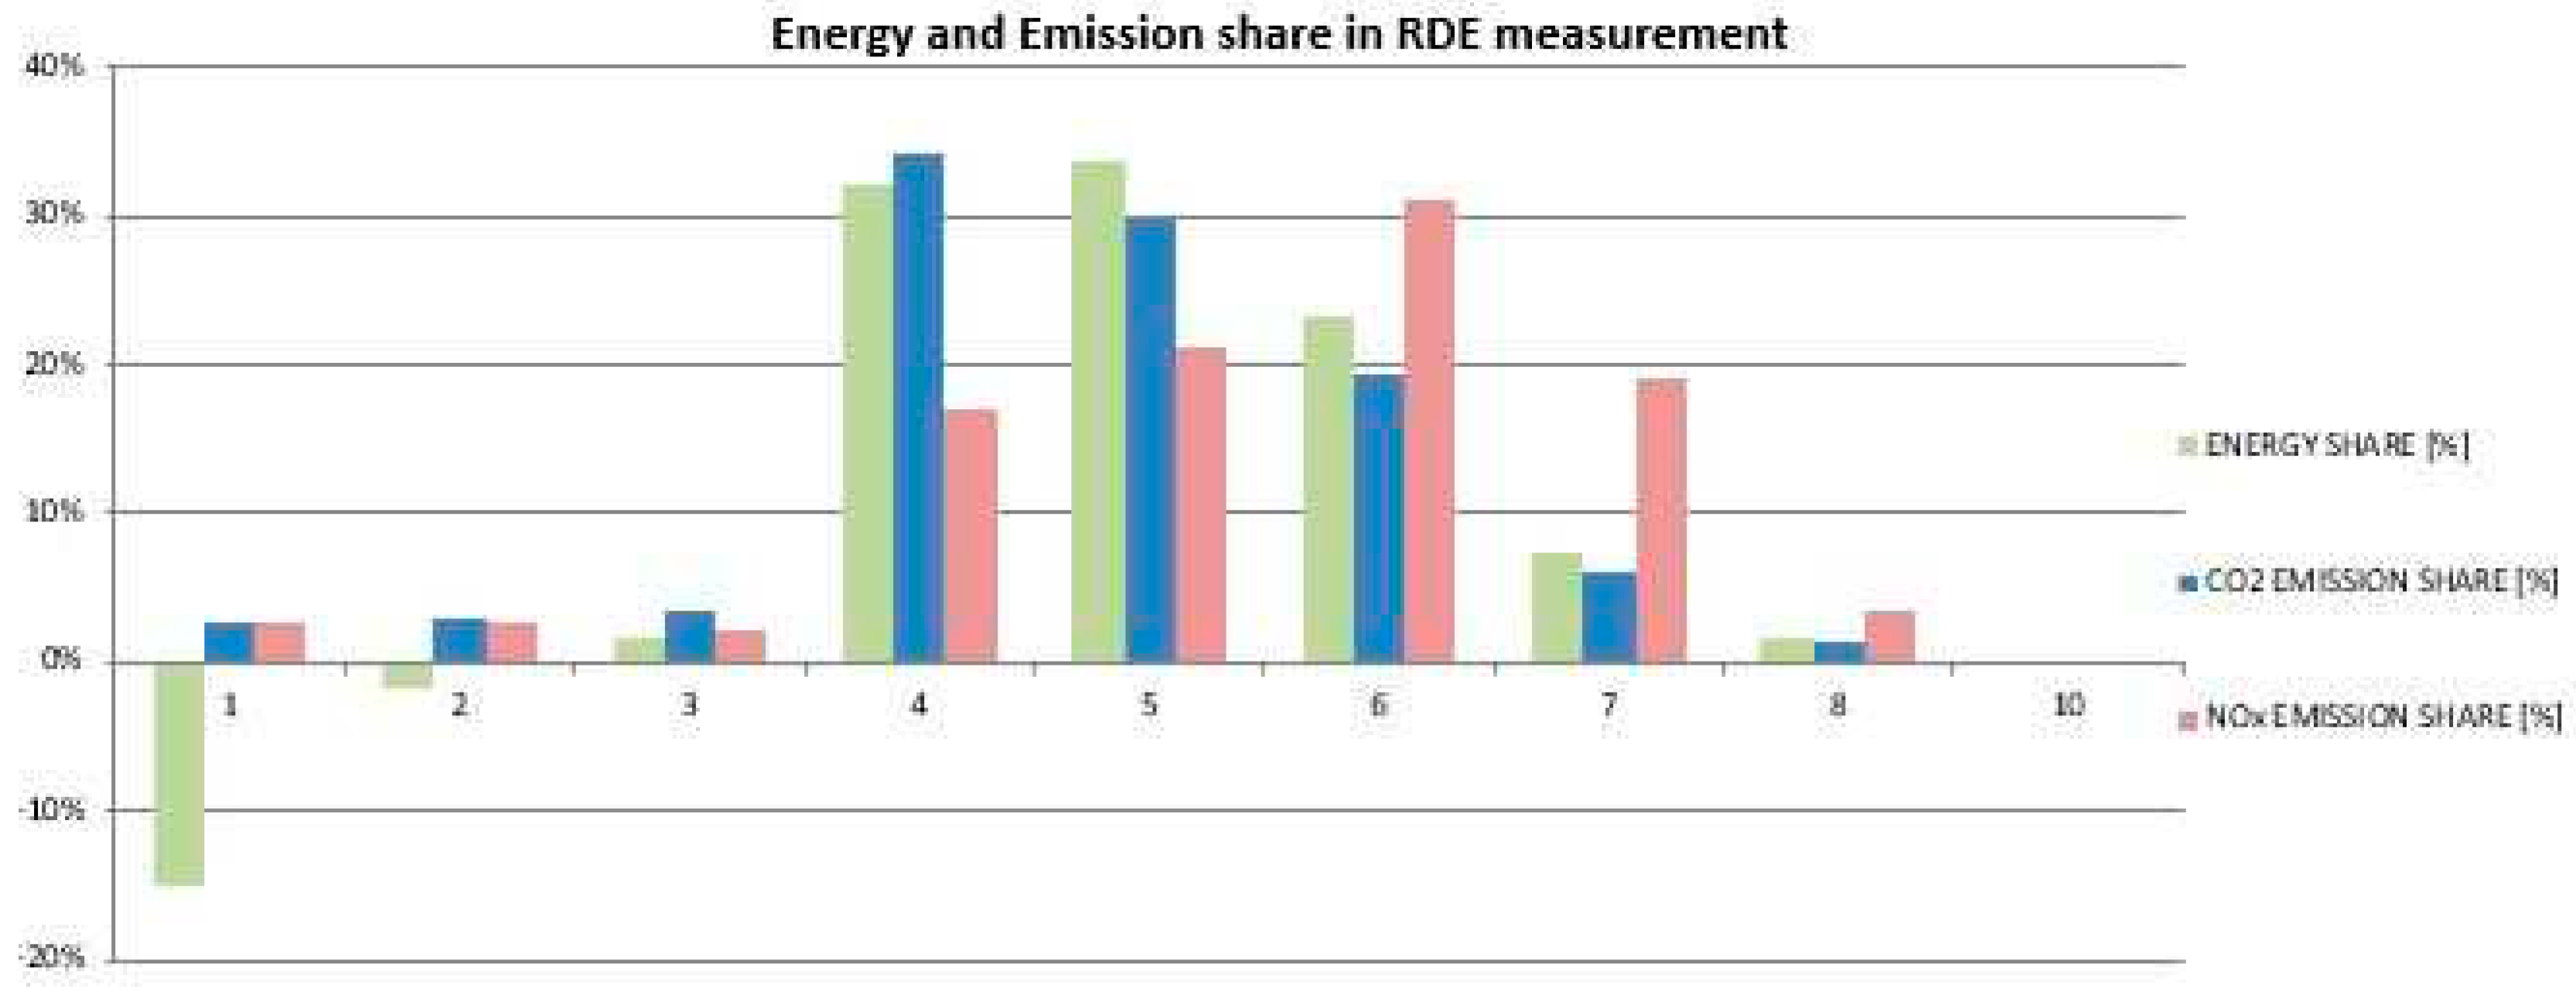
| Power class No | Pc,j [kW] from | Pc,j [kW] to |
|---|---|---|
| 1 | -∞ | -2.368 |
| 2 | -2.368 | 0.000 |
| 3 | 0.000 | 2.368 |
| 4 | 2.368 | 11.840 |
| 5 | 11.840 | 23.680 |
| 6 | 23.680 | 44.992 |
| 7 | 44.992 | 66.304 |
| 8 | 66.304 | ∞ |
| Clasic vehicle | RDE cycle | RDE [1/km] | Deviation | |||||||
|---|---|---|---|---|---|---|---|---|---|---|
| Measured | CruiseM | VSP | Measured | CruiseM | VSP | CruiseM | CruiseM [%] | VSP | VSP [%] | |
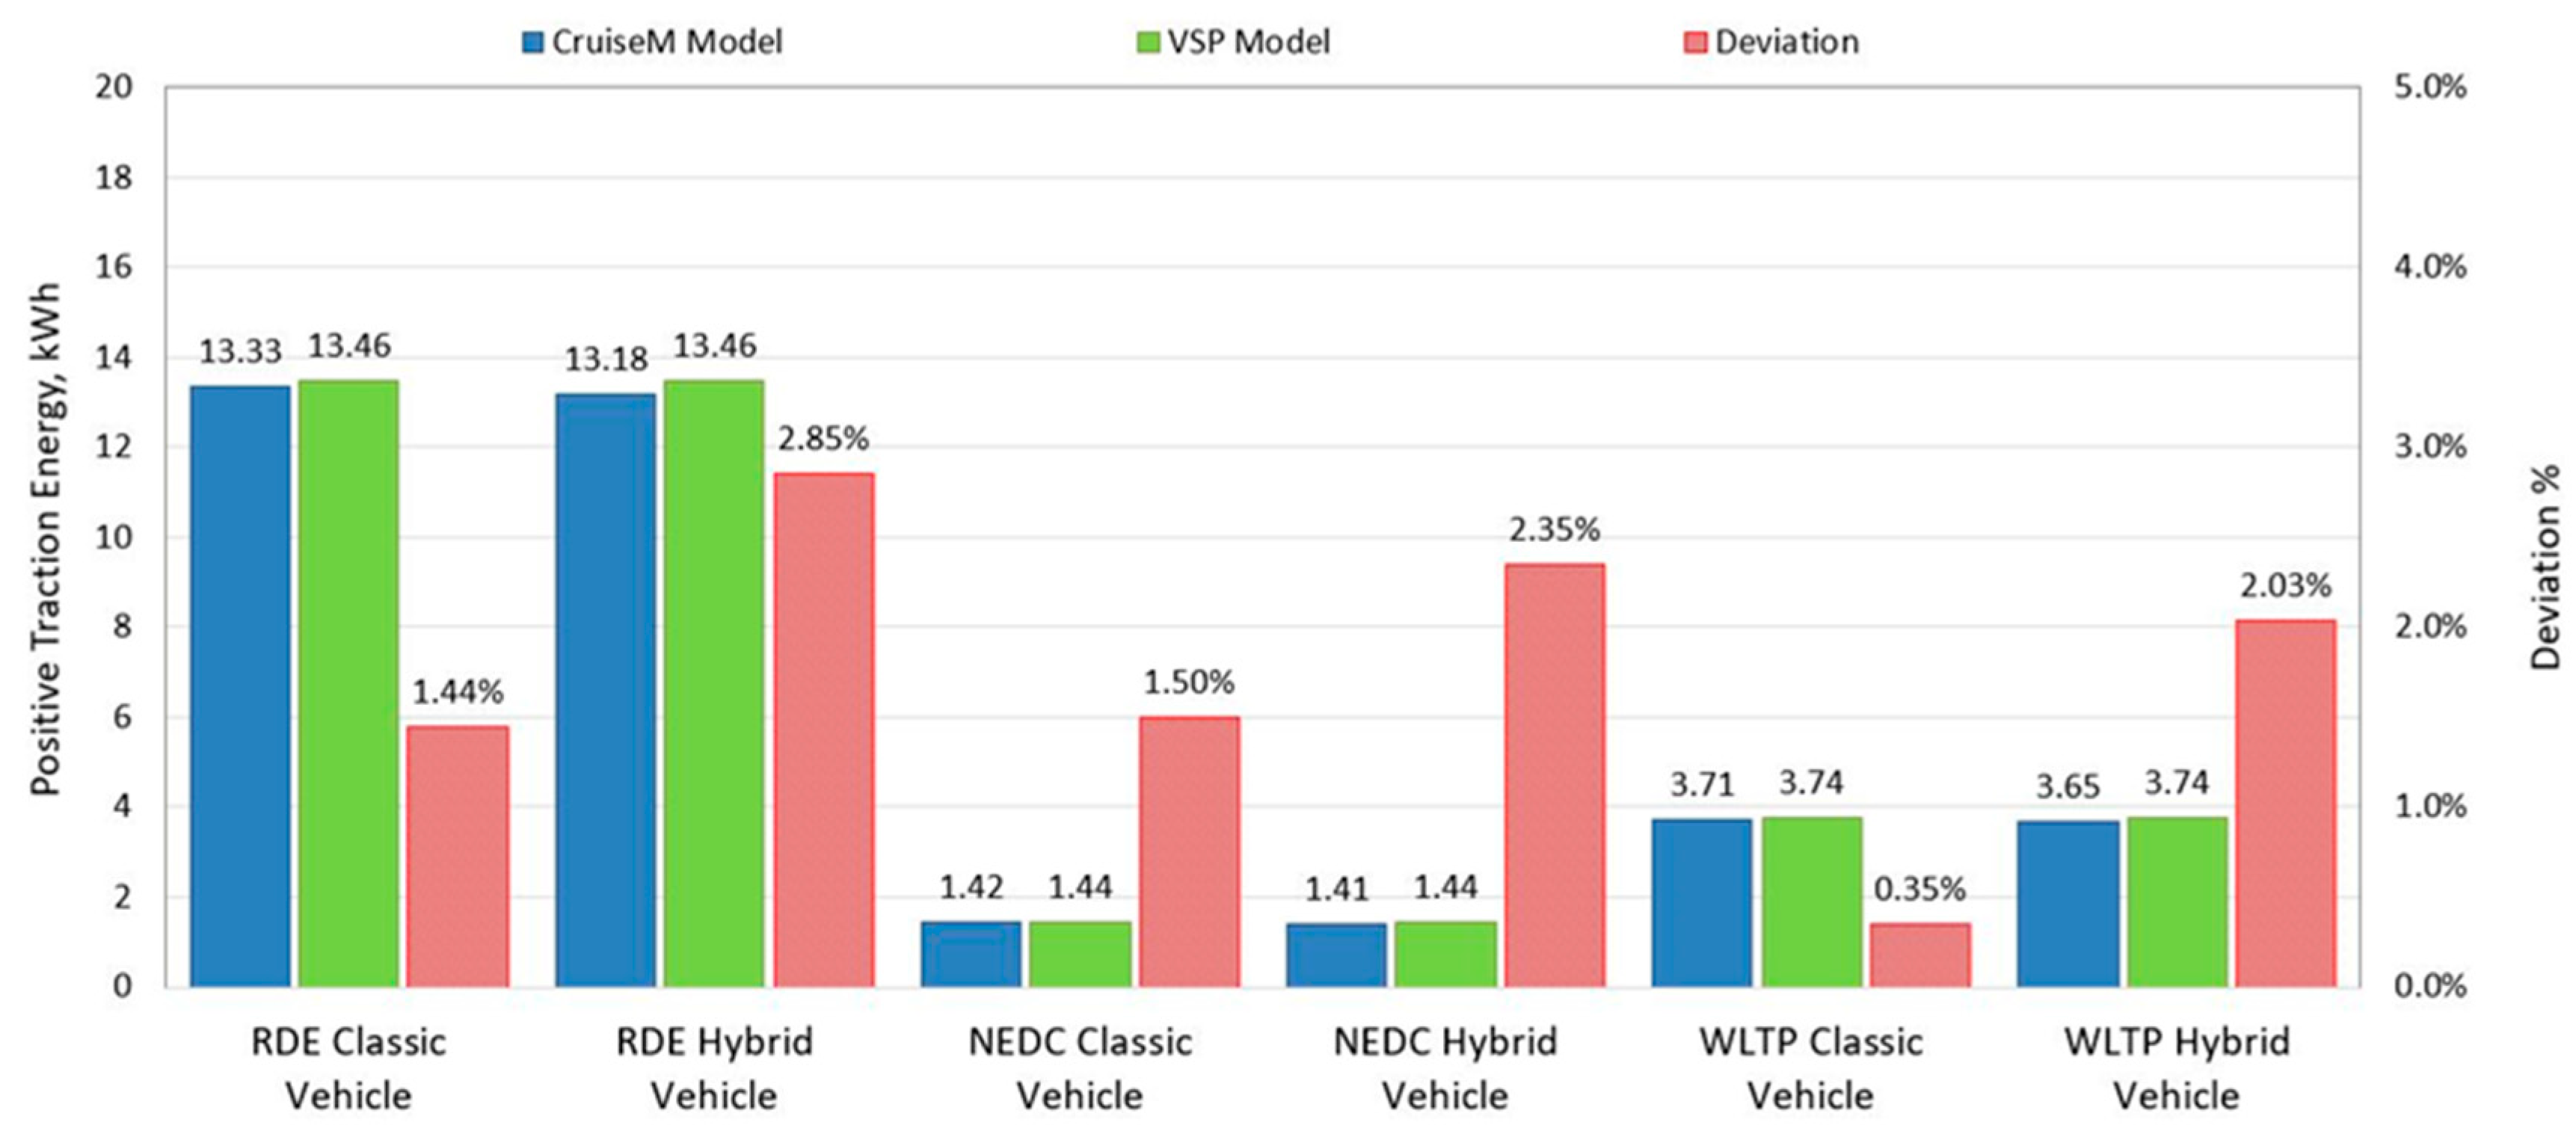
| Distance [km] | 86.21 | 86.63 | 86.21 | 1.000 | 1.005 | 1.000 | 0.005 | 0.48% | 0.000 | 0.00% |
| Positive Traction energy [kWh] | 13.37 | 13.33 | 13.46 | 0.155 | 0.154 | 0.156 | -0.035 | 0.22% | 0.092 | 0.69% |
| Negative Trac. energy [kWh] | -2.14 | -2.22 | -2.27 | -0.0248 | -0.0256 | -0.0263 | -0.080 | 3.26% | -0.130 | 6.08% |
| CO2 emission [g] |
10540 | 10556 | 10540 | 122.2 | 121.9 | 122.2 | 16.259 | -0.33% | 0.000 | 0.00% |
| NOx emission [mg] | 39806 | 40051 | 39806 | 461.7 | 462.3 | 461.7 | 245.136 | 0.13% | 0.000 | 0.00% |
| Consumption [kg] | 3.366 | 3.371 | 3.366 | 0.039 | 0.039 | 0.039 | 0.005 | -0.33% | 0.000 | 0.00% |
Disclaimer/Publisher’s Note: The statements, opinions and data contained in all publications are solely those of the individual author(s) and contributor(s) and not of MDPI and/or the editor(s). MDPI and/or the editor(s) disclaim responsibility for any injury to people or property resulting from any ideas, methods, instructions or products referred to in the content. |
© 2023 by the authors. Licensee MDPI, Basel, Switzerland. This article is an open access article distributed under the terms and conditions of the Creative Commons Attribution (CC BY) license (http://creativecommons.org/licenses/by/4.0/).


