Preprint
Article

Enhanced Susceptibility to Tomato Chlorosis Virus (ToCV) in Hsp90 and Sgt1 Silenced Plants: Insights from Gene Expression Dynamics

Altmetrics

Downloads

128

Views

52

Comments

0

A peer-reviewed article of this preprint also exists.

Submitted:

01 November 2023

Posted:

02 November 2023

You are already at the latest version

Alerts
Abstract
The emerging whitefly-transmitted crinivirus Tomato chlorosis virus (ToCV) causes substantial economic losses by inducing yellow leaf disorder in tomato crops. This study explores potential resistance mechanisms by examining early-stage molecular responses to ToCV. A time-course transcriptome analysis compared naïve, mock and ToCV-infected plants at 2, 7, and 14 days post-infection (dpi). Gene expression changes were most notable at 2 and 14 dpi, likely corresponding to whitefly feeding and viral infection. Gene Ontology (GO) and Kyoto Encyclopedia of Genes and Genomes (KEGG) enrichment analyses revealed key genes and pathways associated with ToCV infection, including those related to plant immunity, flavonoids and steroids biosynthesis, photosynthesis, and hormone signalling. Additionally, virus-derived small interfering RNAs (vsRNAs) originating from ToCV predominantly came from RNA2 and were 22 nucleotides in lengt. To confirm these findings, two genes involved in plant immunity, Hsp90 (heat shock protein 90) and its co-chaperone Sgt1 (suppressor of the G2 allele of Skp1) were targeted through viral-induced gene silencing (VIGS), showing potential contribution to basal resistance against viral infections since their reduction correlated with increased ToCV accumulation. This study provides insights into tomato plants responses to ToCV, with potential implications for developing effective disease control strategies.
Keywords: 
Subject: Biology and Life Sciences  -   Virology

1. Introduction

Tomato chlorosis virus (ToCV, genus Crinivirus, family Closteroviridae) is an emergent plant virus that causes a yellow leaf disorder in tomato, including interveinal yellowing chlorotic areas, thickening of leaves and bronzing and necrosis of the older leaves which may cause serious economic losses in crop yield [1,2]. ToCV has a bipartite genome of positive single-stranded RNA and like many other crinivirus, is restricted to phloem associated cells and transmitted in a semi-persistent manner by several whiteflies of the genera Bemisia and Trialeurodes, although its emergence has been associated mostly with the global spread of the whitefly B. tabaci in tropical and warm regions worldwide [1]. Furthermore, recent studies have demonstrated that ToCV, when present in a mixed infection with Tomato yellow leaf curl virus (TYLCV, genus Begomovirus, family Geminiviridae) also transmitted by B. tabaci, might result into a synergistic interaction disease that could have a significant detrimental impact on tomato production [3,4,5,6].
Since plant viruses are obligate intracellular parasites that exploit host cellular machinery to establish systemic infections [7], they generally induce a wide variety of alterations in host gene expression and cell physiology in order to facilitate infections. These alterations include not only defense-related pathways but also some others involved in photosynthesis, secondary metabolism, or regulation of plant hormone levels [8,9,10,11,12]. Transcriptome sequencing using RNA-seq technology allows to explore gene expression changes that are either directly or indirectly associated with viral infection [13,14,15]. Previous studies have followed this approach to characterize genome-wide gene expression profiles in tomato in response to ToCV infection [16,17]. These two papers focused on a single time-point after inoculation for their sampling and analysis. In the first work, Seo et al. (2018) [16] performed transcriptome analysis of grafted plants from ToCV-infected tomato plants at 56 days post inoculation (dpi), pointing to genes potentially involved in the response affecting the development. Instead, Yue et al. (2021) [17] analyzed plants infected by agroinoculation with an infectious clone and at 40 dpi, identifying in this case genes associated with the MAPK signaling pathway, the glyoxylate cycle, and photosynthesis processes. This variability in the observed responses might reflect experimental differences in terms of virus isolates, plant materials, and specially inoculation modes. Furthermore, it is important to consider the dynamic nature of the pathogenic interaction. In particular, the changes of gene expression in response to viral infection are highly dynamic, and plant viruses are known to induce changes in host gene expression at the early stages of infection, which leads to the activation of antiviral responses [8,18,19]. Therefore, our understanding of how ToCV infection processes regulate gene expression during the early stages of natural vector-mediated infection remains limited.
RNA silencing is a well-established antiviral defense system in plants [20,21]. This antiviral defense involves production of virus-derived small interfering RNAs (vsRNAs) by RNase III Dicer-like (DCL) proteins processing viral RNA precursors into 21- to 24-nucleotide (nt) [22,23]. In Arabidopsis thaliana, virus resistance against positive-strand RNA viruses is initiated by either DCL4 or DCL2, which are involved in the biogenesis of 21-nt and 22-nt vsRNAs, respectively [24,25,26]. These vsRNAs are loaded onto AGO proteins, leading to the formation of RNA-induced silencing complexes (RISCs) that repress complementary target RNA [27]. Moreover, the 22-nt vsRNAs are likely to promote the amplification of RNA silencing, which includes the production of secondary vsRNAs by DCL proteins from the products of RNA-dependent RNA polymerases (RDRs) [28,29]. Characterization of viRNAs through deep sequencing techniques in response to various plant viruses has been previously conducted in multiple agronomically important crop species [30,31,32,33,34,35]. Nevertheless, the vsRNAs profile originating from ToCV infection in tomato plants has only been documented in a single study, which analyzed the tomato virome through sequencing sRNAs from field crop samples collected in China [35]. Consequently, our understanding of the vsRNAs profile associated with ToCV infection in tomato plants remains limited.
In this study, we performed time-course transcriptome analysis using RNA-seq to analyze the dynamic changes of differentially expressed genes (DEGs) in tomato plants after ToCV infection when transmitted by its natural insect vector B. tabaci. Key genes were comprehensively identified and classified into essential pathways, providing new insight into ToCV pathogenesis and host immune response. Further analyses of the distribution of vsRNAs along the viral genome determined using sRNA sequencing indicated that RNA1 and RNA 2 were differentially targeted by vsRNAs. We also observed that genes involved in plant immunity, such as Hsp90 (heat shock protein 90) and its co-chaperone Sgt1 (suppressor of the G2 allele of Skp1) may contribute to the basal resistance to viral infection. These findings provide new insights into the molecular responses that occur in ToCV-infected tomato plants and may represent a step toward identifying potential genes for designing future disease control strategies against ToCV.

2. Materials and Methods

2.1. Plant material and virus infection

Tomato plants (Solanum lycopersicum cv. Moneymaker) were grown in an insect-free growth chamber with a 16-h photoperiod at 250 μmol·s−1m−2 photosynthetically-active radiation (25 °C/20 °C) and 70% relative humidity [36]. Three-week-old seedlings were infected with the ToCV isolate Pl-1-2 [37] using viruliferous whiteflies as previously described [6]. Briefly, a nonviruliferous colony of B. tabaci Mediterranean (MED) was reared on melon plants in cages covered by insect-proof netting. To obtain ToCV-viruliferous whiteflies, nonviruliferous whiteflies were exposed for a 24-h acquisition access period (AAP) on tomato plants infected with ToCV that were inoculated four weeks before being used for virus acquisition. Similarly, whiteflies used as nonviruliferous controls were enclosed in clip-cages attached to virus-free tomato plants for the same 24-h period. After the AAP, 40 whiteflies per test plant in clip-on cages were transferred to healthy plants for a 48-h inoculation access period (IAP). Following IAP, the clip cages were removed and the infested leaf was excised from the plant at 7 days to avoid eclosion of eggs laid by adults during the IAP. The plants were maintained in an insect-free growth chamber (see above).

2.2. Sample collection and RNA extraction

Naïve (no whitefly and no virus), mock (non-viruliferous whiteflies) and ToCV (viruliferous whiteflies)-treated samples were collected at 2, 7, and 14 days-post infection (dpi). The presence of viral RNA in the inoculated plants was tested by tissue blot hybridization 21 dpi as described, and only samples from plants that tested positive were included in the pool [38]. At each time point and replica, the second most recently expanded leaves from the apex from 6 individual plants were pooled and used in downstream analysis. A total of three biological replicates were processed per treatment and time point. Total RNA was extracted using TRIzol reagent according to the manufacturer’s instructions (Invitrogen) and then treated with RNAse-Free DNase (Qiagen). The quality and quantity of RNA were assessed by electrophoresis on 1% agarose gels and by a NanoDrop 1000 spectrophotometer (Thermo Fisher Scientific).

2.3. Libraries construction and sequencing

RNA-Seq libraries were generated and sequenced at CNAG (Centro Nacional de Análisis Genómico, Barcelona, Spain). Total RNA was assayed for quantity and quality using Qubit® RNA HS Assay (Life Technologies) and RNA 6000 Nano Assay on a Bioanalyzer 2100. The RNASeq libraries were prepared from total RNA using the TruSeq®Stranded mRNA LT Sample Prep Kit (Illumina Inc., Rev.E, October 2013). A total of 27 libraries were constructed (3 for each treatment; 3 biological replicates at 2, 7, and 14). The libraries were sequenced on HiSeq2000 (Illumina, Inc) in paired-end mode with a read length of 76 bp using the TruSeq SBS Kit v4. Image analysis, base calling and quality scoring of the run were processed using the manufacturer’s software Real Time Analysis (RTA 1.18.64 or 1.18.66.3) and followed by generation of FASTQ sequence files by CASAVA.
sRNA libraries were generated and sequenced at CRG (Centre for Genomic Regulation, Barcelona, Spain) as described by Piedra-Aguilera et al. (2019). Briefly, libraries were prepared in duplicate from samples corresponding to ToCV infected plants at 14 dpi using the Illumina TruSeq small RNA sample prep kit according to the manufacturer’s instructions. Libraries were validated on an Agilent 2100 Bioanalyzer using a DNA High Sensitivity chip and quantified by qPCR using the Kapa Library Quantification kit for Illumina (Roche). Sequencing was performed on an Illumina HiSeq2500 using 50 bp single reads with HiSeq v4 sequencing chemistry.

2.4. RNA-Seq and sRNA data analysis

RNA-seq raw data files obtained after sequencing were processed using Trimmomatic v0.35 [39] with the options ILLUMINACLIP:./TruSeq3-PE.fa:2:30:10 LEADING:3 TRAILING:3 SLIDINGWINDOW:4:15 MINLEN:36 to remove sequencing adapters and low-quality reads. Raw and processed reads were evaluated with FastQC v0.11.4 (https://www.bioinformatics.babraham.ac.uk/projects/fastqc/) and MultiQC v1.6. [40]. Processed reads were mapped to the current version of tomato reference genome (SL4.0) available at Sol Genomics Network website (SGN, http://solgenomics.net) [41], together with the tomato organelle sequences, using Hisat v2.1.0 [42]. Samtools v1.9 [43] was used to convert the alignment to sorted BAM format. StringTie v1.3.3b [44] was used for transcript quantification based on the tomato ITAG4.1 annotation. The python script prepDE.py was used to convert Stringtie output to counts, and differentially expressed genes (DEG) were calculated using the R package DESeq2 [45], applying a cutoff threshold of 1.2-fold compared to the values observed in both the ToCV and mock treatments. Gene set enrichment analyses of the DEGs were performed with g:profiler [46] (https://biit.cs.ut.ee/gprofiler/gost). To determine the similarity across samples, rlog-transformed data were used for principal component analysis (PCA) using plotPCA of DEseq2 and pairwise comparison of all samples using Pearson’s correlation coefficients in R.
sRNA raw data files obtained after sequencing were processed using Trimmomatic v0.35 [39] with the options ILLUMINACLIP:./smrna_adapters.fa:2:30:10 LEADING:3 TRAILING:3 SLIDINGWINDOW:4:15 MINLEN:15 to remove specific smallRNA adapters and low-quality reads. Then, trimmed reads < 18 nt or > 30 nt were removed. Raw and processed reads were evaluated with FastQC v0.11.4 https://www.bioinformatics.babraham.ac.uk/projects/fastqc/ and MultiQC v1.6. [40] Processed reads were aligned using BWA v0.7.12 [47], with edit distance set to 1, to the genome of RNA1 (GenBank accession number KJ200308) and RNA2 (GenBank accession number KJ200309) of ToCV. The sRNA size distribution of 20 to 25 nt, total read counts and the counts for forward and reverse orientation were estimated using MISIS2 [48].

2.5. Virus-induced gene silencing

VIGS vectors (pTRV1 and pTRV2) derived from the tobacco rattle virus (TRV) [49] were used to silence Sgt1 (Solyc06g036420) and Hsp90 (Solyc07g047790) genes. Gene-specific PCR primer pairs were designed using Primer Blast tool available online (https://www.ncbi.nlm.nih.gov/tools/primer-blast/) and fragments were designed by the VIGS tool (http://solgenomics.net/tools/vigs) [41]. A 430 bp fragment of the Hsp90 gene was amplified by RT-PCR from total RNA (see below). The primers used were LK35A (5´-GATCGGATCCTTGAGCAGTTCTCCTTGTGT-3´) and LK36A (5´-AGTCGAGCTCATTTCTGTCCACCAGCTTCA-3´), which contained BamHI and SacI restriction enzyme sites, respectively, as indicated by underlining in the sequence. The resulting PCR product was digested and then cloned into the BamHI-SacI sites within the multiple cloning region of the pTRV2 vector. Similarly, a 235 bp fragment of Sgt1 was amplified using the primers LK22A (5´-TAGTGAATTCATCCTGCATCTGAGTTACCG-3´) and LK23A (5´-GCATCTCGAGGTTTCTTCACCTGGCACATC-3´) and inserted into EcoRI-XhoI sites of the pTRV2 vector after restriction digestion using the corresponding EcoRI and XhoI restriction enzyme sites underlined in the sequence of primers. Recombinant plasmids were transformed into Escherichia coli strain DH5α (Invitrogen) and the corresponding plasmids of clones pTRV2-Hsp90 and pTRV2-Sgt1 were extracted and electroporated into Agrobacterium tumefaciens GV3101. Bacterial cultures were grown in liquid LB medium at 28°C for 48h containing kanamycin (50µg/mL) and rifampicin (25µg/mL), and then harvested by centrifugation and the pellets resuspended in infiltration buffer (10 mM MgCl2, 200 μM acetosyringone) to a final OD600 of 1.0. Agrobacterium cultures containing pTRV2 derivatives and pTRV1 were mixed at a 1:1 ratio, incubated at room temperature for 3 h and then infiltrated into a 2-3-leaf-stage tomato. The pTRV2 empty vector was used as the control together with pTRV1. Seven days after inoculation with the different TRV-based constructs, plants were infected with ToCV by B.tabaci-mediated inoculation as described above.

2.6. Quantitative real time PCR

RNA isolation from plant samples was performed using TRIZOL following standard protocols. Reverse transcription and quantitative PCR (RT-qPCR) was carried out as previously described [6,50], with some slight modifications. Specifically, each treatment included five biological replicates and three technical replicates, and we used the elongation factor 1-α and Sand as reference genes [51,52].
Quantification of ToCV and TRV accumulation were carried out as described in [52]. Specific primer pair for qPCR LK57 (5´-GGTGTTACTGAGCCTGAGC-3´) and Lk58 (5´-GGCGAGTCATACCAATTCCTG-3´) was used to amplify a 115-nt segment of the Hsp90 gene, and LK53 (5´-CCAAGATGCTGACGAGGAC-3´) and LK54 (5´-CAGAGGATCGATTCTAGATCTCC-3´) to amplify a 166-nt segment of the Sgt1 gene. Each primer pair was evaluated by a standard curve with six points and three replicates to obtain efficiency rates (E) of 104.73% (for Hsp90) and 101.74% (for Sgt1) (E=10(1/slope) −1, expressed as percentages) with R2=0.99 correlation values for the curves. Relative gene expression was calculated using the 2-ΔΔCT method [53]. Statistically significant differences (p<0.05) of virus accumulation and target gene expression levels in control and silenced tomato plants were analysed by one-way ANOVA.

2.7. Data availability

The data for this study have been deposited in the European Nucleotide Archive (ENA) at EMBL-EBI under accession number PRJEB67704 (https://www.ebi.ac.uk/ena/browser/view/PRJEB67704).

3. Results

3.1. Identification of DEGs in tomato leaves at different stages of ToCV infection

To investigate changes in the tomato transcriptome profile associated with ToCV infection, Illumina TruSeq libraries were sequenced from total RNA of naïve, mock and ToCV-infected plants at 2, 7, and 14 dpi. The number of clean reads ranged from 27 to 72 million read pairs, and the percentage of mapped reads against the tomato transcriptome ranged from 90.96 and 92.68. PCA analysis showed that the samples clustered into three discrete groups (Figure 1A). A clear discrimination between ToCV-infected and uninfected samples only was found at 14 dpi. Also, a clear differentiation was found at 2 dpi that identified significant clustering of ToCV and Mock data sets when compared with naïve, suggesting an early response associated to the whitefly feeding. Interestingly, the ToCV-infected samples at 7 dpi and mocks at 7 and 14 dpi clustered tightly with the naive samples, indicating that infection with ToCV at 7 dpi and the effects of Bemisia feeding after 7 dpi not altered the overall gene expression (Figure 1A).
We focused on the differentially expressed genes (DEGs) between mock and infected plants. The number of DEGs was 2,009 (1,163 up- and 936 down-regulated), 561 (246 up- and 315 down-regulated) and 5,937 (2,845 up- and 3,092 down-regulated) at 2, 7 and 14 dpi, respectively (Figure 1B). The largest number of deregulated genes was at 14 dpi, whereas the lowest were found at 7 dpi, in agreement with the data distribution in the PCA, where the ToCV samples appeared close to the mock and naïve treatment. This indicates that while ToCV had a slight influence on the gene expression of the plant at early stages of the infection, the effect of the virus became stronger at 14 dpi. Interestingly, at this later time point, over 80% of deregulated genes were specific and not shared with those observed at 2 and 7 dpi (Figure 1C). This finding suggests that these unique gene likely play a significant role in the development of virus symptoms.

3.2. Gene ontology enrichment analysis in response to ToCV

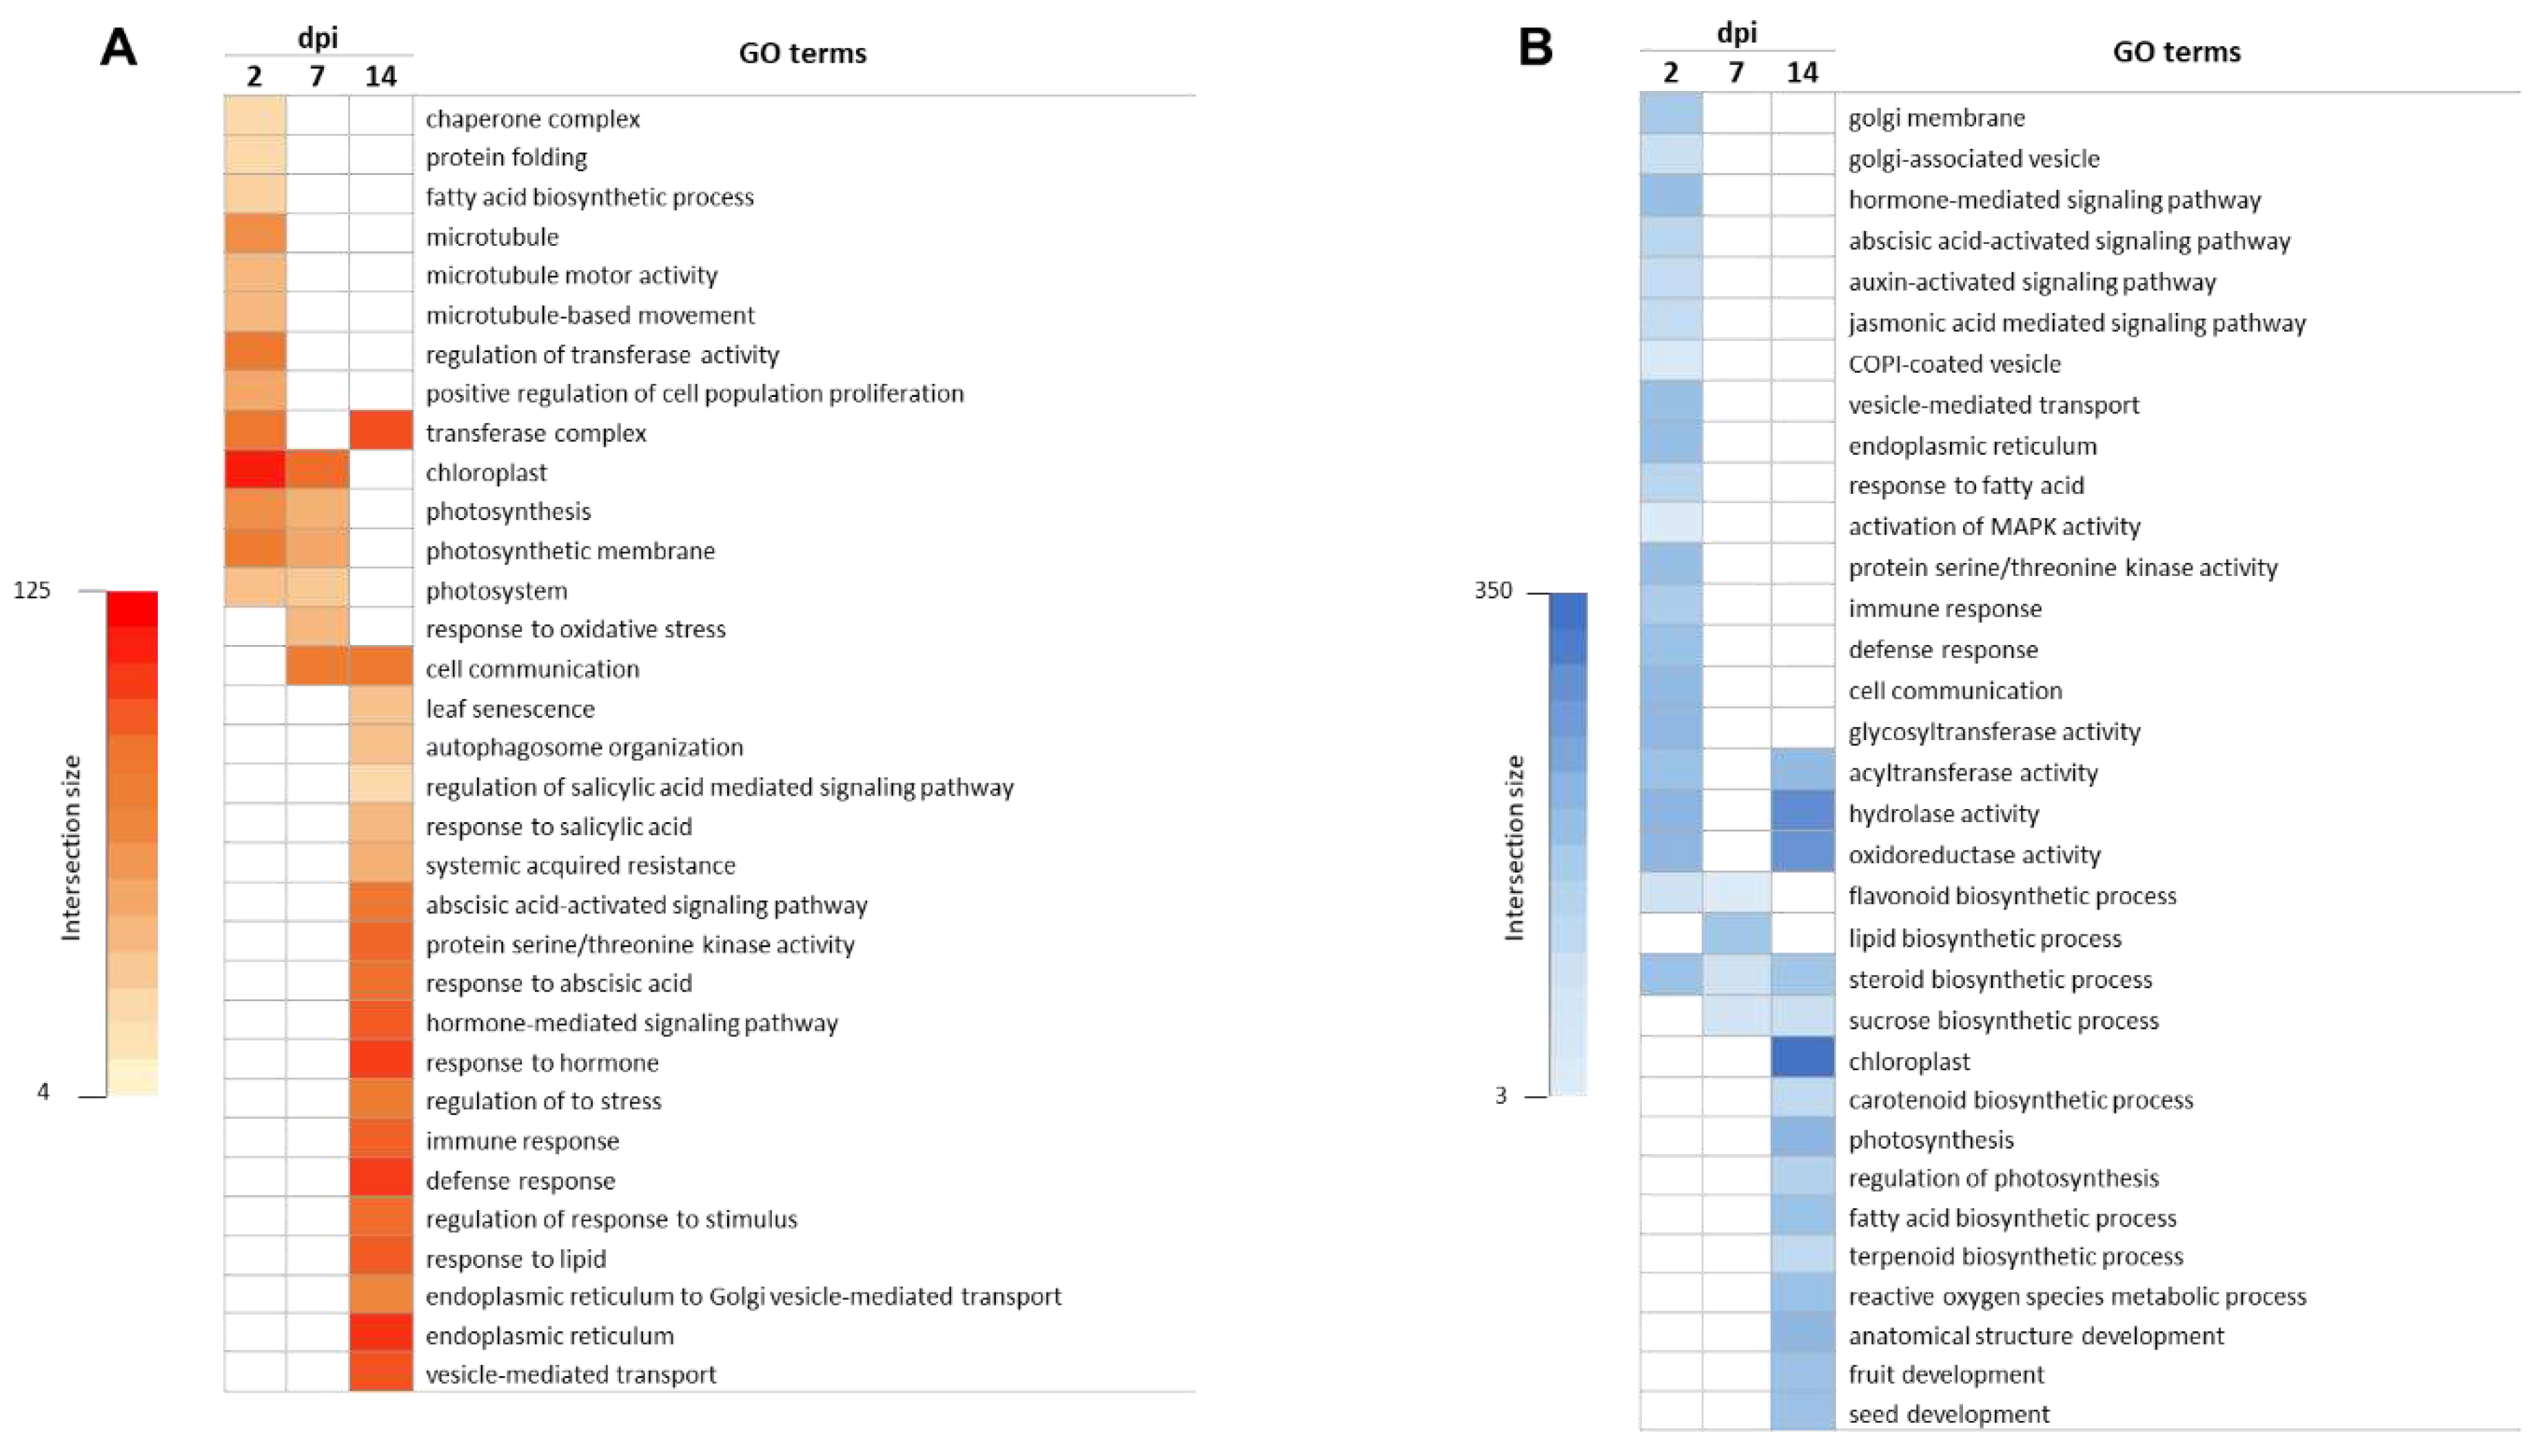
To determine the functional roles of DEGs at each time point, we conducted GO enrichment analysis using the g:Profiler program [46]. A total of 454, 192 and 741 GO terms were significantly enriched at 2, 7 and 14 dpi, respectively, with a relatively higher number of enriched GO terms for up-regulated at 2 and 7 dpi and similar percentages for either up- or down-regulated at 14 dpi. The majority of the terms that were identified from up-regulated genes at 2 dpi were related to the microtubule and photosynthesis processes (Figure 2A), while some terms associated with defense and immune response, cell communication and phytohormones signalling pathways were observed in down-regulated genes (Figure 2B). Out of the 192 terms significantly enriched at 7 dpi, the terms for up-regulated genes were mainly related to cell communication, photosynthesis, and response to stress (Figure 2A). In contrast, terms related to flavonoid biosynthesis, steroid metabolism, and chaperone activity were identified for down-regulated gene (Figure 2B). The number of enriched GO terms at 14 dpi was remarkably higher. Among the up-regulated DEGs, the most significant terms were related to cell communication, vesicular transport, and phytohormone signaling, with a particular emphasis on salicylic acid (Figure 2A). Regarding down-regulated genes, we discovered terms related to the response to photosynthesis, as well as the biosynthesis of lipids, carotenoids, flavonoids, and terpenoids (Figure 2B).

3.3. Impacted pathways in ToCV infection

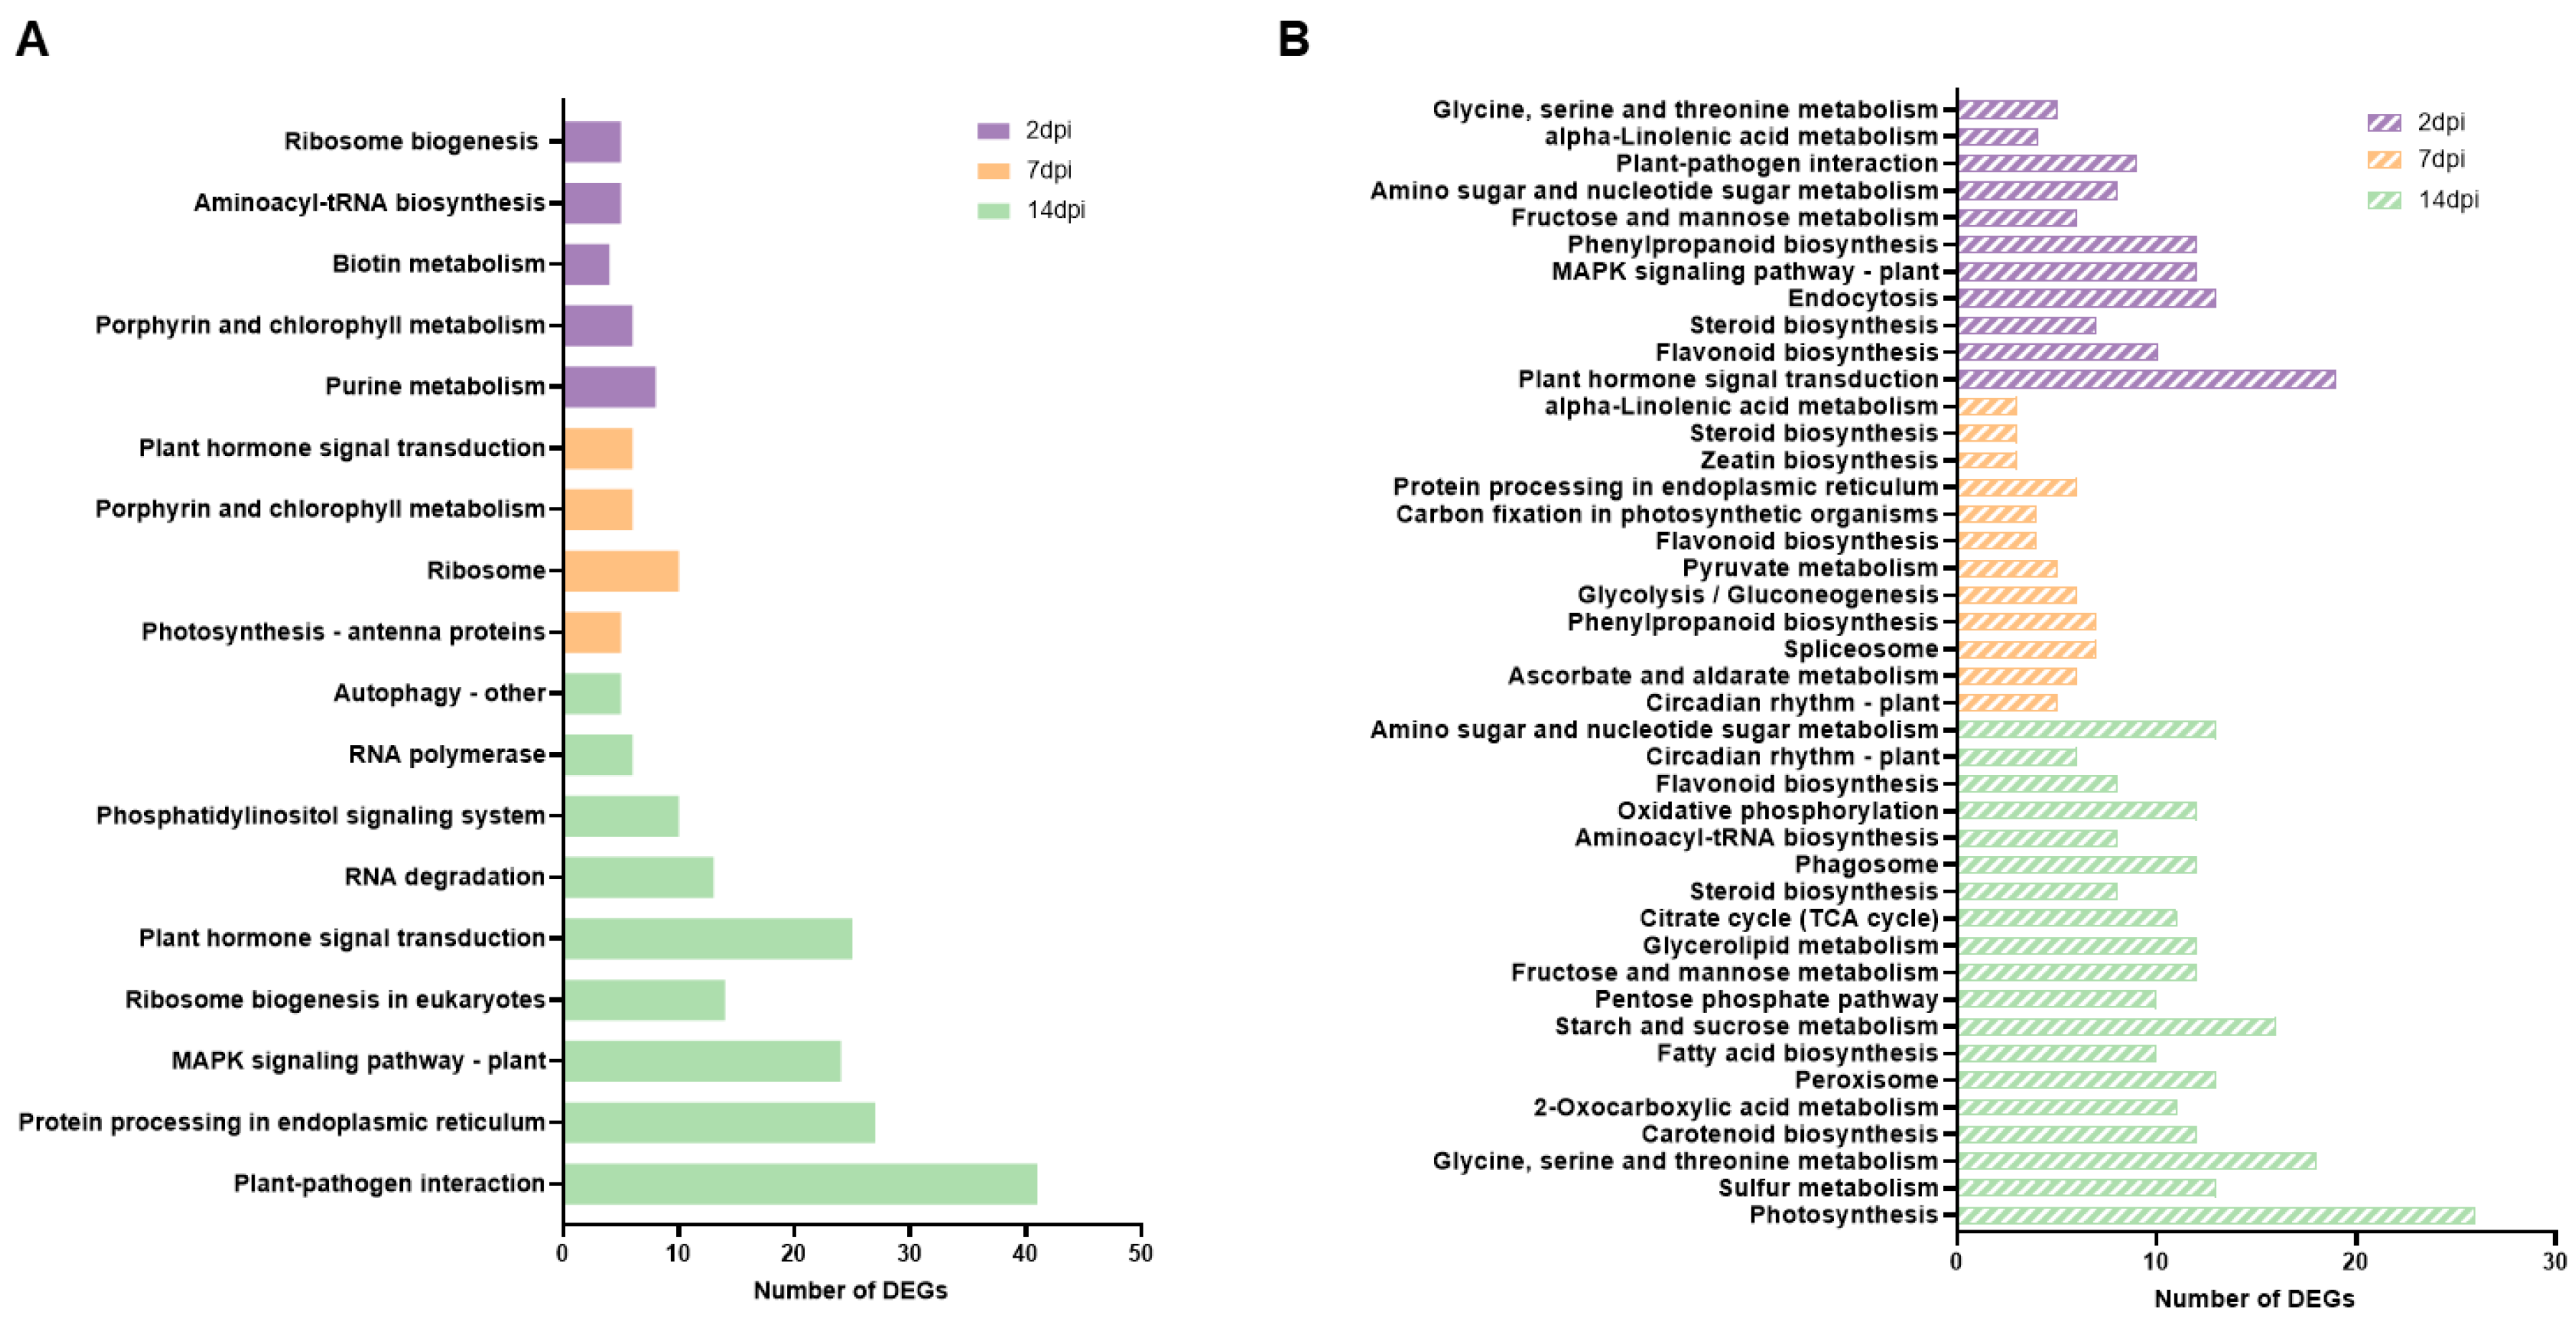
We also conducted a KEGG pathway analysis to assist in the identification of potential pathways, using the same software employed in the GO enrichment analysis. Our analysis revealed a greater number of KEGG pathways for down-regulated genes compared to up-regulated genes. Specifically, at 2 dpi, a total of 11 and 23 pathways were enriched for up-regulated and down-regulated genes, respectively. Notably, several important pathways such as plant hormone signal transduction, plant-pathogen interaction, and MAPK signaling were identified from the down-regulated genes at this time point (Figure 3A). Furthermore, we observed that some pathways associated with flavonoid biosynthesis and steroid biosynthesis were also repressed at 7 and 14 dpi (Figure 3B). The KEGG analysis performed at 7 dpi revealed 5 and 14 pathways related to up-regulated and down-regulated genes, respectively (Figure 3 A and B). The most representative pathway categories identified from up-regulated genes included plant hormone signal transduction, ribosome, and photosynthesis (Figure 3A). Meanwhile, circadian rhythm, spliceosome, flavonoid biosynthesis, protein processing in the endoplasmic reticulum, and steroid biosynthesis-related pathways were identified among the down-regulated genes (Figure 3B). The analysis performed at 14 dpi showed that 15 pathways were enriched in up-regulated genes, while 49 pathways were identified in down-regulated genes. Among the top KEGG pathways from up-regulated genes were the MAPK signalling pathway, protein processing in the endoplasmic reticulum, plant hormone signal transduction, plant-pathogen interaction, and autophagy (Figure 3A). Conversely, down-regulated genes were significantly associated with pathways related to carotenoid biosynthesis, fatty acid biosynthesis, photosynthesis, and steroid biosynthesis (Figure 3B).

3.4. Characterizing viral small RNAs in ToCV-infected plants

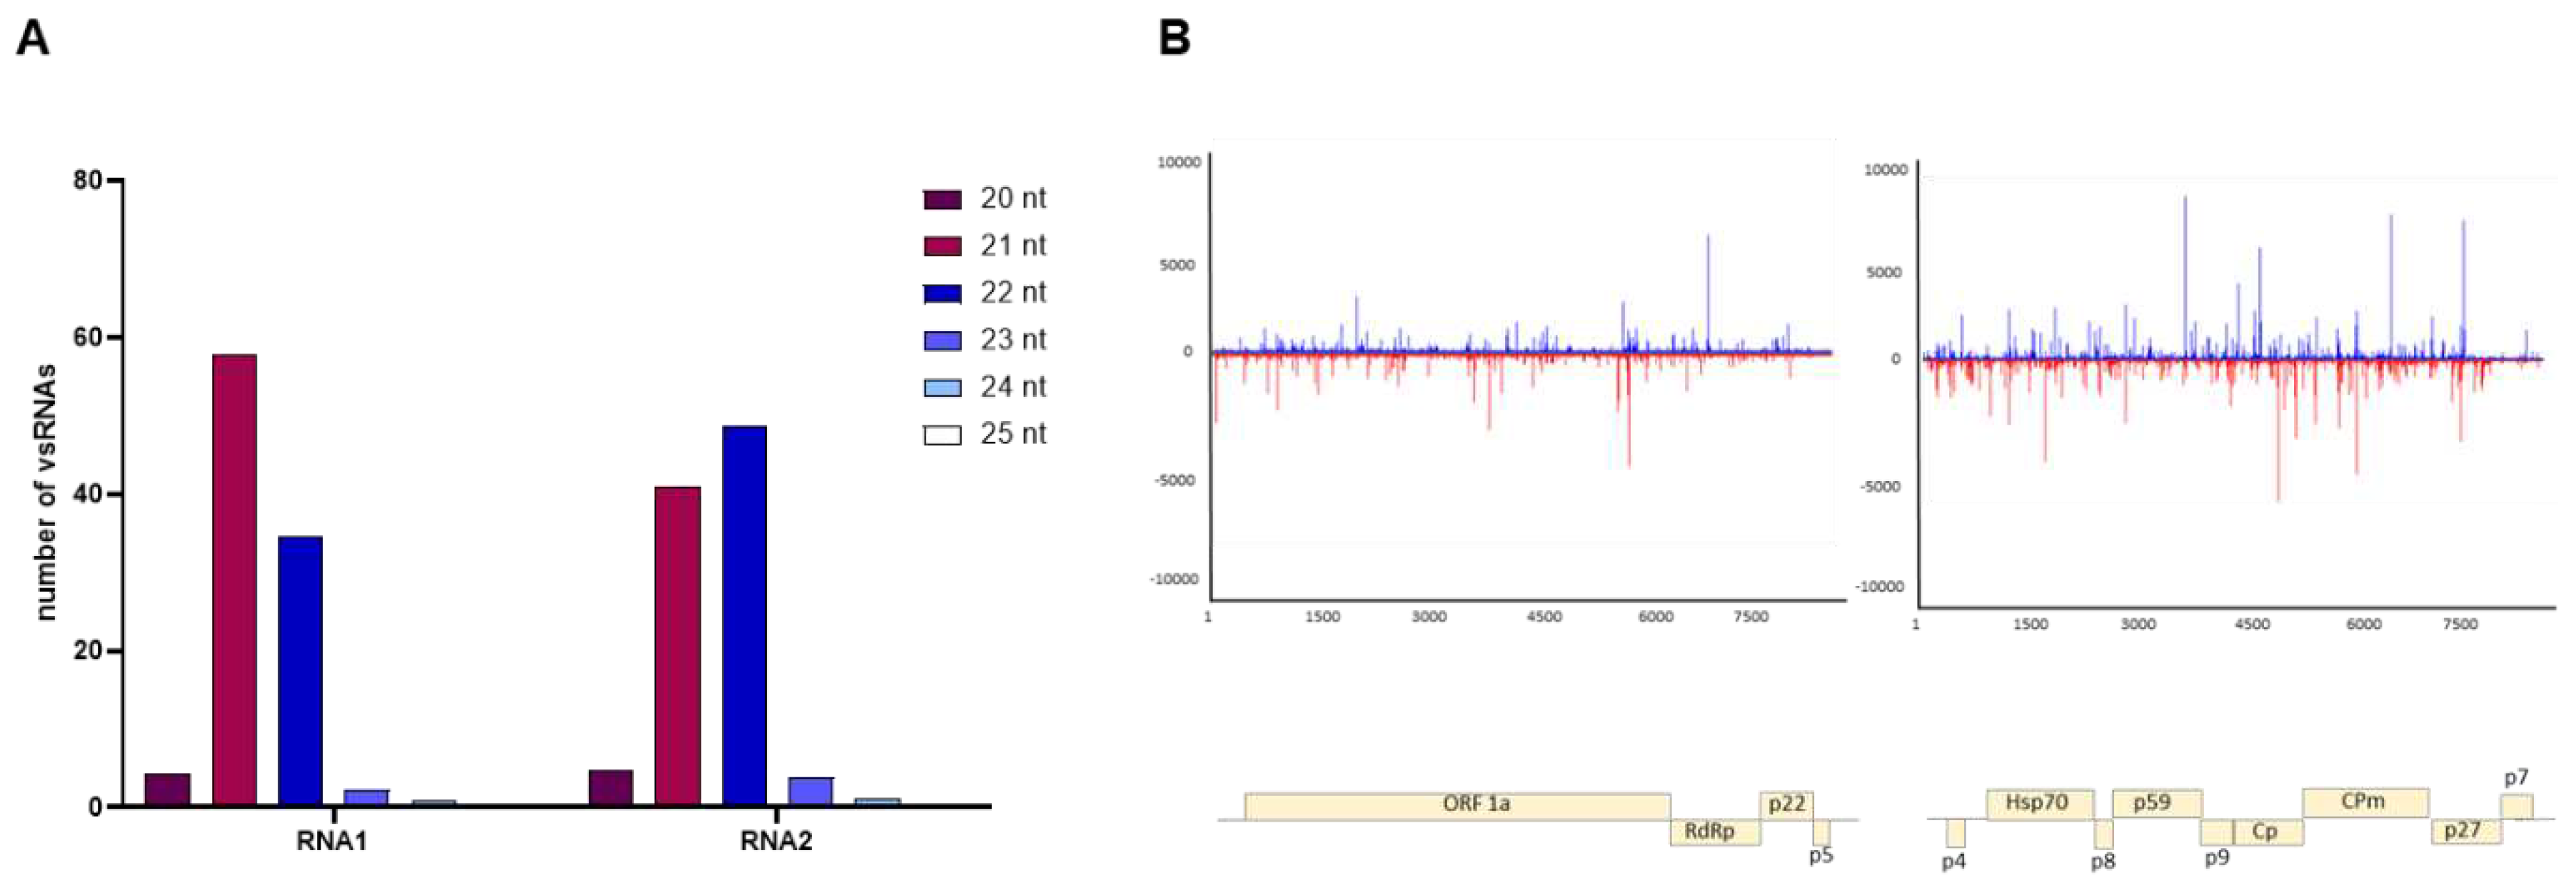
To gain insight into the siRNAs produced during ToCV infection, we conducted an analysis of vsRNAs (20- to 25-nt) accumulation corresponding to ToCV genomic RNA1 and RNA2 using two pools of the same samples previously analyzed at 14 dpi in ToCV infected plants for RNAseq. Our findings revealed that 235,638 and 1,011,948 siRNAs were mapped to viral RNA 1 and RNA 2, respectively. This indicates that the abundance of RNA2-specific vsRNAs was at least four times greater than that of RNA1-specific vsRNAs. Interestingly, the majority of sequenced vsRNAs originating from RNA1 were 21-nt in length, whereas those from RNA2 predominantly comprised 22-nt species (Figure 4A). This suggests that DCL4 played a prominent role in antiviral silencing for RNA1, whereas DCL2 was more actively involved in processing RNA2. Approximately equal ratios of vsRNAs were mapped respectively to the positive and negative strands of each of the two viral genomic RNAs. Additionally, vsRNAs were generated from across the entire viral genome with several hot spots in regions encoding Hsp70 and CPm (Figure 4B). Although there were slight variations in the relative abundance of vsRNAs targeting RNAs 1 and 2 between the duplicate libraries, no significant differences in the patters described above were observed between the two replicates of each viral infection.

3.5. Enhanced ToCV susceptibility in tomato plants after silencing of Hsp90 and Sgt1 genes

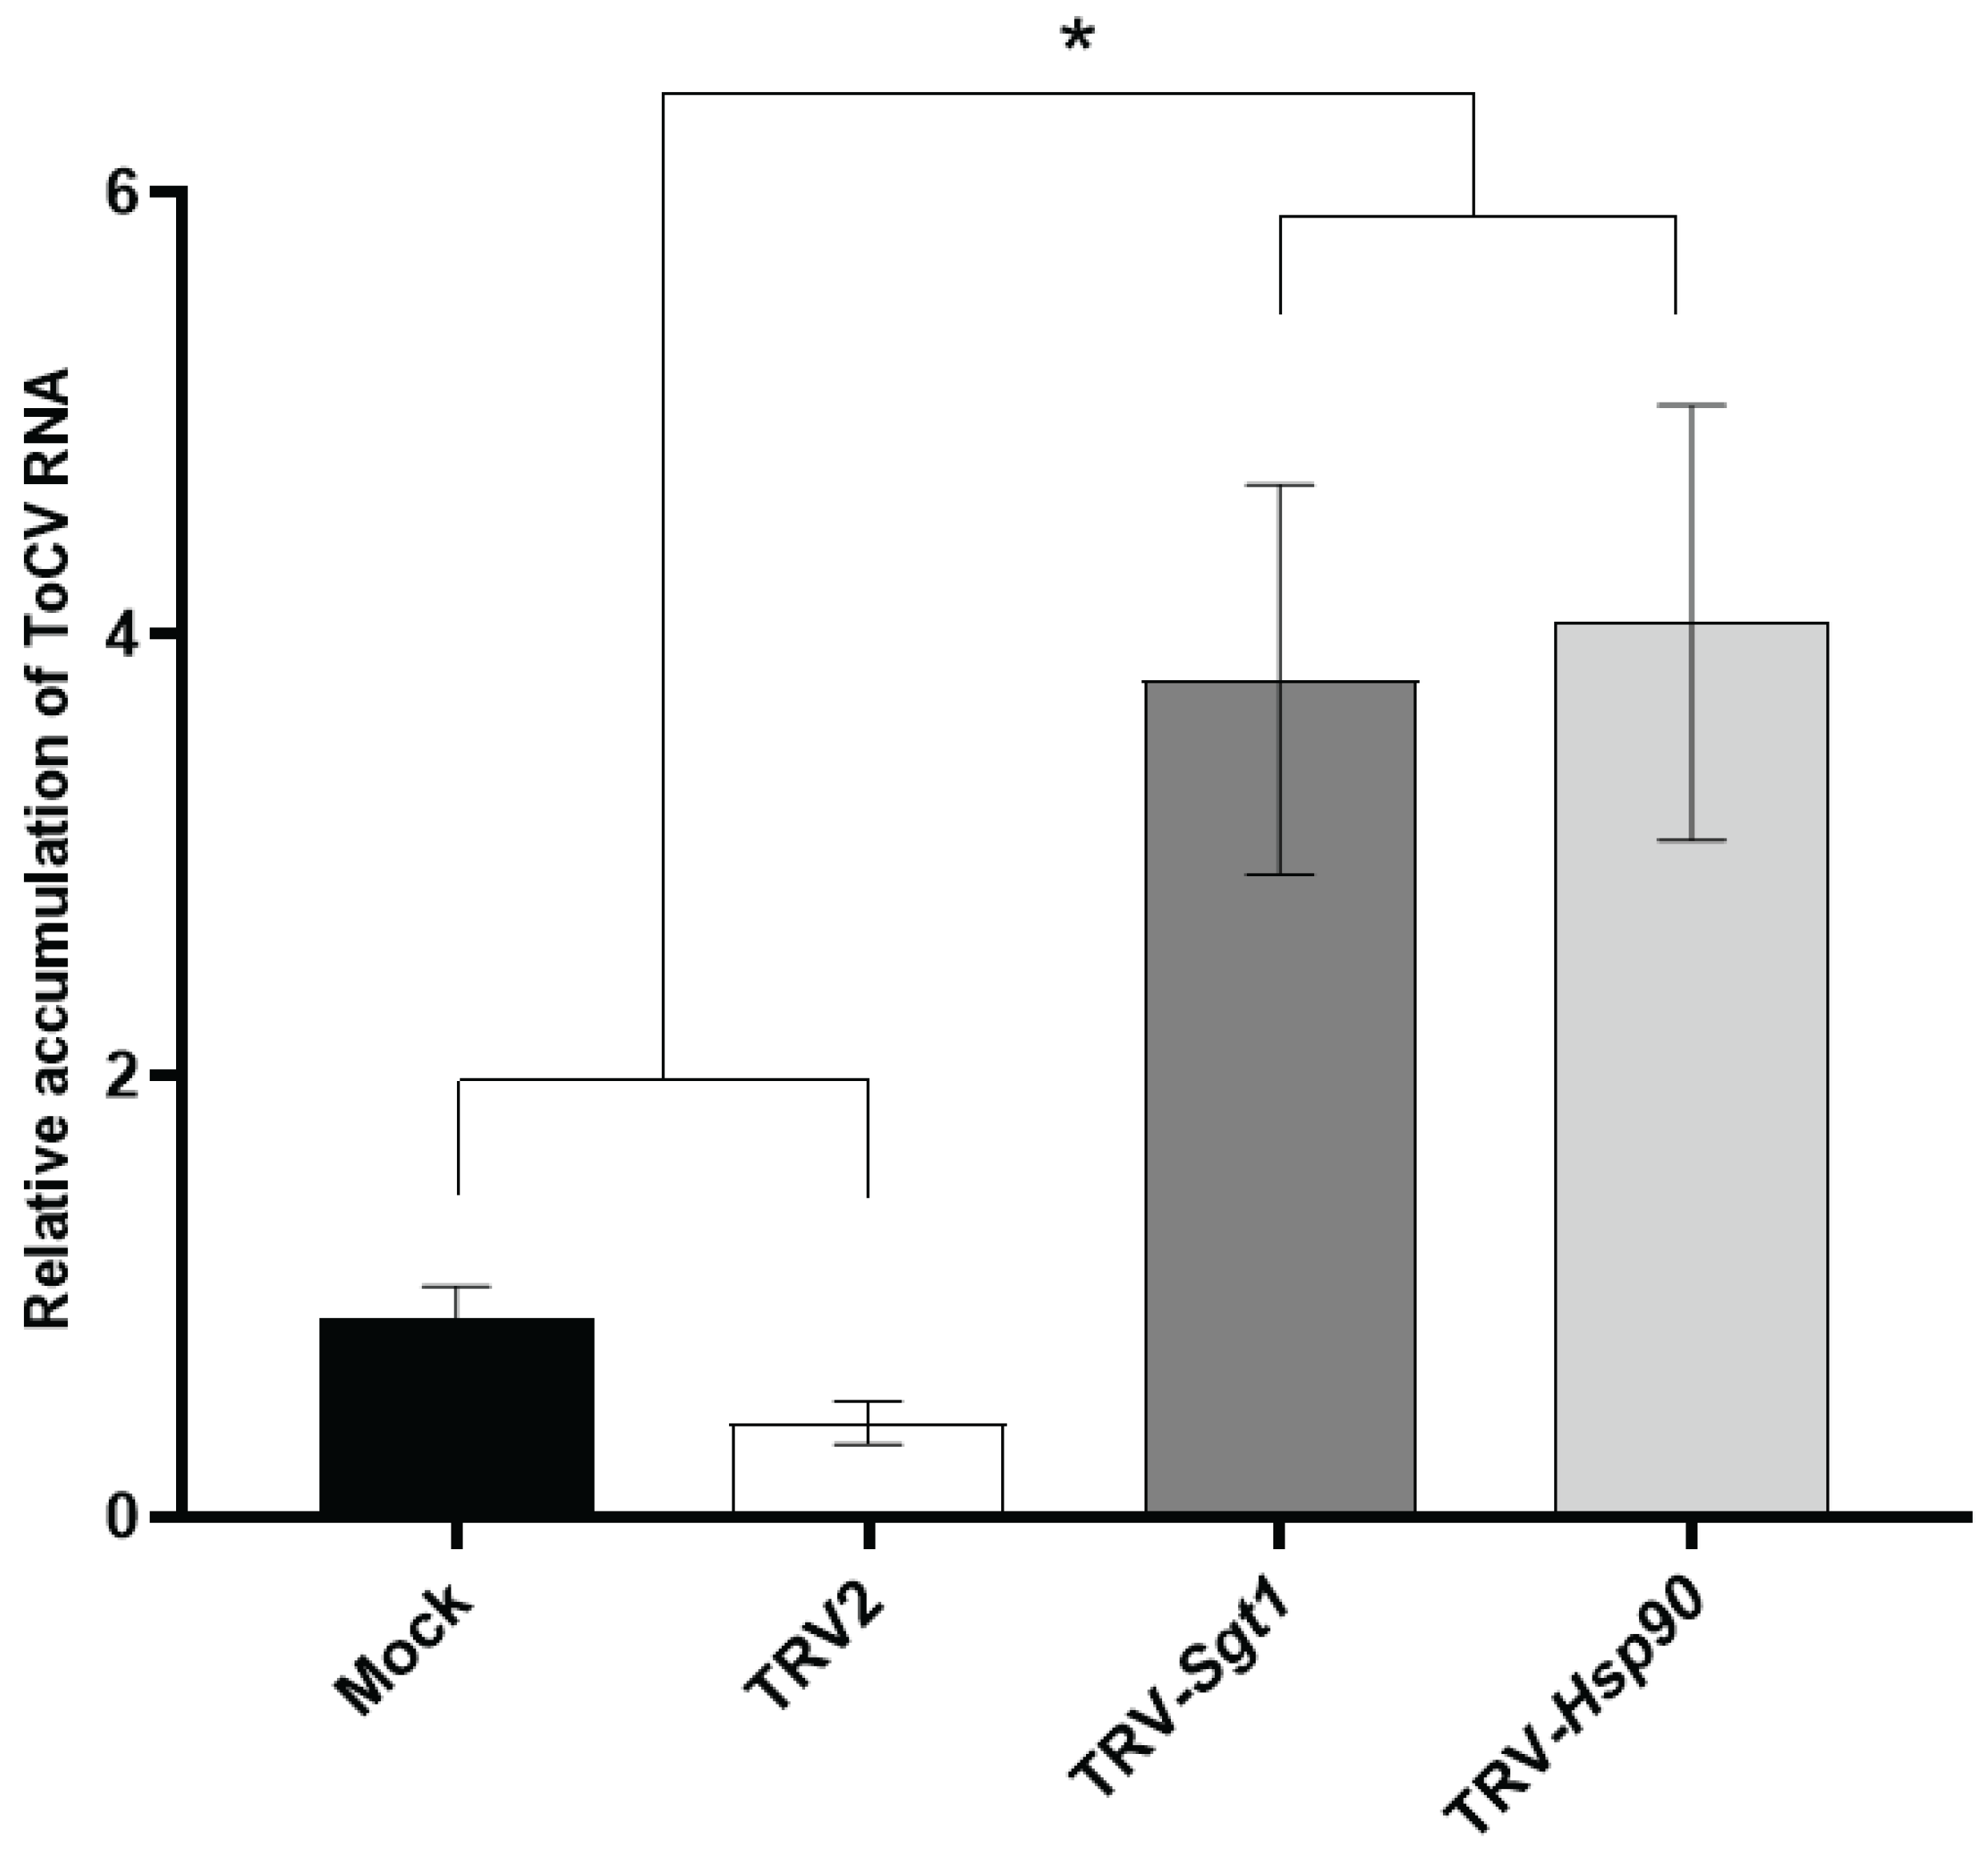
The KEGG pathway enrichment analysis with up-regulated DEGs at 14 dpi showed that the plant-pathogen interaction KEGG pathway was the most significantly enriched in response to ToCV infection at 14 dpi (Figure 3A). Among up-regulated DEGs including in this pathway we focused on the chaperone Hsp90 and its co-chaperone Sgt1, both involved in plant immunity although their role in the interaction tomato-ToCV is unknown. In this context, a matter of interest was to investigate whether the silencing of Hsp90 and Stg1 might exert an influence on the accumulation of viral RNA in planta. Initial infection of tomato plants with TRV-Sgt1 or TRV-Hsp90 was followed by a challenge-inoculation with ToCV after 7 days. Silencing of Sgt1 led to plant lethality by 21 dpi, while Hsp90 silencing induced only a comparatively mild phenotype response (Figure S1A). RT-qPCR analysis at 7 dpi showed that the levels of target mRNAs were reduced in the silenced plants compared to the control plants inoculated with the empty TRV vector (Figure S1B and S1C). These plants were inoculated using ToCV viruliferous whiteflies, and viral RNA accumulation was assessed 12 days after whitefly-mediated inoculation in Hsp90 and Sgt1-silenced plants to prevent the development of the severe phenotype for Sgt1. The results showed a notable increase in the accumulation of ToCV RNA in the silenced plants, with levels approximately four times higher than those in the control TRV-infected plants (Figure 5). Moreover, no significant alterations were observed in the TRV accumulation levels (Figure S1D). These findings suggest that Hsp90 and Stg1 might play an important role for basal resistance against ToCV.

4. Discussion

In our study, our objective was to provide a comprehensive insight into the alterations within the tomato transcriptome throughout the course of ToCV infection. We accomplished this by analyzing the dynamic transcriptional responses of tomato plants at different time points following their infection by B. tabaci. Our findings revealed that gene expression in plants undergoes significant changes over time. We observed a large number of DEGs at 2 dpi (2,009), which a substantial decrease at 7 dpi (561). However, at 14 dpi we observed a remarkable reprogramming of the plant transcript profile, with 5,937 genes exhibiting differential expression (Figure 1B). These findings highlight the dynamic nature of the plant transcriptome during the progression of ToCV infection, and offer a snapshot of a particular stage in the plant's life cycle and the course of infection. On the other hand, the PCA analysis indicated that mock and ToCV samples formed a distinct cluster from naïve samples at 2 dpi (Figure 1A), suggesting that the host can sense the whitefly infestation regardless of whether the whitefly was viruliferous or non-viruliferous. However, the significant deregulation of 2,009 genes observed at 2 dpi in the ToCV samples, as compared to the mock samples, strongly suggests that ToCV may have significant effects on whitefly-plant interaction. Interestingly, the pathways related to flavonoids [54,55] and the steroid biosynthesis involved in resistance to insect herbivories were repressed during ToCV infection (Figure 3A). Yao et al, 2019 [55] demonstrated that tomatoes with high flavonoid levels exhibited resistance to B. tabaci, resulting in a decrease in both the primary and secondary spread of TYLCV. Furthermore, steroid plant hormones such as Brassinosteroids (BRs), which are involved in plant growth and development [56], also play a role in plant-herbivore interactions likely by regulating glucosinolate biosynthesis [57,58,59,60]. Additionally, several studies have suggested that BRs also function in plant immunity by inducing plant defenses against viruses [61,62,63]. Further studies are required to gain a deeper understanding of the specific mechanisms underlying the repression of flavonoids and BRs during ToCV infection, and to investigate how this repression may influence insect resistance and the spread of the virus.
The GO analysis revealed there was an up-regulation of genes associated with the microtubule-based process at 2 dpi (Figure 2A), a phenomenon frequently observed in response to viral infections [64,65,66]. Microtubules are known to play crucial roles in various biological processes, such as virus movement, the assembly of viral replication complexes, and the formation of transmission bodies that facilitate virus transmission between plants via insect vectors [67,68]. However, the rationale behind their up-regulation in ToCV-infected plants remains unknown, and further investigation will be necessary to uncover any underlying causes. GO annotation also revealed an enrichment of genes related to photosynthesis activity and chloroplast organization and structure at 2 and 7 dpi. However, an intriguing contrast emerged, as these same GO terms exhibited down-regulation at 14 dpi (Figure 2 and Figure 3). This underscores once again the need to conduct transcriptomic analyses at different time points during viral infection. Considering that chloroplasts function as factories for the synthesis of key signaling molecules such as salicylic acid (SA) and jasmonic acid (JA) for host defense responses against viruses [69], it is reasonable to speculate that the activation of these pathways constitutes a direct reaction to viral infection. On the contrary, at 14 dpi we observed a downregulation of genes linked to chloroplasts and photosynthesis, consistent with previous findings reported by (Çevik et al., 2021). This downregulation was accompanied by an upregulation of genes involved in SA signaling pathway. Such patterns are frequently documented in virus-infected tissues and are believed to underlie the development of chlorosis symptoms commonly associated with viral infections [9,70]. Indeed, several genes related with leaf senescence and autophagy activity [71,72] were up-regulated during ToCV infection at 14 dpi (Figure 4A). Similar findings were reported by [17] in ToCV-infected plants, despite differences in experimental conditions, tomato cultivars, and virus isolates used in their study. These findings suggest that diverse genes related to defense pathways of tomato plants are expressed during late stages of ToCV infection [73,74].
We found that RNA2 spawns much more abundant vsRNAs than RNA1, which reflects the higher replication rate of the RNA2 (data not shown) potentially leads to the production of more abundant dsRNA replication intermediates for dicing. It has been well established that DCL4 function as the primary sensor of viral dsRNAs producing vsRNAs 21-nt in length [23]. However, consistent with a previous report [35], we found that vsRNAs originating from ToCV were predominantly 22-nt in length, likely orchestrated by tomato orthologs of DCL2. Considering that viral suppressors of RNA silencing (VSRs) have the potential to interfere with host factors involved in antiviral silencing [75], the prevalence of 22-nt vsRNAs may be a consequence of the ability of ToCV-encoded VSRs [76] to disrupt the functioning of DCL4. Similar mechanisms have been observed in other viruses, such as Turnip crinkle virus, where the VSR CP inhibits DCL4 activity, and consequently DCL2 becomes the major contributor for vsRNAs biogenesis [24]. Interestingly, our transcriptome analysis revealed that single infections with ToCV led to a significant upregulation in the expression levels of DCL2b, DCL2d, and DCL4 when compared to mock-infected plants. Furthermore, Wang et al. (2018) [77] documented that tomato DCL2b ranks among the most abundantly expressed members of the DCL2 family and offers enhanced protection against tobacco mosaic virus. Approximately equal amounts of vsRNAs were mapped respectively to the positive and negative strands of RNA1 and RNA2 viral genomic of ToCV (Figure 4B), indicating vsRNAs were likely produced from double-stranded replicative intermediates.
The Hsp90-Sgt1 complex plays a critical role in regulating the plant immune system against pathogens, including plant viruses [78]. In this study, we noted a substantial upregulation of Hsp90 and Sgt1 expression at 14 dpi following ToCV infection. Notably, the silencing of these genes resulted in a higher level of ToCV accumulation in tomato plants, suggesting their potential involvement in antiviral responses specific to the tomato-ToCV pathosystem. Additionally, silencing of Sgt1 through VIGS led to cell death, whereas silencing of Hsp90 did not cause noticeable differences when compared to control TRV-infected plants. Our results are in line with those of [79], who demonstrated that silencing the tomato Hsp90 and Sgt1 genes resulted in increased TYLCV accumulation. However, while they reported that silencing of both genes led to cell death, we observed this phenotype only in Sgt1 tomato plants (Figure S1A). Interestingly, it has been reported that the infection of various RNA viruses, such as TSWV and potato virus X, is impaired in Sgt1-silenced N. benthamiana, despite the fact that these viral infections strongly upregulate Sgt1 expression in the plant (Ye et al., 2012; Qian et al., 2018). Therefore, The Hsp90-Sgt1 complex appears to serve dual functions, playing a crucial role in basal resistance against certain viruses while also potentially acting as a proviral factor for others.
We believe that our study enhances our comprehension of the molecular responses occurring in ToCV-infected tomato plants. This knowledge may aid in the identification of potential genes implicated in defensive responses, making them good candidates for future breeding efforts. These candidates could serve as targets for the development of new strategies aimed at controlling the disease through the modulation of endogenous pathways.

Supplementary Materials

The following supporting information can be downloaded at the website of this paper posted on Preprints.org. Figure S1: Response of Tomato Plants to Virus-Induced Gene Silencing (VIGS) of the Hsp90 and Sgt1 genes.

Author Contributions

Conceptualization, I.O., J.J.L-M. and J.A.D-P.; methodology, I.O., N.F-P., A.E-C., J.J.L-M. and J.A.D-P. ; software, I.O., N.F-P. and A.E-C. .; validation, I.O. and N.F-P.; formal analysis, J.J.L-M. and J.A.D-P.; investigation, I.O.; resources, J.J.L-M. and J.A.D-P.; data curation, I.O., and N.F-P.; writing—original draft preparation, I.O.; writing—review and editing, I.O., J.J.L-M. and J.A.D-P.; supervision, J.J.L-M. and J.A.D-P. ; project administration, J.J.L-M. and J.A.D-P.; funding acquisition, J.J.L-M. and J.A.D-P. All authors have read and agreed to the published version of the manuscript.

Funding

Research in our laboratories has received funding from projects PID2019-105692RB-I00 and PID2019-107657RB-C21 funded by MCIN/AEI/10.13039/501100011033 and PID2022-139376OB-C32 and PID2022-139376OB-C33 funded by MCIN/AEI/ 10.13039/501100011033 by “ERDF A way of making Europe”. This project has received funding from the European Union’s Horizon 2020 research and innovation programme under grant agreement No 101000570. I.O. was recipient of FPI grant BES-2017-080808 funded by MCIN/AEI/ 10.13039/501100011033 and by "ESF Investing in your Future". N.F-P was recipient of the Spanish Ramón y Cajal Grant RYC2020-030219-I funded by MCIN/AEI/ 10.13039/501100011033 and by "ESF Investing in your Future". Research at CRAG was also supported by grants SEV-2015-0533 and CEX2019-000902-S funded by MCIN/AEI/10.13039/501100011033, and by the CERCA Programme, Generalitat de Catalunya.

Institutional Review Board Statement

Not applicable.

Informed Consent Statement

Not applicable.

Data Availability Statement

Not applicable.

Acknowledgments

We thank professor J. Navas-Castillo for providing the isolate of ToCV

Conflicts of Interest

The authors declare no conflict of interest.

References

  1. Fiallo-Olivé, E.; Navas-Castillo, J. Tomato Chlorosis Virus, an Emergent Plant Virus Still Expanding Its Geographical and Host Ranges. Mol. Plant Pathol. 2019, 20, 1307–1320. [Google Scholar] [CrossRef] [PubMed]
  2. Wintermantel, W.M.; Wisler, G.C.; Anchieta, A.G.; Liu, H.-Y.; Karasev, A.V.; Tzanetakis, I.E. The Complete Nucleotide Sequence and Genome Organization of Tomato Chlorosis Virus. Arch. Virol. 2005, 150, 2287–2298. [Google Scholar] [CrossRef] [PubMed]
  3. Fortes, I.M.; Fernández-Muñoz, R.; Moriones, E. The Crinivirus Tomato Chlorosis Virus Compromises the Control of Tomato Yellow Leaf Curl Virus in Tomato Plants by the Ty-1 Gene. Phytopathology® 2023, PHYTO-09-22-0334-R. [Google Scholar] [CrossRef]
  4. Li, J.; Wang, J.; Ding, T.; Chu, D. Synergistic Effects of a Tomato Chlorosis Virus and Tomato Yellow Leaf Curl Virus Mixed Infection on Host Tomato Plants and the Whitefly Vector. Front. Plant Sci. 2021, 12, 672400. [Google Scholar] [CrossRef] [PubMed]
  5. Moreno, A.B.; López-Moya, J.J. When Viruses Play Team Sports: Mixed Infections in Plants. Phytopathology® 2020, 110, 29–48. [Google Scholar] [CrossRef] [PubMed]
  6. Ontiveros, I.; López-Moya, J.J.; Díaz-Pendón, J.A. Coinfection of Tomato Plants with Tomato Yellow Leaf Curl Virus and Tomato Chlorosis Virus Affects the Interaction with Host and Whiteflies. Phytopathology® 2022, 112, 944–952. [Google Scholar] [CrossRef]
  7. Nelson, R.S.; Citovsky, V. Plant Viruses. Invaders of Cells and Pirates of Cellular Pathways. Plant Physiol. 2005, 138, 1809–1814. [Google Scholar] [CrossRef] [PubMed]
  8. Goyer, A.; Hamlin, L.; Crosslin, J.M.; Buchanan, A.; Chang, J.H. RNA-Seq Analysis of Resistant and Susceptible Potato Varieties during the Early Stages of Potato Virus Y Infection. BMC Genomics 2015, 16, 472. [Google Scholar] [CrossRef] [PubMed]
  9. Li, Y.; Cui, H.; Cui, X.; Wang, A. The Altered Photosynthetic Machinery during Compatible Virus Infection. Curr. Opin. Virol. 2016, 17, 19–24. [Google Scholar] [CrossRef] [PubMed]
  10. Lu, J.; Du, Z.-X.; Kong, J.; Chen, L.-N.; Qiu, Y.-H.; Li, G.-F.; Meng, X.-H.; Zhu, S.-F. Transcriptome Analysis of Nicotiana Tabacum Infected by Cucumber Mosaic Virus during Systemic Symptom Development. PLoS ONE 2012, 7, e43447. [Google Scholar] [CrossRef]
  11. Wu, M.; Ding, X.; Fu, X.; Lozano-Duran, R. Transcriptional Reprogramming Caused by the Geminivirus Tomato Yellow Leaf Curl Virus in Local or Systemic Infections in Nicotiana Benthamiana. BMC Genomics 2019, 20, 542. [Google Scholar] [CrossRef]
  12. Xu, M.; Chen, J.; Huang, Y.; Shen, D.; Sun, P.; Xu, Y.; Tao, X. Dynamic Transcriptional Profiles of Arabidopsis Thaliana Infected by Tomato Spotted Wilt Virus. Phytopathology® 2020, 110, 153–163. [Google Scholar] [CrossRef] [PubMed]
  13. Jain, M. Next-Generation Sequencing Technologies for Gene Expression Profiling in Plants. Brief. Funct. Genomics 2012, 11, 63–70. [Google Scholar] [CrossRef] [PubMed]
  14. Wang, Z.; Gerstein, M.; Snyder, M. RNA-Seq: A Revolutionary Tool for Transcriptomics. Nat. Rev. Genet. 2009, 10, 57–63. [Google Scholar] [CrossRef]
  15. Zanardo, L.G.; De Souza, G.B.; Alves, M.S. Transcriptomics of Plant–Virus Interactions: A Review. Theor. Exp. Plant Physiol. 2019, 31, 103–125. [Google Scholar] [CrossRef]
  16. Seo, J.-K.; Kim, M.-K.; Kwak, H.-R.; Choi, H.-S.; Nam, M.; Choe, J.; Choi, B.; Han, S.-J.; Kang, J.-H.; Jung, C. Molecular Dissection of Distinct Symptoms Induced by Tomato Chlorosis Virus and Tomato Yellow Leaf Curl Virus Based on Comparative Transcriptome Analysis. Virology 2018, 516, 1–20. [Google Scholar] [CrossRef] [PubMed]
  17. Yue, H.; Huang, L.-P.; Lu, D.-Y.-H.; Zhang, Z.-H.; Zhang, Z.; Zhang, D.-Y.; Zheng, L.-M.; Gao, Y.; Tan, X.-Q.; Zhou, X.-G.; et al. Integrated Analysis of microRNA and mRNA Transcriptome Reveals the Molecular Mechanism of Solanum Lycopersicum Response to Bemisia Tabaci and Tomato Chlorosis Virus. Front. Microbiol. 2021, 12, 693574. [Google Scholar] [CrossRef] [PubMed]
  18. Reuper, H.; Amari, K.; Krenz, B. Analyzing the G3BP-like Gene Family of Arabidopsis Thaliana in Early Turnip Mosaic Virus Infection. Sci. Rep. 2021, 11, 2187. [Google Scholar] [CrossRef] [PubMed]
  19. Thivierge, K.; Nicaise, V.; Dufresne, P.J.; Cotton, S.; Laliberté, J.-F.; Le Gall, O.; Fortin, M.G. Plant Virus RNAs. Coordinated Recruitment of Conserved Host Functions by (+) ssRNA Viruses during Early Infection Events. Plant Physiol. 2005, 138, 1822–1827. [Google Scholar] [CrossRef] [PubMed]
  20. Baulcombe, D. RNA Silencing in Plants. Nature 2004, 431, 356–363. [Google Scholar] [CrossRef]
  21. Ding, S.-W. RNA-Based Antiviral Immunity. Nat. Rev. Immunol. 2010, 10, 632–644. [Google Scholar] [CrossRef]
  22. Ding, S.-W. Transgene Silencing, RNA Interference, and the Antiviral Defense Mechanism Directed by Small Interfering RNAs. Phytopathology® 2023, 113, 616–625. [Google Scholar] [CrossRef]
  23. Llave, C. Virus-Derived Small Interfering RNAs at the Core of Plant–Virus Interactions. Trends Plant Sci. 2010, 15, 701–707. [Google Scholar] [CrossRef] [PubMed]
  24. Deleris, A.; Gallego-Bartolome, J.; Bao, J.; Kasschau, K.D.; Carrington, J.C.; Voinnet, O. Hierarchical Action and Inhibition of Plant Dicer-Like Proteins in Antiviral Defense. Science 2006, 313, 68–71. [Google Scholar] [CrossRef] [PubMed]
  25. Diaz-Pendon, J.A.; Li, F.; Li, W.-X.; Ding, S.-W. Suppression of Antiviral Silencing by Cucumber Mosaic Virus 2b Protein in Arabidopsis Is Associated with Drastically Reduced Accumulation of Three Classes of Viral Small Interfering RNAs. Plant Cell 2007, 19, 2053–2063. [Google Scholar] [CrossRef] [PubMed]
  26. Donaire, L.; Barajas, D.; Martínez-García, B.; Martínez-Priego, L.; Pagán, I.; Llave, C. Structural and Genetic Requirements for the Biogenesis of Tobacco Rattle Virus -Derived Small Interfering RNAs. J. Virol. 2008, 82, 5167–5177. [Google Scholar] [CrossRef]
  27. Lopez-Gomollon, S.; Baulcombe, D.C. Roles of RNA Silencing in Viral and Non-Viral Plant Immunity and in the Crosstalk between Disease Resistance Systems. Nat. Rev. Mol. Cell Biol. 2022, 23, 645–662. [Google Scholar] [CrossRef] [PubMed]
  28. Iwakawa, H.; Lam, A.Y.W.; Mine, A.; Fujita, T.; Kiyokawa, K.; Yoshikawa, M.; Takeda, A.; Iwasaki, S.; Tomari, Y. Ribosome Stalling Caused by the Argonaute-microRNA-SGS3 Complex Regulates the Production of Secondary siRNAs in Plants. Cell Rep. 2021, 35, 109300. [Google Scholar] [CrossRef] [PubMed]
  29. Wu, H.; Li, B.; Iwakawa, H.; Pan, Y.; Tang, X.; Ling-hu, Q.; Liu, Y.; Sheng, S.; Feng, L.; Zhang, H.; et al. Plant 22-Nt siRNAs Mediate Translational Repression and Stress Adaptation. Nature 2020, 581, 89–93. [Google Scholar] [CrossRef] [PubMed]
  30. Donaire, L.; Wang, Y.; Gonzalez-Ibeas, D.; Mayer, K.F.; Aranda, M.A.; Llave, C. Deep-Sequencing of Plant Viral Small RNAs Reveals Effective and Widespread Targeting of Viral Genomes. Virology 2009, 392, 203–214. [Google Scholar] [CrossRef]
  31. Elvira González, L.; Peiró, R.; Rubio, L.; Galipienso, L. Persistent Southern Tomato Virus (STV) Interacts with Cucumber Mosaic and/or Pepino Mosaic Virus in Mixed- Infections Modifying Plant Symptoms, Viral Titer and Small RNA Accumulation. Microorganisms 2021, 9, 689. [Google Scholar] [CrossRef]
  32. Gonzalez-Ibeas, D.; Blanca, J.; Donaire, L.; Saladié, M.; Mascarell-Creus, A.; Cano-Delgado, A.; Garcia-Mas, J.; Llave, C.; Aranda, M.A. Analysis of the Melon (Cucumis Melo) Small RNAome by High-Throughput Pyrosequencing. BMC Genomics 2011, 12, 393. [Google Scholar] [CrossRef] [PubMed]
  33. Kavalappara, S.R.; Bag, S.; Luckew, A.; McGregor, C.E. Small RNA Profiling of Cucurbit Yellow Stunting Disorder Virus from Susceptible and Tolerant Squash (Cucurbita Pepo) Lines. Viruses 2023, 15, 788. [Google Scholar] [CrossRef] [PubMed]
  34. Olaya, C.; Fletcher, S.J.; Zhai, Y.; Peters, J.; Margaria, P.; Winter, S.; Mitter, N.; Pappu, H.R. The Tomato Spotted Wilt Virus (TSWV) Genome Is Differentially Targeted in TSWV-Infected Tomato (Solanum Lycopersicum) with or without Sw-5 Gene. Viruses 2020, 12, 363. [Google Scholar] [CrossRef] [PubMed]
  35. Xu, C.; Sun, X.; Taylor, A.; Jiao, C.; Xu, Y.; Cai, X.; Wang, X.; Ge, C.; Pan, G.; Wang, Q.; et al. Diversity, Distribution, and Evolution of Tomato Viruses in China Uncovered by Small RNA Sequencing. J. Virol. 2017, 91, e00173-17. [Google Scholar] [CrossRef] [PubMed]
  36. Piedra-Aguilera, Á.; Jiao, C.; Luna, A.P.; Villanueva, F.; Dabad, M.; Esteve-Codina, A.; Díaz-Pendón, J.A.; Fei, Z.; Bejarano, E.R.; Castillo, A.G. Integrated Single-Base Resolution Maps of Transcriptome, sRNAome and Methylome of Tomato Yellow Leaf Curl Virus (TYLCV) in Tomato. Sci. Rep. 2019, 9, 2863. [Google Scholar] [CrossRef] [PubMed]
  37. García-Cano, E.; Resende, R.O.; Fernández-Muñoz, R.; Moriones, E. Synergistic Interaction Between Tomato Chlorosis Virus and Tomato Spotted Wilt Virus Results in Breakdown of Resistance in Tomato. Phytopathology® 2006, 96, 1263–1269. [Google Scholar] [CrossRef] [PubMed]
  38. Fortes, I.M.; Moriones, E.; Navas-Castillo, J. Tomato Chlorosis Virus in Pepper: Prevalence in Commercial Crops in Southeastern Spain and Symptomatology under Experimental Conditions: Tomato Chlorosis Virus in Pepper. Plant Pathol. 2012, 61, 994–1001. [Google Scholar] [CrossRef]
  39. Bolger, A.M.; Lohse, M.; Usadel, B. Trimmomatic: A Flexible Trimmer for Illumina Sequence Data. Bioinformatics 2014, 30, 2114–2120. [Google Scholar] [CrossRef] [PubMed]
  40. Ewels, P.; Magnusson, M.; Lundin, S.; Käller, M. MultiQC: Summarize Analysis Results for Multiple Tools and Samples in a Single Report. Bioinformatics 2016, 32, 3047–3048. [Google Scholar] [CrossRef]
  41. Fernandez-Pozo, N.; Menda, N.; Edwards, J.D.; Saha, S.; Tecle, I.Y.; Strickler, S.R.; Bombarely, A.; Fisher-York, T.; Pujar, A.; Foerster, H.; et al. The Sol Genomics Network (SGN)—from Genotype to Phenotype to Breeding. Nucleic Acids Res. 2015, 43, D1036–D1041. [Google Scholar] [CrossRef]
  42. Kim, D.; Langmead, B.; Salzberg, S.L. HISAT: A Fast Spliced Aligner with Low Memory Requirements. Nat. Methods 2015, 12, 357–360. [Google Scholar] [CrossRef] [PubMed]
  43. Li, H.; Handsaker, B.; Wysoker, A.; Fennell, T.; Ruan, J.; Homer, N.; Marth, G.; Abecasis, G.; Durbin, R. 1000 Genome Project Data Processing Subgroup The Sequence Alignment/Map Format and SAMtools. Bioinformatics 2009, 25, 2078–2079. [Google Scholar] [CrossRef] [PubMed]
  44. Pertea, M.; Pertea, G.M.; Antonescu, C.M.; Chang, T.-C.; Mendell, J.T.; Salzberg, S.L. StringTie Enables Improved Reconstruction of a Transcriptome from RNA-Seq Reads. Nat. Biotechnol. 2015, 33, 290–295. [Google Scholar] [CrossRef] [PubMed]
  45. Love, M.I.; Huber, W.; Anders, S. Moderated Estimation of Fold Change and Dispersion for RNA-Seq Data with DESeq2. Genome Biol. 2014, 15, 550. [Google Scholar] [CrossRef] [PubMed]
  46. Raudvere, U.; Kolberg, L.; Kuzmin, I.; Arak, T.; Adler, P.; Peterson, H.; Vilo, J. G:Profiler: A Web Server for Functional Enrichment Analysis and Conversions of Gene Lists (2019 Update). Nucleic Acids Res. 2019, 47, W191–W198. [Google Scholar] [CrossRef] [PubMed]
  47. Li, H.; Durbin, R. Fast and Accurate Short Read Alignment with Burrows–Wheeler Transform. Bioinformatics 2009, 25, 1754–1760. [Google Scholar] [CrossRef] [PubMed]
  48. Seguin, J.; Otten, P.; Baerlocher, L.; Farinelli, L.; Pooggin, M.M. MISIS-2: A Bioinformatics Tool for in-Depth Analysis of Small RNAs and Representation of Consensus Master Genome in Viral Quasispecies. J. Virol. Methods 2016, 233, 37–40. [Google Scholar] [CrossRef]
  49. Liu, Y.; Schiff, M.; Marathe, R.; Dinesh-Kumar, S.P. Tobacco Rar1, EDS1 and NPR1/NIM1 like Genes Are Required for N-Mediated Resistance to Tobacco Mosaic Virus. Plant J. 2002, 30, 415–429. [Google Scholar] [CrossRef] [PubMed]
  50. Blanco-Sánchez, L.; Planelló, R.; Ferrero, V.; Fernández-Muñoz, R.; De La Peña, E.; Díaz Pendón, J.A. More than Trichomes and Acylsugars: The Role of Jasmonic Acid as Mediator of Aphid Resistance in Tomato. J. Plant Interact. 2023, 18, 2255597. [Google Scholar] [CrossRef]
  51. Expósito-Rodríguez, M.; Borges, A.A.; Borges-Pérez, A.; Pérez, J.A. Selection of Internal Control Genes for Quantitative Real-Time RT-PCR Studies during Tomato Development Process. BMC Plant Biol. 2008, 8, 131. [Google Scholar] [CrossRef]
  52. Rotenberg, D.; Thompson, T.S.; German, T.L.; Willis, D.K. Methods for Effective Real-Time RT-PCR Analysis of Virus-Induced Gene Silencing. J. Virol. Methods 2006, 138, 49–59. [Google Scholar] [CrossRef] [PubMed]
  53. Livak, K.J.; Schmittgen, T.D. Analysis of Relative Gene Expression Data Using Real-Time Quantitative PCR and the 2−ΔΔCT Method. Methods 2001, 25, 402–408. [Google Scholar] [CrossRef] [PubMed]
  54. Ramaroson, M.-L.; Koutouan, C.; Helesbeux, J.-J.; Le Clerc, V.; Hamama, L.; Geoffriau, E.; Briard, M. Role of Phenylpropanoids and Flavonoids in Plant Resistance to Pests and Diseases. Molecules 2022, 27, 8371. [Google Scholar] [CrossRef]
  55. Yao, Q.; Peng, Z.; Tong, H.; Yang, F.; Xing, G.; Wang, L.; Zheng, J.; Zhang, Y.; Su, Q. Tomato Plant Flavonoids Increase Whitefly Resistance and Reduce Spread of Tomato Yellow Leaf Curl Virus. J. Econ. Entomol. 2019, toz199. [Google Scholar] [CrossRef] [PubMed]
  56. Choudhary, S.P.; Yu, J.-Q.; Yamaguchi-Shinozaki, K.; Shinozaki, K.; Tran, L.-S.P. Benefits of Brassinosteroid Crosstalk. Trends Plant Sci. 2012, 17, 594–605. [Google Scholar] [CrossRef] [PubMed]
  57. Guo, R.; Qian, H.; Shen, W.; Liu, L.; Zhang, M.; Cai, C.; Zhao, Y.; Qiao, J.; Wang, Q. BZR1 and BES1 Participate in Regulation of Glucosinolate Biosynthesis by Brassinosteroids in Arabidopsis. J. Exp. Bot. 2013, 64, 2401–2412. [Google Scholar] [CrossRef] [PubMed]
  58. Miyaji, T.; Yamagami, A.; Kume, N.; Sakuta, M.; Osada, H.; Asami, T.; Arimoto, Y.; Nakano, T. Brassinosteroid-Related Transcription Factor BIL1/BZR1 Increases Plant Resistance to Insect Feeding. Biosci. Biotechnol. Biochem. 2014, 78, 960–968. [Google Scholar] [CrossRef] [PubMed]
  59. Wang, L.; Einig, E.; Almeida-Trapp, M.; Albert, M.; Fliegmann, J.; Mithöfer, A.; Kalbacher, H.; Felix, G. The Systemin Receptor SYR1 Enhances Resistance of Tomato against Herbivorous Insects. Nat. Plants 2018, 4, 152–156. [Google Scholar] [CrossRef]
  60. Yang, D.-H.; Hettenhausen, C.; Baldwin, I.T.; Wu, J. BAK1 Regulates the Accumulation of Jasmonic Acid and the Levels of Trypsin Proteinase Inhibitors in Nicotiana Attenuata’s Responses to Herbivory. J. Exp. Bot. 2011, 62, 641–652. [Google Scholar] [CrossRef]
  61. Kørner, C.J.; Klauser, D.; Niehl, A.; Domínguez-Ferreras, A.; Chinchilla, D.; Boller, T.; Heinlein, M.; Hann, D.R. The Immunity Regulator BAK1 Contributes to Resistance Against Diverse RNA Viruses. Mol. Plant-Microbe Interactions® 2013, 26, 1271–1280. [Google Scholar] [CrossRef]
  62. Lozano-Durán, R.; Zipfel, C. Trade-off between Growth and Immunity: Role of Brassinosteroids. Trends Plant Sci. 2015, 20, 12–19. [Google Scholar] [CrossRef] [PubMed]
  63. Yu, M.-H.; Zhao, Z.-Z.; He, J.-X. Brassinosteroid Signaling in Plant–Microbe Interactions. Int. J. Mol. Sci. 2018, 19, 4091. [Google Scholar] [CrossRef] [PubMed]
  64. Alcaide, C.; Donaire, L.; Aranda, M.A. Transcriptome Analyses Unveiled Differential Regulation of AGO and DCL Genes by Pepino Mosaic Virus Strains. Mol. Plant Pathol. 2022, 23, 1592–1607. [Google Scholar] [CrossRef] [PubMed]
  65. Dasgupta, U.; Mishra, G.P.; Dikshit, H.K.; Mishra, D.C.; Bosamia, T.; Roy, A.; Bhati, J.; Priti; Aski, M.; Kumar, R.R.; et al. Comparative RNA-Seq Analysis Unfolds a Complex Regulatory Network Imparting Yellow Mosaic Disease Resistance in Mungbean [Vigna Radiata (L.) R. Wilczek]. PLOS ONE 2021, 16, e0244593. [Google Scholar] [CrossRef] [PubMed]
  66. Liu, D.; Cheng, Y.; Gong, M.; Zhao, Q.; Jiang, C.; Cheng, L.; Ren, M.; Wang, Y.; Yang, A. Comparative Transcriptome Analysis Reveals Differential Gene Expression in Resistant and Susceptible Tobacco Cultivars in Response to Infection by Cucumber Mosaic Virus. Crop J. 2019, 7, 307–321. [Google Scholar] [CrossRef]
  67. Bak, A.; Gargani, D.; Macia, J.-L.; Malouvet, E.; Vernerey, M.-S.; Blanc, S.; Drucker, M. Virus Factories of Cauliflower Mosaic Virus Are Virion Reservoirs That Engage Actively in Vector Transmission. J. Virol. 2013, 87, 12207–12215. [Google Scholar] [CrossRef] [PubMed]
  68. Niehl, A.; Peña, E.J.; Amari, K.; Heinlein, M. Microtubules in Viral Replication and Transport. Plant J. 2013, 75, 290–308. [Google Scholar] [CrossRef] [PubMed]
  69. Yang, F.; Xiao, K.; Pan, H.; Liu, J. Chloroplast: The Emerging Battlefield in Plant–Microbe Interactions. Front. Plant Sci. 2021, 12, 637853. [Google Scholar] [CrossRef] [PubMed]
  70. Zhao, J.; Zhang, X.; Hong, Y.; Liu, Y. Chloroplast in Plant-Virus Interaction. Front. Microbiol. 2016, 7. [Google Scholar] [CrossRef]
  71. Salguero-Linares, J.; Coll, N.S. Cell Death as a Defense Strategy against Pathogens in Plants and Animals. PLOS Pathog. 2023, 19, e1011253. [Google Scholar] [CrossRef]
  72. Yang, M.; Liu, Y. Autophagy in Plant Viral Infection. FEBS Lett. 2022, 596, 2152–2162. [Google Scholar] [CrossRef] [PubMed]
  73. Jones, J.D.G.; Dangl, J.L. The Plant Immune System. Nature 2006, 444, 323–329. [Google Scholar] [CrossRef] [PubMed]
  74. Miozzi, L.; Napoli, C.; Sardo, L.; Accotto, G.P. Transcriptomics of the Interaction between the Monopartite Phloem-Limited Geminivirus Tomato Yellow Leaf Curl Sardinia Virus and Solanum Lycopersicum Highlights a Role for Plant Hormones, Autophagy and Plant Immune System Fine Tuning during Infection. PLoS ONE 2014, 9, e89951. [Google Scholar] [CrossRef] [PubMed]
  75. Diaz-Pendon, J.A.; Ding, S.-W. Direct and Indirect Roles of Viral Suppressors of RNA Silencing in Pathogenesis. Annu. Rev. Phytopathol. 2008, 46, 303–326. [Google Scholar] [CrossRef] [PubMed]
  76. Cañizares, M.C.; Navas-Castillo, J.; Moriones, E. Multiple Suppressors of RNA Silencing Encoded by Both Genomic RNAs of the Crinivirus, Tomato Chlorosis Virus. Virology 2008, 379, 168–174. [Google Scholar] [CrossRef] [PubMed]
  77. Wang, T.; Deng, Z.; Zhang, X.; Wang, H.; Wang, Y.; Liu, X.; Liu, S.; Xu, F.; Li, T.; Fu, D.; et al. Tomato DCL2b Is Required for the Biosynthesis of 22-Nt Small RNAs, the Resulting Secondary siRNAs, and the Host Defense against ToMV. Hortic. Res. 2018, 5, 62. [Google Scholar] [CrossRef] [PubMed]
  78. Shirasu, K. The HSP90-SGT1 Chaperone Complex for NLR Immune Sensors. Annu. Rev. Plant Biol. 2009, 60, 139–164. [Google Scholar] [CrossRef]
  79. Moshe, A.; Gorovits, R.; Liu, Y.; Czosnek, H. Tomato Plant Cell Death Induced by Inhibition of HSP90 Is Alleviated by Tomato Yellow Leaf Curl Virus Infection: Cell Death Reduction in Virus-Infected Plants. Mol. Plant Pathol. 2016, 17, 247–260. [Google Scholar] [CrossRef]
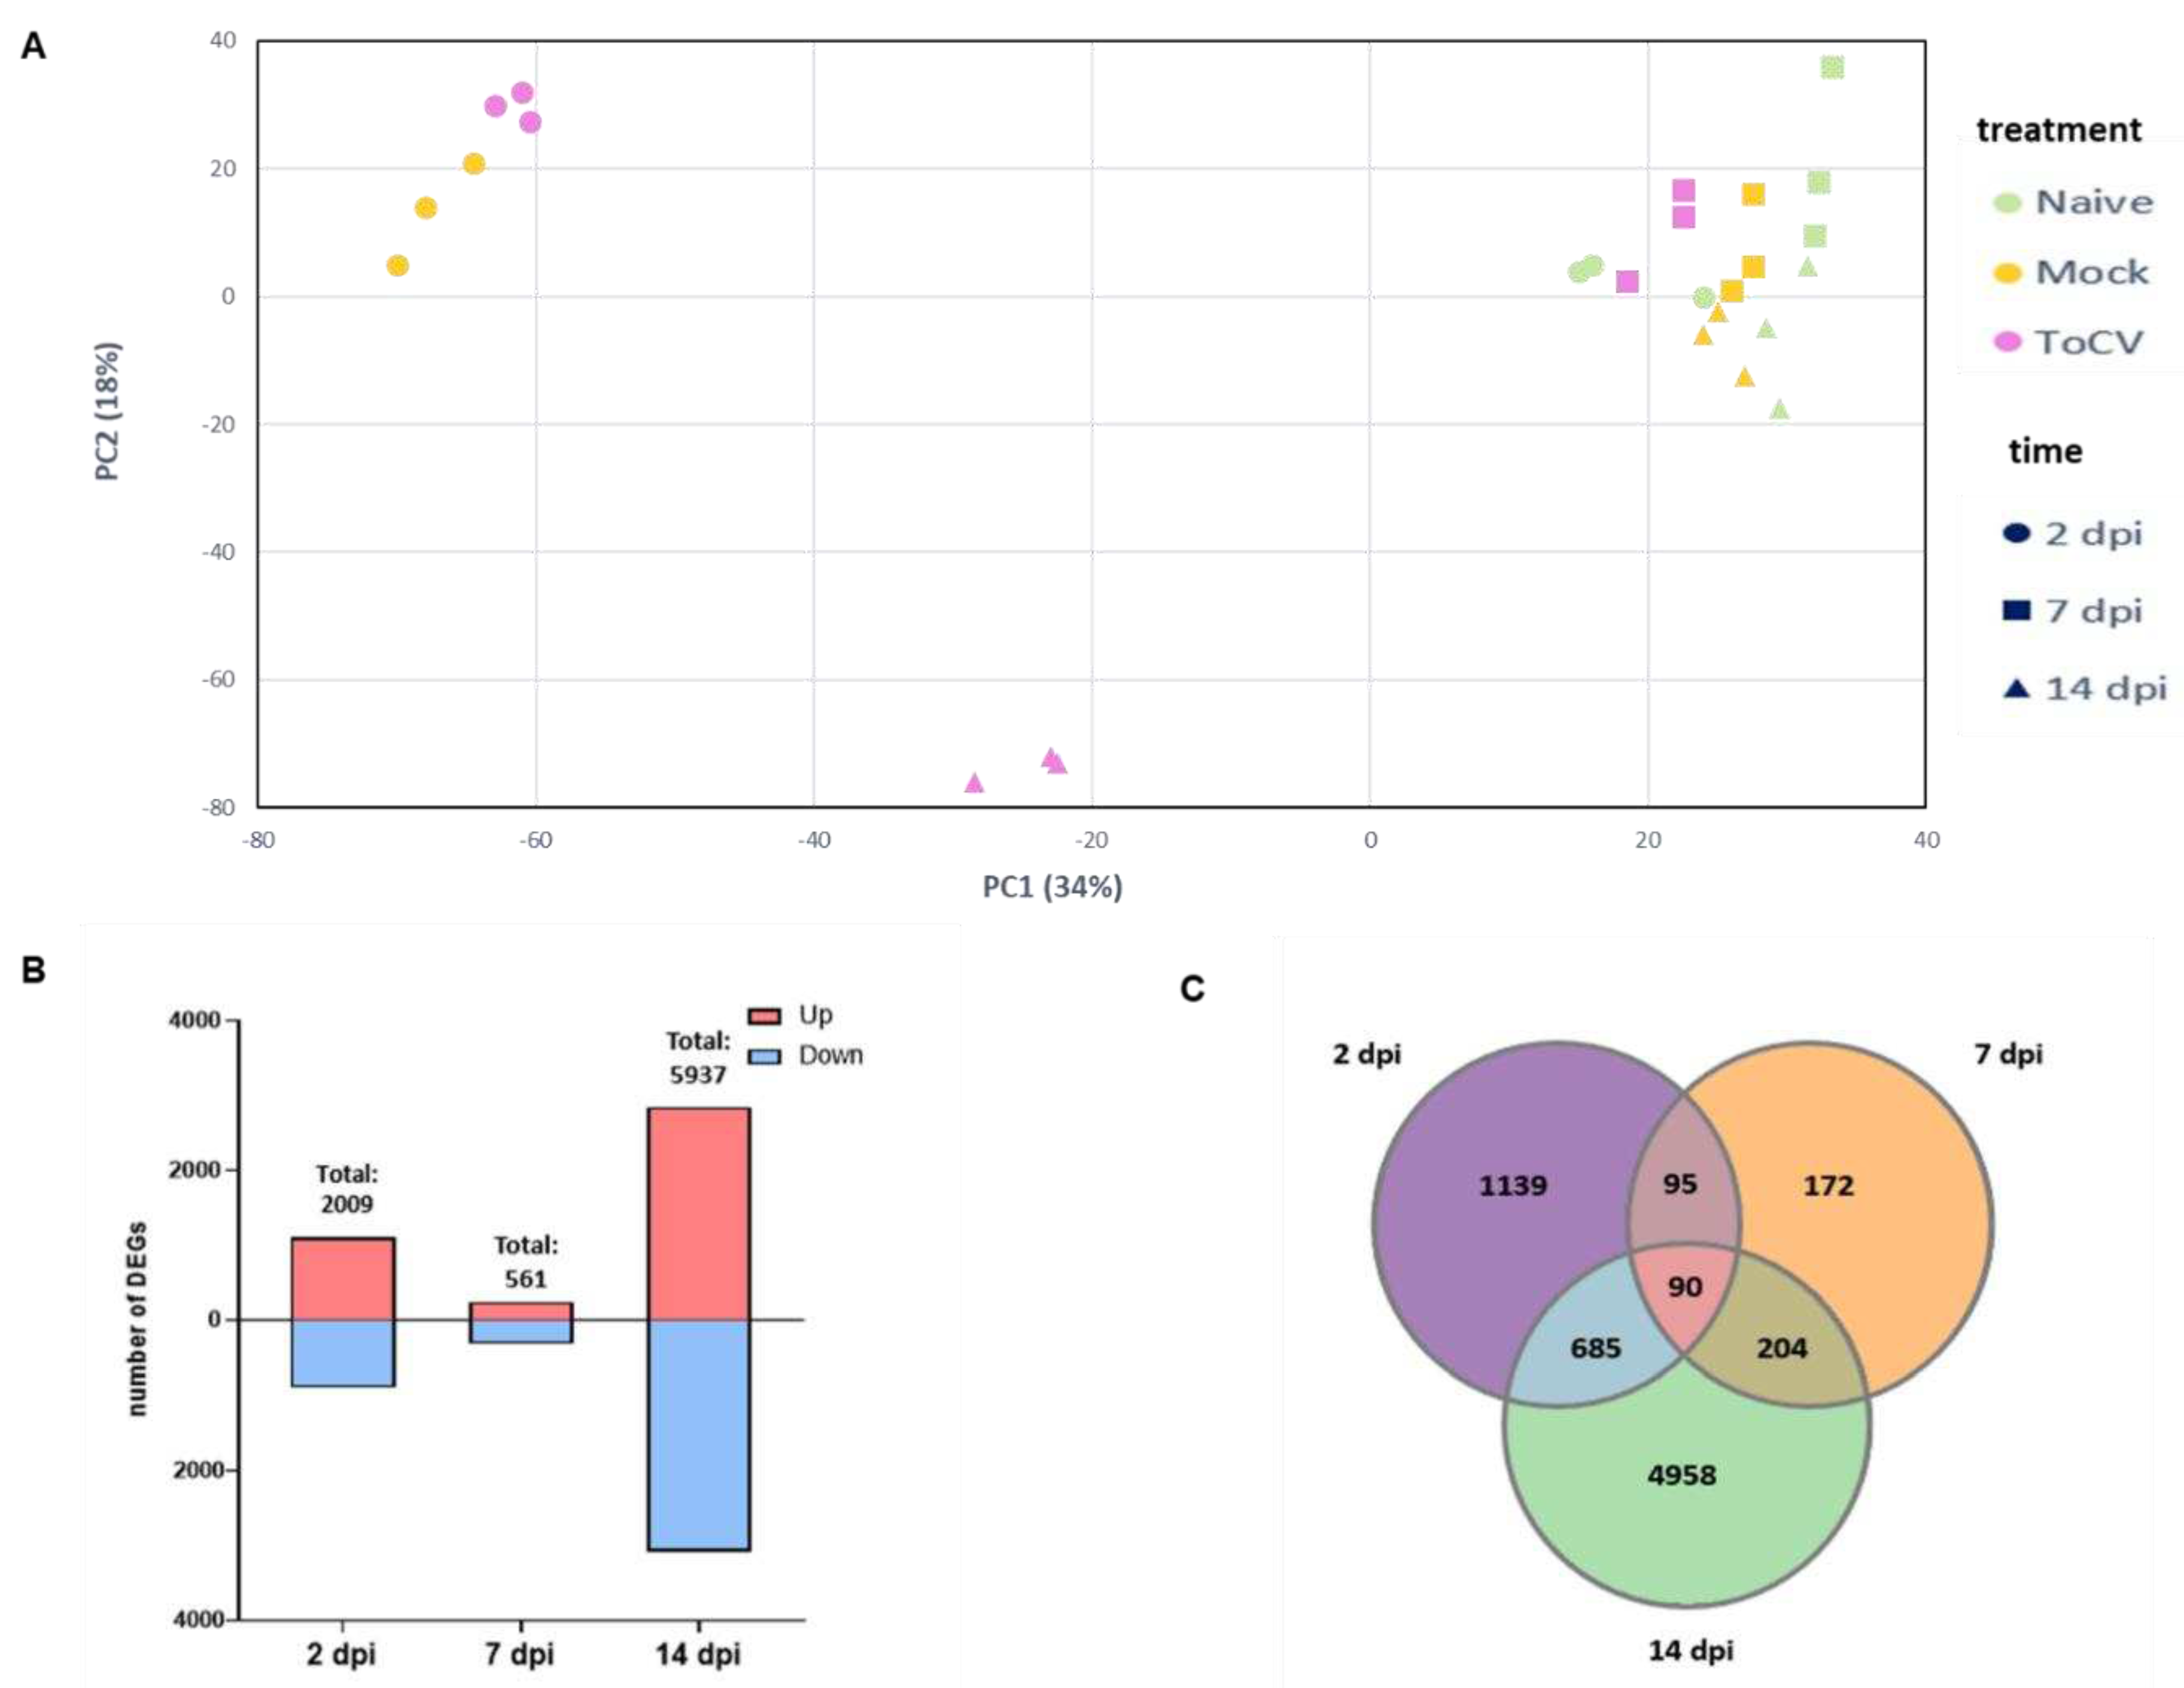
Figure 1. Exploratory analysis of transcriptomic data. (A) Principal component analysis (PCA) of all replicates from naïve (no whitefly and no virus), Mock (non-viruliferous whiteflies) and ToCV (ToCV-viruliferous whiteflies) samples at 2, 7, and 14 days post-infection (dpi). (B) Number of up-regulated and down-regulated differentially expressed genes (DEGs) at each time point after ToCV infection. Red and blue bars represent numbers of up-regulated and down-regulated genes, respectively. Total indicates the total number of both up-regulated and down-regulated DEGs. (C) Venn diagram displaying the number of shared and distinct DEGs across the three specified time points.
Preprints 89375 g001
Figure 2. Gene ontology (GO) enrichment analysis of the differentially expressed genes (DEGs) in response to ToCV infection at 2, 7 and 14 days post inoculation (dpi). Enrichment of GO terms among the up-regulated (A) and down-regulated (B) DEGs. Each cell is coloured based on the number of genes associated with the respective GO term.
Preprints 89375 g002
Figure 3. KEGG enrichment analysis. Top KEGG pathways enriched with up-regulated (A) and down-regulated (B) differentially expressed genes (DEGs) triggered by ToCV infection at 2, 7 and 14 days post inoculation (dpi).
Preprints 89375 g003
Figure 4. Global analysis of virus-derived small RNAs (vsRNAs) in tomato plants infected with ToCV. (A). Percentage of vsRNAs in the 20–25 nt reads pool mapped to RNA1 and RNA2 of the ToCV genome. (B) Single-nucleotide resolution maps of vsRNAs from tomato plants challenged by ToCV. Positive- and negative-strand reads are shown in blue and red, respectively. Genome organization of each viral genomic RNA is shown.
Preprints 89375 g004
Figure 5. Silencing of Hsp 90 and Sgt1 through VIGS enhanced susceptibility to ToCV infection. Relative accumulation of ToCV RNA at 12 days post inoculation (dpi) analyzed by RT-qPCR in untreated control plants (mock) and plants pretreated with TRV2 empty vector, TRV:Sgt1, or TRV:Hsp90. Values were normalized using tomato elongation factor 1-α and Sand as reference genes, with Mock as the calibrator. Error bars represented standard errors of five biological replicates and asterisk indicates significant difference according to one-way ANOVA with P < 0.05.
Preprints 89375 g005
Disclaimer/Publisher’s Note: The statements, opinions and data contained in all publications are solely those of the individual author(s) and contributor(s) and not of MDPI and/or the editor(s). MDPI and/or the editor(s) disclaim responsibility for any injury to people or property resulting from any ideas, methods, instructions or products referred to in the content.
Copyright: This open access article is published under a Creative Commons CC BY 4.0 license, which permit the free download, distribution, and reuse, provided that the author and preprint are cited in any reuse.
Prerpints.org logo

Preprints.org is a free preprint server supported by MDPI in Basel, Switzerland.

Subscribe

© 2024 MDPI (Basel, Switzerland) unless otherwise stated