
Submitted:
01 November 2023
Posted:
01 November 2023
You are already at the latest version
Abstract
Ultrasonic sensors are inexpensive and can take measurements with high accuracy, even with simple hardware configurations, so they are used in various fields. When multiple ultrasonic sensors exist in the measurement space, crosstalk occurs due to other nodes, which causes measurement errors. Crosstalk includes not only receiving homogeneous signals from other nodes, but also overlap by other signals, and interference by heterogeneous signals. This paper proposes a method that uses frequency sweep keying modulation to be robust against overlap and a faster region-based convolutional neural networks (R-CNN)-based demodulator to reduce the interference caused by heterogeneous signals. The demodulator works by training faster R-CNN with the spectrograms of various received signals and classifying the received signals using a faster R-CNN. Experiments implementing an ultrasonic crosstalk environment showed that compared to on-off keying (OOK), phase-shift keying (PSK), and frequency-shift keying (FSK), the proposed method can implement CDMA even with shorter codes, and is robust against overlap. Compared to correlation-based frequency sweep keying, the time-of-flight error was reduced by approximately 75%. While existing demodulators did not consider heterogeneous signals, the proposed method ignored approximately 99% of the OOK and PSK signals, and approximately 79% of the FSK signals. The proposed method performs better than the existing methods and is expected to be used in various applications.
Keywords:
frequency sweep keying
; ultrasonic CDMA
; chirp ultrasound
; ultrasonic ranging system
; ultrasonic crosstalk reduction
; autonomous driving
; front-rear collision avoidance
1. Introduction
Ultrasonic sensors have transducers with various frequencies, from 40 kHz transducers commonly used for distance measurement in air to tens of MHz transducers used for non-destructive testing. The measurement resolution ranges from a few centimeters to tens of nm depending on the ultrasonic wavelength. Ultrasonic sensors have been used in various applications, such as distance measurement [1,2,3], positioning [4,5,6], non-destructive testing [7,8], and human physical inspection [9,10,11] because of their diverse measurement resolution. In particular, ultrasonic sensors are used widely in distance measurements in air because they are cheaper than other sensors and can measure with high accuracy, even with simple hardware configurations. For example, it is attached to a car and used to implement intelligent safety systems, such as autonomous driving or front and rear collision prevention [12,13,14]. Recently, crosstalk between ultrasonic signals has become a problem due to the increasing number of cars equipped with intelligent safety systems implemented by ultrasound [15,16]. When measuring in an environment where multiple ultrasonic sensors exist, ultrasonic signals may not be received, or ultrasonic signals from other sensors may be received due to crosstalk among each sensor. In this case, the measurement error of the ultrasonic sensor may become very large, or the system may not operate normally [17].
Several multiple-access methods have been proposed to ensure orthogonality between each signal in an environment with crosstalk among ultrasonic signals. First, time division multiple access (TDMA) is a method that ensures orthogonality by having each node measure the time of flight (TOF) at different times [18,19,20]. When using this method, even after the TOF measurement is completed, the ultrasound remains in the medium, so the subsequent TOF measurement must be performed after waiting until the ultrasound in the medium disappears entirely. Therefore, there is the measurement takes a long time. Second, frequency division multiple access (FDMA) is a method that ensures orthogonality by having each node perform TOF measurements with different frequencies [21,22]. There are two ways to implement FDMA: using a wideband ultrasound transducer and using several narrowband ultrasound transducers. Wideband ultrasound transducers are more difficult to obtain and expensive than general narrowband ultrasound transducers. When using multiple narrowband ultrasonic transducers, the number of ultrasonic transducers must also increase as the number of nodes increases. Third, code division multiple access (CDMA) ensures orthogonality by assigning different codes to each node [23,24,25,26]. It is a commonly used method in ultrasound and is also called coded ultrasound or multi-code ultrasound. CDMA does not increase hardware complexity and has the advantage of reducing the TOF error due to the spread spectrum of pulses during decoding.
In CDMA, modulation/demodulation methods include on-off keying (OOK) [27], phase shift keying (PSK) [28], frequency shift keying (FSK) [29], and frequency sweep keying [30]. OOK is simply a method of transmitting ultrasound when the code is ‘1’ and not when the code is ‘0’. With OOK, however, there is a high likelihood of demodulation as ‘1’ regardless of the code when signals overlap. PSK is a method of transmitting ultrasonic waves with different phases for codes ‘1’ and ‘0’. PSK has the disadvantage that demodulation does not work properly because a phase shift occurs due to the synthesis of two signals with different phases when signals overlap. FSK uses different frequencies of code ‘1’ and code ‘0’ and is more robust than other methods when overlapping. On the other hand, FSK has a poor signal-to-noise ratio (SNR) because it does not use the center frequency of the transducer. Frequency sweep keying, which was previously studied by our research team, is a modulation method that sweeps the frequency in the direction of the increase or decrease around the center frequency. Demodulation is performed by correlating the received signal and the reference bit mask in the spectrogram. Frequency sweep keying is robust to signal overlap compared to OOK, PSK, and FSK and can be implemented with a relatively short code length. However, this method has some limitations. First, when a heterogeneous signal is received, it is impossible to distinguish the heterogeneous signal using the existing demodulation method, and a demodulation error can occur. Second, failure to properly set the threshold coefficient may cause performance degradation. Third, because CDMA is performed on the spectrogram, time domain resolution is degraded, resulting in low TOF precision.
Ultrasonic signal crosstalk can be caused not only by the homogeneous signals transmitted, but also by heterogeneous signals from unidentified nodes. The OOK, PSK, and FSK demodulators were designed without considering heterogeneous signal input. The same applies to the previous frequency sweep keying method. This paper aims to ensure that CDMA operates normally by being robust to crosstalk, including overlap, for homogeneous signals and ignoring heterogeneous signals. Therefore, this paper proposes a method that uses frequency sweep keying modulation, which is more robust to signal overlap than OOK, PSK, and FSK, and uses faster region-based convolutional neural network (R-CNN) [31]-based demodulation. Frequency sweep keying modulation was proposed in previous paper and used in this paper, briefly described in relative works, and an improved demodulator was proposed in this study. Therefore, the novelty of this paper is a demodulator based on Faster R-CNN, and the process of demodulation is described in Chapter 3. The advantage of the proposed method is that it can ignore heterogeneous signals by classifying keying type and code. In addition, to solve the problem of low TOF measurement resolution, which is a disadvantage of the previous frequency sweep keying method, TOF precision is improved by performing signal segmentation in the time domain. A performance evaluation was conducted by implementing an environment in which ultrasonic crosstalk occurs. In addition, factors, such as SNR and degree of overlap, can be adjusted, and comparisons were made with relative works.
2. Relative Works
2.1. Traditional Keying CDMA
CDMA is a method that provides orthogonality between signals by assigning different ID codes to each node to solve the signal interference problem. Even in single-node ultrasound systems, the coded ultrasonic method has been used to improve the SNR of the received signal, improving the measurement distance range and TOF measurement accuracy [32,33]. It has the same advantages in multiple access and is easy to implement in ultrasonic systems. OOK [5,27], PSK [24,34,35], and FSK [36,37] are used to modulate and demodulate digital codes into analog signals.
OOK is the simplest way to implement CDMA. When the code is ‘1’, the transducer transmits ultrasonic pulses, and when the code is ‘0’, it does not transmit ultrasound for the same amount of time, . Here, is the number of pulses transmitted per bit, is the ultrasonic center frequency, and is the transmission time per bit. While this method is easy to implement and signal process, the first bit of the ID code must be fixed to code '1' for the TOF measurement. That is, one more bit is always needed in the code length. The demodulator sets a threshold voltage to separate the signal from noise and estimates code ‘1’ when the received signal is greater than the threshold value, and code ‘0’ when it is less than the threshold value. Therefore, when the signal overlaps, it is assumed to be code ‘1’, excluding the overlap of codes ‘0’ and ‘0’. This reduces the orthogonality of the two codes. Hence, so long ID codes must be used for normal decoding operation.
PSK is a method of transmitting ultrasonic transmission pulses with different phases depending on the ID code. PSK includes binary phase shift keying, which divides a 1-bit code into 180° phase intervals, and quadrature phase shift keying, which divides a 2-bit code into 90° phase intervals. There is also differential phase shift keying, which modulates using the phase difference between pulses. PSK is used widely in narrowband ultrasonic transducers because of its good energy efficiency. However, when signals are overlapped, the phase of the overlapped signal changes depending on the amplitude and phase of the individual signal, which causes demodulation errors to the incorrect code. Incorrectly estimated codes cannot be predicted, and the correlation with the ID code is low. Hence, decoding is not performed properly, even if the ID code length is long.
FSK is a method that transmits ultrasonic transmission pulses at different frequencies based on the center frequency according to the ID code. FSK has excellent energy efficiency and the modulation and demodulation performance when using wideband ultrasonic transducers. Furthermore, the interference between codes ‘1’ and ‘0’ does not occur when signals overlap. On the other hand, when using a general narrowband ultrasonic transducer, FSK transmits using frequencies that deviate from the center frequency , resulting in poor energy efficiency, lower SNR, and reduced sensing range.
2.2. Frequency Sweep Keying CDMA
Frequency sweep keying [30] modulates by sweeping the frequency in an increasing or decreasing direction around the center frequency using a general high Q ultrasonic transducer. Figure 1 shows codes ‘1’ and ‘0’ on a spectrogram modulated using frequency sweep keying. The signal corresponding to the -th bit of the transmission signal is as follows.
where, is the bit code information with a value of +1 or 1. is +1 when the bit code is ‘1’ and 1 when the bit code is ‘0’. is the time to perform the frequency sweep. is the sweep frequency according to time and is as follows.
where, is the sweep center frequency and is set equal to the center frequency of the ultrasonic transducer. Frequency sweep is performed in the range of the upper limit and lower limit . The transmitted ultrasonic signal using an ideal transducer is expressed as the sum of signals for each bit.
The received signal is converted to a spectrogram and demodulated by calculating cross-correlation with the bit mask and thresholding. Demodulated signals are signals estimated to have code ‘1’ or code ‘0’, respectively. Each bit mask converts the expected ultrasonic signal corresponding to one bit when the code is ‘1’ or ‘0’ into a time-frequency spectrogram. Moreover, the threshold value is based on the cross-correlation value between the received signal and the X mask because the result of the correlation operation is proportional to the power of the signal received. The threshold value is given as the product of the cross-correlation value with the X mask and the threshold coefficient set experimentally.
Through demodulation, signals with code ‘0’ or code ‘1’ are estimated. Finally, decoding is performed by calculating the correlation between the demodulated signal and the signal that up-sampled the corresponding ID code. This method is more robust to signal overlap than OOK, PSK, and FSK and can be implemented with a relatively short code length.
3. Frequency Sweep Keying CDMA Using Faster R-CNN
Figure 2 shows the proposed faster R-CNN-based frequency sweep keying demodulation and CDMA decoding process. First, the received signal is converted to a spectrogram. The converted signal is segmented to improve the classification accuracy of faster R-CNN, and the segmentation area is selected by detecting the signal in the time domain. Segmented signals for each bit are classified according to the code and keying type using faster R-CNN. Finally, CDMA decoding is performed for ID recognition and TOF calculation.
3.1. Spectrogram and Segmentation
The proposed demodulator classifies the signal code using faster R-CNN, merges the results, and outputs the demodulated signal. Segmentation is a process to improve classification performance. After selecting the segmentation range in the time domain, the signal on the spectrogram is segmented. First, the received ultrasonic signal is converted to a time-frequency spectrogram [38] signal to consider both time and frequency domains in the classification process. The short-time Fourier transform-based spectrogram signal is as follows.
where, is the window function, and the following Kaiser window is used.
where, is the 0th-order modified Bessel function, is the window duration, is the window length, and is a parameter that represents the characteristics of the Kaiser window.
Next, the start and end points of the received signal were found for segmentation. Points greater than of noise are considered locations where the signal exists, and the minimum and maximum values of the index of the signal location are found for the start and end points of the signal. Here, is the standard deviation of background noise. The start index and end index of the signal are as follows.
Two signals, front signal and rear signal , are segmented by bit from the start and end points, respectively.
where, is the code bit index and the segmentation interval is a value considering the ADC sampling rate and , the time to perform the frequency sweep, and is calculated as . Figure 3 shows segmentation results in the time domain and spectrogram.
3.2. Code Classification Using Faster R-CNN
Faster R-CNN [31] consists of a convolutional neural network (CNN) backbone to obtain the features of segmented spectrogram signals, a region proposal network (RPN) to propose a time-frequency domain region, and a classification network for classifying code and heterogeneous signal. The CNN backbone receives the segmented spectrogram of the received ultrasonic signal as input and extracts the spatial features through convolution. When ultrasonic waves propagate through air, the power of the received signal is attenuated by distance and radiation. Therefore, the signal attenuation is corrected using a time gain amplifier, and the data are normalized to achieve a zero mean before input. The horizontal and vertical axes of the image are the time and frequency domains, respectively. The input image is selected with a size of 64 × 64, covering the time range and frequency range of a one-bit signal. The input volume was set to 64 × 64 × 3 because the signal power of the spectrogram is expressed in RGB colors. Pre-trained ResNet-50 is used as the CNN backbone. A residual neural network (ResNet) [39] is a CNN that solves the vanishing gradient problem using residual blocks. The ResNet architecture comes in various depths, and ResNet-50 consists of 50 layers.
RPN receives the features of the CNN backbone and proposes the time-frequency region of the received ultrasonic signal and the objectness score of the signal in that region. RPN reduces the dimensionality of input features and proposes regions through two layers for classification and bounding box regression, respectively. A two-dimensional window is stridden, and bounding boxes with three scales and three aspect ratios (1:1, 1:2, and 2:1) are used for every sliding position to find the bounding box in features. For each bounding box, the regression layer outputs the position of the bounding box as the center x and y coordinates width and height, and the classification layer outputs the objectness score of the bounding box. RPN performs region proposals for some bounding boxes with high objectness scores.
The classification network receives the features of the CNN backbone and the region proposal of the RPN and classifies the class of the signal within the bounding box. Each bounding box is resized to a fixed-size feature vector using the region of interest (ROI) pooling layer because the size of the features must be the same to perform classification. For each ROI, the regression layer outputs better-fitted bounding box information, and the classification layer outputs the code of the received signal and its probability, or probability of being a heterogeneous signal.
3.3. Training Data Set
The training data set was acquired using the ultrasonic transmission and reception environment. The data were collected by classifying into a total of four cases. The first case is where only one bit is received without overlap. There are classes with code ‘0’ or code ‘1’. The second case is one in which two bits are received with overlap. There are cases of permutation with repetition of codes ‘0’ and ‘1’. There are a total of classes with an overlap ratio of 0.1, 0.3, 0.5, 0.7, and 0.9 for each case. Regarding overlap, there are a total of five classes, but the data are collected with a uniform random overlap ratio in the range of ±0.1 to increase the diversity of constructive–destructive interference according to the phase difference between the two signals. The third case is one in which three bits are received with overlap. There are cases of permutation with repetition of code ‘0’ and code ‘1’. As in the second case, there are five overlap ratios and a total of classes. The last case is one in which a heterogeneous signal is received. There are two classes: OOK signal and FSK signal. PSK had a similar spectrogram to OOK and was not classified separately.
The dataset had 100 elements for each class, and the signal power ratio and background noise were adjusted to prevent overfitting and increase the amount of data. The signal power ratio was adjusted by fine-tuning the distance of the two transmitters and was adjusted in five steps from 0.2 to 1 in 0.2 increments. A white Gaussian background noise was added to adjust the SNR in five steps from 2 to 10 in two increments. Therefore, the total data has 2500 elements for each class.
3.4. Grouping and Merging
The classified classes vary depending on the overlap ratio or overlapping signals, but if segmentation is performed properly, only the code information of the bit located at the center needs to be obtained. Therefore, each classified class can be grouped into the code ‘1’ set or the code ‘0’ set according to the code information of the bit located at the center. In addition, certain classes were grouped into a set of both-detect cases in which code ‘0’ and code ‘1’ signals were received simultaneously, and cases of heterogeneous signals and cases that were not detected were grouped into a non-detect set . The signal demodulated to code ‘1’ and the signal demodulated to code ‘0’ for each group are as follows.
where, the superscript indicates whether it is a front signal or a rear signal between the signals separated during the segmentation process. Function is a faster R-CNN classifier that receives segmented spectrograms and outputs classified classes. If the -th bit of the received signal is classified into a class included in the set corresponding to code ‘1’ and the both-detect case set , the -th bit of is 1, otherwise it is 0. If the -th bit of the received signal is classified into a class included in the set corresponding to code ‘0’ and the both-detect case set , the -th bit of is 1, otherwise it is 0. Therefore, for the both-detect set , and are both 1 in the corresponding bit, and for the non-detect set , and are both 0 in the corresponding bit.
3.5. CDMA Decoding
The demodulated signal indicates that code ‘1’ is received, and indicates that code ‘0’ is received. Therefore, is compared with the ID code , and is compared with the inverted ID code, . Since the demodulated signal and the ID code have the same dimension, the similarity between the demodulated signal and the ID code can be obtained by performing product sum. The similarity for code ‘1’, the similarity for code ‘0’, and the similarity between the ID code and the demodulated signal, which can be obtained from the sum of the two, are expressed in the equations below.
If the similarity between the ID code and the demodulated signal is equal to the length of the ID code, the corresponding code has been detected, and the TOF is calculated. The TOF is calculated when the front signal is detected and when the rear signal is detected as follows, respectively.
4. Experimental Results
4.1. Experimental Environment
An ultrasound transmission and reception system was configured in a laboratory environment to verify the frequency sweep keying method using the faster R-CNN proposed in this paper. As shown in Figure 4, an ultrasonic signal crosstalk environment was configured by connecting a single ultrasonic receiver and multiple ultrasonic transmitters to the MCU. Ultrasonic transmitters have an individual time delay with their transmitted signals. Therefore, when combining signals, the constructive-destructive interference according to the phase and the overlap ratio of each transmission signal can be adjusted. The data of the received signal was collected through the amplifier and the ADC of the MCU. The collected data is transferred to a PC, and the demodulation and decoding processes are performed.
Figure 5a shows the ultrasonic transmitting and receiving equipment used in the experiment. The used ultrasonic sensor was Hagisonic HG-L40DC with a center frequency of 40 kHz, a bandwidth of 4 kHz, and a beam angle of 65°. In addition, ultrasonic sound-absorbing material was attached around the ultrasonic sensor to minimize reverberation and multi-path fading other than the line of sight. As shown in Figure 5b, an ultrasonic signal crosstalk environment was configured with one receiving device and multiple transmitting devices in an indoor environment measuring 10 m in width and 10 m in length. Table 1 lists the parameters used in the experiment.
4.2. Faster R-CNN Classifier Validation
The performance verification of the trained faster R-CNN classifier was performed. The verification method was 5-fold cross-validation [40]. 5-fold cross-validation is a method of randomly dividing data into five equal-sized subsets and using one subset as a validation set and the remaining four subsets as a training set. The cross-validation process is repeated five times. Each of the five subsets is used once as a validation set. Figure 6 shows the precision of each class as a validation result. Precision is one of the classification performance indicators that is calculated from the true positive TP and false positive FP as follows.
The verification results showed an average precision of approximately 0.9. As a result of analyzing misclassification cases, most cases had classification errors because of the overlap ratio. The classification error in the overlap ratio does not affect the final demodulation performance because the bit information at the center is used in the subsequent grouping process. Therefore, the faster R-CNN classifier was properly trained.
4.3. TOF Error Comparision with Other Modulation Methods
The performance of the frequency sweep keying method using faster R-CNN proposed in this paper was compared with the traditional modulation methods OOK, FSK, PSK, and the correlation-based frequency sweep keying method previously proposed by our research team. The root mean square (RMS) and standard deviation of TOF error were measured in milli-second scale. Ultrasound was transmitted from two transmitting nodes, and the signal was received by one receiving node. The position of the ultrasonic node was set so that the two transmitted signals were received with overlap. The manipulation variables of the experiment were the CDMA code length and overlap ratio. The CDMA code length was 2, 4, 8, 16, 32, 64, and 128; the overlap ratio was 0 to 1 in 0.1 increments, and each case was tested 100 times. The experimental results were expressed in two forms: TOF error according to the code length and detection rates according to the overlap ratio. Table 2 lists the TOF error results of each modulation method according to the code length. FSWK-corr represents the previous correlation-based frequency sweep keying method. The code detection rate was low for OOK, FSK, and PSK, with a short code length of 8 or less, resulting in a substantial TOF error. In the case of PSK, even when the code length was long, the code detection rate was low, and the TOF error is large. When the frequency sweep keying method was used, the TOF error was relatively small due to the high code detection rate, even if the code length was short. In particular, comparing the proposed method with the FSWK-corr, the proposed method estimates TOF in the time domain, so the TOF error is small. The TOF errors of the proposed method and OOK were similar when the code length was long.
Figure 7 shows the results of comparing the detection rates according to the overlap ratio. Methods using frequency sweep keying, which include the proposed method and FSWK-corr, show detection rates of more than 0.93 regardless of the overlap ratio. In the case of OOK and FSK, however, as the overlap ratio increased, the detection rates decreased from approximately 0.92 to approximately 0.84, and the detection rates were even lower in the case of PSK. Therefore, the proposed method showed performance that was robust to overlap and had a small TOF error compared to other methods.
4.4. Robustness Comparision to Heterogeneous Signal
Table 3 shows the results of comparing the robustness of the demodulator to heterogeneous signals. Each keying method has different characteristics in how heterogeneous signals are demodulated. The OOK demodulator usually estimates code ‘1’ for all heterogeneous signals. The PSK demodulator estimates the OOK signal as code ‘1’ because their phases are identical, making false detections. The PSK demodulator estimates the FSK and frequency sweep keying signals as random codes because of their continuously changing phases, making false detections. The FSK demodulator does not detect the OOK and PSK signals because they only have center frequency components, and cause false detection in the case of the frequency sweep keying signals. The correlation-based frequency sweep keying demodulator falsely detects that codes ‘0’ and ‘1’ are detected for the OOK signal with code ‘1’ and the PSK signal, and does not detect the OOK signal with code ‘0’. The correlation-based frequency sweep keying demodulator falsely detects code ‘1’ or code ‘0’ for the FSK signal because the frequency rises or falls when the code changes. In the case of the demodulator using faster R-CNN, which is the proposed method, the OOK and PSK signals use only the center frequency, so they are recognized as horizontal parallel bars in the spectrogram and classified as heterogeneous signals. False detection occurs in approximately 1% of OOK and PSK signals. In the case of the FSK signal, when the position where the code changes is segmented, the frequency rises or falls, resulting in an approximately 21% false detection as code ‘0’ or ‘1’.
5. Conclusions
As the number of devices using ultrasonic sensors increases, crosstalk between ultrasonic nodes becomes more frequent. Crosstalk includes situations where signals are overlapped and heterogeneous signals are received. To solve this problem, our research team proposed a frequency sweep keying method in previous research. The previously proposed correlation-based frequency sweep keying method was more robust to overlap than the existing method. On the other hand, the previously correlation-based frequency sweep keying method had a problem with a high false detection rate when heterogeneous signals were received. In addition, the time resolution was lower than other methods because it performs CDMA on the spectrogram. This study proposed a method robust to overlap using the frequency sweep keying method and demodulated the signal using faster R-CNN to increase the detection rate of proper signals by ignoring when heterogeneous signals are received. An experiment implementing an environment where ultrasonic crosstalk occurs showed that the detection rate was higher than other traditional modulation methods at a short code length, and the TOF error was reduced by approximately 75% compared to the correlation-based frequency sweep keying method. It showed a high non-detection rate for heterogeneous signal input, showing good performance in demodulating only homogeneous signals. Based on the experimental results, the proposed method was robust against overlap and performed CDMA even with a short code length. Therefore, it has a short dead zone and is robust to heterogeneous signals, highlighting its potential in ultrasonic sensors for blind spot detection in automobiles.
On the other hand, several problems must be overcome to be applied to applications. In the present study, experiments were conducted in an ideal environment to verify performance in crosstalk situations. Nevertheless, the proposed method may have limitations when well-known problems of ultrasonic sensing, such as multi-path interference, reverberation artifact, and reflected signal distortion due to object shape, are applied. The performance of the proposed method is inevitably affected greatly by the training data set of faster R-CNN. If the above problem is applied, the shape of the spectrogram of the received signal may change, so the possibility of misclassification may increase. To solve the problem without significantly changing the proposed method, it is possible to train faster R-CNN more robustly by training received data in various situations in the training data set.
Supplementary Materials
The following supporting information can be downloaded at: ww.mdpi.com/xxx/s1, Figure S1: title; Table S1: title; Video S1: title.
Author Contributions
P.G.-R., P.S.-H, and B.K.-R. participated in the study design and data collection, performed statistical analyses and contributed to the interpretation of the results, wrote the manuscript, and approved the final manuscript as presented. All authors have read and agreed to the published version of the manuscript.
Funding
Not applicable
Institutional Review Board Statement
Not applicable
Informed Consent Statement
Not applicable
Data Availability Statement
Not applicable
Conflicts of Interest
Not applicable
References
- Kelemen, M.; Virgala, I.; Kelemenová, T.; Miková, Ľ.; Frankovský, P.; Lipták, T.; Lörinc, M. Distance measurement via using of ultrasonic sensor. Journal of Automation and Control 2015, 3, 71–74. [Google Scholar]
- Zhmud, V.A.; Kondratiev, N.O.; Kuznetsov, K.A.; Trubin, V.G.; Dimitrov, L.V. Application of ultrasonic sensor for measuring distances in robotics. Journal of Physics: Conference Series 2018, 1015, 032189. [Google Scholar] [CrossRef]
- Carullo, A.; Parvis, M. An ultrasonic sensor for distance measurement in automotive applications. IEEE Sensors journal 2001, 1, 143. [Google Scholar] [CrossRef]
- Ureña, J.; Gualda, D.; Hernández, Á.; García, E.; Villadangos, J.M.; Pérez, M.C.; Jiménez, A. Ultrasonic local positioning system for mobile robot navigationL From low to high level processing. 2015 IEEE International Conference on Industrial Technology 2015, 3440–3445. [Google Scholar]
- Moon, W.S.; Cho, B.S.; Jang, J.W.; Baek, K.R. A multi-robot positioning system using a multi-code ultrasonic sensor network and a Kalman filter. International Journal of Control, Automation and Systems 2010, 8, 1349–1355. [Google Scholar] [CrossRef]
- Ijaz, F.; Yang, H.K.; Ahmad, A.W.; Lee, C. Indoor positioning: A review of indoor ultrasonic positioning systems. 2013 15th International Conference on Advanced Communication Technology 2013, 1146–1150. [Google Scholar]
- Sambath, S.; Nagaraj, P.; Selvakumar, N. Automatic defect classification in ultrasonic NDT using artificial intelligence. Journal of nondestructive evaluation 2011, 30, 20–28. [Google Scholar] [CrossRef]
- Ke, W.; Castaings, M.; Bacon, C. 3D finite element simulations of an air-coupled ultrasonic NDT system. Ndt & E International 2009, 42, 524–533. [Google Scholar]
- Wells, P.N. Ultrasonic imaging of the human body. Reports on progress in physics 1999, 62, 671. [Google Scholar] [CrossRef]
- De Rigal, J.; Escoffier, C.; Querleux, B.; Faivre, B.; Agache, P.; Lévêque, J.L. Assessment of aging of the human skin by in vivo ultrasonic imaging. Journal of investigative dermatology 1989, 93, 621–625. [Google Scholar] [CrossRef]
- Ikai, M.; Fukunaga, T. Calculation of muscle strength per unit cross-sectional area of human muscle by means of ultrasonic measurement. Internationale Zeitschrift für Angewandte Physiologie Einschliesslich Arbeitsphysiologie 1968, 26, 26–32. [Google Scholar] [CrossRef]
- Jin, Y.; Li, S.; Li, J.; Sun, H.; Wu, Y. Design of an intelligent active obstacle avoidance car based on rotating ultrasonic sensors. In 2018 IEEE 8th Annual International Conference on CYBER Technology in Automation, Control, and Intelligent Systems 2018, 753-757.
- Krishnan, P. Design of collision detection system for smart car using li-fi and ultrasonic sensor. IEEE Transactions on Vehicular Technology 2018, 67, 11420–11426. [Google Scholar] [CrossRef]
- Kianpisheh, A.; Mustaffa, N.; Limtrairut, P.; Keikhosrokiani, P. Smart parking system (SPS) architecture using ultrasonic detector. International Journal of Software Engineering and Its Applications 2012, 6, 55–58. [Google Scholar]
- Diego, C.; Hernández, A.; Jiménez, A.; Alvarez, F.J.; Sanz, R.; Aparicio, J. Ultrasonic array for obstacle detection based on CDMA with Kasami codes. Sensors 2011, 11, 11464–11475. [Google Scholar] [CrossRef]
- Li, S.E.; Li, G.; Yu, J.; Liu, C.; Cheng, B.; Wang, J.; Li, K. Kalman filter-based tracking of moving objects using linear ultrasonic sensor array for road vehicles. Mechanical Systems and Signal Processing 2018, 98, 173–189. [Google Scholar] [CrossRef]
- Shin, S.; Kim, M.H.; Choi, S.B. Ultrasonic distance measurement method with crosstalk rejection at high measurement rate. IEEE Transactions on Instrumentation and Measurement 2018, 68, 972–979. [Google Scholar] [CrossRef]
- Medina, C.; Segura, J.C.; de la Torre, Á. A synchronous TDMA ultrasonic TOF measurement system for low-power wireless sensor networks. IEEE Transactions on Instrumentation and Measurement 2012, 62, 599–611. [Google Scholar] [CrossRef]
- Cheng, P.; Zhang, F.; Chen, J.; Sun, Y.; Shen, X. A distributed TDMA scheduling algorithm for target tracking in ultrasonic sensor networks. IEEE Transactions on Industrial Electronics 2012, 60, 3836–3845. [Google Scholar] [CrossRef]
- Medina, C.; Segura, J.C.; De la Torre, A. Ultrasound indoor positioning system based on a low-power wireless sensor network providing sub-centimeter accuracy. Sensors 2013, 13, 3501–3526. [Google Scholar] [CrossRef]
- Queirós, R.; Alegria, F.C.; Girao, P.S.; Serra, A.C. A multi-frequency method for ultrasonic ranging. Ultrasonics 2015, 63, 86–93. [Google Scholar] [CrossRef]
- Khyam, M.O.; Alam, M.J.; Lambert, A.J.; Garratt, M.A.; Pickering, M.R. High-precision OFDM-based multiple ultrasonic transducer positioning using a robust optimization approach. IEEE Sensors Journal 2016, 16, 5325–5336. [Google Scholar] [CrossRef]
- Perez, M.C.; Ureña, J.; Hernandez, A.; Jimenez, A.; Ruiz, D.; Alvarez, F.J.; De Marziani, C. Performance comparison of different codes in an ultrasonic positioning system using DS-CDMA. In 2009 IEEE International Symposium on Intelligent Signal Processing 2009, 125–130. [Google Scholar]
- Pérez-Rubio, M.C.; Hernández, Á.; Gualda-Gómez, D.; Murano, S.; Vicente-Ranera, J.; Ciudad-Fernández, F.; Nieto, R. Simulation Tool and Online Demonstrator for CDMA-Based Ultrasonic Indoor Localization Systems. Sensors 2022, 22, 1038. [Google Scholar] [CrossRef] [PubMed]
- Suzuki, A.; Kumakura, K.; Choi, Y.; Iyota, T. Accuracy of distance measurements using signal tracking of spread-spectrum ultrasonic waves with CDMA. In 2014 International Conference on Indoor Positioning and Indoor Navigation (IPIN) 2014, pp. 575–581.
- Oberdorfer, M.; Esslinger, D.; Benz, G.; Sawodny, O.; Tarin, C. Robustness enhancements of time-of-flight measurements in a CDMA ultrasonic channel of an opto-acoustic indoor positioning system using MEMS microphones. In 2020 IEEE International Ultrasonics Symposium (IUS) 2020, 1–6. [Google Scholar]
- Oetting, J. A comparison of modulation techniques for digital radio. IEEE Transactions on communications 1979, 27, 1752–1762. [Google Scholar] [CrossRef]
- Gardner, F. A BPSK/QPSK timing-error detector for sampled receivers. IEEE Transactions on communications 1986, 34, 423–429. [Google Scholar] [CrossRef]
- Watson, Bob. FSK: signals and demodulation. Watkins–Johnson Company Tech–notes 1980, 7, 5. [Google Scholar]
- Park, G.R.; Park, S.H.; Baek, K.R. Frequency Sweep Keying CDMA for Reducing Ultrasonic Crosstalk. Sensors 2022, 22, 4462. [Google Scholar] [CrossRef] [PubMed]
- Ren, S.; He, K.; Girshick, R.; Sun, J. Faster r-cnn: Towards real-time object detection with region proposal networks. Advances in neural information processing systems 2015, 28, 1137–1149. [Google Scholar] [CrossRef]
- Fan, Z.; Rudlin, J.; Asfis, G.; Meng, H. Convolution of Barker and Golay Codes for Low Voltage Ultrasonic Testing. Technologies, 2019, 7, 72. [Google Scholar] [CrossRef]
- Ding, Z.X.; Payne, P.A. A new Golay code system for ultrasonic pulse echo measurements. Measurement Science and Technology 1990, 1, 158. [Google Scholar] [CrossRef]
- Schröder, A.; Henning, B. Signal optimization of PSK modulated gold-sequences for narrow band transducers. In 2014 IEEE International Ultrasonics Symposium 2014, 552–555. [Google Scholar]
- Kumakura, K.; Suzuki, A.; Iyota, T. Code division positioning by continuous signals using spread spectrum ultrasonic waves. International Conference on Indoor Positioning and Indoor Navigation 2013, 1–8. [Google Scholar]
- Zhenjing, Y.; Li, H.; Yanan, L. Improvement of measurement range via chaotic binary frequency shift keying excitation sequences for multichannel ultrasonic ranging system. International Journal of Control and Automation 2016, 9, 189–200. [Google Scholar] [CrossRef]
- Nakahira, K.; Okuma, S.; Kodama, T.; Furuhashi, T. The use of binary coded frequency shift keyed signals for multiple user sonar ranging. In IEEE International Conference on Networking, Sensing and Control 2004, 2, 1271–1275. [Google Scholar]
- Le Roux, J.; Kameoka, H.; Ono, N.; Sagayama, S. Fast signal reconstruction from magnitude STFT spectrogram based on spectrogram consistency. In Proc. DAFx 2010, 10, 397–403. [Google Scholar]
- He, K.; Zhang, X.; Ren, S.; Sun, J. Deep residual learning for image recognition. Proceedings of the IEEE conference on computer vision and pattern recognition 2016, 770–778. [Google Scholar]
- Wong, T.T.; Yeh, P.Y. Reliable accuracy estimates from k-fold cross validation. IEEE Transaction on Knowledge and Data Engineering 2019, 32, 1586–1594. [Google Scholar] [CrossRef]
Figure 1.
One-bit frequency sweep keying signal on the spectrogram.
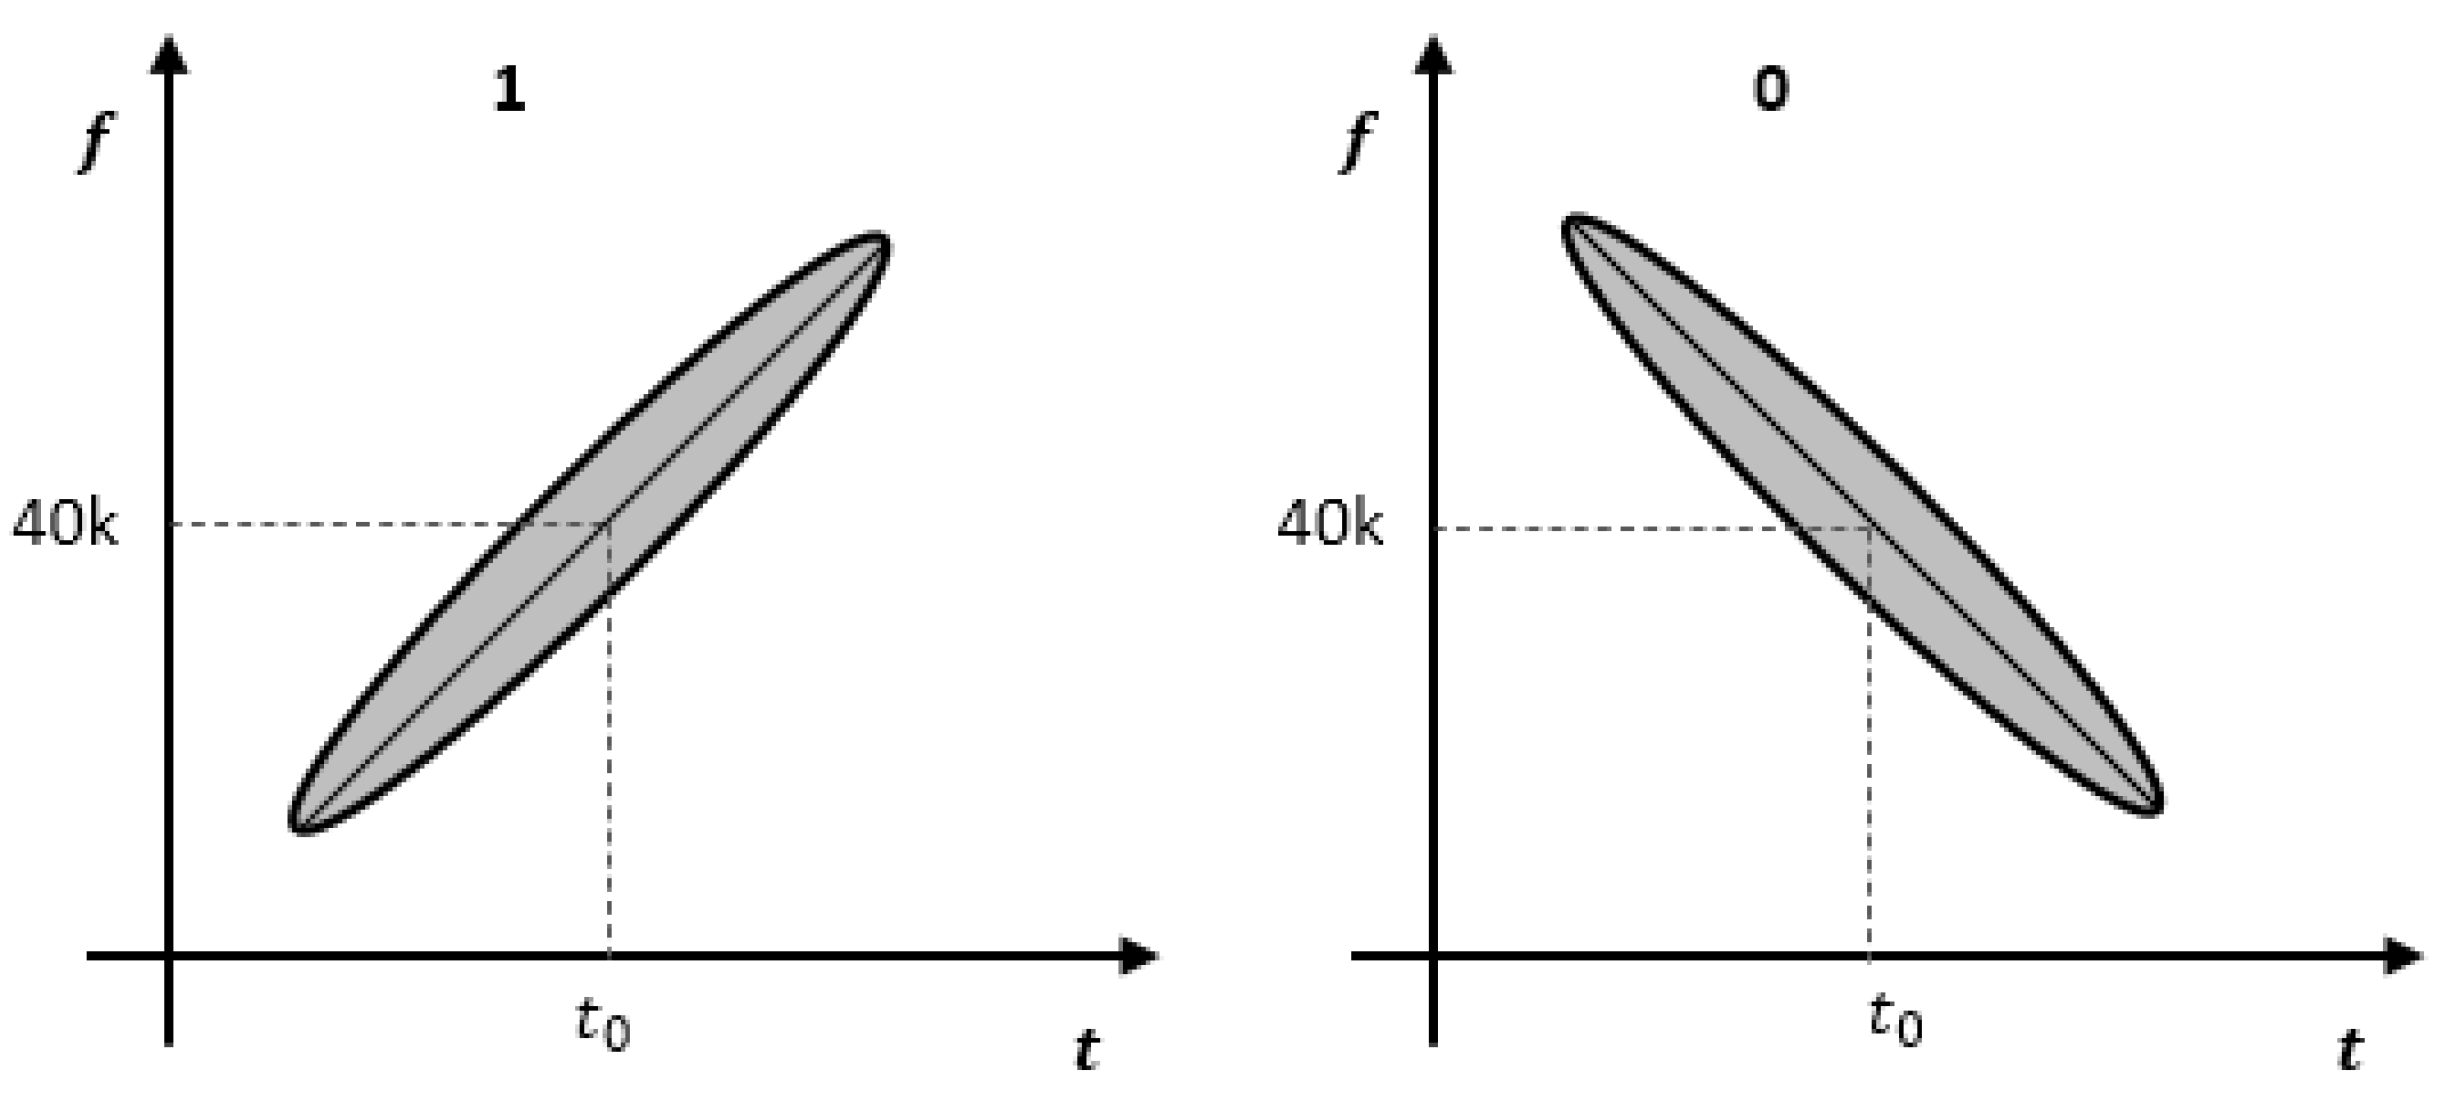
Figure 2.
Process of a frequency sweep keying CDMA using faster R-CNN.
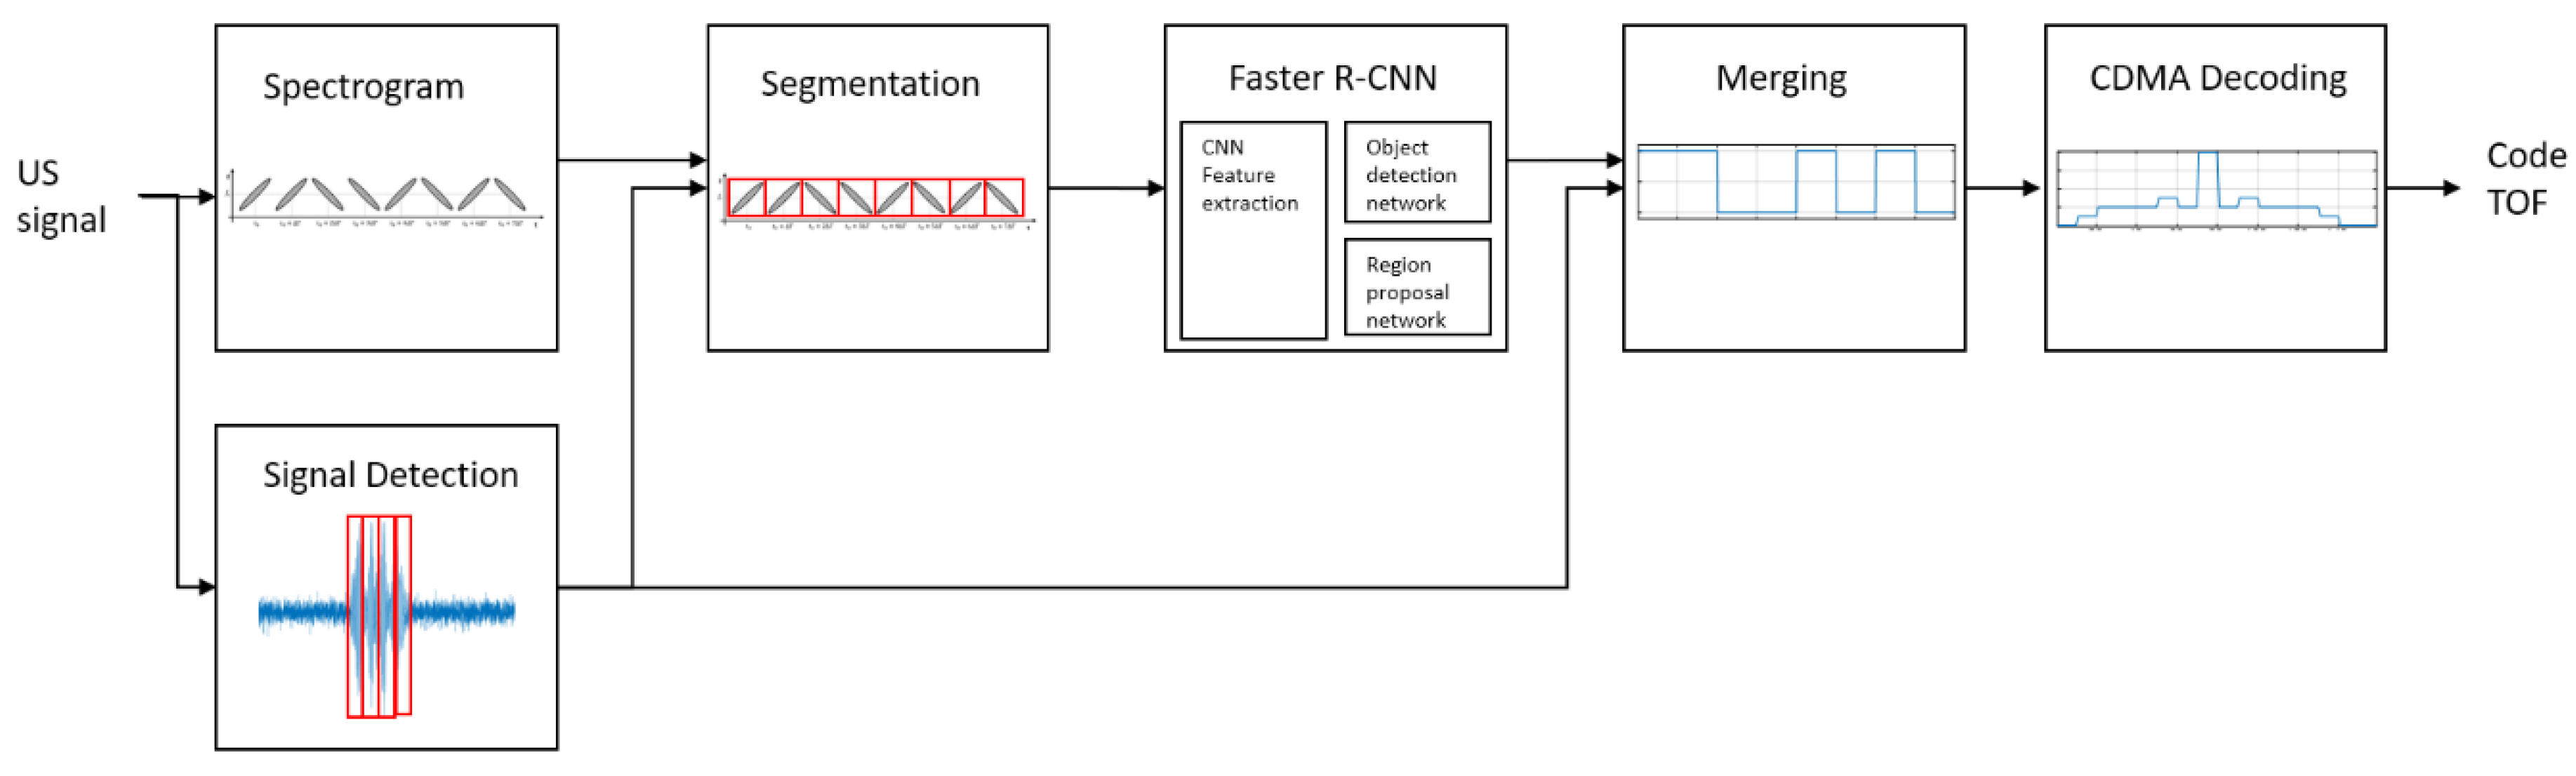
Figure 3.
Segmentation results in the time domain and spectrogram.
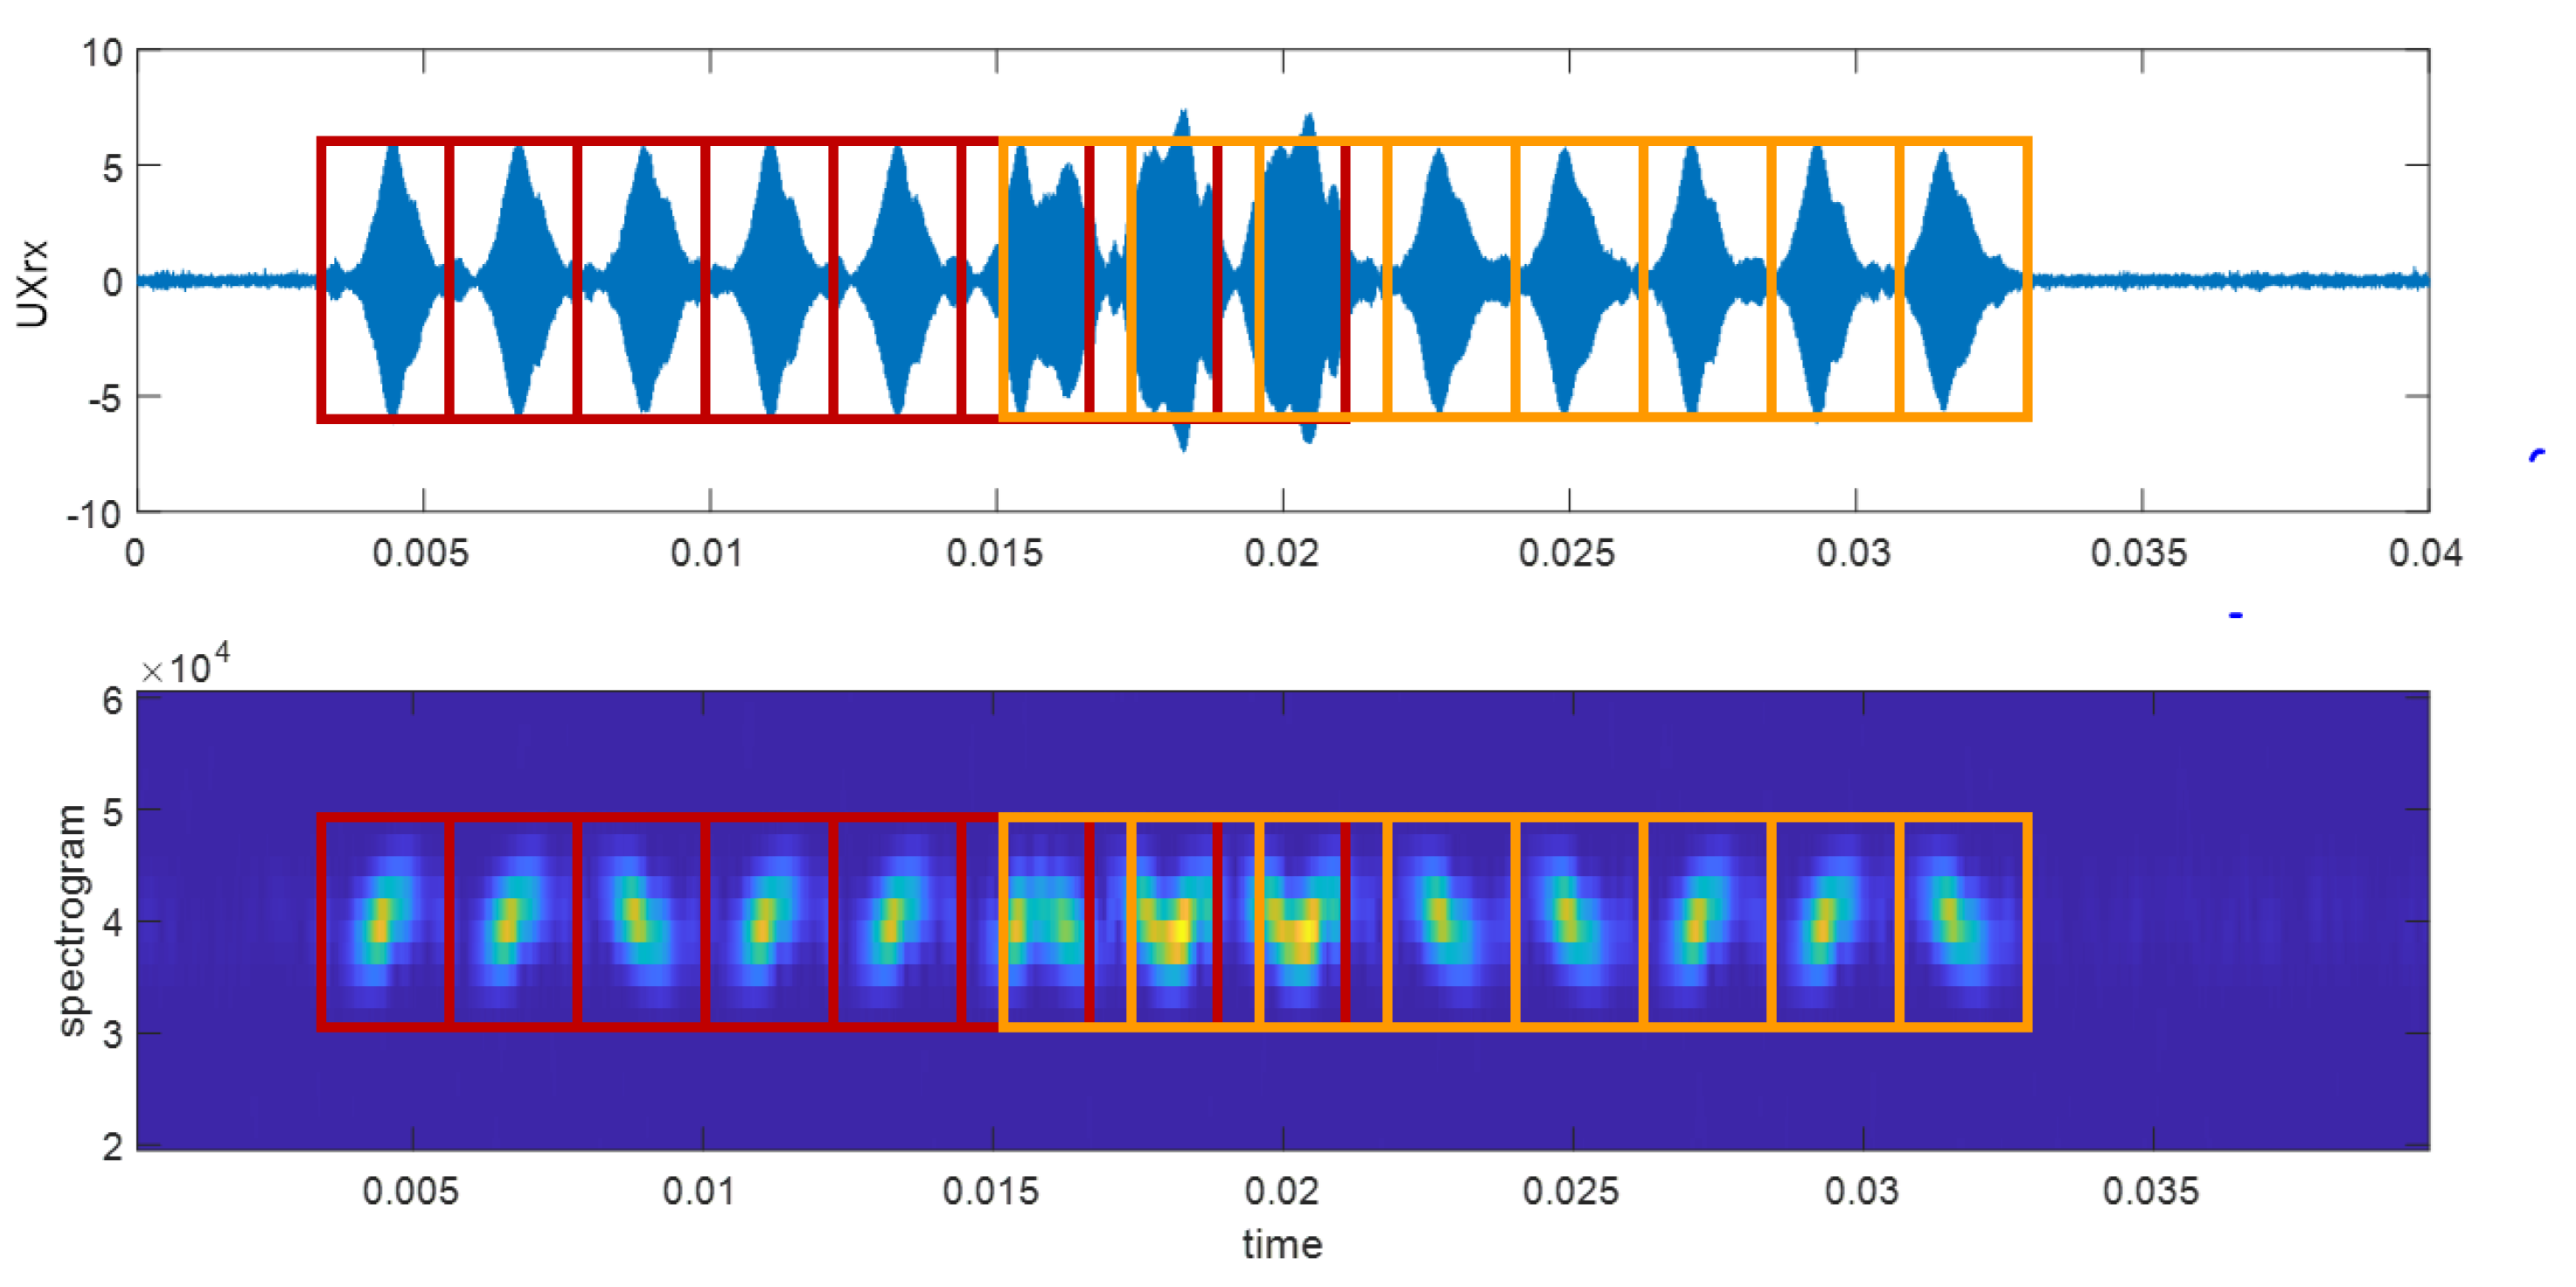
Figure 4.
Ultrasonic transceiver system block diagram.
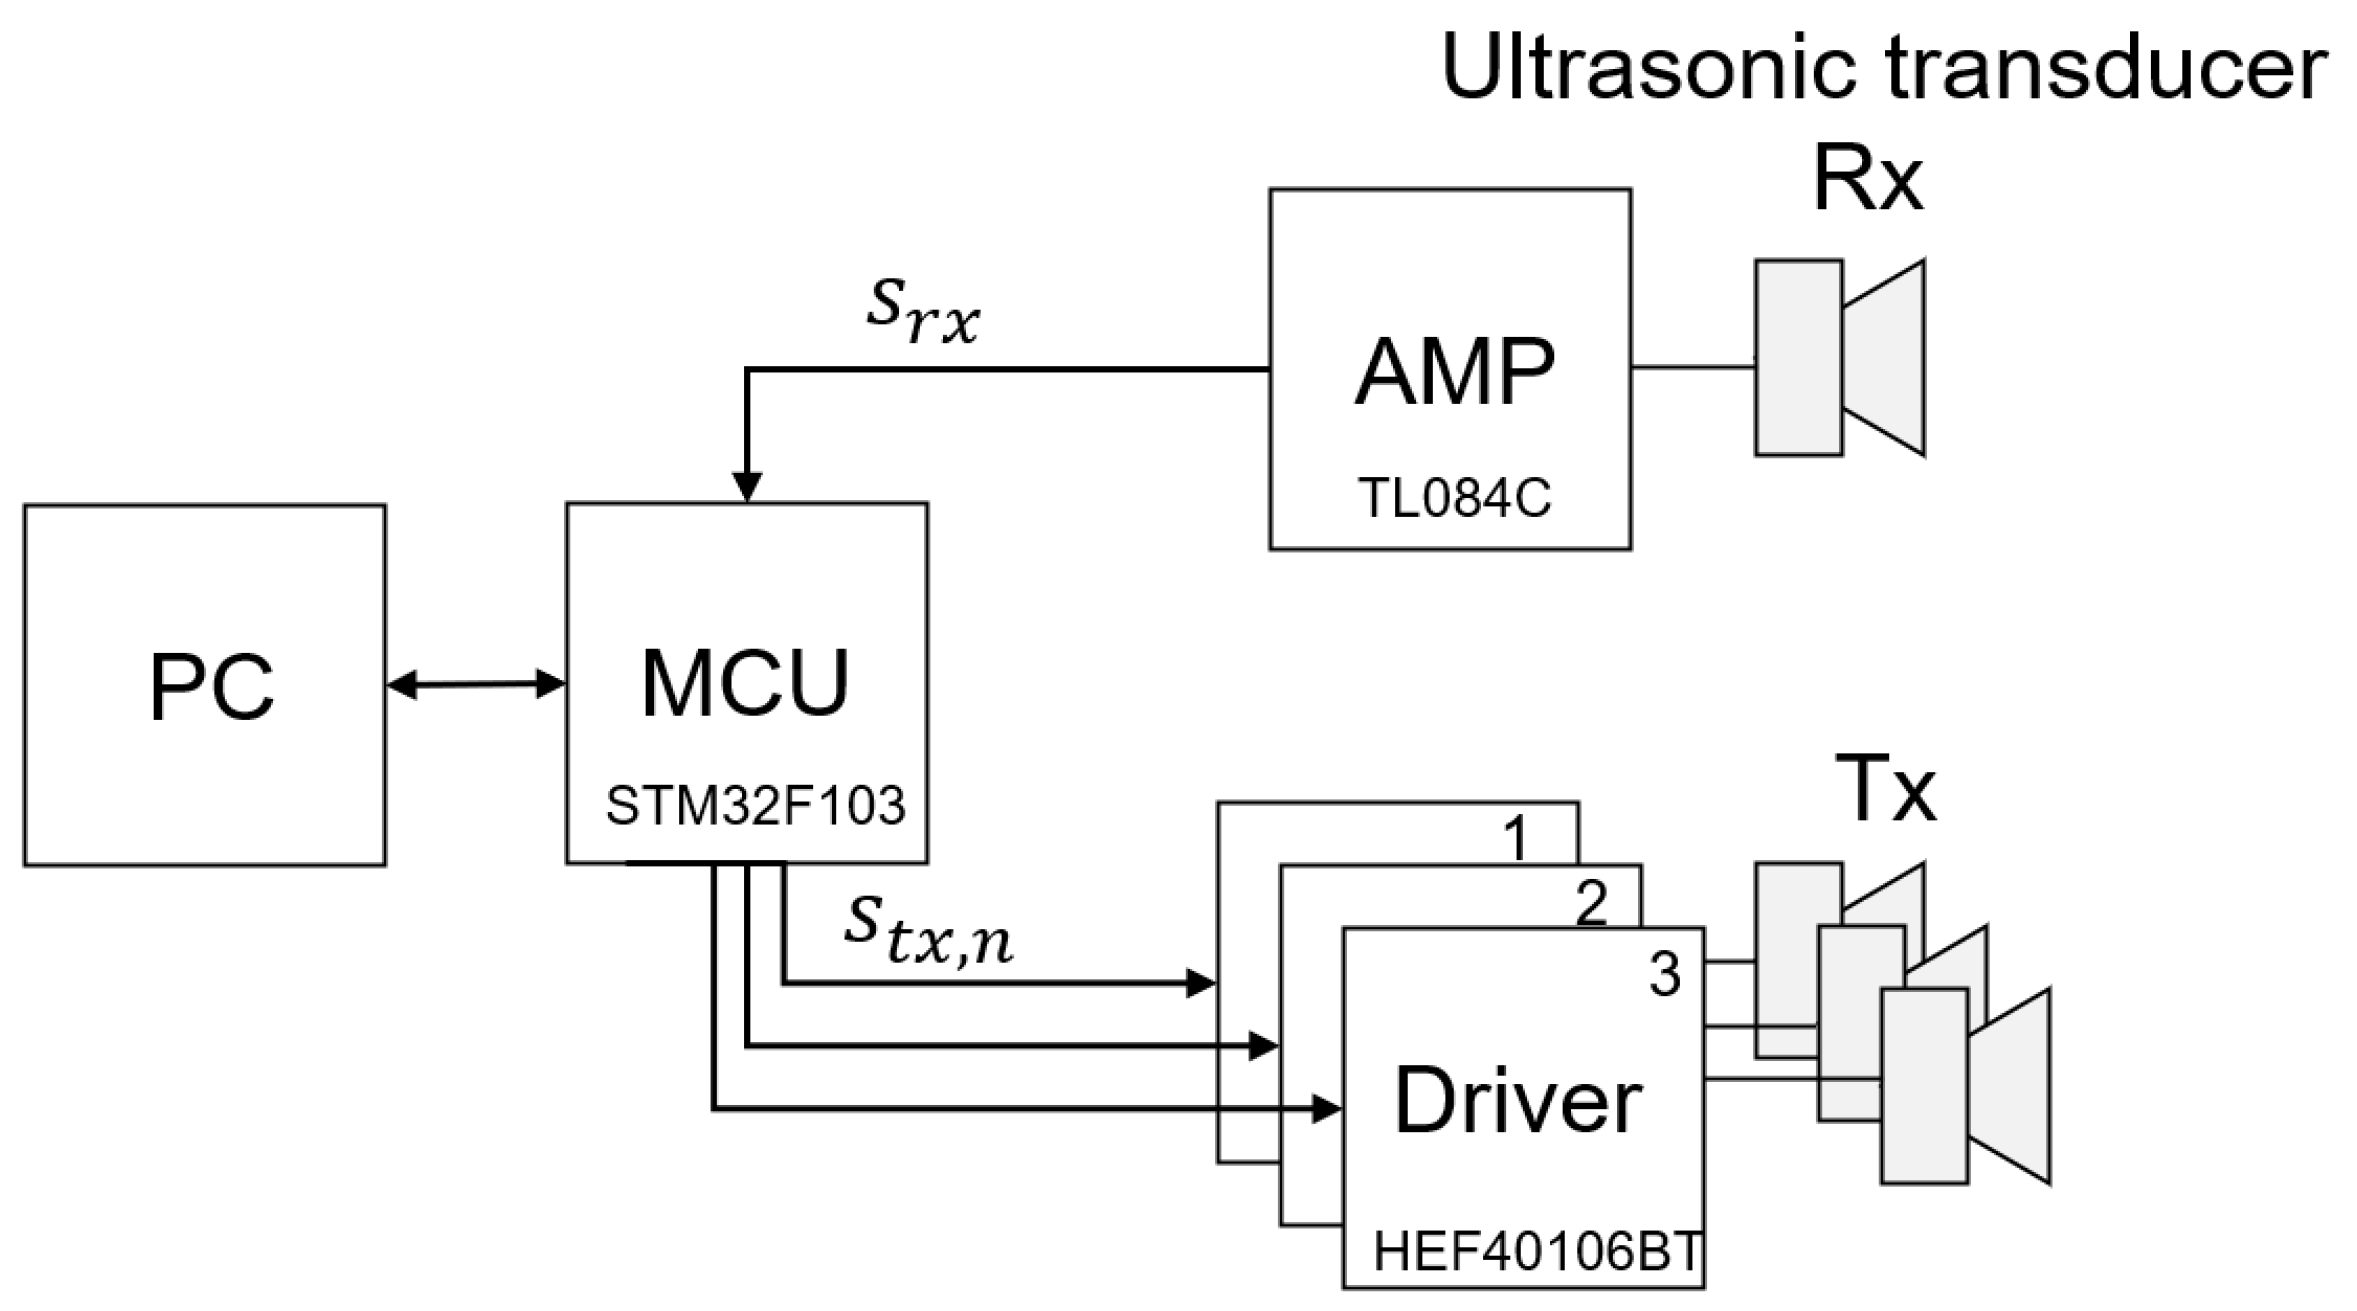
Figure 5.
Ultrasonic transmission/reception environment: (a) ultrasonic transducer, (b) experimental environment.
Figure 5.
Ultrasonic transmission/reception environment: (a) ultrasonic transducer, (b) experimental environment.
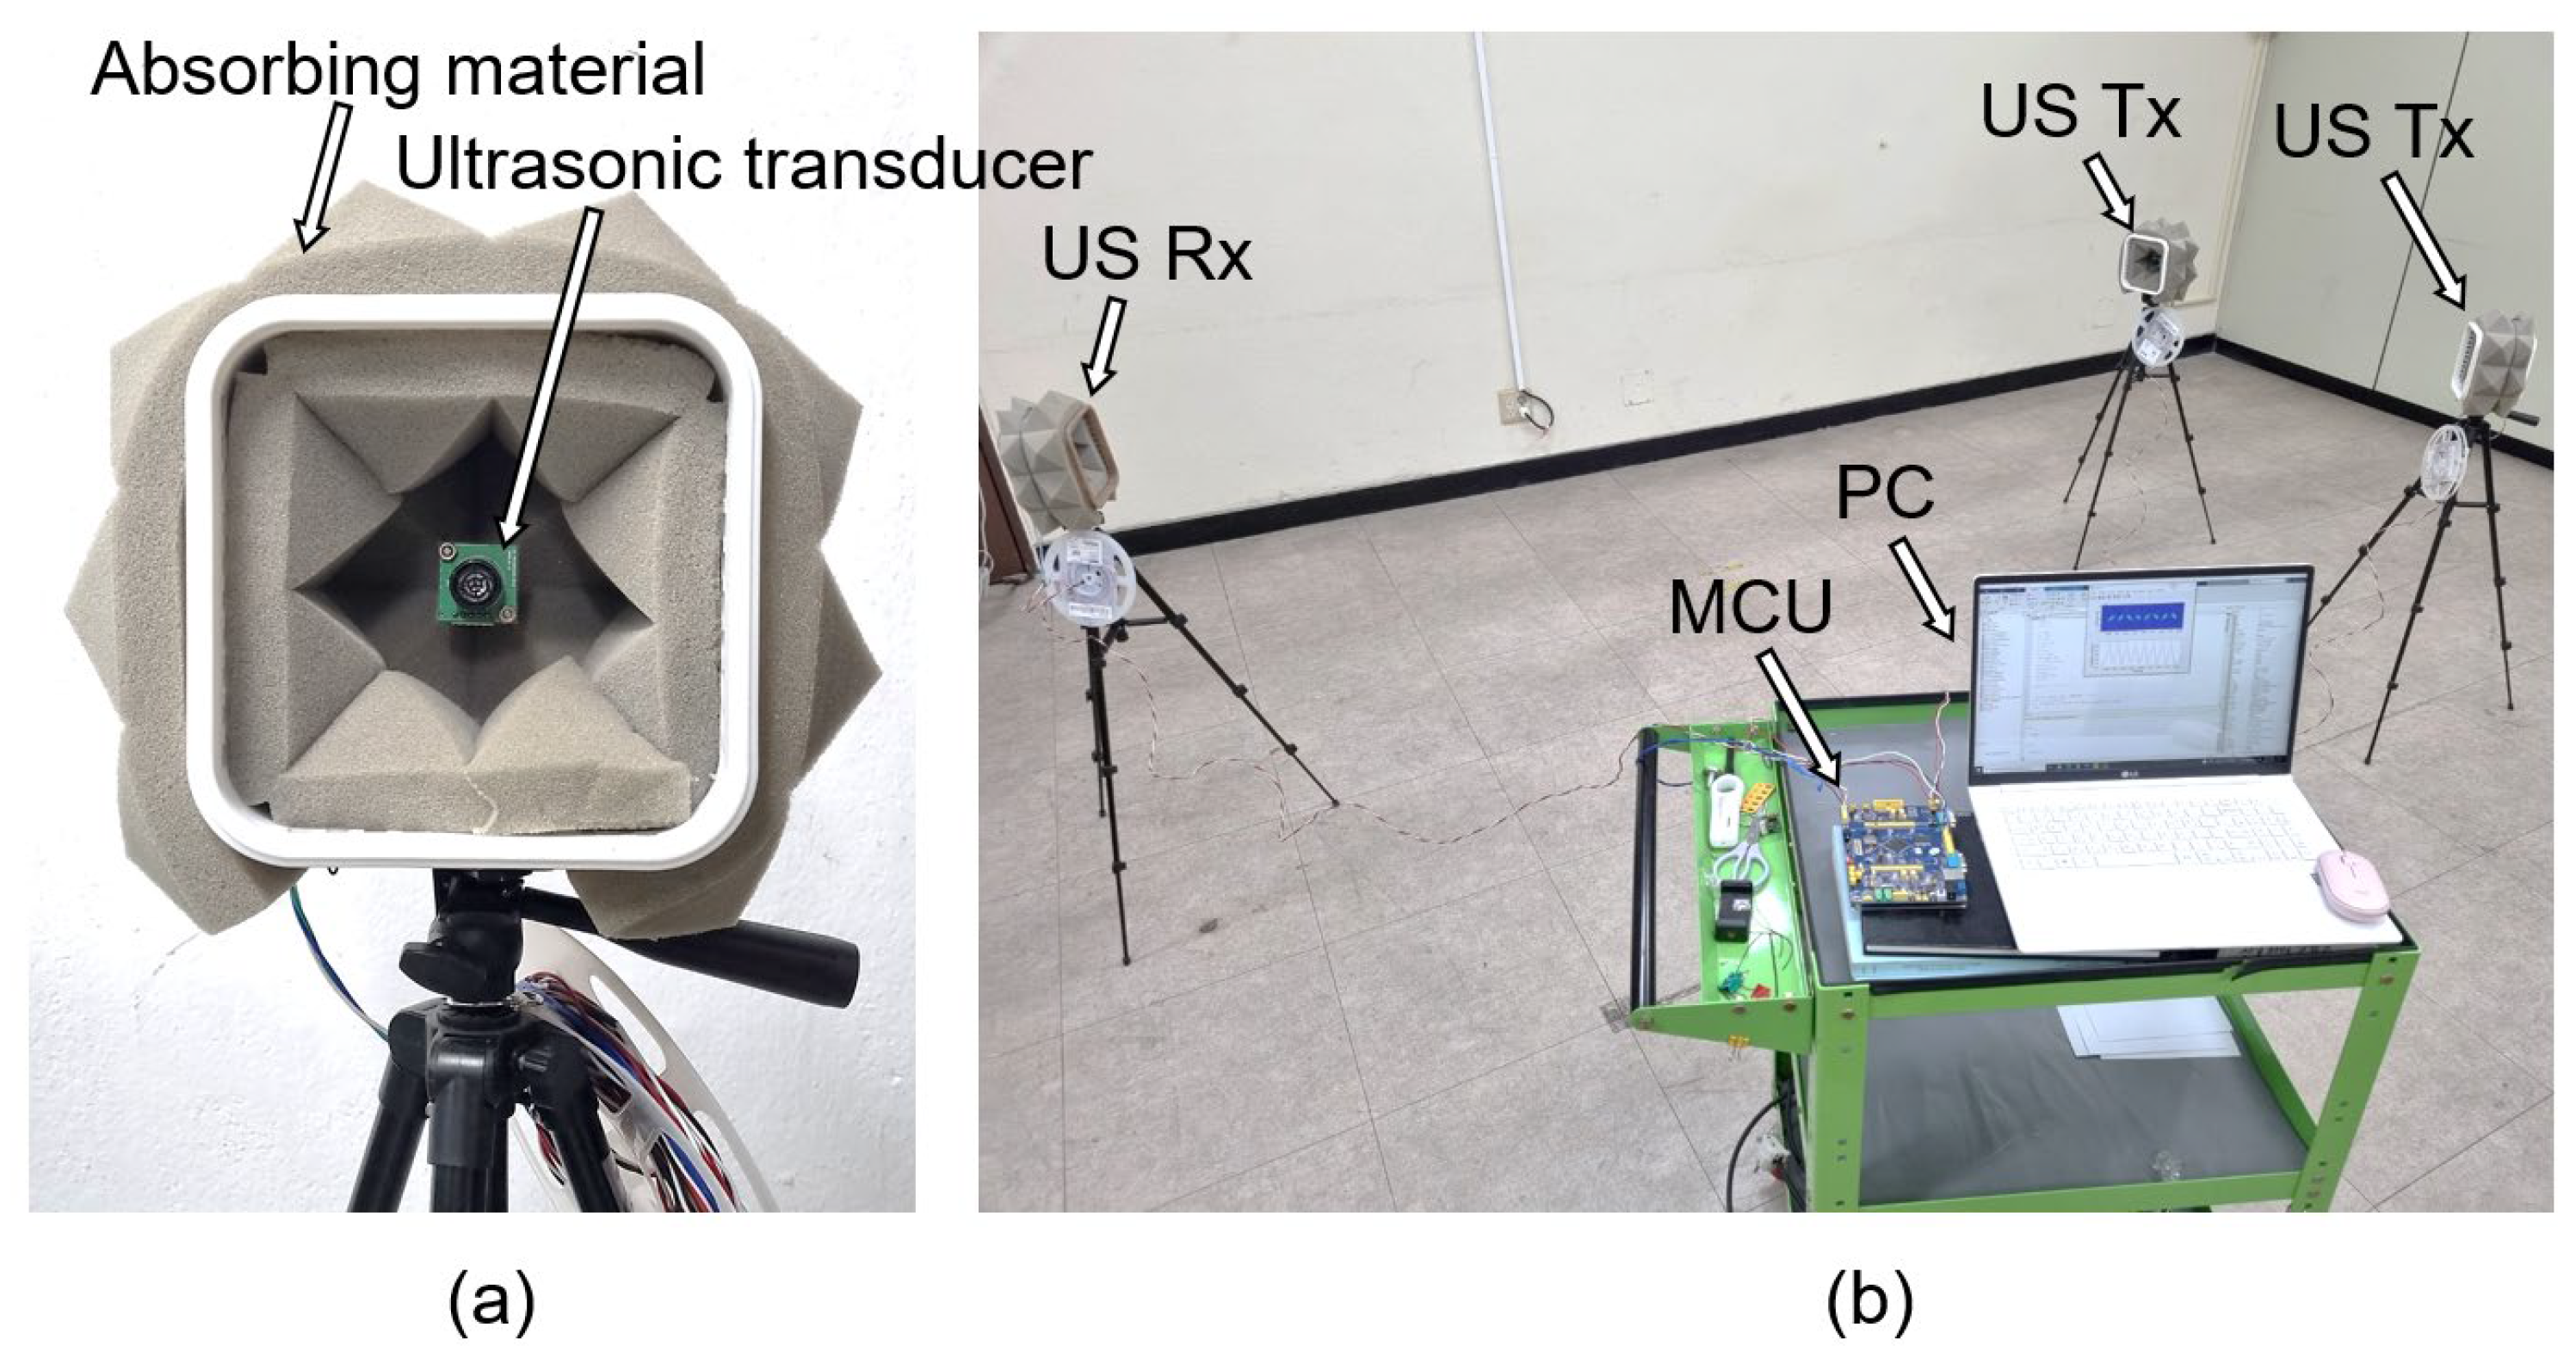
Figure 6.
Precision of each class as a validation result.
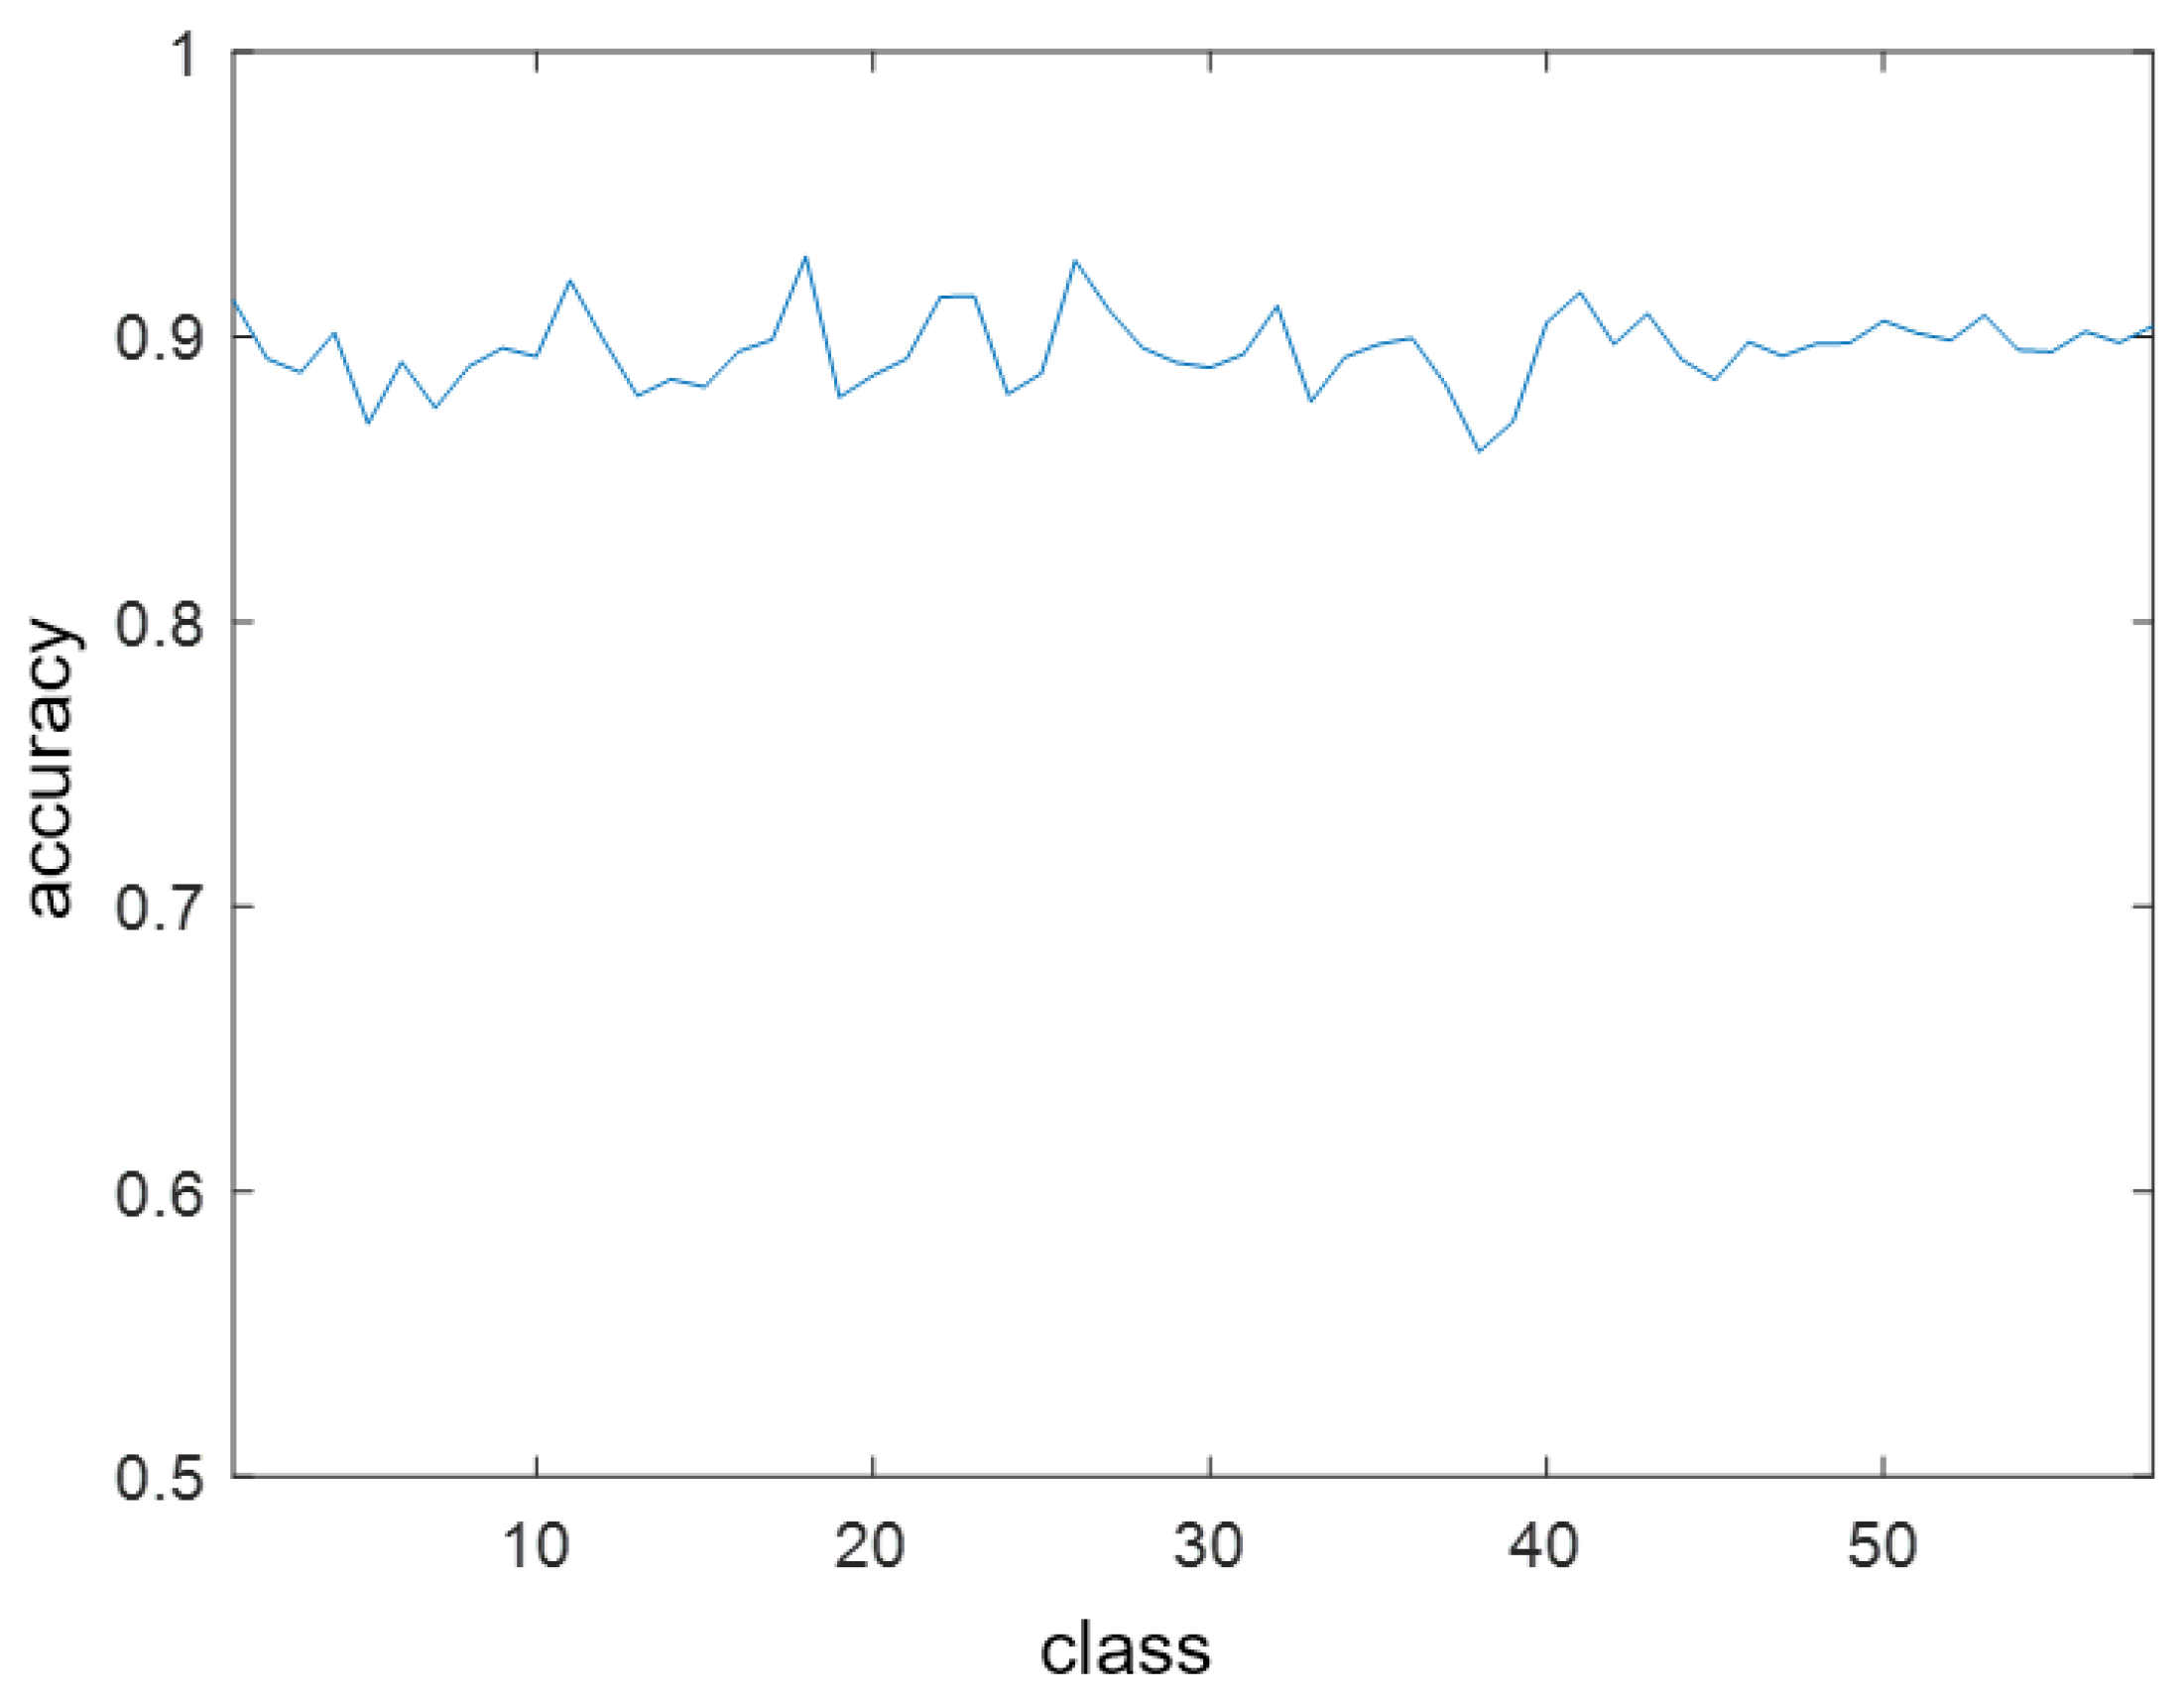
Figure 7.
Results of comparing the detection rates according to the overlap ratio.
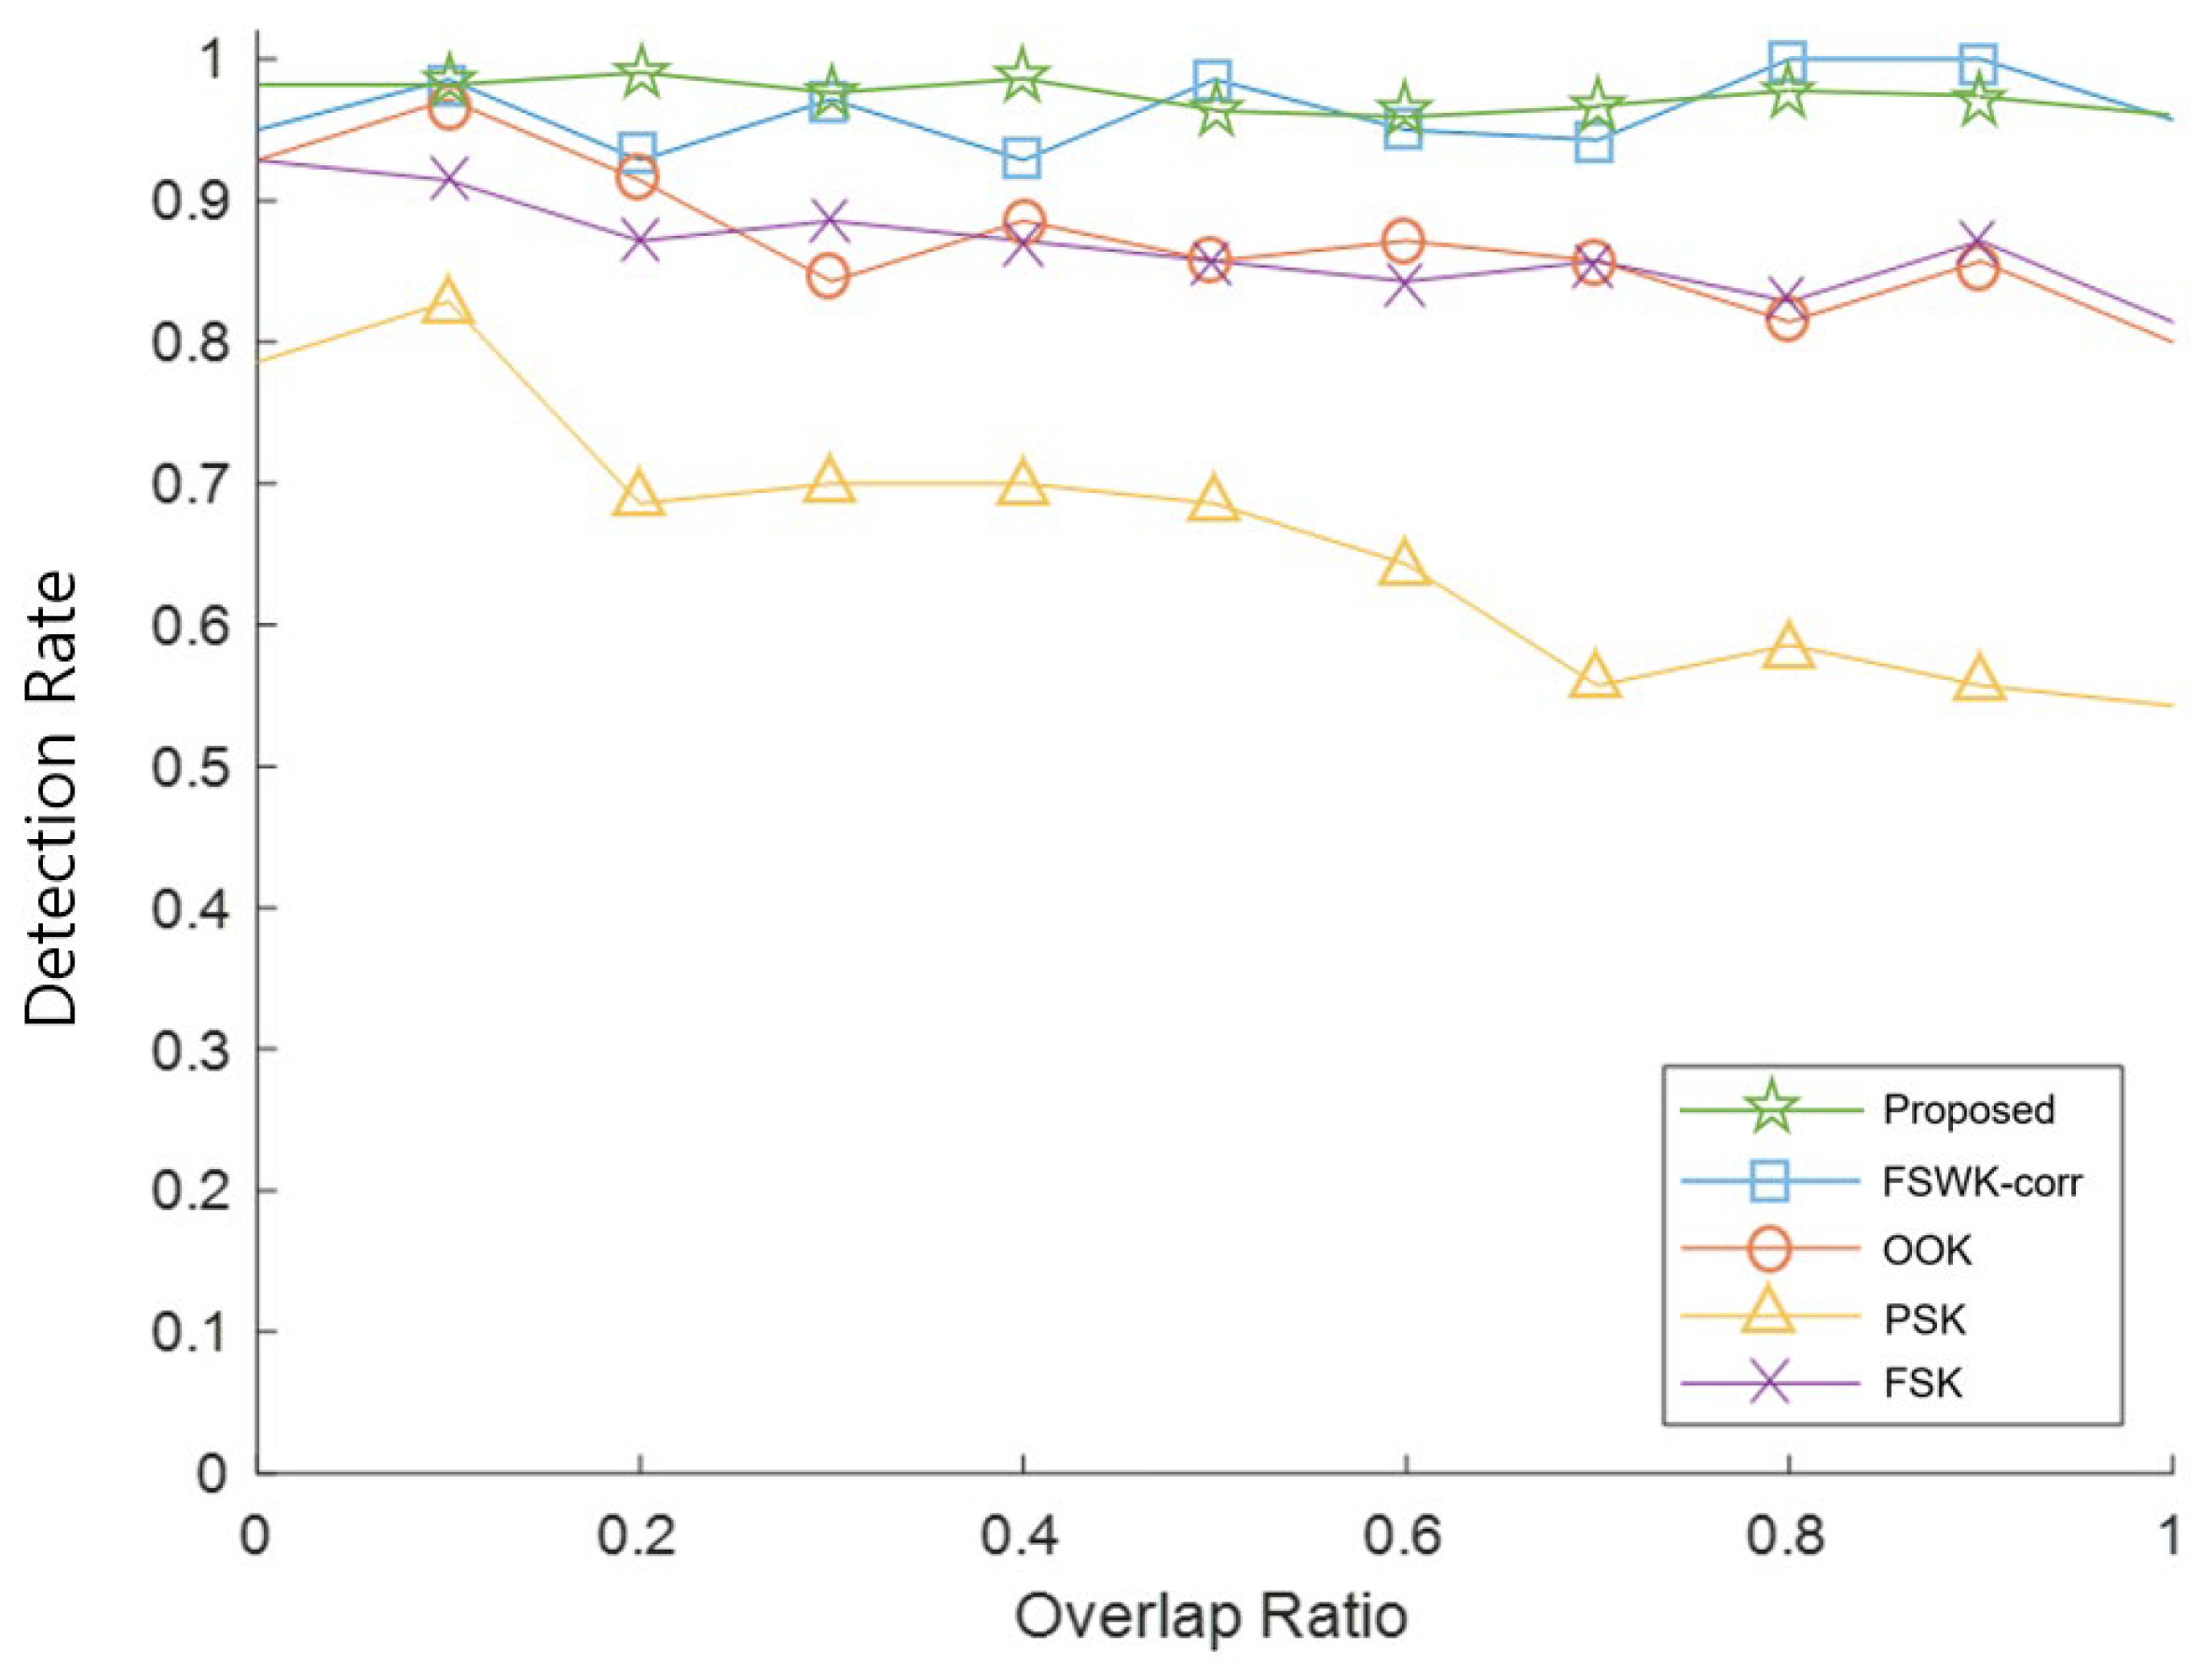

Table 1.
Experimental parameters.
| Parameter | Description | Value | Unit |
|---|---|---|---|
| Ultrasonic transducer center frequency | 40 | kHz | |
| Ultrasonic transducer frequency bandwidth | 4 | kHz | |
| ADC sampling rate | 1 | MHz | |
| Sweep frequency range | 8 | kHz | |
| Sweep time | 2 | ms |
Table 2.
Comparison of the TOF error according to the ID length of the proposed method and the existing methods. Measured in milli-second scale.
Table 2.
Comparison of the TOF error according to the ID length of the proposed method and the existing methods. Measured in milli-second scale.
| Code length | Proposed | FSWK-corr | OOK | FSK | PSK |
|---|---|---|---|---|---|
| 2 | 0.061 ± 0.019 | 0.362 ± 0.073 | 66.792 ± 29.135 | 66.268 ± 29.847 | 68.441 ± 30.362 |
| 4 | 0.064 ± 0.020 | 0.324 ± 0.059 | 32.235 ± 15.349 | 32.379 ± 15.894 | 33.618 ± 16.168 |
| 8 | 0.062 ± 0.019 | 0.326 ± 0.121 | 3.215 ± 1.548 | 4.782 ± 2.161 | 11.272 ± 4.558 |
| 16 | 0.064 ± 0.019 | 0.272 ± 0.075 | 2.371 ± 1.299 | 4.185 ± 2.335 | 12.185 ± 5.654 |
| 32 | 0.059 ± 0.018 | 0.249 ± 0.043 | 0.548 ± 0.024 | 1.335 ± 0.887 | 19.143 ± 8.548 |
| 64 | 0.058 ± 0.017 | 0.314 ± 0.054 | 0.064 ± 0.019 | 0.248 ± 0.052 | 21.151 ± 10.167 |
| 128 | 0.057 ± 0.017 | 0.291 ± 0.039 | 0.059 ± 0.018 | 0.206 ± 0.057 | 16.688 ± 7.748 |
Table 3.
Results of comparing the robustness of demodulator to heterogeneous signals.
| Modulation Method | Detection rate / Wrong detection rate / Non-detection rate | ||||
|---|---|---|---|---|---|
| Faster R-CNN | FSWK-corr | OOK | PSK | FSK | |
| Proposed | 0.99 / 0.01 / 0.00 | 0.97 / 0.00 / 0.03 | 0.43 / 0.57 / 0.00 | 0.69 / 0.31 / 0.00 | 0.61 / 0.39 / 0.00 |
| OOK | 0.01 / 0.01 / 0.99 | 0.00 / 0.56 / 0.44 | 0.94 / 0.06 / 0.00 | 0.53 / 0.47 / 0.00 | 0.44 / 0.56 / 0.00 |
| PSK | 0.00 / 0.01 / 0.98 | 0.00 / 1.00 / 0.00 | 0.51 / 0.49 / 0.00 | 0.96 / 0.04 / 0.00 | 0.52 / 0.48 / 0.00 |
| FSK | 0.14 / 0.07 / 0.79 | 0.16 / 0.83 / 0.01 | 0.47 / 0.53 / 0.00 | 0.42 / 0.58 / 0.00 | 0.97 / 0.03 / 0.00 |
Disclaimer/Publisher’s Note: The statements, opinions and data contained in all publications are solely those of the individual author(s) and contributor(s) and not of MDPI and/or the editor(s). MDPI and/or the editor(s) disclaim responsibility for any injury to people or property resulting from any ideas, methods, instructions or products referred to in the content. |
© 2023 by the authors. Licensee MDPI, Basel, Switzerland. This article is an open access article distributed under the terms and conditions of the Creative Commons Attribution (CC BY) license (http://creativecommons.org/licenses/by/4.0/).
Copyright: This open access article is published under a Creative Commons CC BY 4.0 license, which permit the free download, distribution, and reuse, provided that the author and preprint are cited in any reuse.


