A. Introduction
Today, the world has witnessed a global pandemic that has played an important role in changing aspects of human life, including the way we interact, work and shop. The trading industry is also not immune from this significant impact. In Indonesia, a country with a long tradition of producing traditional cloth that is rich in culture, the cloth sales industry is facing new challenges in facing the post-pandemic era. Nusantara fabric sellers are currently facing changes in consumer behavior, with customers increasingly wary of visiting physical stores and preferring to shop online. In facing this condition, Indonesian cloth sellers need to find innovative ways to market their products and reach potential customers.
One of the problems faced by Indonesian cloth sellers is how to present their products effectively to potential buyers. Traditional Indonesian fabrics have rich aesthetic value and beauty, but it is not always easy to communicate the uniqueness and characteristics of products through conventional marketing channels such as images or written descriptions. Customers often need more information and interactive experiences before they can make a purchasing decision. Therefore, a more creative and interactive marketing approach is needed to attract the interest and interest of potential customers.
In recent years, Augmented Reality (AR) technology has experienced rapid development and gained significant popularity in various industries. AR combines the real world with virtual elements, allowing users to have interactive and immersive experiences. The potential of AR in marketing has begun to be explored, with a number of companies and brands integrating this technology into their marketing strategies. AR can provide a more enjoyable, informative and personalized experience for customers, helping to increase sales and brand awareness.
In selling Indonesian fabrics, the use of Augmented Reality (AR) can be an interesting solution to introduce and market products in a more interesting and effective way. With AR, fabric sellers can show potential buyers how the fabric will look when used in various situations. Users can also interact with the product, change the pattern and color of the fabric virtually, and get detailed information about the material, manufacturing techniques, and history of the fabric. That way, the experience provided by AR is more immersive and convincing for customers, thereby helping them make better purchasing decisions. This research has a main problem formulation, namely how to use Augmented Reality (AR) technology in marketing and selling Indonesian fabrics. The problem consists of three main questions.
This research has the main objective of answering questions based on the problem formulation that has been developed by identifying the right strategy for utilizing AR technology, designing applications that suit the needs of Indonesian fabrics, and measuring the impact on sales, brand awareness and customer satisfaction. Practically, this research will provide in-depth understanding for Indonesian cloth sellers in utilizing AR to market and sell their products more effectively. By implementing specially designed AR applications, customer interactions and experiences with Nusantara fabric products can be improved, helping to increase marketing effectiveness, sales and brand awareness. Apart from that, this research can also provide academic benefits by increasing understanding of the use of AR in the fields of marketing and sales. Thus, it is hoped that a positive contribution can be made to this research in expanding knowledge about the use of AR in marketing Indonesian fabrics and becoming a reference for practitioners and academics who are involved in this field.
B. Library Review
Basic Concepts of Augmented Reality
Augmented Reality (AR) is a technology that combines virtual elements with the real world, creating an experience that looks and feels as if the virtual object exists in a real environment (Gillis, 2016). The basic concept of AR involves recognizing and mapping a physical environment using sensors such as cameras and motion sensors, then displaying virtual objects integrated with that environment via devices such as smartphones, tablets, or smart glasses. One of the key elements in AR is a virtual “overlay” that overlaps the real world. This overlay can be a 2D or 3D object, text, sound, or animation that is integrated with the real view around it (Mujumdar, 2022).
AR technology uses image processing, pattern detection, and motion sensors to align virtual overlays with the physical environment being observed. In AR, users can interact with virtual objects through touch, movement, or voice commands (Afshar, 2023). This enables a more interactive experience and allows users to manipulate, explore, or get more information about virtual objects in real time (Kompasiana, 2018). AR has a wide range of applications, including gaming, education, product design, location mapping, tour guiding, and of course marketing. The application of AR in marketing allows customers to have a richer and more immersive experience with a particular product or brand.
Application of AR in Marketing
The application of Augmented Reality (AR) in marketing has become an increasingly popular trend. AR allows businesses to create engaging and unique interactive experiences for customers. Through AR, customers can see products or brands in their real environment, try and manipulate virtual objects, and get additional useful information (Sinha & Srivastava, 2023). One application of AR in marketing is through the virtual "try-on" feature. For example, in the fashion industry, customers can use AR applications to try on clothes or accessories virtually in front of their mirror. This allows customers to see how the product will look when worn before they make a purchasing decision (Suryawijaya et al., 2023).
Additionally, AR can also be used in advertising campaigns to provide additional information to customers. For example, a print ad can be enhanced by using an AR application, which, when hovered over the ad, will display additional content such as a video, a link to a website, or a snippet of a product review. This provides opportunities for deeper interactions between customers and brands. The application of AR in marketing also allows businesses to collect valuable user data. By analyzing user interactions with virtual objects, businesses can better understand customer preferences and behavior, and thereby direct more effective marketing strategies.
C. Research methods
This research uses quantitative methods with the Unified Theory of Acceptance and Use of Technology (UTAUT) model approach.This approach was chosen because the research focus is on customer experiences, preferences and perceptions of the use of AR in visualizing fabrics and their motifs. The initial stage involves collecting data and information through literature studies from books, journals, and trusted online sources to gain a deep understanding of the AR concept, its application in marketing, and its use in creating a more interactive shopping experience. After gaining adequate understanding through a literature review, this research uses a Design Thinking approach (Cuiñas & Fernández Iglesias, 2023; Kuswana, 2023). Test data was collected using an online survey via Google Form with a sample size of 100 data taken using the Quota Sampling method (Banning, 2023). The testing instrument consists of predetermined variables and indicators. An interval scale is used in filling out the testing instrument, with the number 1 indicating the inappropriateness of the question or statement, and the number 10 indicating the suitability of the question or statement. After that, the samples obtained from the questionnaire will be analyzed using the smartPLS 4.0 application to evaluate the relationship between variables in order to check the level of readiness of the AR prototype that has been created for research purposes.
D. Results and Discussion
Application Development: Design Thinking Method
In the process of developing user experience design, the author uses the design thinking method as a product development approach. According to Dam and Shiang (2021), Design thinking is a design method carried out with an approach that prioritizes solutions as problem solving. This method is especially useful when solving complex, unclear, or unknown problems, by understanding the needs and requirements of the people involved, rethinking the problem in a user-centered way, generating multiple solution ideas in brainstorming, and making practical decisions.
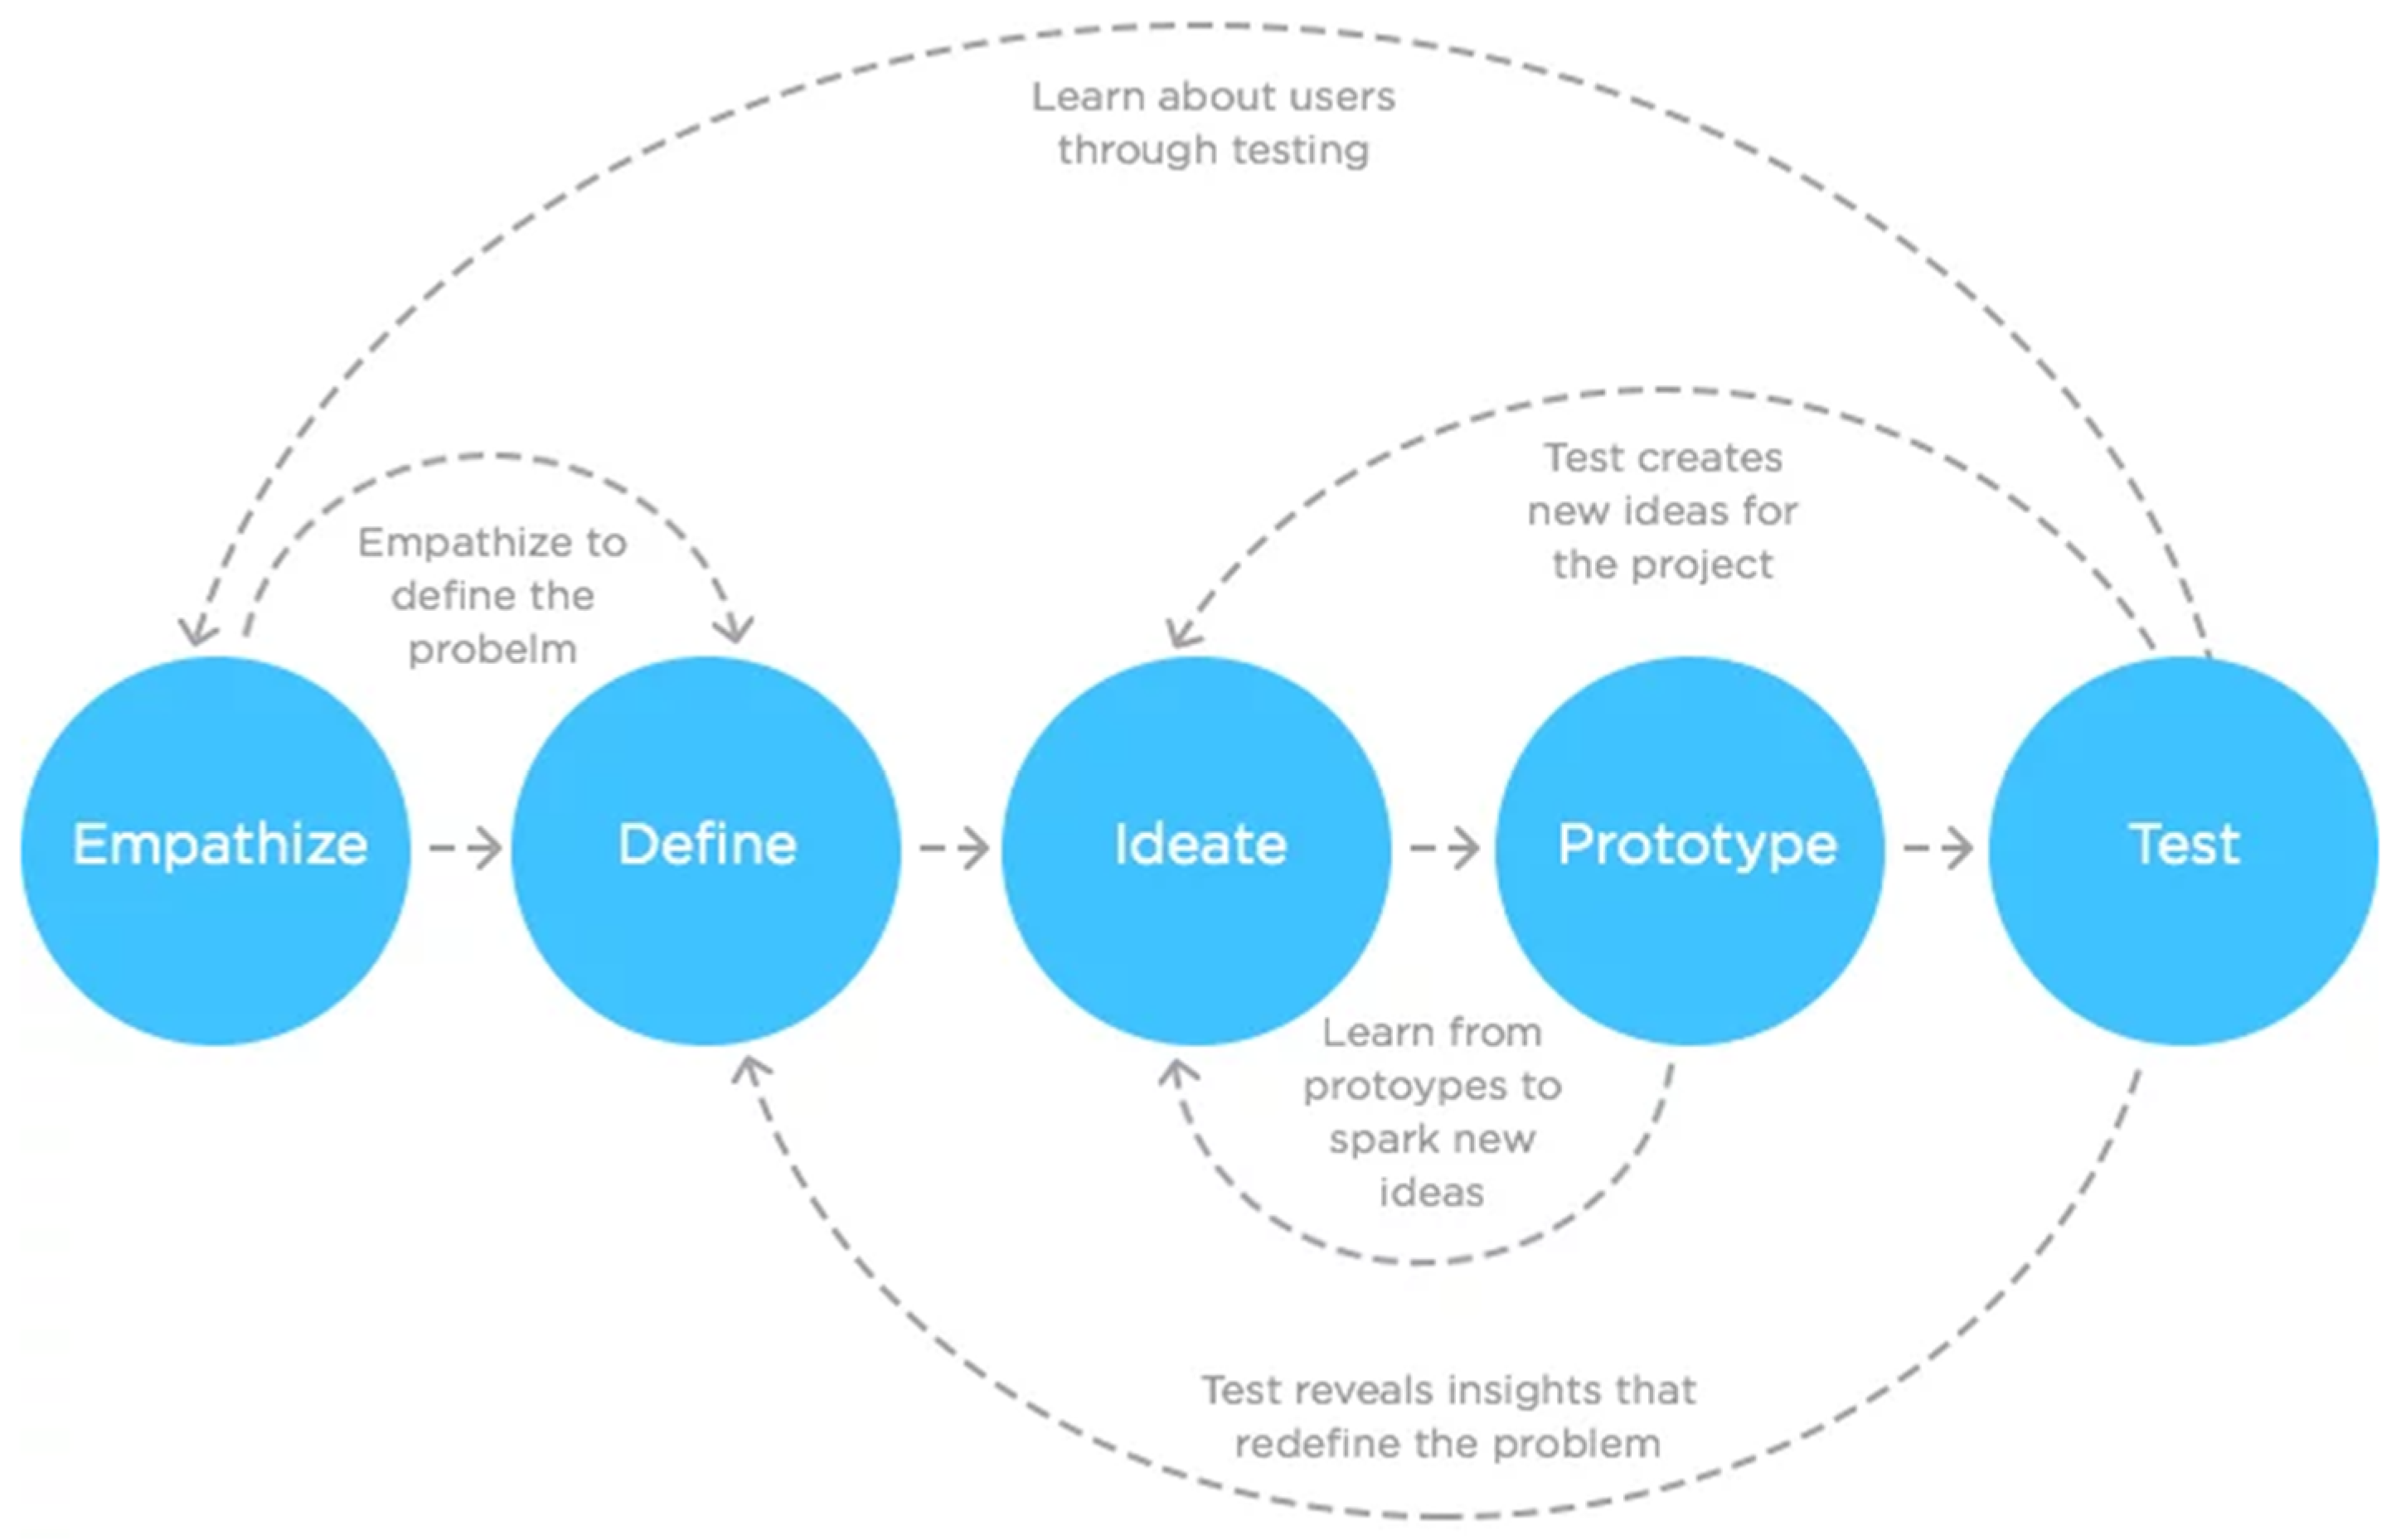
In their presentation, Bon Ku and Ellen (2020) stated that the design thinking development method focuses primarily on how users meet their needs. The Design Thinking method is divided into five stages, namely the empathize, define, ideate, prototype and test stages. The stages in design thinking show an iterative and non-linear process where the process itself is divided into several such as trying to find problem data, making counter assumptions, and redefining the problem with the aim of finding alternative strategies and solutions that might be slower if using other methodologies (Fariyanto, Suaidah & Ulum: 2021). The design thinking method that the author uses is a method that has non-linear development capabilities, which means that every evaluation and improvement does not have to go back to the initial stage and can be adjusted to the needs found by the developer.
Figure 1.
Design Thinking Method.
Figure 1.
Design Thinking Method.
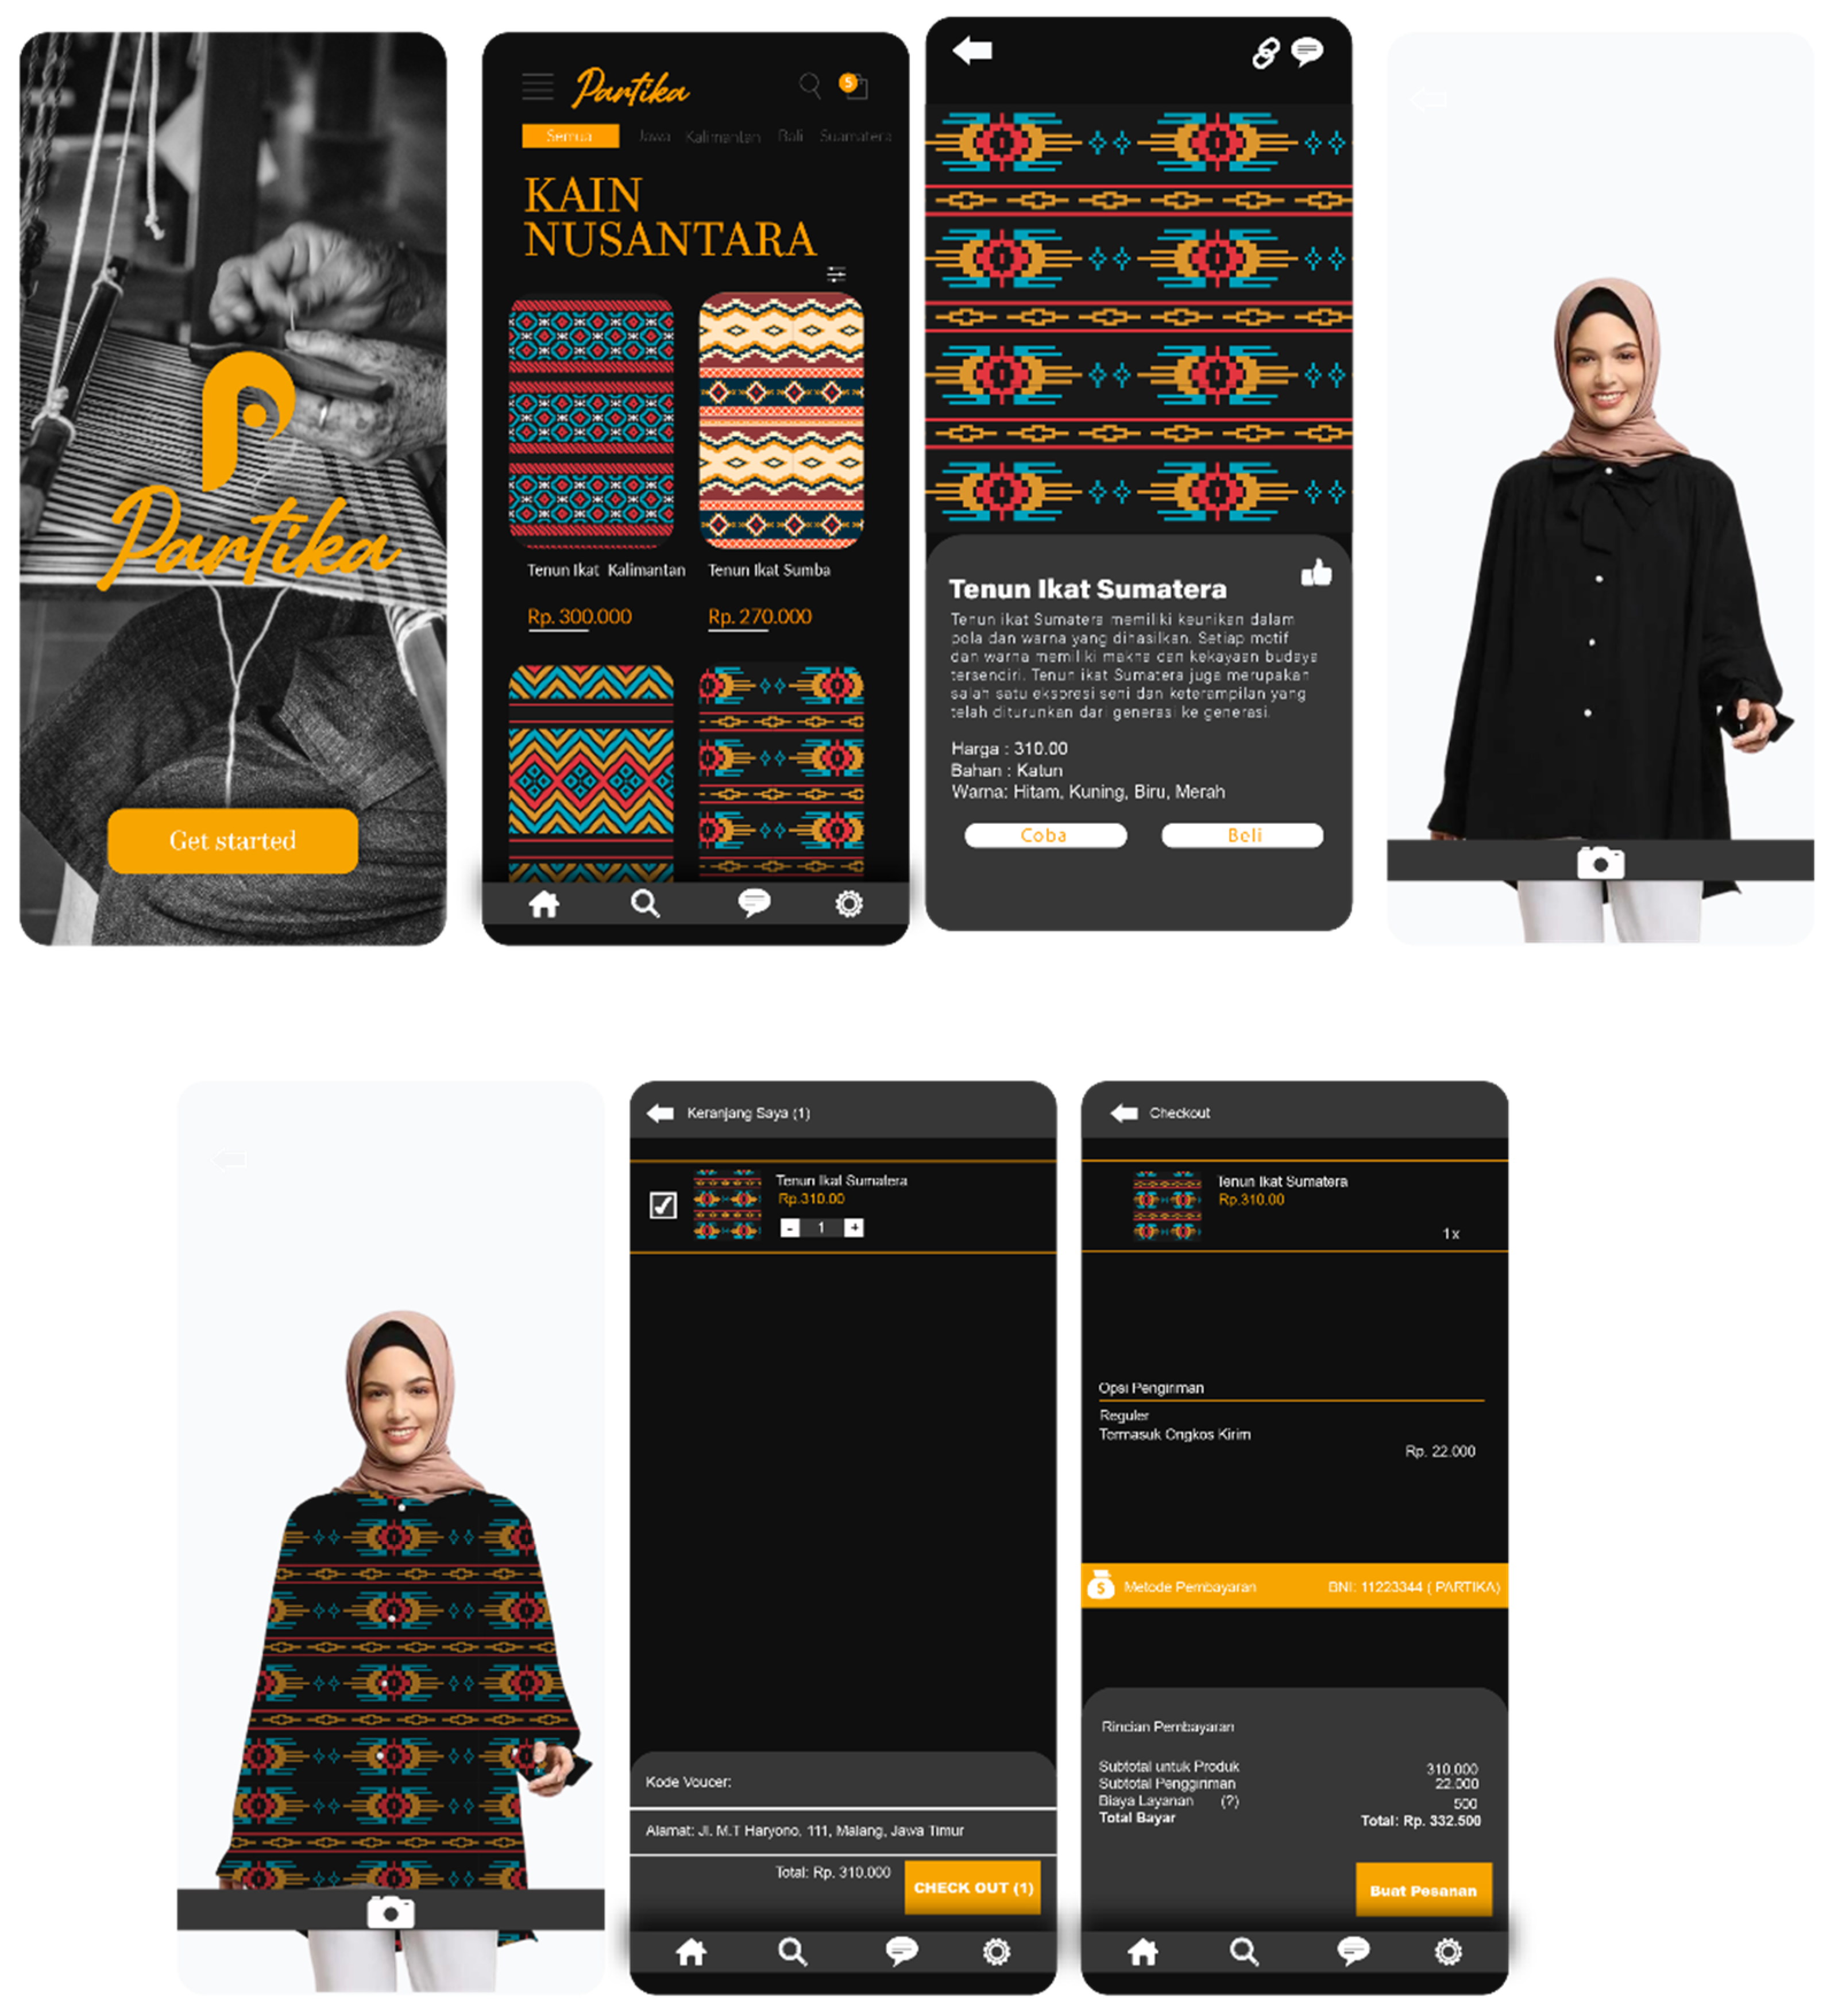
Scheme 1 Variations in product types with traditional fabric motifs, 2) Variations in clothing models based on male and female gender for the implementation of traditional fabrics, 3) Visualization of clothing designs according to traditional fabric motifs. which have been selected through AR technology, and 4) Shopping basket for making purchases and payments.
A. Flowchart
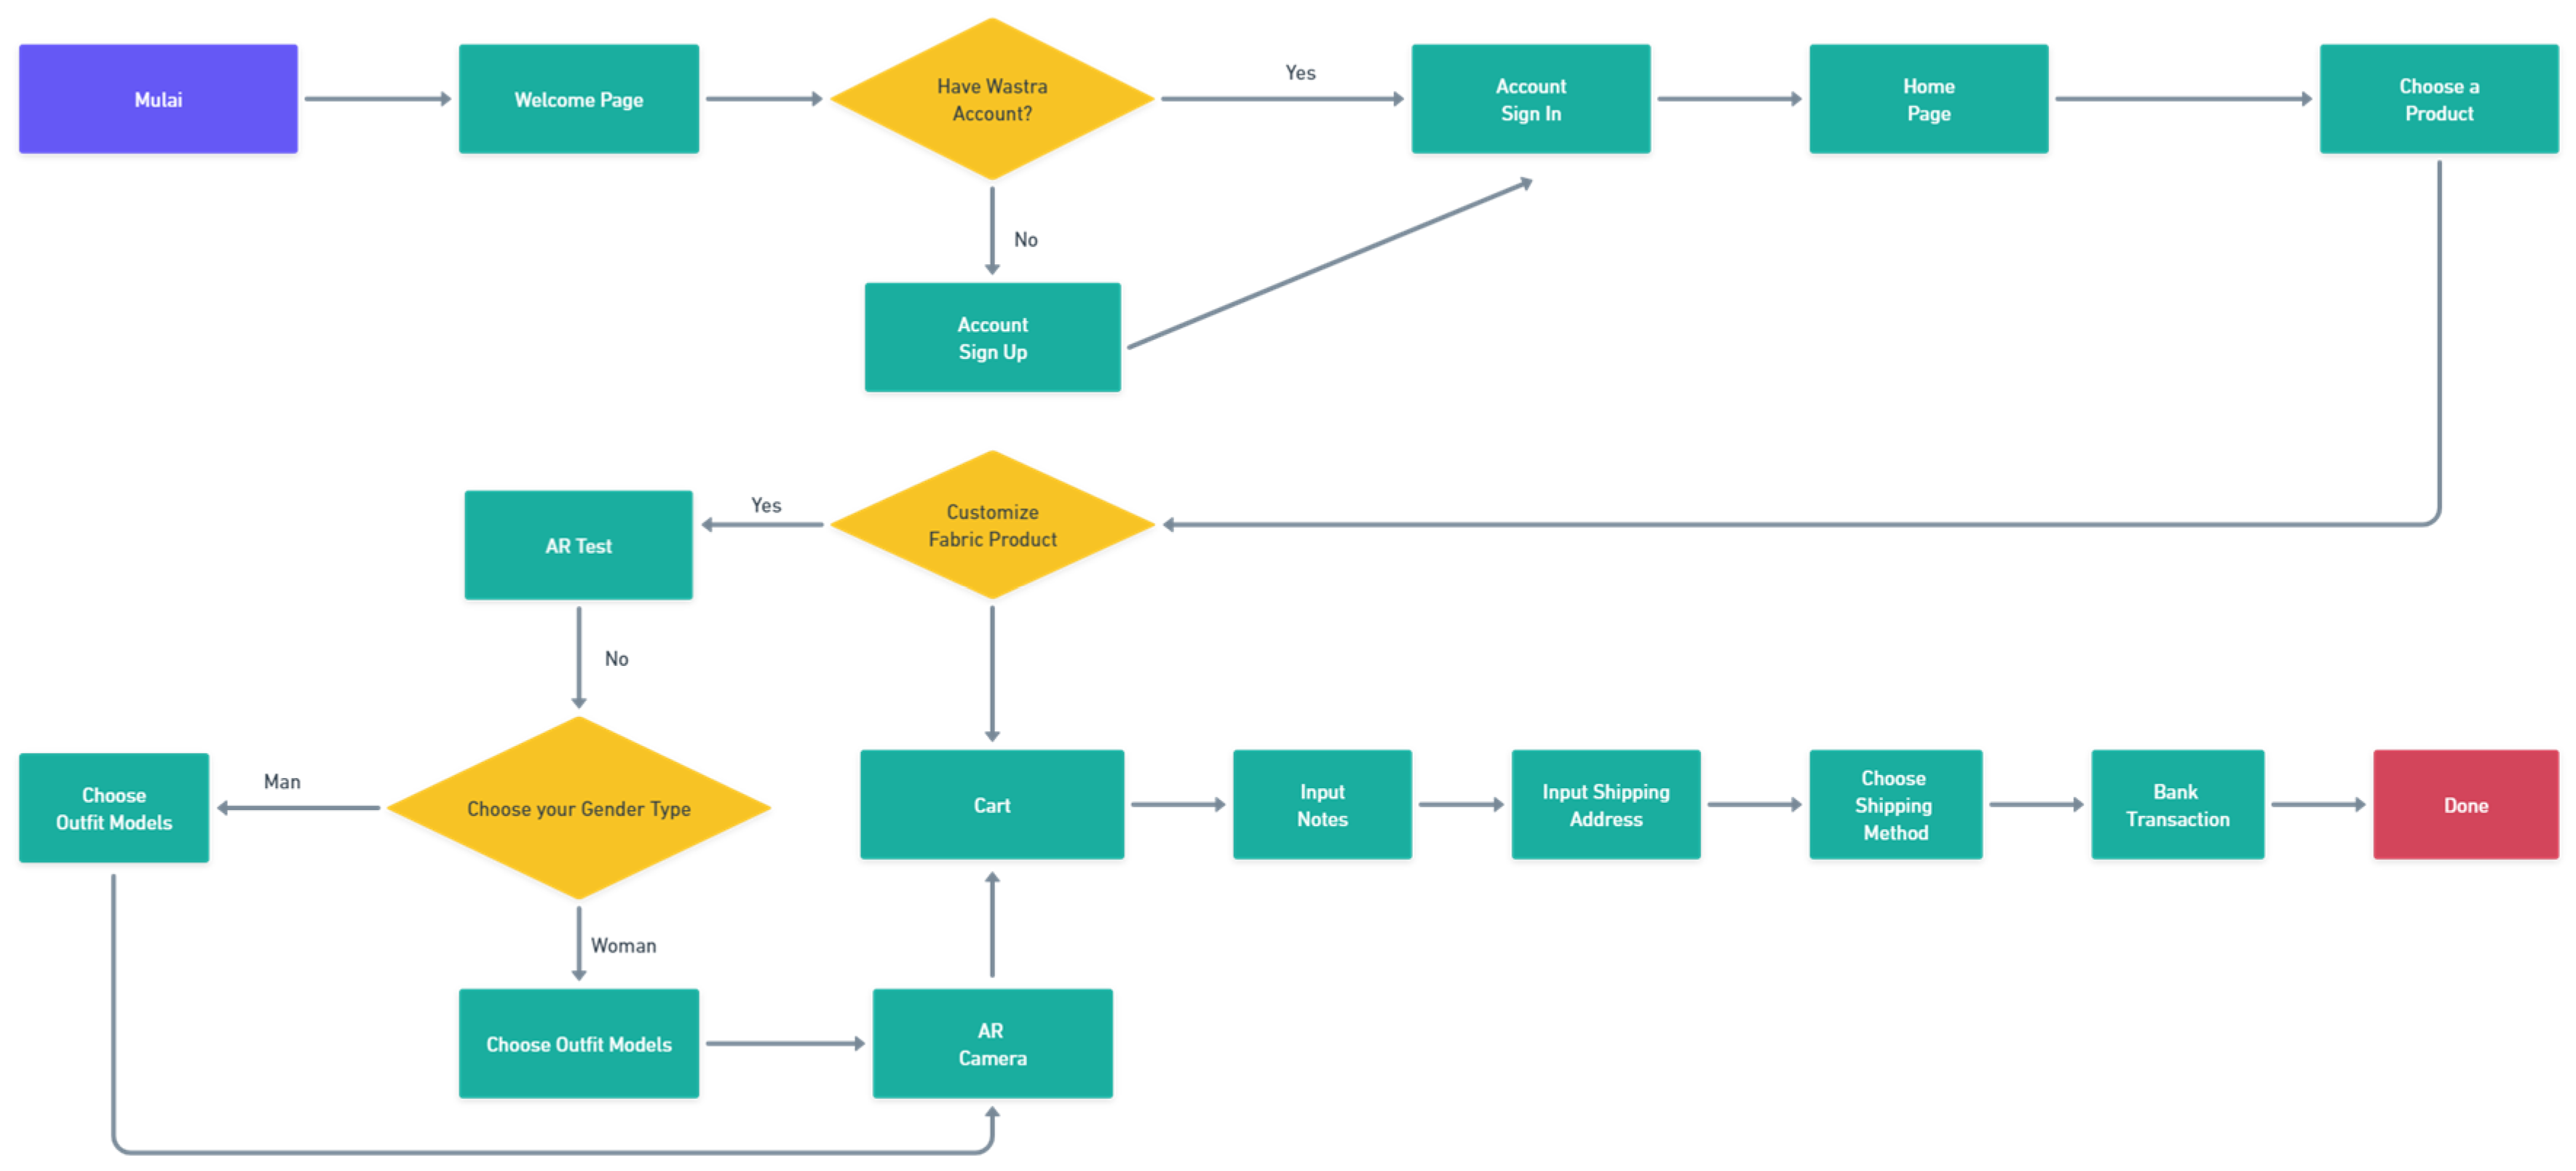
Flowcharts, according to Kristin in Al-Khairi (2022), are a form of system design that visualizes the system and its components, as well as the flow of data or information that flows between these components. The following is a PARTIKA application flowchart that illustrates system design navigation based on the features provided.
Figure 2.
PARTIKA User Flowchart.
Figure 2.
PARTIKA User Flowchart.
B. Information Architecture
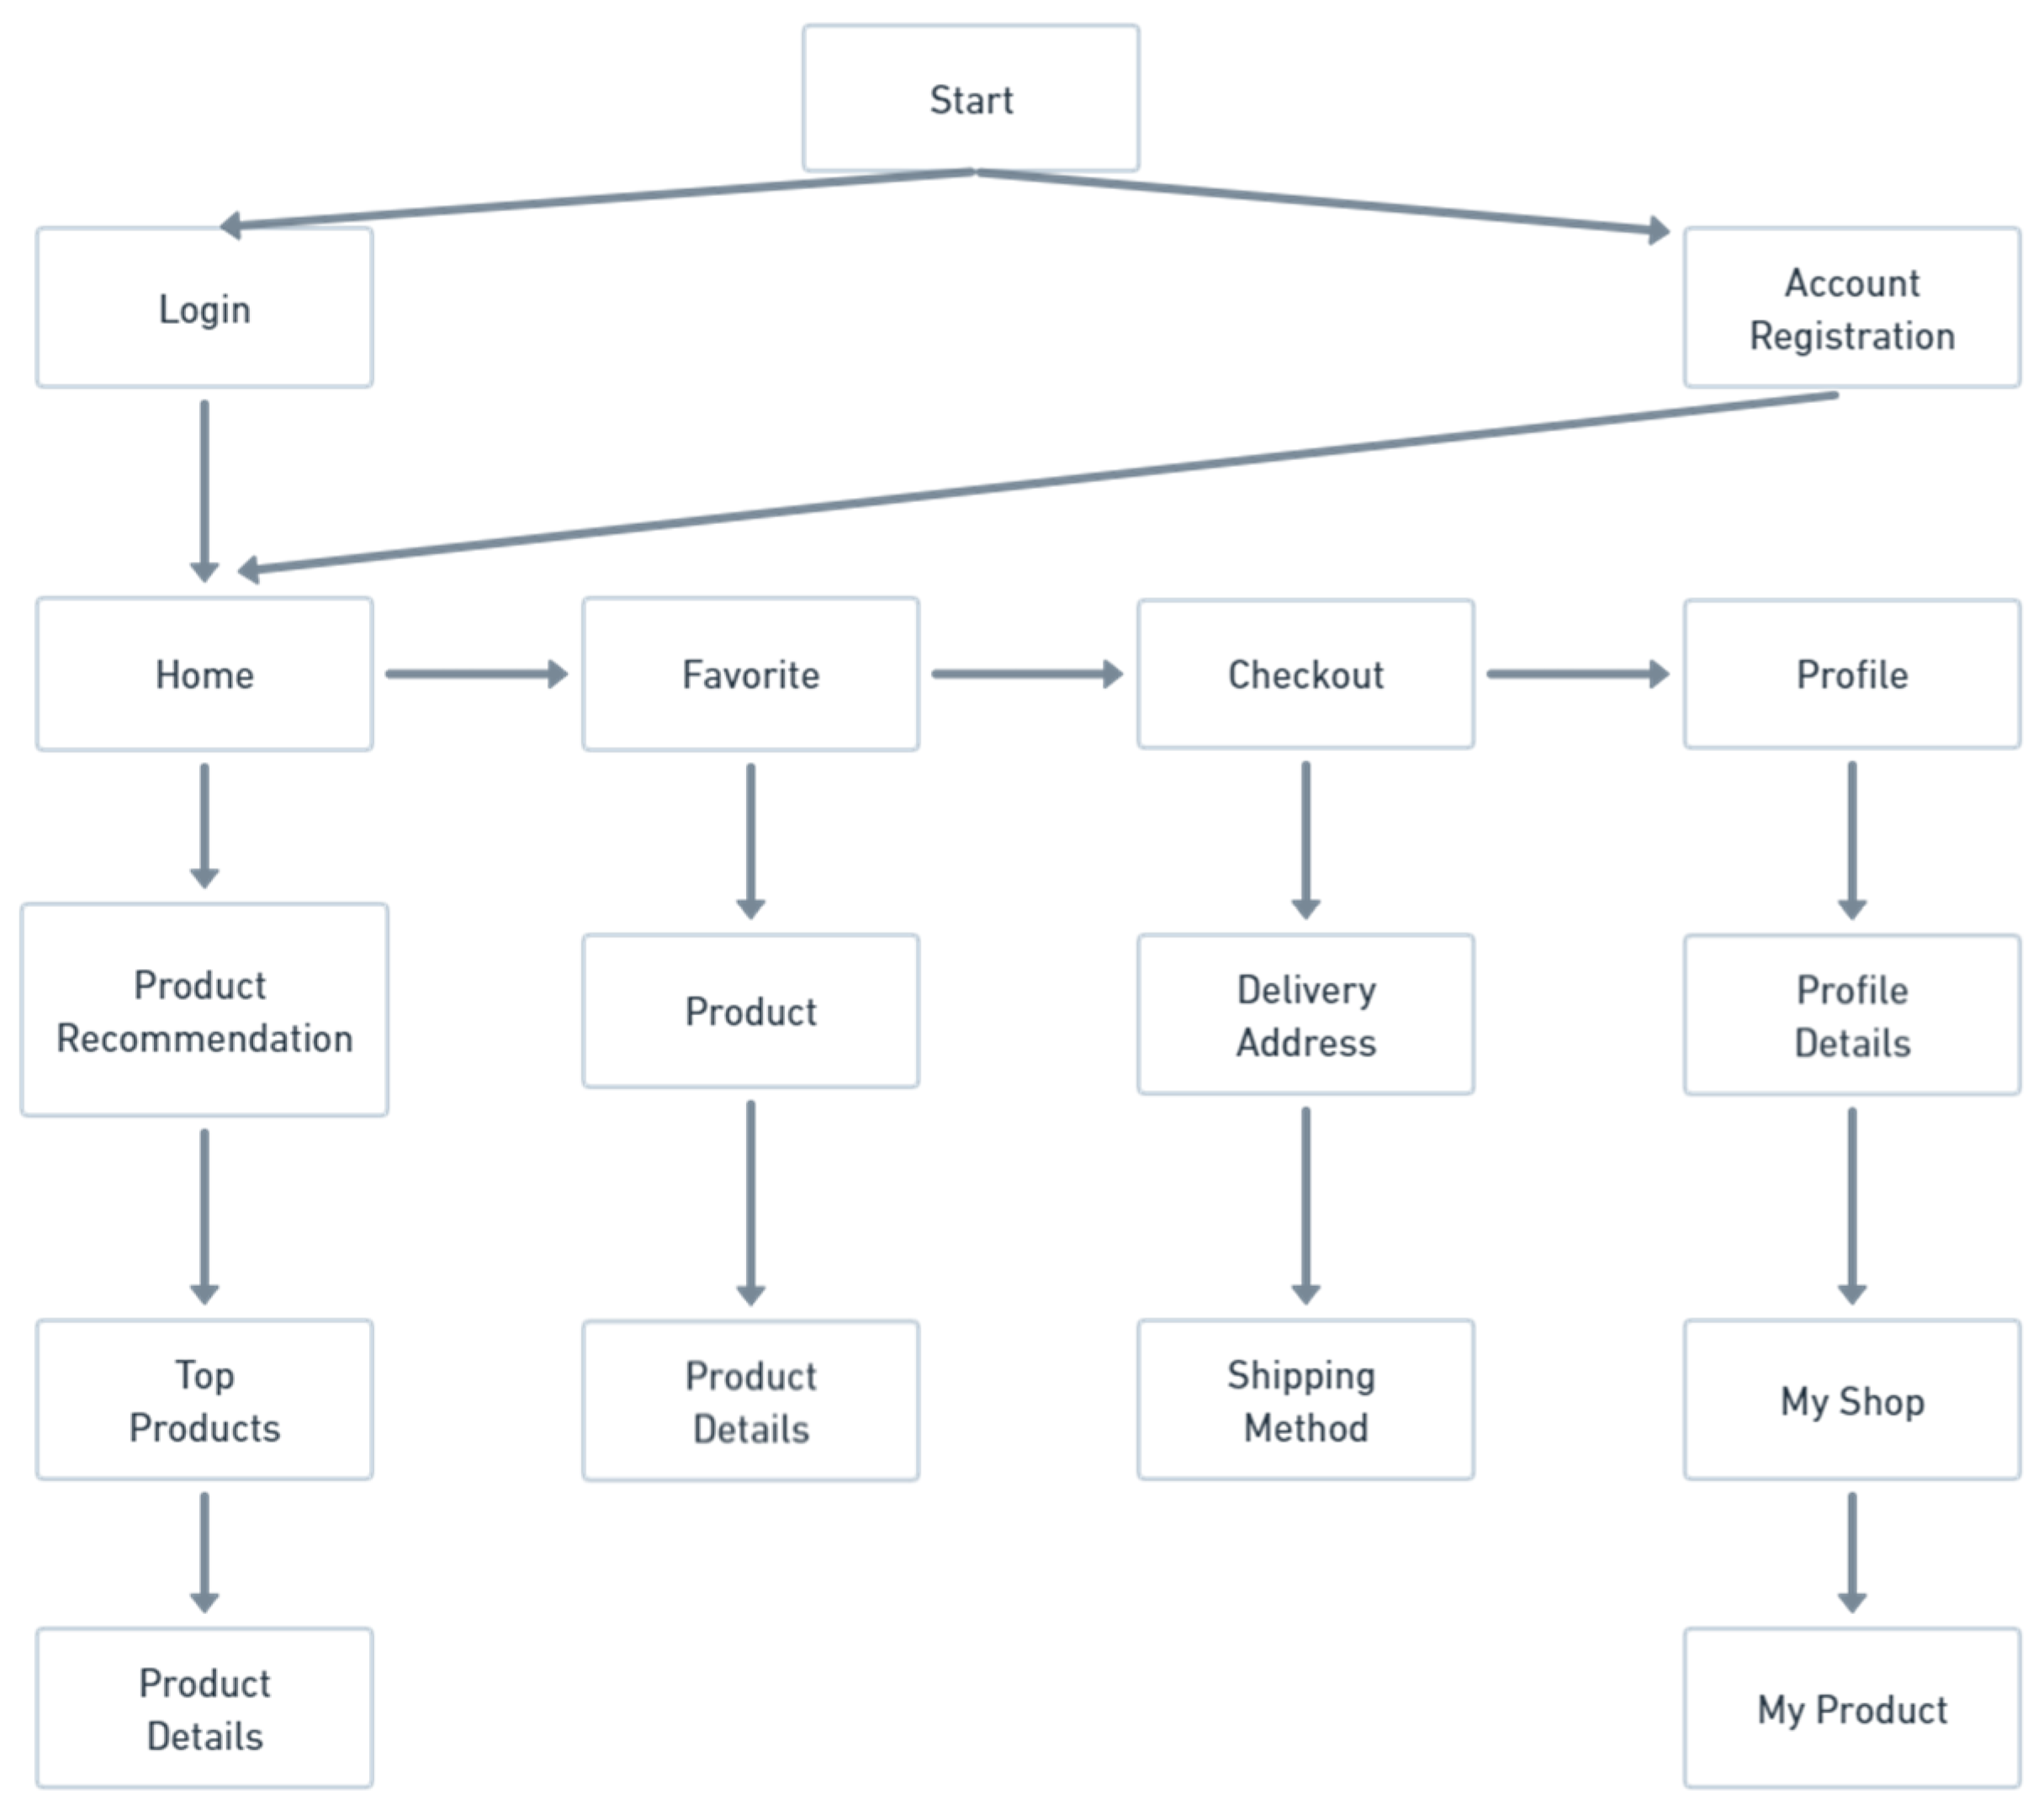
Information Architecture is the creation of an information structure in an application that allows users to understand the information. According to Anwariningsih in Al-Khairi (2022), information architecture or sitemap is a menu hierarchy of a site that describes the contents and links of each page on a website/application. The following is an overview of information architecture in designing the PARTIKA application.
Figure 3.
PARTIKA Information Architecture.
Figure 3.
PARTIKA Information Architecture.
C. Wireframe
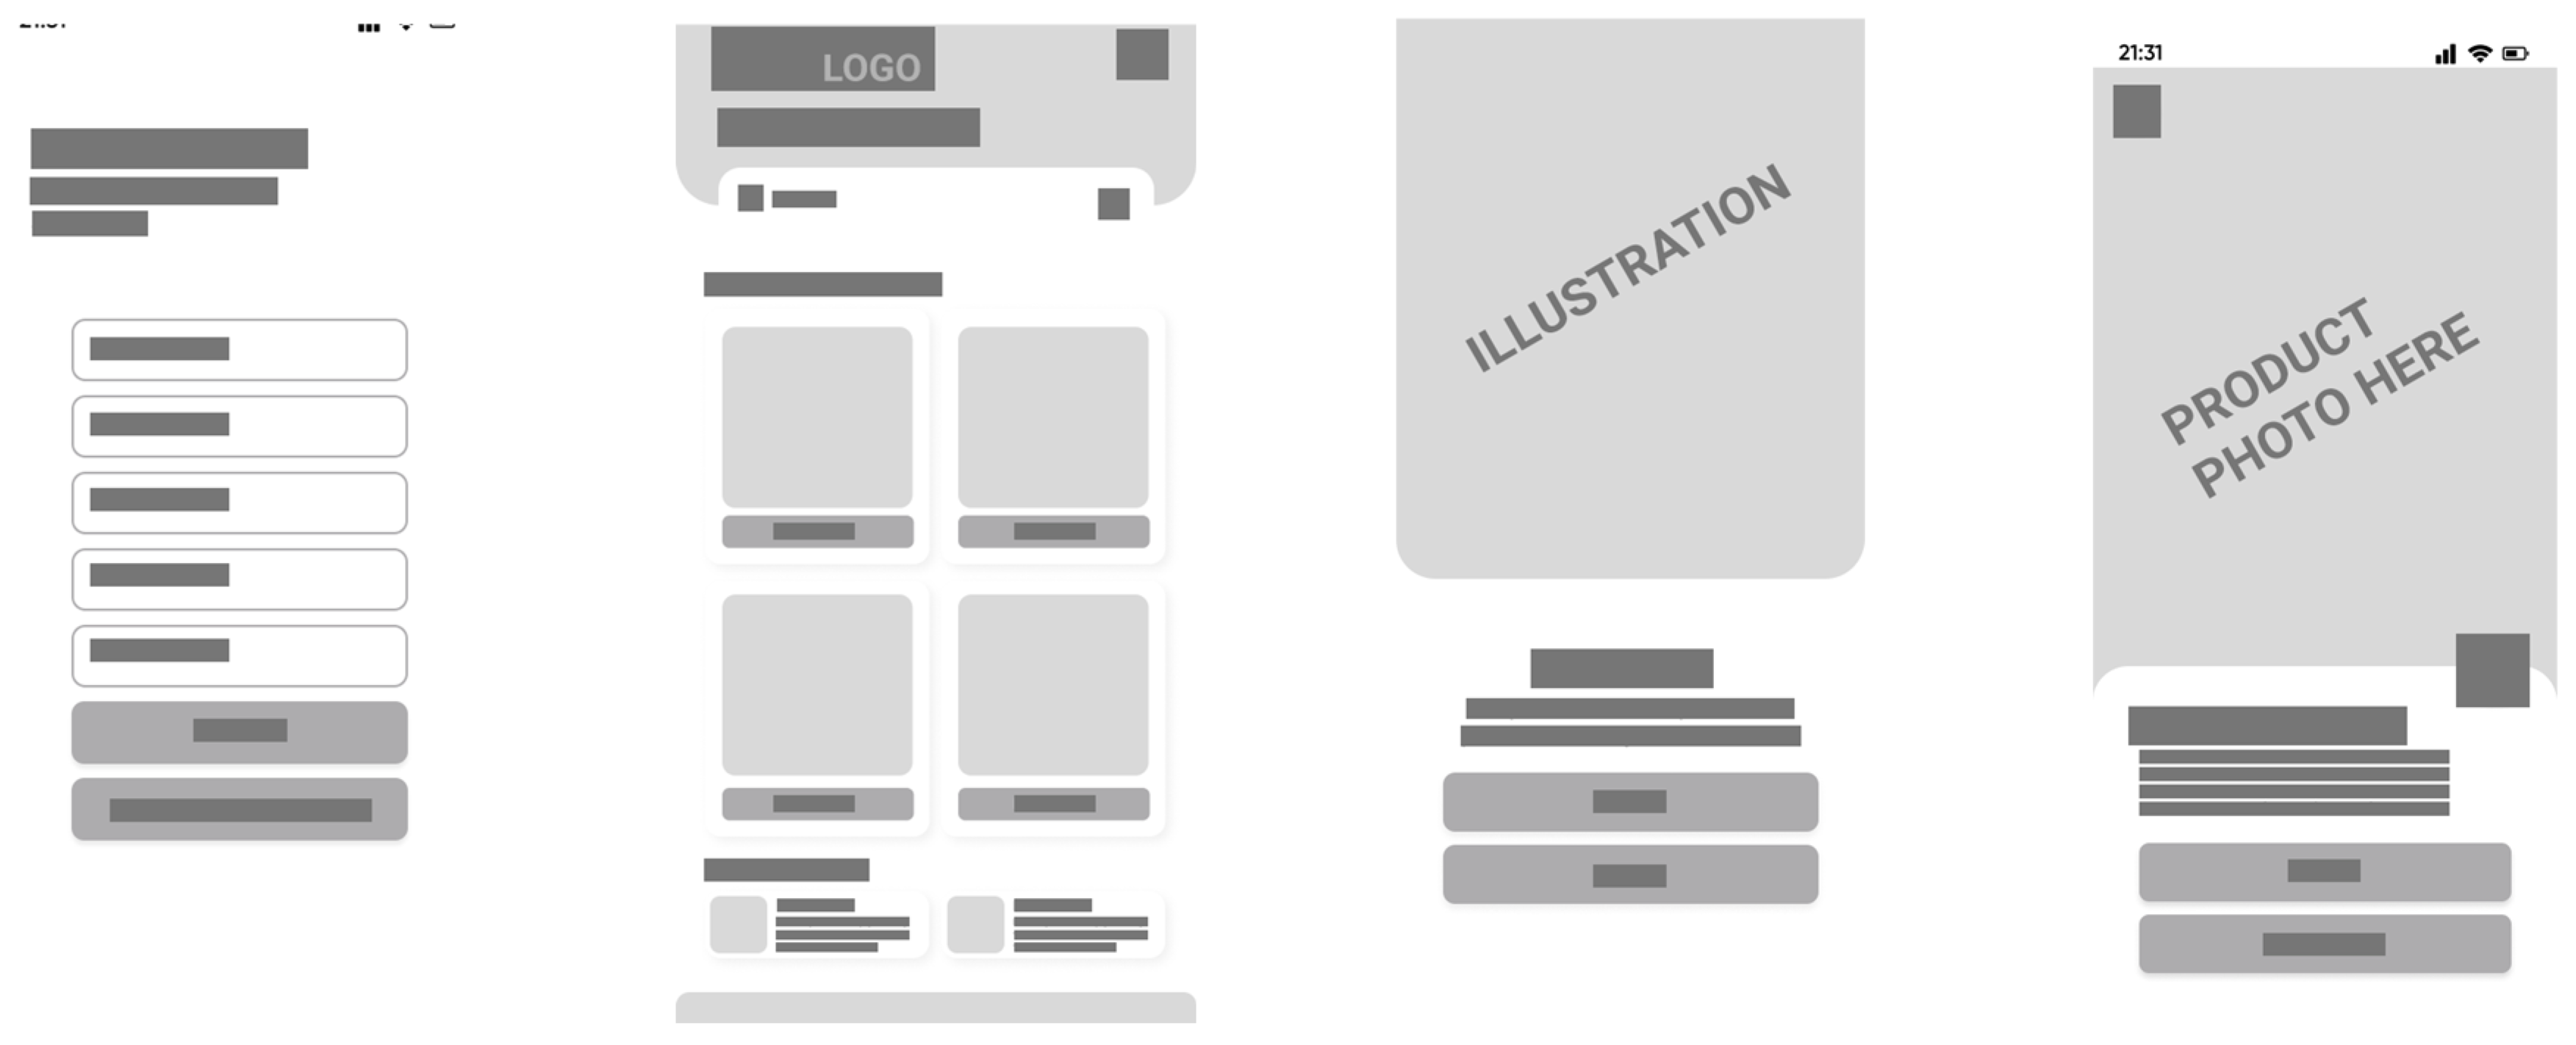
A wireframe is a rough description of an interface design. Its purpose is to show the arrangement, layout, content organization, and navigation on an interface page. Wireframes are necessary because at this stage you need to freely explore the desired layout, and be able to create various alternative views quickly, so you can minimize too many revisions. The following is a wireframe based on the information architecture that has been created.
Figure 4.
PARTIKA User Interface Wireframe.
Figure 4.
PARTIKA User Interface Wireframe.
D. Prototype Design
A prototype is a computer-based digital representation that resembles a final system or product. At this stage the interface design appears clearer, more detailed and neater.
Figure 5.
High Fidelity PARTIKA prototype.
Figure 5.
High Fidelity PARTIKA prototype.
Prototype Testing
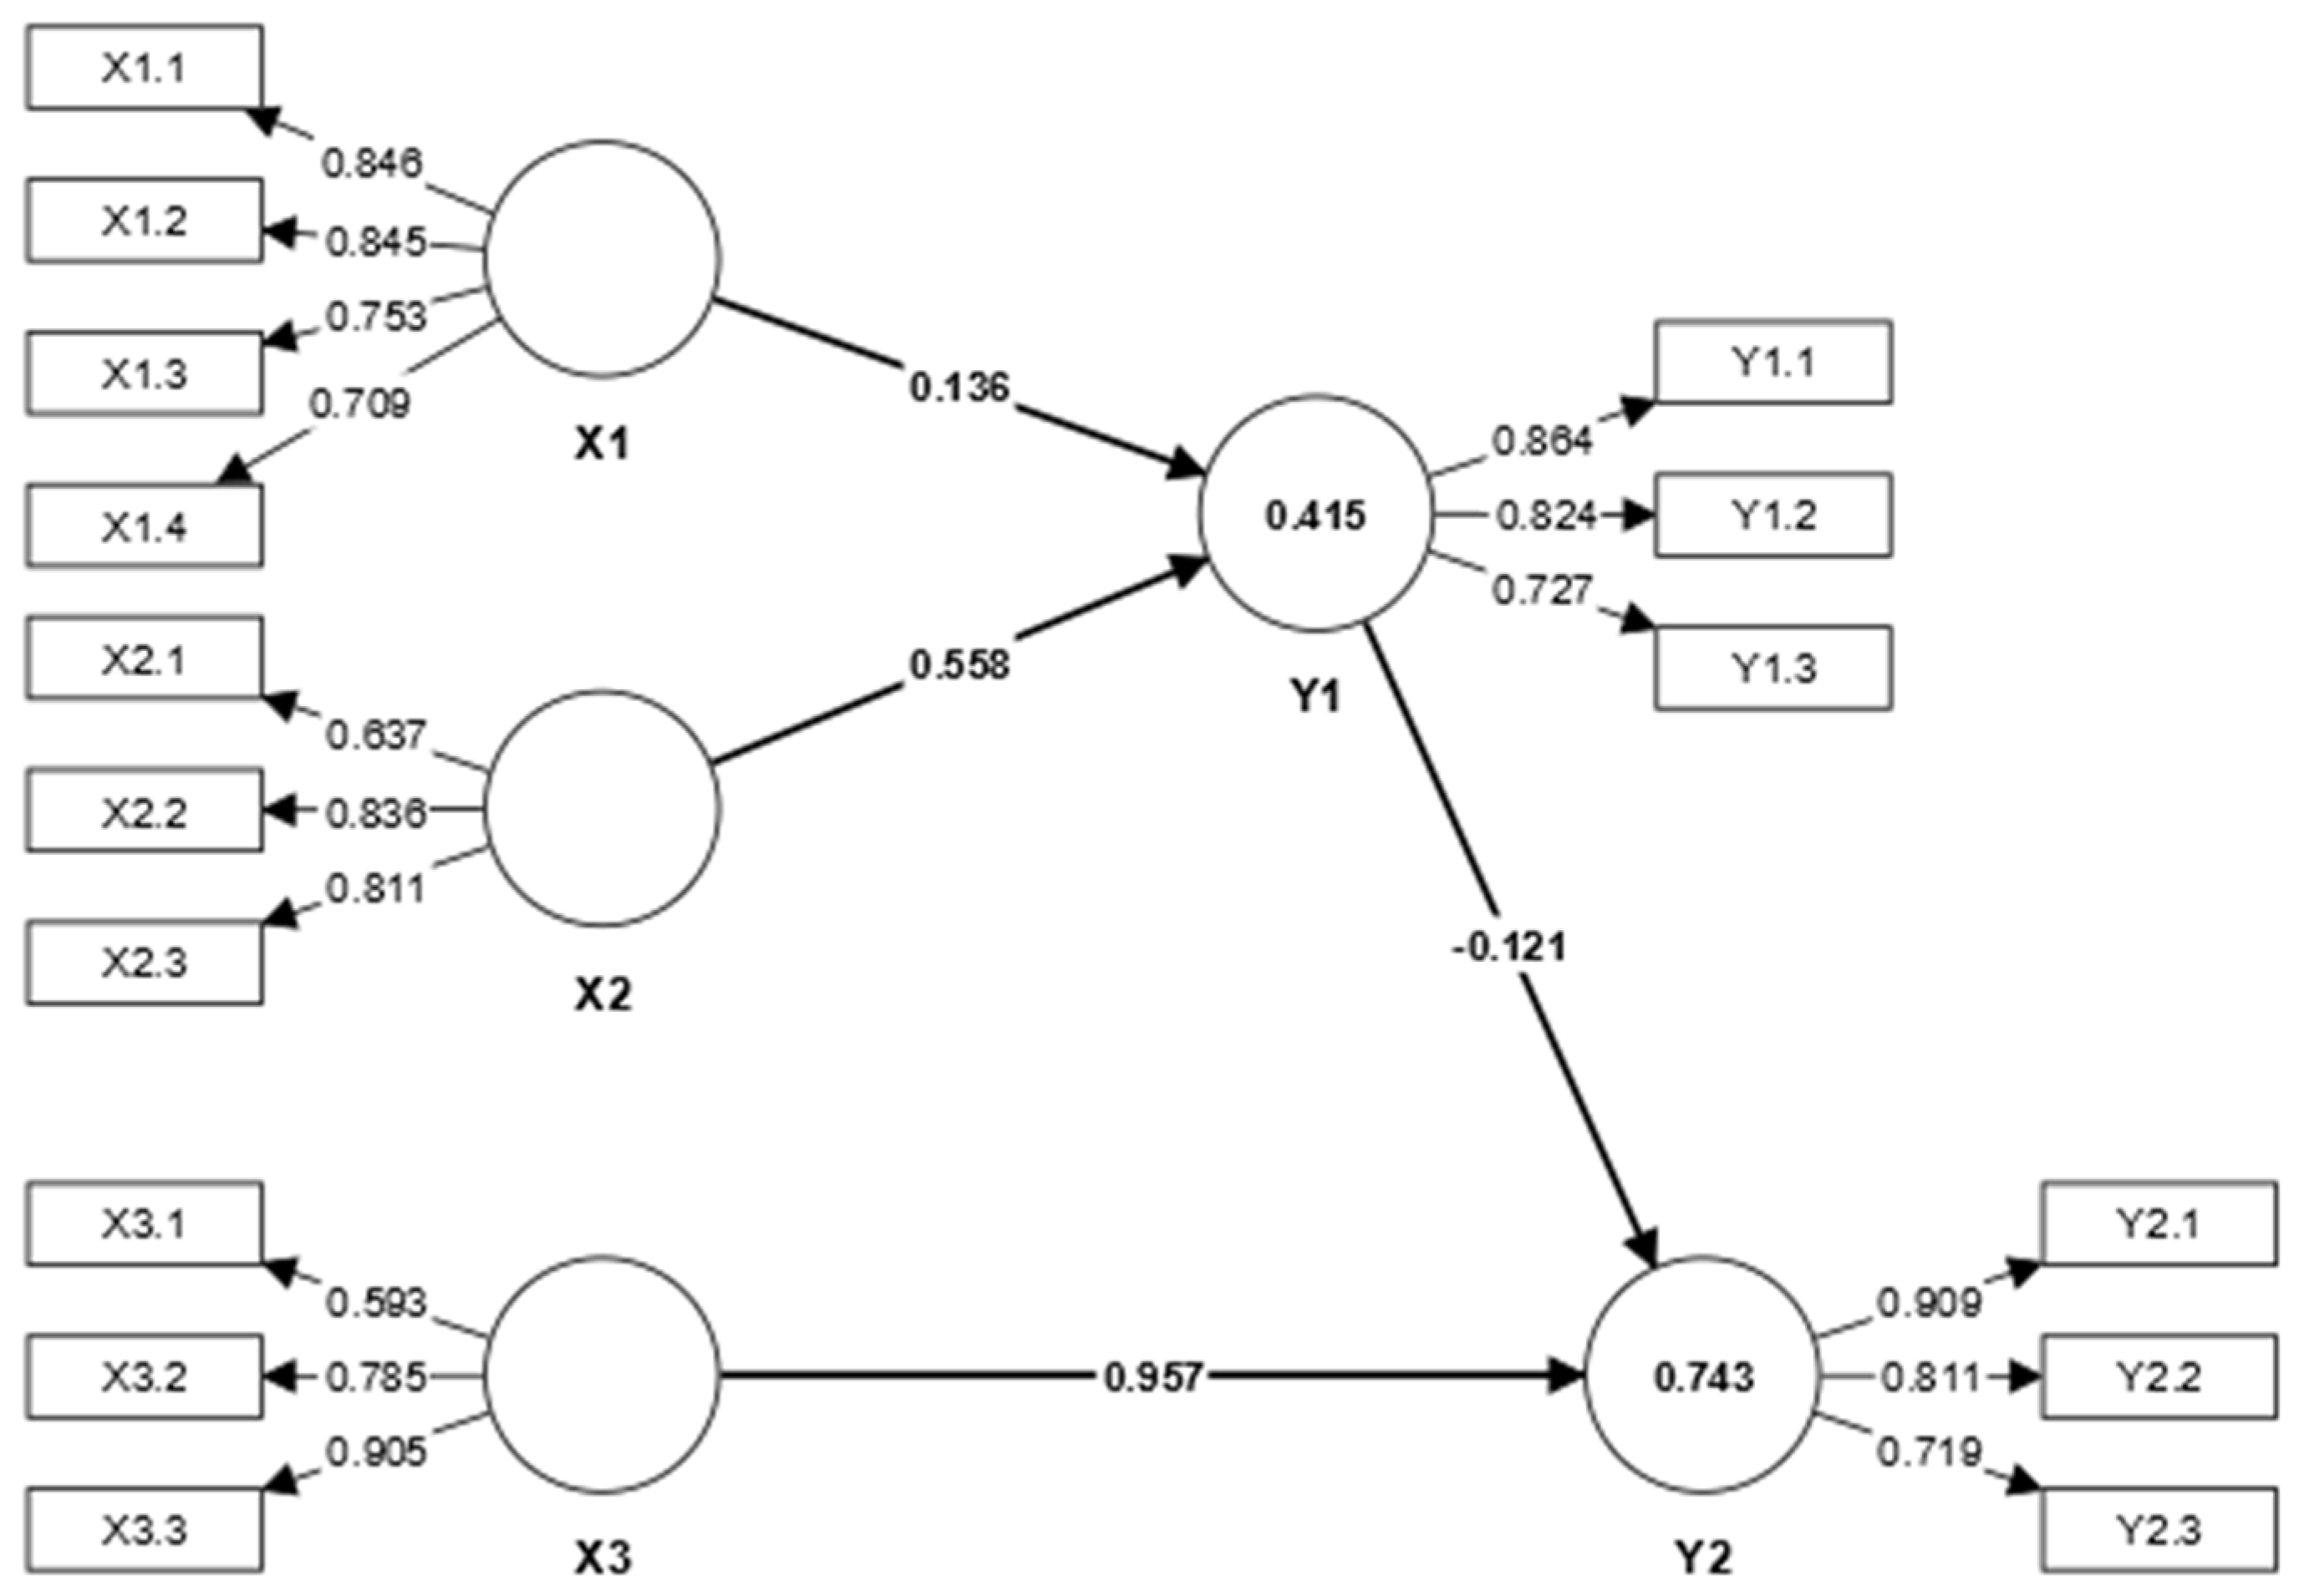
Figure 8.
UTAUT Model Analysis Results. Source: Author’s Data Elaboration (Processed, 2023)
Figure 8.
UTAUT Model Analysis Results. Source: Author’s Data Elaboration (Processed, 2023)
Table 1 shows the results of data validity and reliability tests, which show that all variables in this research have been declared valid. The Average Variance Extracted (AVE) value of all variables exceeds 0.5, indicating that the variables studied have valid constructs. Apart from that, the Composite Reliability test results also show values that exceed 0.7 for the four variables. Therefore, it can be concluded that all items in the variables studied can be considered reliable and can be used in further analysis.
Next, to evaluate how well the regression model can explain variable variations. So an R-Square test was carried out which can be seen in
Table 3. The results of the R-Square test on variable Y1 (Behavioral Intention) show that 0.415 of the variation in this variable can be explained by the independent variables used in the model. This shows that there is a significant relationship between the independent variables and Behavioral Intention. In addition, the Adjusted R-Square value of 0.403 indicates that around 40.3% of the variation in Y1 (Behavioral Intention) can be explained by the independent variables used, taking into account the complexity of the model and the number of variables used.
Meanwhile, for variable Y2 (Use Behavior), the R-Square test results show that 0.743 of the variation in this variable can be explained by the independent variables used in the model. This shows that the independent variable has a strong influence on Use Behavior. In addition, the Adjusted R-Square value of 0.738 indicates that around 73.8% of the variation in Y2 (Use Behavior) can be explained by the independent variables used, taking into account the complexity of the model and the number of variables used.
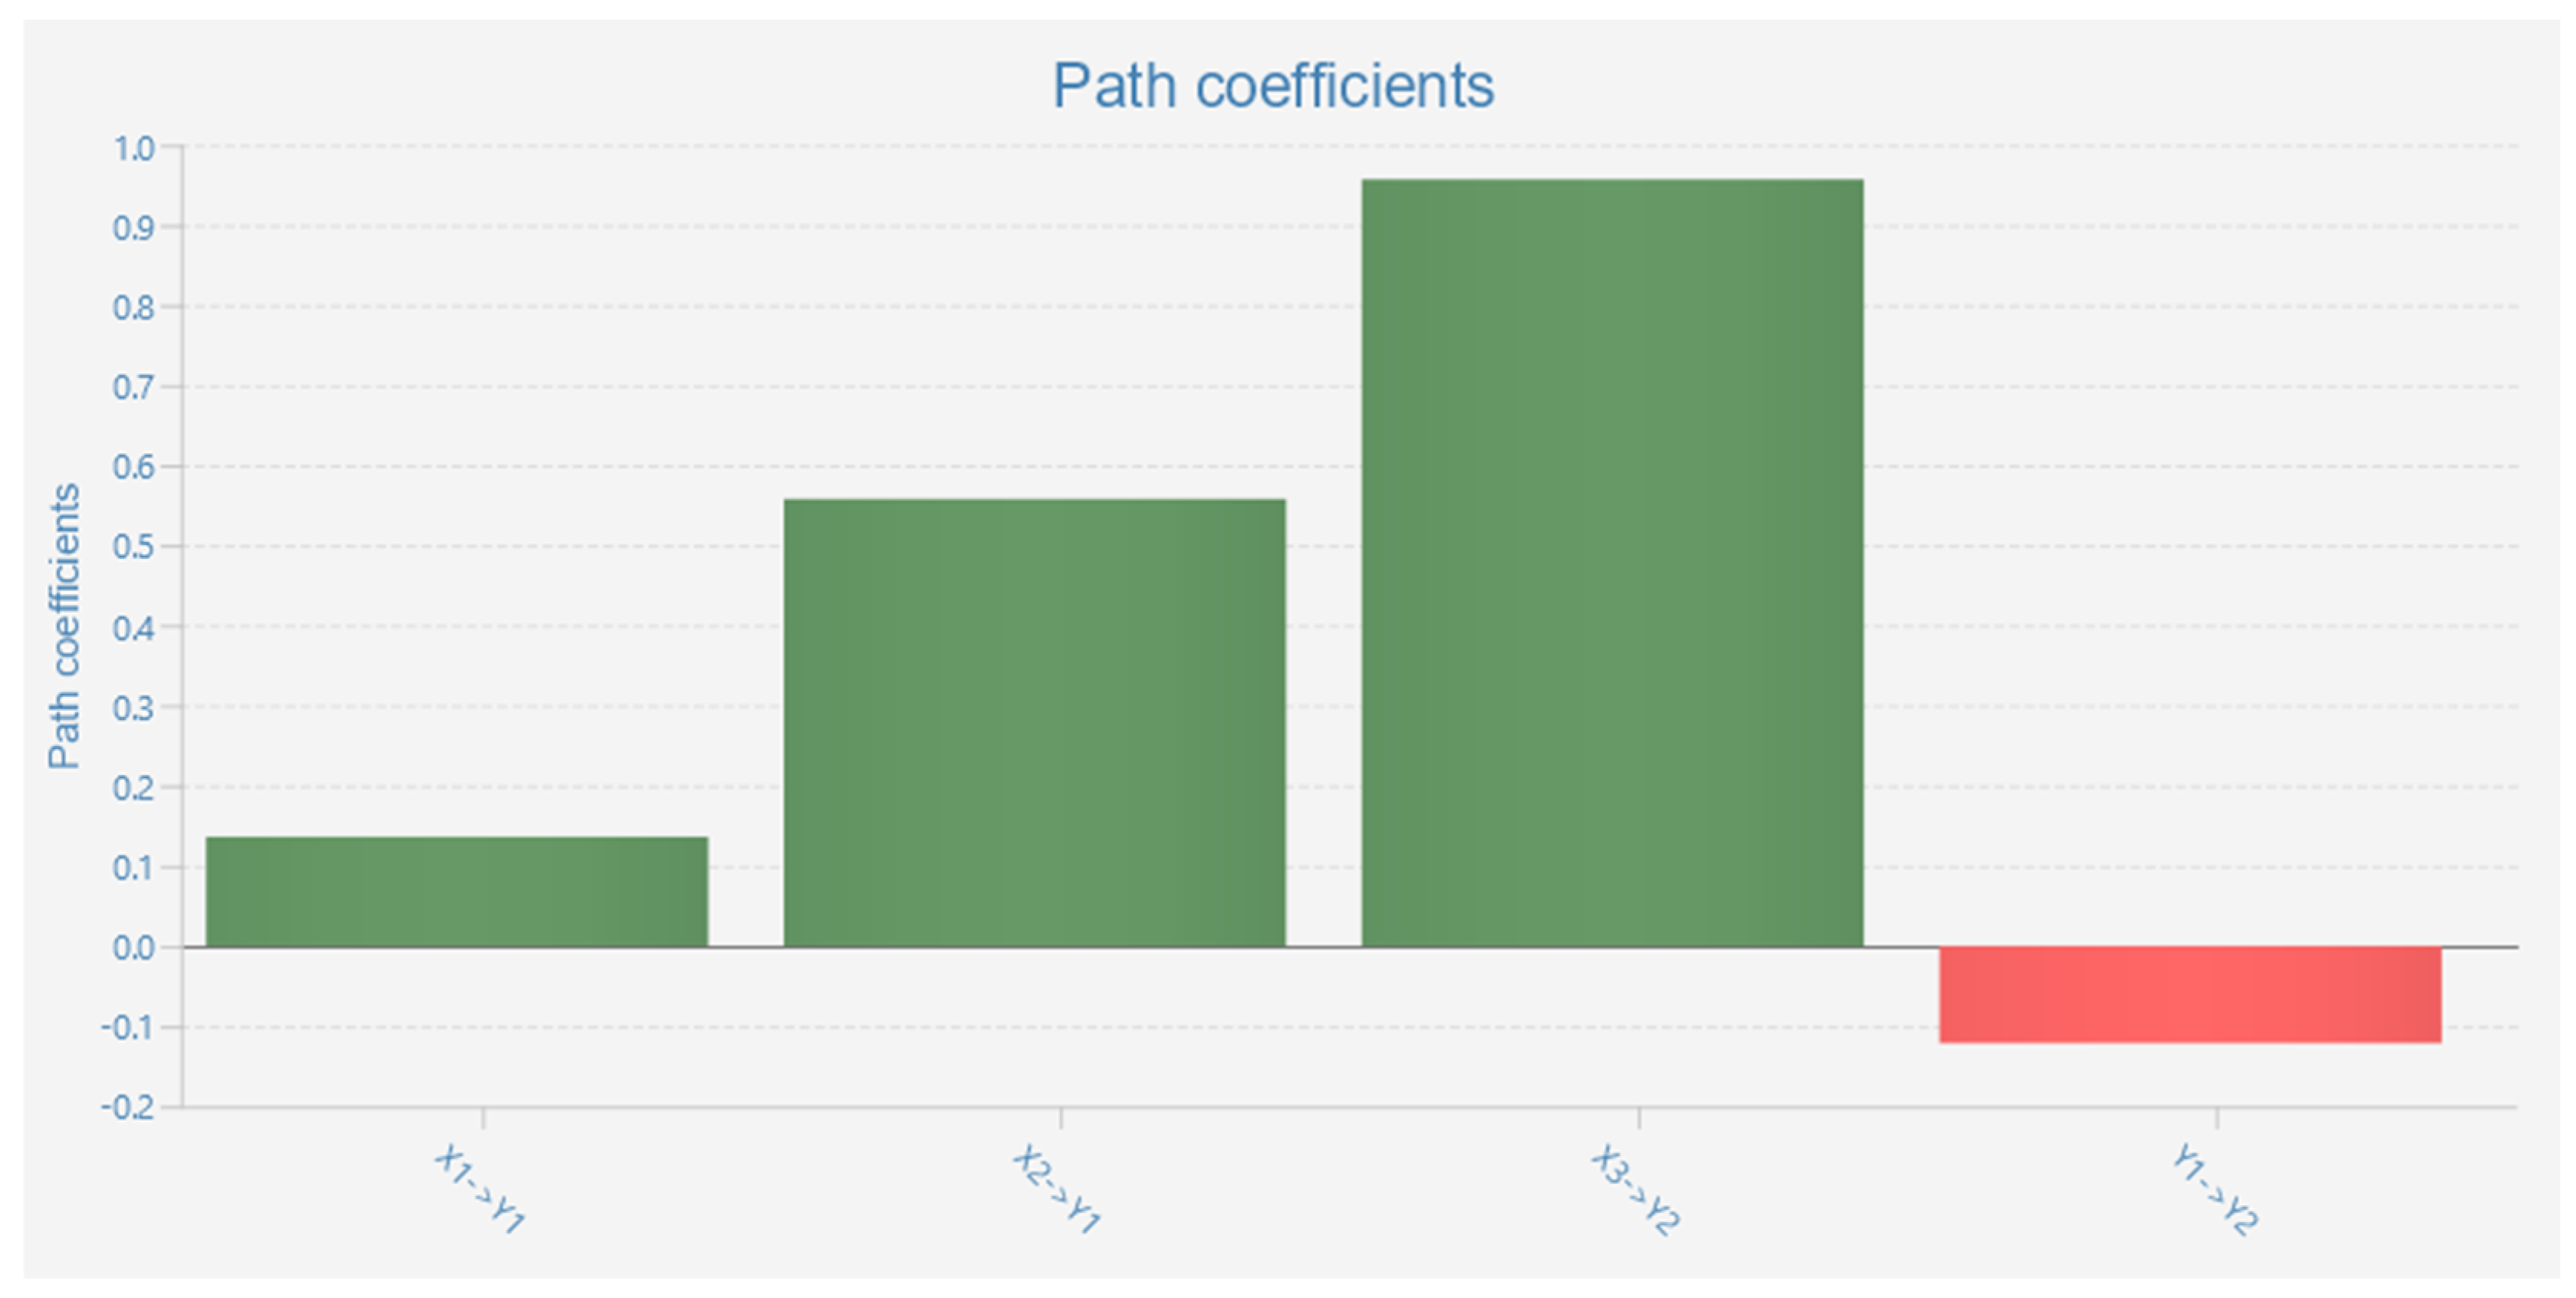
Overall, these results have a good model construct for research. Furthermore, the Path Coefficients analysis in
Figure 4 illustrates the results of the significance of the direct influence of variable X1 (Performance Expectancy) on Y1 (Behavioral Intention) with a value of 0.136, and variable Apart from that, the direct influence of variable X3 (Social Influence) on Y2 (Use Behavior) has a value of 0.957. However, there is an indirect effect of Y1 (Behavioral Intention) on Y2 (Use Behavior) which shows a result of -0.121 which can be interpreted as meaning that the influence between variables is less significant.
Figure 9.
Results ChartPath Coefficients. Source: Author’s Data Elaboration (Processed, 2023)
Figure 9.
Results ChartPath Coefficients. Source: Author’s Data Elaboration (Processed, 2023)
Overall, it can be concluded that UTAUT can be used as a design model for AR-based interactive marketing applications. Therefore, the PARTIKA application can be developed into an even better application. This innovation contributes to and applies AR applications in the field of interactive marketing for users and sellers of Indonesian fabrics.
Discussion
Innovation in this research named PARTIKA, a system designed to increase interactivity in selling Indonesian fabrics by utilizing Augmented Reality (AR) technology. PARTIKA combines AR technology with an application that allows customers to experience fabric products virtually via compatible devices such as smartphones or tablets. With their device’s camera, customers can identify Indonesian fabrics and instantly see a realistic virtual display on their screen. They have the ability to rotate, enlarge, or change fabric patterns, colors, or designs in real-time.
PARTIKA has four target users with different roles and usage scenarios. First, consumers of fabric products are PARTIKA’s main target. They need visualization of fabric products to make more informed and realistic shopping decisions.Then, distributors of fabric products can use PARTIKA as a tool to promote products and assist potential consumers in making purchasing decisions, with the aim of increasing purchase conversions.
Fabric product manufacturers are another target user who can use PARTIKA as a research tool for fabric product development. This helps them improve the quality and variety of products based on the development of fabric processing results.Finally, the government, through the ministry of cooperatives and SMEs as well as regional governments, can use PARTIKA as a marketing and development tool to support the progress of MSMEs which are the foundation of the country’s economy.However, it is important to pay attention to some limitations in using this AR application. This app requires adequate lighting and currently only supports Android devices, with additional restrictions related to the use of third-party platforms.In building PARTIKA, the Meta Spark AR Studio platform was used which allows creating AR effects on device cameras, and has been integrated with Meta products such as Instagram, making it easier to sell Indonesian fabric products via AR.
E. Conclusion
To optimize the application of Augmented Reality (AR) technology in traditional fabric purchasing and marketing applications, PARTIKA is here as a form of modernization of the current traditional fabric business. Through the PARTIKA application, users can experience convenience and improved experience in shopping for traditional fabrics using AR technology. The PARTIKA app interface is designed with the user in mind to make it more convenient and enrich the traditional fabric purchasing experience. The development of the PARTIKA application design uses a design thinking method that focuses on the user in order to provide an optimal experience in purchasing and marketing woven fabrics. This approach shows that the design of the PARTIKA application was carried out taking into account the needs and comfort of the user.
In line with User Experience (UX) principles, the design of the PARTIKA application not only prioritizes users, but also implements interactive interactions through optimizing AR technology to improve user experience. The PARTIKA application has been tested on users to ensure that the aim of optimizing AR technology in purchasing woven fabrics is achieved, so that it becomes a form of modernization that is relevant to current developments and contributes to sustainable economic recovery as well as introducing local traditional products into a context that remains relevant.
Acknowledgments
Thank you to Brawijaya University and Dian Nuswantoro University for helping carry out this research. Thank you also to STIKOM Bandung as the committee who has provided a forum for presenting the results of our research at this National Seminar activity.
References
- Afshar, J. (2023). Getting Started with Meta Spark Studio. In Hands-On Augmented Reality Development with Meta Spark Studio: A Beginner’s Guide (pp. 9–29). Apress. [CrossRef]
- Araújo, I., Grilo, A., & Silva, C. (2023). Portuguese Validation of the Unified Theory of Acceptance and Use of Technology Scale (UTAUT) to a COVID-19 Mobile Application: A Pilot Study. Healthcare, 11(13). [CrossRef]
- Babich, N. (2019, January 16). 6 Interesting Concepts for AR Experiences. Nick Babich. Retrieved Juni 12, 2023, from https://babich.biz/ar-experiences/.
- Banning, E. B. (2023). Sampling Methods and Theory. In Module in Social Sciences. Elsevier. [CrossRef]
- Cuiñas, I., & Fernández Iglesias, M. J. (Eds.). (2023). Design Thinking for Engineering: A Practical Guide. Institution of Engineering & Technology. [CrossRef]
- Gillis, A. S. (2016). What is Augmented Reality (AR)? TechTarget. Retrieved Juni 27, 2023, from https://www.techtarget.com/whatis/definition/augmented-reality-AR.
- INSTIKI. (2022, April 28). Canggihnya Teknologi VR & AR di Dunia Bisnis. INSTIKI. Retrieved Juni 4, 2023, from https://instiki.ac.id/2022/04/28/canggihnya-teknologi-vr-ar-di-dunia-bisnis/.
- Kompasiana. (2018, July 3). Augmented Reality Untuk Marketing, Media Pemasaran Kekinian Wajib Untuk Kesuksesan Bisnis Anda. Kompasiana.com. Retrieved Juni 6, 2023, from https://www.kompasiana.com/duduipok/5b3b1e87ab12ae2b5e00b882/augmented-reality-untuk-marketing-media-pemasaran-kekinian-wajib-untuk-kesuksesan-bisnis-anda.
- Kuswana, R. (2023, February 7). Yuk Kenali Design Thinking, Tips Untuk Memulai Bisnis. Alan Creative. Retrieved Juni 14, 2023, from https://alan.co.id/yuk-kenali-design-thinking-tips-untuk-memulai-bisnis/.
- Marikyan, D., & Papagiannidis, S. (2023). Unified Theory of Acceptance and Use of Technology: A review. Buku TheoryHub. http://open.ncl.ac.uk/ISBN: 9781739604400.
- Marketing In Asia (MIA). (2023, January 24). Dampak Personalisasi Terhadap Keterlibatan Dan Loyalitas Pelanggan. Marketing In Asia. Retrieved Juni 9, 2023, from https://marketinginasia.com/id/how-the-giants-do-it-the-impact-of-personalisation-on-customer-engagement-and-loyalty/.
- Mujumdar, O. (2022, Desember). Augmented Reality. International Journal For Research, 10(12), 487-495. [CrossRef]
- Ozturkcan, S. (2020, Agustus). Service innovation: Using augmented reality in the IKEA Place app. Journal of Information Technology Teaching Cases, 11(1). [CrossRef]
- Putri, C. (2022, October 25). Mengenal Spark AR untuk Membuat Filter Instagram Sendiri - Jasa Pembuatan Web & Aplikasi Android iOS. CAN Creative. Retrieved Juni 9, 2023, from https://can.co.id/mengenal-spark-ar-untuk-membuat-filter-instagram-sendiri/.
- Sinha, M., & Srivastava, M. (2023). Augmented Reality: New Future of Social Media Influencer Marketing. Vision: The Journal of Business Perspective, 0(0). [CrossRef]
- Suryawijaya, T. W. E., Susilo, Z. C., & Wardhani, M. F. (2023). Augmented Marketing Communications: Ar-Based Marketing In The Banking World. International Journal Of Accounting, Management, And Economics Research, 1(1), 04-14. https://ijamer.feb.dinus.ac.id/index.php/ijamer/article/view/2.
- Suryawijaya, T. W. E., & Wardhani, M. F. (2023). Tailoring the future of MSME marketing: A study on leveraging customer data for personalized experiences. Jurnal Implementasi Manajemen dan Kewirausahaan, 3(1). http://jurnal.uwp.ac.id/feb/index.php/manajemen/article/view/163.
- Wang, W.-P., Chen, H.-W., Yang, D.-N., & Chen, M.-S. (2023). Post-it: Augmented Reality Based Group Recommendation with Item Replacement. In H. Kashima, W.-C. Peng, & T. Ide (Eds.), Advances in Knowledge Discovery and Data Mining: 27th Pacific-Asia Conference on Knowledge Discovery and Data Mining, PAKDD 2023, Osaka, Japan, May 25–28, 2023, Proceedings, Part IV. Springer Nature Switzerland. [CrossRef]
Table 1.
Indicator Distribution.
Table 1.
Indicator Distribution.
| Variable |
Indicator |
AVE |
CR |
| X1 (Performance Expectancy) |
X1.1. Perception of benefits |
0.626 |
0.869 |
| X1.2. Perceived quality of visualizations presented through AR. |
| X1.3. User perception of increased efficiency and productivity. |
| X1.4. Perception of information. |
| X2(Effort Expectancy) |
X2.1. Perception of convenience |
0.587 |
0.808 |
| X2.2. Navigation |
| X2.3. Intuitivitas |
| X3 (Social Influence) |
X3.1. Intent of Use |
0.596 |
0.811 |
| X3.2. Recommendation |
| X3.3. Adaptability |
| Y1 (Behavioral Intention) |
Y1.1. Intensity of using AR for personal needs |
0.652 |
0.848 |
| Y1.2. Intensity of use with other people |
| Y1.3. Intensity in daily life |
| Y1.4. User intent for interactivity using AR |
| Y2(Use Behavior) |
Y2.1. The level of use of AR in the product purchasing process. |
0.667 |
0.856 |
| Y2.2. The level of user participation in interactions with virtual objects via AR. |
| Y2.3. Level of user involvement in using AR as a marketing medium. |
| Y2.4. The level of user adaptation to AR in daily shopping activities. |
Table 3.
Test resultsR-Square.
Table 3.
Test resultsR-Square.
| Variable |
R-Square |
R-Square Adjusted |
| Y1 (Behavioral Intention) |
0.415 |
0.403 |
| Y2(Use Behavior) |
0.743 |
0.738 |
|
Disclaimer/Publisher’s Note: The statements, opinions and data contained in all publications are solely those of the individual author(s) and contributor(s) and not of MDPI and/or the editor(s). MDPI and/or the editor(s) disclaim responsibility for any injury to people or property resulting from any ideas, methods, instructions or products referred to in the content. |
© 2023 by the authors. Licensee MDPI, Basel, Switzerland. This article is an open access article distributed under the terms and conditions of the Creative Commons Attribution (CC BY) license (http://creativecommons.org/licenses/by/4.0/).
