Submitted:
31 October 2023
Posted:
01 November 2023
You are already at the latest version
Abstract
CONTEXT: The sustained White corn (Zea mays L.) yield relies on supply of Nitrogen (N), which is an important element in improving soil fertility.
OBJECTIVE: The research aim to determine the effect of Nitrogen on white corn yield and grain mass.
METHOD: The experimental design was a 4 × 4 factorial arranged in randomized complete block design with 2 replications each. The effect of nitrogen was determined in terms of the flow within the soil, initial component, addition, uptake, loss and use of nitrogen by the White corn plants. Nitrogen was applied as Granular Urea using zero broadcast method. The grain yield was determined hand-harvesting and shelling.
RESULTS AND CONCLUSIONS: There were no statistically significant differences between the mean samples from the two replicates (blocks 1 & 2) across the two seasons for corn sugar concentration, corn yield estimates and grain yields. In 2021, the mean yield estimate was 12,552 Kg ha-1, while that of 2022 averaged 12687 Kg ha-1. Similarly, the grain yield achieved in 2022 was 844.1kg more than the average grain yield in 2021. The white corn yield estimate and grain yield increased linearly with an increase in nitrogen application level, with the highest yields achieved when nitrogen fertilizer was applied at 150kg N/ha. This demonstrates that nitrogen has a positive influence on the yield quantity of white corn.
SIGNIFICANCE: The White maize model may be used to improve the formulation of decisions and enhance the precision of estimates for yield and N fate within the soil-plant-atmosphere continuum. Further, the findings of this study can significantly enhance agricultural productivity while keeping an eye on the environment.
Keywords:
Grain yield
; White corn
; Nitrogen
HIGHLIGHTS
- Using conventional techniques, similar white maize seeds (Pioneer Hybrid: P1120WYHR) were planted with a planting depth of 1.5 cm and a row spacing of 30-inches (2.5 feet). Using a broadcast method, four rates of nitrogen application (0, 50, 100, and 150 kg N ha-1) were applied to each plot in the form of Granular Urea (46-0-0). The white maize seedlings were planted and were reliant only on precipitation. The plots were kept free of weeds through regular weeding.
- The plant population was estimated at 35,000 plants/acre, determined by counting the plants in a row multiplied by four. The Yield estimates were determined by the Yield Component Method.
- The yield estimates and grain yields were slightly higher in 2022 than in 2021 (Figure 4.1 & 4.2). In 2021, the mean yield estimate was 12,552 Kg ha-1, while that of 2022 averaged 12687 Kg ha-1. Similarly, the grain yield achieved in 2022 was 844.1kg more than the average grain yield in 2021.
- Yield characteristics showed a positive response to nitrogen application in both seasons, whereby, there was a linear increase in yield with an increase in nitrogen
INTRODUCTION
White corn, commonly referred to as maize (Zea mays L.) is a grain crop that produces kernels in a cob and is grown in many different parts of the world (Reddy, et al., 2012). Corn grows in grass- like stalks, and each ear of corn contains kernels encased in a husk. It is believed that corn originated from Mexico, 7000 years ago (Pruitt, 2016). There are various varieties of white corn grown in the United States. Depending on the maturity stage at harvest, the most common are field corn variety and immature sugary white corn variety. Field corn is usually harvested at late maturity stage and is commonly used as a grain product for livestock fodder and human processed foods like cereals, oil, and starch. On the other hand, Sugary corn is however, harvested during the immature ‘milking’ stage and is commonly treated as a vegetable.
The global maize yields nearly tripled for the last five decades, up from 2 tons/ha (TE1963) in 1961 to the current 5.8 tons/ha (TE2019, + 190%) (Erenstein, et al., 2022). Given these substantive increases, maize production rose five-fold since 1961. However, just like any other crops - wheat and rice – there are indications that corn production reaches a plateau with any additional increase in yield attracting very high costs. Ray et al., (2012) documented a study highlighting that 24-39% of maize, rice, wheat, and soybean producing areas throughout the world, had recorded zero improvements in yields for these crops. Moreover, there are studies showing that immature white corn fetches higher prices in the markets and industries as compared to field maize, but the major setback has been the relatively lower yields (Sinclair et al., 2020). Currently, corn farming is a dominant aspect in modern crop production in USA (Fausti, 2015). Moreover, according to NASS (2014), between 2009 – 2014, 30% of total field crop acreage had been devoted to corn farming. Annually, this equated to at least 4.6% of the total cultivatable land in USA, and 35% of total crop profits harnessed between 2010 – 2012 in USA.
The United States is the world's largest producer of maize and dominates world maize trade. Maize exports to US accounts for only 15%, hence, they’re majorly dependent on own production (Ranum et al., 2014). According to the Food and Agriculture Organization (FAO) of the United Nations indices of agricultural production, it is estimated that in 2012, the total world production of maize was 875,226,630 tons, with the United States, China, and Brazil harvesting 31%, 24%, and 8% of the total production of maize, respectively. Overly, the 3 countries combined produce approximately 563 of the 717 million metric tons/year (Ranum et al., 2014). The trends in maize yield in US has been steadily increasing since its cultivation in the early periods. Moreover, the corn harvest has steadily trended upward over the past 50 years, increasing at approximately 2% per year. According to Erenstein et al., (2021), since 1961, the global maize area under maize production nearly doubled, up from 106 M ha to the current 197 M ha (+ 87%), with an acceleration of area expansion since the early 2000s. Moreover, the global maize yields nearly tripled since 1961, up from 2 tons/ha to the current 5.8 tons/ha (Erenstein et al., 2022). Similarly, Wallington et al., (2012) documented the increasingly steady production of corn in US with 15% yields increased between 2000 – 2010 (from approximately 8.5 to 10 tons hectare).
According to Erenstein et al., (2022) the observed surges in corn production over the decades is associated with the ever-increasing demand, and combination of technological advances such as gene alteration to increase kernel sweetness and other sensory qualities, and Genetically Modified (GM) herbicide-resistant maize such as Bt corn - a variant of maize that has been genetically altered to express one or more proteins from the bacteria, Bacillus thuringeiensis (Szymanek et al., 2015). Other reasons cited include regional land use changes (Johnstone, 2014), fundamental changes to US agricultural policies that removed both the linkage between prices of agricultural products and income support payments, and acreage restrictions from cropping decisions (Claassen et al., 2011), and the sudden demand of corn for industrial use and applications such as U.S. corn-based ethanol production (Wallander et al., 2011).
Soil fertility plays an important role in determining crop yield in agricultural ecosystem (Pellegrino et.al, 2011). There is a huge body of literature on soil fertility with some studies focusing on soil fertility in intercropping relative to monocultures and rotation at a longer time scale (Wang et al., 2015). Ohyama (2010) documented that white corn, just like any other growing plants, require 17 essential elements to grow to their full genetic potential. Of these 17, 14 are absorbed by plants through the soil, while the remaining three come from air and water. One of the fundamentally key essential elements in corn growth is Nitrogen. Nitrogen plays a key role in regulating the efficiency of other nutrients utilization in plants by affecting both physiological and biochemical process in plants (Brady, 1990). In white corn, the use of nitrogen fertilizers results in higher biomass and protein yield by influencing the amino acid concentration in corn kernels (Shrestha et al., 2018). Moreover, Muchow (1998) reported that Nitrogen (N) fertilizer affects corn dry matter production by influencing leaf area development, leaf area maintenance, photosynthetic capacity, and consequently yield and grain quality. According to Shrestha et al., (2018), the rate of Nitrogen fertilizer needed to be applied to a growing maize crop is determined by the soil nitrogen content, source of N, soil reaction, and environmental factors such as rainfall, maize maturity period and desired total yield. For example, higher the soil nitrogen, results in increased absorption of nitrogen in corn plants (Martins et al., 2008), and since 1935, the primary source of dry nitrogen fertilizer in USA is urea, as it relatively affordable, easy to handle and has a high N content (Tisdale et al., 2014).
There are various methods widely utilized in N fertilizer application such as the traditional broadcast fertilization, fertilization in rows, and top dressing among others. This coupled with the timing of application – early plant growth, late plant growth, tasseling, silking among others – influences corn vegetative growth and development and consequently yields (Szulc et al., 2016). For example, Shrestha et al., (2018) during a study review on nitrogen fertilizer application in Southern Asia recommended that nitrogen (maximum dose of 200kg N/ha) should be applied at a basal dosage during planting stage, and split doses at critical growth stages such as knee high and flowering stages for enhanced yields. Other studies have documented varying observations such as applying nitrogen (0 – 150 kg N/ha) significantly increases corn dry matter at any stage of growth (Terman & Allen, 1974); applying nitrogen at 3 equal divided doses (maximum 60 kg N/ha) at sowing, earthing up and silking stages maximizes the corn grain yield (Bhattarai et al., 2004); and applying nitrogen at 80kg N/ha in two split doses-half applied at sowing as basal and the other half applied through side dressing at knee-high stage- resulted in maximum corn grain and better biomass yield at a higher benefit cost ratio (Nurudeen et al., 2015). Although adequate supply of nitrogen to crops is fundamental to optimize crop yields excess mismanagement of nitrogen such as excess nitrogen application can result in environmental contamination (Karlen et al., 2001). Hence, as recommended by Ma et al., (2012), there is need to adopt improved N management practices in corn production to not only increase both grain yield and N use efficiency, but also, minimize N loading in the environment.
The high moisture, high sugar white corn has numerous benefits. Other than being utilized as a fresh or canned vegetable (Bender et al., 2013) – due to its rich source of antioxidants, vitamins, and minerals, it is also commonly used in production of processed foods and non-food products. For example, white corn beverages are gaining popularity as an alternative recovery drink for active people due to their high content of carbohydrate and protein levels (Jusoh et al., 2019); a modern bakery trend is the use of white corn residues to replace wheat flour in cakes due to its high nutrient content (dietary fiber, folate & Vitamin E) and increased digestive characteristics (Lao et al., 2019); there is an increasing trend in the use of corn sweeteners and high fructose corn syrup in the global sugar industries (Singh et al., 2014); bioenergy production using the white corn stalks and other residues (Pan-in and Sukasem, 2017); and use of white corn stalks as highly nutritious animal feeds/forage (Zhou et al., 2019) as an optimal management of agricultural waste practice. Notably, white corn is a food product consumed in diverse forms ranging from specialized foods in developed countries to staple cereal foods in developing countries (Malvar et al., 2008).
Despite the increasing yields in corn production, there are certain factors that hinder optimal yield results hence the notable gap between the total production and the global demands. These factors can be largely categorized as growth-reducing and growth limiting factors. The growth-reducing factors include pests, weeds and diseases that negatively impact corn yield. According to Munkvold & White (2016), the previous estimates of annual yield loss caused by corn diseases in the United States ranged from 2 to 15%. Sometimes the yield losses to corn diseases may also go unnoticed or misdiagnosed. For example, yield reduction from stalk rots can take place through reduced ear size, poor grain fill, and early eardrop (Jardine, 2006), whereas plant-parasitic nematodes can cause above ground symptoms that may be mistakenly attributed to environmental conditions (Norton & Nyvall, 2011). The growth-limiting factors include water and nutrients availability – soil fertility. To help fill this gap in knowledge, this study sought to investigate the effect of Nitrogen on white corn yield estimate and grain yield. For the purposes of achieving this, the study addressed these two objectives: (1) to establish yield estimate and grain yield of white corn harvested in selected plots, (2) investigate the response of white corn to Nitrogen fertilization applied at different rates in selected plots.
The results of this study can play an integral role in improving crop production while being conscious of the environment. Due to the rising population, there is an increased demand of crop production. Increased agricultural production requires either increasing productivity on currently used land or converting additional land to agricultural. Therefore, building a body of evidence on appropriate ways to improve the quality of white corn would be beneficial in terms of economic returns to the farmers and policy makers, hence, improving the overall economic development.
2. METHODOLOGY
The experimental design was a 4 × 4 factorial arranged in randomized complete block design (RCBD) with 2 replications; blocks 1&2 (as shown in Figure 3.1 below) were used for replication. The two blocks were marked with pvc flags to distinguish the various plots on urea treatment. This also enabled the researcher to mark the various paths within the field during mowing. Nitrogen was applied as Granular Urea (46-0-0) at four rates (0, 50, 100, 150 kg N ha-1) using broadcast method on each plot (See Figure 3.1).
The study was conducted at the Illinois State University research farm in Lexington, IL 61753 (40.66844 N, 88.77591 W and 40.6710 N, 88.77178 W) in 2021 and 2022 respectively. General characteristics of the location included an average annual precipitation of 38.0 inches, with a rainy season from on March – July, hence sufficient to increase the soil moisture content and adequately support the growth of white corn seedlings without the need for additional measures such as irrigation. The predominant soil type was drummer silty clay loam (Fine-silty, mixed, superactive, mesic Typic Endoaquolls). Moreover, the land selected for this study had no prior manure history and in the previous years (2020 & 2021) was under soybean production. No soil testing was done prior to sowing to establish and document soil properties.
The study was done over two years (2021 – 2022) with two cyclic planting and harvesting seasons (the planting & harvesting dates are summarized in Table 3.1 below). Uniform white corn seeds (Pioneer Hybrid: P1120WYHR) were planted using traditional methods (fields were managed in no till – no till planter was mounted on a tractor), with a row spacing of 30-inches (2.5fts) and a planting depth of 1.5 cm. Nitrogen was applied as Granular Urea (46-0-0) at four rates (0, 50, 100, 150 kg N ha-1) using a broadcast method on each plot. White corn seedlings were established, dependent solely on rainfall. The plots were kept weed free through regular weeding where overgrown weeds were pulled out and left on the plots as mulch.

Table 3.1.
Cultural practices dates for the 2 years at Illinois State University research farms in Lexington (IL 61753).
Table 3.1.
Cultural practices dates for the 2 years at Illinois State University research farms in Lexington (IL 61753).
| Cultural Practice | 2021 | 2022 |
|---|---|---|
| Site Coordinates | 40.66844 N, 88.77591 W | 40.6710 N, 88.77178 W |
| Planting dates | 2nd June 2021 | 16th May 2022 |
| Fertilizer Application dates | 13th June 2021 | 31st May 2022 |
| Mowing & regular weeding | 2nd July 2021 2nd August 2021 2nd September 2021 |
15th June 2022 15th July 2022 15th August 2022 |
| Corn sugar sampling | 9th – 15th September 2021 | 10th – 15th July 2021 |
| Harvesting dates | 15th October 2021 | 30th September 2022 |
2.1. White Corn Yield Estimate
The plant population was estimated at 35,000 plants/acre, determined by counting the plants in a row multiplied by four. The Yield estimates were determined by the Yield Component Method – developed by the Agricultural Engineering Department at the University of Illinois. The principal advantage to this method is that it can be used as early as the milk stage of kernel development. The yield component method involves use of a numerical constant for kernel weight that is figured into an equation to calculate grain yield. This numerical constant is sometimes referred to as a “fudge-factor” since it is based on a predetermined average kernel weight. To estimate grain yield, the Yield Component Method was used as follows:
The number of harvestable ears in a length of row equivalent to 1/1000th acre was determined.
On every fifth ear, the total number of kernel rows per ear and the average was determined. The sequence followed was that on every 5th, 9th, and 13th ears from one end of the row were picked.
On each of these ears the total number of kernels per row and the average was determined.
Yield (bushels per acre) is calculated by multiplying (ear number) by (average row number) and (average kernel number) and divide the results by 89.605*
The procedure was repeated for each plot.
2.2. White Corn Grain Yield
At corn physiological maturity, 1/1000th acre per plot was hand-harvested and shelled. The percentage of dry matter was then determined as: = (1 – grain moisture %). To determine the pounds of dry matter per acre, we multiplied the grain weight x percent dry matter x 1000. Dry matter per acre was converted to 15.5% moisture (1 - 0.155 = 0.845) and a test weight of 56 pounds per bushel. The calculations were:
Pounds of dry matter per acre ÷ 0.845 = Pounds of grain at 15.5% moisture
Pounds of grain at 15.5% moisture ÷ 56 = Bushels of corn per acre at 15.5% moisture
The Bu/A were then converted to KgHa-1.
2.3. Statistical Analysis
The independent variable was the Nitrogen treatment at different rates of application (0, 50, 100, & 150), whereas the study location and blocks were random factors. Dependent variables evaluated included yield estimates of white corn, and white corn grain yield. Both descriptive and inferential statistical analysis were performed. Descriptive analysis output was expressed as mean and standard deviation for the dependent variables across the 2 years (2021 & 2022). Inferential analyses entailed both independent sample t-tests and Analysis of Variance (One-way ANOVA) for mean comparisons. All statistical tests (T-test & ANOVA) were conducted at 95% C.I with the P-value for statistical significance set at α ≤ 0.05. Additionally, the t-value/t-statistic (for the student T-test) and the F-ratio & F-crit (for the ANOVA test) were evaluated rigorously to see whether the differences were statistically significant, thereby providing enough information to support the null hypotheses (whether to reject the null hypotheses or accept).
3. RESULTS AND DISCUSSION
There was similarity on the trends of average monthly temperatures throughout the May-November season for 2021 and 2022 (Tables 2 and 3). As the season progressed, the average high and low temperatures rose during June, July, and August before beginning to decline in August. Notably, the year 2021 was relatively cold compared to 2022. The peak high average in 2022 was 3.69°F higher than that of 2021, while the peak low average was 2.59°F higher. Similarly, the rainfall patterns for both years showed similar trends, with the highest rainfall being recorded in June followed by October and August (Tables 2 and 3).
Similarly, the precipitation in 2022 was reduced compared with that of 2021. Rainfall in 2021 was greater than that of 2022 by 47.75mm. The lowest rainfall recorded reduced by 1.5 mm from that recorded in 2021. This is in line with Wuebbles et al. (2021), who reported that climate change has caused 1-2°F increases in average daily temperatures in Illinois in the past century and is projected to cause further temperature increases statewide. Additionally, extreme precipitation events observed during the study are also evidence of the changing weather conditions due to global warming.
Table 3.2.
Environmental Conditions in 2021.
| Month | Temperature (°F) 2021 | Rainfall 2021 | ||
|---|---|---|---|---|
| High Average | Low Average | Ppt (inches) | Ppt (mm) | |
| May | 76.25 | 43.13 | 1.41 | 35.81 |
| June | 82.00 | 64.13 | 4.32 | 109.73 |
| July | 80.38 | 64.17 | 1.41 | 35.81 |
| August | 83.11 | 66.63 | 1.89 | 48.01 |
| September | 76.58 | 57.27 | 0.84 | 21.34 |
| October | 74.42 | 45.71 | 2.58 | 65.53 |
| November | 53.63 | 24.67 | 0.3 | 7.62 |
Table 3.3.
Environmental Conditions in 2022.
| Month | Temperature (°F) 2022 | Rainfall 2022 | ||
|---|---|---|---|---|
| High Average | Low Average | Ppt (inches) | Ppt (mm) | |
| May | 81.19 | 48.87 | 0.87 | 22.10 |
| June | 86.08 | 63.33 | 2.44 | 61.98 |
| July | 85.79 | 69.22 | 0.71 | 18.03 |
| August | 80.00 | 65.56 | 0.77 | 19.56 |
| September | 78.29 | 50.12 | 0.24 | 6.10 |
| October | 61.80 | 39.00 | 0.72 | 18.29 |
3.1. Corn Yield Estimate and Grain Yields
There were no statistically significant differences between the mean samples from the two replicates (blocks 1 & 2) across the two seasons for corn yield estimates and grain yields. The yield estimates and grain yields were slightly higher in 2022 than in 2021 (Figure 4.1 and 4.2). In 2021, the mean yield estimate was 12,552 Kg ha-1, while that of 2022 averaged 12687 Kg ha-1 (Annex Table 2a). Similarly, the grain yield achieved in 2022 was 844.1kg more than the average grain yield in 2021 (Annex Table 2a)
The slight differences in mean yield estimate and grain yield between 2021 and 2022 were corroborated by other studies. For instance, Gheith et al. (2022) found that corn yield increased by 100 Kg ha-1 in the second year of the nitrogen treatment. An earlier study (Ray et al., 2019) also recorded a 7% increase in yield in the second year of their nitrogen study. These slight improvements in yield can be attributed to varied nitrogen fertilization in the crops farmed in the previous years. Fertilizers applied in the plots in 2021 during soybean cultivation could have contained some residual nutrients that may have benefitted the crops in the following planting season.
3.2 Corn Yield Characteristics under Different Nitrogen Application Levels
Yield characteristics showed a positive response to nitrogen application in both seasons, whereby, there was a linear increase in yield with an increase in nitrogen (Table 4.1). The highest yields were achieved when nitrogen fertilizer was applied at 150kg ha-1, while the least was recorded without any nitrogen fertilization. In 2021, the application of nitrogen at 50kg ha-1 increased the yield estimate by 5%, 100kg ha-1 by 16%, and 150kg ha-1 by 23% compared with the yield from unfertilized corn plants. The grain yield was 8% higher in crops planted with 50kg Nha-1, 20% higher at 100kg Nha-1, and 26% higher at 150kg Nha-1 than the yield at 0kg Nha-1 in 2021. Surprisingly, the same margins of differences in grain yield between the 0kg Nha-1 treatment and 100kg Nha-1 (20%) and 150kg Nha-1 (26%) treatment groups were observed both in 2021 and 2022. Conversely, the yield estimates showed higher margins between the 0kg Nha-1 treatment and other nitrogen treatments in 2022 than in 2021. In 2022, the yield under 150kg Nha- 1 was 30% higher than the unfertilized group, while 100kg Nha-1 and 50kg Nha-1 were 21% and 11% higher, respectively.
Table 4.1.
Yield Characteristics at Different Nitrogen Application Levels.
| Variables | N treatment | Block 1 | Block 2 | Blocks 1 & 2 | |||||
|---|---|---|---|---|---|---|---|---|---|
| N | Mean | Std. Dev | Mean | Std. Dev | N | Mean | Std. Dev | ||
| 2021 | |||||||||
| Yield estimate (Kg ha-1) | 0 kg Nha-1 | 4 | 11240.94 | 537.99 | 11298.95 | 175.92 | 8 | 11269.95 | 371.84 |
| 50 kg Nha-1 | 4 | 12125.68 | 352.07 | 11755.52 | 552.48 | 8 | 11940.60 | 472.32 | |
| 100 kg Nha-1 | 4 | 13042.63 | 349.95 | 13104.82 | 307.95 | 8 | 13073.73 | 306.97 | |
| 150 kg Nha-1 | 4 | 13798.99 | 194.55 | 14048.44 | 598.99 | 8 | 13923.71 | 433.32 | |
| Grain yield (Kg ha-1) | 0 kg Nha-1 | 4 | 11954.99 | 1298.77 | 11746.42 | 1499.23 | 8 | 11850.70 | 1303.32 |
| 50 kg Nha-1 | 4 | 13275.13 | 495.26 | 13017.86 | 240.61 | 8 | 13146.49 | 385.80 | |
| 100 kg Nha-1 | 4 | 14387.00 | 209.70 | 14354.28 | 689.77 | 8 | 14370.64 | 472.29 | |
| 150 kg Nha-1 | 4 | 15382.80 | 1337.83 | 15512.51 | 410.81 | 8 | 15447.66 | 918.80 | |
| 2022 | |||||||||
| Yield estimate(Kg ha-1) | 0 kg Nha-1 | 4 | 11039.92 | 363.47 | 11216.03 | 443.66 | 8 | 11127.98 | 387.09 |
| 50 kg Nha-1 | 4 | 12046.55 | 563.67 | 12151.63 | 322.36 | 8 | 12099.09 | 428.79 | |
| 100 kg Nha-1 | 4 | 13578.63 | 376.01 | 13258.81 | 594.04 | 8 | 13418.72 | 490.97 | |
| 150 kg Nha-1 | 4 | 14167.06 | 680.23 | 14037.29 | 598.88 | 8 | 14102.17 | 597.35 | |
| Grain yield(Kg ha-1) | 0 kg Nha-1 | 4 | 13097.40 | 1512.23 | 12292.20 | 836.34 | 8 | 12694.80 | 1210.41 |
| 50 kg Nha-1 | 4 | 14452.90 | 1580.30 | 13943.42 | 775.84 | 8 | 14198.16 | 1184.24 | |
| 100 kg Nha-1 | 4 | 15646.59 | 610.13 | 14911.90 | 1319.73 | 8 | 15279.25 | 1029.66 | |
| 150 kg Nha-1 | 4 | 16512.64 | 2448.93 | 15526.74 | 2229.14 | 8 | 16019.69 | 2231.04 | |
Table 2021. were statistically significant at 95% C.I (Table 4.2).
Table 4.2.
Analysis of Variance (ANOVA) test summary on Yield characteristics 2021.
| Variables | ANOVA | ||
|---|---|---|---|
| Blocks 1 & 2 | Block 1 | Block 2 | |
| Yield estimate (Kg/ha) |
F3, 28 = 69.159, p < 0.001 |
F3, 12 = 34.362, p < 0.001 |
F3, 12 = 32.072, p < 0.001 |
| Grain yield (Kg/ha) |
F3, 28 = 26.46, p < 0.001 |
F3, 12 = 9.233, p = 0.002 |
F3, 12 = 14.441, p < 0.001 |
The Tukey post hoc test (annex 1a) revealed that the mean yield estimates were significantly higher after treating white corn with 50 kg Nha-1 (11940.60 ± 472.32 Kg/ha, p = 0.012), 100 kg Nha-1 (13073.73 ± 306.97 Kg/ha, p < 0.001), & 150 kg Nha-1 (13923.71 ± 433.32 Kg/ha, p < 0.001) compared to 0 kg Nha-1 (11269.95 ± 371.84 Kg/ha). Additionally, treating with 100 kg Nha-1 (13073.73 ± 306.97 Kg/ha, p < 0.001) & 150 kg Nha-1 (13923.71 ± 433.32 Kg/ha, p< 0.001) resulted in significantly higher mean yield estimates compared to 50 kg Nha-1 (11940.60 ± 472.32 Kg/ha), whereas, treating the corn with 150 kg Nha-1 (13923.71 ± 433.32 Kg/ha, p = 0.001) had a higher mean yield estimate compared with treating corn with 100 kg Nha-1 (13073.73 ± 306.97 Kg/ha).
In the same year, there were statistically significant mean differences in the grain yield between and within the various N treatment groups at 95% C.I (Table 4.3). According to the Tukey Post Hoc test (annex 1a), the mean grain yield was significantly higher after treating white corn with 50 kg Nha-1 (13146.49 ± 385.80 Kg/ha, p = 0.025), 100 kg Nha-1 (14370.64 ± 472.29 Kg/ha, p < 0.001), & 150 kg Nha-1 (15447.66 ± 918.80 Kg/ha, p < 0.001) compared to 0 kg Nha-1 (11850.70 ± 1303.32 Kg/ha). Similarly, the corn treated with 100 kg Nha-1 (14370.64 ± 472.29 Kg/ha, p = 0.037) & 150 kg Nha-1 (15447.66 ± 918.80 Kg/ha, p < 0.001) had significantly higher mean grain yield compared to 50 kg Nha-1 (13146.49 ± 385.80 Kg/ha). For the corn treated with 100 kg Nha-1 and 150 kg Nha-1 (p = 0.078), there were no statistically significant differences in the grain yield.
Similarly in 2022, both the yield estimate and grain yield were all statistically significant at 95% C.I – between the N treatment groups as determined by one way ANOVA tests shown in the ANOVA results summary Table 4.3.
Table 4.3.
2022 Analysis of Variance (ANOVA) test summary on Yield characteristics.
| Variables | ANOVA | ||
|---|---|---|---|
| Blocks 1 & 2 | Block 1 | Block 2 | |
| Yield estimate (Kg/ha) |
F3, 28 = 60.849, p < 0.001 |
F3, 12 = 30.903, p < 0.001 |
F3, 12 = 24.229, p < 0.001 |
| Grain mass (Kg/ha) |
F3, 28 = 7.495, p = 0.001 |
F3, 12 = 3.158, p = 0.064* |
F3, 12 = 3.973, p = 0.035 |
The Tukey Post Hoc test (Annex 1b.) further revealed that the 2022 findings observed in the yield estimates were like those documented in the previous year. The mean yield estimates were significantly higher after treating white corn with 50 kg Nha-1 (12099.09 ± 428.79 Kg/ha, p = 0.002), 100 kg Nha-1 (13418.72 ± 490.97 Kg/ha, p < 0.001), & 150 kg Nha-1 (14102.17 ± 597.35 Kg/ha, p < 0.001) compared to 0 kg Nha-1 (11127.98 ± 387.09 Kg/ha). Additionally, treating with 100 kg Nha-1 (13418.72 ± 490.97 Kg/ha, p < 0.001) & 150 kg Nha-1 (14102.17 ± 597.35 Kg/ha, p < 0.001) resulted in significantly higher mean yield estimates compared to 50 kg Nha-1 (12099.09 ± 428.79 Kg/ha), whereas, treating the corn with 150 kg Nha-1 (14102.17 ± 597.35 Kg/ha, p = 0.04) had a higher mean yield estimate compared to treating corn with 100 kg Nha-1 (13418.72 ± 490.97 Kg/ha).
The mean differences in the grain yield were only significant between the two N treatment groups: 0 kg Nha-1 & 100 kg Nha-1 and 0 kg Nha-1 & 150 kg Nha-1. The mean grain yield was significantly higher in the 150 kg Nha-1 (16019.69 ± 2231.04 Kg/ha, p = 0.001) treatment group and 100 kg Nha-1 (15279.25 ± 1029.66 Kg/ha, p = 0.009) treatment group compared to 0 kg Nha- 1 treatment group (12694.80 ± 1210.41 Kg/ha). The mean differences in grain yield observed in the remaining groups were not statistically significant. These groups include: 0 kg Nha-1 & 50 kg Nha-1 (p = 0.207), 50 kg Nha-1 & 100 kg Nha-1 (p = 0.481), 50 kg Nha-1 & 150 kg Nha-1 (p = 0.092), and 100 kg Nha-1 & 150 kg Nha-1 (p = 0.755).
As nitrogen is an important nutrient for all plants, increased nitrogen application is expected to produce higher yields. This is evident in our study, as in other studies that have previously shown this effect in corn, with some reporting higher effects than others (Gheith et al., 2022; Yue et al., 2022; Ray et al., 2019). Yue et al. (2022) reported an annual yield increase of over 200% in the corn treated with 300kg Nha-1 and a 185% increase in under 200kg Nha-1 compared with unfertilized corn. However, their study evaluated the effect of both nitrogen level and application time. In that case, both factors were shown to interact and cause these high effects. As similar to our study, Ray et al. (2019), recorded higher margins of yield, and observed that increasing nitrogen fertilizer application from 100kg ha-1 to 200kg ha-1 increased yield by 12% while increasing to 250kg ha-1 yielded a 20% yield increase.
In contrast, Omar et al. (2022) used application levels (0, 50, 100, and 150kg Nha-1) as in our study but did not find a corresponding linear increase in yield. The researchers found that the highest yield was achieved at 50kg Nha-1, with additional increases causing a reduction in yield. Omar and colleagues applied the nitrogen fertilizer once at the vegetative stage (V12). Conversely, other studies used more than one application times done before the V12 stage (Gheith et al., 2022; Yue et al., 2022; Ray et al., 2019). The differences in application times could explain the variation in results observed.
4. CONCLUSION
This study found significant differences in sweet corn grain mass, yield, and sugar content following varied levels of nitrogen fertilization. Higher nitrogen treatments resulted in higher yields, peaking with the fertilization at 150kgN ha-1, failure to use nitrogen fertilizer resulted in lower corn yields. As nitrogen fertilization was increased, a corresponding increase in white corn yield was recorded. The study found that nitrogen fertilization and corn growth/maturity levels affect the yield characteristics and sugar content of white corn. According to the study results the highest corn sugar content was attained when nitrogen fertilizer was applied at 150 kg N ha-1 with the corn harvested on the 60th day upon emergence. Although the soil moisture content was not measured in this study, the findings revealed that differences in weather observed in the two seasons could affect the white corn sugar content through soil moisture.
Data Availability Statement
Data will be provided upon request.
Acknowledgments
Coming together is a beginning; keeping together is progress; working together is success. The success of this study would not have been possible without the kind support and help of many individuals. My sincere thanks to all who have supported me in my endeavors to complete this thesis. I would like to acknowledge the chair of my thesis committee, Dr. Fanson Kidwaro for his unwavering support, commitment, and willingness in ensuring this study was a success. I extend my appreciation to my thesis committee members Dr. Robert Rhykerd, Michael Barrowclough and Dr. Nicholas Heller for the tutelage, mentorship, encouragement, and guidance. I am sincerely grateful to Dr. Aslihan Spaulding for providing oversight and the much-needed administrative support that steered the completion of this work. My heartfelt gratitude to my colleagues Betsy Kosgei & Vincent Mmata for the enormous support and constructive feedback that enabled me to perfect this study. Lastly, many thanks to my family and the entire Illinois State University Fraternity for the invaluable patience, love, and encouragement all through. I am much indebted to you all.
APPENDIX I. MULTIPLE COMPARISONS/TUKEY POST HOC TESTS RESULTS TABLES
Table 1a.
2021 Turkey Post-hoc Test Table.
| Dependent Variable | (I) N treatment | (J) N treatment | Mean Difference (I-J) | Std. Error | Sig. | 95% Confidence Interval | |
|---|---|---|---|---|---|---|---|
| Lower Bound | Upper Bound | ||||||
| Brix % 60th day (8/25/2021) | 0 kg Nha-1 | 100 kg Nha-1 | .5000-1* | 0.373 | 0.002 | -2.519 | -0.481 |
| 150 kg Nha-1 | -2.719* | 0.373 | 0 | -3.738 | .699-1 | ||
| 50 kg Nha-1 | 150 kg Nha-1 | -2.156* | 0.373 | 0 | -3.175 | .137-1 | |
| 100 kg Nha-1 | 0 kg Nha-1 | 1.500* | 0.373 | 0.002 | 0.481 | 2.519 | |
| 150 kg Nha-1 | .219-1* | 0.373 | 0.014 | -2.238 | -0.199 | ||
| 150 kg Nha-1 | 0 kg Nha-1 | 2.719* | 0.373 | 0 | 1.699 | 3.739 | |
| 50 kg Nha-1 | 2.156* | 0.373 | 0 | 1.137 | 3.175 | ||
| 100 kg Nha-1 | 1.219* | 0.373 | 0.014 | 0.199 | 2.238 | ||
| Brix % 64th day (8/30/2021) | 0 kg Nha-1 | 100 kg Nha-1 | .531-1* | 0.321 | 0 | -2.408 | -0.655 |
| 150 kg Nha-1 | -2.000* | 0.321 | 0 | -2.876 | .1236-1 | ||
| 50 kg Nha-1 | 100 kg Nha-1 | .406-1* | 0.321 | 0.001 | -2.283 | -0.529 | |
| 150 kg Nha-1 | .875-1* | 0.321 | 0 | -2.751 | -0.999 | ||
| 100 kg Nha-1 | 0 kg Nha-1 | 1.531* | 0.321 | 0 | 0.655 | 2.408 | |
| 50 kg Nha-1 | 1.406* | 0.321 | 0.001 | 0.530 | 2.2826 | ||
| 150 kg Nha-1 | 0 kg Nha-1 | 2.000* | 0.321 | 0 | 1.124 | 2.8764 | |
| 50 kg Nha-1 | 1.875* | 0.321 | 0 | 0.999 | 2.7514 | ||
| Yield estimate Kg/ha | 0 kg Nha-1 | 50 kg Nha-1 | -670.650* | 200.523 | 0.012 | 218.14-1 | 23.16-1 |
| 100 kg Nha-1 | 803.783-1* | 200.523 | 0 | -2351.27 | 256.29-1 | ||
| 150 kg Nha-1 | -2653.765* | 200.523 | 0 | -3201.26 | -2106.28 | ||
| 50 kg Nha-1 | 0 kg Nha-1 | 670.650* | 200.523 | 0.012 | 123.16 | 1218.14 | |
| 100 kg Nha-1 | 133.133-1* | 200.523 | 0 | 680.62-1 | -585.642 | ||
| 150 kg Nha-1 | 983.115-1* | 200.523 | 0 | -2530.61 | -435.63 | ||
| 100 kg Nha-1 | 0 kg Nha-1 | 1803.783* | 200.523 | 0 | 1256.292 | 2351.273 | |
| 50 kg Nha-1 | 1133.133* | 200.523 | 0 | 585.642 | 1680.623 | ||
| 150 kg Nha-1 | -849.983* | 200.523 | 0.001 | 397.47-1 | -302.492 | ||
| 150 kg Nha-1 | 0 kg Nha-1 | 2653.765* | 200.523 | 0 | 2106.275 | 3201.255 | |
| 50 kg Nha-1 | 1983.115* | 200.523 | 0 | 1435.625 | 2530.605 | ||
| 100 kg Nha-1 | 849.983* | 200.523 | 0.001 | 302.492 | 1397.473 | ||
| Grain Yield Kg/ha | 0 kg Nha-1 | 50 kg Nha-1 | 295.790-1* | 426.814 | 0.025 | -2461.13 | 30.453-1 |
| 100 kg Nha-1 | -2519.936* | 426.815 | 0 | -3685.27 | 354.6-1 | ||
| 150 kg Nha-1 | -3596.956* | 426.815 | 0 | -4762.29 | -2431.62 | ||
| 50 kg Nha-1 | 0 kg Nha-1 | 1295.790* | 426.815 | 0.025 | 130.453 | 2461.127 | |
| 100 kg Nha-1 | 224.146-1* | 426.815 | 0.037 | -2389.48 | -58.809 | ||
| 150 kg Nha-1 | -2301.166* | 426.815 | 0 | -3466.5 | 135.83-1 | ||
| 100 kg Nha-1 | 0 kg Nha-1 | 2519.936* | 426.815 | 0 | 1354.599 | 3685.274 | |
| 50 kg Nha-1 | 1224.146* | 426.815 | 0.037 | 58.809 | 2389.484 | ||
| 150 kg Nha-1 | 0 kg Nha-1 | 3596.956* | 426.815 | 0 | 2431.619 | 4762.294 | |
| 50 kg Nha-1 | 2301.166* | 426.815 | 0 | 1135.829 | 3466.504 | ||
* The mean difference is significant at the 0.05 level.
Table 1b.
2022 Turkey Post-hoc Test Table.
| Dependent Variable | (I) N treatment | (J) N treatment | Mean Difference (I- J) | Std. Error | Sig. | 95% Confidence Interval | |
|---|---|---|---|---|---|---|---|
| Lower Bound | Upper Bound | ||||||
| Brix 60th day (8/12/2022) | 0 kg Nha-1 | 150 kg Nha-1 | -3.006* | 0.608 | 0 | -4.667 | .3451-1 |
| 50 kg Nha-1 | 150 kg Nha-1 | -3.250* | 0.608 | 0 | -4.911 | .5888-1 | |
| 150 kg Nha-1 | 0 kg Nha-1 | 3.006* | 0.608 | 0 | 1.345 | 4.6674 | |
| 50 kg Nha-1 | 3.250* | 0.608 | 0 | 1.589 | 4.9112 | ||
| Brix 64th day (8/15/2022) | 0 kg Nha-1 | 150 kg Nha-1 | -2.594* | 0.628 | 0.002 | -4.310 | -0.878 |
| 50 kg Nha-1 | 150 kg Nha-1 | -2.969* | 0.628 | 0 | -4.685 | .253-1 | |
| 100 kg Nha-1 | 150 kg Nha-1 | .844-1* | 0.628 | 0.032 | -3.560 | -0.128 | |
| 150 kg Nha-1 | 0 kg Nha-1 | 2.594* | 0.628 | 0.002 | 0.878 | 4.3095 | |
| 50 kg Nha-1 | 2.969* | 0.628 | 0 | 1.253 | 4.6845 | ||
| 100 kg Nha-1 | 1.844* | 0.628 | 0.032 | 0.128 | 3.5595 | ||
| Brix 67th day (8/19/2022) | 0 kg Nha-1 | 150 kg Nha-1 | -2.750* | 0.663 | 0.002 | -4.561 | -0.939 |
| 50 kg Nha-1 | 150 kg Nha-1 | -2.844* | 0.663 | 0.001 | -4.655 | .0328-1 | |
| 150 kg Nha-1 | 0 kg Nha-1 | 2.750* | 0.663 | 0.002 | 0.939 | 4.561 | |
| 50 kg Nha-1 | 2.844* | 0.663 | 0.001 | 1.033 | 4.6547 | ||
| Yield estimate Kg/ha | 0 kg Nha-1 | 50 kg Nha-1 | -971.113* | 241.296 | 0.002 | 629.93-1 | -312.299 |
| 100 kg Nha-1 | -2290.743* | 241.296 | 0 | -2949.56 | 631.93-1 | ||
| 150 kg Nha-1 | -2974.196* | 241.296 | 0 | -3633.01 | -2315.38 | ||
| 50 kg Nha-1 | 0 kg Nha-1 | 971.113* | 241.296 | 0.002 | 312.299 | 1629.926 | |
| 100 kg Nha-1 | 319.630-1* | 241.296 | 0 | 978.44-1 | -660.817 | ||
| 150 kg Nha-1 | -2003.084* | 241.296 | 0 | -2661.9 | 344.27-1 | ||
| 100 kg Nha-1 | 0 kg Nha-1 | 2290.743* | 241.296 | 0 | 1631.929 | 2949.556 | |
| 50 kg Nha-1 | 1319.630* | 241.296 | 0 | 660.817 | 1978.443 | ||
| 150 kg Nha-1 | -683.454* | 241.296 | 0.04 | 342.27-1 | -24.641 | ||
| 150 kg Nha-1 | 0 kg Nha-1 | 2974.196* | 241.296 | 0 | 2315.383 | 3633.009 | |
| 50 kg Nha-1 | 2003.084* | 241.296 | 0 | 1344.271 | 2661.897 | ||
| 100 kg Nha-1 | 683.454* | 241.296 | 0.04 | 24.641 | 1342.267 | ||
| Grain Yield Kg/ha | 0 kg Nha-1 | 100 kg Nha-1 | - 2584.450* | 746.042 | 0.009 | -4621.38 | -547.523 |
| 150 kg Nha-1 | -3324.890* | 746.042 | 0.001 | -5361.82 | 287.96-1 | ||
| 100 kg Nha-1 | 0 kg Nha-1 | 2584.450* | 746.042 | 0.009 | 547.523 | 4621.378 | |
| 150 kg Nha-1 | 0 kg Nha-1 | 3324.890* | 746.042 | 0.001 | 1287.963 | 5361.818 | |
* The mean difference is significant at the 0.05 level.
ANNEX II. WHITE CORN YIELD & SUGAR CHARACTERISTICS
Table 2a.
White Corn Yield Estimate & Grain Yield Summary Table.
| Variables | Block | N | Minimum | Maximum | Mean | Std. Dev |
|---|---|---|---|---|---|---|
| 2021 | ||||||
| Yield estimate (Kg ha-1) | Blocks 1 & 2 average | 32 | 10451.70 | 14760.50 | 12551.99 | 1105.32 |
| Block 1 | 16 | 10451.70 | 14024.70 | 12552.06 | 1049.01 | |
| Block 2 | 16 | 11103.90 | 14760.50 | 12551.93 | 1193.52 | |
| Grain Yield (Kg ha-1) | Blocks 1 & 2 average | 32 | 9655.62 | 17336.93 | 13703.87 | 1588.72 |
| Block 1 | 16 | 10271.30 | 17336.93 | 13749.98 | 1578.50 | |
| Block 2 | 16 | 9655.62 | 16055.85 | 13657.76 | 1649.29 | |
| 2022 | ||||||
|
Yield estimate (Kg ha-1) |
Blocks 1 & 2 average | 32 | 10660.70 | 14922.90 | 12686.99 | 1257.69 |
| Block 1 | 16 | 10660.70 | 14922.90 | 12708.04 | 1356.20 | |
| Block 2 | 16 | 10660.70 | 14760.50 | 12665.94 | 1195.33 | |
|
Grain Yield (Kg ha-1) |
Blocks 1 & 2 average | 32 | 11433.69 | 19193.86 | 14547.97 | 1904.12 |
| Block 1 | 16 | 11677.59 | 19193.86 | 14927.38 | 1997.97 | |
| Block 2 | 16 | 11433.69 | 17360.41 | 14168.57 | 1787.19 |
ANNEX III. PICTORIAL ILLUSTRATION ON THE METHODS & MATERIALS
Figure IIIa.
Aerial view of the experimental design; a 4 × 4 factorial arranged in randomized complete block design (RCBD).
Figure IIIa.
Aerial view of the experimental design; a 4 × 4 factorial arranged in randomized complete block design (RCBD).
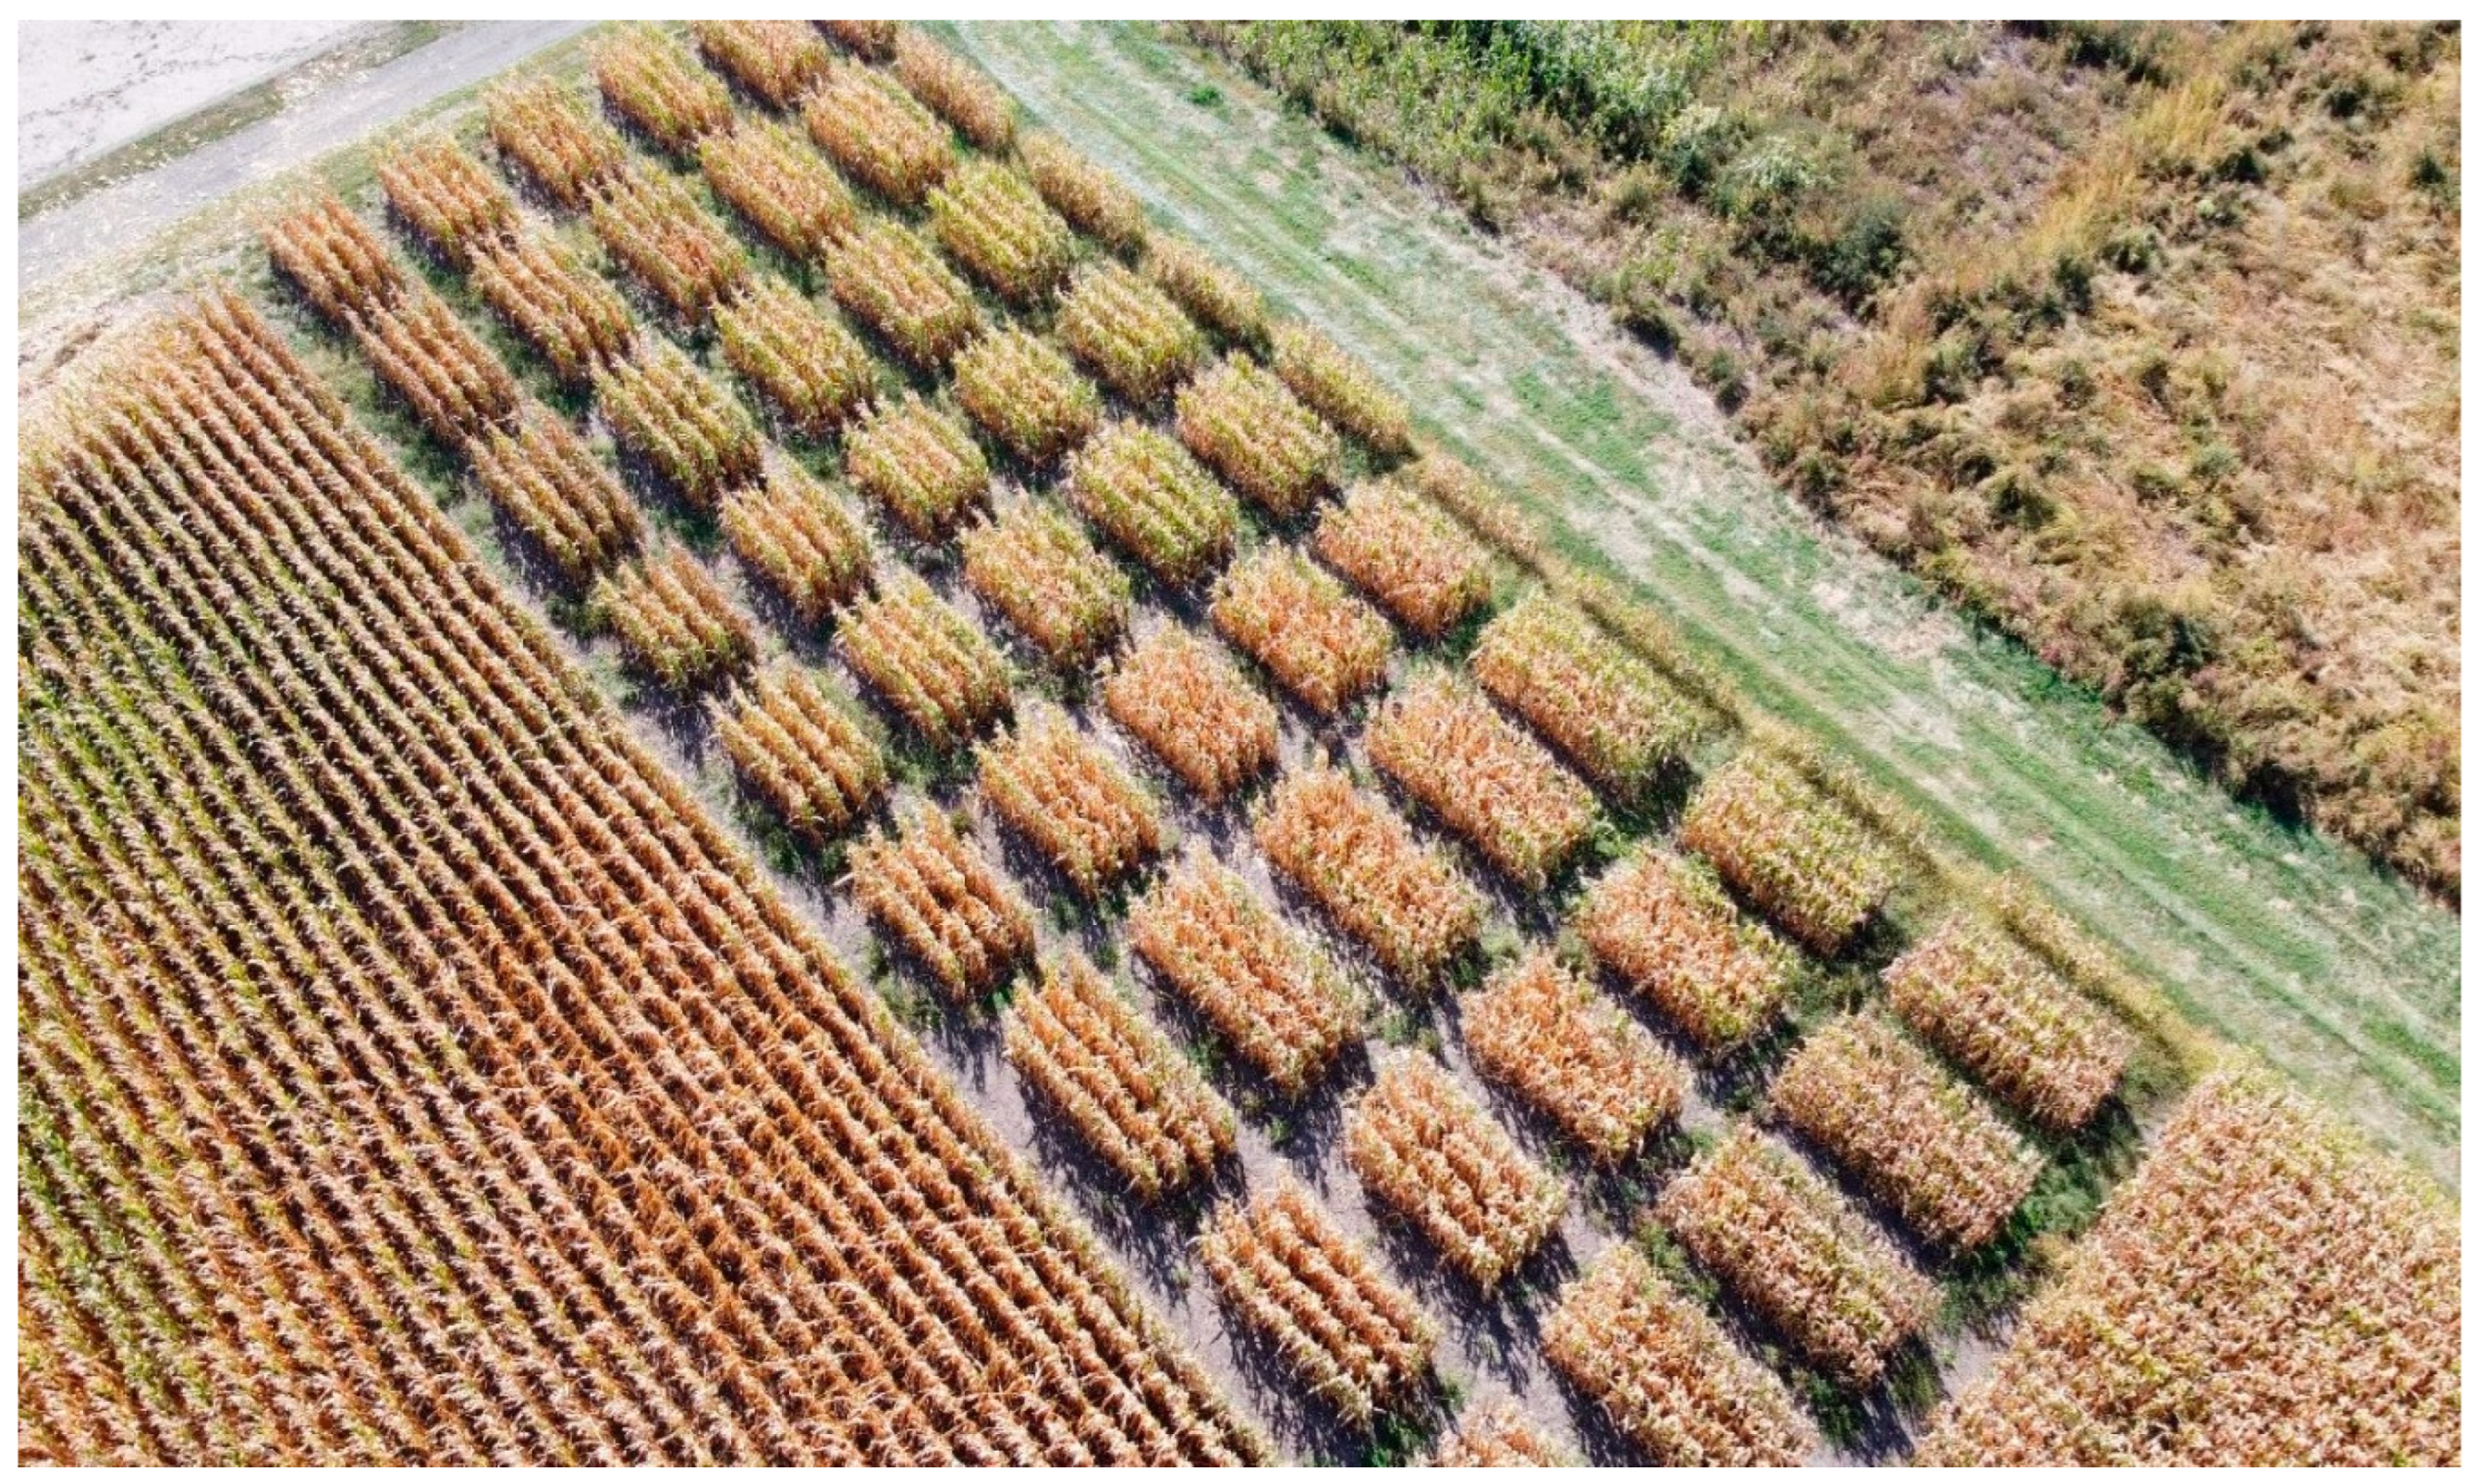
Figure IIIb.
White corn sugar sampling using a refractometer.
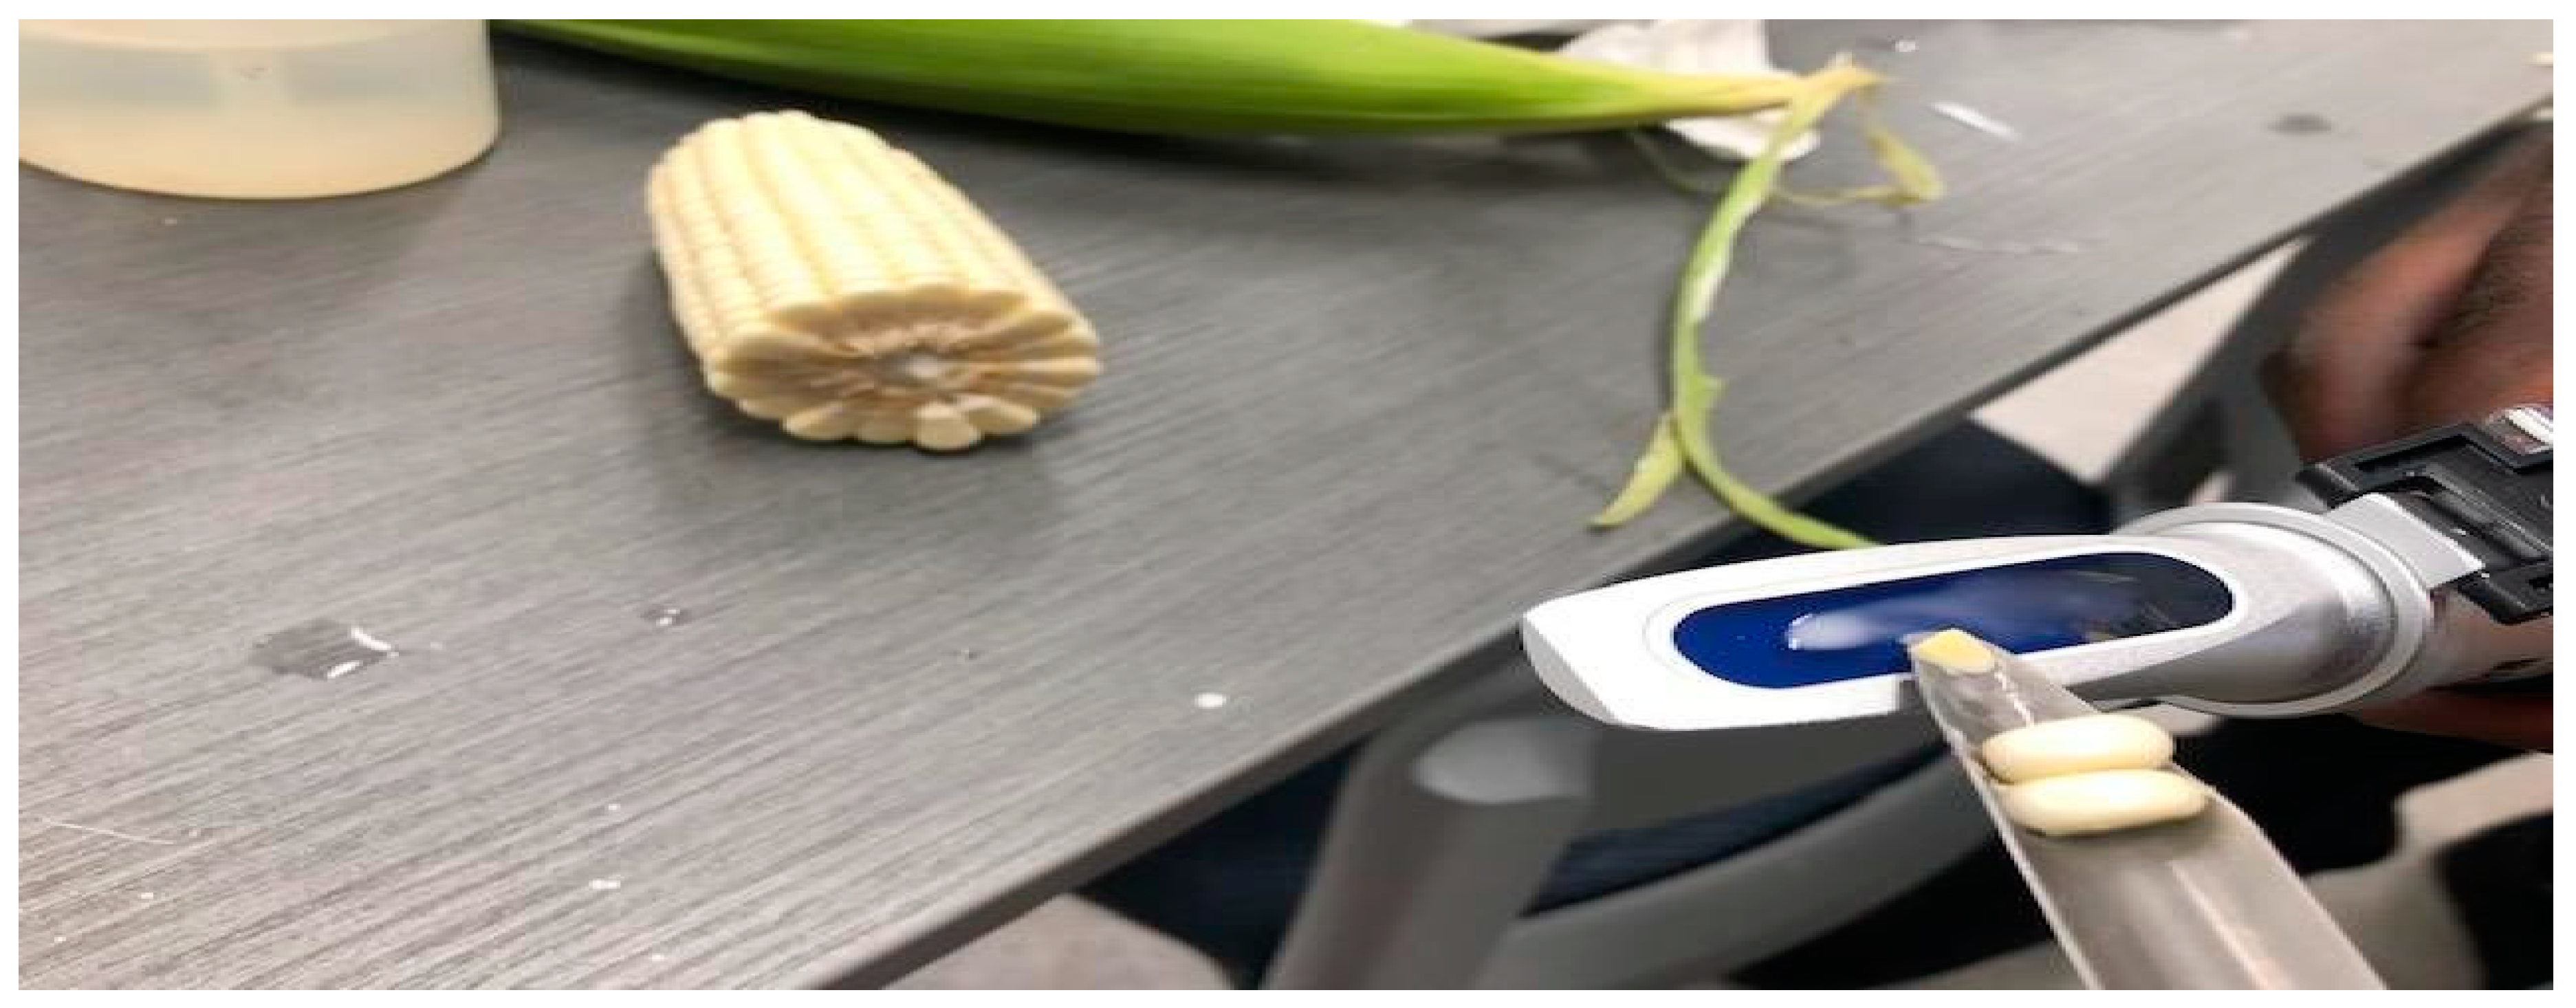
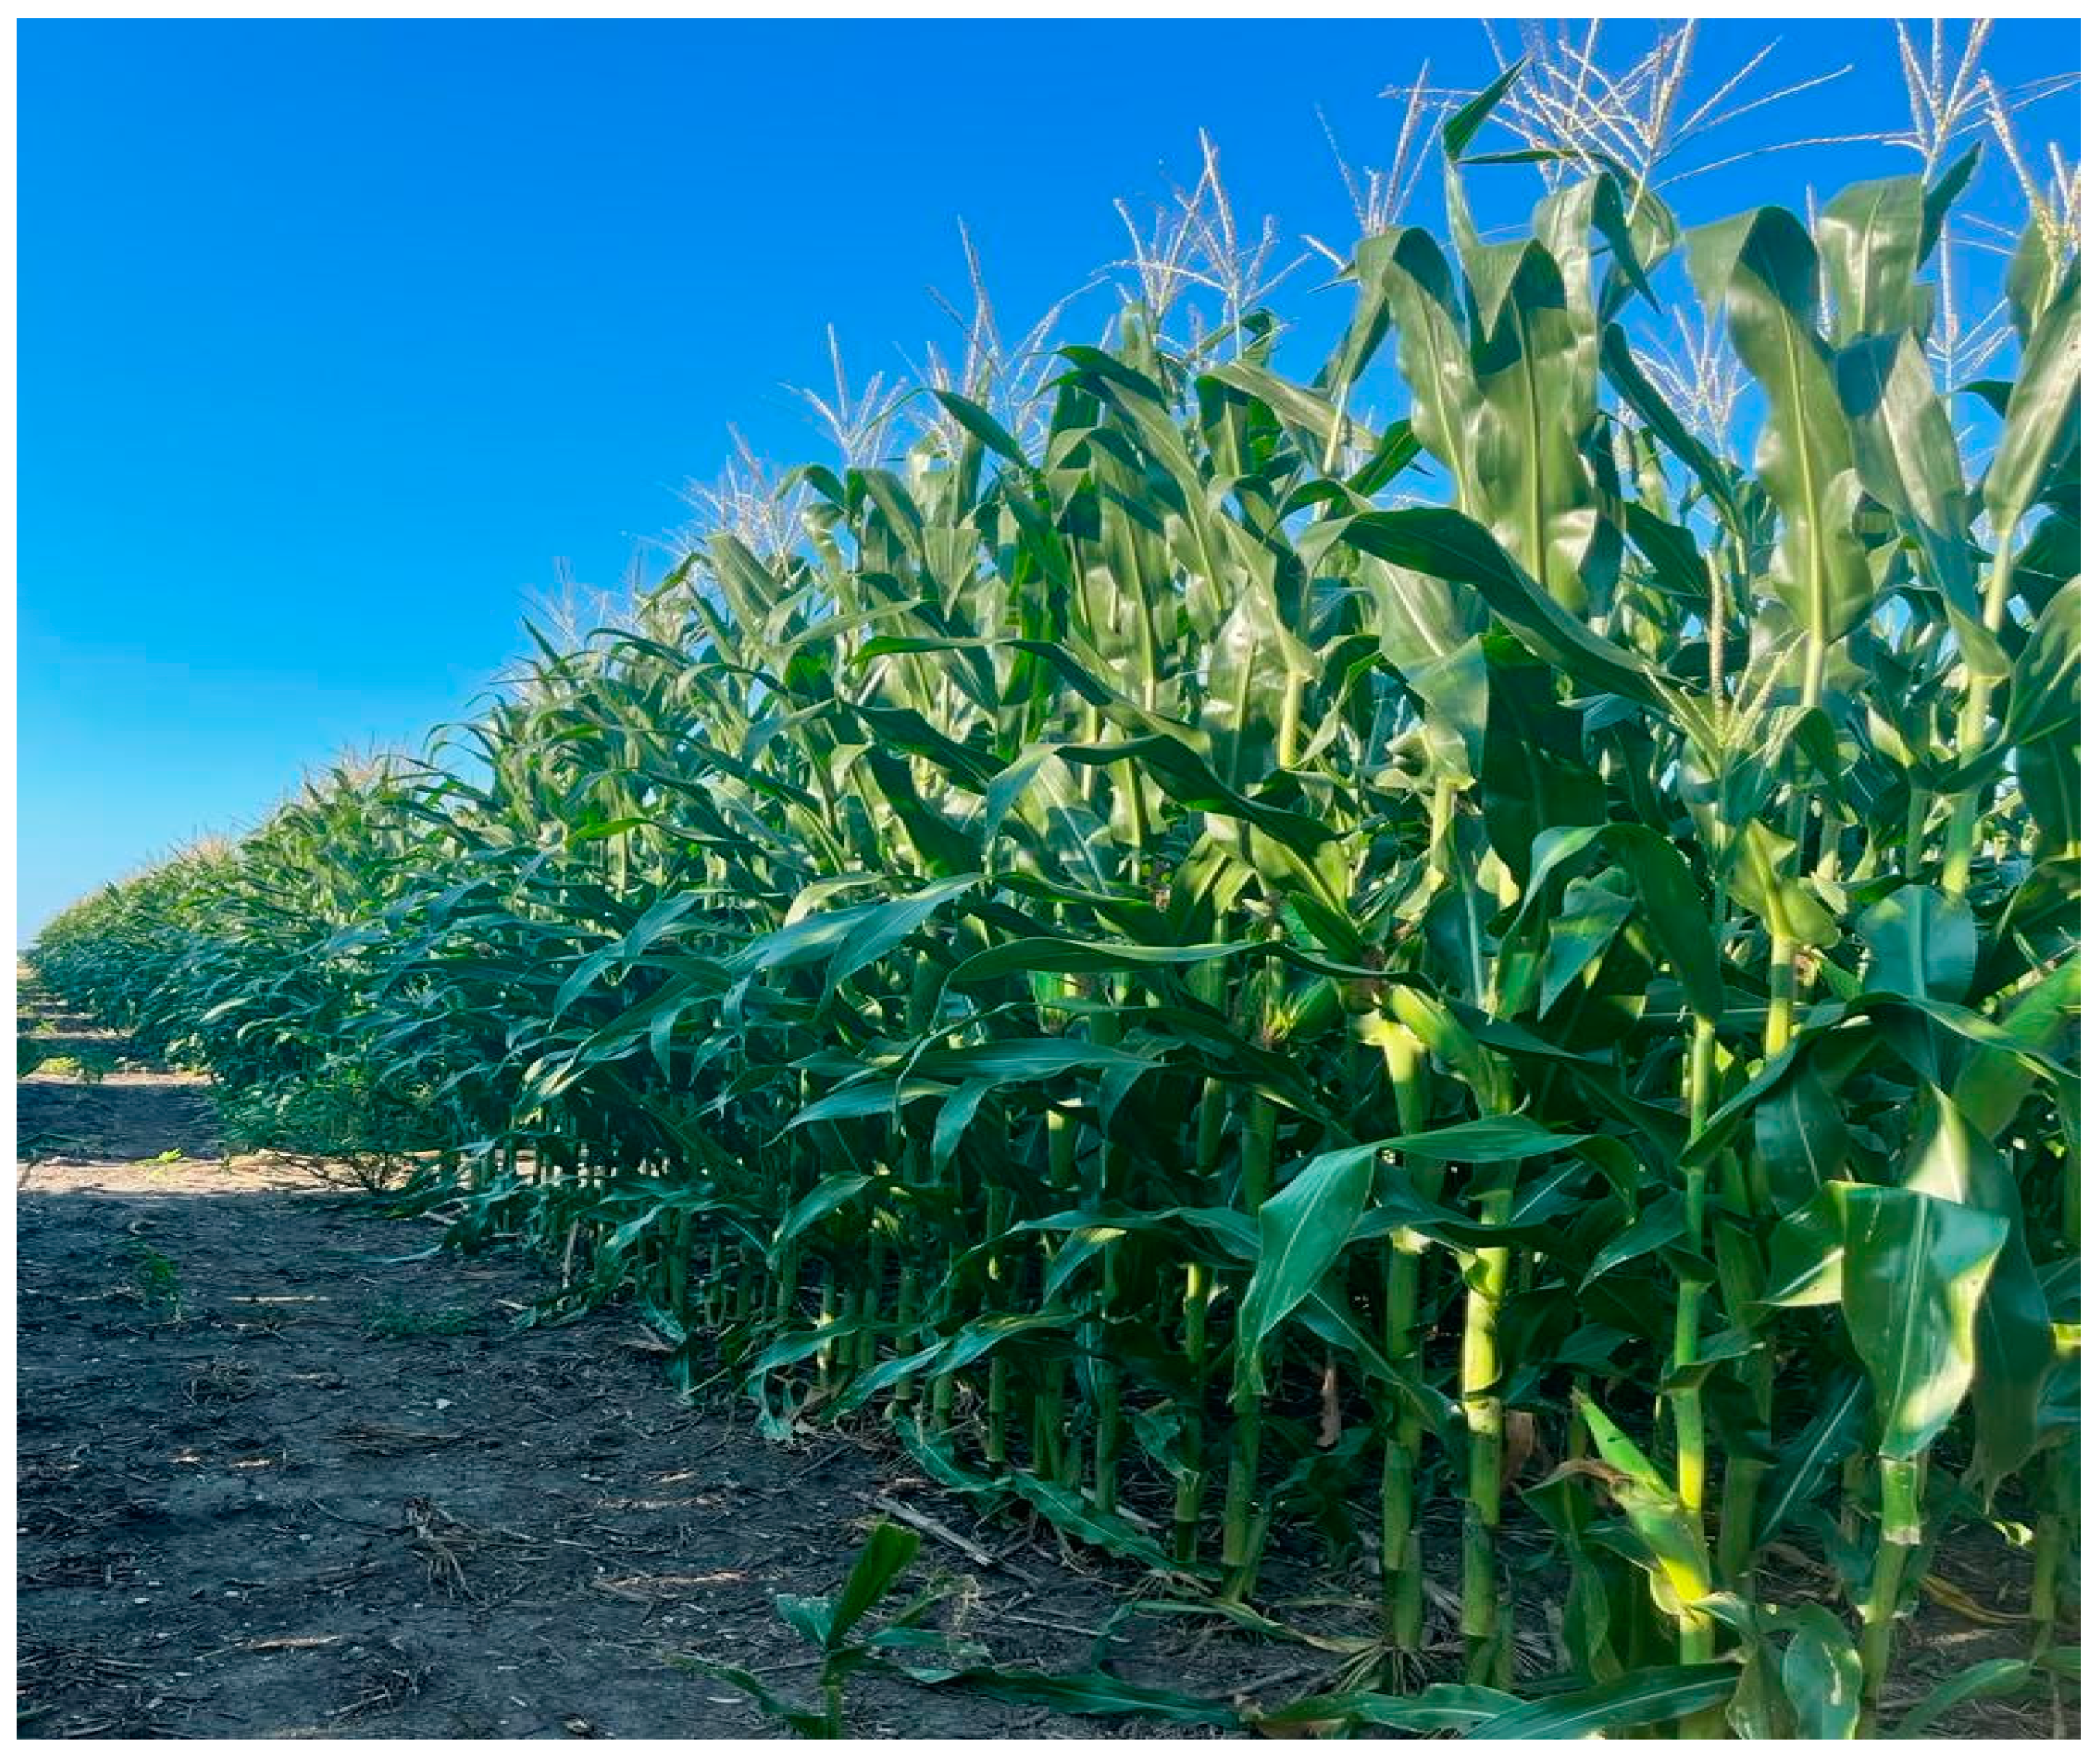
Figure IIIc.
White corn plants growing at Illinois State University research farm in Lexington, IL 61753 (40.66844 N, 88.77591 W).
Figure IIIc.
White corn plants growing at Illinois State University research farm in Lexington, IL 61753 (40.66844 N, 88.77591 W).
References
- Alexandratos, N., & Bruinsma, J. (2012). World agriculture towards 2030/2050: the 2012 revision.
- Amer, M. W., Alhesan, J. S. A., Ibrahim, S., Qussay, G., Marshall, M., & Al-Ayed, O. S. (2021). Potential use of corn leaf waste for biofuel production in Jordan (physio-chemical study). Energy, 214, 118863.
- Caballero, B., Trugo, L. C., & Finglas, P. M. (2003). Encyclopedia of food sciences and nutrition. Academic.
- Erenstein, O., Jaleta, M., Sonder, K., Mottaleb, K., & Prasanna, B. M. (2022). Global maize production, consumption, and trade: trends and R&D implications. Food Security, 1-25.
- Fausti, S. W. (2015). The causes and unintended consequences of a paradigm shift in corn production practices. Environmental Science & Policy, 52, 41-50.
- García-Lara, S., & Serna-Saldivar, S. O. (2019). Corn history and culture. Corn, 1-18.
- Gheith, E., El-Badry, O. Z., Lamlom, S. F., Ali, H. M., Siddiqui, M. H., Ghareeb, R. Y., El-Sheikh, M. H., Jebril, J., Abdelsalam, N. R., & Kandil, E. E. (2022). Maize (Zea mays L.) Productivity and Nitrogen Use Efficiency in Response to Nitrogen Application Levels and Time. Frontiers in plant science, 13, 941343.
- Helstad, S. (2019). Corn Sweeteners. In Corn (pp. 551-591). AACC International Press.
- Jafarikouhini, N., Kazemeini, S. A., & Sinclair, T. R. (2020). Sweet Corn Ontogeny in Response to Irrigation and Nitrogen Fertilization. Journal of Horticulture and Plant Research, 23.
- Jusoh, N., Ahmad, A., & Tengah, R. Y. (2019). Evaluation of nutritive values and consumer acceptance of sweet corn (Zea mays) juice as a recovery beverage for exercising people. Malays. J. Fundam. Appl. Sci, 15, 504-507.
- Khanduri, A., Hossain, F., Lakhera, P. C., & Prasanna, B. M. (2011). Effect of harvest time on kernel sugar concentration in sweet corn. Indian Journal of Genetics and Plant Breeding, 71(3), 231.
- Lao, Y. X., Yu, Y. Y., Li, G. K., Chen, S. Y., Li, W., Xing, X. P., & Guo, X. B. (2019). Effect of Sweet Corn Residue on Micronutrient Fortification in Baked Cakes. Foods, 8(7), 260.
- Malvar, R. A., Revilla, P., Moreno-González, J., Butrón, A., Sotelo, J., & Ordás, A. (2008).
- White maize: genetics of quality and agronomic performance. Crop science, 48(4), 1373-1381.
- Manjunatha, S. B., Biradar, D. P., & Aladakatti, Y. R. (2016). Nanotechnology and its applications in agriculture: A review. Journal of farm Science, 29(1), 1-13.
- Merrill, W. L., Hard, R. J., Mabry, J. B., Fritz, G. J., Adams, K. R., Roney, J. R., & MacWilliams, A.C. (2009). The diffusion of maize to the southwestern United States and its impact. Proceedings of the National Academy of Sciences, 106(50), 21019-21026.
- Ohyama, T. (2010). Nitrogen as a major essential element of plants. Nitrogen assimilation in plants, 37(2), 2-17.
- Omar, S., Abd Ghani, R., Khaeim, H., Sghaier, A.H., & Jolánkai, M. (2022). The effect of nitrogen fertilisation on yield and quality of maize (Zea mays L.). Acta Alimentaria, 51(2). [CrossRef]
- Pan-in, S., & Sukasem, N. (2017). Methane production potential from anaerobic co-digestions of different animal dungs and sweet corn residuals. Energy Procedia, 138, 943-948.
- Pruitt, J. D. (2016). A brief history of corn: looking back to move forward. The University of Nebraska-Lincoln.
- Ranum, P., Peña-Rosas, J. P., & Garcia-Casal, M. N. (2014). Global maize production, utilization, and consumption. Annals of the New York academy of sciences, 1312(1), 105-112.
- Ray, D. K., Ramankutty, N., Mueller, N. D., West, P. C., & Foley, J. A. (2012). Recent patterns of crop yield growth and stagnation. Nature communications, 3(1), 1-7.
- Ray, K., Banerjee, H., Dutta, S., Hazra, A. K., & Majumdar, K. (2019). Macronutrients influence yield and oil quality of hybrid maize (Zea mays L.). PloS one, 14(5), e0216939. [CrossRef]
- Reddy, V. R., Seshu, G., Jabeen, F., & Rao, A. S. (2012). Speciality corn types with reference to quality protein Maize (Zea mays L.)-A review. International Journal of Agriculture, Environment and Biotechnology, 5(4), 393-400.
- Revilla, P., Anibas, C. M., & Tracy, W. F. (2021). Sweet corn research around the world 2015–2020. Agronomy, 11(3), 534.
- Rooney, L. W. (1991). Chapter 13: Food uses of whole corn and drymilled fractions. Corn: Chemistry and Technology, 399-429.
- Rose, D. J., Inglett, G. E., & Liu, S. X. (2010). Utilisation of corn (Zea mays) bran and corn fiber in the production of food components. Journal of the Science of Food and Agriculture, 90(6), 915-924.
- Sharma, A., Wuebbles, D. J., & Kotamarthi, R. (2021). The need for urban-resolving climate modeling across scales. AGU Advances, 2(1), e2020AV000271.
- Serpen, J. Y. (2012). Comparison of sugar content in bottled 100% fruit juice versus extracted juice of fresh fruit.
- Singh, I., Langyan, S., & Yadava, P. (2014). Sweet corn and corn-based sweeteners. Sugar tech, 16(2), 144-149.
- Szymanek, M., Tanaś, W., & Kassar, F. H. (2015). Kernel carbohydrates concentration in sugary- 1, sugary enhanced and shrunken sweet corn kernels. Agriculture and Agricultural Science Procedia, 7, 260-264.
- Tilman, D., Fargione, J., Wolff, B., D'antonio, C., Dobson, A., Howarth, R., & Swackhamer, D. (2001).Forecasting agriculturally driven global environmental change. Science, 292(5515), 281-284.
- Wallington, T. J., Anderson, J. E., Mueller, S. A., Kolinski Morris, E., Winkler, S. L., Ginder, J.M., & Nielsen, O. J. (2012). Corn ethanol production, food exports, and indirect land use change. Environmental science & technology, 46(11), 6379-6384.
- Wang, N., Fu, F., Wang, H., Wang, P., He, S., Shao, H., Ni, Z., & Zhang, X. (2021). Effects of irrigation and nitrogen on chlorophyll content, dry matter and nitrogen accumulation in sugar beet (Beta vulgaris L.). Scientific Reports 11, 16651. [CrossRef]
- White, J. S., Hobbs, L. J., & Fernandez, S. (2015). Fructose content and composition of commercial HFCS-sweetened carbonated beverages. International Journal of Obesity, 39(1), 176-182.
- Wu, Y., Zhao, B., Li, Q., Kong, F., Du, L., Zhou, F., Shi, H., Ke, Y., Liu, Q., Feng, D., & Yuan, J. (2019). Non-structural carbohydrates in maize with different nitrogen tolerance are affected by nitrogen addition. PloS one, 14(12), e0225753. [CrossRef]
- Yue, K., Li, L., Xie, J., Liu, Y., Xie, J., Anwar, S. & Fudjoe, S. K. (2022). Nitrogen supply affects yield and grain filling of maize by regulating starch metabolizing enzyme activities and endogenous hormone contents. Frontiers in Plant Science, 12, 798119. [CrossRef]
- Zhou, X., Ouyang, Z., Zhang, X., Wei, Y., Tang, S., Ma, Z., & Han, X. (2019). Sweet corn stalk treated with saccharomyces cerevisiae alone or in combination with lactobacillus plantarum: Nutritional composition, fermentation traits and aerobic stability. Animals, 9(9), 598.
Figure 3.1.
The 4 × 4 factorial arranged plots in randomized complete block design (RCBD) with 2 replications; blocks 1&2. The Key guides on the Nitrogen treatment at four rates (0, 50, 100, 150 Kg N/ha).
Figure 3.1.
The 4 × 4 factorial arranged plots in randomized complete block design (RCBD) with 2 replications; blocks 1&2. The Key guides on the Nitrogen treatment at four rates (0, 50, 100, 150 Kg N/ha).
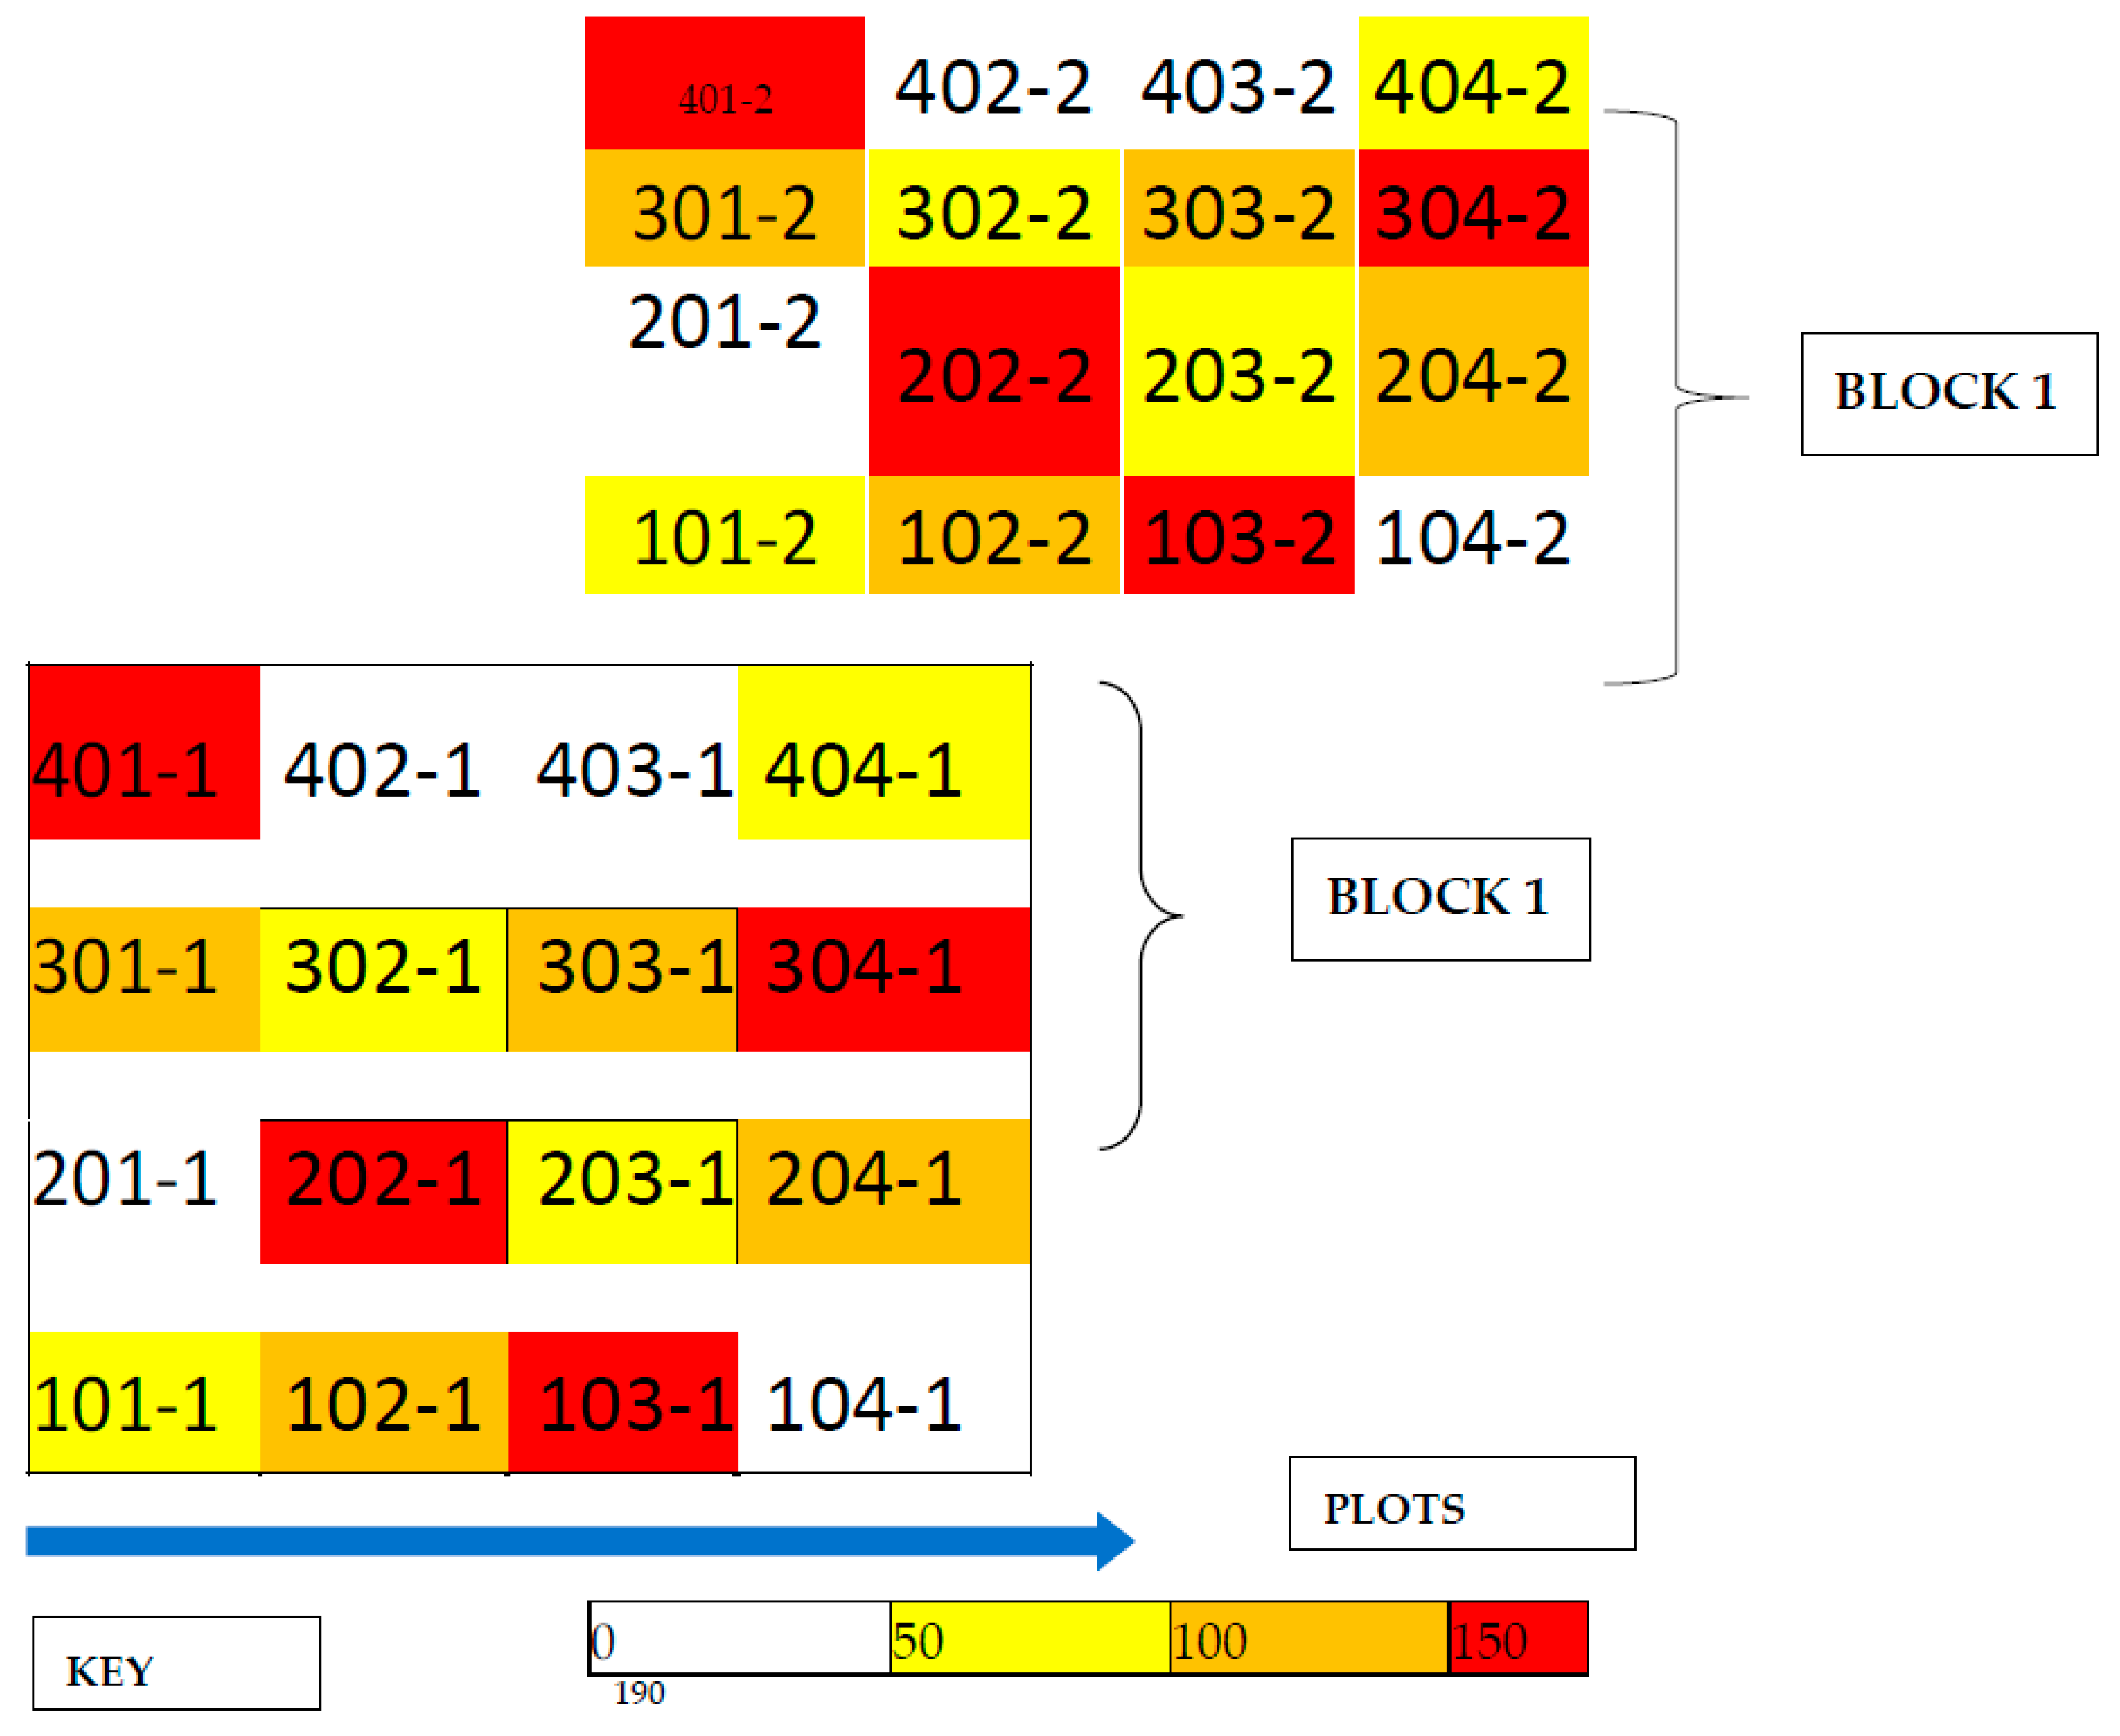
Figure 4.1.
White corn mean yield estimate (Kg/Ha) with standard deviation error bars in 2021 & 2022.
Figure 4.1.
White corn mean yield estimate (Kg/Ha) with standard deviation error bars in 2021 & 2022.
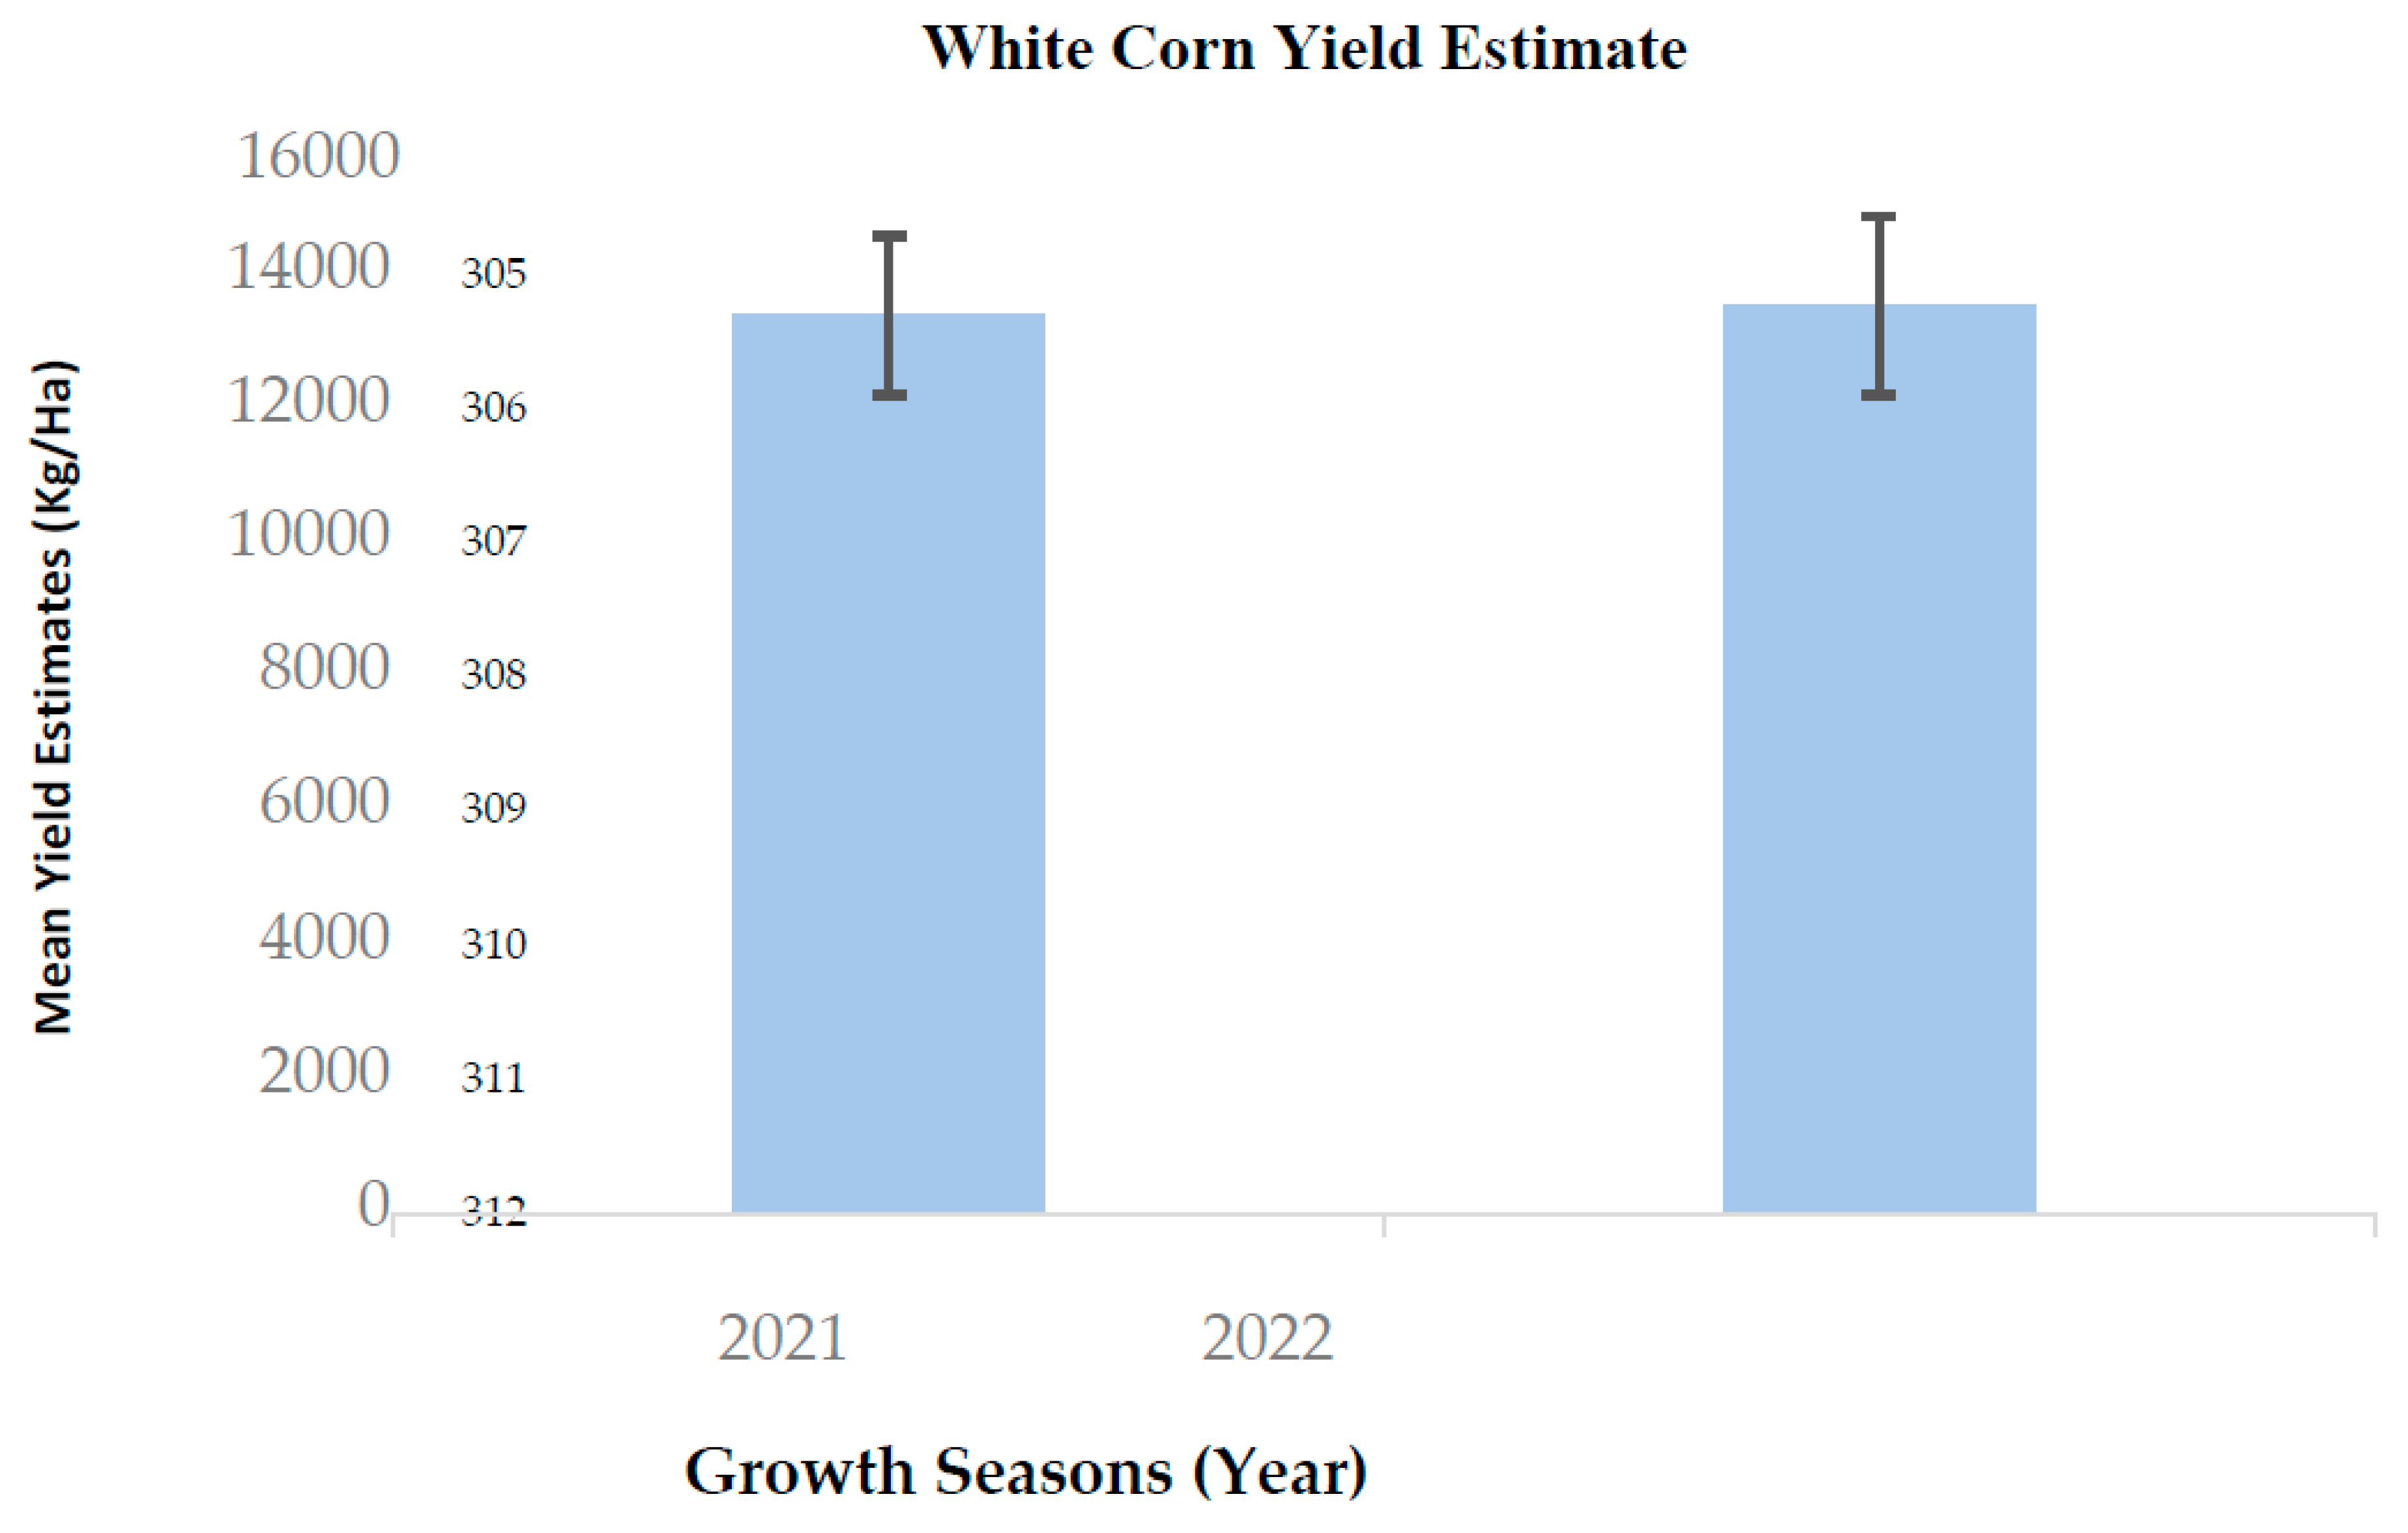
Figure 4.2.
White corn mean grain yield (Kg/Ha) with standard deviation error bars in 2021&2022.

Disclaimer/Publisher’s Note: The statements, opinions and data contained in all publications are solely those of the individual author(s) and contributor(s) and not of MDPI and/or the editor(s). MDPI and/or the editor(s) disclaim responsibility for any injury to people or property resulting from any ideas, methods, instructions or products referred to in the content. |
© 2023 by the authors. Licensee MDPI, Basel, Switzerland. This article is an open access article distributed under the terms and conditions of the Creative Commons Attribution (CC BY) license (http://creativecommons.org/licenses/by/4.0/).
Copyright: This open access article is published under a Creative Commons CC BY 4.0 license, which permit the free download, distribution, and reuse, provided that the author and preprint are cited in any reuse.


