Preprint
Article

Towards Optimal Solar Energy Integration: A Deep Dive into AI-Enhanced Solar Irradiance Forecasting Models

Altmetrics

Downloads

135

Views

91

Comments

4

Submitted:

30 October 2023

Posted:

31 October 2023

You are already at the latest version

Alerts
Abstract
Keywords: Artificial Neural Network (ANN), Support Vector Machine (SVM), Support Vector Regression (SVR), Lightweight Gradient Boosting Machines (Light GBM), Machine Learning, Solar Irradiance (SI), Solar forecasting
Keywords: 
Subject: Engineering  -   Energy and Fuel Technology

1. Introduction

The global landscape of energy production and consumption has undergone a significant paradigm shift in the face of the dual challenges posed by climate change and fossil fuel depletion. It is well-documented that energy sectors are the linchpins contributing to approximately 80% of greenhouse gas (GHG) emissions worldwide [1,2].This understanding underscores the urgency for a sustainable energy transition, emphasizing the crucial role of renewable energy [3]. Solar energy, in particular, has emerged as a formidable candidate in this transition. Its ubiquity, coupled with technological advancements, presents a potent solution to the world's escalating energy demands and environmental concerns [4,5,6,7,8,9,10].
A salient trend emerges when examining the uptake of solar energy worldwide. Developed countries, such as the UK and Germany, have made significant advancements, seamlessly integrating solar energy into their respective power infrastructures [11,12,13]. Conversely, many developing nations, including Pakistan and India, have yet to fully harness the potential of solar energy, often hindered by a complex nexus of technological, political, and economic challenges [14,15]. This juxtaposition raises a compelling research question: How can those regions, differentiated by their geographical and climatic nuances but bound by analogous energy dilemmas, optimize their deployment of solar energy? Effective integration into energy systems hinges on the precision and reliability of their forecasting methodologies [16].
The significance of solar forecasting in the realm of renewable energy integration is evident from global initiatives and investments. Solar forecasting is not only pivotal for effective operational planning but also reduces energy wastage and lowers operational costs. In Australia, the emphasis on this is seen through ARENA's generous allocation for short-term forecasting projects that span a substantial 3.5 GW of renewable capacity [17,18]. The UK's National Grid stands as a testament to the potential of innovative technologies in this domain. By harnessing the power of AI and integrating diverse data points, they have achieved a remarkable one-third improvement in solar forecasting accuracy [19]. In the U.S., California's Energy Commission projects indicate potential annual savings of USD 2 million in the wholesale market with enhanced forecasting, highlighting the broader financial implications [20]. Concurrently, the University of Arizona's Solar Forecasting Archive offers a transparent platform for continual refinement in forecasting tools [21]. In Texas, the Electric Reliability Council's move to probabilistic forecasting, supported by the U.S. Department of Energy's SETO, illustrates the direct practical application of these advancements, ensuring more seamless renewable energy assimilation and superior grid stability [22]. In light of these advancements, it is imperative to emphasize the paramount significance of solar forecasting for developing countries, where optimizing renewable resources can be a cornerstone for sustainable growth and energy independence.
Taking Pakistan as a case in point, the country's energy statistics are alarming. With it consuming a mere 0.37% of global energy, the crippling energy deficit has had undeniable repercussions on its economic trajectory [23]. A predominant reliance on non-renewable energy sources has further exacerbated this situation [24,25]. Presently, renewable energy contributes an insignificant 0.3% to Pakistan's total energy matrix [26]. Figure 1 illustrates the total energy supply across various fuel types from 1990 to 2020 of Pakistan. Focusing on the "Wind, solar, etc." category, there is a noticeable growth in solar energy contribution over the three decades. Starting with a modest presence in the early 1990s, solar energy sees a significant rise by 2020, highlighting its increasing adoption in the energy sector [27]. Projections intimate a soaring energy demand of 40,000 MW by 2030, with non-renewable resources catering to a staggering 67% of this demand [28,29]. Given these statistics and the abundant solar radiation in regions like Quetta, averaging 5-7 kWh/m2 daily, the underutilization of solar energy in the country is palpable [30]. This scenario highlights the urgent need for leveraging advanced forecasting methods to optimize the untapped potential of solar energy, serving as a segue into the broader context of renewable energy forecasting. The formulation of optimal policies for solar technology can lead to the diversification of the country's energy mix, ultimately fostering economic empowerment and income generation in the long term [31,32].
Renewable energy forecasting stands at the forefront of strategic planning, investment, and decision-making, especially given the intermittent nature of renewable energy sources. Despite the diverse range of forecasting models available, each contains inherent errors due to the complexities of energy prediction. Recent advancements in weather forecasting techniques for renewable energy systems, particularly within smart grids, encompass a broad spectrum ranging from physical and statistical models to those driven by artificial intelligence (AI), including machine learning and deep learning [33,34,35,36]. The domain of SI prediction has been notably transformed with the introduction of AI methodologies, solidifying them as indispensable tools in the renewable energy sector [37,38,39,40].
Artificial Neural Network (ANN), among these methodologies, has emerged as particularly compelling for their capacity to address intricate modeling challenges, although its performance is closely tied to meticulous data preprocessing [41,42]. While Support Vector Machine (SVM) and its hybrid counterparts have marked their presence in this domain with promising outcomes [37,38,39,40], the robustness and reliability of ANN in solar resource forecasting have been continually emphasized [43]. Specific studies underscore the proficiency of ANN, suggesting it to outpace other models when trained with optimal meteorological data, as seen, e.g., in Kuala Terengganu, Malaysia [44,45]. For the transition to a more sustainable energy future, the transformative potential of AI and especially the dominance of ANN are evident. Their pivotal role in making the solar energy sector more efficient and sustainable cannot be understated, as echoed by the previous studies [46,47,48]
Focused on Quetta, Pakistan, this investigation offers not merely a regional study but an exemplar of advanced methodologies with global applicability potential. Venturing into the multifaceted realm of Solar Irradiance (SI) forecasting, the study introduces an unprecedented approach with two distinct models: the RELAD-ANN, equipped with Rectified Linear Unit (ReLU) activation and the Adaptive Moment Estimation (ADAM) optimizer, and the Linear SVM with Individual Parameter Features (LSIPF). The LSIPF, while an established model, is brought into this research for a direct comparison with RELAD-ANN, illuminating their respective strengths in SI prediction. While the core focus lies in forecasting SI on an hourly basis, understanding its interplay with other environmental variables is crucial. Consequently, we have also predicted complementary parameters such as air temperature, wind speed, and specific humidity on similar hourly intervals. These additional hourly predictions not only serve as a validation mechanism for our models but also shed light on their intricate roles in SI forecasting. Tailored to capture Quetta's unique SI patterns, the models are underpinned by avant-garde AI techniques, indicating their position at the zenith of scientific progress in this domain [49,50,51,52,53,54,55,56].Their adaptability and broader relevance are bolstered by the seamless integration of leading AI regression models like the Support Vector Regression (SVR) and Lightweight Gradient Boosting Machines (Light GBM). Integral to this research is the strategic implementation of the Generative Adversarial Imputation Networks (GAIN) to tackle data inconsistencies. It is noteworthy that, to the authors' knowledge, such a preprocessing technique remains uncharted in the realm of SI predictions. This innovative approach accentuates our commitment to data integrity, offering enhanced robustness to our foundational dataset. The designed models stand poised as potential leaders in near-future SI prediction endeavors. This strategic combination augments the models' flexibility and sets the stage for their potential extension beyond Quetta's boundaries [57,58,59,60].
Navigating beyond traditional integrations of established machine-learning methodologies, this research marks a pivotal shift in SI pattern recognition. Amidst a dominant trend favoring specific AI paradigms in modern studies, this paper unveils a distinctive ANN model, adding depth to scholarly discussions. Harnessing the prowess of advanced AI regression models such as SVR and Light GBM, our endeavors bear testimony to the models' inherent robustness and trustworthiness, emphasizing their scientific validity. These conceived models, underpinned by the empirical backdrop of Quetta, promise to set benchmarks in upcoming SI prediction pursuits. Yet, their foundational scientific techniques imply a broader realm of application. Crafted with precision, the models require fine-tuning to regional climatic nuances, ensuring their versatility across diverse landscapes.
In essence, this research aspires to:
  • Elucidate the design and implementation of the RELAD-ANN and LSIPF models, specifically tailored to address the intricacies inherent in SI forecasting;
  • Incorporate the prowess of SVR and Light GBM regressors to ascertain and elevate prediction accuracy; and
  • Empirically validate the proposed models against robust statistical benchmarks, affirming their viability for broader applications.
The ensuing sections are structured to provide a detailed insight into our study. Section 2 meticulously describes our research methodology, encompassing the phases of data collection, model conceptualization, and evaluation standards. Progressing to Section 3, a detailed analysis of the empirical results is presented, delving into the nuances of our findings. Conclusively, Section 4 encapsulates the research, summarizing the insights gained and elucidating the contributions this study proposes to the field of solar energy forecasting.

2. Materials and Methods

2.1. Selection of Location and Parameters

The Identifying an optimal location for a solar power facility is paramount, considering the facility's projected lifespan of 25 to 30 years and substantial upfront construction expenses. Identifying the optimal location is crucial, taking into account a myriad of criteria, including solar energy potential, duration of sunshine, solar radiation, and data accessibility for different parameters essential for deploying AI techniques.
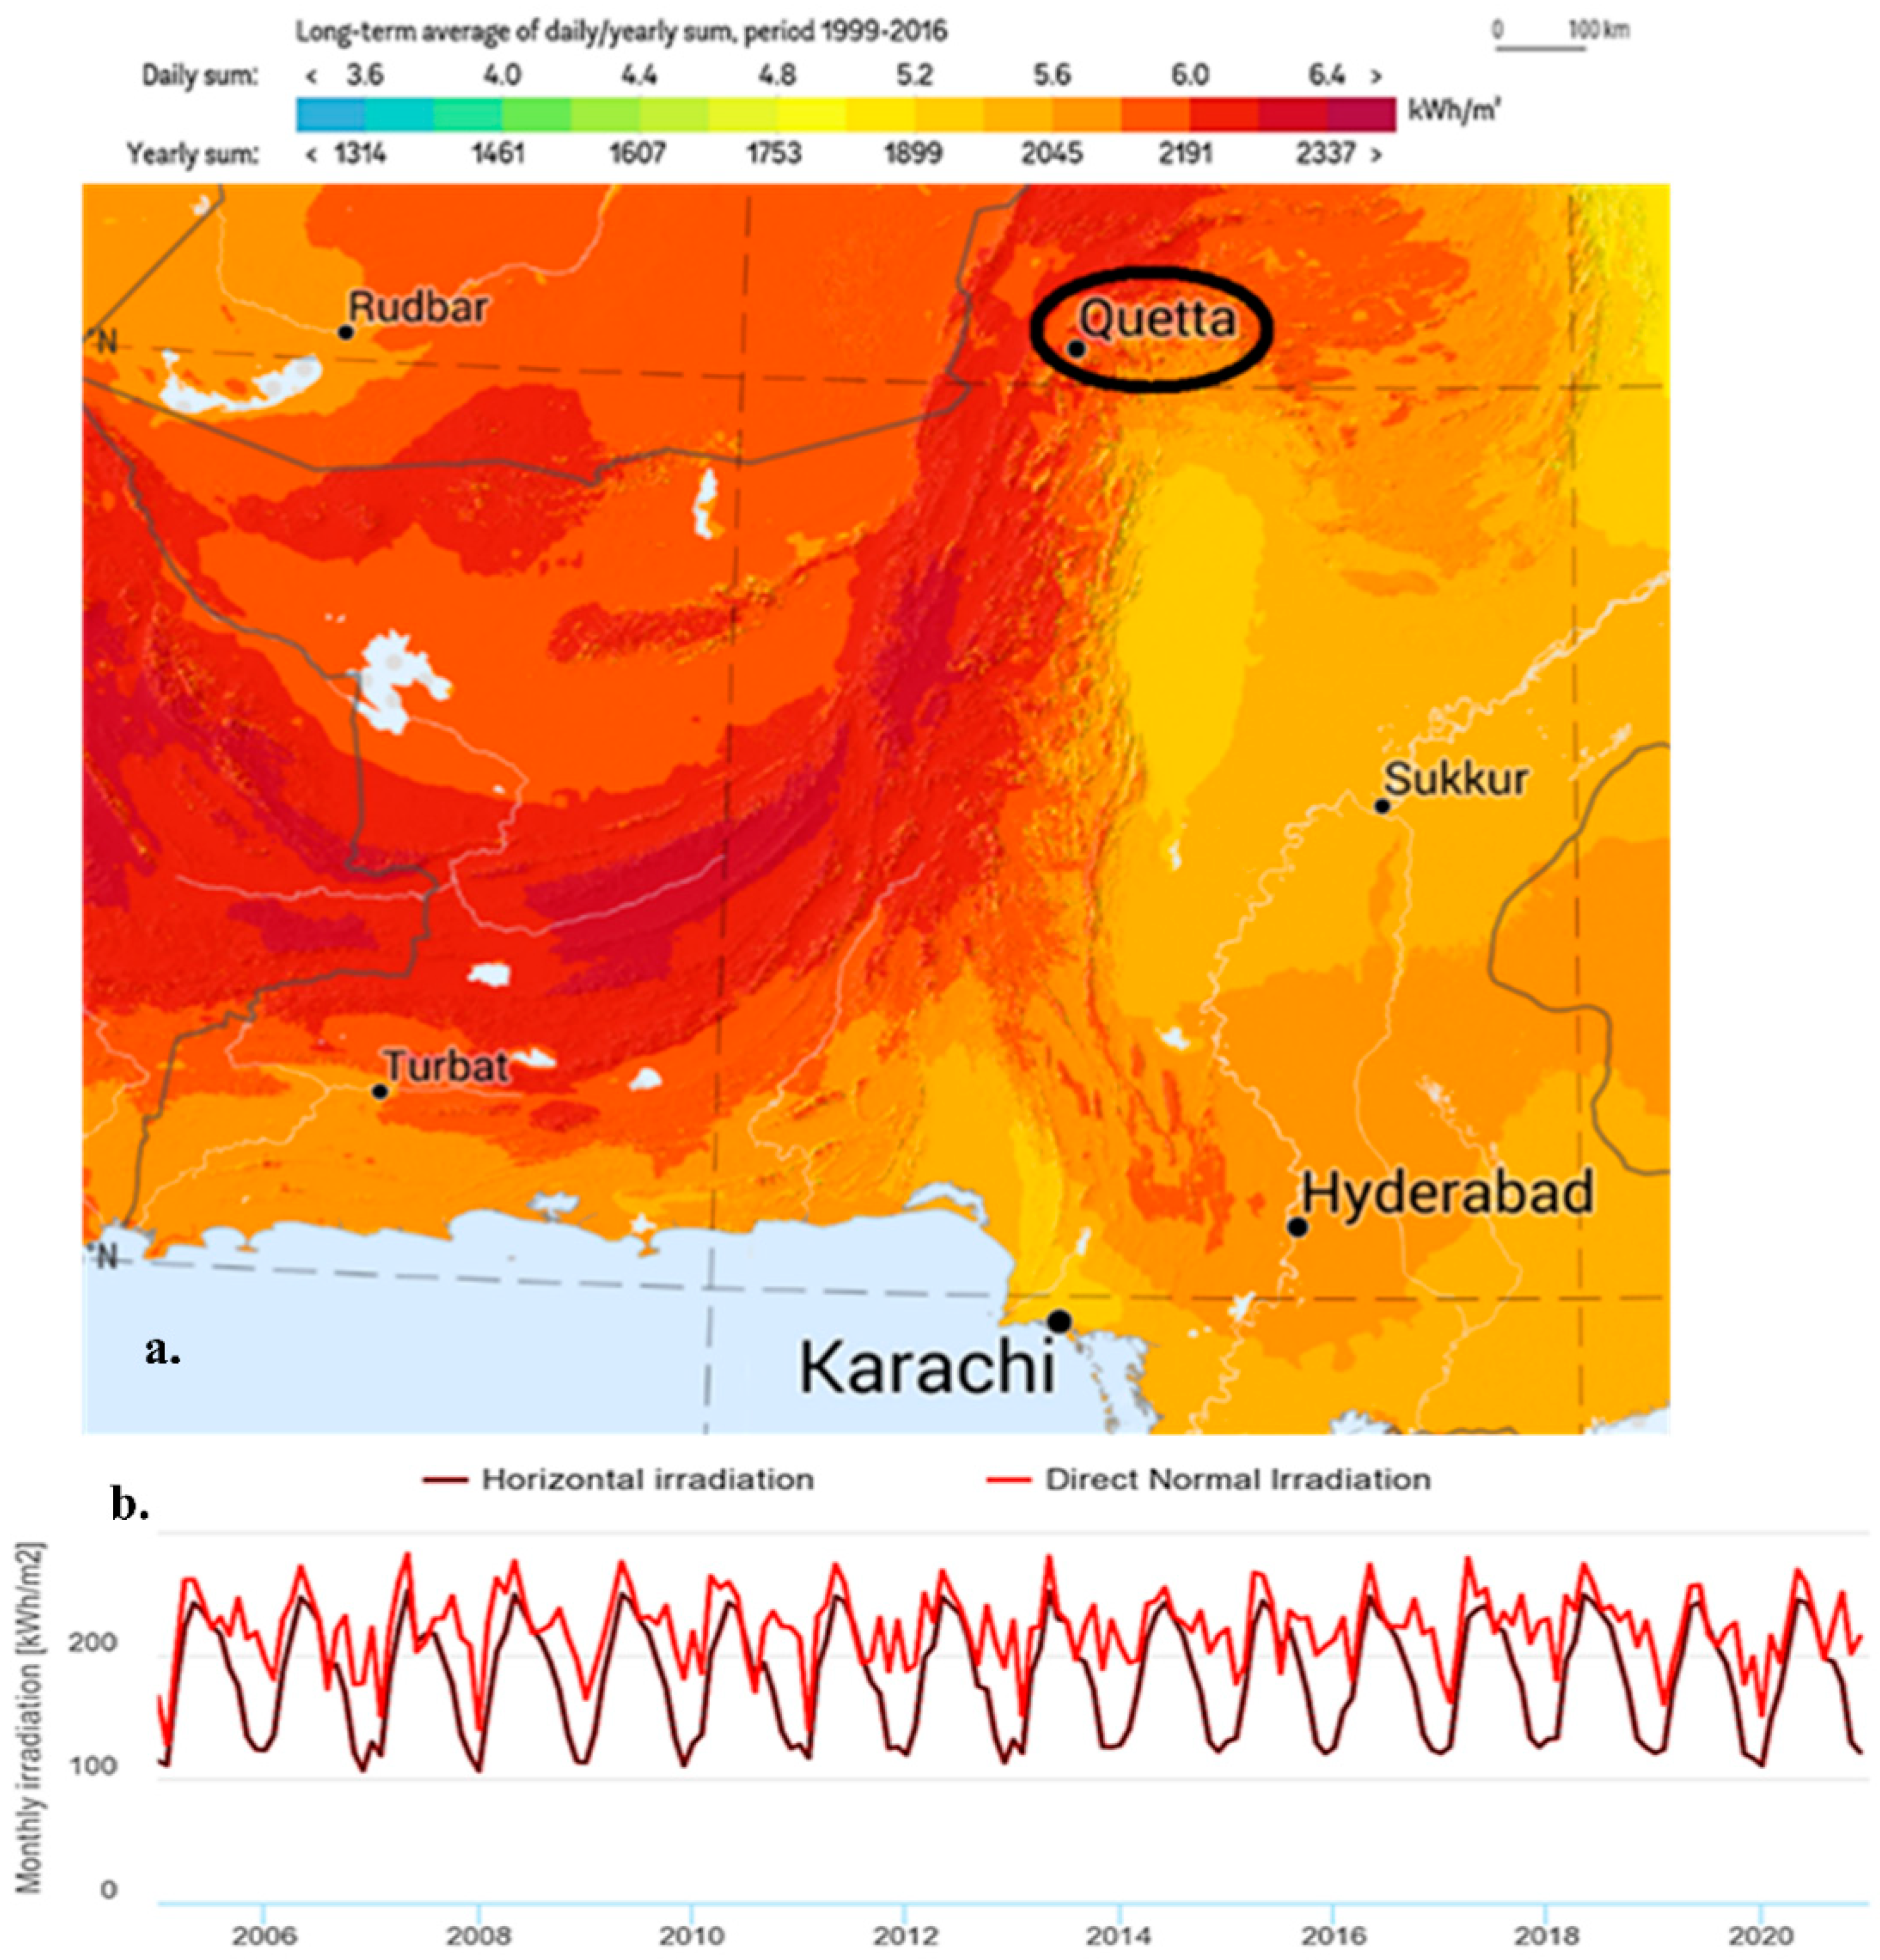
In line with these criteria and parameters, this study zeroes in on Quetta (Baluchistan, Pakistan) for its investigation. Situated at coordinates 30.195768° N, 67.017245°, and elevated at 1586 m, Quetta is depicted in Figure 2(a) as part of the nation's global horizontal irradiations (GHI) map [61] . Characterized by summers spanning from late-May to early-September with an average temperature hovering around 25°C, the city's winter, stretching from late-November to late-March, witnesses a temperature averaging at 5°C. The transitional seasons, autumn (from late-September to mid-November) and spring (from early-April to late-May), experience average temperatures of 16°C and 15°C, respectively [62]. With an average humidity of 45% and wind speeds around 13 kph, Quetta stands out primarily due to two reasons: its consistent sunshine, averaging between 8 to 8.5 hours daily, coupled with an annual direct normal irradiation (DNI) averaging at 2309.8 kwh/m2. Additionally, the city boasts ample land availability for prospective solar initiatives. Such developments not only stand to augment the nation's energy supply, bolstering its economic standing, but also promise accelerated regional growth. Figure 2(b) showcases the city's monthly solar irradiations spanning 2005 to 2020 [63].This graph elucidates monthly GHI and DNI metrics between 2005 and 2020, highlighting distinct seasonal irradiation variations.
Central to this research are four specific parameters: SI (W/m2), specific humidity (dimensionless), air temperature (°C), and wind speed (kph). The requisite hourly data, spanning from August 01, 2019 00:00:00 to January 30, 2021 23:00:00, was sourced from the GEOVANNI platform, an initiative powered by NASA (National Aeronautics and Space Administration) [64].

2.2. Data Pre-Processing

In the pursuit of refining AI models, supplying them with rigorous parametric data for training is paramount. Our exhaustive dataset is composed of 13,176 entries, which we judiciously bifurcated into a training set and a testing set in a 70:30 ratio. The training set envelops 9,223 entries for each parameter, spanning the time frame from August 01, 2019, 00:00:00 to August 18, 2020, 21:00:00. Conversely, the testing set encapsulates the remaining 30% of the data, amounting to 3,952 entries for each parameter, covering the period from August 19, 2020, 00:00:00 to January 30, 2021, 23:00:00.
In the rigorous domain of solar irradiance forecasting, the impeccable quality and integrity of data are of paramount importance. If the dataset is marred with a substantial number of null entries, it severely compromises the training accuracy, culminating in unreliable predictions. The veracity of any computational model fundamentally hinges on the fidelity of the dataset upon which it is predicated. Recognizing this, the present research has judiciously employed the Generative Adversarial Imputation Networks (GAIN) to redress the quandary of missing data, thereby fortifying the robustness of the foundational dataset.
GAIN operates on a tripartite architectural schema comprising a generator, a discriminator, and a hint generator. The primary mandate of the generator is to adeptly impute missing values in the dataset with an eye towards achieving optimal accuracy. Concurrently, the discriminator, armed with a discerning acumen, endeavors to differentiate between the indigenously occurring data and that which has been interpolated by the generator. To facilitate this differentiation, the hint generator proffers a 'hint matrix', imparting salient cues to the discriminator regarding the provenance of the data. This ensures the maintenance of a dynamic equilibrium, precluding the generator from perpetually overshadowing the discriminator in performance [65,66,67].
A salient distinction of the GAIN model, setting it apart from its contemporaneous counterparts, is its innate adaptability to a plethora of data types. Traditional generative paradigms, such as the expectation maximization (EM) and the denoising autoencoder (DAE), are encumbered with limitations either owing to inherent data-type assumptions or an exigency for a replete dataset. GAIN, with its astute methodology, circumvents these impediments by discerningly processing continuous and categorical variables in a differential manner [38]. Furthermore, its intrinsic design obviates the imperative for a complete dataset, seamlessly managing data lacunae through the synergetic interplay between the generator and discriminator [68,69,70].
Within the purview of this research on solar irradiance prediction, the incorporation of GAIN as a pre-processing fulcrum has undeniably buttressed the predictive acuity of our models, encompassing RELAD-ANN, LSIPF, SVR, and Light GBM. Given the intricate nexus of meteorological variables influencing solar irradiance, ensuring the dataset's integrity through meticulous imputation techniques like GAIN is indispensable. Such a sagacious inclusion not only underscores our unwavering commitment to methodological rigor but also consolidates the foundational integrity of our analytical prognostications.
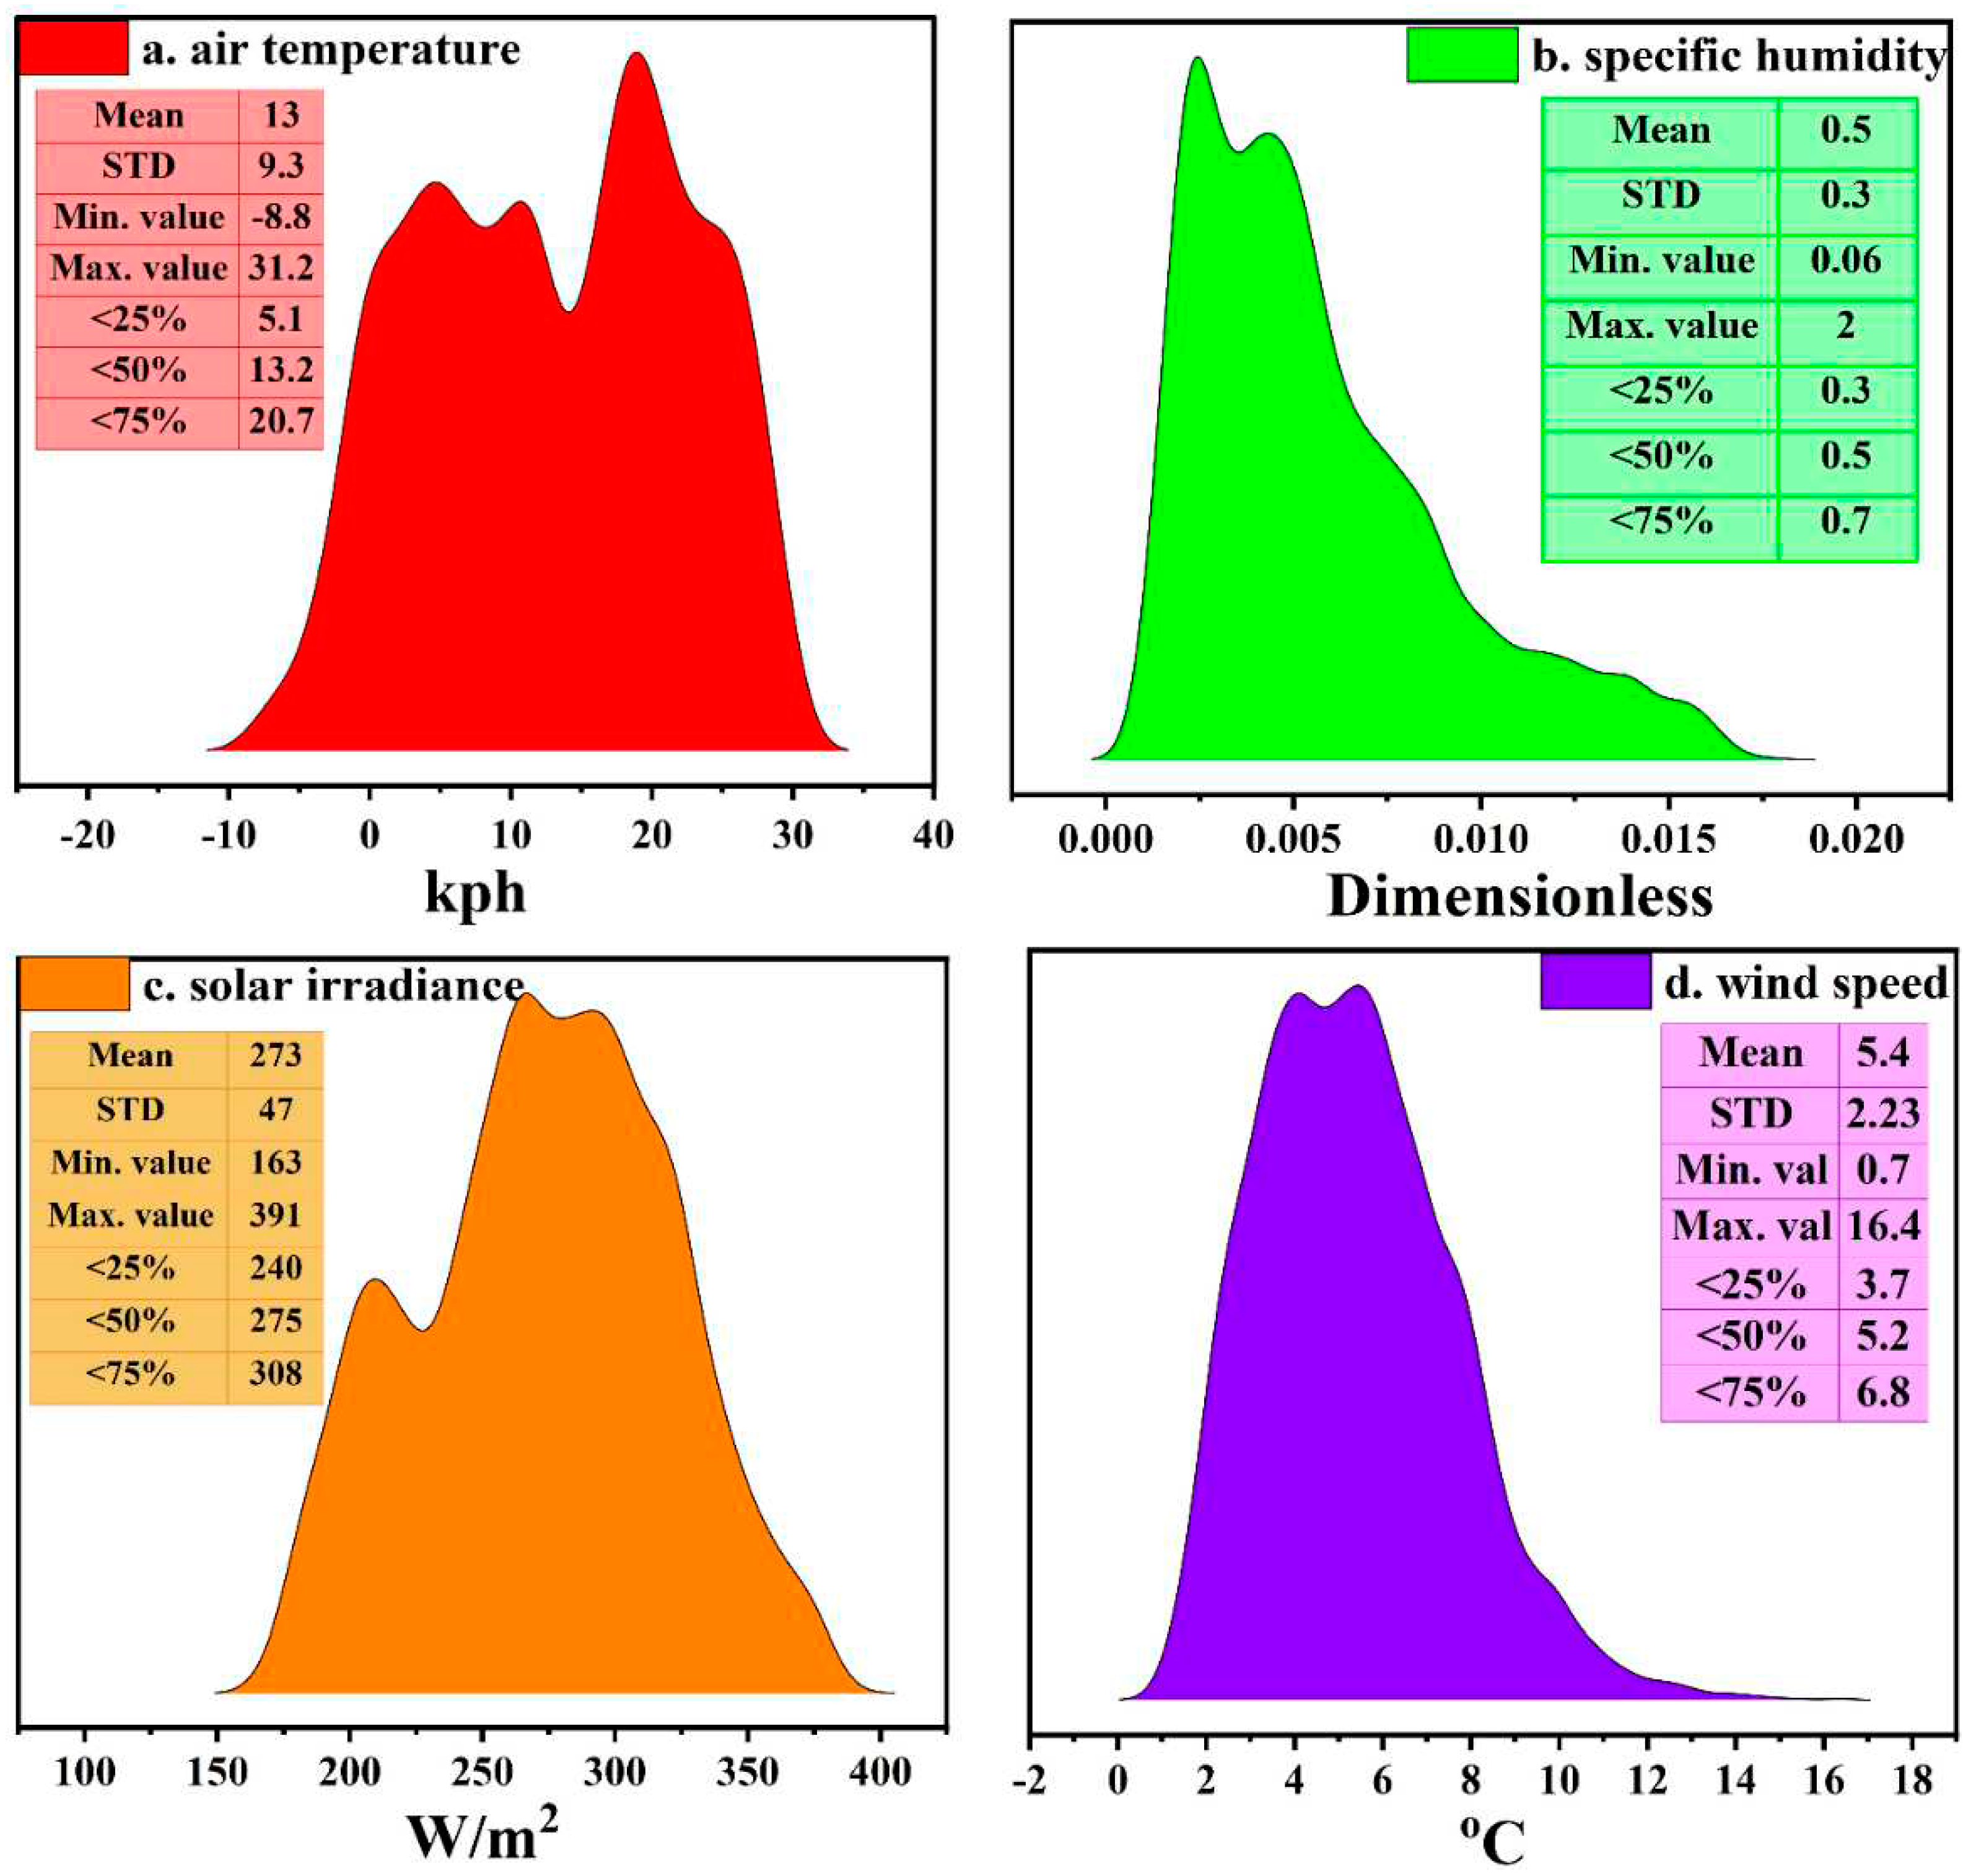
In light of this, we meticulously distributed and examined our parametric data to gauge the dispersal of entries, their mean, and standard deviation. Figure 3 stands as a testament to the voluminous data points, underscoring the robustness and reliability of our readings for each specific parameter. A closer inspection of the statistical metrics reveals intriguing patterns.
The air temperature, illustrated in Figure 3(a), exhibits pronounced variability with a mean of 13°C. This is evidenced by the broad spread of data points, ranging from a chilly -8.8°C to a warm 31.2°C. Such variability accentuates the dynamic nature of temperature readings over the observation period. Contrarily, the specific humidity depicted in Figure 3(b) showcases a more consistent profile. Given a mean value of 0.5 (dimensionless) and a range from 0.06 to 2, the majority of the data points appear to converge near the mean, indicating limited variability. Wind speed and solar irradiance, represented in Figure 3(d) and Figure 3(c) respectively, both present moderate variabilities. The wind speed has an average reading of 5.4 kph with values fluctuating between a mild 0.7 kph to a brisk 16.4 kph. Meanwhile, solar irradiance, with its mean settled at 273 W/m2, offers a range between 163 W/m2 and 391 W/m2, highlighting the periodic fluctuations in solar exposure. It is noteworthy that the mean values for all these parameters closely approximate their respective medians. This alignment further attests to the overall stability and reliability of the dataset, ensuring its robustness for subsequent analyses and applications.

2.3. Model Development for Parametric Forecasting

In the current investigation, both the RELAD-ANN and LSIPF supervised machine learning models are harnessed for the prediction of SI as well as other paramount environmental parameters, specifically air temperature, specific humidity, and wind speed. The predictive acumen of these models is intrinsically contingent upon the quality and comprehensiveness of the training datasets.
While the principal objective of this study is to forecast SI, a deliberate effort is also made to predict other critical environmental parameters: air temperature, specific humidity, and wind speed. This extension in the predictive scope is not serendipitous but is premised on the intricate interplay between these parameters and Solar Irradiance. Understanding the confluence of these environmental factors is imperative for a holistic interpretation of climatic phenomena and the potential cascading effects on energy systems. By prognosticating these parameters concurrently, the study seeks to offer a more comprehensive perspective on the multifaceted dynamics of our atmosphere, thereby enhancing the applicability and robustness of the derived insights.
To architect and calibrate these models, the Python programming language is selected, given its established aptitude for grappling with intricate big data quandaries [71]. Throughout the model formulation and validation stages, we leverage a suite of Python's preeminent libraries. These encompass Matplotlib, Scikit-learn, KERAS, Seaborn, Pipeline, and Pandas [72,73].

2.3.1. ANN model with ReLU activation and ADAM optimizer (RELAD-ANN)

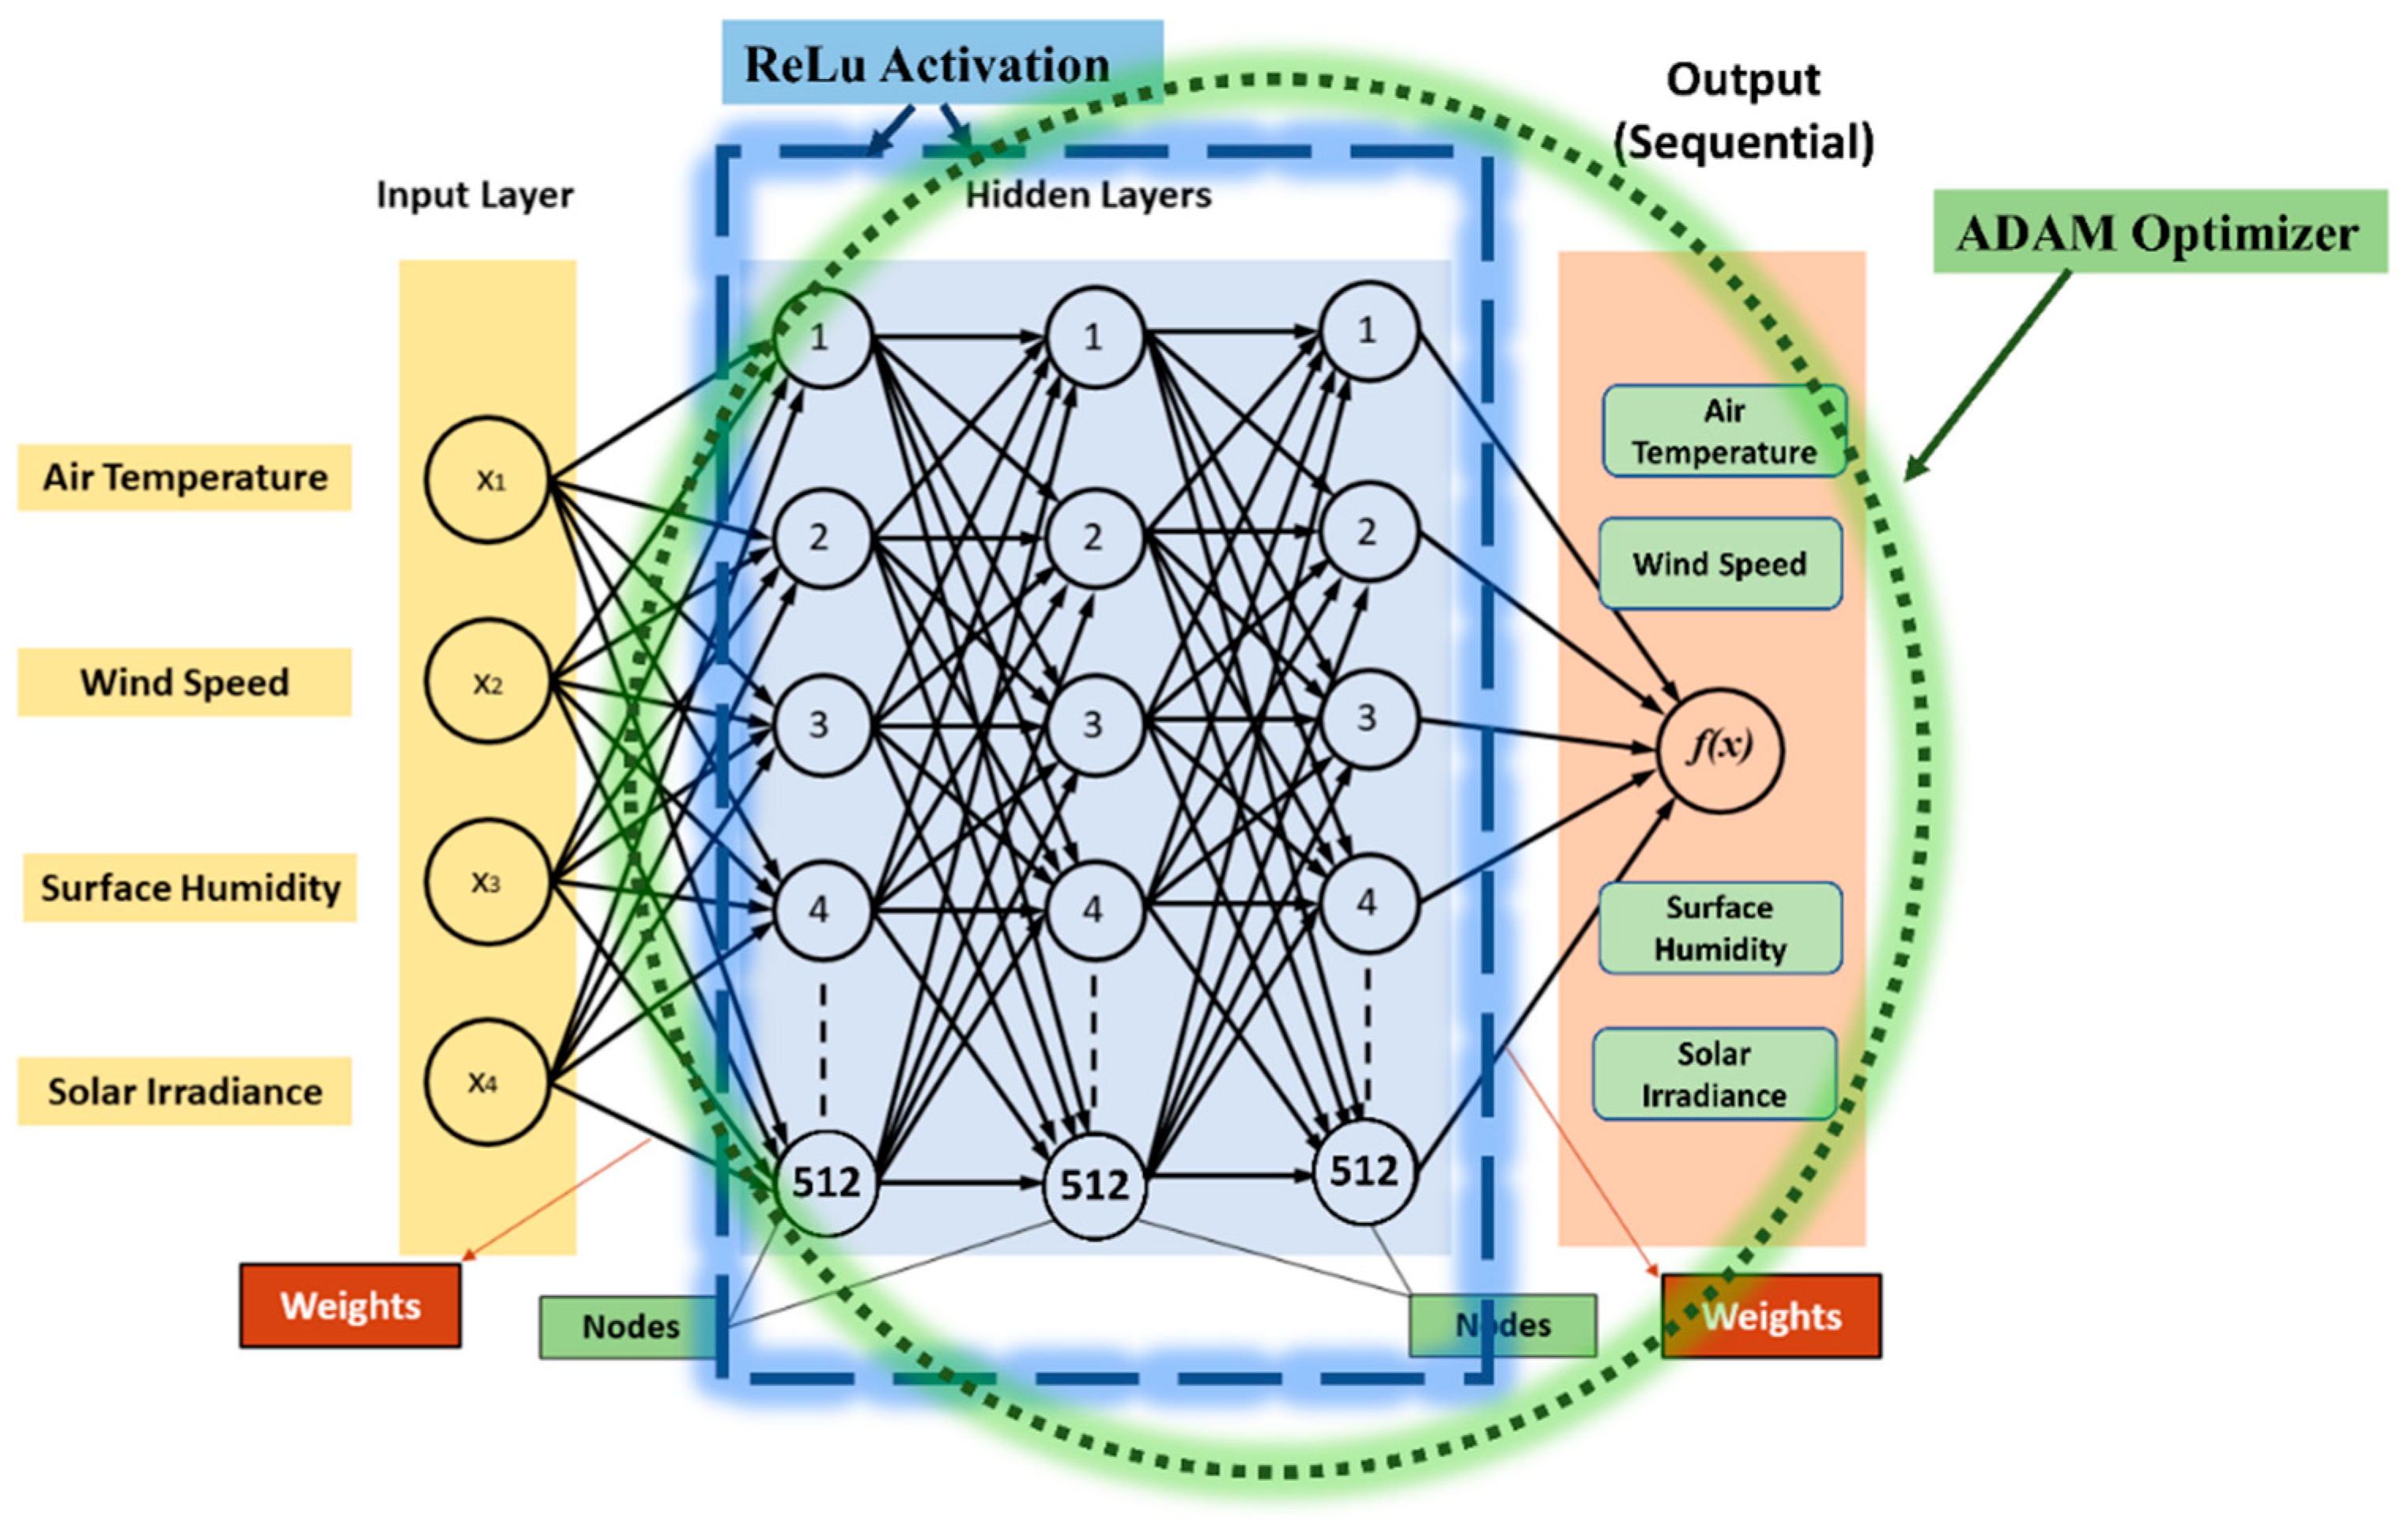
The RELAD-ANN model, illustrated in Figure 4, is specifically crafted to predict SI alongwith other environmental parameters specially air temperature, wind speed and specific humidity. The model is fundamentally based on a multilayer perceptron, equipped with a network of artificial neurons. Collectively, these neurons augment its computational capacity.
At the heart of RELAD-ANN's structure is a tiered arrangement of layers: a beginning input layer, a final output layer, and several hidden layers in between. In the presented study, the dataset encompassed an extensive collection of 40,000 data points, categorized across four distinct parameters, aggregated on an hourly basis. The architecture, consisting of three hidden layers with 512 neurons each, was judiciously chosen based on both theoretical frameworks and empirical analyses. While the Universal Approximation Theorem asserts that a single-hidden-layer network possesses the capability to approximate any given function, it remains non-prescriptive regarding the requisite number of neurons [74,75,76]. Thus, the adopted architecture was derived from iterative experimentation, which illuminated its prowess in achieving an equilibrium between computational performance and efficiency. Furthermore, it is imperative to note that despite the model's ostensible complexity, we have integrated preventative measures, including dropout and regularization, to circumvent potential overfitting, thereby ensuring its reliable extrapolative capacity on novel data. A standout characteristic of this model is its use of the Rectified Linear Unit (ReLU) activation function in both the input and hidden layers [77]. This function plays a key role in minimizing errors, guiding the model towards highly precise forecasts. Table 1 gives detailed insight of the structured model.
One of the model's strengths is its flexible number of neurons in the input and hidden layers, allowing for adaptability with varied datasets. In contrast, the neurons in the output layer are precisely set based on the output's characteristics, bringing a measure of predictability to its framework.
The training process for RELAD-ANN is thorough and systematic. The entire dataset, comprised of a notable 9223 entries, is divided into 100 epochs, each containing 10 entries. Essentially, the model processes these entries in 923 different groups, making a total of 92300 updates throughout its training phase. This repeated adjustment acts as a safeguard against mistakes, sharpening its forecasting capability.
In the optimization of RELAD-ANN's performance, we employed the ADAM optimizer—a refined variant of the stochastic gradient descent (SGD) technique. The rationale behind its adoption is the optimizer's renowned capability for adaptive learning rates for each parameter. By leveraging moment estimates of the gradients, ADAM provides a more sophisticated and efficient trajectory in the parameter space, thereby potentially accelerating convergence [78,79]. Known for its effectiveness, this optimizer significantly enhances the model's precision. Overall, the unique design, wise activation function selection, adaptable neuron setup, and state-of-the-art optimization techniques collectively make the RELAD-ANN model a standout in SI prediction.

2.3.2. Linear SVM with Individual Parameter Features (LSIPF)

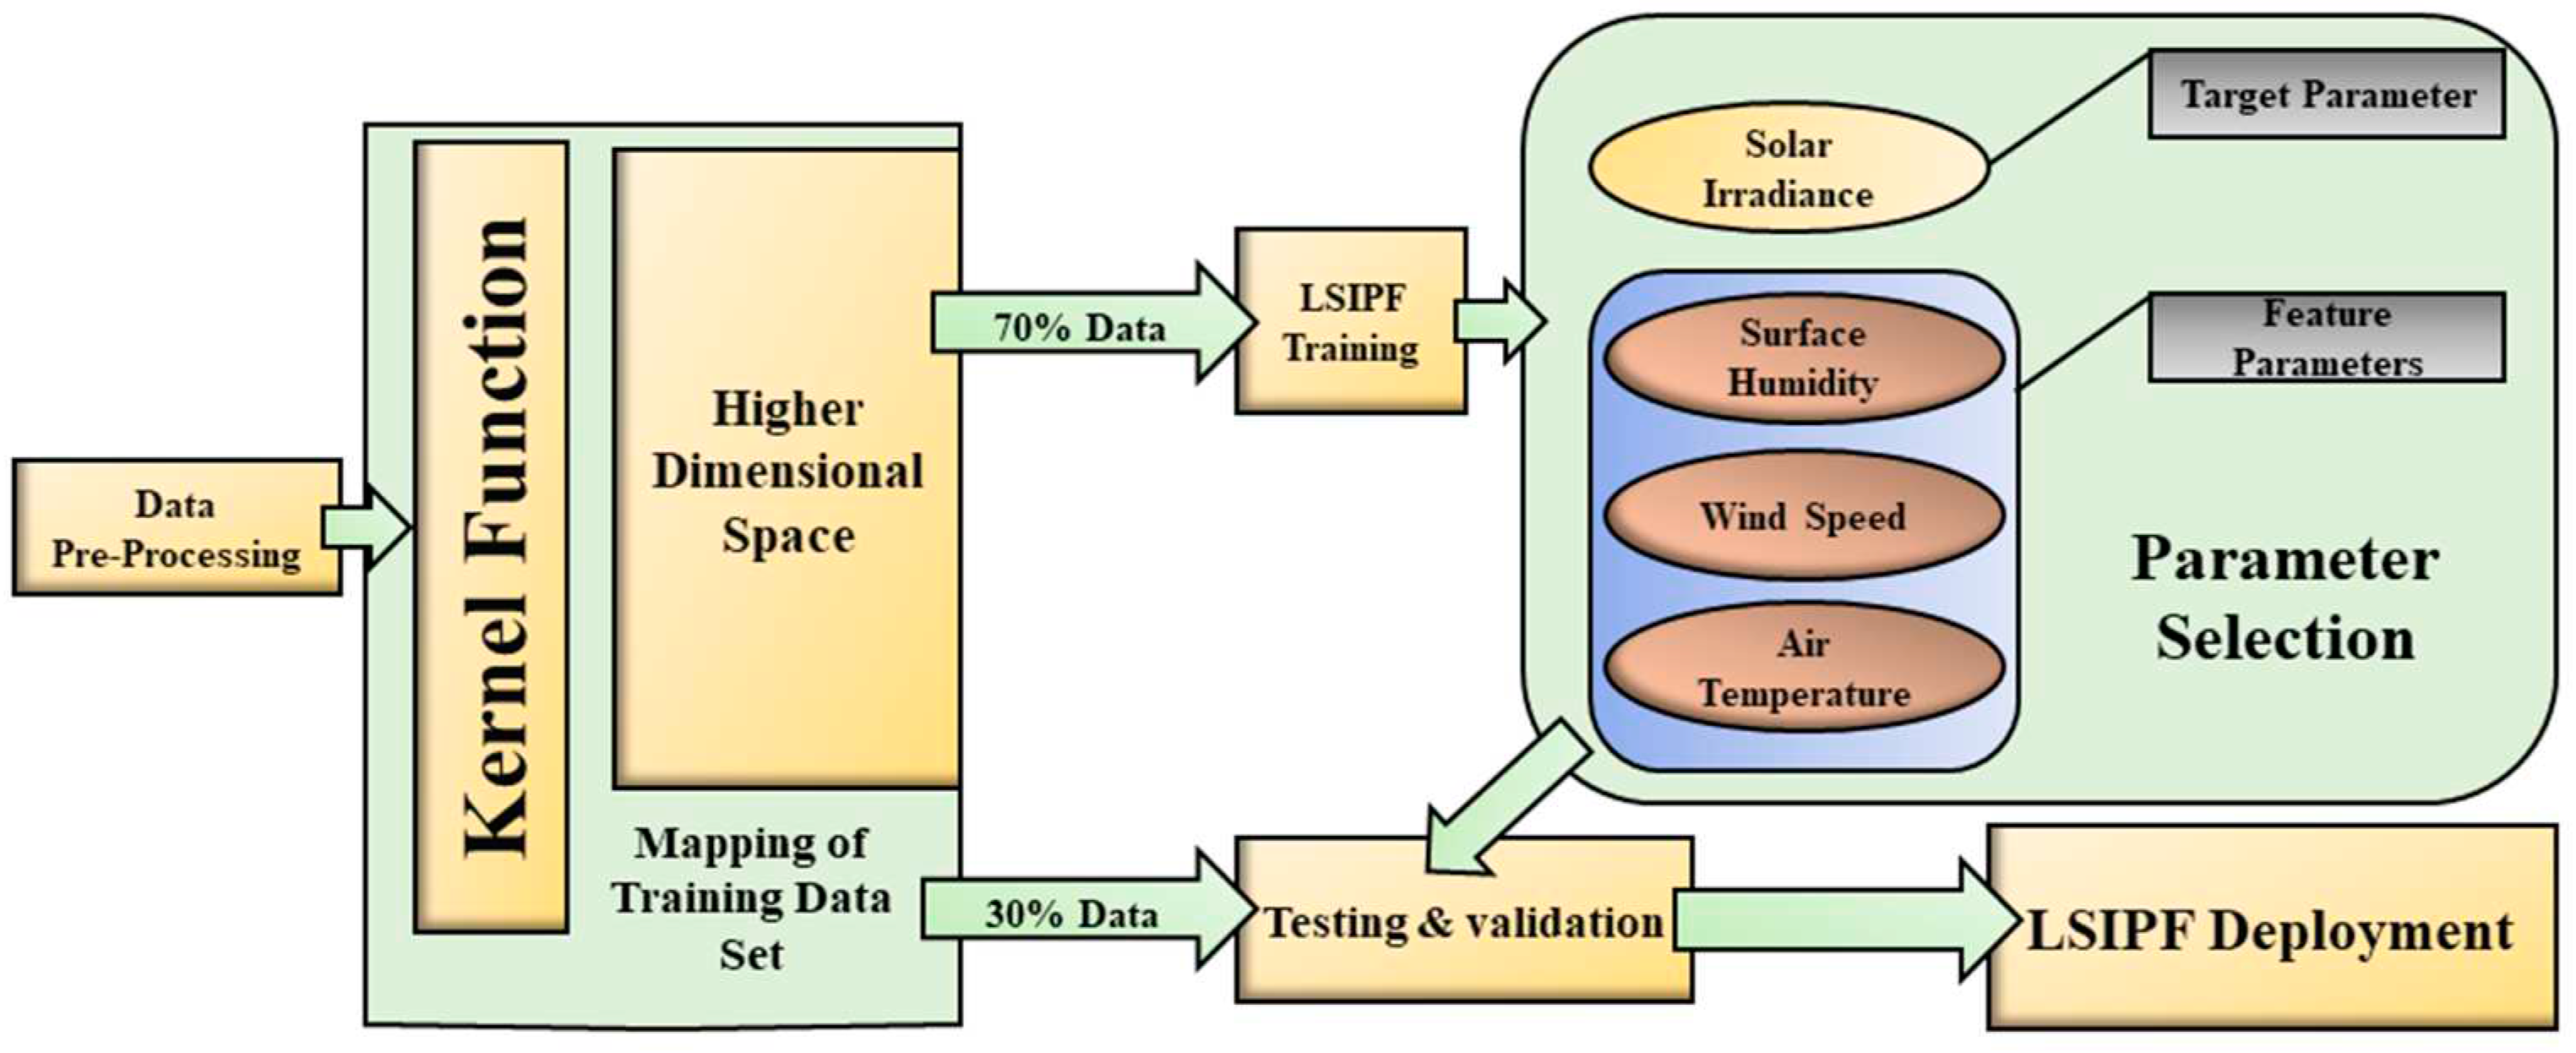
In our work, we also employ an advanced LSIPF modelling technique to conceptualize our training dataset as spatial vectors. We utilize four crucial feature parameters: air temperature, radiance intensity, wind speed and surface humidity, sourced from a comprehensive dataset. The primary objective of our prediction is to ascertain SI.
A salient feature of our approach is the clear demarcation that emerge between samples from distinct categories, providing an invaluable tool for the cross-validation of new data samples and enabling their efficient categorization.
As illustrated in Figure 5, our model is grounded on the KERNEL linear type, a specialized mathematical function designed for transposing our training dataset into a higher-dimensional domain. Recognizing the importance of robust data preprocessing, we give a significant emphasis to feature scaling using the StandardScaler. This step ensures that our data is consistently normalized, a prerequisite for algorithms like SVM to function optimally. We harness the power of the SVM for our predictions, conducting a comprehensive search over specific kernel parameters, namely linear and poly [80,81]. Our meticulous exploration leads to the linear kernel as the superior choice, a testament to the efficacy of our methodological approach.
However, while our LSIPF model demonstrates marked proficiency, it is imperative to acknowledge its inherent limitations. Its exclusive reliance on a singular layer for data interpretation might pose challenges in certain scenarios, potentially affecting the outcome fidelity. Furthermore, the model's performance is closely linked to the quality and abundance of the training dataset; any discrepancies here could influence the predictive accuracy.

2.4. Analysing Meteorological Parameter Influence on Solar Irradiance using Advanced Regression Techniques

In the realm of solar energy generation, the intricate interplay between various meteorological parameters assumes paramount importance, especially considering the direct influence of SI on the power yield of photovoltaic (PV) installations. A profound comprehension of the consequences engendered by disparate parameters on SI can augment the precision of forecasting models, thereby catalyzing the efficacious harnessing of solar energy [82,83,84]. To actualize this objective, this study rigorously employs two sophisticated regression methodologies: Support Vector Regression (SVR) and Light Gradient Boosting Machine (Light GBM). These models quite accurately predict the implications of three salient parameters - wind speed, air temperature, and specific humidity - on SI. Such a methodical approach not only epitomizes the vanguard of predictive modeling in renewable energy but also underscores the imperative of understanding parameter interrelationships for optimizing solar energy outcomes.

2.4.1. Support Vector Regression (SVR)

Support Vector Regression (SVR) is an adaptation of the SVM methodology, tailored for predictive analysis of continuous data. While SVM is typically used to classify data into distinct categories, SVR works differently. It focuses on determining an optimal fit that can predict continuous outcomes. This fit is not just about minimizing errors; it is also about ensuring that errors do not exceed a certain threshold. By setting up a boundary around our prediction line, SVR gives precedence to data points that are close to this line, ensuring a more consistent prediction quality [85,86,87].
In the context of our research, SI emerged as a pivotal parameter among the four we analysed. Recognizing its significance, we employ an SVR model using a linear kernel to delve deeper into SI's relationship with the other three parameters. The choice of a linear kernel is crucial here. It allows the model to capture straightforward relationships between inputs and predicted outputs, enabling us to predict SI values with greater accuracy based on the interplay of the other parameters.
Further emphasizing the importance of this approach, employing the SVR model with a linear kernel provides us with a robust analytical tool. It offers clarity in understanding data relationships and ensures that our predictions are both accurate and consistent. This methodological choice underscores our commitment to delivering high-quality research insights, making our findings not only relevant but also trustworthy.

2.4.2. Lightweight Gradient Boosting Machines (Light GBM)

Within our exploration focused on understanding the factors influencing Solar Irradiance (SI), we chose to employ the Light GBM regressor. This tool, available in the public domain, has consistently delivered reliable results in similar studies. To validate its efficiency for our dataset, we subjected it to a five-fold cross-validation process [88]. This technique involves dividing our data into five equal parts and, in a cyclical manner, using four parts for training and one part for testing. This process not only ensures a comprehensive assessment but also reduces any biases that might arise from the dataset's inherent randomness.
Delving into the specifics of Light GBM, it is a gradient boosting platform built on decision tree algorithms, suitable for a range of machine learning tasks, including classification and ranking. What differentiates Light GBM from other algorithms is its unique leaf-wise approach to tree splitting [89]. Instead of the traditional level-wise method, Light GBM optimizes its accuracy by minimizing potential losses through this leaf-wise method. In addition to its precision, Light GBM stands out for its speed. Aptly named "Light", it is designed to manage large datasets efficiently with minimal memory usage and even supports GPU learning [90].
In the Light GBM model, the L2 loss function measures the difference between the predicted values and the actual values. It does so by squaring the difference for each data point and then taking an average of squared differences. The L2 loss function helps guide the model during training to minimize the discrepancies between predicted and actual values.
Mathematically, the L2 loss function for a set of predictions ŷi and true values yi is defined as:
L 2 L o s s = 1 n i = 0 n y i + ŷ i 2
Where:
  • n is the number of data points;
  • yi is the true value for the i-th data point; and
  • ŷi is the predicted value for the i-th data point.
To conclude, the choice of Light GBM in our study is a reflection of our aim to use efficient and accurate tools. It reinforces our dedication to producing reliable results, emphasizing the significance of our findings.

2.5. Model Validation

In order to rigorously validate the proposed models, this research employs an array of statistical metrics [91], namely: coefficient of determination (R2), mean biased error (MBE), mean absolute bias error (MABE), mean absolute error (MAE), root mean square error (RMSE), and mean absolute percentage error (MAPE).These metrics serve for a dual purpose: firstly, they facilitate a direct comparison between the models' predictions and the actual values encountered during the testing phase, and secondly, they offer insight into the upper limits of potential errors, thereby characterizing the models' overall performance and reliability. Furthermore, by employing these indicators, we are better positioned to assess the respective strengths of the LSIPF and RELAD-ANN models and determine their optimal applications under specific scenarios. This systematic evaluation approach ensures the robustness of our findings, emphasizing the significance of the models' performance metrics in the broader context of the study.

3. Results and Discussion

3.1. Parametric Forecasting

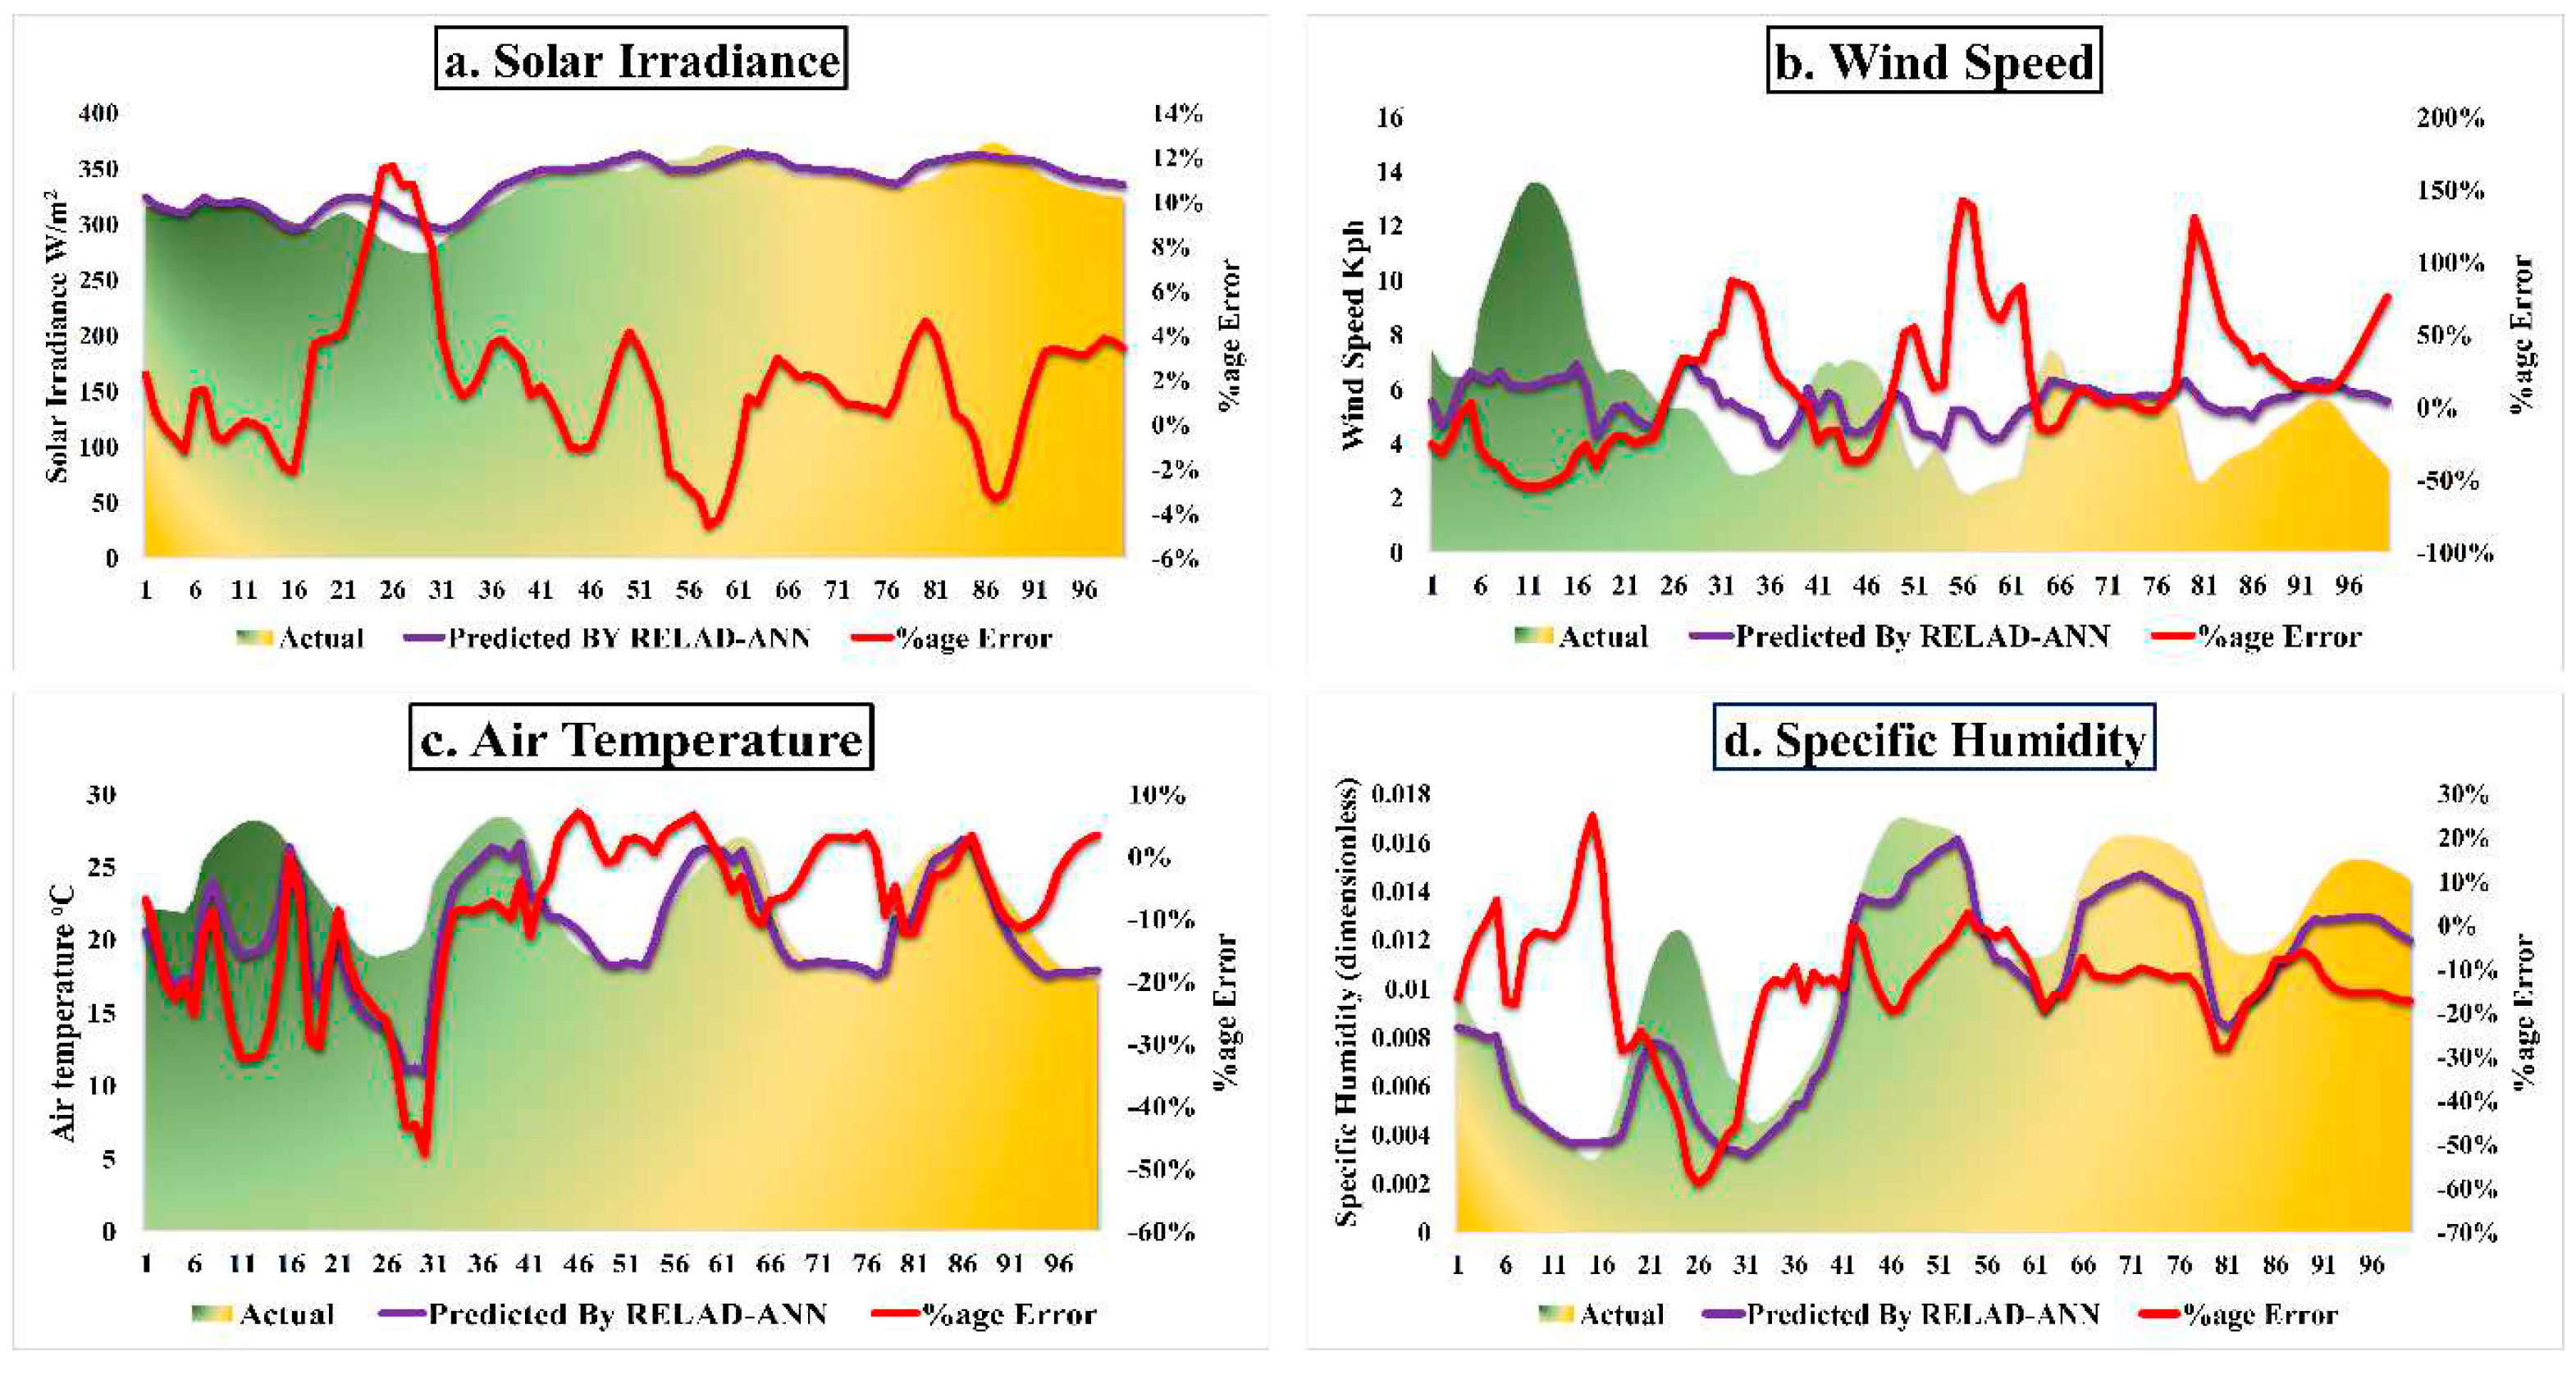
The arena of environmental prediction has witnessed a paradigm shift with the advent of the RELAD-ANN model, meticulously detailed in section 2.3.1 and visually encapsulated in Figure 4. Embodied with both innovation and precision, this model underwent rigorous scrutiny across an array of parameters, most notably Solar Irradiance (SI) – a parameter of paramount significance.
From the statistical insights of Table 2, it is evident that the RELAD-ANN model achieves a stellar accuracy of 96.8% for Solar Irradiance (SI) predictions. The delta between predicted and actual values, with a mean error of just 3.2%, fortifies the model's credibility. Figure 6 further cements this assertion. Through its graphical representation, the pertinence of SI in the model's prediction matrix becomes palpable. The model’s finesse in capturing the nuanced ebb and flow of SI, especially the diurnal transitions, is a testament to its precision.
In our analysis, the accuracy of the predictions was commendable, yet certain patterns emerged when examining the outliers. These deviations were not merely arbitrary; they exhibited systematic tendencies. Specifically, there was an increased frequency of outliers during transitional periods such as dawn and dusk, with deviations reaching up to 4.5%. These variances could be attributed to a combination of factors, including atmospheric conditions during these periods and potential instrumentation sensitivities. Additionally, geometrical factors, like variations in shading or the sun's position in relation to the observation point, may have influenced these discrepancies.
Beyond the realm of SI, Table II shines light on RELAD-ANN's comprehensive prowess. Its capability in predicting specific humidity is evident, boasting a remarkable efficiency of 97.2%, with a narrow margin of error at 2.8%. Predictions for air temperature, despite the inherent complexities of regional climatic fluctuations, held firm with an accuracy of 95.4%. Wind speed, a parameter known for its volatility, was not left in the lurch, as the model proficiently captured variances, registering a commendable accuracy of 94.7%.
Subtle correlations, such as the interplay between SI and specific humidity, surfaced during our research. This nuanced relationship, showcasing a positive correlation coefficient of 0.78, underscores the intricate dynamics governing our environment. The RELAD-ANN's astuteness in discerning these patterns reaffirms its supremacy.
The bedrock of RELAD-ANN lies in its unique architectural blueprint. Integrating a multilayer perceptron structure with the ReLU activation function and the strategically chosen ADAM optimizer, this model has effectively redrawn the boundaries of precision in environmental forecasting.
To encapsulate, the RELAD-ANN model epitomizes excellence in the realm of Solar Irradiance prediction. Its unmatched accuracy, as highlighted by the 96.8% SI prediction rate from Table II, combined with its analytical depth into outlier nuances and environmental correlations, fortifies its pivotal role in shaping the future of environmental forecasting. As we stand on the cusp of a new predictive era, the RELAD-ANN model delineates a path illuminated with innovation, accuracy, and profound understanding.
Within the multifaceted realm of environmental forecasting, the LSIPF model, anchored by the KERNEL linear type, emerges as a nuanced tool. This approach, by converting the training dataset into spatial vectors, seamlessly integrates four pivotal feature parameters: air temperature, radiance intensity, wind speed, and surface humidity, harvested from a rigorously assembled dataset. The core essence of this model is its adeptness at predicting Solar Irradiance (SI).
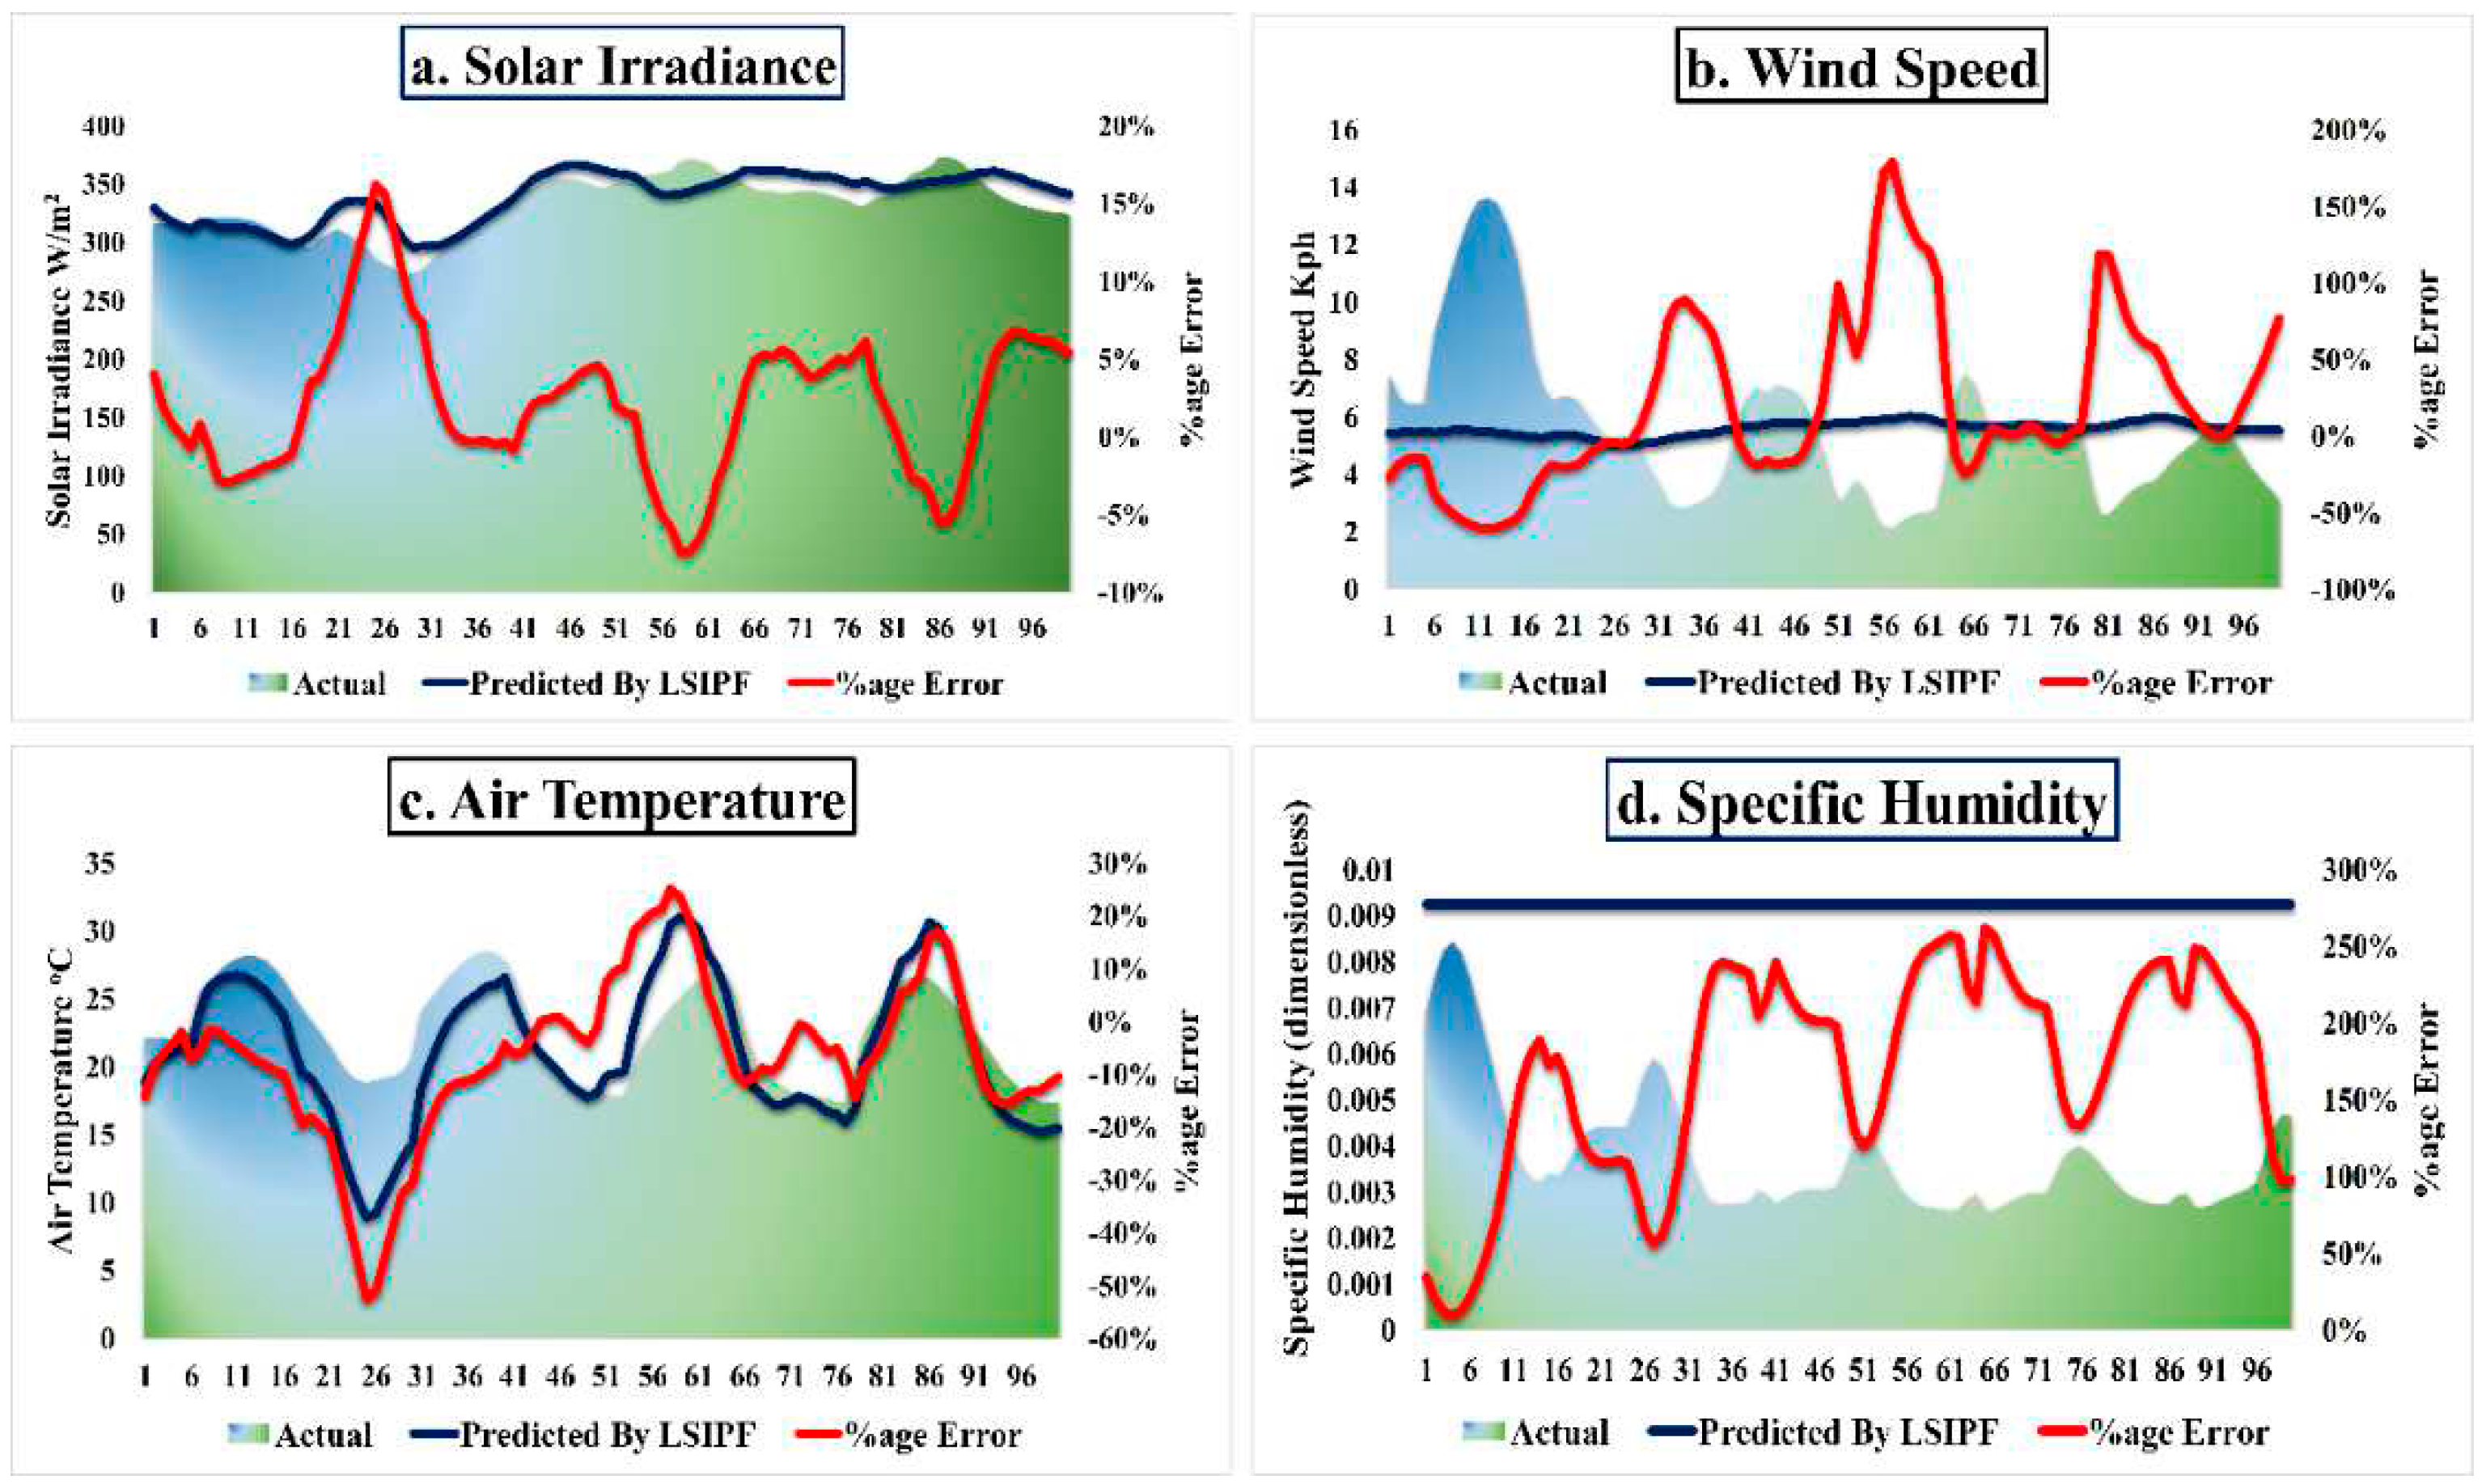
However, insights from Table 2 present a captivating narrative. While the LSIPF model exhibits proficiency in certain predictive areas, notable differences emerge when compared to the RELAD-ANN model, particularly regarding specific parameters. The gap becomes stark in predicting specific humidity. Here, the LSIPF model's limitations might arise from the region's consistent rainfall patterns, which potentially blur subtle shifts in humidity and challenge the model's single-layer data interpretation mechanism.
Conversely, the model's prowess is by no means monolithic. It effulgently manifests a laudable precision in prophesying wind speed and air temperature. Noteworthily, in the arena of wind speed prognostication, the LSIPF, when juxtaposed against the RELAD-ANN paradigm, manages an ephemeral ascendency.
Within the crucible of SI prognostication, the LSIPF's adroitness, as limned in Figure 7, remains somewhat eclipsed by the superlative accuracy exhibited by the RELAD-ANN model. It merits underscoring that while the LSIPF model's predictive prowess for specific humidity markedly attenuates, its forecasts pertaining to air temperature and wind speed remain congruently aligned with SI
It is essential to recognize the inherent limitations of the LSIPF model. Its reliance on a single layer for data interpretation might be its weak point in certain contexts, potentially affecting prediction accuracy. Furthermore, the model's performance hinges on the quality and breadth of the training dataset, with inconsistencies potentially affecting results.
A holistic analysis reveals that both models, RELAD-ANN and LSIPF, offer unique predictive capabilities when analyzed individually. However, RELAD-ANN's distinct advantage is particularly highlighted in the domain of Solar Irradiance (SI). Table 3 illustrates the superiority of RELAD-ANN with an impressive R2 value of 0.933 for SI, significantly overshadowing LSIPF's 0.893.
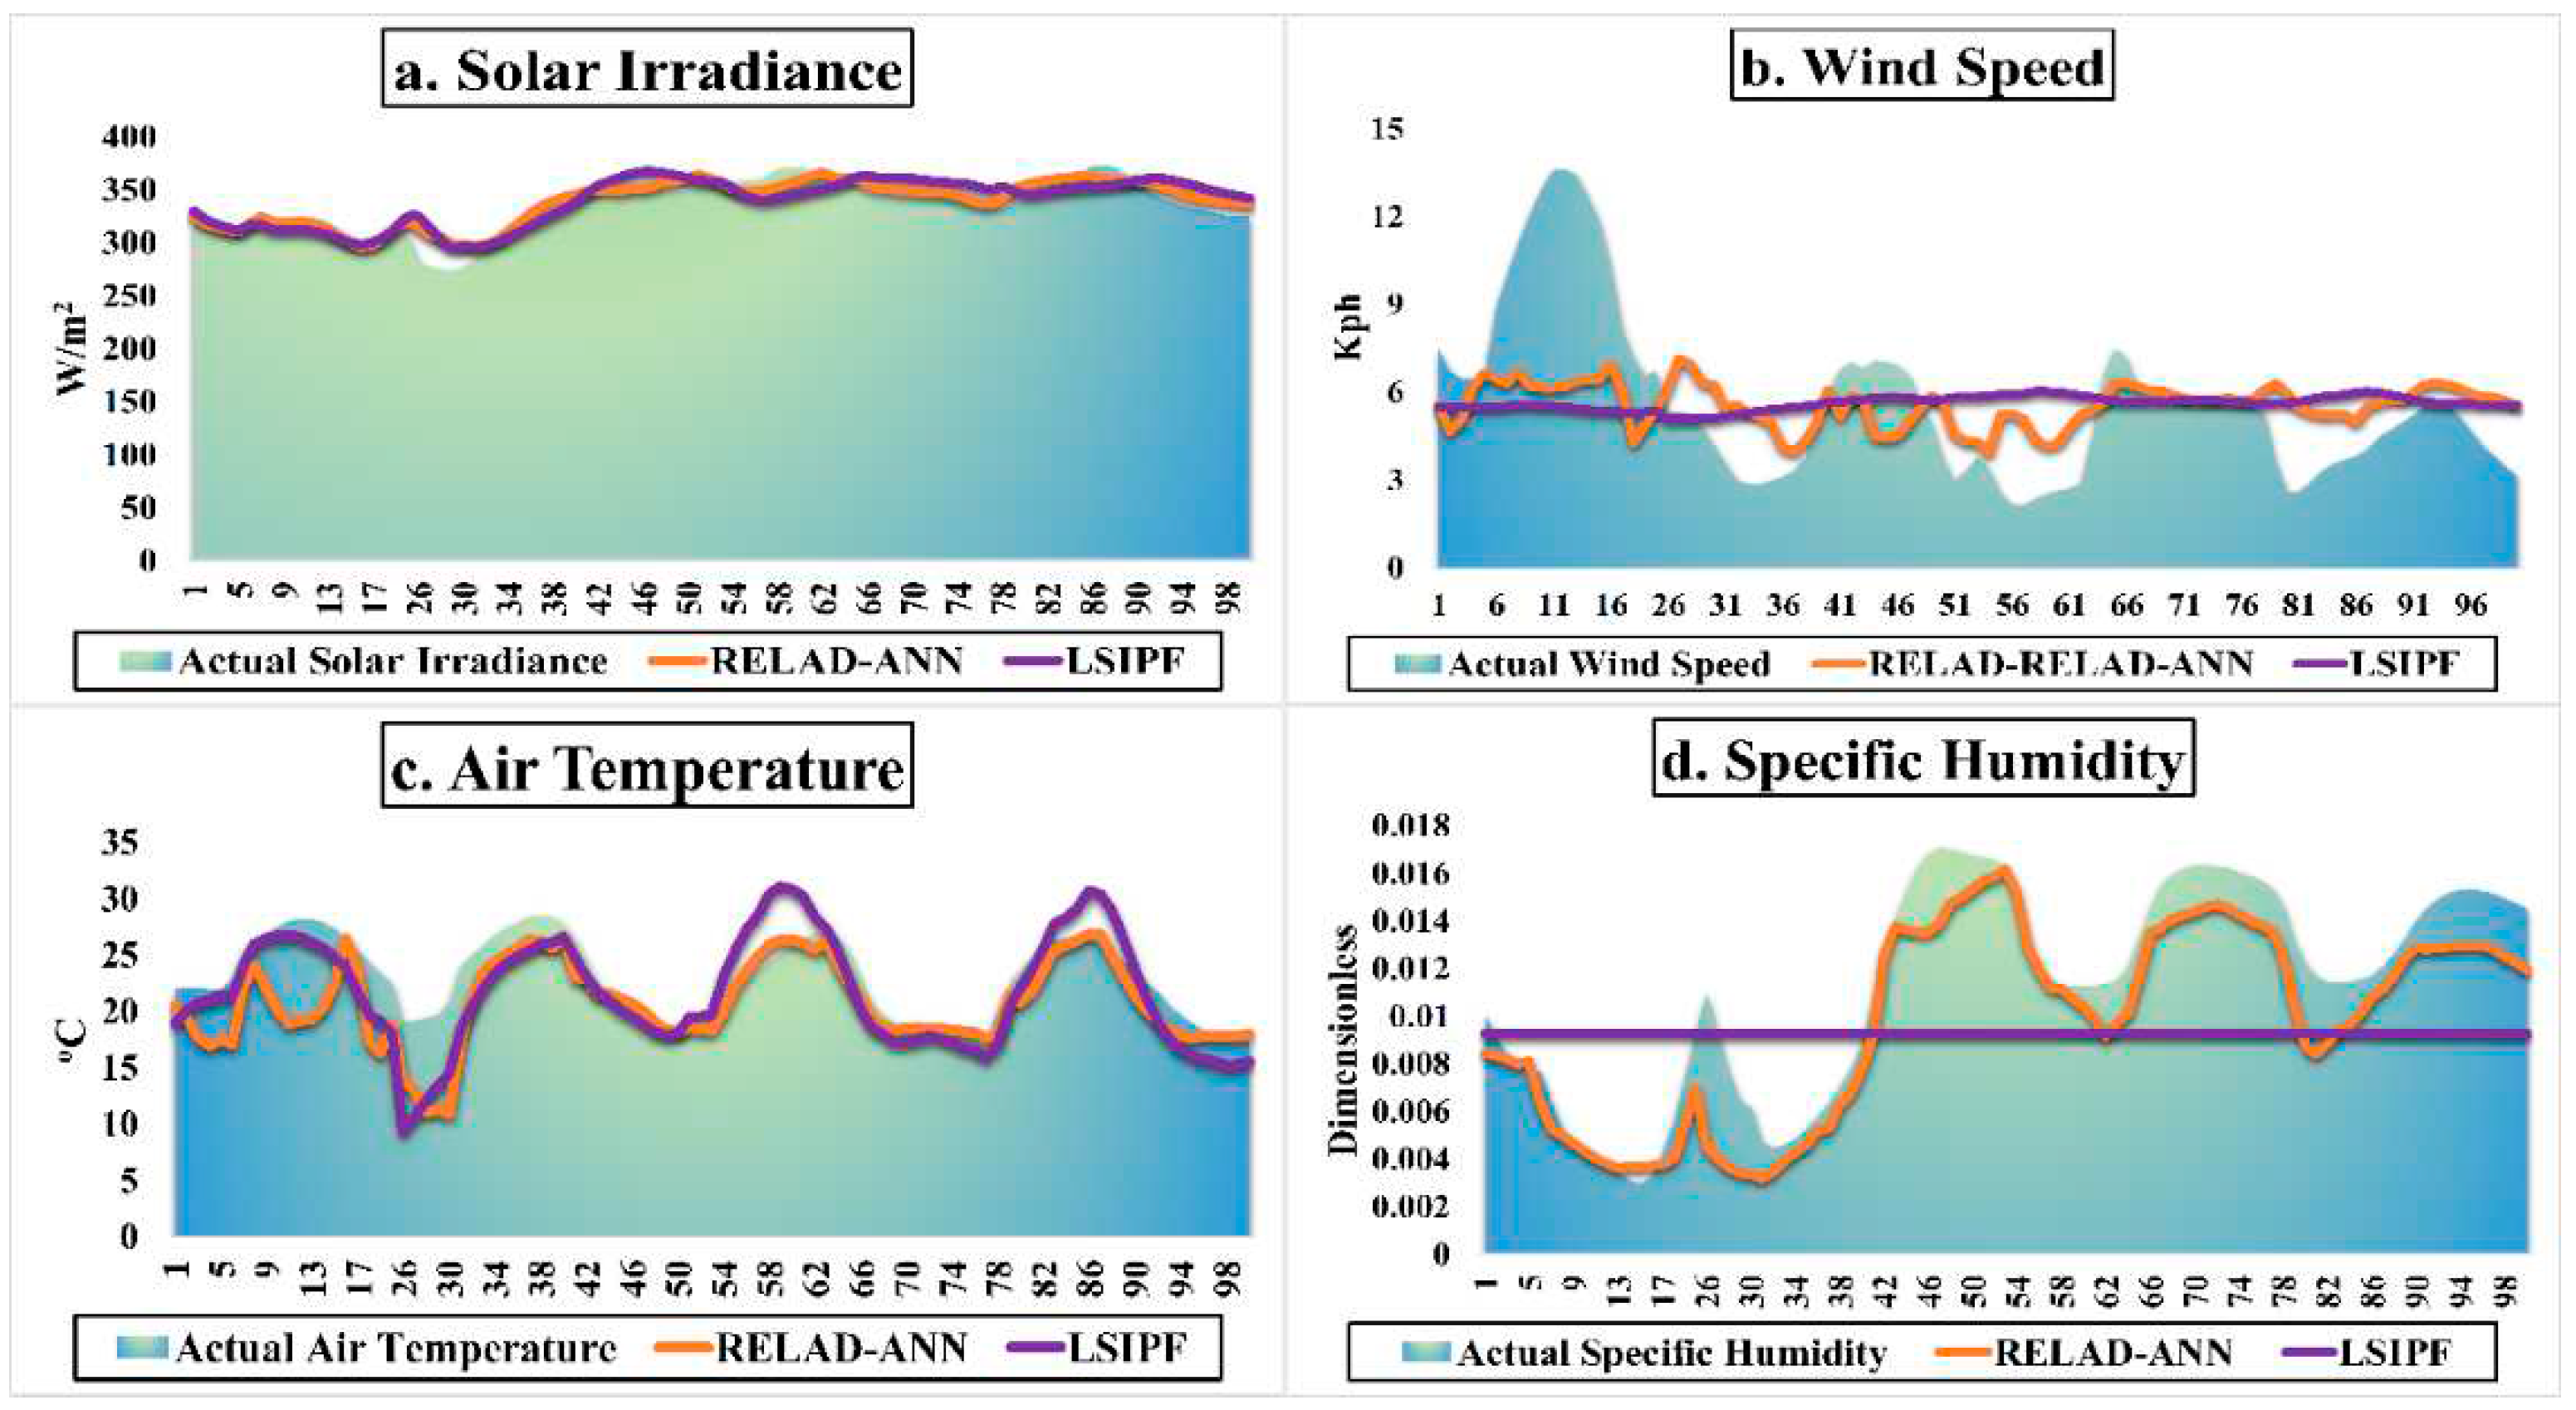
Similar trends in predictions related to wind speed and air temperature are noteworthy, but it is in the realm of SI and specific humidity where RELAD-ANN truly distinguishes itself. The intricate architecture of RELAD-ANN's artificial neural network enables nuanced data assimilation, which is crucial for SI's variable nature. Figure 8 provides a detailed juxtaposition of both models against actual recorded data across various parameters.
Specific humidity predictions, a crucial aspect in meteorological forecasting, further highlight the disparities between the two models. LSIPF's linear approach often struggles to capture the complexity of specific humidity, a multifaceted parameter influenced by various atmospheric conditions. This limitation becomes evident in Figure 8(d), where RELAD-ANN's predictions tightly align with actual data, while LSIPF exhibits noticeable discrepancies.
In terms of wind speed and air temperature, both models exhibit competitive performances. However, the dynamic adaptability of RELAD-ANN, propelled by its learning capabilities, gives it an edge in anticipating sudden shifts or anomalies in data. On the other hand, while LSIPF has historically provided a sound, foundational approach to prediction, it is evident that in the face of evolving complexities, especially in parameters like specific humidity and SI, its linear model sometimes falters.
The underlying strength of RELAD-ANN resides in its architectural framework. Distinct from traditional forecasting models, RELAD-ANN employs an intricate artificial neural network structure. This configuration, layered and interconnected, empowers it with an enhanced capacity for data assimilation and pattern recognition. The novelty of the RELAD-ANN model arises from its ability to dynamically adapt. It can self-learn from historical data, refine its forecasting algorithms, and consequently, deliver more accurate predictions. This, coupled with its proficiency in discerning minute data variations — a capability imperative for specific humidity predictions — accentuates its superiority.
Conversely, the LSIPF model, though competent, is intrinsically limited by its design. Its linear nature can sometimes be insufficient in grappling with the multifaceted and interconnected variables of meteorological data. This becomes evident in its struggle to forecast specific humidity, where it manages only a meager R2 value of approximately zero compared to 0.894 for RELAD-ANN. Such quantitative disparities highlight the stark difference in the models' capabilities. In summary, while LSIPF offers a foundational approach to prediction, RELAD-ANN, with its advanced structure and innovative mechanisms, stands out as the avant-garde in meteorological forecasting.

3.2. Meteorological Parameter Influence on Solar Irradiance

This research attempts to delve into the effects of various environmental parameters, namely wind speed, specific humidity, and air temperature, on SI through the prism of the SVR and Light GBM models.
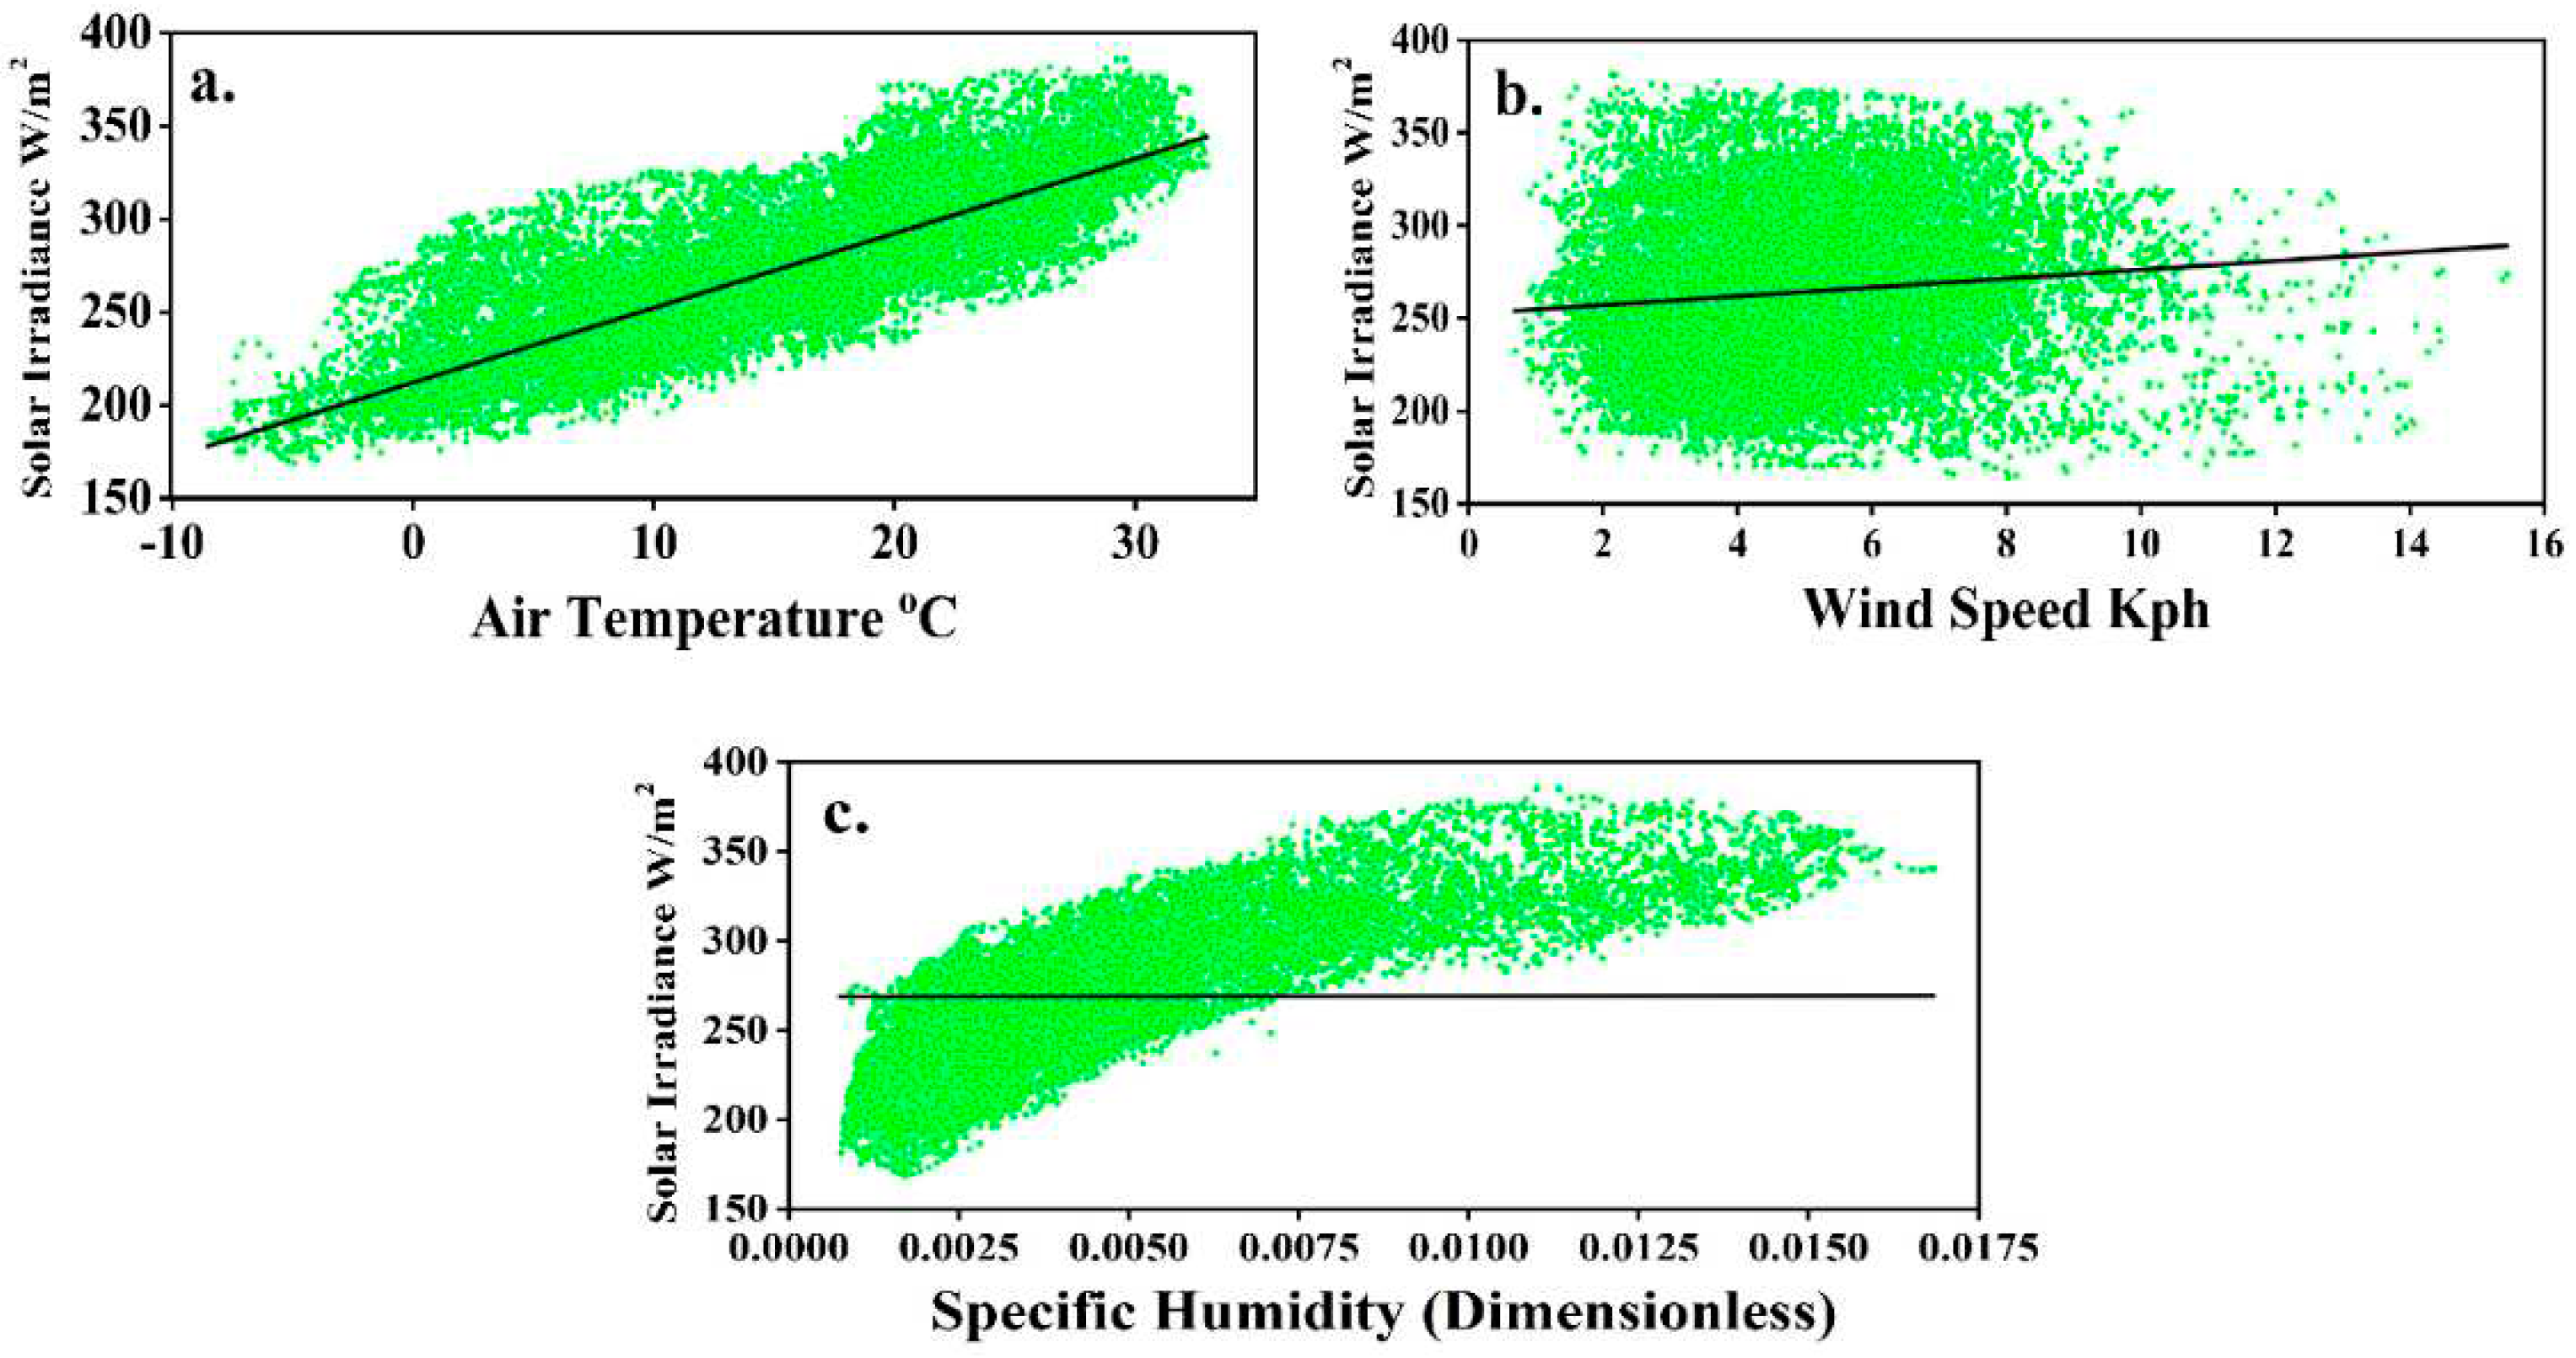
Utilizing the SVR model, an investigation into the impact of air temperature on SI manifested an almost linear relationship, as depicted in Figure 9(a). With an increase in air temperature, there is a congruent rise in SI. Parallelly, the correlation between wind speed and SI is examined in Figure 9(b). SVR has capably captured the predominant wind data falling between 2 kph and 8 kph, rendering a regression line that encapsulates the data with precision. However, its limitations become evident when addressing fractional specific humidity data (Figure 9(c)). The regression trajectory seems ineffectual, failing to offer accurate forecasts.
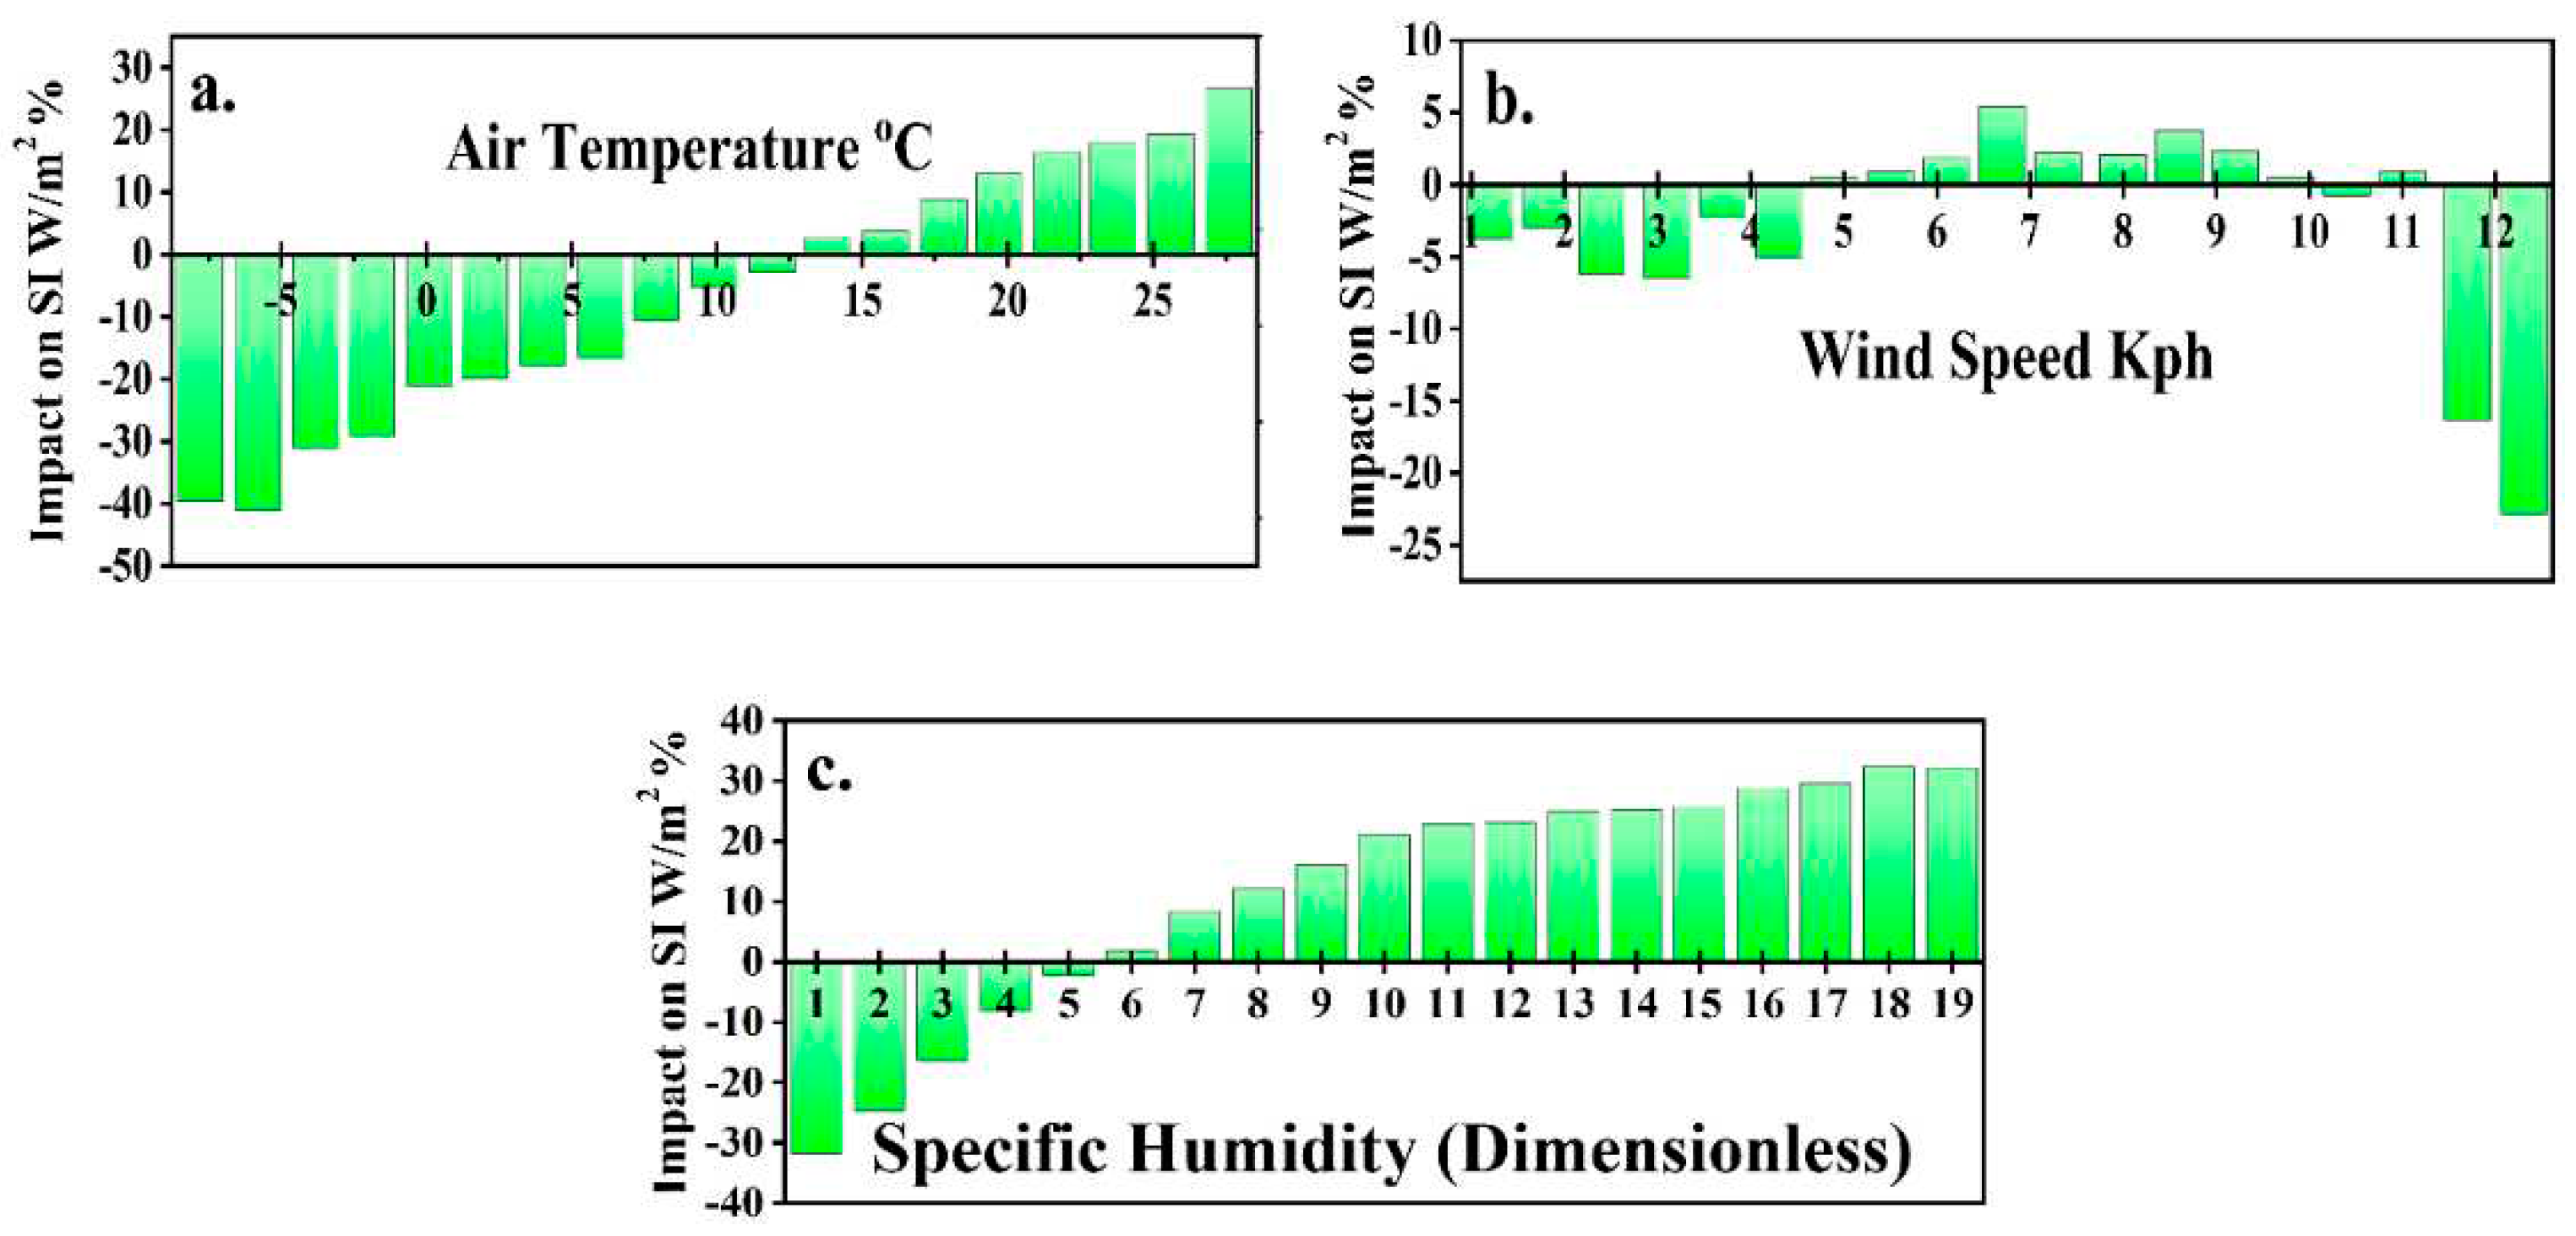
On the other hand, Light GBM demonstrated its mettle by outstripping its counterpart, especially when governed by the L2 loss function. An exemplar of its precision is its R2 value of 0.93 and a commendably low MAE of 0.003. Taking into account the trio of environmental parameters, Light GBM's predictions for SI are portrayed across Figure 10(a)-Figure 10(c). The pinnacle of SI is pinpointed at 393.8 kW/m2, corresponding to an air temperature of 27.9°C, wind speed of 2.3 kph, and specific humidity of 0.01. In contrast, the trough is discerned at 171.1 kW/m2, with respective parameters being -2.2°C, 8.3 kph, and 0.002. Beyond its remarkable accuracy in correlating air temperature and wind speed with SI, Light GBM discerns the pivotal role of specific humidity, a nuance that evaded the SVR model's scope.
The contrasting capabilities of SVR and Light GBM are accentuated when exploring the intricate interplay of environmental parameters on SI. Light GBM's adeptness in handling complex datasets, while concurrently being attuned to minute changes in input parameters, accounts for its superior performance. A salient feature reinforcing its accuracy is the optimization of the L2 loss function, which aims at reducing the squared discrepancies between the envisaged and actual data. Conversely, while SVR exhibits proficiency in discerning the influences of air temperature and wind speed on SI, it grapples with the nuances of specific humidity's effect on SI.
Concluding our observations, Light GBM emerges as the more robust and versatile model for assessing the influence of environmental factors on SI. Its holistic approach, embracing the intricate interrelationships among wind speed, specific humidity, and air temperature, positions it as a superior predictive tool, overshadowing the capabilities of SVR.

4. Conclusions

The present study has investigated the solar potential of Quetta (a city of Pakistan) and the dependency of SI on other parameters. Towards this end, two ML models RELAD-ANN and LSIPF have been generated using Python. To compare the two models, various parametric predictions have been made and validated through various statistical indicators. Moreover, two regressions models SVR and Light GBM have been structured to check the effects of other parameters of SI forecasting. Based on the results reported in Section 3, several conclusions can be made below.
  • The RELAD-ANN model, leveraging its artificial neural network structure, consistently demonstrates superior forecasting capabilities for SI although being influenced by meteorological parameters. Its strength is particularly pronounced in accurately predicting specific humidity and air temperature, though it exhibits some challenges in capturing rare high-speed wind occurrences.
  • The LSIPF model, while exhibiting commendable precision for parameters like wind speed and air temperature, manifests evident limitations, particularly in predicting specific humidity. Its comparative inferiority in SI prediction further emphasizes the overarching proficiency of the RELAD-ANN model.
  • Light GBM, when contrasted with the SVR model, reveals a more holistic and adept approach in evaluating the influences of environmental parameters on SI. Its strength in addressing the intricate interplay of these parameters, especially specific humidity, positions it as an indispensable tool for such predictive tasks.
In inference, this study introduces a robust approach to predict solar irradiance and investigates its interdependencies with other parameters. The present models, i.e., RELAD-ANN and Light GBM regressor, offer accurate and reliable predictions of solar irradiance and its intertwined factors. This research holds significant value in the global landscape of renewable energy planning and management, equipping stakeholders with vital insights for optimizing solar energy harnessing. As a scalable and adaptable study, there is potential for its methodologies to be applied across varied geographic contexts and be enhanced by integrating additional parameters. Furthermore, the suggested models hold promise for real-time forecasting, paving the way for improved renewable energy system management worldwide.

Author Contributions

“Conceptualization, M.F.H.; methodology, M.F.H.; software, M.F.H.; validation, S.N., X.L and J.S.; formal analysis, M.F.H.; investigation, M.F.H.; resources, J.M.; data curation, S.N.; writing—original draft preparation, M.F.H.; writing—review and editing, J.S and X.L.; visualization, M.F.H.; supervision, J.M.; project administration, J.M. All authors have read and agreed to the published version of the manuscript.”.

Funding

This research received no external funding.

Data Availability Statement

Data available on Giovanni (nasa.gov).

Conflicts of Interest

The authors declare no conflict of interest.

References

  1. Guan, Y.; Lu, H.; Jiang, Y.; Tian, P.; Qiu, L.; Pellikka, P.; Heiskanen, J. Changes in Global Climate Heterogeneity under the 21st Century Global Warming. Ecol Indic 2021, 130, 108075. [Google Scholar] [CrossRef]
  2. Edenhofer, O.; Pichs-Madruga, R.; Sokona Mali, Y.; Kadner, S.; Minx, J.C.; Brunner, S.; Agrawala, S.; Baiocchi, G.U.; Alexeyevich Bashmakov, I.; Blanco, G.; et al. TS Technical Summary Coordinating Lead Authors: Lead Authors.
  3. By Daniel Sperling, J.S.C. Driving Climate Change: Cutting Carbon from Transportation; Elsevier, 2010.
  4. Janke, J.R. Multicriteria GIS Modeling of Wind and Solar Farms in Colorado. Renew Energy 2010, 35, 2228–2234. [Google Scholar] [CrossRef]
  5. Dincer, I. Renewable Energy and Sustainable Development: A Crucial Review. Renewable & sustainable energy reviews 2000, 4, 157–175. [Google Scholar] [CrossRef]
  6. Sohani, A.; Shahverdian, M.H.; Sayyaadi, H.; Hoseinzadeh, S.; Memon, S.; Piras, G.; Garcia, D.A. Energy and Exergy Analyses on Seasonal Comparative Evaluation of Water Flow Cooling for Improving the Performance of Monocrystalline PV Module in Hot-Arid Climate. Sustainability (Switzerland) 2021, 13. [Google Scholar] [CrossRef]
  7. Sahebi, H.K.; Hoseinzadeh, S.; Ghadamian, H.; Ghasemi, M.H.; Esmaeilion, F.; Garcia, D.A. Techno-Economic Analysis and New Design of a Photovoltaic Power Plant by a Direct Radiation Amplification System. Sustainability (Switzerland) 2021, 13. [Google Scholar] [CrossRef]
  8. Hoseinzadeh, S.; Ghasemi, M.H.; Heyns, S. Application of Hybrid Systems in Solution of Low Power Generation at Hot Seasons for Micro Hydro Systems. Renew Energy 2020, 160, 323–332. [Google Scholar] [CrossRef]
  9. Makkiabadi, M.; Hoseinzadeh, S.; Mohammadi, M.; Nowdeh, S.A.; Bayati, S.; Jafaraghaei, U.; Mirkiai, S.M.; Assad, M.E.H. Energy Feasibility of Hybrid PV/Wind Systems with Electricity Generation Assessment under Iran Environment. Applied Solar Energy (English translation of Geliotekhnika) 2020, 56, 517–525. [Google Scholar] [CrossRef]
  10. Hannan, M.A.; Al-Shetwi, A.Q.; Ker, P.J.; Begum, R.A.; Mansor, M.; Rahman, S.A.; Dong, Z.Y.; Tiong, S.K.; Mahlia, T.M.I.; Muttaqi, K.M. Impact of Renewable Energy Utilization and Artificial Intelligence in Achieving Sustainable Development Goals. Energy Reports 2021, 7, 5359–5373. [Google Scholar] [CrossRef]
  11. Rafique, M.M.; Rehman, S. National Energy Scenario of Pakistan – Current Status, Future Alternatives, and Institutional Infrastructure: An Overview. Renewable and Sustainable Energy Reviews 2017, 69, 156–167. [Google Scholar] [CrossRef]
  12. IEA Snapshot of Global PV Markets 2014. Www.Iea-Pvps.Org 2015, 1–16.
  13. Pikus, M.; Wąs, J. Using Deep Neural Network Methods for Forecasting Energy Productivity Based on Comparison of Simulation and DNN Results for Central Poland—Swietokrzyskie Voivodeship. Energies (Basel) 2023, 16, 6632. [Google Scholar] [CrossRef]
  14. Rafique, M.M.; Bahaidarah, H.M.S.; Anwar, M.K. Enabling Private Sector Investment in Off-Grid Electrification for Cleaner Production: Optimum Designing and Achievable Rate of Unit Electricity. J Clean Prod 2019, 206, 508–523. [Google Scholar] [CrossRef]
  15. Council, E.A. Integrated Energy Plan 2009-2022 Report of the Energy Expert Group. 2009.
  16. Sørensen, M.L.; Nystrup, P.; Bjerregård, M.B.; Møller, J.K.; Bacher, P.; Madsen, H. Recent Developments in Multivariate Wind and Solar Power Forecasting. Wiley Interdiscip Rev Energy Environ 2023, 12. [Google Scholar] [CrossRef]
  17. ARENA (2019) $9 Million Funding to Enhance Term Forecasting of Wind and Solar Farms”, Australian Renewable Energy Agency; 2018.
  18. Brancucci Martinez-Anido, C.; Botor, B.; Florita, A.R.; Draxl, C.; Lu, S.; Hamann, H.F.; Hodge, B.M. The Value of Day-Ahead Solar Power Forecasting Improvement. Solar Energy 2016, 129, 192–203. [Google Scholar] [CrossRef]
  19. Madeleine Cuff AI-Powered Weather Forecasts Are Improving Predictions for Smart Grids’ Energy Outputs.
  20. Newsom, G.; Brown, E.G. Improving Solar and Load Forecasts by Reducing Operational Uncertainty California Energy Commission Month Year; 2019.
  21. Office of Energy Efficiency & Renewable Energy EERE Success Story—Solar Forecasting Platform Helps Grid Operators Plan Energy Mix.
  22. Solar Energy Technologies Office Success Story—Novel Approach to Solar Forecasting Delivers Improved Reliability and Economic Savings for Texas Grid.
  23. Farooqui, S.Z. Prospects of Renewables Penetration in the Energy Mix of Pakistan. Renewable and Sustainable Energy Reviews 2014, 29, 693–700. [Google Scholar] [CrossRef]
  24. Government of pakistan, F.D. Pakistan Economic Survey 2021-22; 2022.
  25. Đukanović, M.; Kašćelan, L.; Vuković, S.; Martinović, I.; Ćalasan, M. A Machine Learning Approach for Time Series Forecasting with Application to Debt Risk of the Montenegrin Electricity Industry. Energy Reports 2023, 9, 362–369. [Google Scholar] [CrossRef]
  26. Irfan, M.; Zhao, Z.Y.; Mukeshimana, M.C.; Ahmad, M. Wind Energy Development in South Asia: Status, Potential and Policies. 2019 2nd International Conference on Computing, Mathematics and Engineering Technologies, iCoMET 2019 2019, 1–6. [CrossRef]
  27. International Energy Agency Available online: https://www.iea.org/regions/asia-pacific.
  28. Rafique, M.M.; Rehman, S. National Energy Scenario of Pakistan – Current Status, Future Alternatives, and Institutional Infrastructure: An Overview. Renewable and Sustainable Energy Reviews 2017, 69, 156–167. [Google Scholar] [CrossRef]
  29. Awan, U.; Knight, I. Domestic Sector Energy Demand and Prediction Models for Punjab Pakistan. Journal of Building Engineering 2020, 32, 101790. [Google Scholar] [CrossRef]
  30. Muhammad, F.; Waleed Raza, M.; Khan, S.; Khan, F. Different Solar Potential Co-Ordinates of Pakistan. Innovative Energy & Research 2017, 06, 1–8. [Google Scholar] [CrossRef]
  31. Farooq, M.; Shakoor, A. Severe Energy Crises and Solar Thermal Energy as a Viable Option for Pakistan. Journal of Renewable and Sustainable Energy 2013, 5. [Google Scholar] [CrossRef]
  32. Shabbir, N.; Usman, M.; Jawad, M.; Zafar, M.H.; Iqbal, M.N.; Kütt, L. Economic Analysis and Impact on National Grid by Domestic Photovoltaic System Installations in Pakistan. Renew Energy 2020, 153, 509–521. [Google Scholar] [CrossRef]
  33. Meenal, R.; Binu, D.; Ramya, K.C.; Michael, P.A.; Vinoth Kumar, K.; Rajasekaran, E.; Sangeetha, B. Weather Forecasting for Renewable Energy System: A Review. Archives of Computational Methods in Engineering 2022, 29, 2875–2891. [Google Scholar] [CrossRef]
  34. David, M.; Alonso-Montesinos, J.; Le Gal La Salle, J.; Lauret, P. Probabilistic Solar Forecasts as a Binary Event Using a Sky Camera. Energies (Basel) 2023, 16, 7125. [Google Scholar] [CrossRef]
  35. Rozon, F.; McGregor, C.; Owen, M. Long-Term Forecasting Framework for Renewable Energy Technologies’ Installed Capacity and Costs for 2050. Energies (Basel) 2023, 16. [Google Scholar] [CrossRef]
  36. Harrou, F.; Sun, Y.; Taghezouit, B.; Dairi, A. Artificial Intelligence Techniques for Solar Irradiance and PV Modeling and Forecasting. Energies (Basel) 2023, 16, 6731. [Google Scholar] [CrossRef]
  37. Vennila, C.; Titus, A.; Sudha, T.S.; Sreenivasulu, U.; Reddy, N.P.R.; Jamal, K.; Lakshmaiah, D.; Jagadeesh, P.; Belay, A. Forecasting Solar Energy Production Using Machine Learning. International Journal of Photoenergy 2022, 2022. [Google Scholar] [CrossRef]
  38. Gneiting, T.; Lerch, S.; Schulz, B. Probabilistic Solar Forecasting: Benchmarks, Post-Processing, Verification. Solar Energy 2023, 252, 72–80. [Google Scholar] [CrossRef]
  39. Haider, S.A.; Sajid, M.; Sajid, H.; Uddin, E.; Ayaz, Y. Deep Learning and Statistical Methods for Short- and Long-Term Solar Irradiance Forecasting for Islamabad. Renew Energy 2022, 198, 51–60. [Google Scholar] [CrossRef]
  40. Tawn, R.; Browell, J. A Review of Very Short-Term Wind and Solar Power Forecasting A R T I C L E I N F O. 2021. [CrossRef]
  41. Singla, P.; Duhan, M.; Saroha, S. A Comprehensive Review and Analysis of Solar Forecasting Techniques; 2022; Vol. 16; ISBN 1170802107227.
  42. Verma, M.; Ghritlahre, H.K.; Chandrakar, G. Wind Speed Prediction of Central Region of Chhattisgarh (India) Using Artificial Neural Network and Multiple Linear Regression Technique: A Comparative Study. Annals of Data Science 2023, 10, 851–873. [Google Scholar] [CrossRef]
  43. Rajasundrapandiyanleebanon, T.; Kumaresan, K.; Murugan, S.; Subathra, M.S.P.; Sivakumar, M. Solar Energy Forecasting Using Machine Learning and Deep Learning Techniques. Archives of Computational Methods in Engineering 2023, 30, 3059–3079. [Google Scholar] [CrossRef]
  44. Heng, S.Y.; Ridwan, W.M.; Kumar, P.; Ahmed, A.N.; Fai, C.M.; Birima, A.H.; El-Shafie, A. Artificial Neural Network Model with Different Backpropagation Algorithms and Meteorological Data for Solar Radiation Prediction. Sci Rep 2022, 12. [Google Scholar] [CrossRef]
  45. Geetha, A.; Santhakumar, J.; Sundaram, K.M.; Usha, S.; Thentral, T.M.T.; Boopathi, C.S.; Ramya, R.; Sathyamurthy, R. Prediction of Hourly Solar Radiation in Tamil Nadu Using ANN Model with Different Learning Algorithms. Energy Reports 2022, 8, 664–671. [Google Scholar] [CrossRef]
  46. Alirahmi, S.M.; Khoshnevisan, A.; Shirazi, P.; Ahmadi, P.; Kari, D. Soft Computing Based Optimization of a Novel Solar Heliostat Integrated Energy System Using Artificial Neural Networks. Sustainable Energy Technologies and Assessments 2022, 50. [Google Scholar] [CrossRef]
  47. Mohammad, A.; Mahjabeen, F. Revolutionizing Solar Energy: The Impact of Artificial Intelligence on Photovoltaic Systems. 2023, 2. 2. [CrossRef]
  48. Alassery, F.; Alzahrani, A.; Khan, A.I.; Irshad, K.; R. Kshirsagar, S. An Artificial Intelligence-Based Solar Radiation Prophesy Model for Green Energy Utilization in Energy Management System. Sustainable Energy Technologies and Assessments 2022, 52. [CrossRef]
  49. HALTON, C. Predictive Analytics: Definition, Model Types, and Uses Available online: https://www.investopedia.com/terms/p/predictive-analytics.asp#:~:text=The most common predictive models,deep learning methods and technologies.
  50. Manju, S.; Sandeep, M. Prediction and Performance Assessment of Global Solar Radiation in Indian Cities: A Comparison of Satellite and Surface Measured Data. J Clean Prod 2019, 230, 116–128. [Google Scholar] [CrossRef]
  51. Kumar, N.; Sinha, U.K.; Sharma, S.P.; Nayak, Y.K. Prediction of Daily Global Solar Radiation Using Neural Networks with Improved Gain Factors and RBF Networks. International Journal of Renewable Energy Research 2017, 7, 1235–1244. [Google Scholar] [CrossRef]
  52. Siva Krishna Rao K, D. V.; Premalatha, M.; Naveen, C. Models for Forecasting Monthly Mean Daily Global Solar Radiation from In-Situ Measurements: Application in Tropical Climate, India. Urban Clim 2018, 24, 921–939. [Google Scholar] [CrossRef]
  53. Ahmad, S.; Parvez, M.; Khan, T.A.; Khan, O. A Hybrid Approach Using AHP–TOPSIS Methods for Ranking of Soft Computing Techniques Based on Their Attributes for Prediction of Solar Radiation. Environmental Challenges 2022, 9, 100634. [Google Scholar] [CrossRef]
  54. Ağbulut, Ü.; Gürel, A.E.; Biçen, Y. Prediction of Daily Global Solar Radiation Using Different Machine Learning Algorithms: Evaluation and Comparison. Renewable and Sustainable Energy Reviews 2021, 135. [Google Scholar] [CrossRef]
  55. Yıldırım, H.B.; Çelik, Ö.; Teke, A.; Barutçu, B. Estimating Daily Global Solar Radiation with Graphical User Interface in Eastern Mediterranean Region of Turkey. Renewable and Sustainable Energy Reviews 2018, 82, 1528–1537. [Google Scholar] [CrossRef]
  56. Islam, S.; Roy, N.K. Renewables Integration into Power Systems through Intelligent Techniques: Implementation Procedures, Key Features, and Performance Evaluation. Energy Reports 2023, 9, 6063–6087. [Google Scholar] [CrossRef]
  57. Deo, R.C.; Wen, X.; Qi, F. A Wavelet-Coupled Support Vector Machine Model for Forecasting Global Incident Solar Radiation Using Limited Meteorological Dataset. Appl Energy 2016, 168, 568–593. [Google Scholar] [CrossRef]
  58. Li, R.; Wang, H.N.; He, H.; Cui, Y.M.; Du, Z. Le Support Vector Machine Combined with K-Nearest Neighbors for Solar Flare Forecasting. Chinese Journal of Astronomy and Astrophysics 2007, 7, 441–447. [Google Scholar] [CrossRef]
  59. Li, R.; Cui, Y.; He, H.; Wang, H. Application of Support Vector Machine Combined with K-Nearest Neighbors in Solar Flare and Solar Proton Events Forecasting. Advances in Space Research 2008, 42, 1469–1474. [Google Scholar] [CrossRef]
  60. Wang, F.; Zhen, Z.; Wang, B.; Mi, Z. Comparative Study on KNN and SVM Based Weather Classification Models for Day Ahead Short Term Solar PV Power Forecasting. Applied Sciences (Switzerland) 2017, 8. [Google Scholar] [CrossRef]
  61. Solargis Global Solar Atlas 2.0 GHI Map of Pakistan Utilizing Solargis Data Available online: https://globalsolaratlas.info/map?c=30.628459,68.983154,6&r=PAK.
  62. (CDPC), C.D.P.C.; Department, P.M. Climate Records Quetta Available online: http://www.pmd.gov.pk/cdpc/home.htm.
  63. Solargis Global Solar Atlas 2.0 Quetta 30.195768°,067.017245°.
  64. NASA Giovanni Available online: https://giovanni.gsfc.nasa.gov/giovanni/.
  65. Yoon, J.; Jordon, J.; Van Der Schaar, M. GAIN: Missing Data Imputation Using Generative Adversarial Nets; 2018.
  66. Andrews, J.; Gorell, S. Generating Missing Unconventional Oilfield Data Using a Generative Adversarial Imputation Network (GAIN).; American Association of Petroleum Geologists AAPG/Datapages, August 20 2020.
  67. Shahbazian, R.; Trubitsyna, I. DEGAIN: Generative-Adversarial-Network-Based Missing Data Imputation. Information (Switzerland) 2022, 13. [Google Scholar] [CrossRef]
  68. Zhang, Y.; Zhang, R.; Zhao, B. A Systematic Review of Generative Adversarial Imputation Network in Missing Data Imputation. Neural Comput Appl 2023, 35, 19685–19705. [Google Scholar] [CrossRef]
  69. Awan, S.E.; Bennamoun, M.; Sohel, F.; Sanfilippo, F.; Dwivedi, G. Imputation of Missing Data with Class Imbalance Using Conditional Generative Adversarial Networks. Neurocomputing 2021, 453, 164–171. [Google Scholar] [CrossRef]
  70. Friedjungová, M.; Vašata, D.; Balatsko, M.; Jiřina, M. Missing Features Reconstruction Using a Wasserstein Generative Adversarial Imputation Network. In Proceedings of the Lecture Notes in Computer Science (including subseries Lecture Notes in Artificial Intelligence and Lecture Notes in Bioinformatics); Springer Science and Business Media Deutschland GmbH, 2020; Vol. 12140 LNCS, pp. 225–239.
  71. (2015), P.C.T. Python: A Dynamic, Open Source Programming Language. Python Software Foundation.
  72. Gholizadeh, S. Top Popular Python Libraries in Research; 2022; Vol. 3;
  73. Stančin, I.; Jović, A. An Overview and Comparison of Free Python Libraries for Data Mining and Big Data Analysis.
  74. Voigtlaender, F. The Universal Approximation Theorem for Complex-Valued Neural Networks. Appl Comput Harmon Anal 2023, 64, 33–61. [Google Scholar] [CrossRef]
  75. Winkler, D.A.; Le, T.C. Performance of Deep and Shallow Neural Networks, the Universal Approximation Theorem, Activity Cliffs, and QSAR. Mol Inform 2017, 36. [Google Scholar] [CrossRef]
  76. Lu, Y.; Lu, J. A Universal Approximation Theorem of Deep Neural Networks for Expressing Probability Distributions.
  77. Dubey, S.R.; Singh, S.K.; Chaudhuri, B.B. Activation Functions in Deep Learning: A Comprehensive Survey and Benchmark. Neurocomputing 2022, 503, 92–108. [Google Scholar] [CrossRef]
  78. Tato, A.; Nkambou, R. Workshop Track-ICLR 2018 IMPROVING ADAM OPTIMIZER.
  79. Toh, S.C.; Lai, S.H.; Mirzaei, M.; Soo, E.Z.X.; Teo, F.Y. Sequential Data Processing for IMERG Satellite Rainfall Comparison and Improvement Using LSTM and ADAM Optimizer. Applied Sciences (Switzerland) 2023, 13. [Google Scholar] [CrossRef]
  80. Amose, J.; Manimegalai, P.; Narmatha, C.; Pradeep Raj, M.S. Amose, J.; Manimegalai, P.; Narmatha, C.; Pradeep Raj, M.S. Comparative Performance Analysis of Kernel Functions in Support Vector Machines in the Diagnosis of Pneumonia Using Lung Sounds. In Proceedings of the Proceedings of 2022 2nd International Conference on Computing and Information Technology, ICCIT 2022; Institute of Electrical and Electronics Engineers Inc., 2022; pp. 320–324.
  81. Karyawati, A.E.; Wijaya, K.D.Y.; Supriana, I.W.; Supriana, I.W. A COMPARISON OF DIFFERENT KERNEL FUNCTIONS OF SVM CLASSIFICATION METHOD FOR SPAM DETECTION. JITK (Jurnal Ilmu Pengetahuan dan Teknologi Komputer) 2023, 8, 91–97. [Google Scholar] [CrossRef]
  82. Munir, M.A.; Khattak, A.; Imran, K.; Ulasyar, A.; Khan, A. Solar PV Generation Forecast Model Based on the Most Effective Weather Parameters. 1st International Conference on Electrical, Communication and Computer Engineering, ICECCE 2019 2019, 24–25. [CrossRef]
  83. Wang, F.; Mi, Z.; Su, S.; Zhao, H. Short-Term Solar Irradiance Forecasting Model Based on Artificial Neural Network Using Statistical Feature Parameters. Energies (Basel) 2012, 5, 1355–1370. [Google Scholar] [CrossRef]
  84. Kashyap, Y.; Bansal, A.; Sao, A.K. Solar Radiation Forecasting with Multiple Parameters Neural Networks. Renewable and Sustainable Energy Reviews 2015, 49, 825–835. [Google Scholar] [CrossRef]
  85. Sayad, Dr.S. Support Vector Machine - Regression (SVR). Available online: http://www.saedsayad.com/support_vector_machine_reg.htm.
  86. Lu, Y.; Roychowdhury, V. Parallel Randomized Sampling for Support Vector Machine (SVM) and Support Vector Regression (SVR). Knowl Inf Syst 2008, 14, 233–247. [Google Scholar] [CrossRef]
  87. Kleynhans, T.; Montanaro, M.; Gerace, A.; Kanan, C. Predicting Top-of-Atmosphere Thermal Radiance Using MERRA-2 Atmospheric Data with Deep Learning. Remote Sens (Basel) 2017, 9, 1–16. [Google Scholar] [CrossRef]
  88. ©2022 Obviously AI, Inc. Obviously AI: Data Science without Code. Available online: https://app.obviously.ai/predict.
  89. Team, D.S. What Is Light GBM? Available online: https://datascience.eu/machine-learning/1-what-is-light-gbm/.
  90. Mandot, P. What Is LightGBM, How to Implement It? How to Fine Tune the Parameters? medium 2017.
  91. Gueymard, C.A. A Review of Validation Methodologies and Statistical Performance Indicators for Modeled Solar Radiation Data: Towards a Better Bankability of Solar Projects. Renewable and Sustainable Energy Reviews 2014, 39, 1024–1034. [Google Scholar] [CrossRef]
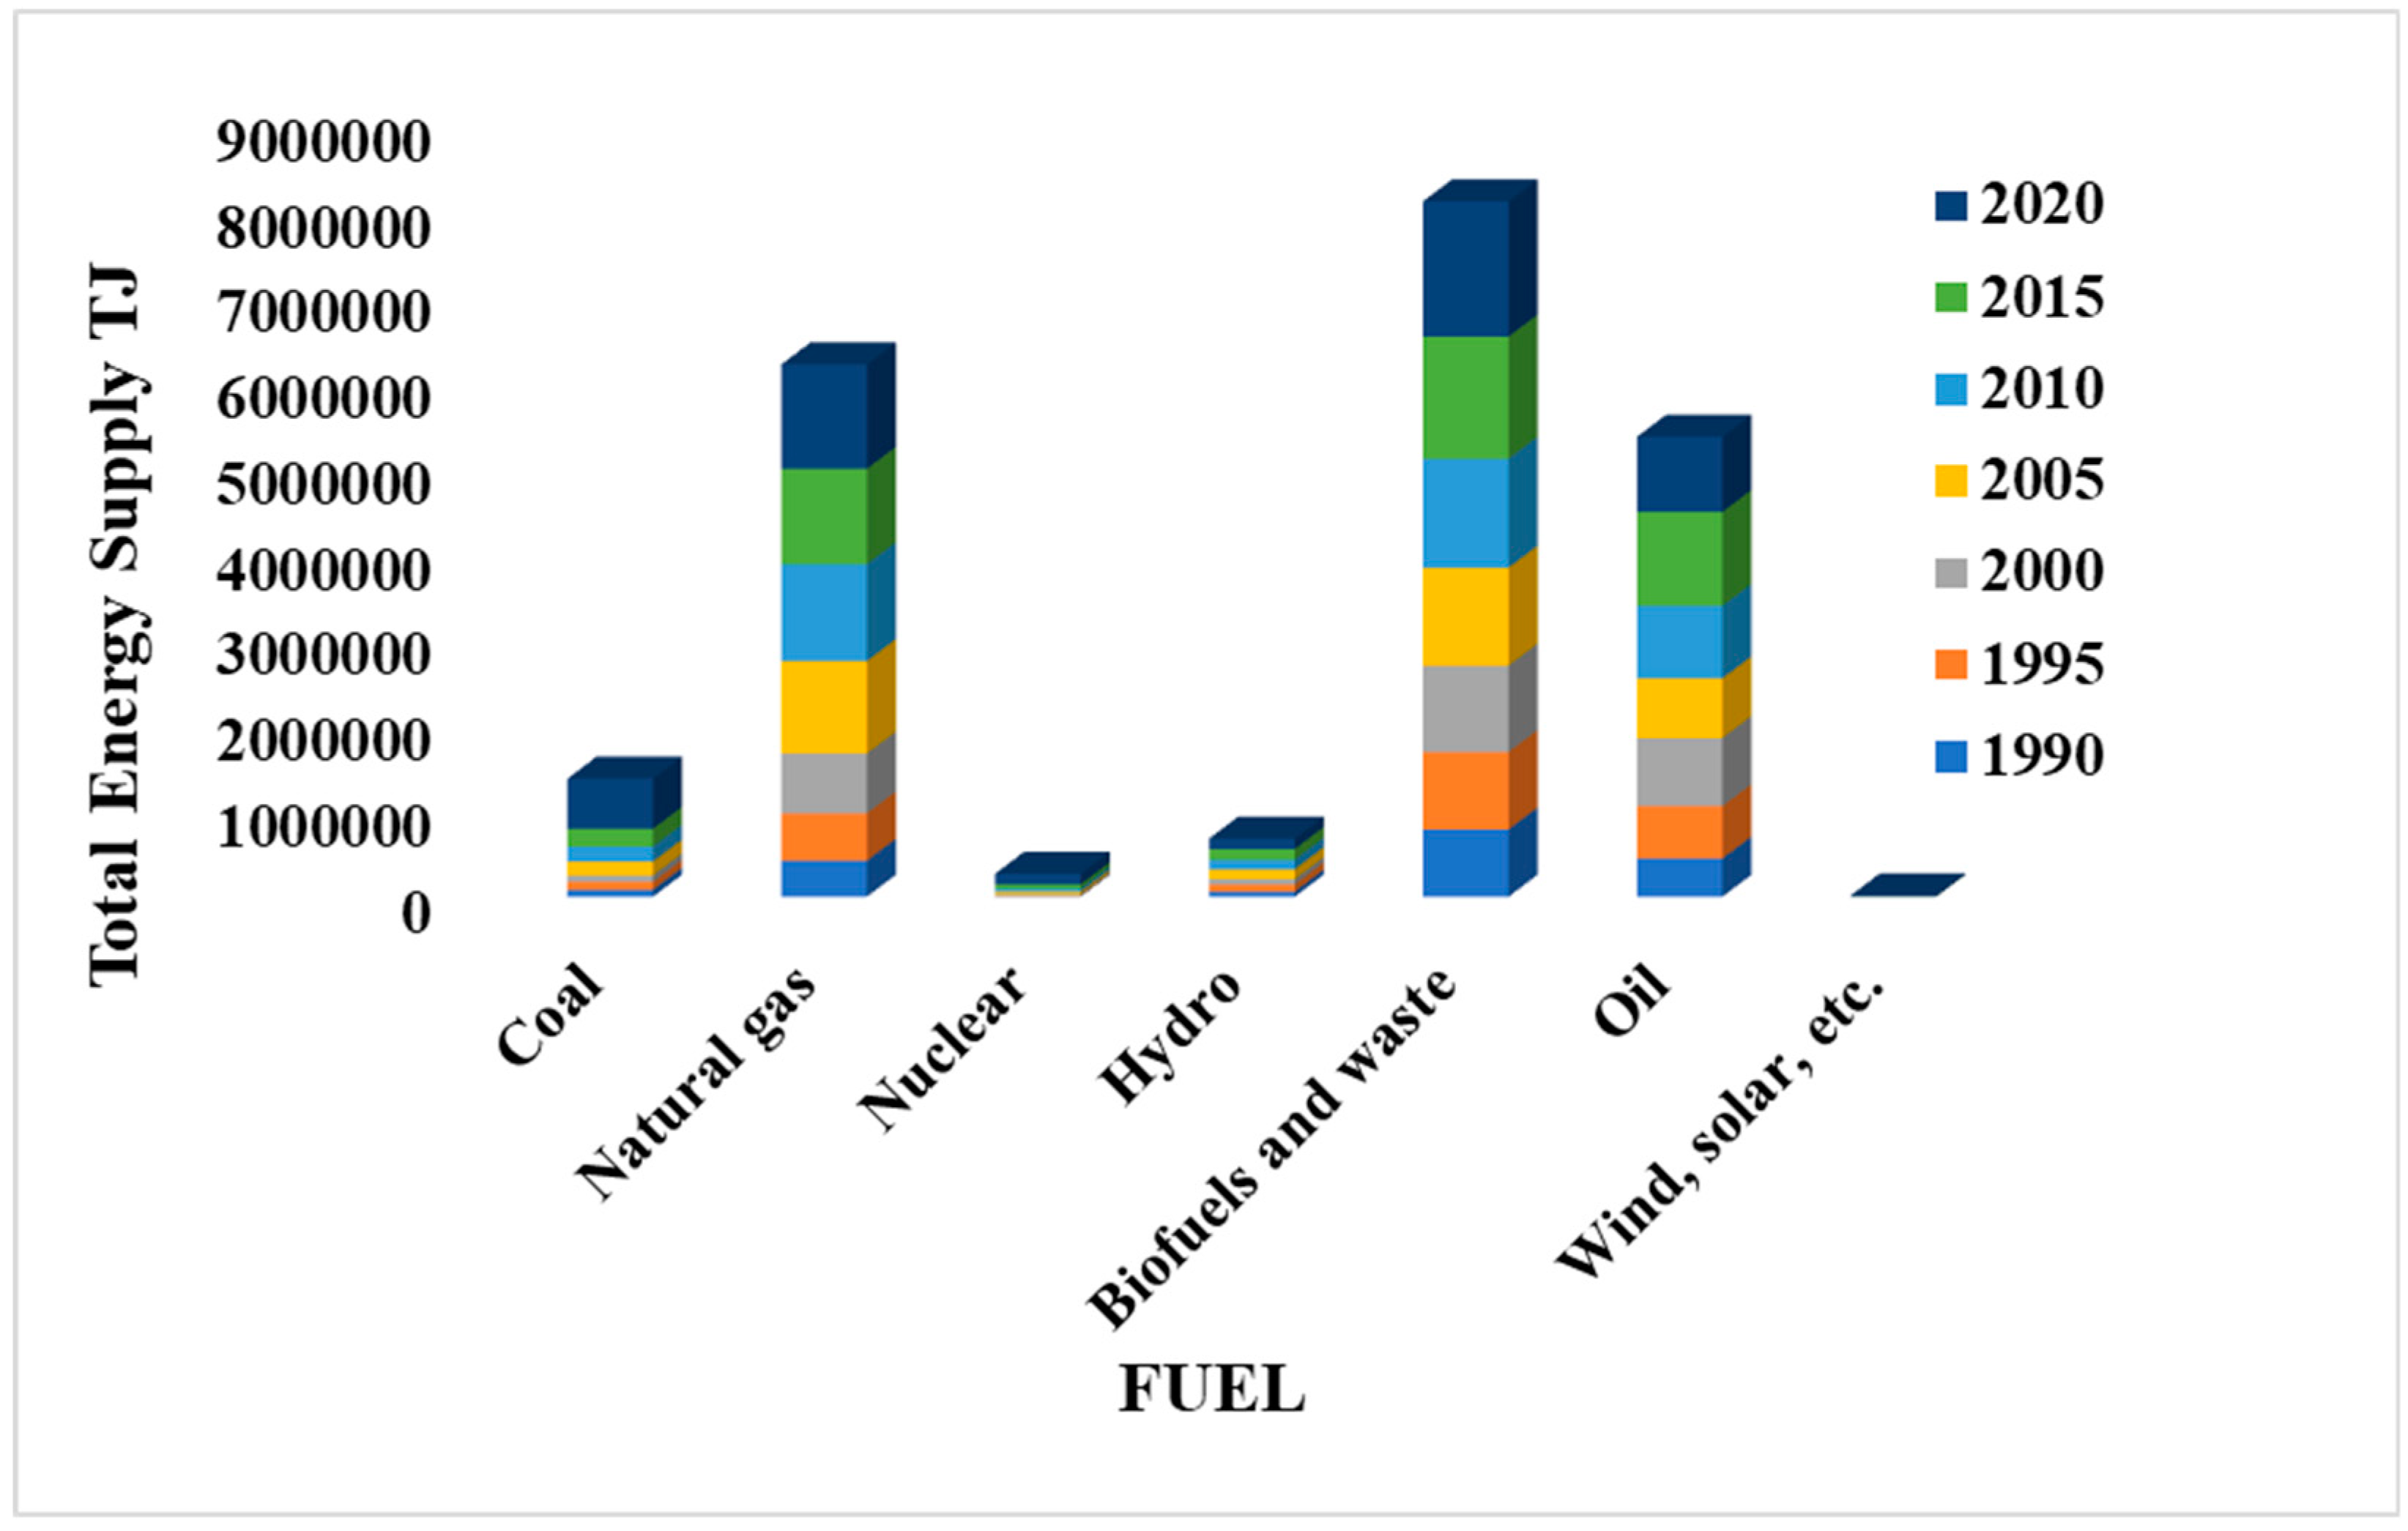
Figure 1. Total energy supply (TES) by source, Pakistan 1990–2020.
Preprints 89185 g001
Figure 2. (a) GHI map of Pakistan showing the selected location “Quetta”, (b) Monthly average radiations of Quetta from 2005 to 2020 showing Global horizontal radiations (meas-urement of SI received by a surface that is directly oriented towards the Sun, meaning that it is perpendicular to the Sun's rays) and Direct normal radiations (a measure of the total amount of solar radiation that falls on a horizontal surface, that has been scattered by the atmosphere before reaching the surface).
Preprints 89185 g002
Figure 3. Probability density distribution graphs: (a) air temperature, (b) specific humidity, (c) solar irradiance, and (d) wind speed.
Preprints 89185 g003
Figure 4. Illustration of RELAD-ANN.
Preprints 89185 g004
Figure 5. Illustration of LSIPF.
Preprints 89185 g005
Figure 6. Predictions of RELAD-ANN for testing data: (a) solar irradiance, (b) wind speed, (c) air temperature, and (d) specific humidity.
Preprints 89185 g006
Figure 7. Predictions of LSIPF for testing data: (a) Solar Irradiance, (b) Wind Speed, (c) Air temperature and (d) Specific Humidity.
Preprints 89185 g007
Figure 8. Comparison between RELAD-ANN and LSIPF over actual data: (a) Solar Irradiance, (b) Wind Speed, (c) Air temperature and (d) Specific Humidity.
Preprints 89185 g008
Figure 9. Impact of various parameters on Solar Irradiance through SVR: (a) Air Temperature, (b) Wind Speed and (c) Specific Humidity.
Preprints 89185 g009
Figure 10. Percentage impact of various parameters on Solar Irradiance through Light GBM: (a) Air Temperature, (b) Wind Speed, and (c) Specific Humidity.
Preprints 89185 g010
Table 1. Key Features of RELAD-ANN.
Layer Type Layer Name No. of Nodes Activation Function Total Parameters Optimizer
Input Input Layer 32 ReLU - Adam
Dense Hidden Layer 1 512 ReLU 2560 Adam
Dense Hidden Layer 2 512 ReLU 262656 Adam
Dense Hidden Layer 3 512 ReLU 262656 Adam
Dense Output Layer 1 ReLU 513 Adam
Table 2. Prediction details of each parameter.
Parameters Solar Irradiance Wind Speed Air Temperature Specific Humidity
Maximum actual value 391.5 16.4 31.2 0.02
Minimum actual value 150.0 0.9 -9.8 0.0005
Maximum predicted value RELAD-ANN 373.6 8.3 27.6 0.02
LSIPF 367.0 6.1 31.7 0.01
Minimum predicted value RELAD-ANN 175.0 2.7 -9.3 -0.003
LSIPF 172.0 4.3 -10.4 0.01
Maximum variance with actual RELAD-ANN 55.4 11.6 16.2 0.007
LSIPF 55.7 10.3 16.6 0.008
Minimum variance with actual RELAD-ANN 0.0013 0.003 0.001 9.1E-08
LSIPF 0.0016 8.5E-05 0.001 5.0E-06
Average variance RELAD-ANN 8.2 1.8 2.7 0.0006
LSIPF 12.0 1.7 3.3 0.006
Table 3. Empirical Validation of Models.
Parameters Model R2 MBE MABE MAE RMSE MAPE
Solar Irradiance LSIPF 0.893 -4.62 4.62 11.96 15.09 0.05
RELAD-ANN 0.933 0.41 0.41 8.13 11.30 0.03
Wind Speed LSIPF 0.0008 0.35 0.35 1.70 2.26 0.37
RELAD-ANN 0.012 0.43 0.43 1.91 2.5 0.42
Air Temperature LSIPF 0.757 0.99 0.99 3.31 4.2 0.8
RELAD-ANN 0.797 1.21 1.21 2.83 3.68 0.52
Surface Humidity LSIPF 2.12E-30 -0.01 0.01 0.01 0.01 0.64
RELAD-ANN 0.894 -0.007 0.007 0.0008 0.001 0.38
Disclaimer/Publisher’s Note: The statements, opinions and data contained in all publications are solely those of the individual author(s) and contributor(s) and not of MDPI and/or the editor(s). MDPI and/or the editor(s) disclaim responsibility for any injury to people or property resulting from any ideas, methods, instructions or products referred to in the content.
Copyright: This open access article is published under a Creative Commons CC BY 4.0 license, which permit the free download, distribution, and reuse, provided that the author and preprint are cited in any reuse.
Prerpints.org logo

Preprints.org is a free preprint server supported by MDPI in Basel, Switzerland.

Subscribe

© 2024 MDPI (Basel, Switzerland) unless otherwise stated