
Submitted:
27 October 2023
Posted:
27 October 2023
You are already at the latest version
Abstract
Quinoa, known as the "golden grain" for its high nutritional value, is a significant source of essential nutrients, including proteins, minerals, vitamins, polyphenols, phytosterols, and flavonoids. However, the biological functions of quinoa polysaccharides remain understudied. In this research, two crude quinoa polysaccharides extracts (Q-40 and Q-60) were obtained extracting by 40% and 60% alcohol. The purity of Q-40 and Q-60 was 58.29% and 62.15%, with protein contents of 8.27% and 9.60%, respectively. Monosaccharide analysis revealed that Q-40 contained glucose (Glc), galacturonic acid (GalA), and arabinose (Ara) in a molar ratio of 0.967:0.027:0.006. Q-60 was composed of xylose (xyl), arabinose (Ara), galactose, and galacturonic acid (GalA) with a molar ratio of 0.889:0.036:0.034:0.020. The average molecular weight of Q-40 ranged from 47484 to 626488 Da, while Q-60 showed a range of 10025 to 47990 Da. Rheological experiments showed that Q-40 exhibited higher viscosity, while Q-60 demonstrated more elastic properties. Remarkably, Q-60 showed potent antioxidant abilities, with scavenging rates of 98.49% for DPPH and 57.5% for ABTS. Antibacterial experiments using the microdilution method revealed that Q-40 inhibited the growth of Methicillin-resistant Staphylococcus aureus (MRSA) and E. coli, while Q-60 specifically inhibited MRSA. At lower concentrations, both polysaccharides inhibited MDA cell proliferation, but at higher concentrations, they promoted proliferation. Similar proliferation-promoting effects were observed in HepG2 cells. The research provides important information in application of quinoa in food and functional food industries.
Keywords:
quinoa polysaccharides
; chemical composition
; antioxidant activity
; anti-proliferation activity
; anti-microbial activity
1. Introduction
Chenopodium quinoa Willd, an annual herb originating in South America, is now widely grown in Asia, Africa, and Europe [1,2]. Quinoa was introduced to China in 1988 in Tibet and has seen significant growth since 2008 [3]. It is highly valued for its rich content of proteins, amino acids, starch, cellulose, minerals, and other beneficial nutrients, which impart various health benefits including anti-inflammatory, antibacterial, antitumor, and anti-aging effects [4,5,6]. Recognized by the Food and Agriculture Organization of the United Nations (FAO) as the only whole-nutrient plant for humans, quinoa's nutritional profile meets the dietary needs of people. Its production has been steadily increasing, reaching over 192,000 tons in 2014 [7]. Due to its nutritional value, quinoa is often referred to as "the super grain" and "the mother of grain," while in China, most of the grain produced is used for storage[8].
With increasing cultivation globally, quinoa is poised to become an essential food crop and industrial raw material in the 21st century. In developing countries, where balanced diets with adequate and high-quality protein are challenging to achieve, quinoa holds the potential to address this nutritional gap [9]. Conversely, in developed countries, quinoa can be integrated into snacks, bread, pasta, and prepared foods to enhance their nutritional quality [9]. Investigating the nutritional composition of Chinese quinoa will further improve our understanding and utilization of different quinoa varieties [10]. The consumption of quinoa is being encouraged, as several recent studies have indicated its potential in reducing the risk of cardiovascular disease [11].
Polysaccharides extracted from quinoa, known as biological response modifiers (BRM), play a vital role in the growth and development of organisms [12,13,14]. These polysaccharides have diverse biological functions, including energy storage, structural support, and physical defense, as well as critical physiological functions like antioxidant [15,16], hypolipidemic [17,18], hypoglycemic [19], anti-tumor [20], and immune-enhancing effects [21,22].
While the extraction of polysaccharides from various plants has been extensively studied, research on quinoa polysaccharides remains limited. In this study, we prepared crude quinoa polysaccharides through hot water extraction and subsequently separated them into different fractions using graded ethanol precipitation. We investigated the yield, polysaccharide content, rheological characteristics, protein content, and antioxidant activity of each fraction. Additionally, we analyzed the monosaccharide composition, molecular weight, and thermogravimetric properties of Q-40 and Q-60, two specific quinoa polysaccharides. Furthermore, we evaluated their in vitro anti-proliferative activity and antibacterial abilities. This study contributes valuable information for future structural identification and product development involving quinoa polysaccharides.
2. Results
2.1. The Yield of Crude Polysaccharides and Its Component Analysis
Ethanol can reduce the dielectric constant of polysaccharide solutions, thereby decreasing the interaction of polysaccharides with water and leading to the precipitation of polysaccharide polymers. In this study, we investigated the impact of 40% and 60% concentrations of ethanol on the precipitation and fractionation of quinoa polysaccharides. Two quinoa polysaccharides, namely Q-40 and Q-60, were obtained through ethanol fractionation. After freeze-drying, Q-40 appeared as a light yellow flocculent substance, while Q-60 exhibited a darker color compared to Q-40. According to the results of phenol-sulfuric acid experiment and colloidal Coomassie brilliant blue experiment, the polysaccharide content of Q-40 was found to be 58.29%, with a protein content of 8.27%, whereas Q-60 contained 62.15% polysaccharide and 9.6% protein content.
2.2. Rheological Characteristics
The viscosity of Q-40 and Q-60 sample solutions increased as the concentration increased, with Q-60 solutions consistently exhibiting higher viscosity than Q-40 solutions at equivalent concentrations (Figure 1A). Furthermore, all solutions displayed shear-thinning behaviors, indicating their pseudoplastic properties, as the shear rate increased.
Figure 1 (B-C) presented the storage modulus (G') and loss modulus (G'') of Q-40 (a) and Q-60 (b) against frequency (0.1% strain), providing insights into the viscoelastic properties of the polysaccharides. Both Q-40 and Q-60 solutions displayed frequency and concentration-dependent behavior in terms of their storage and loss moduli. Specifically, the storage modulus (G') of Q-40 solutions at concentrations of 10 mg/mL and 20 mg/mL was higher than the loss modulus (G''), indicating elastic behavior in those cases. Conversely, at 5 mg/mL and 40 mg/mL concentrations, the G' and G'' intersected. The 5 mg/mL solution exhibited viscous properties at high frequency (G' < G'') and elastic properties at low frequency (G' > G''), while the 40 mg/mL solution's behavior became unstable as the frequency increased, showing several intersections. This may be attributed to the complex network structure formed by the high concentration of Q-40 polysaccharides.
In contrast, Q-60 solutions showed concentration-dependent viscoelastic properties. At lower concentrations, they displayed elastic behavior (G' > G''), whereas higher concentrations led to viscous behavior (G' < G'') as the frequency increased.
The data highlights distinct rheological properties between Q-40 and Q-60, underscoring the significant influence of ethanol concentration on the precipitation of quinoa polysaccharides. Overall, polysaccharides precipitated with 40% ethanol exhibited more viscous behavior, while those extracted with 60% ethanol displayed more elastic components.
2.3. Monosaccharide Composition
Figure 2A displays the HPLC diagrams of 16 monosaccharide standard derivatives, and standard curves were generated based on the peak times and peak areas of these monosaccharides. In the case of Q-60, the peak appearance times were recorded as 10.159, 12.784, 14.234, and 43.934 minutes, indicating the presence of arabinose, galactose, glucose, and galacturonic acid in the sample, with a molar ratio of 0.036:0.034:0.889:0.020, respectively.
It is worth noting that some studies reported quinoa polysaccharides to mainly consist of six sugars: arabinose, rhamnose, xylose, mannose, galactose, and glucose, with glucose being the most abundant among them. The observed differences in monosaccharide composition between Q-60 and the reported findings may be attributed to variations in the raw material origins of quinoa and the methods used for polysaccharide extraction and separation. Such factors can lead to differences in the final polysaccharide composition obtained from different sources of quinoa.
2.4. Molecular Weight
Figure 3 displays the molecular weight and purity of quinoa polysaccharides determined using the HPGPC method. The spectrum of Q-40 exhibited three elution peaks, while that of Q-60 showed two elution peaks. Interestingly, both salt peaks were followed by additional peaks, suggesting the possible presence of oligosaccharide components in both Q-40 and Q-60 polysaccharides. Additionally, the asymmetry and varying widths of the peaks provided evidence of the heterogeneous nature of the polysaccharides, indicating a mixture of several polysaccharide components in both samples.
Furthermore, the molecular weights of the quinoa polysaccharides obtained from 40% and 60% ethanol gradients differed (as shown in Table 1). The molecular weights gradually decreased with increasing ethanol concentration, and the molecular weight distribution index indicated that Q-60 had a relatively narrow distribution compared to Q-40. This suggests that the extraction with 60% ethanol resulted in polysaccharides with a more uniform molecular size distribution, while the use of 40% ethanol led to a
broader range of molecular weights in the polysaccharide mixture.

Table 1.
Relative molecular masses of Q-40 and Q-60.
| Sample | LM-40 | LM-60 | |||
| Peak 1 | Peak 2 | Peak 3 | Peak 1 | Peak 2 | |
| Mp | 433062 | 155898 | 38510 | 38739 | 8924 |
| Mw | 626488 | 210818 | 47484 | 47990 | 10025 |
| Mn | 350187 | 127526 | 32003 | 32427 | 7601 |
| PDI (Mw/Mn) | 1.789 | 1.653 | 1.484 | 1.480 | 1.319 |
2.5. SEM Analysis
Upon observation under a 500× microscope, Q-40 displayed a cluster-turned flake structure with varying sizes. The surface appeared smooth and intact, indicating strong polymerization and interactions between the polysaccharide components. Further examination under a 5000× microscope revealed characteristic large indentations on the polysaccharide surface, accompanied by internal holes.
In contrast, Q-60 exhibited a fragmented polysaccharide structure with diverse sizes and numerous irregular bumps on the surface, forming spherical or ovoid shapes when viewed under a 500× microscope. Upon magnification to 5000×, the surface of the polysaccharides appeared porous, resembling a honeycomb-like structure (Figure 4).
2.6. Thermal Analysis
Three primary curves were employed for the thermal analysis, as depicted in Figure 5 (A-B). The combination of TG (Thermogravimetric Analysis), DTG (Derivative Thermogravimetric Analysis), and DSC (Differential Scanning Calorimetry) curves revealed two distinct thermal weight loss peaks. The initial weight loss peak was observed at approximately 70°C, with both polysaccharide fractions experiencing a weight loss of around 7%. This weight loss primarily resulted from the evaporation of water present in the samples.
The second weight loss peak occurred within the temperature range of 200 to 510°C, during which the polysaccharides underwent rapid weight loss. Q-40 lost about 63% of its weight, while Q-60 lost about 56%. This significant weight reduction indicates violent decomposition reactions and oxidation of polysaccharides within this temperature range. However, the decomposition reactions tended to stabilize after reaching 510°C.
2.7. Antioxidant Activity
Figure 6 demonstrates the scavenging activities of Q-40, Q-60, and ascorbic acid on DPPH and ABTS radicals. In particular, Q-60 exhibited significantly higher scavenging rate on DPPH radicals compared to Q-40 (Figure 6A). At a concentration of 5.0 mg/mL, the DPPH radical scavenging ability of Q-40 was measured at 66.18%, whereas Q-60 showed a remarkable DPPH radical scavenging rate of 98.49%. These results indicate that quinoa polysaccharides obtained through ethanol graded precipitation hold substantial value for effectively scavenging DPPH radicals.
Regarding ABTS radical scavenging (Figure 6B), both Q-40 and Q-60 displayed considerable scavenging abilities, although their overall effect was weaker than that of ascorbic acid. As the concentration ranged from 0 to 5.0 mg/mL, the ABTS radical scavenging capacity of Q-40 and Q-60 gradually increased. At 5.0 mg/mL, Q-40 demonstrated an ABTS radical scavenging activity of 27.26%, while Q-60 exhibited a higher rate of 57.5%.
2.8. Anti-proliferation Effect
Figure 7 presents the image of MDA and HepG2 cells after the treatment of Q-40 and Q-60 which indicated anti-proliferative activities of Q-40 and Q-60 against the two types of cells. For MDA cells cultivated for 24 h at lower concentrations (31.25 μg/mL), both Q-40 and Q-60 showed only a slight anti-proliferative effect (4.6%, 8.2%). Notably, for MDA cells cultivated for 48 h, Q-40 displayed a minor anti-proliferative effect at low concentrations (31.25 μg/mL), while Q-60 and Q-40 at other concentrations exhibited a pronounced promotion effect. Specifically, Q-60 showed the greatest proliferation-promoting effect at 1000 μg/mL, whereas the promotion effect of Q-40 increased with higher concentrations.
In HepG2 cells, both Q-40 and Q-60 demonstrated proliferation-promoting effects, and these effects increased with higher concentrations at 24 h. However, at 48 h, the promotion effects of both polysaccharides were not as evident, and the promotion effect was not apparent at concentrations of 250 μg/mL and higher.
In summary, the anti-proliferative activities of Q-40 and Q-60 varied depending on the concentration and cell type. While both polysaccharides exhibited anti-proliferative effects at lower concentrations and shorter incubation times in MDA cells, they demonstrated promotion effects at higher concentrations and longer incubation times. Conversely, in HepG2 cells, both polysaccharides displayed promotion effects at 24 h, but the effects were not significant at 48 h, particularly at higher concentrations.
2.9. Anti-microbial Ability
The antimicrobial abilities of Q-40 and Q-60 against C. albicans, C. neoformans, MRSA, E. coli, T. rubrum, and T. mentagrophytes were assessed using the microdilution method, and the results are summarized in Table 2. Q-40 displayed inhibitory activity against MRSA and E. coli, with inhibition rates of 16.61±0.87% and 3.39±1.91%, respectively. However, no inhibitory effect of Q-40 was observed on C. albicans, C. neoformans, T. rubrum, and T. mentagrophytes. On the other hand, Q-60 exhibited inhibitory activity against MRSA, with an inhibition rate of 23.97±0.64%. Similar to Q-40, Q-60 did not show any inhibitory effect on C. albicans, C. neoformans, E. coli, T. rubrum, or T. mentagrophytes.
In summary, both Q-40 and Q-60 demonstrated some degree of antimicrobial activity against MRSA, while Q-40 also exhibited a minimal inhibitory effect on E. coli. However, neither polysaccharide had any inhibitory effect on the other tested microorganisms, including C. albicans, C. neoformans, T. rubrum, and T. mentagrophytes.
3. Materials and Methods
3.1. Materials and Reagents
Quinoa was purchased from Shanxi Jiaqi Quinoa Development Co.Ltd (Shanxi, China). Ethanol, sulfuric acid, and trichloromethane were purchased from Guangzhou Chemical Reagent Factory (Guangdong, China). Petroleum ether and phenol were purchased from Tianjin Damao Chemical Reagent Factory (Tianjin, China). Normal butanol was purchased from Tianjin Yongda Chemical Reagent Co.Ltd (Tianjin, China). Monosaccharide standards, including rhamnose, xylose, glucose, etc., were chromatographically pure and purchased from Shanghai Yuanye Biotechnology Co.Ltd (Shanghai, China).
3.2. Preparation of polysaccharides (Q-40 and Q-60)
1 kg of quinoa was initially washed with deionized water, crushed, and then passed through a 60-mesh sieve. Next, petroleum ether was added, and reflux extraction was conducted for 1 hour each time. The mixture was then filtered, and the residue was subjected to two cycles of reflux extraction with 95% ethanol for 2 hours each, aiming to remove pigments, lipids, and small molecules such as monosaccharides. Subsequently, the resulting filter residue was dried in an oven at 45°C for 48 hours, yielding the quinoa sample powder.
For the pretreated quinoa sample, it was mixed with deionized water at a ratio of 1:20 (g/mL) and subjected to reflux in a water bath at 100°C for 2 hours. Afterward, the sample underwent centrifugation at 4500 rpm for 15 minutes, and the supernatant was collected and concentrated under reduced pressure. The process was repeated once. To remove the residual Sevag reagent, a Sevag reagent (chloroform:n-butanol=4:1) treatment was performed, and this operation was repeated 4-5 times. The remaining Sevag reagent was then removed by spin evaporation under reduced pressure at 50°C. After deproteinization, the quinoa polysaccharide was prepared as a 10 mg/mL polysaccharide solution and mixed with anhydrous ethanol to achieve a 40% ethanol concentration. The resulting mixture was refrigerated overnight at 4°C, and the precipitate was collected by centrifugation (4500 rpm) for 15 minutes. This precipitate was later re-dissolved in deionized water and dialyzed in dialysis bags (with an MWCO of 3500 Da) for 48 hours. During this period, the water was changed every 16 hours. The polysaccharide solution in the dialysis bags was collected and freeze-dried, resulting in the 40% fraction of polysaccharide Q-40. The same method was employed to obtain Q-60 with the ethanol concentration being increased to 60%.
3.3. Determination of physical and chemical properties
The standard curve regression equation for the determination of polysaccharide content using the sulfuric acid-phenol method was y = 0.0061x - 0.0058, with a high correlation coefficient R2 = 0.9981. Here, the mass concentration of D-glucose served as the horizontal coordinate, and the absorbance was the vertical coordinate [23].
For the determination of protein content through the Kormas Brilliant Blue method, the standard curve regression equation was y = 0.005x + 0.3556, with a strong correlation coefficient R2 = 0.9982. The mass concentration of bovine serum albumin was used as the horizontal coordinate, and the absorbance as the vertical coordinate [24].
3.4. Rheological characteristics analysis
Rheological measurements were carried out using a rheometer (RST-CPS, Brookfield, US) equipped with a 40 mm parallel plate. The linear viscoelastic properties, including the storage modulus (G') and loss modulus (G''), of both Q-40 and Q-60 at various concentrations were determined using dynamic strain sweep and dynamic frequency sweep techniques at room temperature (25°C).
To perform the measurements, the samples were dissolved at concentrations of 5, 10, 20, and 40 mg/mL in deionized water. The dynamic frequency sweep was conducted in the frequency range from 0.1 to 100 Hz, with 1 mL of the sample injected for each measurement.
3.5. Monosaccharide composition analysis
The determination of monosaccharide composition was carried out using ion chromatography [25]. A ten-milligram sample in an ampoule was mixed with 10 mL of 3 mol/L trifluoroacetic acid (TFA) and then hydrolyzed at 120°C for 3 hours. The acid hydrolysis solution was accurately transferred to a tube, dried with nitrogen, and then 5 mL of water was added and mixed thoroughly using vortexing. Next, 100 μL of the solution was aspirated and combined with 900 μL of deionized water. After centrifugation at 12,000 rpm for 5 minutes, the supernatant was collected for analysis using ion chromatography by Thermo Scientific Dionex.
To create the monosaccharide standards, 16 monosaccharides (fucose, rhamnose, arabinose, galactose, glucose, xylose, mannose, fructose, ribose, galacturonic acid, glucuronic acid, aminogalactose hydrochloride, glucosamine hydrochloride, N-acetyl-D glucosamine, gulo-glucuronic acid, and mannuronic acid) were added to a 10 mg/mL standard solution. Each monosaccharide standard solution was precisely prepared to a concentration of 5 mg/L. The monosaccharide concentrations were determined based on the monostandard method, and the molar ratios were calculated using the respective molar masses of the monosaccharides.
For the chromatography, the following conditions were applied: The chromatographic column used was DionexCarbopacTMPA20 (3*150). The mobile phase comprised three components: A: H2O; B: 15 mM NaOH; C: 15 mM NaOH & 100 mM NaOAc. The flow rate was set to 0.3 mL/min, and the injection volume was 5 µL. The column temperature was maintained at 30ºC, and detection was performed using an electrochemical detector.
3.6. molecular weight.
High-Performance Gel Permeation Chromatography (HPGPC) was used to analyzed polysaccharide molecular weight and purity[26]. The samples and standards were weighed precisely, and the samples were prepared at 5 mg/mL and centrifuged at 12000 rpm for 10 min. And then, the supernatant was filtered through a 0.22 μm microporous membrane. The samples were transferred into 1.8 mL injection vials. Chromatography Conditions: Chromatographic column: BRT105-104-102 tandem gel column (8×300 mm). Mobile phase: 0.05 mol/L NaCl solution. Flow rate: 0.6 mL/min, column temperature: 40ºC. Injection volume: 20 μL. Detector: RI-10A differential detector.
3.7. Scanning Electron Microscopy (SEM) analysis
A small amount of Q-40 and Q-60 polysaccharides were weighed onto the sample stage, sprayed with gold, and placed under the scanning electron microscope for observation and filming. The morphology was obtained after the instrument was set up and stabilized.
3.8. Thermal stability analysis
The thermal stability of polysaccharides was determined by the following methods[27]. Appropriate amounts of Q-40 and Q-60 polysaccharides were weighed onto the sample bench, warmed up to 600 °C at a rate of 10 °C/min, and analyzed by thermogravimetry (TG), differential thermal gravity (DTG) and differential scanning calorimetry (DSC). The temperature and weight loss curves were used as the X and Y axes to plot the thermogravimetric variation curves.
3.9. Antioxidant activity analysis
3.9.1. DPPH radical scavenging activity
The determination of DPPH radical scavenging activity was conducted with slight modifications [28]. Polysaccharide solutions were prepared at concentrations of 0, 1.0, 2.0, 3.0, 4.0, and 5.0 mg/mL, and their respective DPPH radical scavenging rates were measured. The absorbance values at 517 nm were recorded using a spectrophotometer, and the DPPH radical scavenging ability was calculated using ascorbic acid as the control group with the following formula:
where A1 represents the absorption of the DPPH solution with the polysaccharide sample, A2 is the absorption of anhydrous ethanol with the polysaccharide sample, and A is the absorption of the DPPH solution with deionized water
Scavenging rate/%=(1-(A1-A2)/A)×100%
3.9.2. ABTS radical scavenging activity analysis
The determination of ABTS radical scavenging activity was conducted following a method reported by Meng with slight modifications [29]. Polysaccharide solutions were prepared at concentrations of 0, 1.0, 2.0, 3.0, 4.0, and 5.0 mg/mL, and their respective ABTS radical scavenging rates were determined. The solution was filtered through a 0.45 μm microporous membrane and then diluted with PBS (5.0 mmol/L, pH 7.4) to achieve an absorbance value of 0.70±0.02 at 734 nm before measurement. Next, 0.4 mL of the sample solution with different concentrations was added to 4 mL of the working solution, shaken vigorously for 30 seconds, and left to stand for 6 minutes in the dark. The absorbance was then measured at the same wavelength. The scavenging ability of ABTS radicals was calculated as follows:
where A1 represents the ABTS solution with the polysaccharide sample solution added, A2 is the ABTS solution with deionized water and the polysaccharide sample solution added, and A is the ABTS solution with deionized water added.
Scavenging rate/%=(1-(A1-A2)/A)×100%
3.10. Anti-proliferation activity analysis
The Cell Counting Kit-8 (CCK-8) assay was employed to evaluate the anti-proliferation effect of quinoa polysaccharides on HepG2 and MDA cells [30]. During the logarithmic growth phase, HepG2 and MDA cells were seeded into 96-well plates at a density of 5000 cells/well and then placed in a thermostatic incubator at 37°C with 5% CO2 overnight. Subsequently, the supernatant medium in the wells was discarded, and the cells were washed twice with sterile PBS. Next, a new DMEM medium solution containing various concentrations of quinoa polysaccharide extracts (ranging from 0.03125 to 1.00 mg/mL) was added to the wells. After 24 hours and 48 hours of incubation, the cells were removed, photographed, and then incubated with the Cell Counting Kit-8 working solution for 1 to 2 hours. The absorbance at 450 nm was measured using a microplate reader to determine the inhibition rate of cell proliferation. The calculation of the inhibition rate is as follows:
where A1 represents the absorbance of the experimental group (cells treated with quinoa polysaccharide extracts), and A is the absorbance of the control group (cells without quinoa polysaccharide treatment).
Inhibition rate=(1-A1/A)×100%
3.11. Anti-microbial activity
To evaluate the antifungal activity against filamentous fungi, T. rubrum and T. mentagrophytes were individually cultured for 2 weeks at 28°C on SDA (Sabouraud Dextrose Agar) to produce conidia. A mixed suspension of conidia and hyphae fragments was obtained by covering the fungal colonies with sterile saline (0.85%) and gently rubbing the colonies with an inoculation loop. The resulting suspension was then filtered through four layers of sterile lens paper to remove the hyphae, and the remaining conidia were collected by centrifugation at 1000 g for 10 minutes. The conidia were washed twice with sterile saline, and their concentration was adjusted to 1 × 10⁴ cells/mL using a hemocytometer for cell counting.
Antifungal susceptibility testing was conducted following the guidelines outlined in documents M38-A2 and previous research, with minor modifications [31,32]. The testing medium used was RPMI 1640 with L-glutamine buffered to pH 7.0 with 0.165 M 3-(N-morpholino) propanesulfonic acid (MOPS) and supplemented with 2% glucose (m/v). For the assay, 195 μL of the prepared conidia or spore suspension was seeded into 96-well plates, and each well was supplemented with 5 μL of the tested agents. Three replicates were used for each treatment, with ketoconazole serving as a positive control. The 96-well plates were then incubated at 28±2°C for 7 days, and the optical density was measured at 510 nm using a microplate reader.
For antifungal susceptibility testing of yeasts, a micro-broth dilution assay was employed. The test compounds were dissolved in DMSO at a stock concentration of 4 mg/mL and stored at 4°C for the bioassays. Exponentially growing cultures of each strain were prepared from overnight cultures and adjusted to an OD value of approximately 0.5 at 600 nm. The cultures were then diluted 1:1000 in broth (C. neoformans was directly used at OD600 = 0.05) and added to a 96-well plate at a volume of 195 µL per well. Ketoconazole (at a concentration of 10 µg/mL) was used as a positive control for C. albicans and C. neoformans. After incubation for 48 hours, the plates were read at 600 nm, and inhibition was calculated by subtracting the absorbance of the blank wells, dividing by the average value for the DMSO-only wells, and multiplying by 100.
Similarly, samples were tested for planktonic microbial growth inhibition using the micro-broth dilution assay mentioned above [33]. The compounds and standard drugs were prepared in DMSO. Exponentially growing cultures of S. aureus, E. coli, S. mutans, and S. sobrinus were prepared from overnight cultures and adjusted to an OD value of 0.5 at 600 nm. The cultures were then diluted 1:1000 in broth and added to a 96-well plate at a volume of 195 µL per well. Penicillin G and Tetracycline (at a concentration of 10 µg/mL in DMSO) were used as standard drugs. After incubation for 24 hours, the plates were read at 600 nm, and inhibition was calculated using the formula:
where A1 stands for the absorbance of the experimental group, A2 is for the blank group, A is for the control group.
Inhibition Rate=(1-(A1-A2)/A)×100%
3.12. Data Analysis
Each experiment was replicated three times and the mean was used. Data analysis was performed using Excel 2010. Origin 8.6 was used to plot the graphs. The data are expressed as the mean ± standard deviation (mean ± SD).
4. Conclusion
The current study focused on the extraction of two polysaccharides from quinoa using the ethanol grading method, namely Q-40 and Q-60. The analysis revealed that Q-40 had a polysaccharide content of 58.29% and a protein content of 8.27%, while Q-60 had a polysaccharide content of 62.15% and a protein content of 9.6%. Both Q-40 and Q-60 displayed heterogeneous polysaccharide profiles, with Q-40 showing three molecular weight peaks and Q-60 exhibiting two peaks. Moreover, both polysaccharides exhibited significant DPPH and ABTS radical scavenging abilities, indicating potent antioxidant properties.
The antioxidant ability of polysaccharides is crucial for combating oxidative stress, which plays a role in aging and various human diseases, such as diabetes and liver damage. Q-40 and Q-60 exhibited considerable antioxidant activity, particularly Q-60, suggesting their potential application as natural antioxidants in the nutritional and pharmaceutical industries.
Regarding antimicrobial activity, Q-40 demonstrated antibacterial effects against MRSA and E. coli, while Q-60 exhibited antibacterial effects against MRSA. Although the inhibition abilities were weaker than those of the positive control group, this finding aligns with observations from other plant polysaccharides. The exact mechanisms underlying the antimicrobial ability of quinoa polysaccharides require further investigation, considering the polysaccharides are not 100% pure.
As for anti-proliferative effects, both Q-40 and Q-60 displayed inhibitory effects at low concentrations against MDA and HepG2 cells in in vitro experiments. However, no further effects on tumor cells were observed. In-depth in vivo studies are needed to explore the potential antitumor activity of quinoa polysaccharides. Moreover, our preliminary data indicated that Q-40 and Q-60 exhibit antioxidant, antimicrobial, and anti-proliferative activities. However, the mechanisms underlying how quinoa polysaccharides exert protective roles in aging processes and human disease development require further investigation.
In conclusion, this study highlights quinoa polysaccharides as promising candidates for food supplementation or products aimed at improving human health and well-being. The potent antioxidant, antimicrobial, and anti-proliferative activities of these polysaccharides hold significant potential for various applications, and further research is essential to fully understand their mechanisms and explore their therapeutic potential.
Author Contributions
Xucheng Zhu Investigation, Writing – Original Draft; Guiyan Yang Conceptualization, Methodology; Yingbin Shen Project administration, Writing - Review & Editing Liqiong Niu Review & Editing. Yao Peng Formal Analysis, Visualization; Haiting Chen Data Curation. Haimei Li Supervision, Funding acquisition; Xinquan Yang Supervision, Funding acquisition
Acknowledgments
This research was funded by Guangzhou Municipal Science and Technology Bureau, grant number 621045-06001,and National Natural Science Foundation of China, grant number 622219-12.
Conflicts of Interest
The authors declared that they have no conflict of interest.
References
- Watanabe, K.; Peng, N. L.; Tang, H.; Mitsunaga, T. Molecular Structural Characteristics of Quinoa Starch. Food science and technology research 2007, 13(1), 73–76. [Google Scholar] [CrossRef]
- Lim, J. G.; Park, H. M.; Yoon, K. S. , Analysis of saponin composition and comparison of the antioxidant activity of various parts of the quinoa plant (Chenopodium quinoa Willd.). Food Sci Nutr 2020, 8(1), 694–702. [Google Scholar] [CrossRef]
- Wu, L.; Wang, A.; Shen, R.; Qu, L. , Effect of processing on the contents of amino acids and fatty acids, and glucose release from the starch of quinoa. Food Sci Nutr 2020, 8(9), 4877–4887. [Google Scholar] [CrossRef] [PubMed]
- M, W. G.; M, W., Identification and biological activities of triterpenoid saponins from Chenopodium quinoa. Journal of agricultural and food chemistry 2001, 49, (5).
- Hirose, Y.; Fujita, T.; Ishii, T.; Ueno, N. Antioxidative properties and flavonoid composition of Chenopodium quinoa seeds cultivated in Japan. Food Chemistry 2009, 119, (4). [CrossRef]
- Stuardo, M.; Martín, R. S. Antifungal properties of quinoa ( Chenopodium quinoa Willd) alkali treated saponins against Botrytis cinerea. Industrial Crops & Products 2007, 27, (3). [CrossRef]
- Li, G.; Zhu, F. , Quinoa starch: Structure, properties, and applications. Carbohydr Polym 2018, 181, 851–861. [Google Scholar] [CrossRef] [PubMed]
- Zhai, Y.; Pan, L.; Luo, X.; Zhang, Y.; Wang, R.; Chen, Z. , Effect of electron beam irradiation on storage, moisture and eating properties of high-moisture rice during storage. Journal of Cereal Science 2022, 103. [Google Scholar] [CrossRef]
- Zhu, N.; Kikuzaki, H.; Vastano, B. C.; Nakatani, N.; Ho, C. T. Ecdysteroids of Quinoa Seeds (Chenopodium quinoa Willd.). Journal of Agricultural and Food Chemistry 2001, 49, (5), 2576-2578. [CrossRef]
- Lamothe, L. M.; Srichuwong, S.; Reuhs, B. L.; Hamaker, B. R. Quinoa (Chenopodium quinoa W.) and amaranth (Amaranthus caudatus L.) provide dietary fibres high in pectic substances and xyloglucans. Food Chem 2015, 167, 490-6. [CrossRef]
- Li, L.; Lietz, G.; Seal, C. J. Phenolic, apparent antioxidant and nutritional composition of quinoa (Chenopodium quinoa Willd.) seeds. International Journal of Food Science & Technology 2021, 56, (7), 3245-3254. [CrossRef]
- Zhou, P.; Eid, M.; Xiong, W.; Ren, C.; Ai, T.; Deng, Z.; Li, J.; Li, B. , Comparative study between cold and hot water extracted polysaccharides from Plantago ovata seed husk by using rheological methods. Food Hydrocolloids 2020, 101. [Google Scholar] [CrossRef]
- Xie, L.; Shen, M.; Wen, P.; Hong, Y.; Liu, X.; Xie, J. , Preparation, characterization, antioxidant activity and protective effect against cellular oxidative stress of phosphorylated polysaccharide from Cyclocarya paliurus. Food Chem Toxicol 2020, 145, 111754. [Google Scholar] [CrossRef]
- Chen, W.; Zhu, X.; Wang, L.; Xin, X.; Zhang, M. , Effects of two polysaccharides from Lepidium meyenii (maca) on intestinal immunity and inflammation in vitro. Food Funct 2022, (6), 3441–3452. [Google Scholar] [CrossRef]
- Yin, Z. N.; Wu, W. J.; Sun, C. Z.; Liu, H. F.; Chen, W. B.; Zhan, Q. P.; Lei, Z. G.; Xin, X.; Ma, J. J.; Yao, K.; Min, T.; Zhang, M. M.; Wu, H. , Antioxidant and Anti-inflammatory Capacity of Ferulic Acid Released from Wheat Bran by Solid-state Fermentation of Aspergillus niger. Biomed Environ Sci 2019, (1), 11–21. [Google Scholar]
- Zhang, L.; Hu, Y.; Duan, X.; Tang, T.; Shen, Y.; Hu, B.; Liu, A.; Chen, H.; Li, C.; Liu, Y. , Characterization and antioxidant activities of polysaccharides from thirteen boletus mushrooms. Int J Biol Macromol 2018, 113, 1–7. [Google Scholar] [CrossRef]
- Jia, R. B.; Li, Z. R.; Wu, J.; Ou, Z. R.; Zhu, Q.; Sun, B.; Lin, L.; Zhao, M. , Physicochemical properties of polysaccharide fractions from Sargassum fusiforme and their hypoglycemic and hypolipidemic activities in type 2 diabetic rats. Int J Biol Macromol 2020, 147, 428–438. [Google Scholar] [CrossRef] [PubMed]
- Yang, Z. W.; Ouyang, K. H.; Zhao, J.; Chen, H.; Xiong, L.; Wang, W. J. , Structural characterization and hypolipidemic effect of Cyclocarya paliurus polysaccharide in rat. Int J Biol Macromol 2016, 91, 1073–80. [Google Scholar] [CrossRef] [PubMed]
- Liu, Y.; Tang, T.; Duan, S.; Li, C.; Lin, Q.; Wu, H.; Liu, A.; Hu, B.; Wu, D.; Li, S.; Shen, L.; Wu, W. , The purification, structural characterization and antidiabetic activity of a polysaccharide from Anoectochilus roxburghii. Food Funct 2020, (4), 3730–3740. [Google Scholar] [CrossRef] [PubMed]
- Xie, L.; Shen, M.; Hong, Y.; Ye, H.; Huang, L.; Xie, J. , Chemical modifications of polysaccharides and their anti-tumor activities. Carbohydr Polym 2020, 229, 115436. [Google Scholar] [CrossRef]
- He, P.; Dong, Z.; Wang, Q.; Zhan, Q. P.; Zhang, M. M.; Wu, H. , Structural Characterization and Immunomodulatory Activity of a Polysaccharide from Eurycoma longifolia. J Nat Prod 2019, (2), 169–176. [Google Scholar] [CrossRef] [PubMed]
- Xiong, L.; Ouyang, K. H.; Jiang, Y.; Yang, Z. W.; Hu, W. B.; Chen, H.; Wang, N.; Liu, X.; Wang, W. J. , Chemical composition of Cyclocarya paliurus polysaccharide and inflammatory effects in lipopolysaccharide-stimulated RAW264.7 macrophage. Int J Biol Macromol 2018, (Pt B), 1898–1907. [Google Scholar] [CrossRef]
- Zhan, Q.; Wang, Q.; Lin, R.; He, P.; Lai, F.; Zhang, M.; Wu, H. , Structural characterization and immunomodulatory activity of a novel acid polysaccharide isolated from the pulp of Rosa laevigata Michx fruit. Int J Biol Macromol 2020, 145, 1080–1090. [Google Scholar] [CrossRef] [PubMed]
- Zhu, K.; Zhang, Y.; Nie, S.; Xu, F.; He, S.; Gong, D.; Wu, G.; Tan, L. , Physicochemical properties and in vitro antioxidant activities of polysaccharide from Artocarpus heterophyllus Lam. pulp. Carbohydr Polym 2017, 155, 354–361. [Google Scholar] [CrossRef] [PubMed]
- Wenjin, M. A.; Meilin, L. I.; Wang, B.; Zhang, Y.; Changqing, Y. U.; Ban, S. , Determination of Monosaccharide Composition of Extracellular Polysaccharides from R. mucilaginosa CICC 33013 by Ion Chromatography. Farm Products Processing 2019. [Google Scholar]
- Liu, Y.; Liu, Y.; Zhang, M.; Li, C.; Zhang, Z.; Liu, A.; Wu, Y.; Wu, H.; Chen, H.; Hu, X.; Lin, B.; Wu, W. , Structural characterization of a polysaccharide from Suillellus luridus and its antidiabetic activity via Nrf2/HO-1 and NF-κB pathways. International Journal of Biological Macromolecules 2020, 162. [Google Scholar] [CrossRef]
- Iqbal, M. S.; Massey, S.; Akbar, J.; Ashraf, C. M.; Masih, R. Thermal analysis of some natural polysaccharide materials by isoconversional method. Food Chem 2013, 140, (1-2), 178-82. [CrossRef]
- Song, Q.; Jiang, L.; Yang, X.; Huang, L.; Yu, Y.; Yu, Q.; Chen, Y.; Xie, J. Physicochemical and functional properties of a water-soluble polysaccharide extracted from Mung bean (Vigna radiate L.) and its antioxidant activity. Int J Biol Macromol 2019, 138, 874-880. [CrossRef]
- Meng, Z.; Yi, H.; Li, J.; Qi, A.; Ye, X.; Xiang, L.; Zhao, Z.; Yang, Z.; Jing, H. Structural characterization and antioxidant activity of an acetylated Cyclocarya paliurus polysaccharide (Ac-CPP0.1). Int J Biol Macromol 2021, 171, 112-122.
- Na, S.; Junyi, M.; Wei, H.; Yongyue, G.; Ling, H.; Mohamed, A.; Jun, M. Lappaconitine hydrochloride inhibits proliferation and induces apoptosis in human colon cancer HCT-116 cells via mitochondrial and MAPK pathway. Acta Histochemica 2021, 123, (5).
- Song, X.; Wei, Y. X.; Lai, K. M.; He, Z. D.; Zhang, H. J. , In vivo antifungal activity of dipyrithione against Trichophyton rubrum on guinea pig dermatophytosis models. Biomed Pharmacother 2018, 108, 558–564. [Google Scholar] [CrossRef] [PubMed]
- Wong-Deyrup, S. W.; Song, X.; Ng, T. W.; Liu, X. B.; Zeng, J. G.; Qing, Z. X.; Deyrup, S. T.; He, Z. D.; Zhang, H. J. , Plant-derived isoquinoline alkaloids that target ergosterol biosynthesis discovered by using a novel antifungal screening tool. Biomed Pharmacother 2021, 137, 111348. [Google Scholar] [CrossRef] [PubMed]
- Song, X.; Gaascht, F.; Schmidt-Dannert, C.; Salomon, C. E. Discovery of Antifungal and Biofilm Preventative Compounds from Mycelial Cultures of a Unique North American Hericium sp. Fungus. Molecules 2020, 25, (4). [CrossRef]
Figure 1.
Rheological properties of Q-40 and Q-60. (A) Effect of concentration on the viscosity of Q-40 and Q-60 solutions; (B) Effect of concentration on the storage modulus (G’); (C) Effect of concentration on the loss modulus (G’’) of Q-40 and Q-60 solutions.
Figure 1.
Rheological properties of Q-40 and Q-60. (A) Effect of concentration on the viscosity of Q-40 and Q-60 solutions; (B) Effect of concentration on the storage modulus (G’); (C) Effect of concentration on the loss modulus (G’’) of Q-40 and Q-60 solutions.
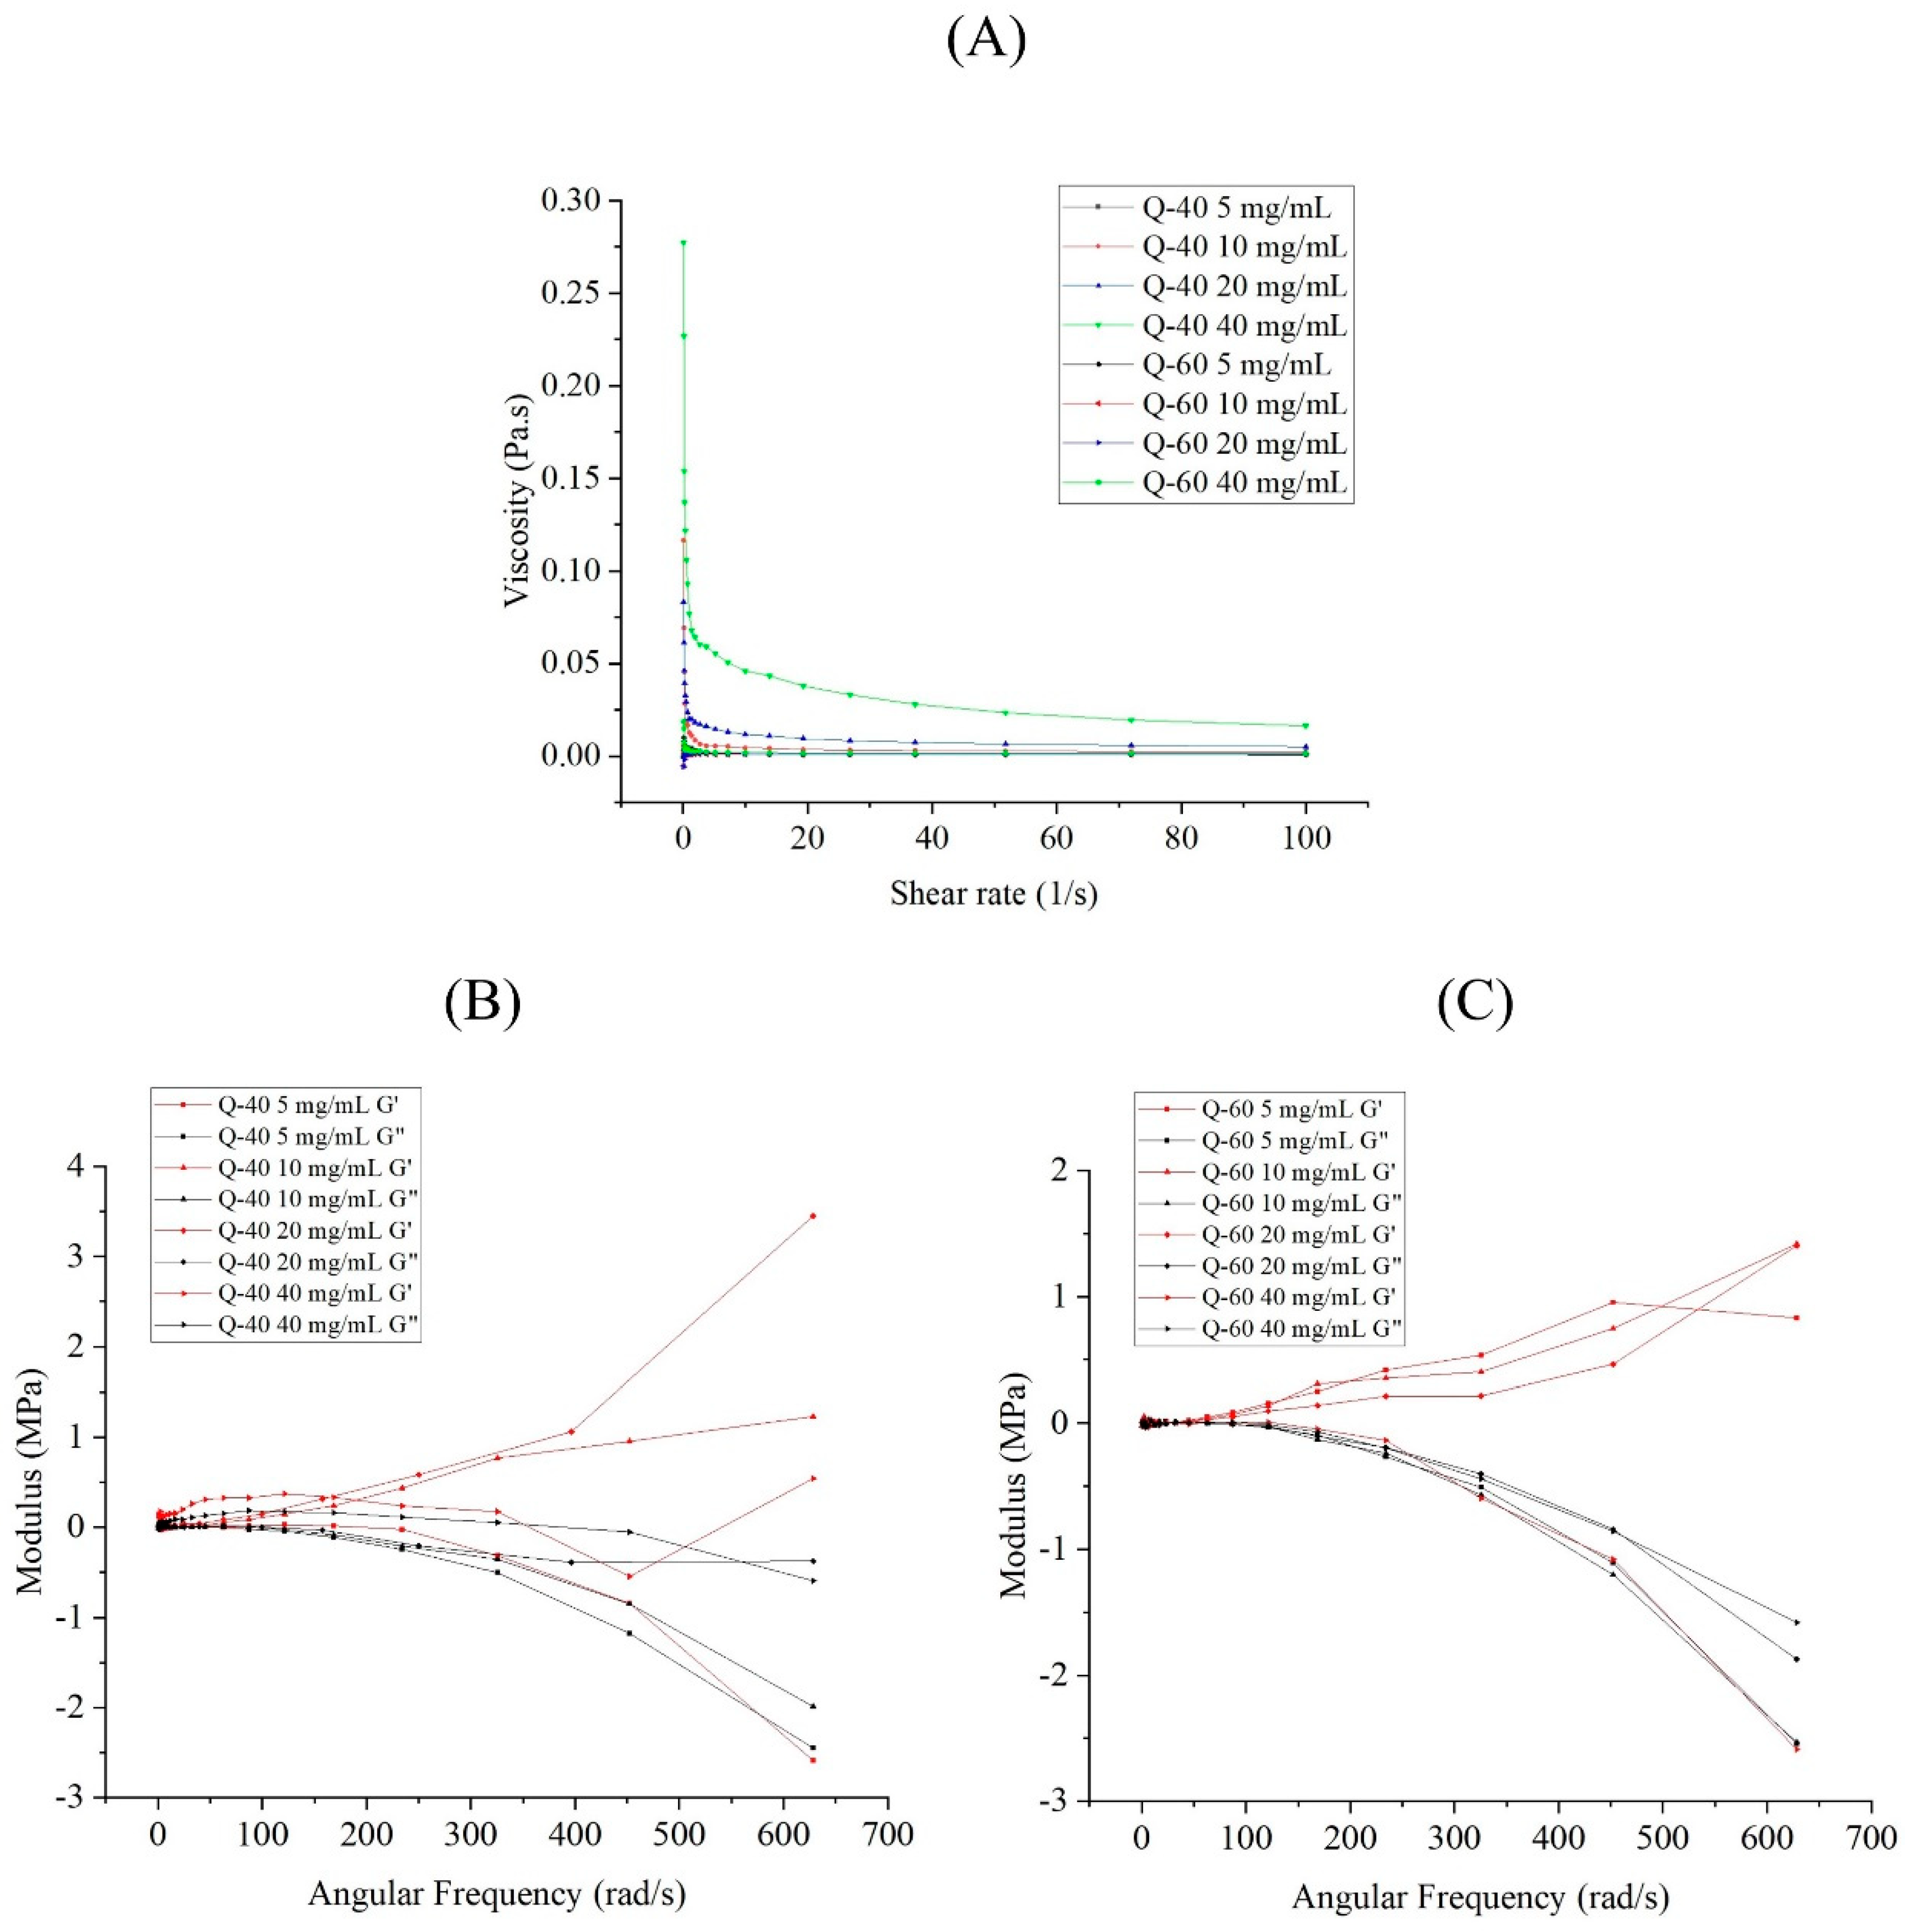
Figure 2.
Chromatogram of the mixture of 16 monosaccharide standards and the composition of Q-40 and Q-60; (1.NaOH; 2.Fuc; 3.GalN; 4.Rha; 5.Ara; 6.GlcN; 7.Gal; 8.Glc; 9.GlcNAc; 10.Xyl; 11.Man; 12.Fru; 13.Rib; 14.GulA; 15.ManA; 16.GlaA; 17.GlcA).
Figure 2.
Chromatogram of the mixture of 16 monosaccharide standards and the composition of Q-40 and Q-60; (1.NaOH; 2.Fuc; 3.GalN; 4.Rha; 5.Ara; 6.GlcN; 7.Gal; 8.Glc; 9.GlcNAc; 10.Xyl; 11.Man; 12.Fru; 13.Rib; 14.GulA; 15.ManA; 16.GlaA; 17.GlcA).
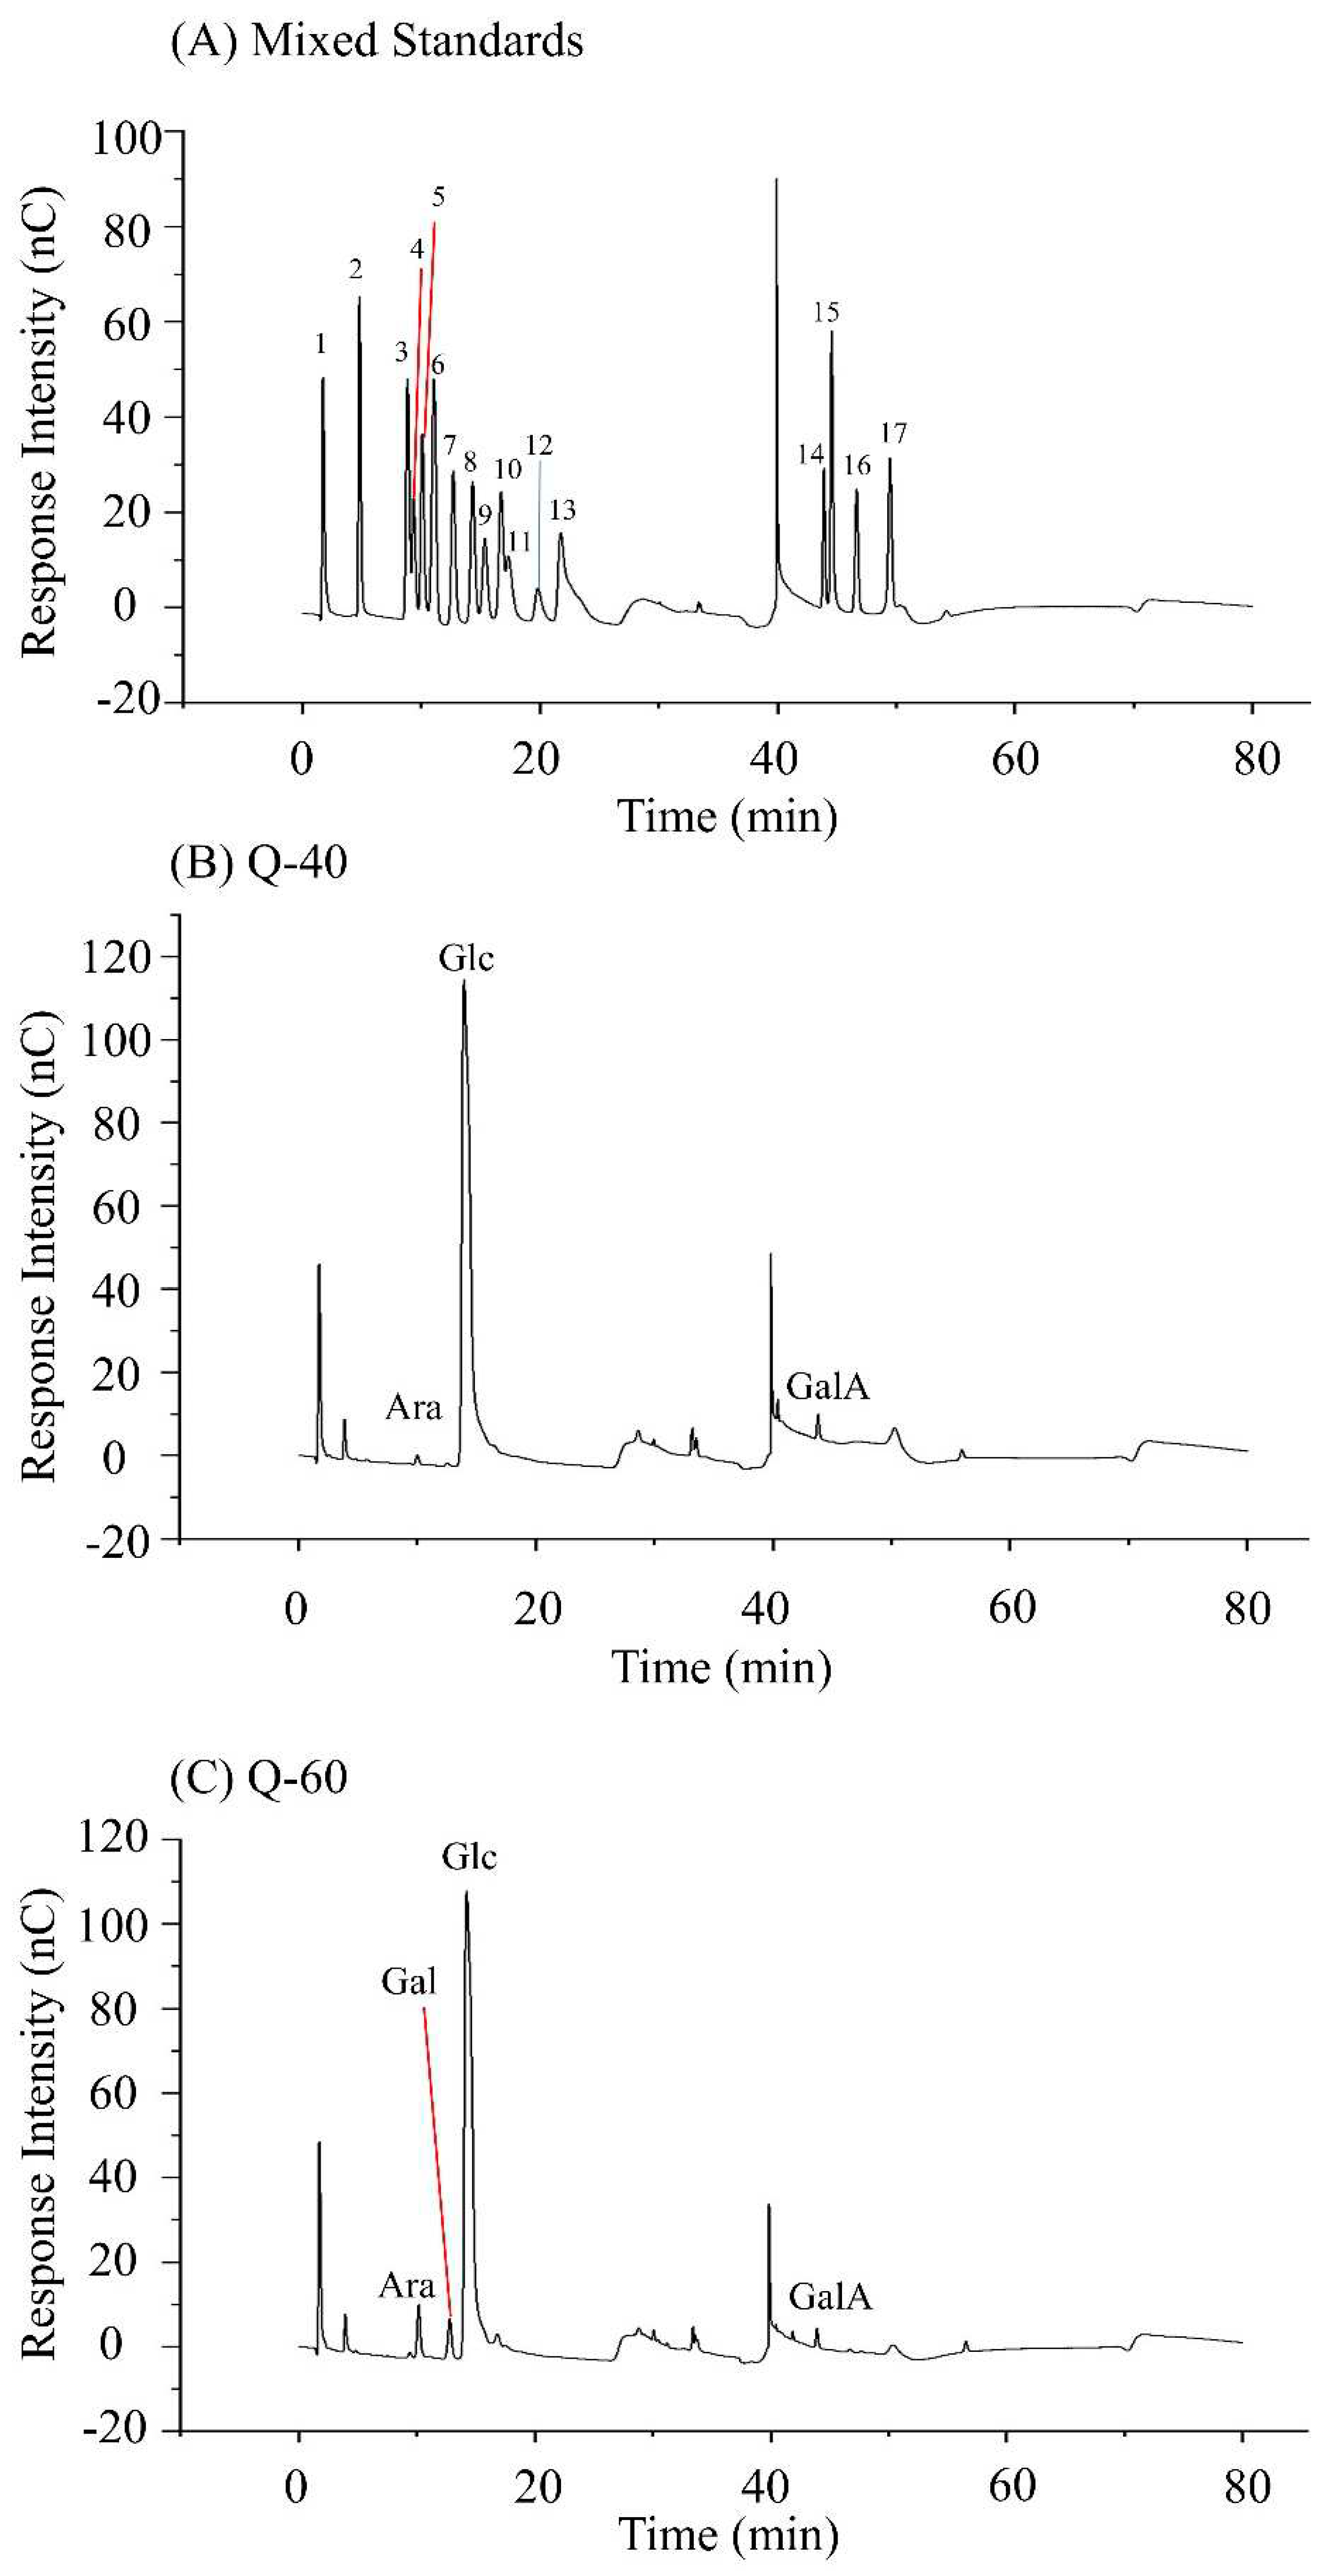
Figure 3.
HPGPC diagram of Q-40 and Q-60.
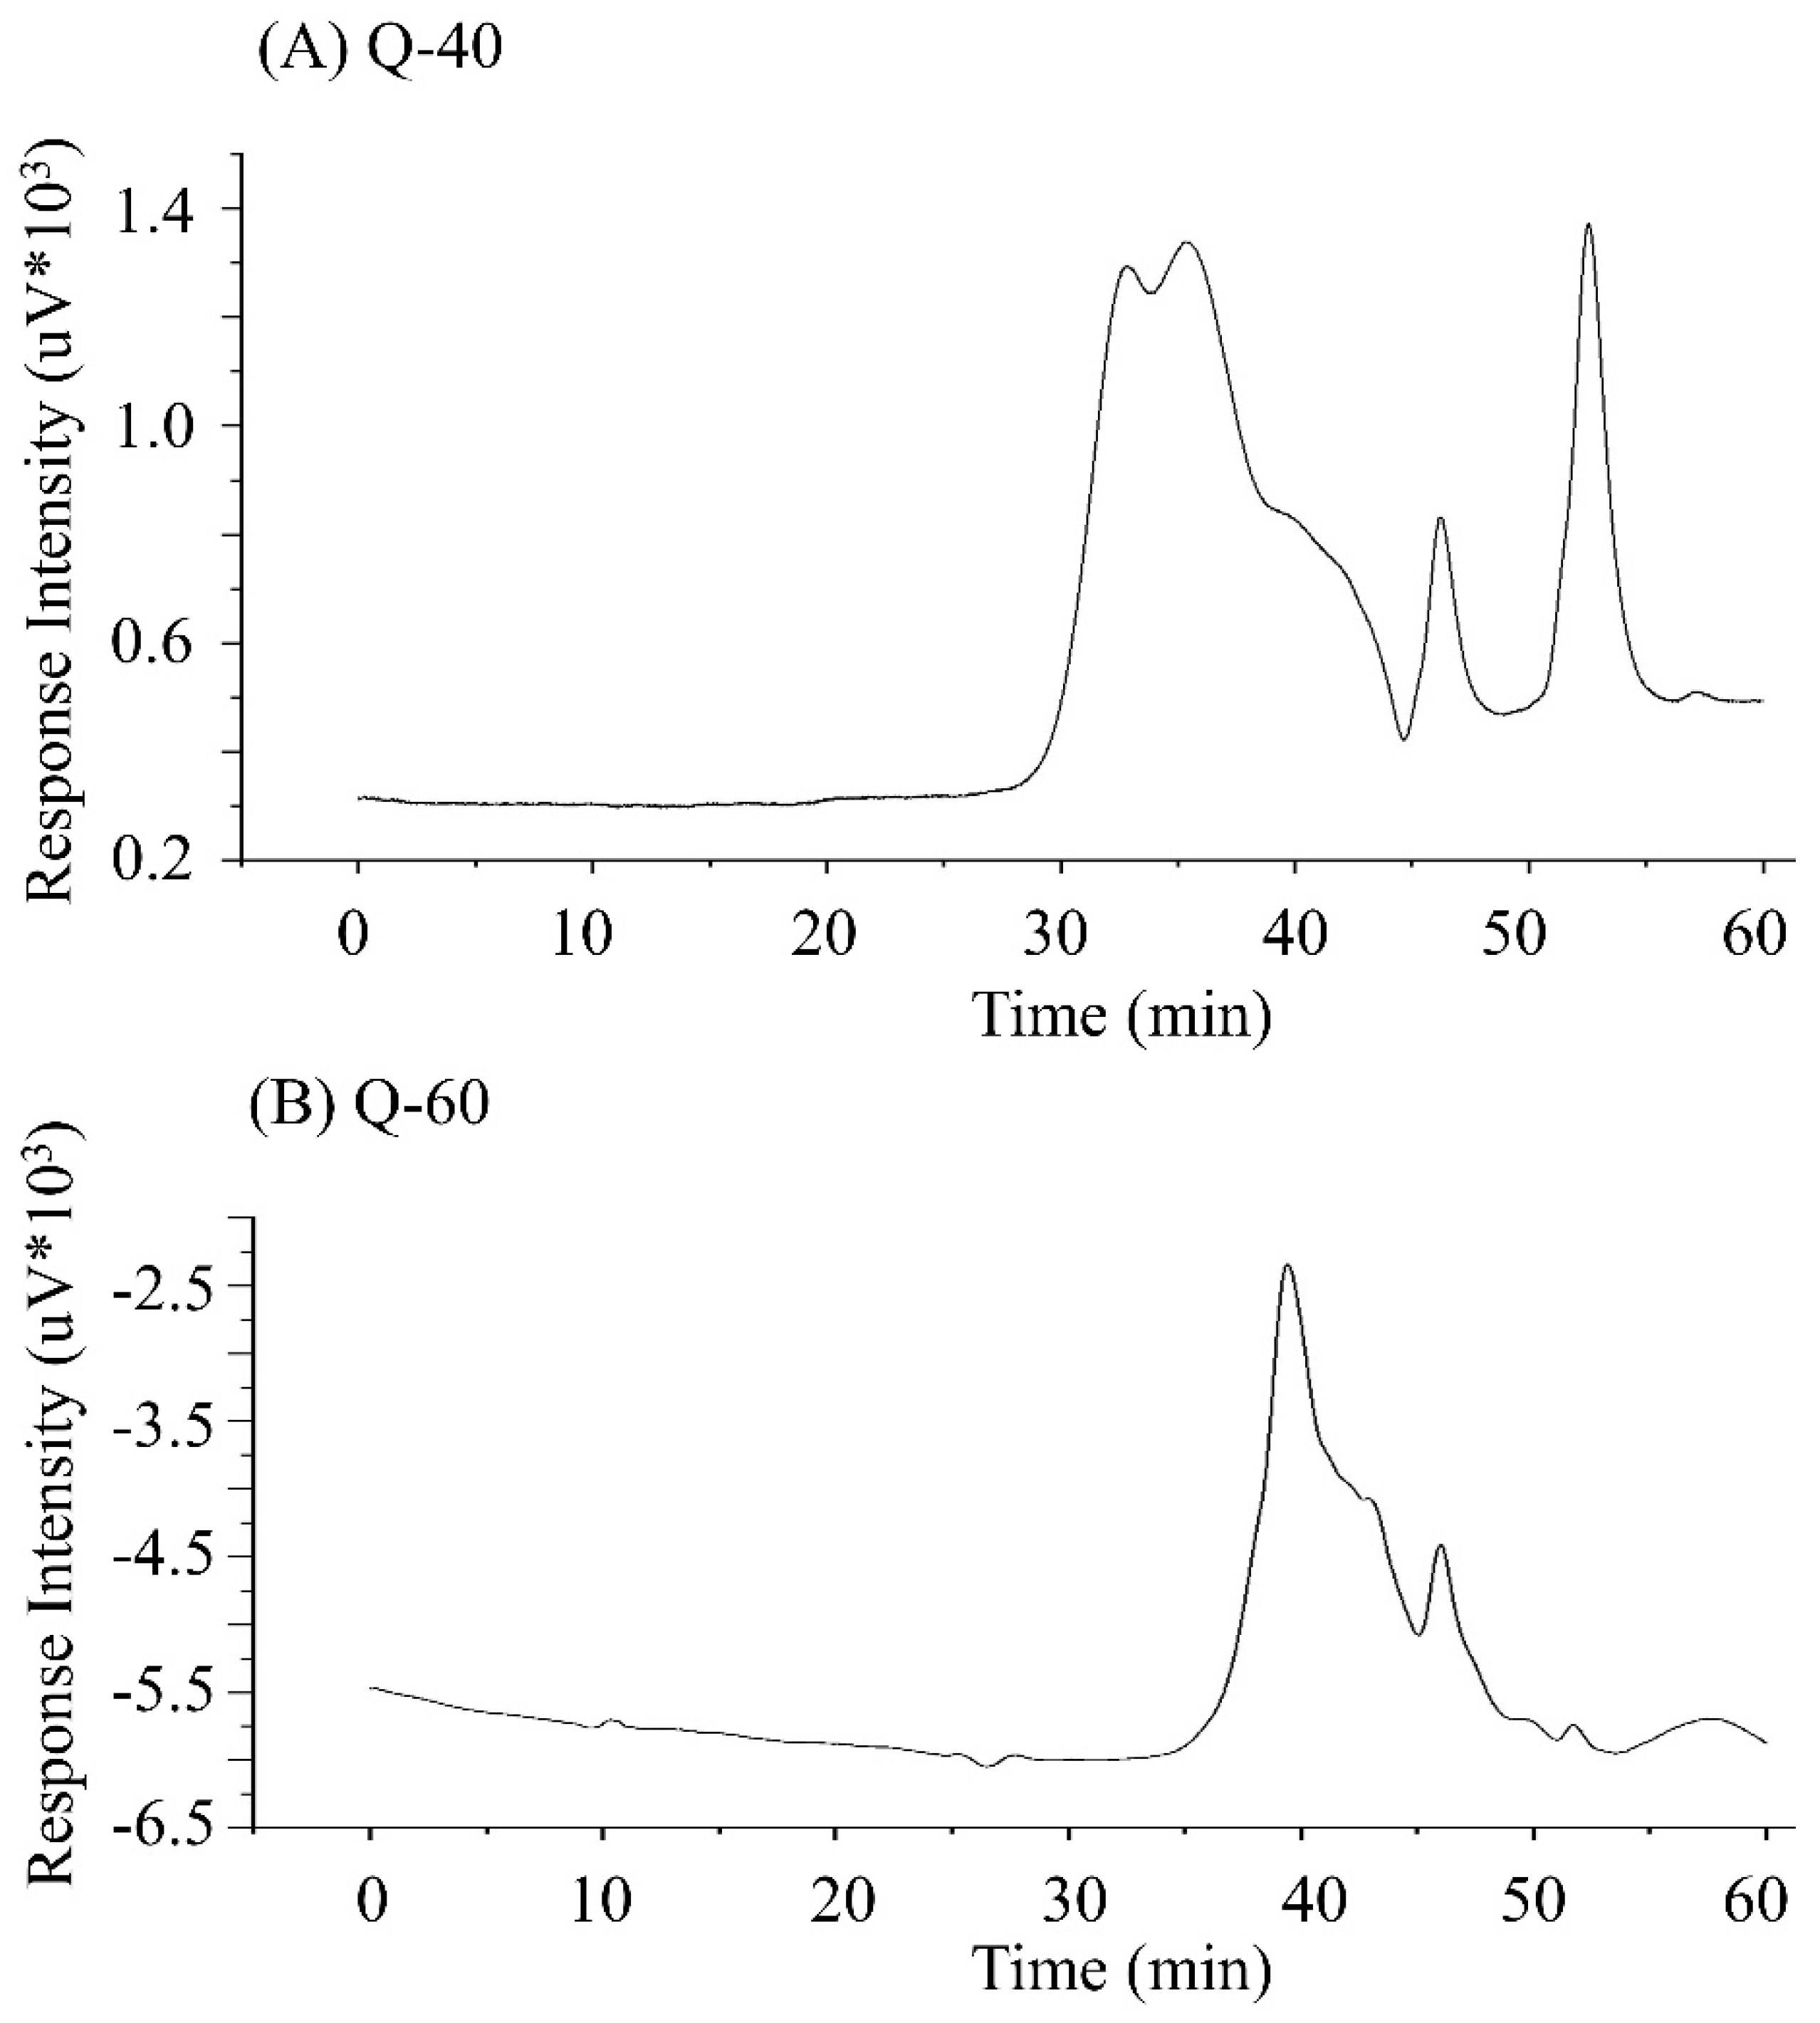
Figure 4.
Scanning electron micrographs of quinoa polysaccharides (A), (B) Q-40; (C), (D) Q-60.
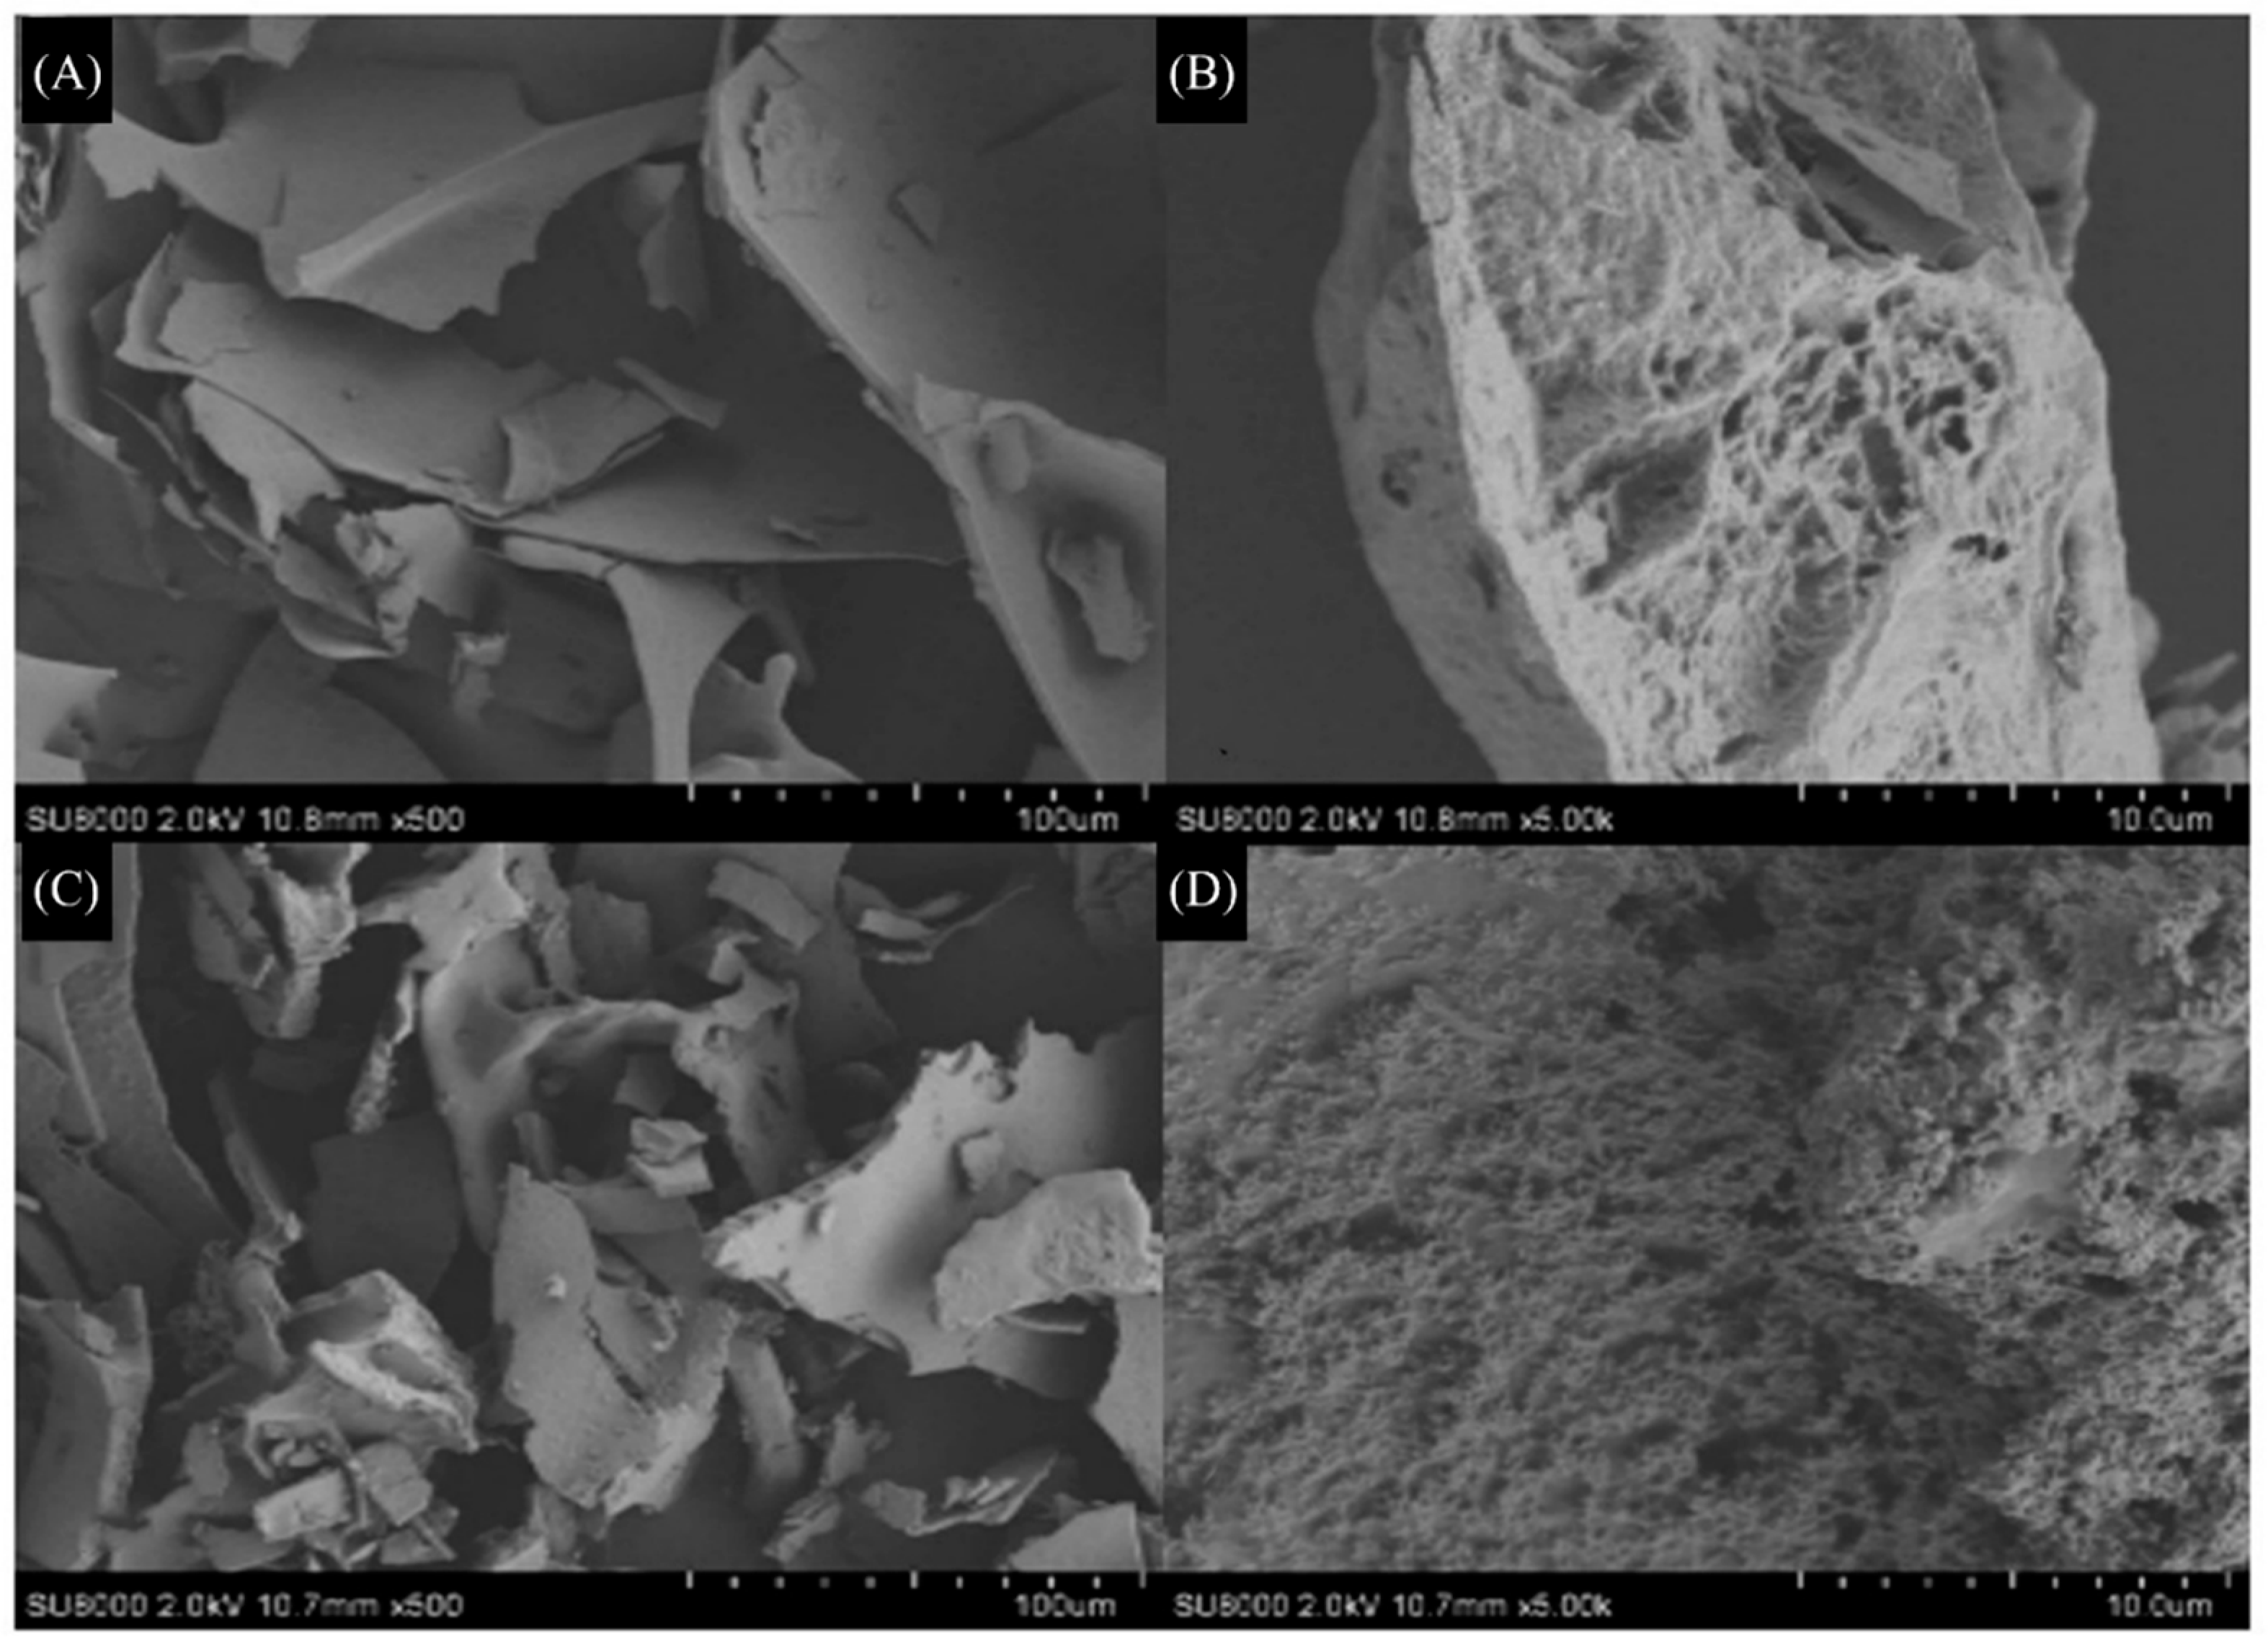
Figure 5.
Thermal analysis of Q-40 and Q-60.
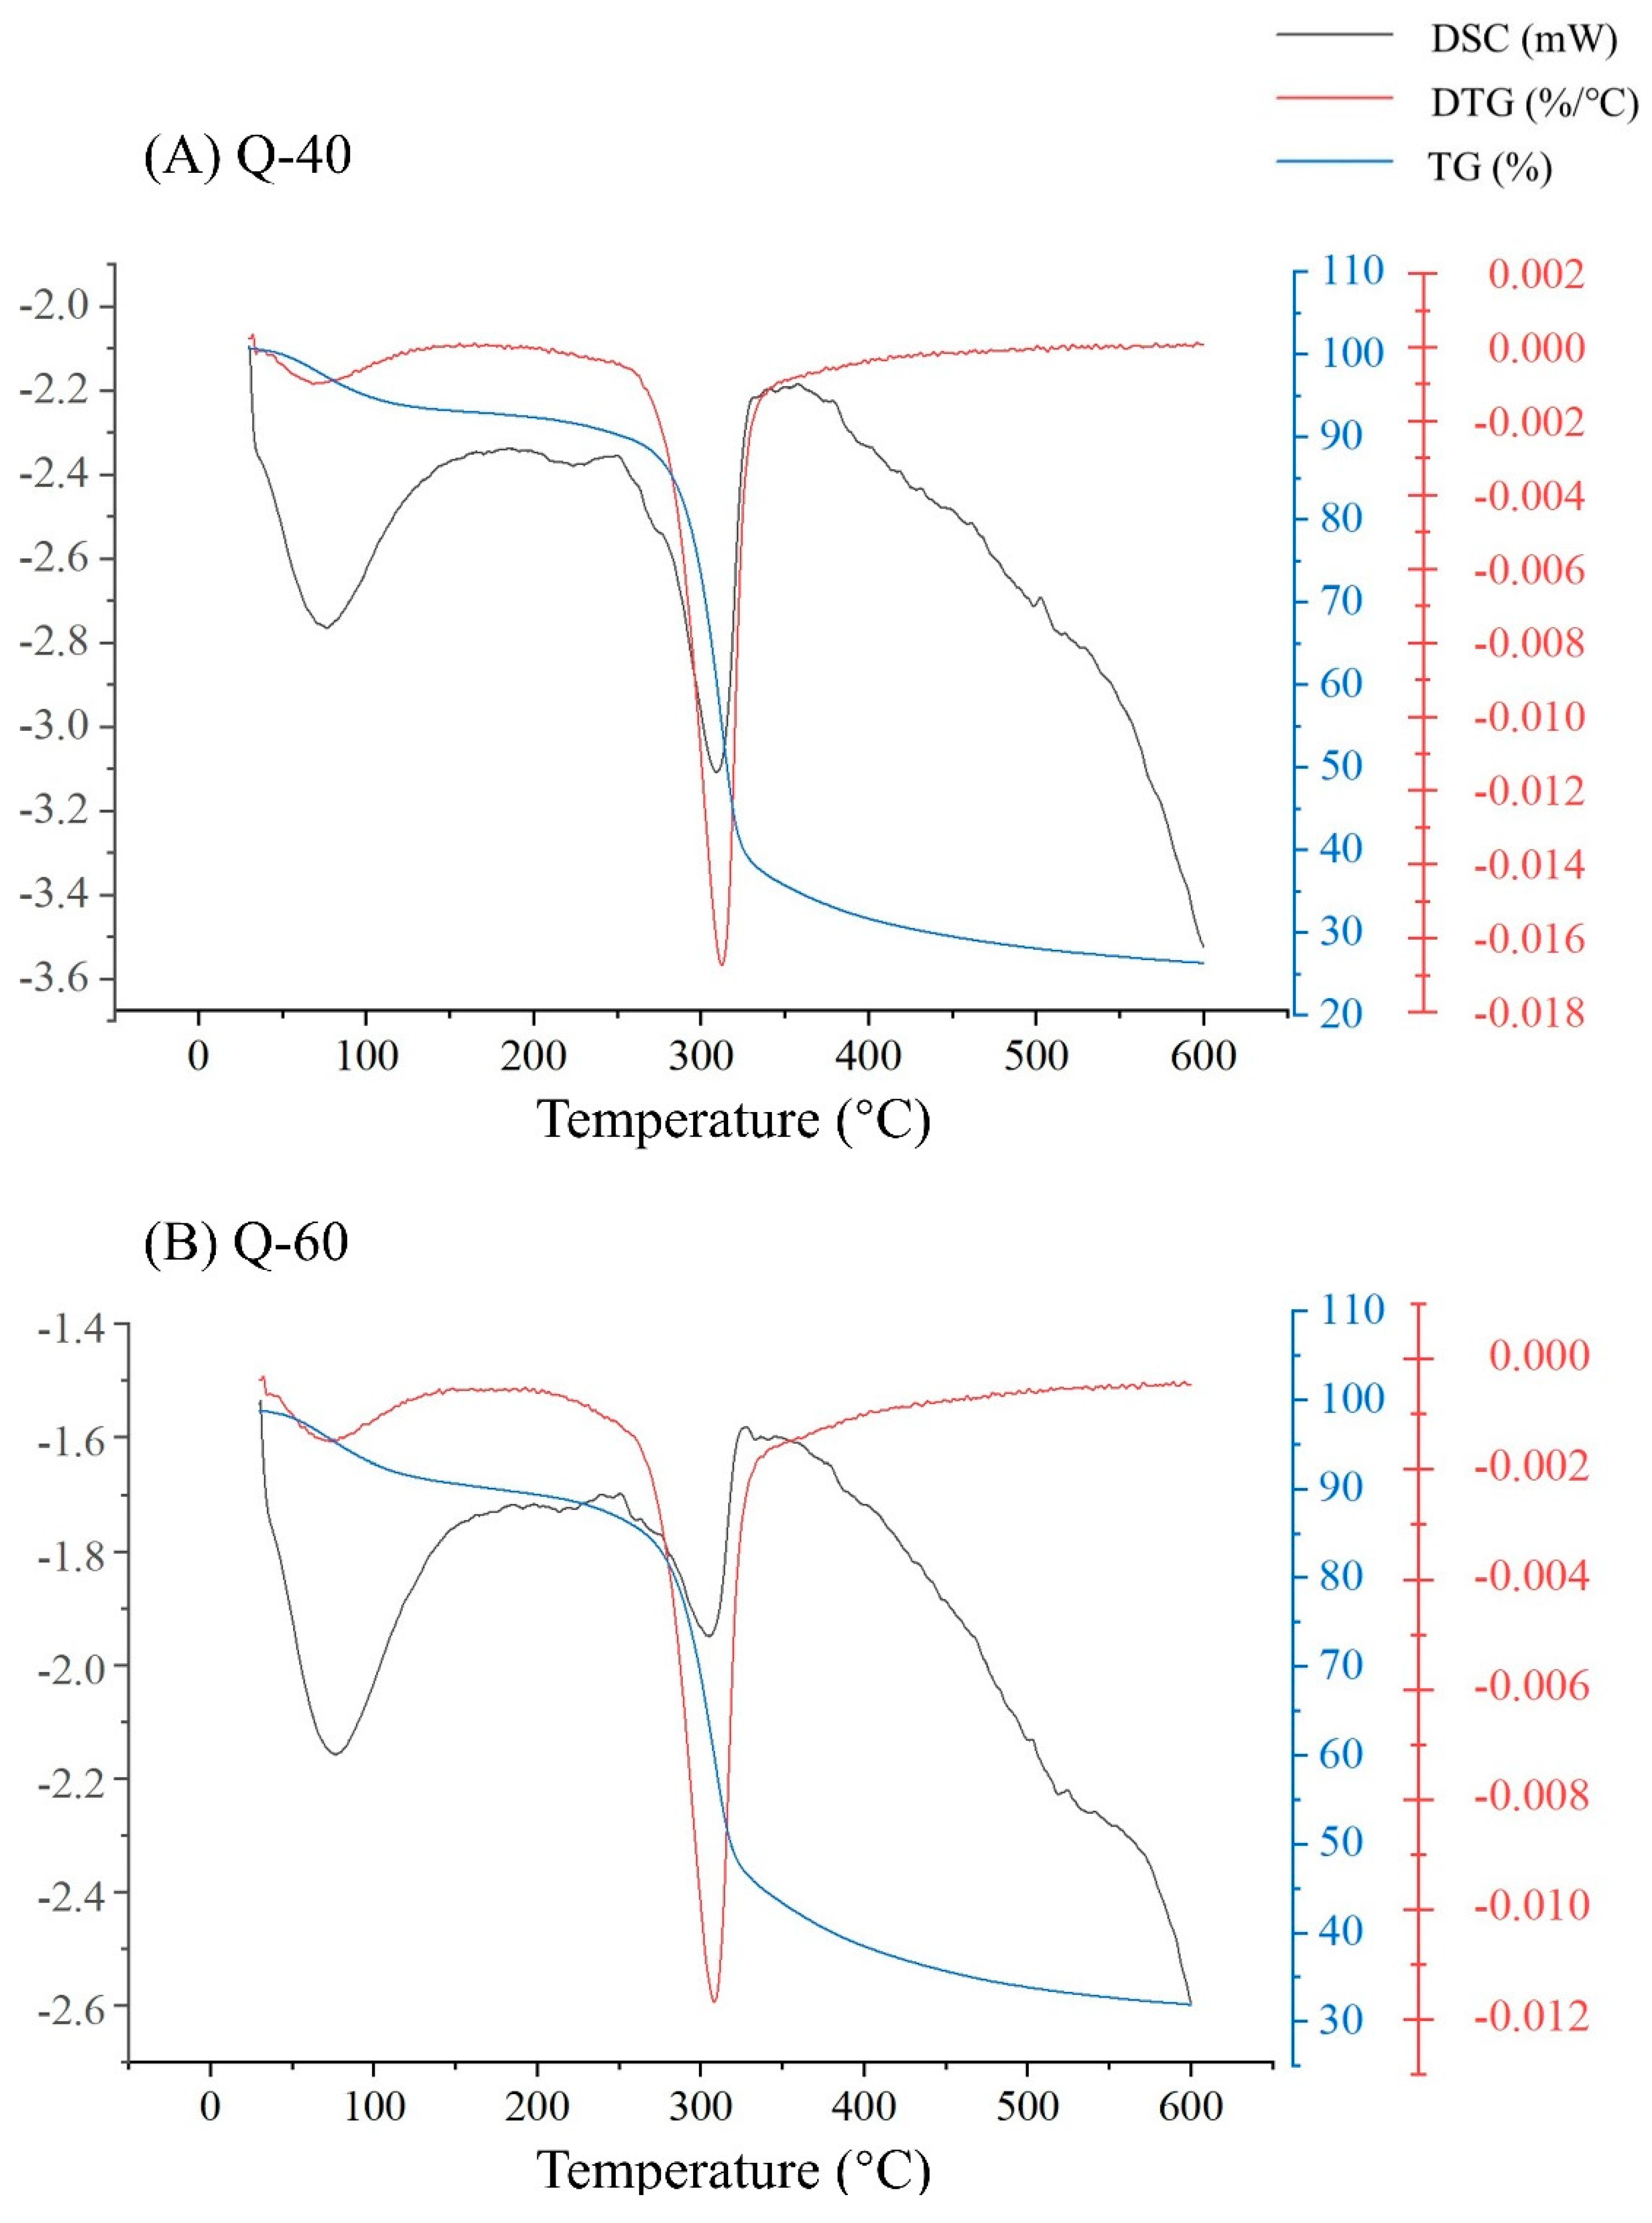
Figure 6.
Antioxidant properties of Q-40 and Q-60. (A) DPPH radical scavenging ability of ascorbic acid, Q-40 and Q-60; (B) ABTS radical scavenging ability of ascorbic acid, Q-40 and Q-60.
Figure 6.
Antioxidant properties of Q-40 and Q-60. (A) DPPH radical scavenging ability of ascorbic acid, Q-40 and Q-60; (B) ABTS radical scavenging ability of ascorbic acid, Q-40 and Q-60.
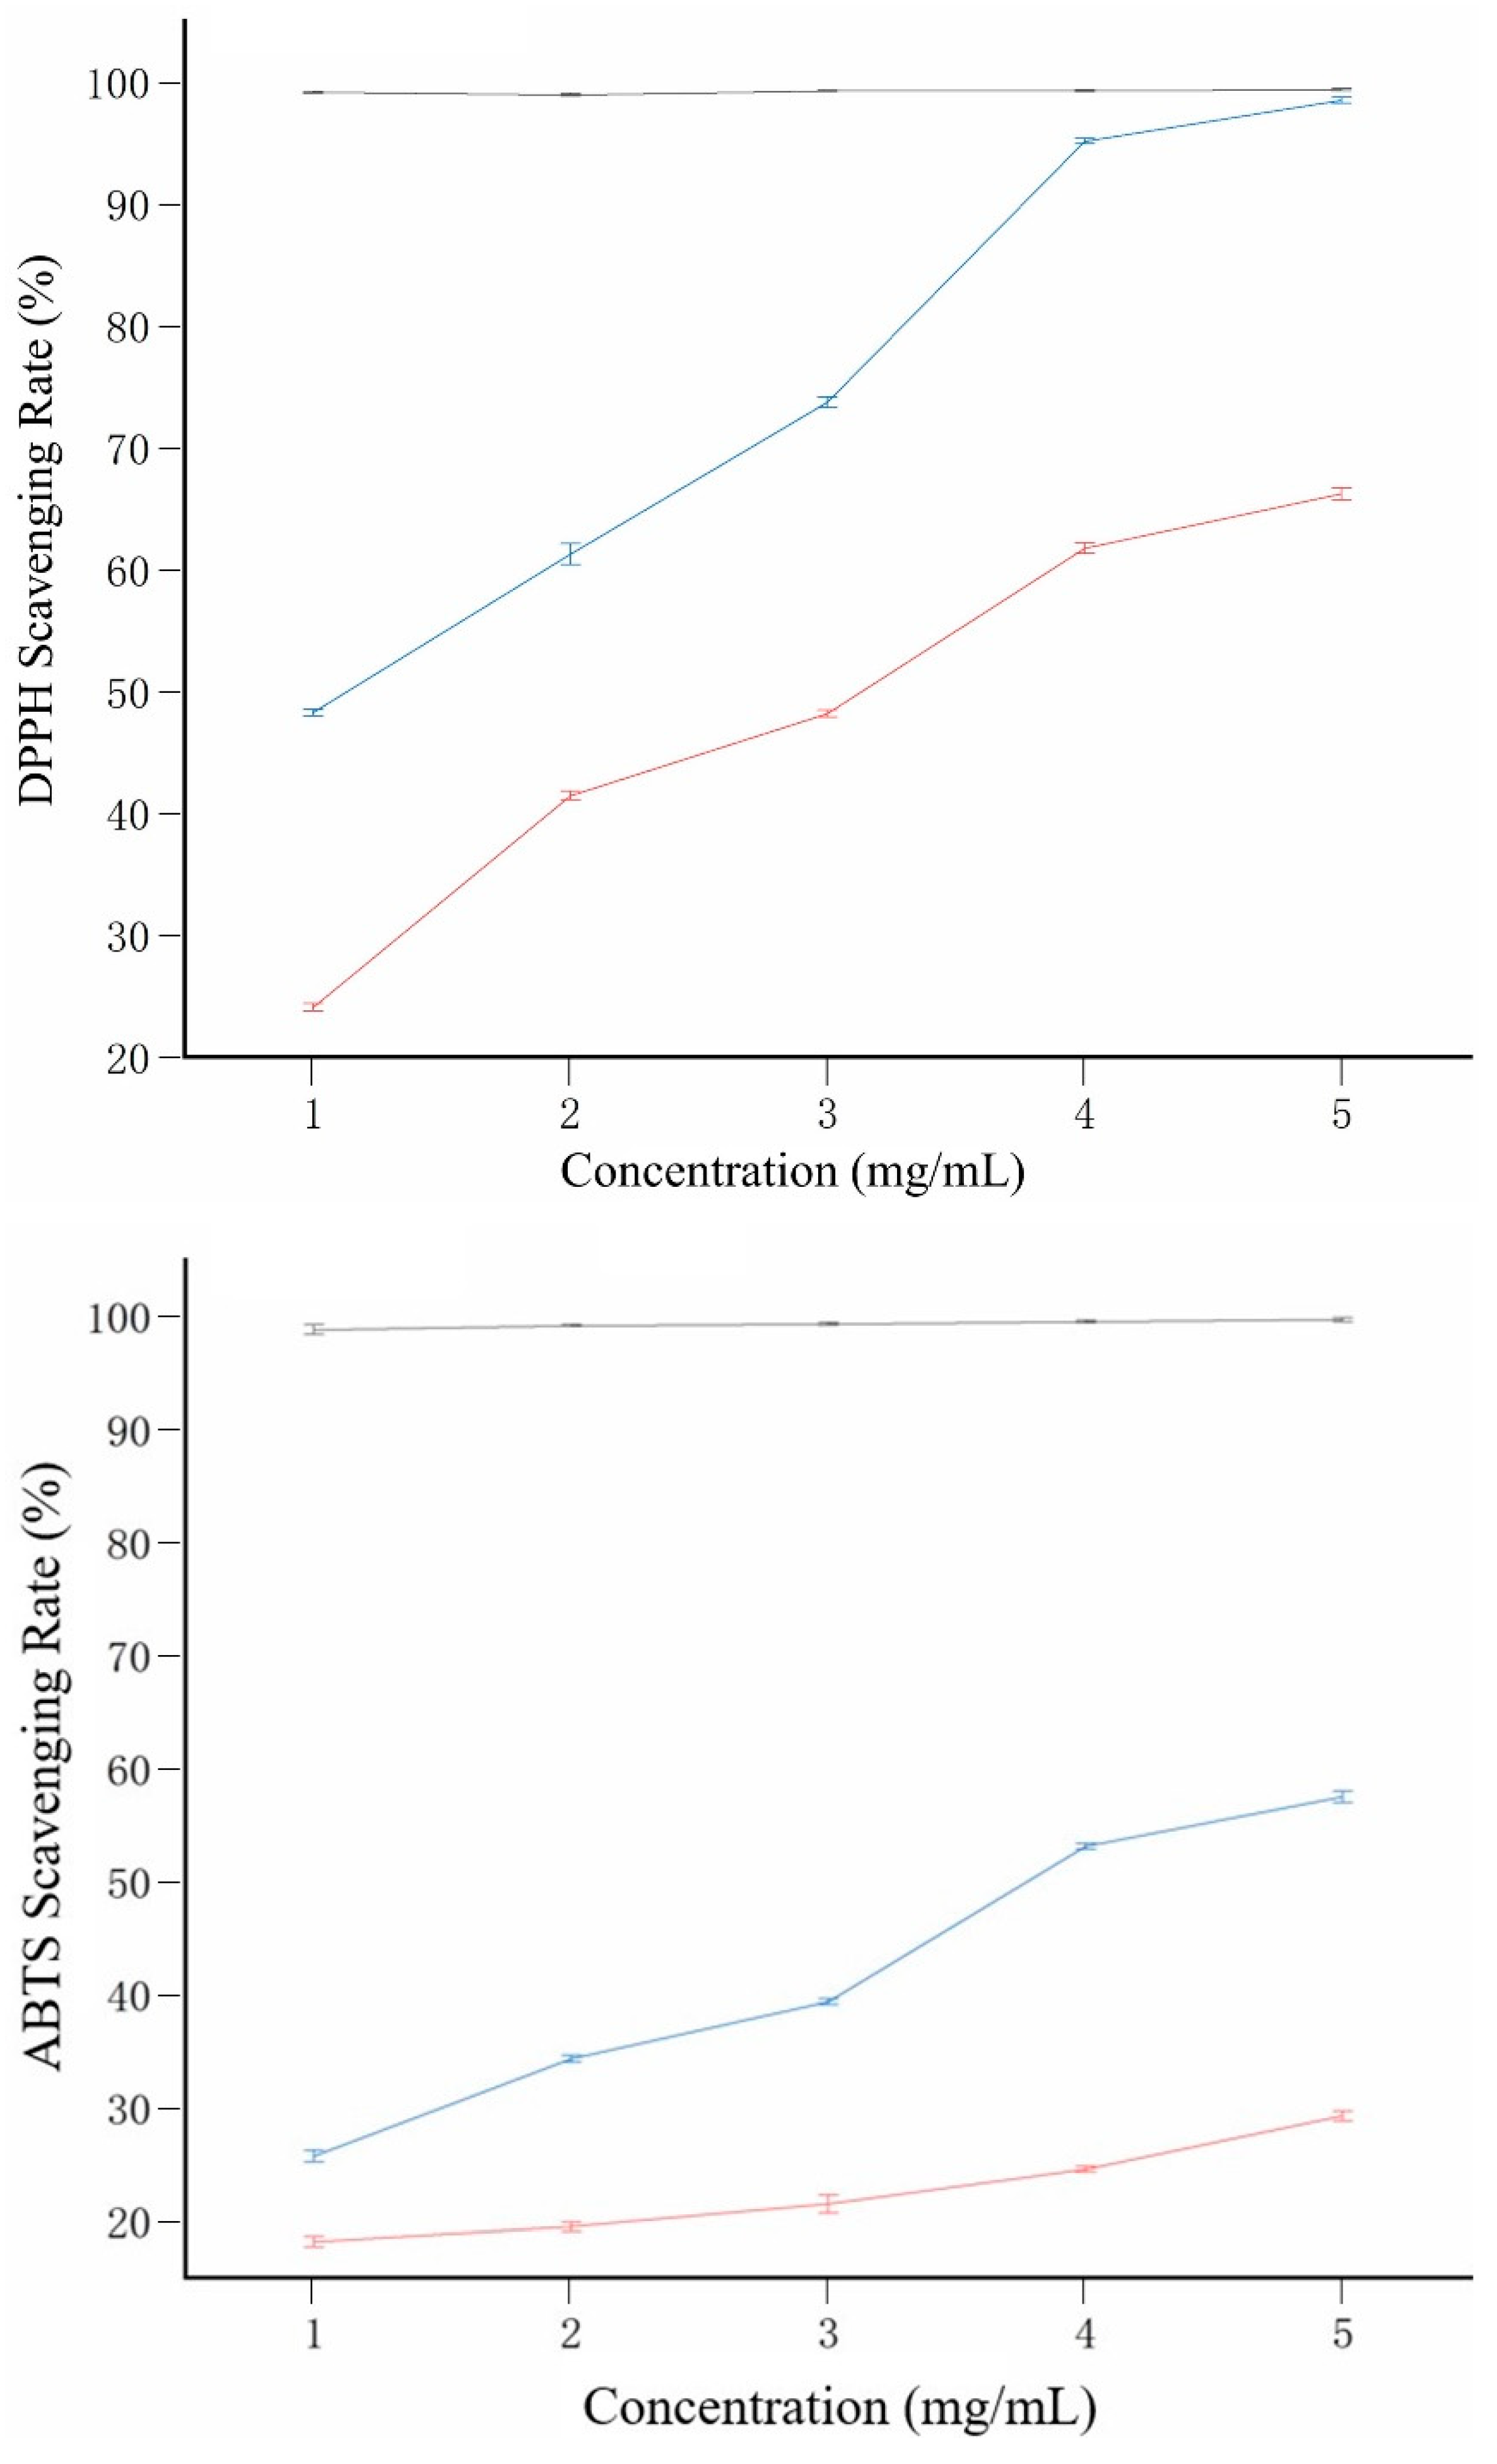
Figure 7.
Effect of Q-40 and Q-60 on the proliferation of MDA and HepG2 cells. (A) Inhibition rate of proliferation of MDA-231 cells by Q-40 and Q-60; (B) Inhibition rate of Q-40 and Q-60 on the proliferation of HepG2 cells; (C) Photograph of the effect of Q-40 and Q-60 on the proliferation of MDA cells; (D) Photograph of the effect of Q-40 and Q-60 on the proliferation of HePG2 cells.
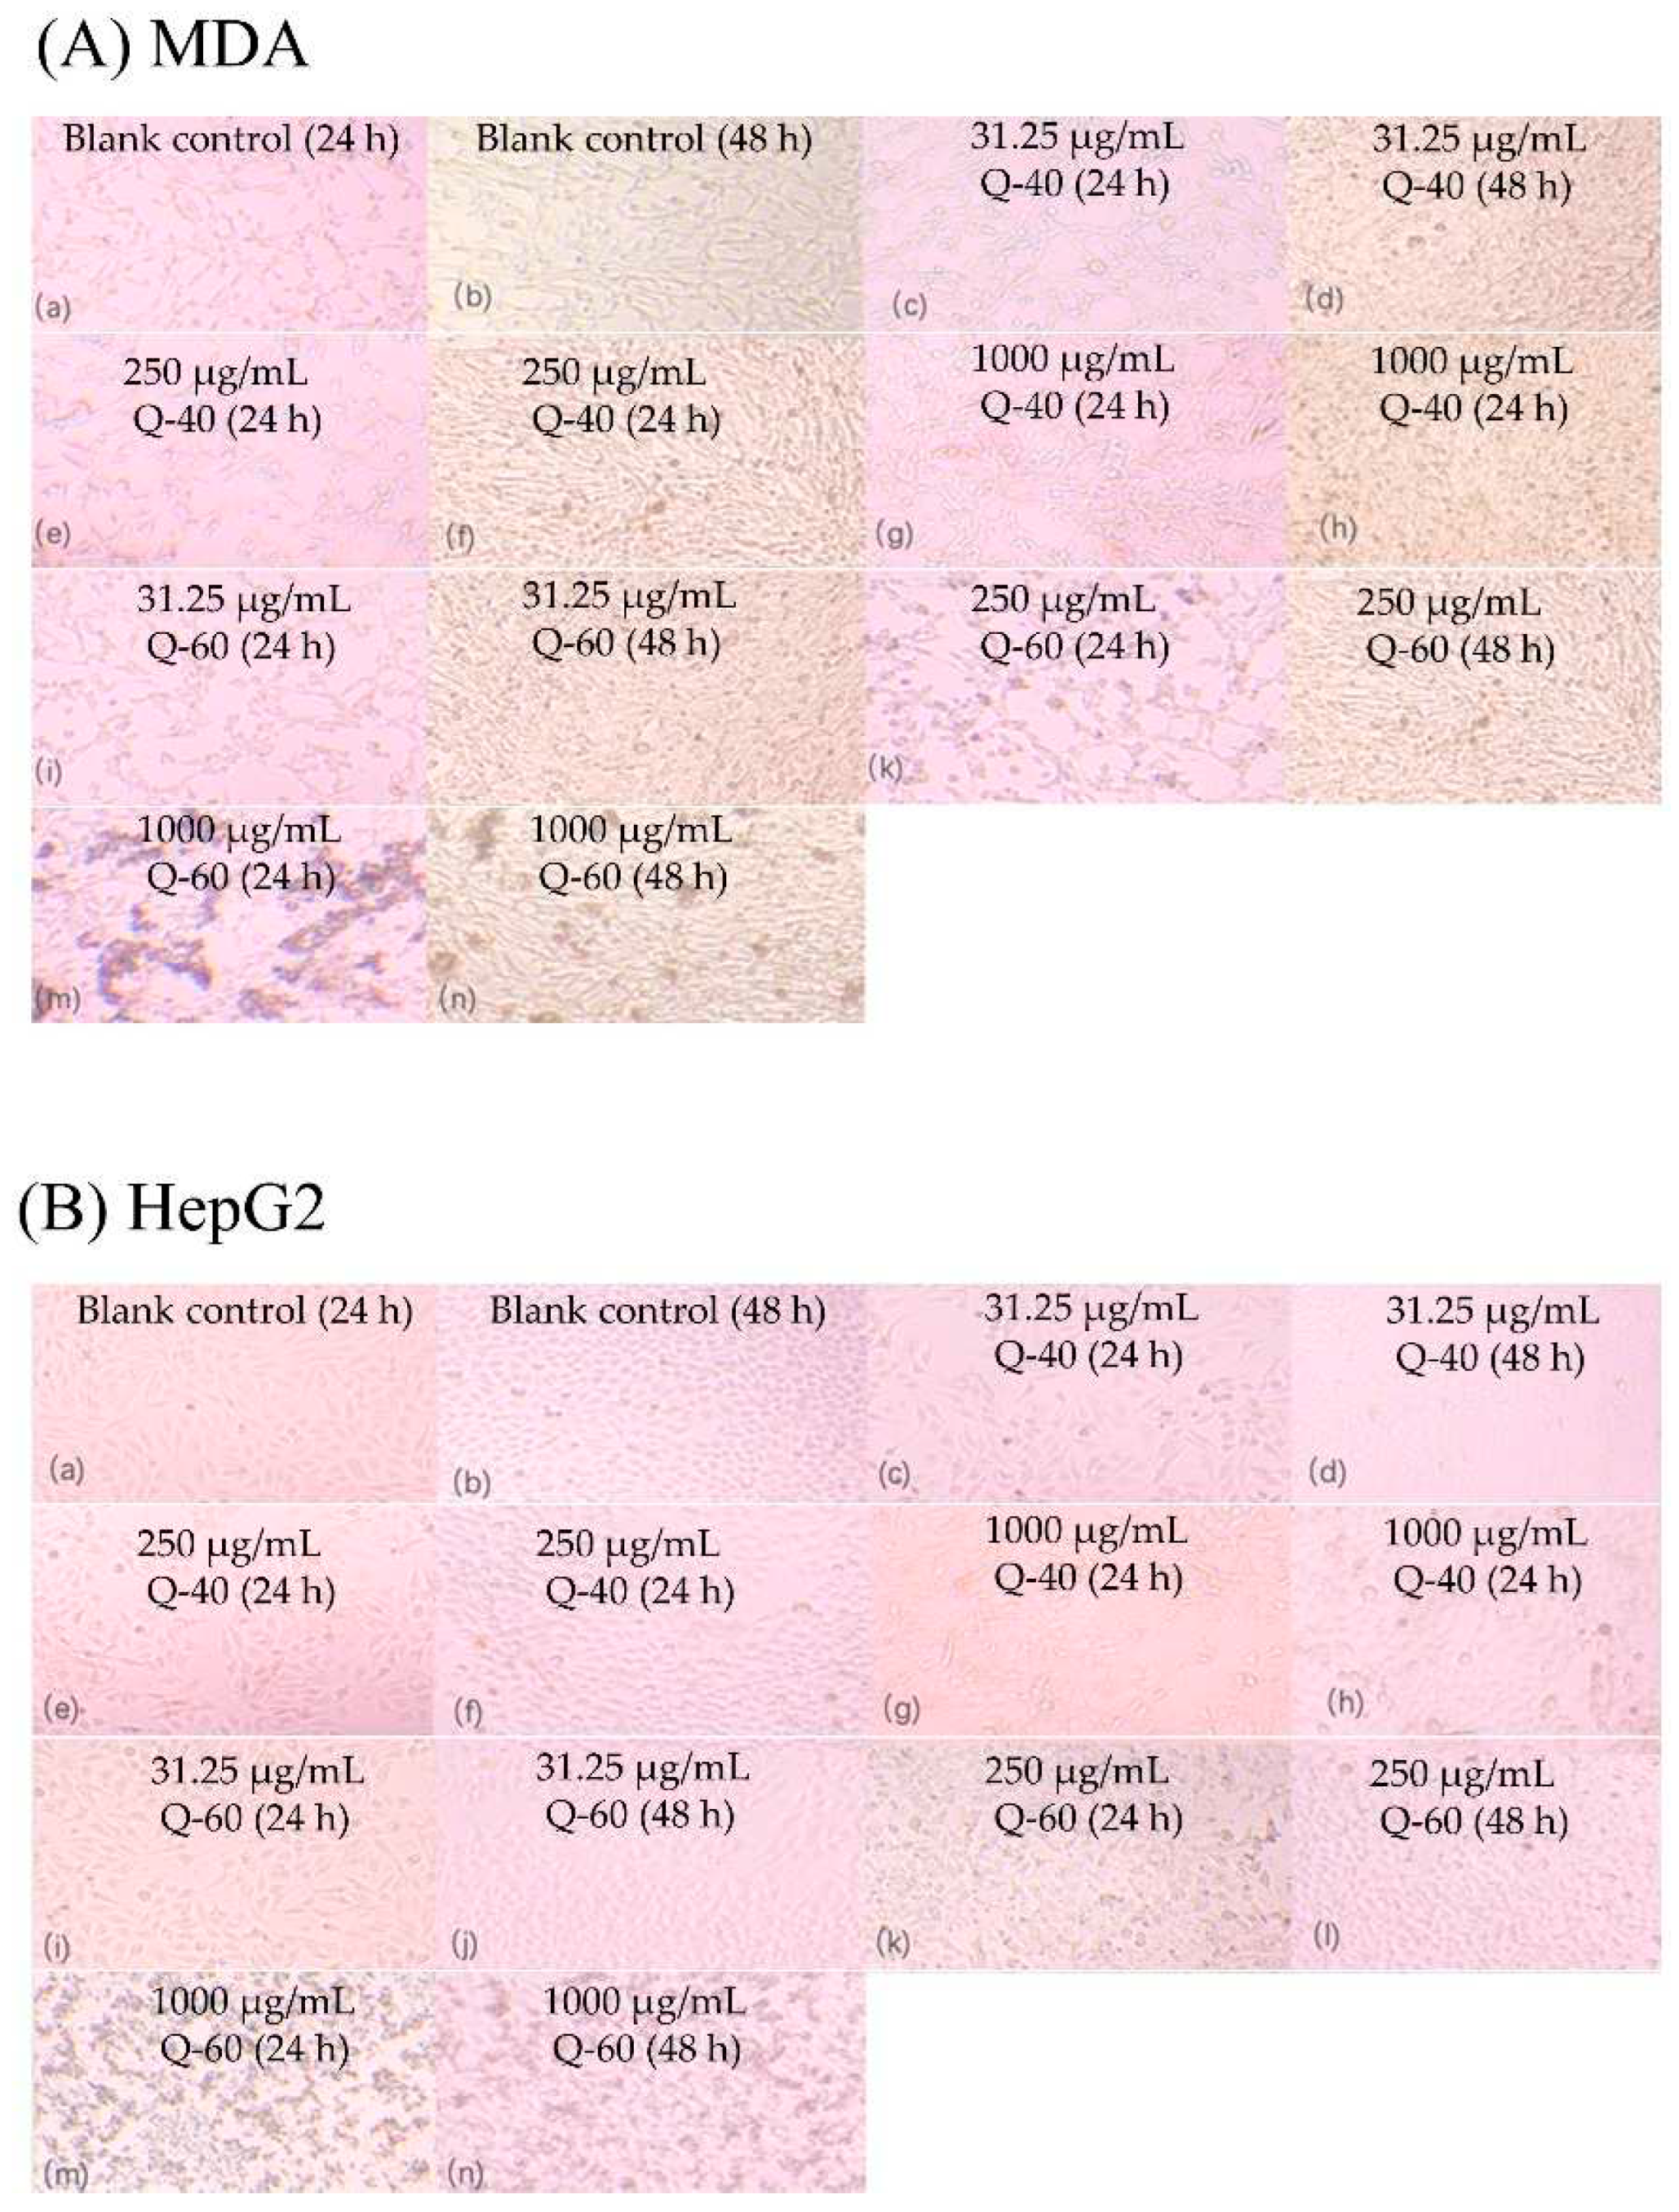
Table 2.
Antimicrobial properties of Q-40 and Q-60.
| C. albicans | C. neoformans | MRSA | E. coli | T. rubrum | T. mentagrophytes | |
| LM-40 | — | — | 16.61±0.87% | 3.39±1.91% | — | — |
| LM-60 | — | — | 23.97±0.64% | — | — | — |
| KCZ | 89.82±2.34% | 100±0.29% | 98.17±0.15% | — | ||
| Penicillin | 98.10±0.25% | 96.64±0.21% | ||||
| TCS | 95.02±1.08% |
Disclaimer/Publisher’s Note: The statements, opinions and data contained in all publications are solely those of the individual author(s) and contributor(s) and not of MDPI and/or the editor(s). MDPI and/or the editor(s) disclaim responsibility for any injury to people or property resulting from any ideas, methods, instructions or products referred to in the content. |
© 2023 by the authors. Licensee MDPI, Basel, Switzerland. This article is an open access article distributed under the terms and conditions of the Creative Commons Attribution (CC BY) license (http://creativecommons.org/licenses/by/4.0/).
Copyright: This open access article is published under a Creative Commons CC BY 4.0 license, which permit the free download, distribution, and reuse, provided that the author and preprint are cited in any reuse.


