Preprint
Article

Recent Progresses in Signal Processing for Alzheimer's Disease Detection

Altmetrics

Downloads

202

Views

76

Comments

0

This version is not peer-reviewed

Submitted:

24 October 2023

Posted:

25 October 2023

You are already at the latest version

Alerts
Abstract
Alzheimer's Disease (AD) is a neurodegenerative disease that is common in the elderly. This paper introduces the overview of Alzheimer's disease and the application of relevant signal processing methods in its detection. Signal processing is a technique that converts raw data into meaningful information and is widely used in the medical field. This paper lists common signal processing techniques, including Fourier transform, time-frequency analysis and statistical signal processing, and discusses their applications in the detection of Alzheimer's disease. Fourier transform can convert time domain signals into frequency domain representations, providing an effective tool for the study of EEG in Alzheimer's disease. Time-frequency analysis can perform a combined time and frequency analysis of the signal to help detect the signal characteristics of Alzheimer's disease. Statistical signal processing methods can be used to identify the features of Alzheimer's disease by building mathematical models. Finally, the challenges of Alzheimer's disease detection are discussed, including signal noise, diversity, and insufficient data volume. Through in-depth research and development of signal processing methods, it is expected to improve the accuracy and efficiency of early detection of Alzheimer's disease.
Keywords: 
Subject: Public Health and Healthcare  -   Primary Health Care

1. Introduction of Alzheimer’s Disease

Alzheimer’s disease, a progressive neurodegenerative disorder, is a significant public health concern with far-reaching implications for both individuals and societies [1]. First described by Dr. Alois Alzheimer in 1906, the disease is characterized by a relentless decline in cognitive functions, memory loss, and behavioral changes. As shown in Figure 1, Alzheimer’s disease predominantly affects the elderly, and its prevalence is expected to surge with the global aging population [2]. This introduction section provides an overview of the disease, its historical context, and the immense impact it has on individuals and healthcare systems [3].
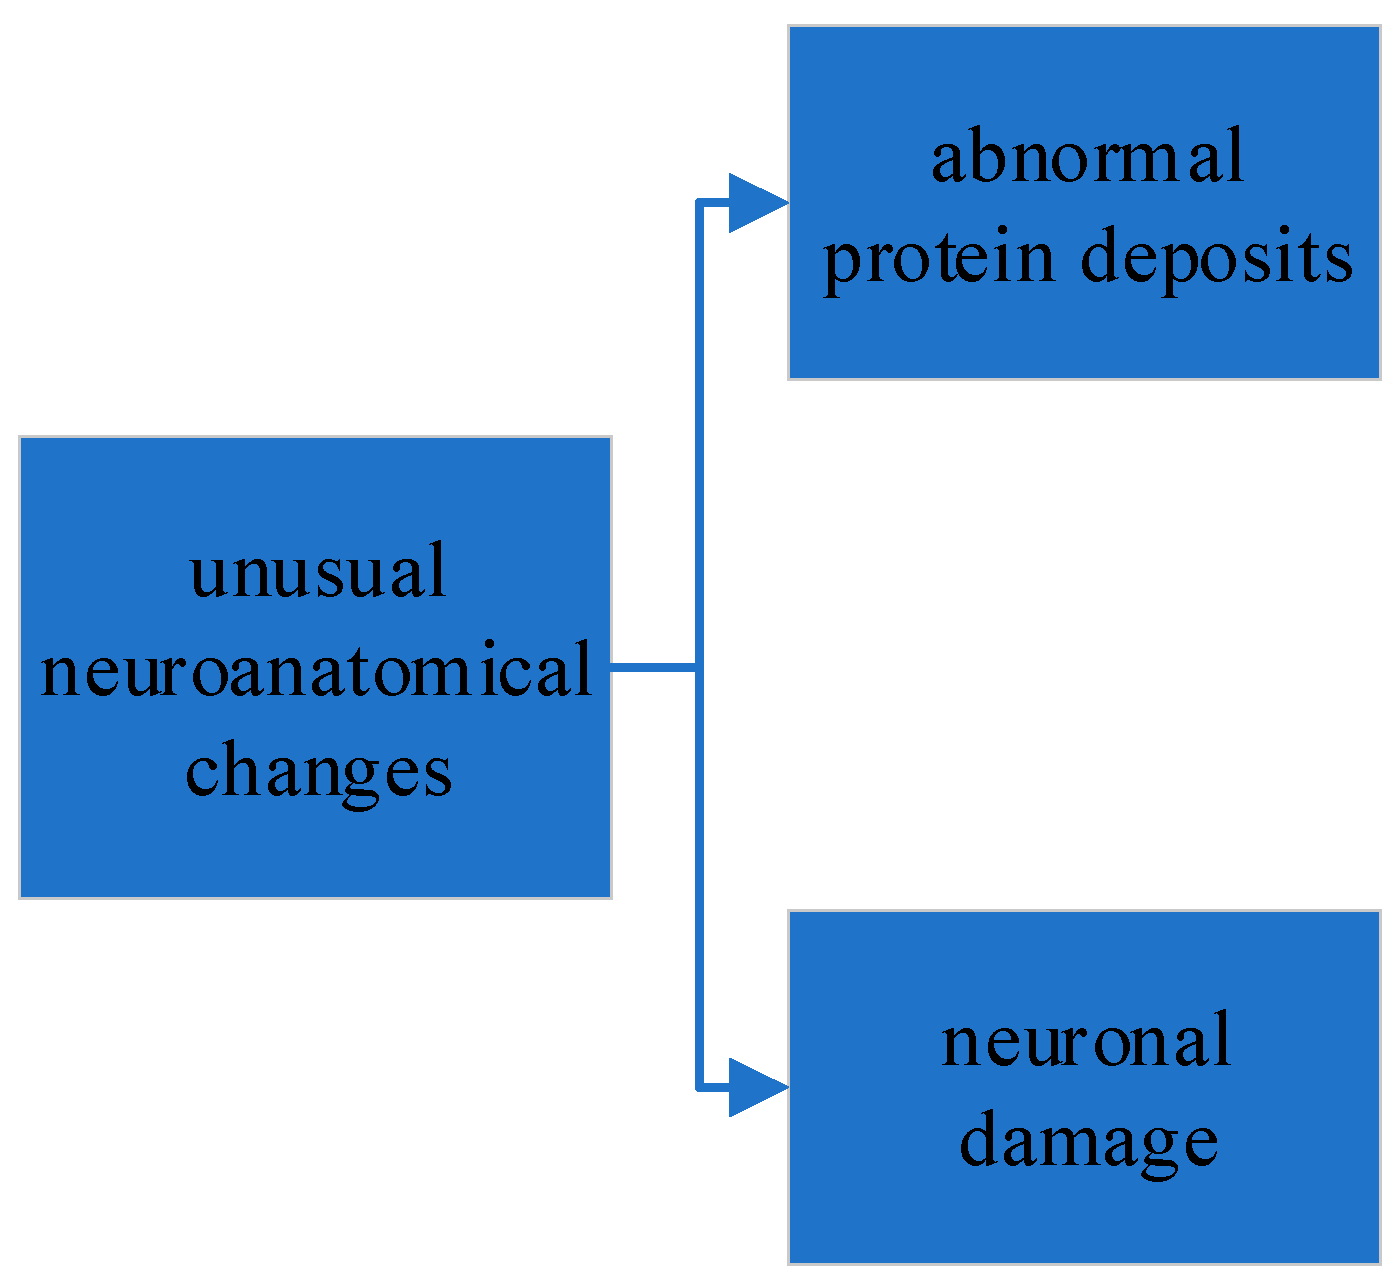
The history of Alzheimer’s disease research spans over a century, and the understanding of its etiology and pathophysiology has evolved significantly [4]. The initial case, involving a 51-year-old patient named Auguste Deter, showcased severe memory impairment, language difficulties, and behavioral disturbances, ultimately leading to her death. Upon post-mortem examination of her brain, Dr. Alzheimer identified unusual neuroanatomical changes, including the presence of abnormal protein deposits and neuronal damage [5],As shown in Figure 2. This seminal discovery laid the foundation for future research into Alzheimer’s disease. Since then, there has been a steady progression in our understanding of the disease, its genetic and environmental risk factors, and the development of diagnostic criteria.
Alzheimer’s disease has emerged as a global health crisis. As populations age, the prevalence of this condition has increased, placing an immense burden on healthcare systems and the economy. According to the World Alzheimer Report 2018, an estimated 50 million people worldwide were living with dementia, with Alzheimer’s disease being the most common cause [6]. This number is projected to triple by 2050 if effective interventions are not developed. Alzheimer’s not only impairs an individual’s quality of life but also places significant emotional and financial stress on caregivers and families.
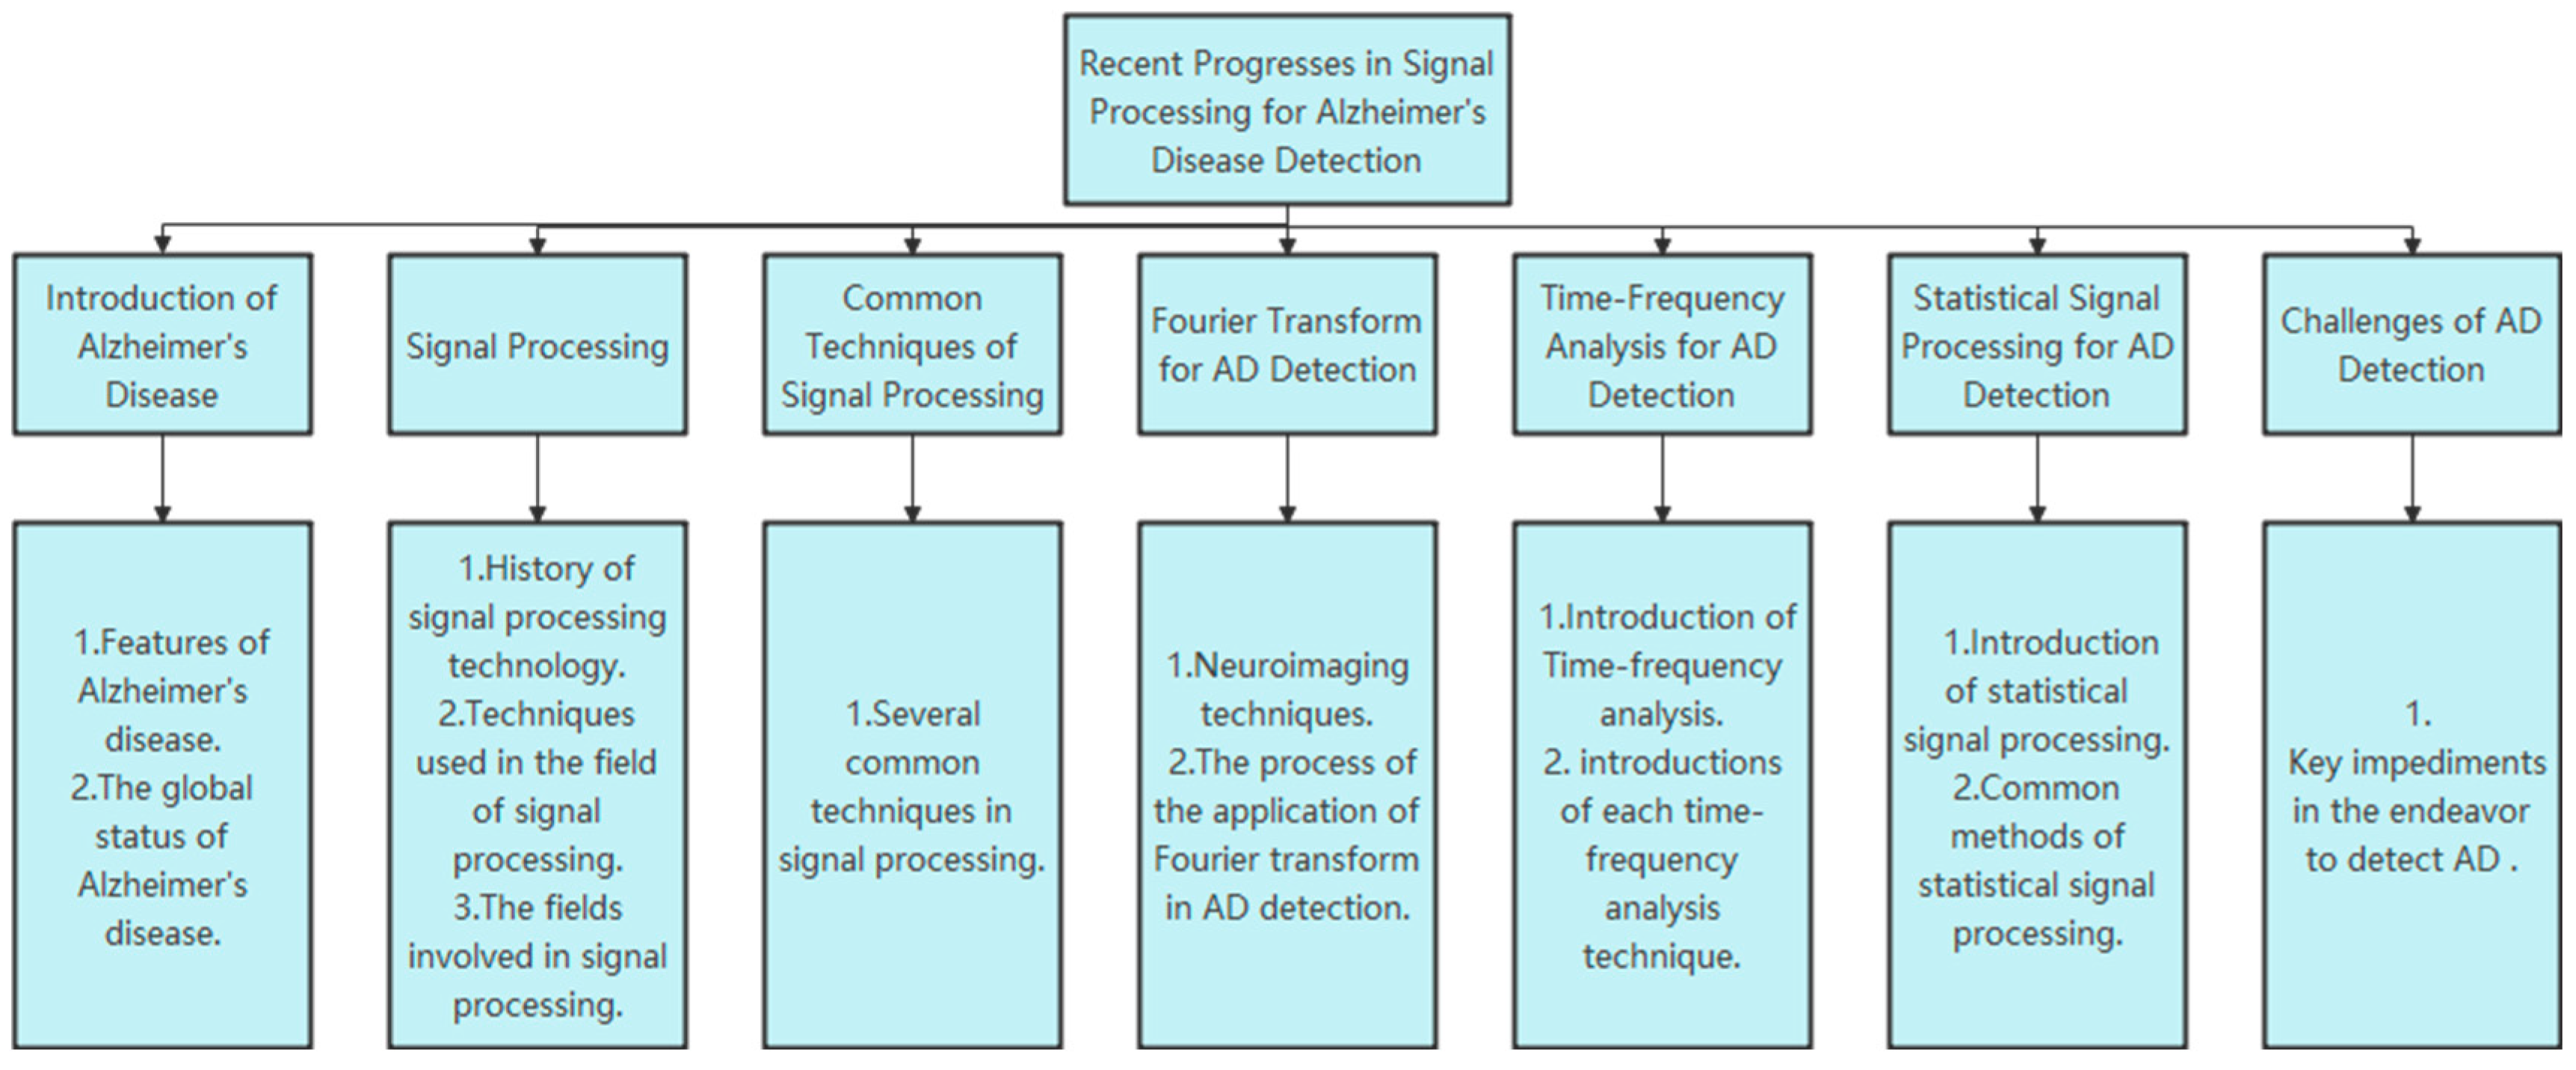
As we delve deeper into understanding the complexities of Alzheimer’s disease, the importance of research aimed at early detection, effective treatment, and potential prevention becomes increasingly clear. This paper focuses on one specific aspect of Alzheimer’s disease research – signal processing for Alzheimer’s disease detection [7]. We will explore the recent advances in this field, shedding light on innovative methods, techniques, and technologies that hold promise for early diagnosis and monitoring. By harnessing the power of signal processing, we aim to contribute to the broader effort to combat the devastating impact of Alzheimer’s disease and improve the lives of those affected by it. Paper structure is shown in Figure 3:

2. Signal Processing

Signal processing [8] is a fundamental discipline that has deep historical roots dating back to ancient civilizations. The earliest forms of signal processing were centered around basic audio and visual signals. In ancient Egypt, for instance, hieroglyphics served as a form of signal processing, encoding and transmitting information through symbols and images. Ancient Chinese texts similarly used symbols and encoding to convey messages, effectively representing a primitive form of signal processing [9].
The formalization of signal processing began in earnest during the 19th century. The mathematical groundwork was laid by scholars like Jean-Baptiste Joseph Fourier, whose work on Fourier analysis in the early 19th century revolutionized the way signals could be analyzed and synthesized [10]. Fourier’s pioneering techniques allowed for the decomposition of complex signals into simpler sinusoidal components, a fundamental concept in signal processing known as Fourier analysis [11].
World War II marked a significant turning point for signal processing. The development of radar systems for military purposes necessitated advanced techniques for the analysis of signals, leading to the emergence of digital signal processing (DSP) [12]. This period saw the application of early computers and digital technology to process and analyze signals efficiently.
The latter half of the 20th century witnessed a rapid expansion of signal processing applications across diverse fields, from telecommunications to medical imaging [13]. Advances in microelectronics and the availability of powerful computers made digital signal processing increasingly accessible. Researchers developed algorithms, such as the fast Fourier transform (FFT) [14], which made complex signal analysis feasible and opened the door to applications like image and speech processing, data compression, and audio synthesis, The advantages and drawbacks of each Techniques used in the field of signal processing are shown in Table 1:
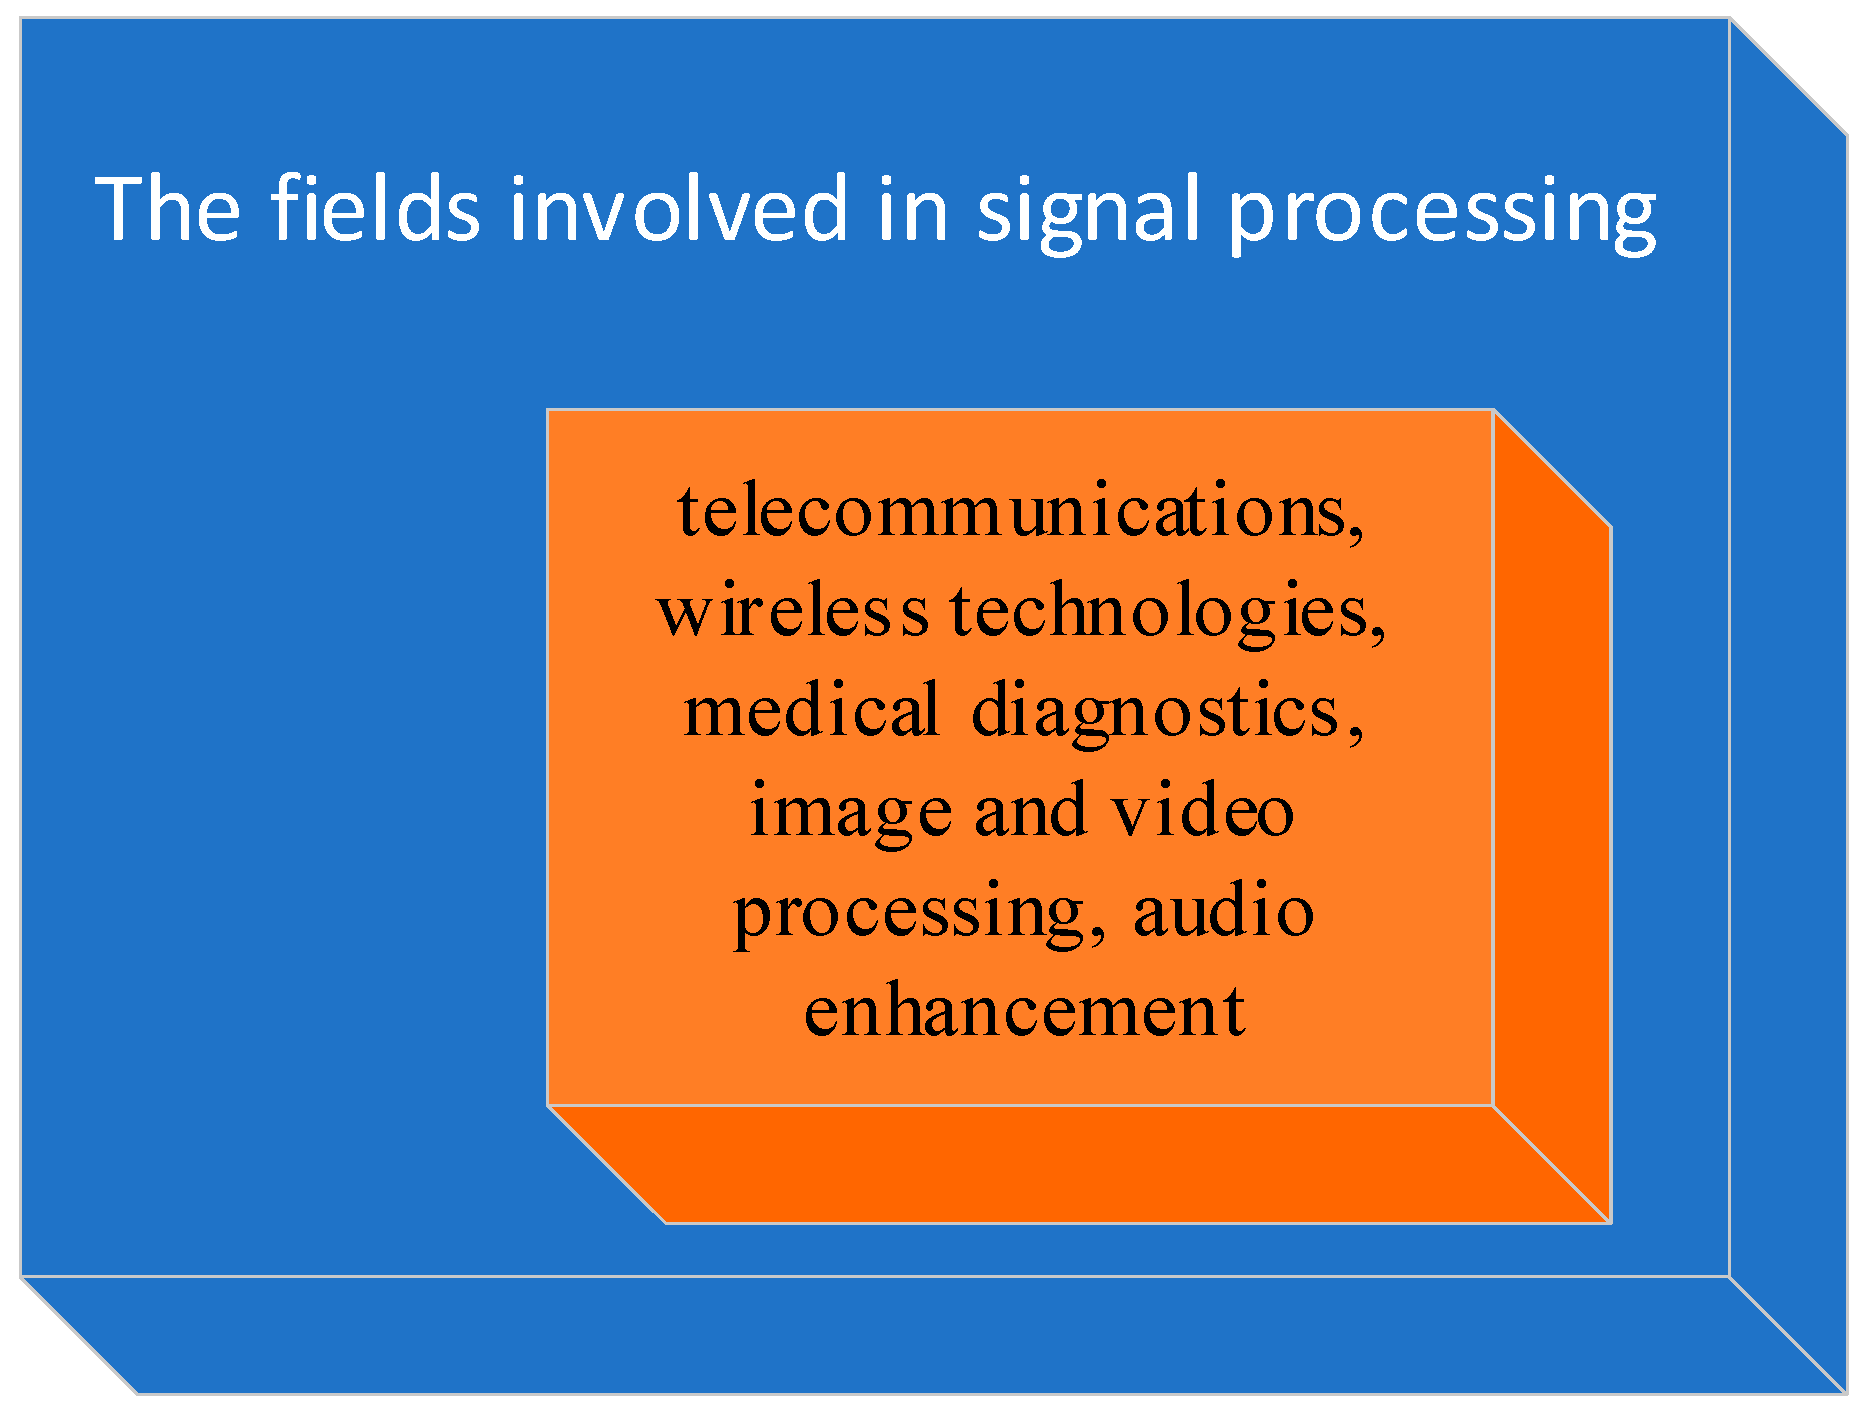
In the 21st century, signal processing continues to evolve and expand its reach. It plays a pivotal role in areas such as telecommunications, wireless technologies, medical diagnostics, image and video processing, audio enhancement, and more. As shown in Figure 4.With the proliferation of data in the digital age, signal processing techniques have become essential for extracting meaningful information from large datasets. The emergence of machine learning and artificial intelligence has further enriched the field, enabling advanced signal processing techniques to automate tasks like speech recognition, natural language processing, and image analysis [15].

3. Common Techniques of Signal Processing

Signal processing, a fundamental discipline with diverse applications, encompasses a broad spectrum of techniques and methodologies for the manipulation, analysis, and extraction of information from signals. These techniques are integral to the fields of engineering, physics, computer science, and numerous other domains. Several common techniques in signal processing, often utilized individually or in combination [16], As shown in Figure 5, include:
Fourier Transform and Spectral Analysis [17]: The Fourier transform is a fundamental tool for signal processing, enabling the decomposition of complex signals into their constituent frequency components. Spectral analysis, rooted in Fourier techniques, provides insights into the frequency content, power, and phase characteristics of signals, facilitating applications such as filtering, modulation, and the analysis of periodic phenomena.
Filtering and Convolution [18]: Filtering is a core concept, encompassing techniques like convolution, which allow for the extraction or enhancement of specific components within a signal. Filters can be designed to attenuate noise, isolate desired frequency ranges, or perform operations such as smoothing or differentiation.
Sampling and Discrete-Time Processing [19]: In the context of digital signal processing, signals are typically discrete in time. Sampling involves the conversion of continuous-time signals into discrete form, enabling efficient storage and processing. Techniques like quantization are employed to represent analog signals as digital values.
Time-Frequency Analysis [20]: Time-frequency analysis techniques, including the Short-Time Fourier Transform (STFT) and Wavelet Transform [21], provide a means to analyze signals in both the time and frequency domains simultaneously. These methods are particularly valuable for non-stationary signals or those with time-varying characteristics.
Digital Signal Processing (DSP) [22]: DSP encompasses a wide array of mathematical algorithms and techniques specifically tailored for the processing of digital signals. These include the Fast Fourier Transform (FFT), digital filtering, and various numerical methods for signal analysis and manipulation.
Statistical Signal Processing [23]: Statistical techniques, such as regression analysis, autoregressive modeling, and hidden Markov models, are employed to model and analyze signals with inherent probabilistic characteristics. These methods find application in fields like speech recognition [24], data compression [25], and pattern recognition.
Waveform and Signal Reconstruction [26]: Signal reconstruction techniques aim to recover a continuous or high-resolution representation from sampled or quantized data. Interpolation methods, such as polynomial or spline interpolation, facilitate the reconstruction of signals for visualization or further analysis.
Time-Domain Analysis [27]: Techniques in the time domain include amplitude modulation, envelope detection, and event detection, which focus on the characterization of signals in the time dimension. These methods are crucial for applications involving signal demodulation and event recognition.

4. Fourier Transform for AD Detection

The Fourier Transform is a fundamental mathematical tool employed in signal processing and medical imaging [28], and it has garnered significant attention for its potential utility in Alzheimer’s Disease (AD) detection. Alzheimer’s Disease is a neurodegenerative condition characterized by subtle cognitive decline, and early diagnosis is pivotal for effective intervention and management. In this academic overview, we delve into the application of the Fourier Transform as an analytical technique for AD detection, with a focus on its theoretical underpinnings, methodological implementation, and the potential insights it offers into the pathological processes associated with this debilitating condition.
The Fourier Transform is based on the pioneering work of Jean-Baptiste Joseph Fourier and allows the representation of complex, time-domain signals as a superposition of sinusoidal components [29]. In the context of AD detection, the application of Fourier analysis to neuroimaging data, particularly electroencephalography (EEG) and functional magnetic resonance imaging (fMRI) [30], enables the exploration of neural oscillations and frequencies, offering valuable insights into the brain’s functional and structural alterations associated with the disease, The advantages and drawbacks of each Neuroimaging techniques used in the field of signal processing are shown in Table 2:
The application of the Fourier Transform in AD detection involves the acquisition of neural signal data, typically EEG or fMRI, and the subsequent conversion of these time-domain signals into their frequency-domain representation. This is achieved by employing mathematical algorithms, such as the Fast Fourier Transform (FFT) in the case of EEG data. The transformed data reveals the spectral content, amplitude, and phase characteristics of neural oscillations, which may provide diagnostic biomarkers [31]. The process is shown in the Figure 6:
AD is known to manifest with disruptions in neural oscillations and functional connectivity. The Fourier Transform enables the quantification of these disturbances by identifying aberrations in specific frequency bands, including delta, theta, alpha, beta, and gamma rhythms [32]. Studies have shown that alterations in these frequency components are associated with cognitive impairment and have the potential to serve as informative markers for early AD detection.
The Fourier Transform’s application in AD detection holds promise for early diagnosis, tracking disease progression, and assessing treatment efficacy [33]. The characterization of neural oscillations through Fourier analysis offers quantitative measures of cognitive decline and may aid in the identification of subtle changes in brain function that precede clinical symptoms, enhancing the potential for early intervention and personalized treatment strategies.
Despite its potential, the application of the Fourier Transform in AD detection is not without challenges, including data preprocessing, interpretation, and the need for large-scale, longitudinal studies to validate its diagnostic accuracy. Future research endeavors are poised to harness the full potential of the Fourier Transform in conjunction with other advanced techniques, such as machine learning and artificial intelligence, to enhance the sensitivity and specificity of AD detection models [34].

5. Time-Frequency Analysis for AD Detection

Time-frequency analysis [35] is a pivotal signal processing technique that has garnered significant attention in the context of Alzheimer’s Disease (AD) detection. Alzheimer’s Disease is a progressive neurodegenerative condition characterized by cognitive impairment, and early diagnosis is critical for effective intervention. In this academic overview, we explore the application of time-frequency analysis as an essential analytical method for AD detection, emphasizing its theoretical foundations, methodological implementation, and its potential to reveal pertinent neurophysiological insights in the context of this debilitating disease.
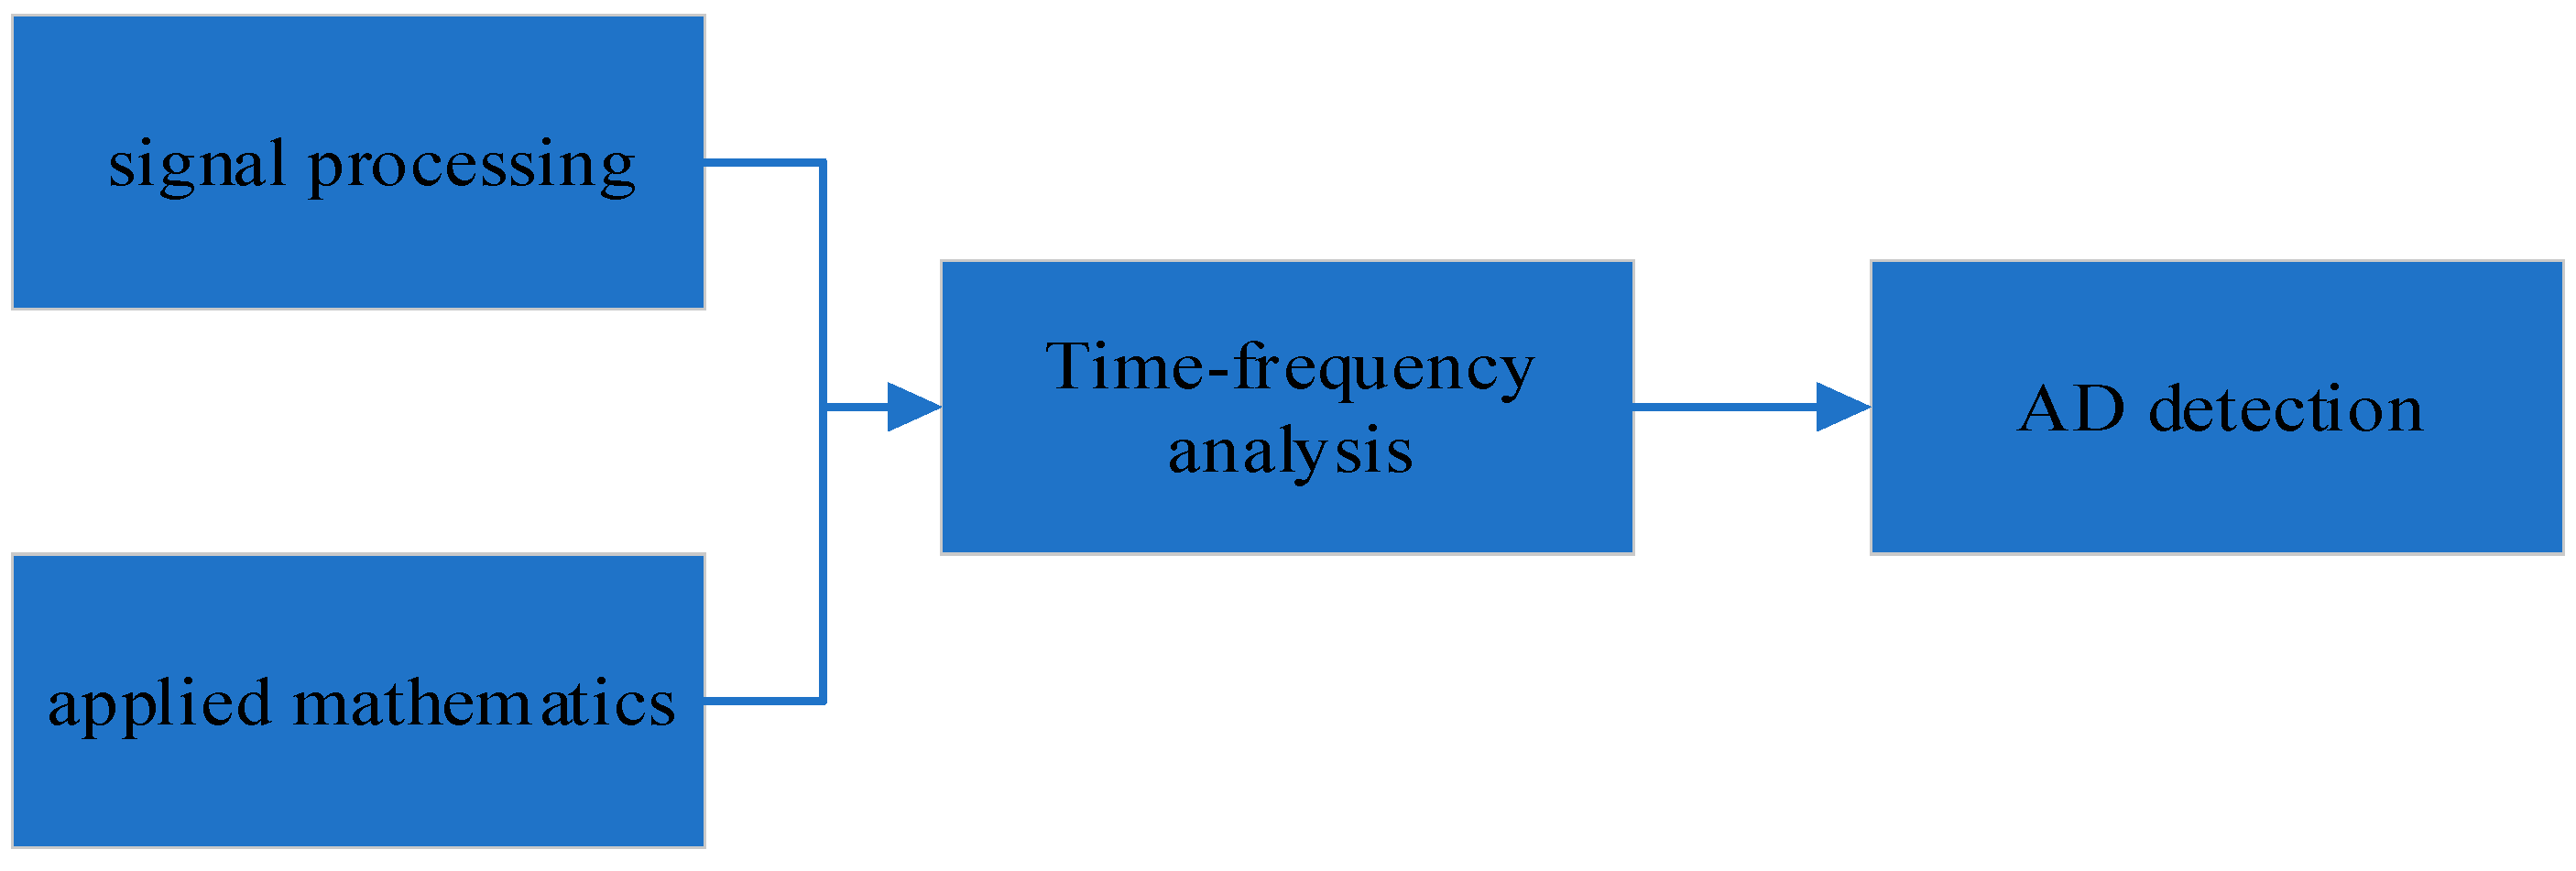
Time-frequency analysis, rooted in signal processing and applied mathematics, provides a means to dissect complex, time-varying signals into their constituent spectral components. In the realm of AD detection, it facilitates the examination of neural oscillations and frequency variations, offering valuable insights into the dynamic changes in brain activity that are associated with the disease [36],As shown in Figure 7:
Time-frequency analysis involves the transformation of neuroimaging data, such as electroencephalography (EEG), magnetic resonance imaging (MRI) [37,38] or fMRI [39], from the time domain to the frequency domain. Various techniques, including the Short-Time Fourier Transform (STFT), Wavelet Transform, and spectrogram analysis, are employed to elucidate the temporal evolution of frequency content within these neural signals [40], The introductions of each time-frequency analysis techniques are shown in Table 3:
AD is known to be linked to disturbances in neural oscillations, as well as alterations in functional connectivity patterns. Time-frequency analysis allows for the quantification of these abnormalities by detecting deviations in specific frequency bands or time-frequency patterns [41]. These variations in neural activity can serve as informative markers for the early detection of AD and may provide a deeper understanding of the underlying pathophysiological processes.
The application of time-frequency analysis in AD detection holds promise for early diagnosis, tracking the progression of the disease, and assessing the effectiveness of therapeutic interventions. By quantifying dynamic changes in brain activity, time-frequency analysis may enable the identification of subtle alterations in neural oscillations that precede clinical symptoms, thereby offering opportunities for timely and personalized clinical management strategies [42].
While time-frequency analysis offers significant potential for AD detection, it presents challenges related to data preprocessing, feature extraction, and the establishment of robust diagnostic models. Future research directions are poised to combine time-frequency analysis with advanced machine learning and artificial intelligence approaches to enhance the sensitivity and specificity of AD detection models, ultimately improving early diagnosis and patient outcomes.

6. Statistical Signal Processing for AD Detection

Statistical Signal Processing, a cornerstone of signal processing methodology, has gained prominence in the context of Alzheimer’s Disease (AD) detection [43]. Alzheimer’s Disease is a progressive neurodegenerative condition that manifests with cognitive decline, and early diagnosis plays a pivotal role in effective intervention and care. In this academic discourse, we delve into the application of Statistical Signal Processing as an analytical framework for AD detection, focusing on its theoretical foundations [44], methodological utilization, and its potential to unearth significant insights into the pathological mechanisms underlying this debilitating ailment.
Statistical Signal Processing encompasses a rich theoretical foundation rooted in the principles of probability, statistics, and estimation theory [45]. Its application to AD detection capitalizes on the inherent variability and stochastic characteristics of neural signals, such as electroencephalography (EEG), MRI [46], or functional MRI (fMRI). It facilitates the quantification of signal variations, enabling the identification of patterns associated with AD-related changes in brain function.
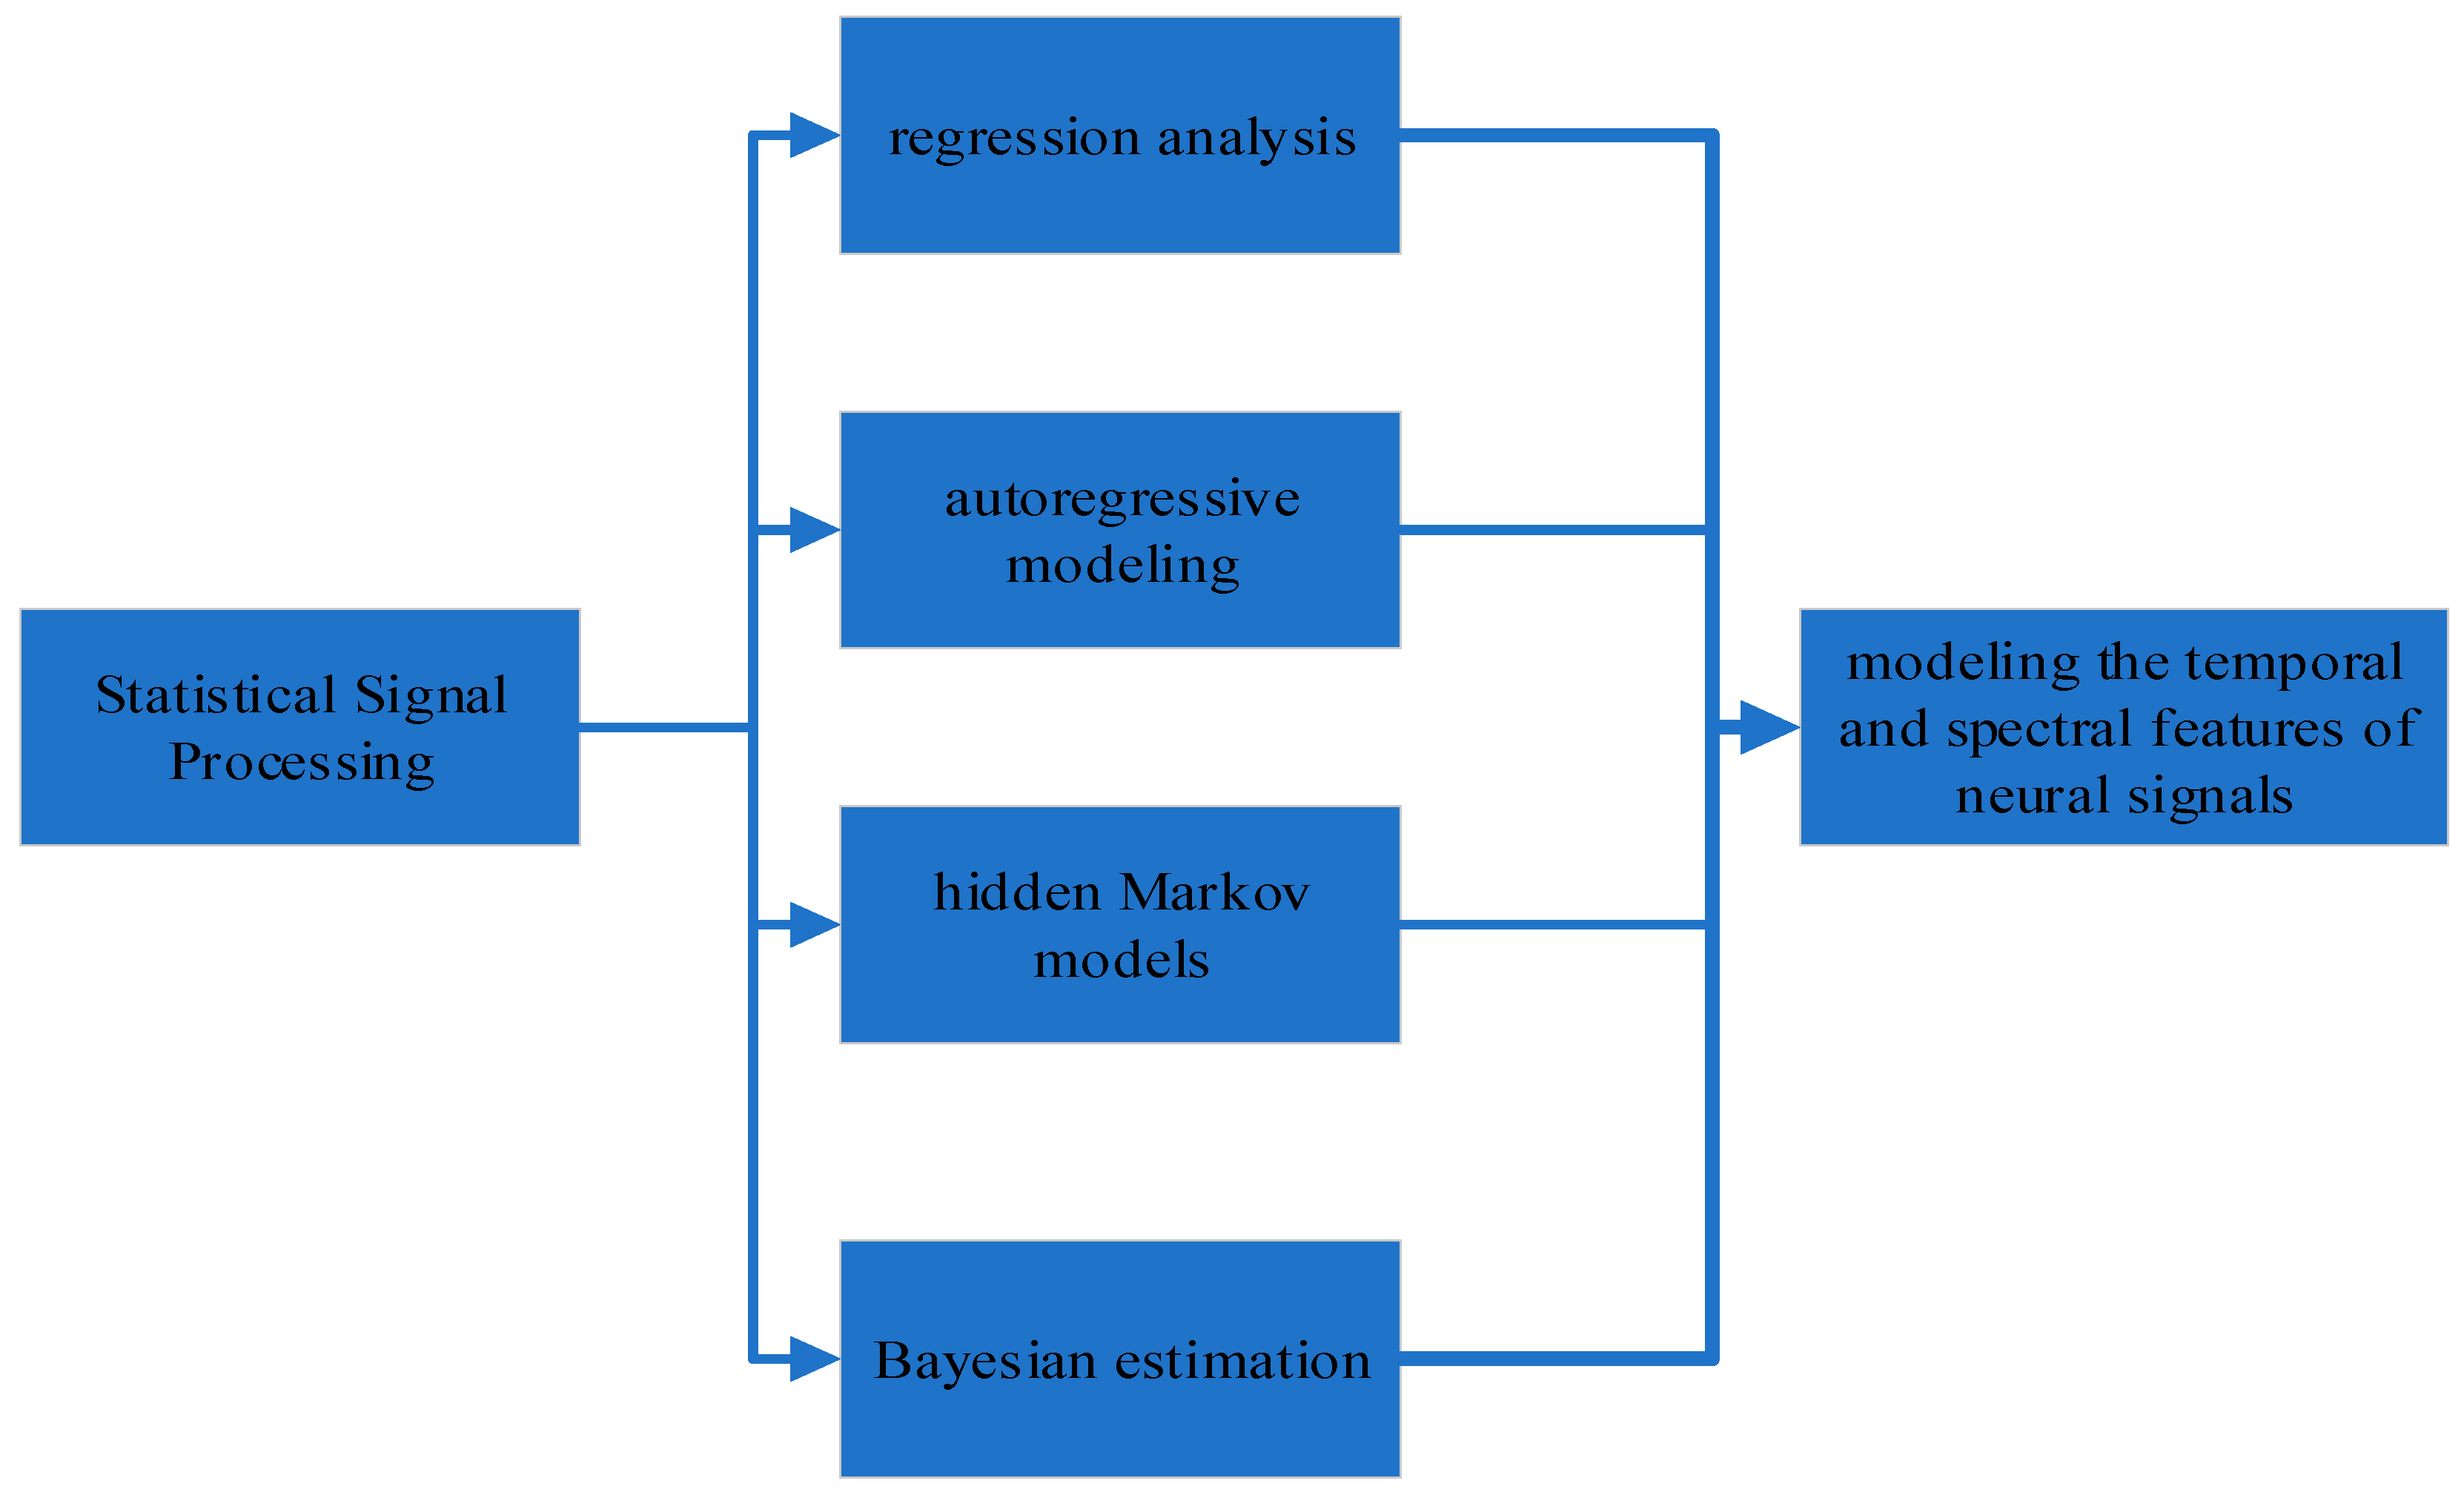
Statistical Signal Processing leverages a range of statistical techniques to analyze neuroimaging data. Common approaches encompass regression analysis, autoregressive modeling, hidden Markov models, and Bayesian estimation [47]. These methodologies assist in modeling the temporal and spectral features of neural signals, as well as the inherent uncertainties and variability within these signals, As shown in Figure 8:
Alzheimer’s Disease is characterized by distinct alterations in neural activity patterns and connectivity. Statistical Signal Processing empowers the identification of these deviations by modeling and analyzing the stochastic properties of neural signals [48]. This allows for the quantification of anomalies in specific brain regions or networks, ultimately serving as diagnostic markers and enhancing our understanding of the pathophysiological mechanisms associated with AD.
The application of Statistical Signal Processing in AD detection holds substantial potential for early diagnosis, tracking disease progression, and assessing the effectiveness of therapeutic interventions. By statistically characterizing the deviations in neural activity and connectivity, this approach can enable the identification of subtle, preclinical changes in brain function that precede observable cognitive deficits, thus fostering early intervention and individualized treatment strategies [49].
While Statistical Signal Processing offers significant promise for AD detection, it is not devoid of challenges, including the need for robust statistical models and data with high-dimensional complexity. Ongoing research is anticipated to combine Statistical Signal Processing with machine learning and artificial intelligence methodologies, further enhancing the precision and accuracy of AD detection models and advancing our ability to address the burgeoning public health concern posed by Alzheimer’s Disease.

7. Challenges of AD Detection

The pursuit of reliable and early detection of Alzheimer’s Disease (AD), a complex and progressive neurodegenerative disorder, is confronted by multifaceted challenges. This academic overview dissects the key impediments in the endeavor to detect AD [50], offering a comprehensive examination of the hurdles that researchers, clinicians, and healthcare practitioners face in this critical domain of clinical neuroscience.
AD is characterized by a wide spectrum of clinical and pathological heterogeneity. This heterogeneity extends to the various subtypes and stages of the disease. Distinguishing AD from other forms of dementia, such as vascular dementia or Lewy body dementia [51], and identifying early preclinical stages presents a formidable diagnostic challenge [52].
AD detection is hampered by the absence of definitive, universally accepted biomarkers. While cerebrospinal fluid markers like amyloid-beta and tau proteins show promise, they remain invasive and costly. Non-invasive and cost-effective biomarkers are imperative for widespread screening and early diagnosis [53].
Early detection in the preclinical phase, where individuals exhibit subtle cognitive changes but are asymptomatic, remains elusive. Developing tools and techniques to identify AD-related changes in this phase is a pressing challenge, as intervention at this stage may yield the greatest therapeutic benefit.
Neuroimaging and physiological data, including data from techniques like magnetic resonance imaging (MRI), positron emission tomography (PET), and electroencephalography (EEG), exhibit considerable variability due to factors like noise, inter-subject differences, and variability in imaging protocols [54]. Analyzing this complex, high-dimensional data presents significant computational and statistical challenges.
The collection and analysis of sensitive neuroimaging and genetic data for AD detection raise ethical and privacy concerns. Striking a balance between data sharing and privacy protection is crucial to advance research while safeguarding patient confidentiality [55].

8. Conclusion

The quest for early and accurate detection of Alzheimer’s Disease (AD) is a multidimensional endeavor that traverses the realms of clinical neuroscience, computational analysis, and ethical considerations. This paper has elucidated the profound significance of AD detection, delving into the diverse methodologies, including Fourier Transform, Time-Frequency Analysis, and Statistical Signal Processing, that promise to shed light on the intricate pathophysiological processes underlying this devastating condition [56].
Through an academic lens, we have explored the theoretical foundations and methodological implementation of these techniques, emphasizing their potential to reveal crucial neurophysiological signatures that herald the onset and progression of AD. These tools hold the promise of early detection, offering the potential for interventions at preclinical stages and personalized treatment strategies, ultimately ameliorating the impact of AD on individuals and society.
However, the journey towards effective AD detection is far from straightforward, beset with intricate challenges. The diagnostic heterogeneity of AD, the absence of definitive biomarkers, and the identification of the preclinical phase present formidable hurdles. Furthermore, the complexity of high-dimensional data, ethical concerns, and issues of cost and accessibility demand innovative solutions and interdisciplinary collaboration.

9. Future Research Directions

Multimodal Data Fusion: One important future direction is to explore the integration of multiple modalities for Alzheimer’s disease detection, such as combining EEG (Electroencephalography) signals with fMRI (Functional Magnetic Resonance Imaging) or PET (Positron Emission Tomography) data. By leveraging the complementary information from different modalities, it is possible to improve the accuracy and reliability of Alzheimer’s disease detection.
Deep Learning for Feature Extraction: Deep learning techniques, such as Convolutional Neural Networks (CNNs) and Recurrent Neural Networks (RNNs), have shown great success in various signal processing tasks. Future research can focus on developing deep learning-based algorithms for feature extraction from brain imaging and physiological signals related to Alzheimer’s disease. This can potentially capture complex patterns and relationships that are difficult to extract using traditional methods.

Funding

This research did not receive any grants.

Data Availability Statement

There is no data associated with this paper.

Acknowledgment

We thank all the anonymous reviewers for their hard reviewing work.

Conflict of Interest

The author declares there is no conflict of interest regarding this paper.

References

  1. C. T. Zhang, J. C. T. Zhang, J. Wang, and W. Y. Wang, “Wnt signaling in synaptogenesis of Alzheimer’s disease,” Ibrain, 2023. [CrossRef]
  2. Y. Deng, H. Y. Deng, H. Wang, K. Gu, and P. Song, “Alzheimer’s disease with frailty: Prevalence, screening, assessment, intervention strategies and challenges,” BioScience Trends, vol. 17, pp. 283-292, 2023. [CrossRef]
  3. Jiang, X.; Chang, L.; Zhang, Y.-D. Classification of Alzheimer’s Disease via Eight-Layer Convolutional Neural Network with Batch Normalization and Dropout Techniques. J. Med Imaging Heal. Informatics 2020, 10, 1040–1048. [Google Scholar] [CrossRef]
  4. Dave, B.P.; Shah, Y.B.; Maheshwari, K.G.; Mansuri, K.A.; Prajapati, B.S.; Postwala, H.I.; Chorawala, M.R. Pathophysiological Aspects and Therapeutic Armamentarium of Alzheimer’s Disease: Recent Trends and Future Development. Cell. Mol. Neurobiol. 2023, 43, 1–38. [Google Scholar] [CrossRef] [PubMed]
  5. Ferrer, I. “Hypothesis review: Alzheimer’s overture guidelines,” Brain Pathology, vol. 33, p. e13122, 2023. [CrossRef]
  6. Mattap, S.M.; Mohan, D.; McGrattan, A.M.; Allotey, P.; Stephan, B.C.; Reidpath, D.D.; Siervo, M.; Robinson, L.; Chaiyakunapruk, N. The economic burden of dementia in low- and middle-income countries (LMICs): a systematic review. BMJ Glob. Heal. 2022, 7, e007409. [Google Scholar] [CrossRef] [PubMed]
  7. AlSharabi, K.; Bin Salamah, Y.; Abdurraqeeb, A.M.; Aljalal, M.; Alturki, F.A. EEG Signal Processing for Alzheimer’s Disorders Using Discrete Wavelet Transform and Machine Learning Approaches. IEEE Access 2022, 10, 89781–89797. [Google Scholar] [CrossRef]
  8. Gafni, T.; Shlezinger, N.; Cohen, K.; Eldar, Y.C.; Poor, H.V. Federated Learning: A signal processing perspective. IEEE Signal Process. Mag. 2022, 39, 14–41. [Google Scholar] [CrossRef]
  9. Zhang, Y.; Wu, L.; Wei, G.; Wang, S. A novel algorithm for all pairs shortest path problem based on matrix multiplication and pulse coupled neural network. Digit. Signal Process. 2011, 21, 517–521. [Google Scholar] [CrossRef]
  10. G. Buttman, “The shadow of the telescope: a biography of John Herschel,” The Shadow of the Telescope, pp. 1-288, 2022.
  11. Fan, Y.; Sun, J.; Shu, Y.; Zhang, Z.; Zheng, G.; Chen, W.; Zhang, J.; Gui, K.; Wang, K.; Chen, Q.; et al. Efficient Synthetic Aperture for Phaseless Fourier Ptychographic Microscopy with Hybrid Coherent and Incoherent Illumination. Laser Photon- Rev. 2022, 17. [Google Scholar] [CrossRef]
  12. Yu, J.; Wei, Y. Digital Signal Processing for High-Speed THz Communications. Chin. J. Electron. 2022, 31, 534–546. [Google Scholar] [CrossRef]
  13. Valizadeh, M.; Wolff, S.J. Convolutional Neural Network applications in additive manufacturing: A review. Adv. Ind. Manuf. Eng. 2022, 4, 100072. [Google Scholar] [CrossRef]
  14. Rajaby, E.; Sayedi, S.M. A structured review of sparse fast Fourier transform algorithms. Digit. Signal Process. 2022, 123, 103403. [Google Scholar] [CrossRef]
  15. Soori, M.; Arezoo, B.; Dastres, R. Artificial intelligence, machine learning and deep learning in advanced robotics, a review. Cogn. Robot. 2023, 3, 54–70. [Google Scholar] [CrossRef]
  16. Zhang, Y.; Wang, S.; Phillips, P.; Yang, J.; Yuan, T.-F. Three-Dimensional Eigenbrain for the Detection of Subjects and Brain Regions Related with Alzheimer’s Disease. J. Alzheimer’s Dis. 2016, 50, 1163–1179. [Google Scholar] [CrossRef] [PubMed]
  17. Vowels, M.J.; Vowels, L.M.; Wood, N.D. Spectral and cross-spectral analysis—A tutorial for psychologists and social scientists. Psychol. Methods 2023, 28, 631–650. [Google Scholar] [CrossRef] [PubMed]
  18. Stanković, L.; Mandic, D. Convolutional Neural Networks Demystified: A Matched Filtering Perspective-Based Tutorial. IEEE Trans. Syst. Man, Cybern. Syst. 2023, 53, 3614–3628. [Google Scholar] [CrossRef]
  19. Campbell, J. A. , Benton, V. De Bortoli, T. Rainforth, G. Deligiannidis, and A. Doucet, “A continuous time framework for discrete denoising models,” Advances in Neural Information Processing Systems, vol. 35, pp. 28266-28279, 2022.
  20. R. B. Pachori, Time-frequency analysis techniques and their applications: CRC Press, 2023.
  21. Ha, L.D.; Kim, K.J.; Kwon, S.J.; Chang, B.; Hwang, S. Time-Resolved Electrochemical Impedance Spectroscopy of Stochastic Nanoparticle Collision: Short Time Fourier Transform versus Continuous Wavelet Transform. Small 2023, 19, e2302158. [Google Scholar] [CrossRef] [PubMed]
  22. M. Khan, S. K. M. Khan, S. K. Hasnain, and M. Jamil, Digital Signal Processing: A Breadth-first Approach: CRC Press, 2022.
  23. X.-D. Zhang, Modern signal processing: Walter de Gruyter GmbH & Co KG, 2022.
  24. Dong, M.; Yan, D.; Gong, Y. Adversarial Example Devastation and Detection on Speech Recognition System by Adding Random Noise. J. Audio Eng. Soc. 2023, 71, 34–44. [Google Scholar] [CrossRef]
  25. Ruggeri, R.; Blake, C.; DeRose, J.; Garcia-Quintero, C.; Hadzhiyska, B.; Ishak, M.; Jeffrey, N.; Joudaki, S.; Krolewski, A.; Lange, J.U.; et al. A data compression and optimal galaxy weights scheme for Dark Energy Spectroscopic Instrument and weak lensing data sets. Mon. Not. R. Astron. Soc. 2023, 525, 3865–3878. [Google Scholar] [CrossRef]
  26. Xiao, H.; Liu, C.; Zhang, B. Reconstruction of central arterial pressure waveform based on CNN-BILSTM. Biomed. Signal Process. Control. 2022, 74, 103513. [Google Scholar] [CrossRef]
  27. Zhou, K.; Tang, J. A wavelet neural network informed by time-domain signal preprocessing for bearing remaining useful life prediction. Appl. Math. Model. 2023, 122, 220–241. [Google Scholar] [CrossRef]
  28. V. Goyal, A. V. Goyal, A. Chaudhary, and R. Saxena, “Review of Wavelet Transform and its Application in Different Compression Technique,” 2022.
  29. Özhan, O. Basic Transforms for Electrical Engineering; Springer Science and Business Media LLC: Dordrecht, GX, Netherlands, 2022; ISBN 9783030988456. [Google Scholar]
  30. Ebrahiminia, F.; Cichy, R.M.; Khaligh-Razavi, S.-M. A multivariate comparison of electroencephalogram and functional magnetic resonance imaging to electrocorticogram using visual object representations in humans. Front. Neurosci. 2022, 16, 983602. [Google Scholar] [CrossRef]
  31. Granado, M.; Collavini, S.; Baravalle, R.; Martinez, N.; Montemurro, M.A.; Rosso, O.A.; Montani, F. High-frequency oscillations in the ripple bands and amplitude information coding: Toward a biomarker of maximum entropy in the preictal signals. Chaos: Interdiscip. J. Nonlinear Sci. 2022, 32, 093151. [Google Scholar] [CrossRef]
  32. Liu, S.; Chen, S.; Huang, Z.; Liu, X.; Li, M.; Su, F.; Hao, X.; Ming, D. Hypofunction of directed brain network within alpha frequency band in depressive patients: a graph-theoretic analysis. Cogn. Neurodynamics 2022, 16, 1059–1071. [Google Scholar] [CrossRef] [PubMed]
  33. Vitorino, R.; Barros, A.S.; Guedes, S.; Caixeta, D.C.; Sabino-Silva, R. Diagnostic and monitoring applications using near infrared (NIR) spectroscopy in cancer and other diseases. Photodiagnosis Photodyn. Ther. 2023, 42, 103633. [Google Scholar] [CrossRef] [PubMed]
  34. Zhao, J.; Han, X.; Ouyang, M.; Burke, A.F. Specialized deep neural networks for battery health prognostics: Opportunities and challenges. J. Energy Chem. 2023, 87, 416–438. [Google Scholar] [CrossRef]
  35. Lam, S.I.; Pant, M. Manning, M. Kubanski, P. Fox, S. Rajan, et al., “Time-frequency analysis using V-band radar for drone detection and classification,” in 2023 IEEE International Instrumentation and Measurement Technology Conference (I2MTC), 2023, pp. 1-6. [CrossRef]
  36. Rodríguez, F.; Azcárate, I.; Vadillo, J.; Galarza, A. Forecasting intra-hour solar photovoltaic energy by assembling wavelet based time-frequency analysis with deep learning neural networks. Int. J. Electr. Power Energy Syst. 2021, 137, 107777. [Google Scholar] [CrossRef]
  37. Zhang, Y.; Wang, S.; Ji, G.; Dong, Z. AN IMPROVED QUALITY GUIDED PHASE UNWRAPPING METHOD AND ITS APPLICATIONS TO MRI. Prog. Electromagn. Res. 2014, 145, 273–286. [Google Scholar] [CrossRef]
  38. Zhang, Y.-D.; Wang, S.-H.; Yang, X.-J.; Dong, Z.-C.; Liu, G.; Phillips, P.; Yuan, T.-F. Pathological brain detection in MRI scanning by wavelet packet Tsallis entropy and fuzzy support vector machine. SpringerPlus 2015, 4, 1–16. [Google Scholar] [CrossRef]
  39. Allam, A.K.; Froudarakis, E.; Papageorgiou, T.D. Individualized Real-Time fMRI Neuromodulation for the Alleviation of Cranial Nerve IX and XII Neuropathy (S38.004). Neurology 2023, 100. [Google Scholar] [CrossRef]
  40. Siddique, M.F.; Ahmad, Z.; Ullah, N.; Kim, J. A Hybrid Deep Learning Approach: Integrating Short-Time Fourier Transform and Continuous Wavelet Transform for Improved Pipeline Leak Detection. Sensors 2023, 23, 8079. [Google Scholar] [CrossRef]
  41. Torres-Castilllo, J.R.; López-López, C.O.; Padilla-Castañeda, M.A. Neuromuscular disorders detection through time-frequency analysis and classification of multi-muscular EMG signals using Hilbert-Huang transform. Biomed. Signal Process. Control. 2021, 71, 103037. [Google Scholar] [CrossRef]
  42. Nafea, M.S.; Ismail, Z.H. Supervised Machine Learning and Deep Learning Techniques for Epileptic Seizure Recognition Using EEG Signals—A Systematic Literature Review. Bioengineering 2022, 9, 781. [Google Scholar] [CrossRef]
  43. Pokorny, F.B.; Schmitt, M.; Egger, M.; Bartl-Pokorny, K.D.; Zhang, D.; Schuller, B.W.; Marschik, P.B. Automatic vocalisation-based detection of fragile X syndrome and Rett syndrome. Sci. Rep. 2022, 12, 1–13. [Google Scholar] [CrossRef] [PubMed]
  44. Wang, S.-H.; Du, S.; Zhang, Y.; Phillips, P.; Wu, L.-N.; Chen, X.-Q.; Zhang, Y.-D. Alzheimer’s Disease Detection by Pseudo Zernike Moment and Linear Regression Classification. CNS Neurol. Disord. - Drug Targets 2017, 16, 11–15. [Google Scholar] [CrossRef] [PubMed]
  45. Peel, L.; Peixoto, T.P.; De Domenico, M. Statistical inference links data and theory in network science. Nat. Commun. 2022, 13, 1–15. [Google Scholar] [CrossRef] [PubMed]
  46. Zhang, Y.; Yang, J.; Wang, S.; Dong, Z.; Phillips, P. Pathological brain detection in MRI scanning via Hu moment invariants and machine learning. J. Exp. Theor. Artif. Intell. 2016, 29, 299–312. [Google Scholar] [CrossRef]
  47. M. Hashemi, A. N. M. Hashemi, A. N. Vattikonda, J. Jha, V. Sip, M. M. Woodman, F. Bartolomei, et al., “Simulation-based inference for whole-brain network modeling of epilepsy using deep neural density estimators,” medRxiv, p. 2022.06. 02.22275860, 2022.
  48. Dara, O.A.; Lopez-Guede, J.M.; Raheem, H.I.; Rahebi, J.; Zulueta, E.; Fernandez-Gamiz, U. Alzheimer’s Disease Diagnosis Using Machine Learning: A Survey. Appl. Sci. 2023, 13, 8298. [Google Scholar] [CrossRef]
  49. J. 10 3705, 2023. [CrossRef]
  50. Wang, S.; Zhang, Y.; Liu, G.; Phillips, P.; Yuan, T.-F. Detection of Alzheimer’s Disease by Three-Dimensional Displacement Field Estimation in Structural Magnetic Resonance Imaging. J. Alzheimer’s Dis. 2016, 50, 233–248. [Google Scholar] [CrossRef]
  51. Fu, X.; Chu, C.; Pang, Y.; Cai, H.; Ren, Z.; Jia, L. A blood mRNA panel that differentiates Alzheimer’s disease from other dementia types. J. Neurol. 2023, 270, 2117–2127. [Google Scholar] [CrossRef] [PubMed]
  52. Zhang, Y.; Wang, S. Detection of Alzheimer’s disease by displacement field and machine learning. PeerJ 2015, 3, e1251. [Google Scholar] [CrossRef]
  53. Yu, X.; Shao, K.; Wan, K.; Li, T.; Li, Y.; Zhu, X.; Han, Y. Progress in blood biomarkers of subjective cognitive decline in preclinical Alzheimer’s disease. Chin. Med J. 2023, 136, 505–521. [Google Scholar] [CrossRef] [PubMed]
  54. M. T. deBettencourt, W. A. M. T. deBettencourt, W. A. Bainbridge, and M. D. Rosenberg, “Functional neuroimaging,” 2023. [CrossRef]
  55. Wang, S.-H.; Zhang, Y.; Li, Y.-J.; Jia, W.-J.; Liu, F.-Y.; Yang, M.-M.; Zhang, Y.-D. Single slice based detection for Alzheimer’s disease via wavelet entropy and multilayer perceptron trained by biogeography-based optimization. Multimedia Tools Appl. 2016, 77, 10393–10417. [Google Scholar] [CrossRef]
  56. Zhang, Y.; Wang, S.; Sui, Y.; Yang, M.; Liu, B.; Cheng, H.; Sun, J.; Jia, W.; Phillips, P.; Gorriz, J.M. Multivariate Approach for Alzheimer’s Disease Detection Using Stationary Wavelet Entropy and Predator-Prey Particle Swarm Optimization. J. Alzheimer’s Dis. 2018, 65, 855–869. [Google Scholar] [CrossRef] [PubMed]
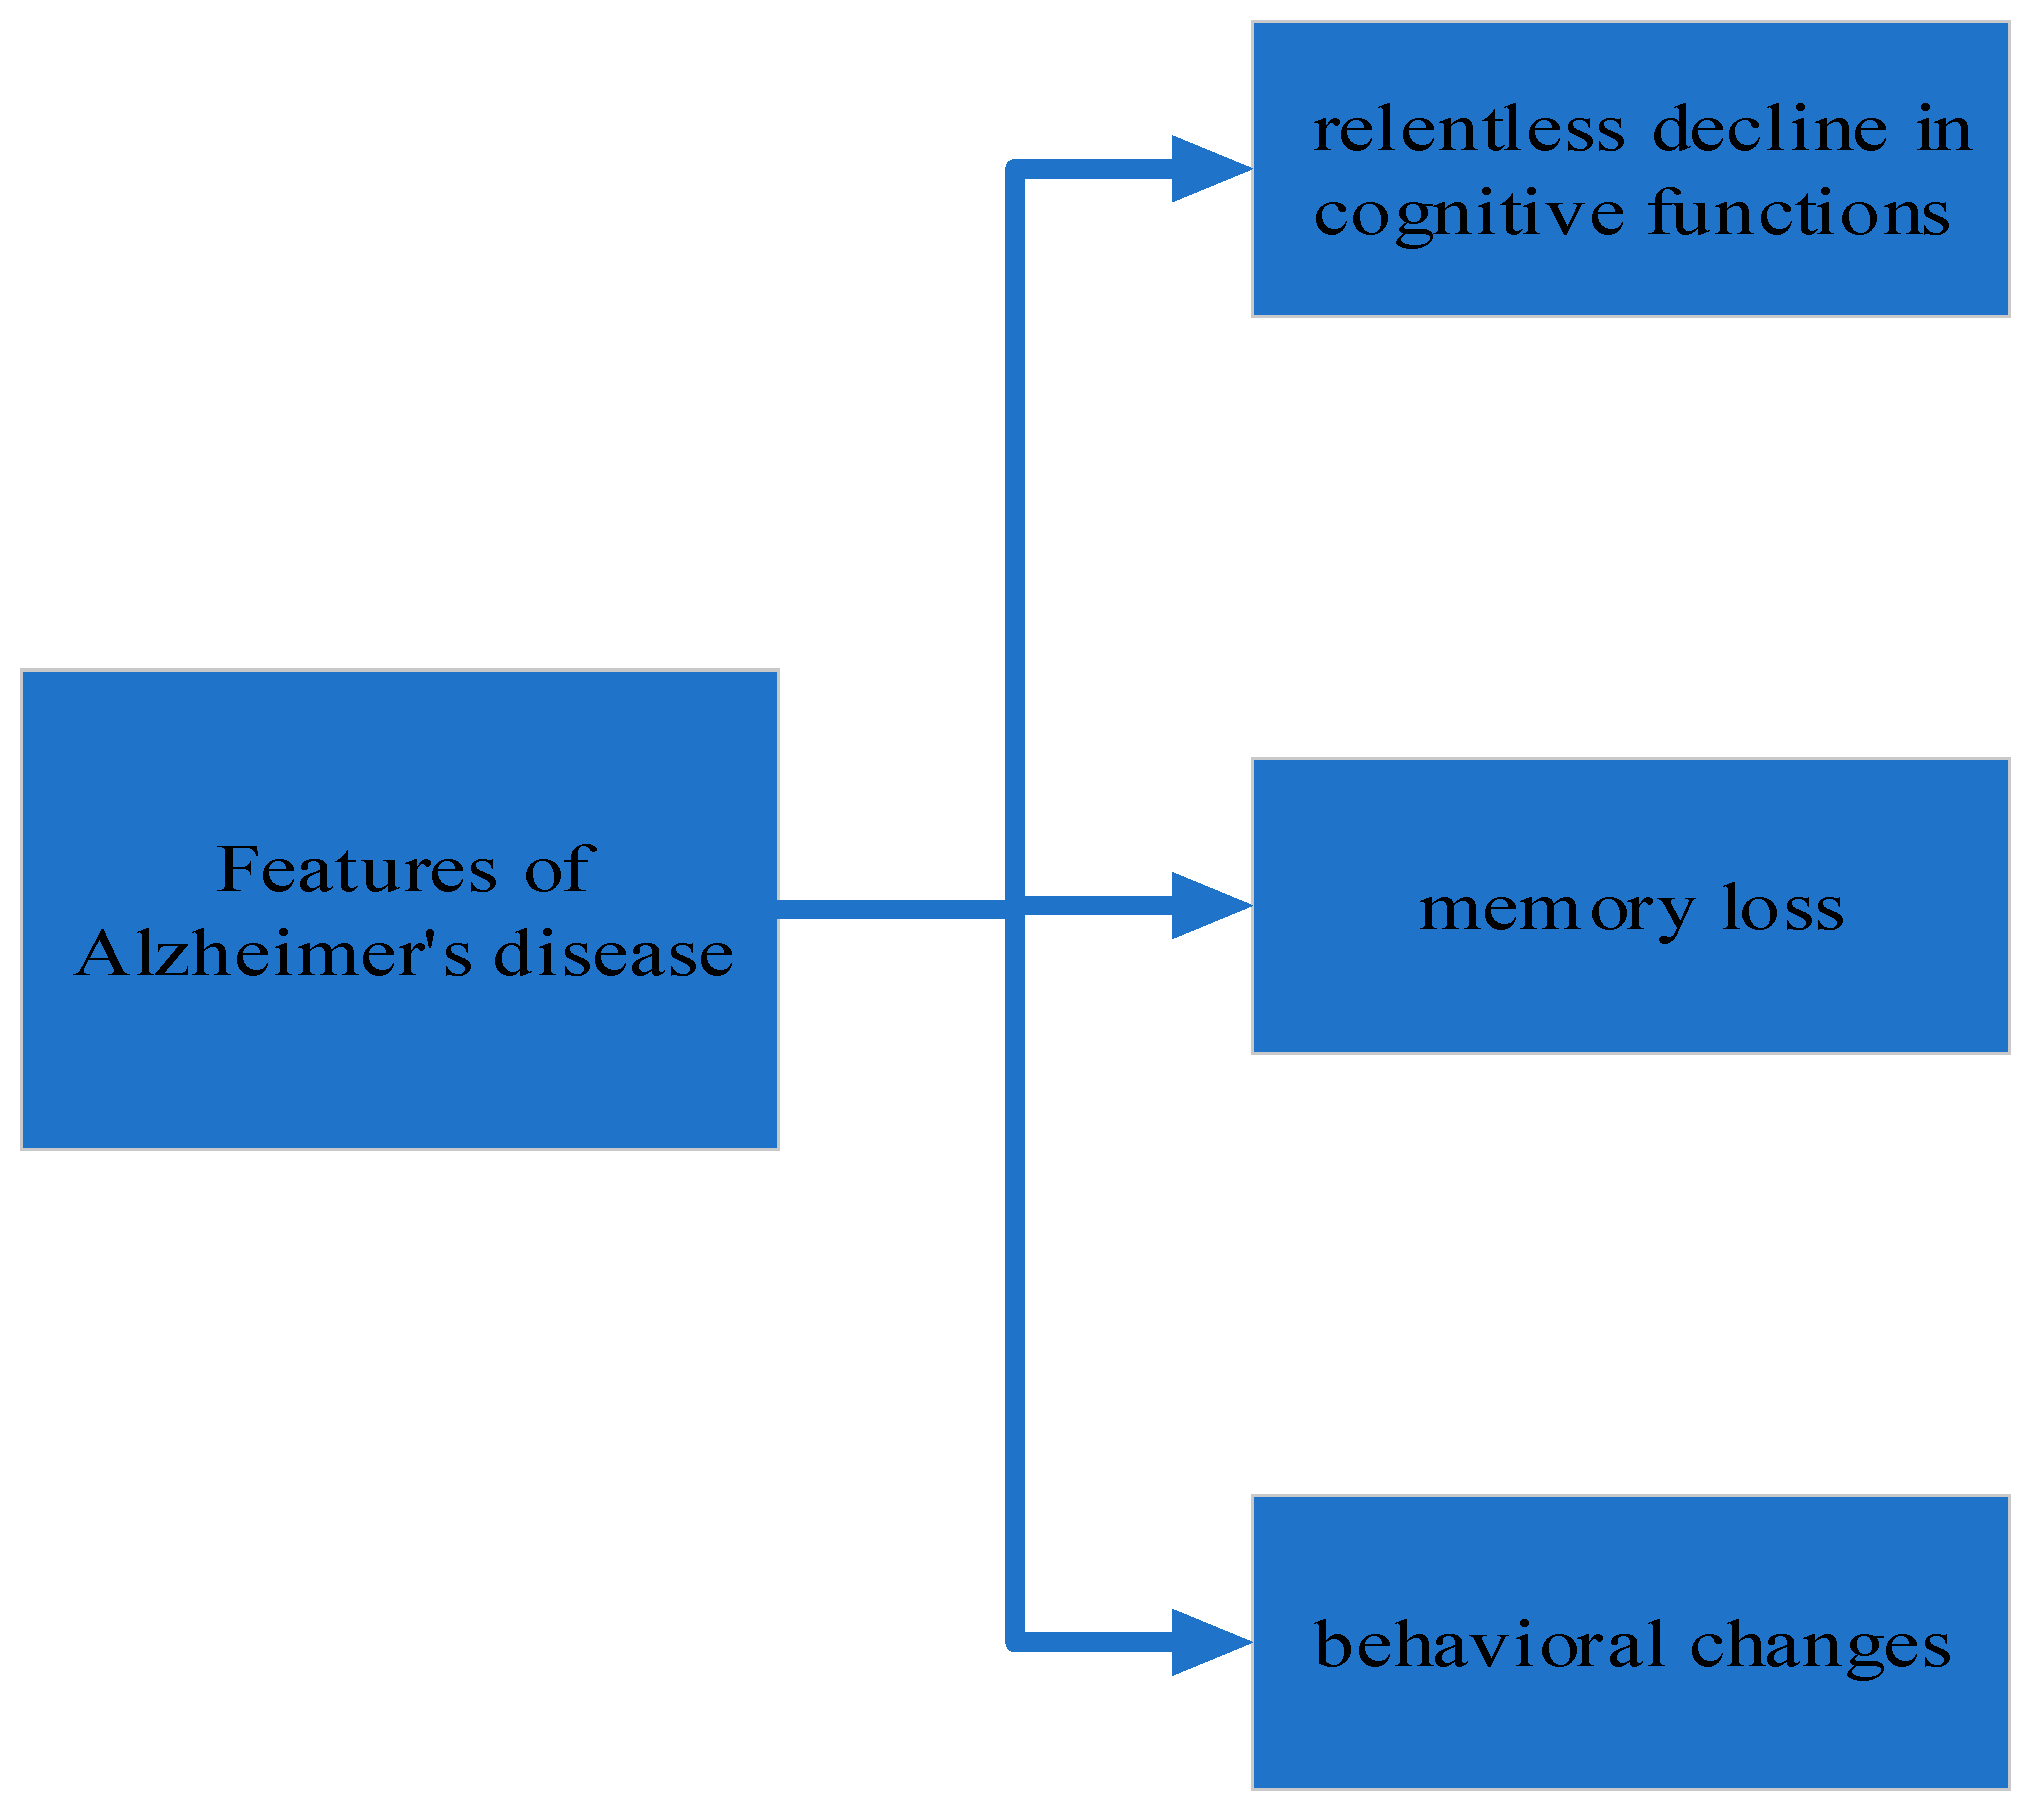
Figure 1. Features of Alzheimer’s disease.
Preprints 88648 g001
Figure 2. Unusual neuroanatomical changes.
Preprints 88648 g002
Figure 3. Paper structure.
Preprints 88648 g003
Figure 4. The fields involved in signal processing.
Preprints 88648 g004
Figure 5. Several common techniques in signal processing.
Preprints 88648 g005
Figure 6. The process of the application of Fourier transform in AD detection.
Preprints 88648 g006
Figure 7. Time-frequency analysis.
Preprints 88648 g007
Figure 8. Common methods of statistical signal processing.
Preprints 88648 g008
Table 1. The advantages and drawbacks of each technique used in the field of signal processing.
Techniques used in the field of signal processing Advantages Drawbacks
digital signal processing (DSP)
  • Flexibility: The DSP approach can be customized and adapted to the needs of the application and is suitable for a variety of signal processing tasks.
  • Real-time: DSP algorithms can usually process signals in real time and are suitable for applications that require an immediate response.
  • High accuracy: Because DSP methods can use complex algorithms and filters, they can provide highly accurate signal processing results.
  • High computational complexity: Some complex DSP algorithms may require a lot of computational resources, including high-performance processors and memory, which limits their application in resource-constrained systems.
  • Difficult parameter selection: DSP algorithms usually need to select the right parameters according to the signal characteristics and application requirements, which may require a certain amount of professional knowledge and experience.
fast Fourier transform (FFT)
  • Fast computation: The FFT algorithm can significantly reduce the computational complexity, and by utilizing symmetry and periodicity, the computation time to convert the signal from the time domain to the frequency domain is greatly shortened.
  • Efficiency: The FFT algorithm operates in the frequency domain, can analyze and process the spectrum, and is suitable for many signal processing tasks, such as spectrum analysis and filtering.
  • Wide application: FFT has become a general signal processing tool, widely used in speech processing, image processing, communication systems and other fields.
  • Since the output is 0 on a negative input, the ReLU neuron may experience a “death” situation, that is, the neuron will never be activated again, resulting in the deactivation of parts of the network.
  • The output is not centered on 0, which can cause migration problems during training and increase the instability of the model.
Table 2. The advantages and drawbacks of each Neuroimaging technique.
Neuroimaging technique Advantages Drawbacks
electroencephalography (EEG) High temporal resolution: EEG is able to record brain electrical activity with a temporal resolution of milliseconds, which can capture the brain’s rapidly changing activity.
Low cost and easy to operate: EEG devices are relatively inexpensive and simple to operate, allowing for a wide range of applications in laboratory and clinical Settings.
Strong tolerance for movement: EEG is more tolerant of subjects’ head movements, which is suitable for situations where active participation or dynamic tasks are required.
Limited spatial resolution: Because EEG signals are interfered with by the skull and tissues, their spatial resolution is low, making it difficult to accurately locate the source of brain activity.
Subject to artifacts and noise: EEG is susceptible to eye movement, muscle activity, and other electromagnetic interference, which may produce artifacts and noise that require subsequent signal processing.
Unable to directly observe brain structure: EEG can only reflect the electrical activity of the brain and cannot provide direct information about brain structure.
functional magnetic resonance imaging (fMRI) High spatial resolution: fMRI can provide high spatial resolution and can accurately locate the region where brain activity occurs, which plays an important role in the study of brain function regions.
Non-invasive: fMRI is a non-invasive imaging technology that does not require intervention by means of surgery or inserting probes, and is more suitable for clinical and human studies.
Visualizing brain structure and functional connectivity: fMRI can provide detailed three-dimensional images of brain structure and reveal interactions between brain regions through functional connectivity analysis.
Low temporal resolution: The temporal resolution of fMRI is usually in the second level and does not capture rapid changes in brain activity.
High cost and complexity: fMRI equipment and operations are relatively expensive and complex, requiring highly trained and specialized operators.
Sensitivity to motion: fMRI is very sensitive to the subject’s head movements, that is, even small movements can lead to distortion of imaging results.
Table 3. The introductions of each time-frequency analysis techniques.
Time-frequency analysis technique Introduction
Short-Time Fourier Transform (STFT) The Short-Time Fourier Transform (STFT) is a time-frequency analysis technique used to analyze non-stationary signals. It provides a way to examine the frequency content of a signal over short and successive time intervals. The main idea behind STFT is to divide the signal into shorter segments called windows and then perform Fourier Transform on each window individually.
STFT uses a sliding window function to extract short sections of the signal, which are then transformed into the frequency domain using the Fourier Transform. By applying this transformation to overlapping windows of the signal, we obtain a time-frequency representation that reveals how the frequency content of the signal evolves over time. The resulting representation is often visualized as a spectrogram, which shows the varying intensity of different frequencies at different time points.
Wavelet Transform Wavelet Transform is another time-frequency analysis technique commonly used to analyze non-stationary signals. Unlike the STFT, which uses fixed-sized windows, the wavelet transform uses variable-sized windows called wavelets. These wavelets have different shapes and scales, allowing for a more flexible analysis of signal features at different resolutions.
Wavelet Transform decomposes a signal into a set of wavelet coefficients at different scales and positions. This decomposition allows us to capture both localized and global frequency information of the signal. Like STFT, Wavelet Transform can also produce a time-frequency representation, but it offers better localization in time and frequency compared to STFT.
Wavelet Transform is particularly useful in analyzing signals with transient or rapidly changing characteristics, as it can provide detailed information about the time-varying behavior of different frequency components.
Spectrogram Analysis Spectrogram analysis refers to the visualization of the time-frequency representation of a signal using techniques like the STFT or Wavelet Transform. A spectrogram provides a 2D representation of the signal’s frequency content over time, revealing how different frequencies contribute to the signal at different time points.
In practice, a spectrogram is obtained by calculating the magnitude or power of the frequency components obtained from the STFT or Wavelet Transform and displaying it as a function of time and frequency. The resulting image shows the intensity of different frequencies at different time intervals, allowing us to identify patterns, changes, and relationships between various frequency components in the signal.
Disclaimer/Publisher’s Note: The statements, opinions and data contained in all publications are solely those of the individual author(s) and contributor(s) and not of MDPI and/or the editor(s). MDPI and/or the editor(s) disclaim responsibility for any injury to people or property resulting from any ideas, methods, instructions or products referred to in the content.
Copyright: This open access article is published under a Creative Commons CC BY 4.0 license, which permit the free download, distribution, and reuse, provided that the author and preprint are cited in any reuse.
Prerpints.org logo

Preprints.org is a free preprint server supported by MDPI in Basel, Switzerland.

Subscribe

© 2024 MDPI (Basel, Switzerland) unless otherwise stated