Preprint
Article

Investigation and Improvement Strategies for Mold Fracture: A Study on the Application of a Double-Pulse Electrodeposition Method for Enhancing Mold Lifespan

Altmetrics

Downloads

93

Views

16

Comments

0

A peer-reviewed article of this preprint also exists.

This version is not peer-reviewed

Submitted:

23 October 2023

Posted:

24 October 2023

You are already at the latest version

Alerts
Abstract
We present an investigation on the fracture of a mold, comparing it with a normal part using specific techniques, such as EDX, SEM, and AES. The EDX analysis revealed that the composition of the normal part was consistent with that of low carbon steel, mainly comprising Fe and C. In contrast, the fractured part exhibited cracks due to nonconforming nonmetallic inclusions and reticular carbides, with fractures resulting from microporosity agglomeration and cleavage fracture. The SEM and AES analyses further presented the causes of mold fracture, highlighting the mechanism by which dimples on the specimen edge contributed to the fracture. The EDX analysis confirmed that the mold experienced thermal brittleness during use. To enhance mold durability and extend its lifespan, a double-pulse electrodeposition method was employed to create a NiCo alloy coating as a replacement for the Cr layer on the metal surface. The coating exhibited a smooth and scratch-free surface. The prepared NiCo special coating significantly increased the mold yield strength by approximately 313.8%, facilitated a 13% increase in plastic deformation, and reduced fracture strain by 25%, effectively preventing mold fracture and 3improving its service life.
Keywords: 
Subject: Chemistry and Materials Science  -   Surfaces, Coatings and Films

1. Introduction

Die-casting molds are crucial equipment for the die casting process, and their service life directly affects the cost of finished products. To improve performance and reduce costs associated with low-pressure castings, higher standards have been set for mold mechanical properties and service life [1,2,3]. Various factors impact mold service life, including sound die-cast part structure, innovative design of molds, ideal selection of materials, and advancement and rationality of the manufacturing process. Proper use and soundness of the casting process is necessary, which includes selecting the right equipment, alloys, and process parameters. The mold design must consider each stress condition to ensure that the mold meets large-scale production standards [4,5,6]. The tolerance fit and surface roughness of each active part should be adequately selected to avoid metal liquid penetration during initial operation and to prevent biting under normal working conditions. The design of the filling system, overflow system, and exhaust system should avoid the direct impact or flushing of metal liquid on the mold cavity or core. An effective exhaust guide groove from the overflow slot to the exhaust slot helps prevent blockage and maintain efficient exhaust passage [7,8].
To extend the service life of large mold cores, bolt fastening is more preferential than step fastening for easy replacement and convenient operation. The thermal balance of mold parts should be considered in the design, particularly for large and complex molds [9,10,11]. By rationally designing inlet, overflow, and exhaust systems and by utilizing hot oil type mold temperature control machines, mold service life can be significantly increased. The casting design should meet the die-casting process requirements as much as possible for parts with sharp corners or edges or that are prone to stress concentration. Parts that cannot be avoided should use embedding or splicing to simplify manufacturing, release early cracking and stress concentration, and facilitate maintenance and replacement. Die-cast parts should be suitable for the die-casting process while meeting use requirements. Uniform wall thickness and metal liquid flow should not produce heat concentration to accelerate mold thermal fatigue. Fillets should be increased to improve mold forming part stress conditions and avoid sharp edges, corners, and fractures [12,13]. An erosion zone should be left in the pouring port position to extend mold service life without affecting casting use requirements. Mold processing technology is constantly evolving but should retain traditional processing technologies and ensure that the surface of the formed part does not have residual machining or scratching marks [14,15,16]. Welding is sometimes necessary but requires attention to material consistency, cleanliness, preheating, insulation, and adequate removal of welding stress through heat treatment. Reasonable arrangements for heat treatment procedures in the mold manufacturing process directly impact mold service life [17,18,19,20].
Fracture is a severe defect in the die during use and can significantly impact its service life. Fracture damages the die structure, making it ineffective and unable to function correctly, which can cause the die to fail, necessitating repair or replacement [21,22,23]. This phenomenon can lead to additional costs and disrupt production planning and processes. Fracture can damage the die surface, causing scratches, cracks, and other forms of surface damage, which can impact the appearance of the final product and increase the difficulty of mold maintenance [24,25,26]. Additionally, fracture can modify the material properties of the mold, affecting its hardness, strength, toughness, and other characteristics, ultimately impacting its reliability and service life. For example, defects in the contour design of the mold can negatively affect its fatigue life, while holes or defects in the material can enlarge under stress and lead to premature failure. It is crucial to address fracture promptly by identifying the causes, using effective repair methods, and continuously monitoring and maintaining the mold to extend its service life and ensure high-quality products [27,28,29].

2. Materials and Methods

2.1. Detecting and analyzing the causes of mold fractures in parts

To detect and analyze the causes of mold fractures in parts, sampling was performed, and the chemical composition of the mold was measured using an energy-dispersive X-ray fluorescence spectrometer (EDX-XRF). The purpose of the detection was a qualitative and semiquantitative analysis of the elemental components in the sample. The detection method involved placing the sample in a sample cup and testing it using the EDX-XRF instrument, and the results were analyzed. The detection instrument used was a Shimadzu EDX-LE plus (ID: 61-0069-00002). The results obtained indicated that the content of each element was within the needed range, which could identify potential causes of mold fractures. Further analysis and testing could be required to determine the exact causes and provide appropriate solutions to prevent future mold fractures.
Based on the chemical composition measurements, it was likely that the type of steel used for the mold was low carbon steel, as it mainly comprised iron and carbon, with relatively low amounts of other alloying elements, such as chromium, cobalt, and nickel. In addition, from the macroscopic examination of the fracture surface shown in Figure 1, it could be observed that the mold fracture surface was bright and had a distinct metallic luster. The extended ridges with a radial center toward the mold center indicated that the crack source originated at the mold cavity, which rapidly expanded toward the center along the axial direction, resulting in a typical brittle fracture. Therefore, it could be concluded that the mode of mold cracking was a brittle cleavage fracture at the center. Further analysis and testing could be required to determine the exact causes of the mold fracture, including the factors that contributed to the formation of the crack source in the mold cavity and how it rapidly expanded. By identifying the specific causes, appropriate measures could be taken to prevent similar mold fractures in the future and extend the service life of the mold.
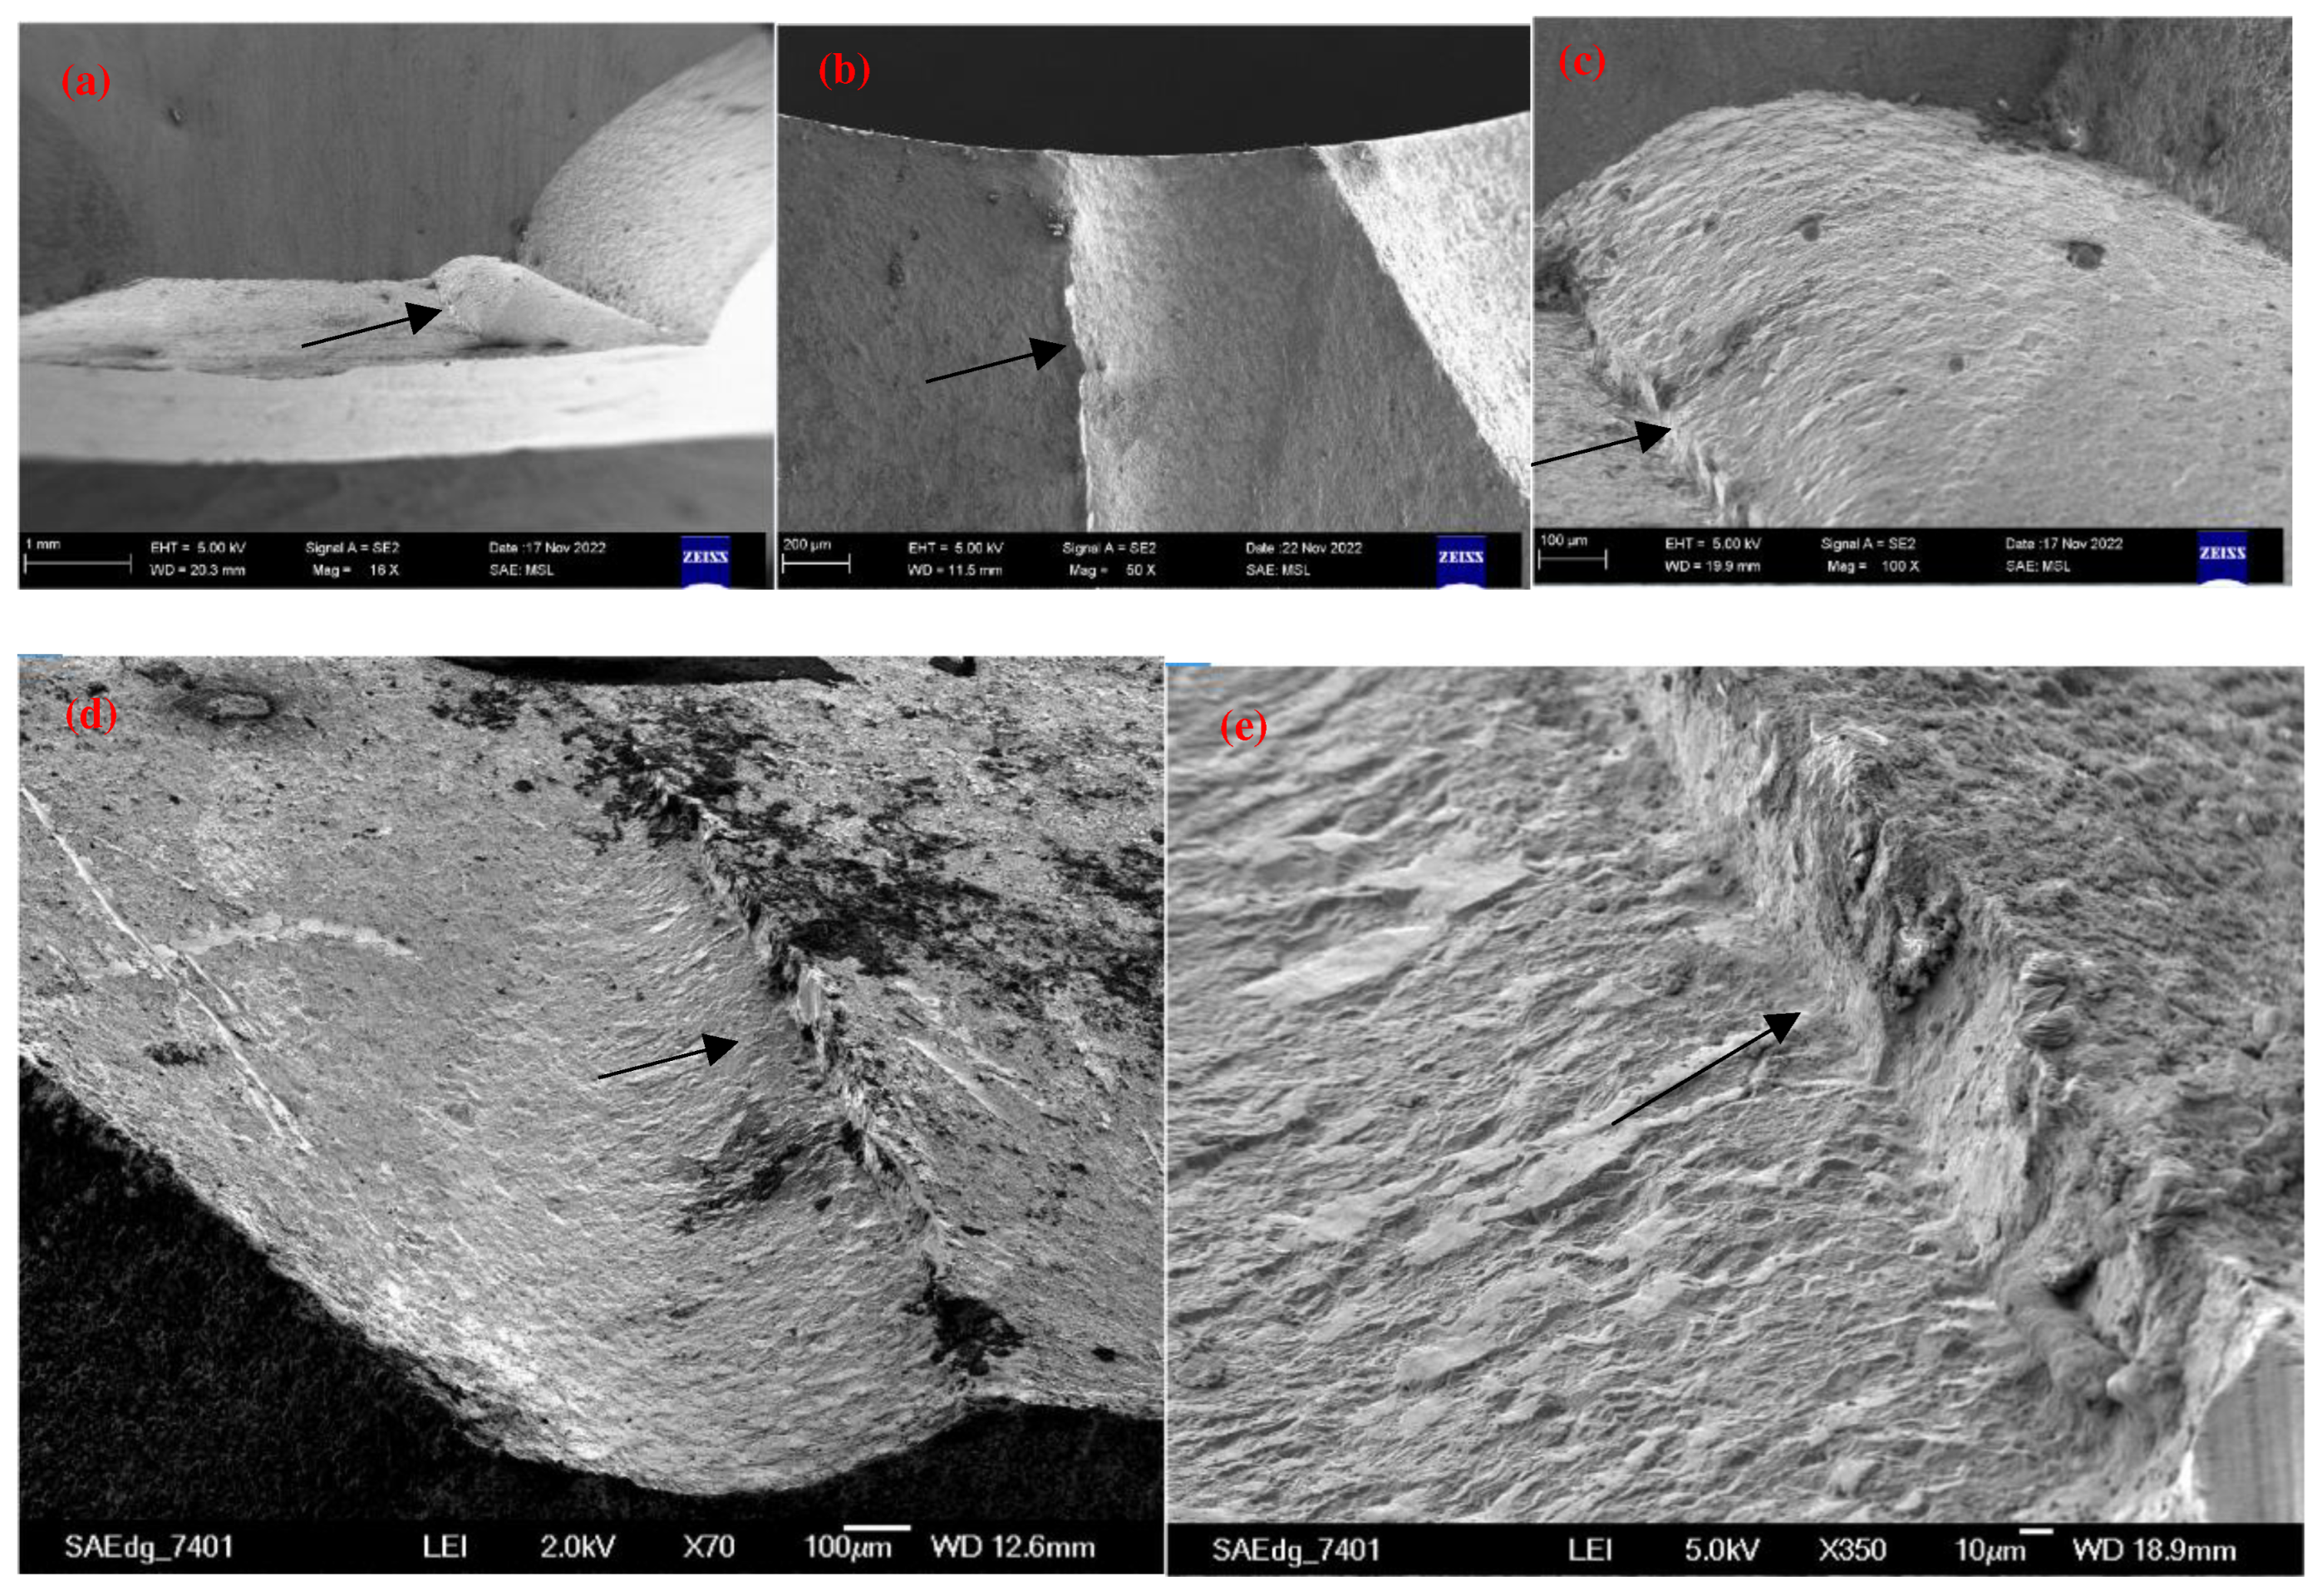
The fracture surface was microscopically inspected using SEM, and the morphology of the fracture was observed at different magnifications, as shown in Figure 2. The SEM images of the fracture surface were magnified at 16×, 50×, and 100×, and they clearly showed fracture steps, indicating intergranular cleavage fracture characteristics. At high magnifications, such as 100 μm and 10 μm in Figure 2(d) and (e), respectively, flat quasicleavage planes, micropores, and tear ridges were observed, indicating a fracture along the original grain boundaries.
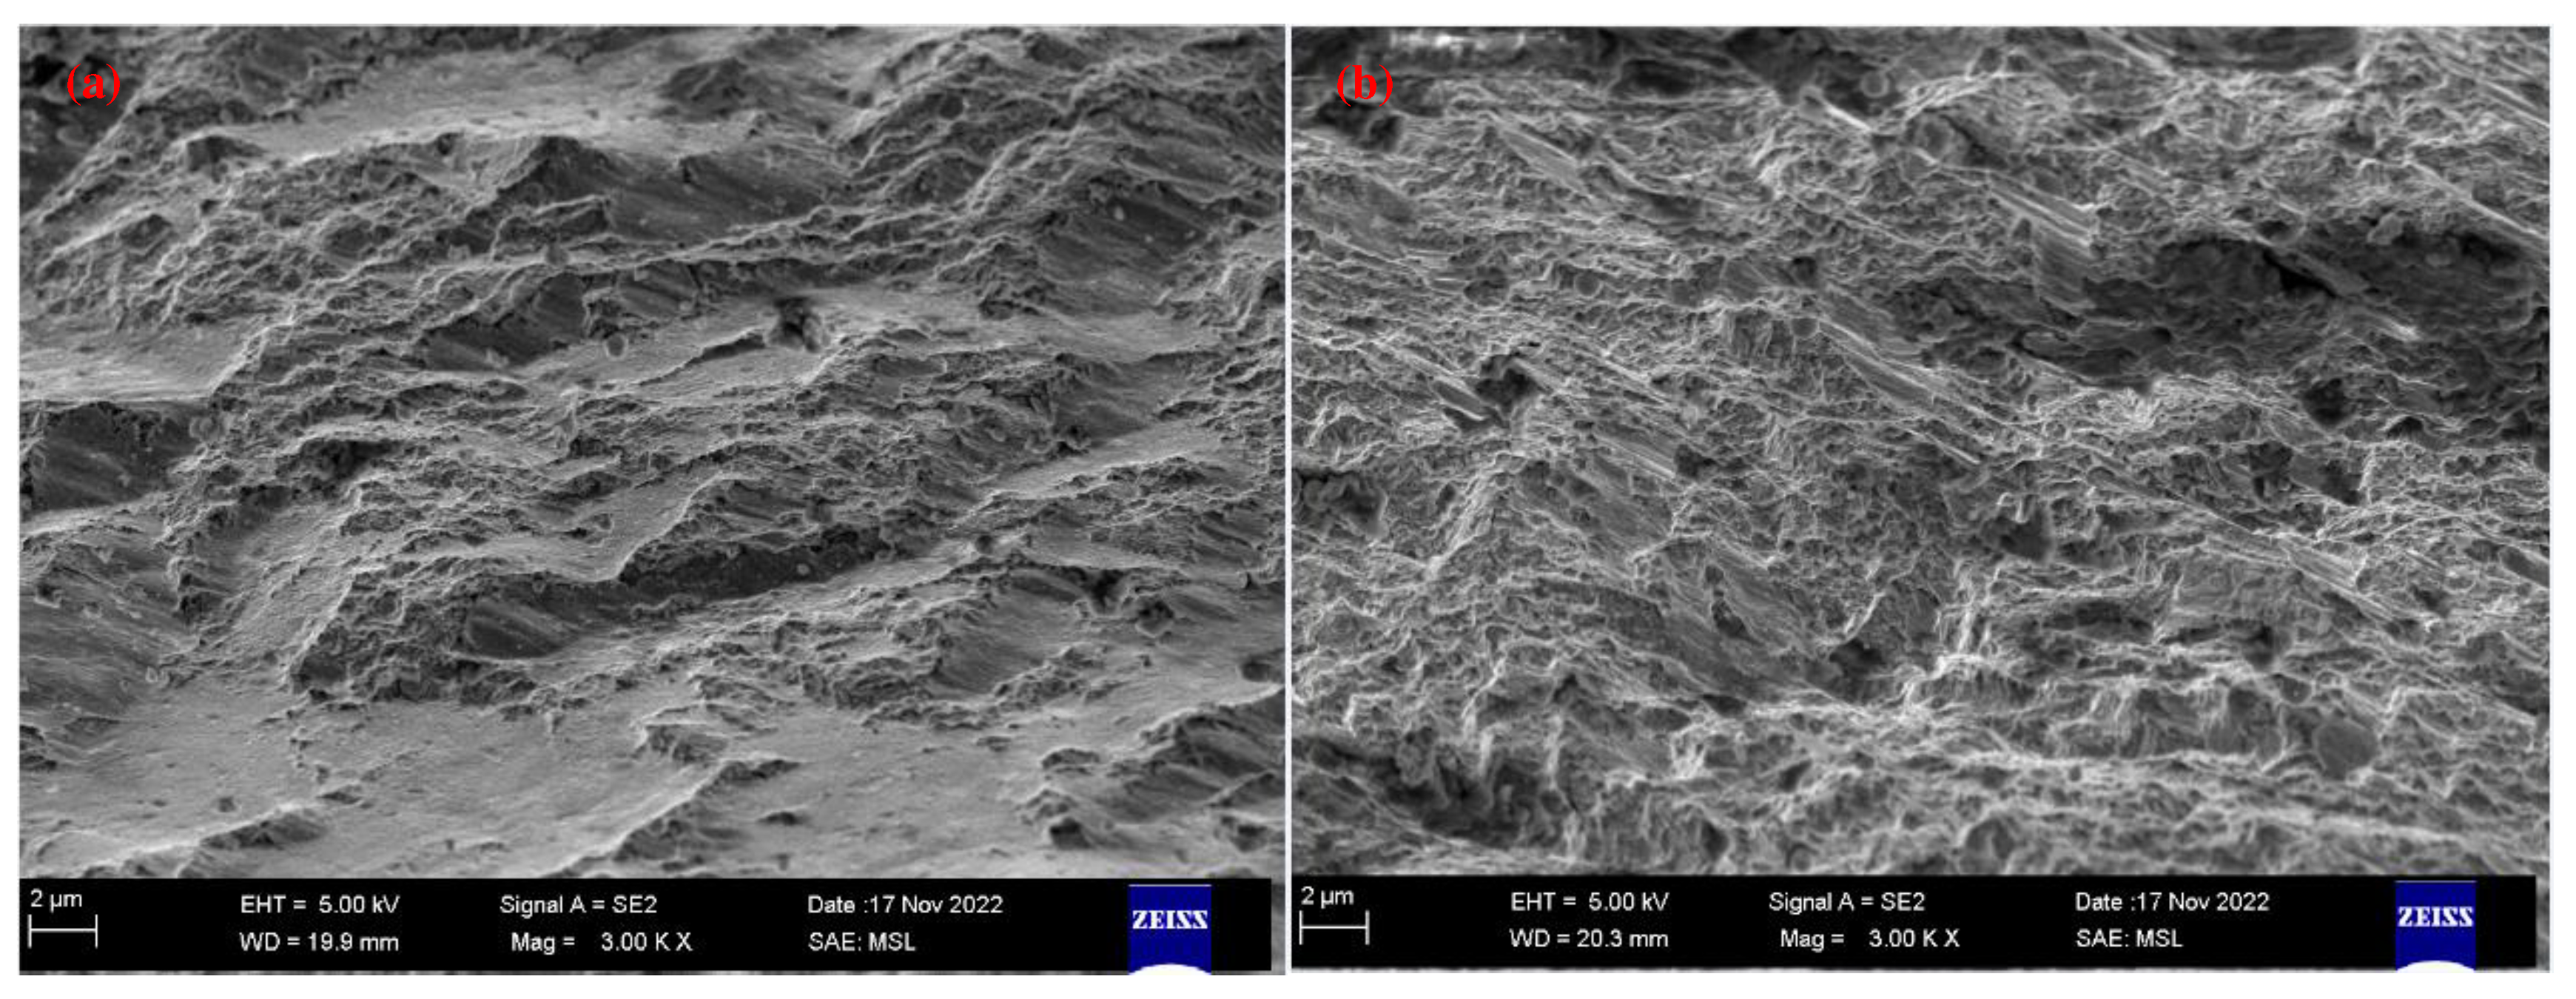
From the high-magnification observations in Figure 3, it was observed that the micromorphology along the grain boundary exhibited ductile dimples. However, local dimples contained additional nonmetallic inclusions and carbide particles, which had significant concentrations at the microscopic crack sites. This phenomenon corresponded to a quasicleavage fracture formed at the concentrations of nonmetallic inclusions and carbides. When comparing the fracture morphology in Figure 3(a) with the normal site shown in Figure 3(b), multiple microcracks were evident, as shown in Figure 3(a), which were distributed along the boundaries of the nonmetallic inclusions and carbide particles. This finding indicated that the fractures were caused by the lack of conformity of the nonmetallic inclusions and reticular carbides.
The fracture site in Figure 3(a) displays microporosity agglomeration and cleavage fracture. Microporosity agglomeration fracture [30,31] is a form of shear fracture, which is a common mode of material toughness fracture. The fracture surface was typically dark gray and fibrous, with numerous dimples distributed on the surface. The process of microporosity agglomeration fracture included micropore nucleation, growth, aggregation, and fracture.
According to the microporosity agglomeration fracture mechanism, the fracture was likely to have occurred at the interfaces between certain phases in the material, such as inclusions and second-phase particles, or at the grain boundaries, twinning regions, phase boundaries, and areas of significant dislocation accumulations under external force. These areas could have formed microcracks. The visible micropores were generated by the agglomeration of adjacent microcracks, and they grew, proliferated and eventually connected to produce the final fracture.
It is thought that the time of micropore nucleation is determined by the low bonding strength between the second-phase particles and matrix in the material [32,33] and that micropore nucleation typically occurs before necking. Micropore nucleation was considered the primary aspect in controlling the fracture process of martensitic aging steel.
The size and depth values of the dimples on the fracture surface of the martensitic aging steel depend on the quantity and distribution of the second-phase particles and the plastic deformation capability of the matrix. The small and shallow dimples on the fracture surface in Figure 3(a) suggest that the matrix has a strong work hardening ability [34]. These dimples may be generated due to the specimen loading at the edge, resulting in σmax not being uniformly distributed across the cross-section. The stress at the edge was very high, and the crack gradually increased from the surface to the inside, resembling the process of tearing two stuck papers from one end. Therefore, this phenomenon is known as a tensile tearing type of fracture. Notched or cracked samples often showed this type of fracture surface. The tensile tearing elongated dimple was small and shallow, and the cracks propagated quickly over a macroscopic scale, leading to brittle fracture. This result supported the previous conclusion that the fracture had both brittle and cleavage features.
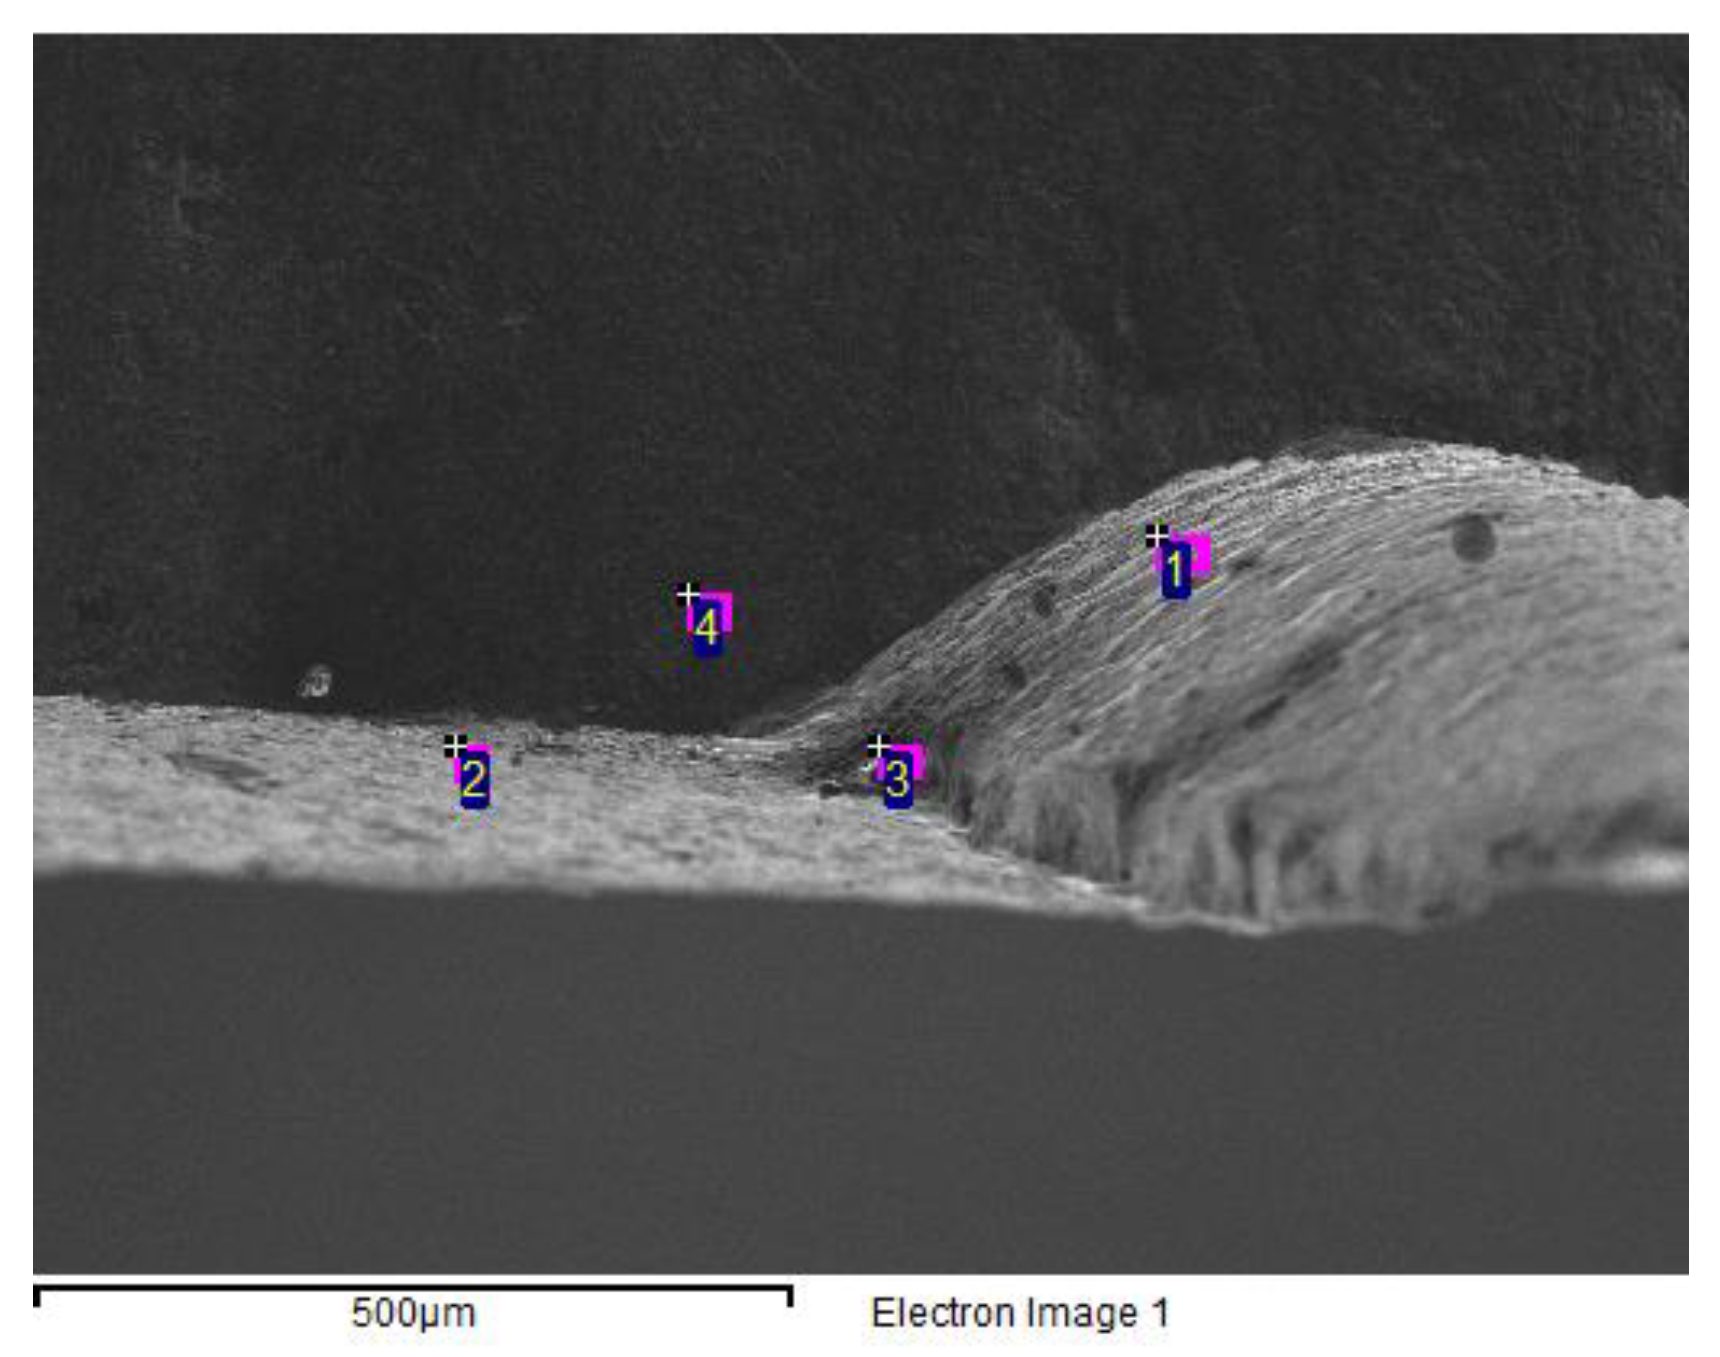
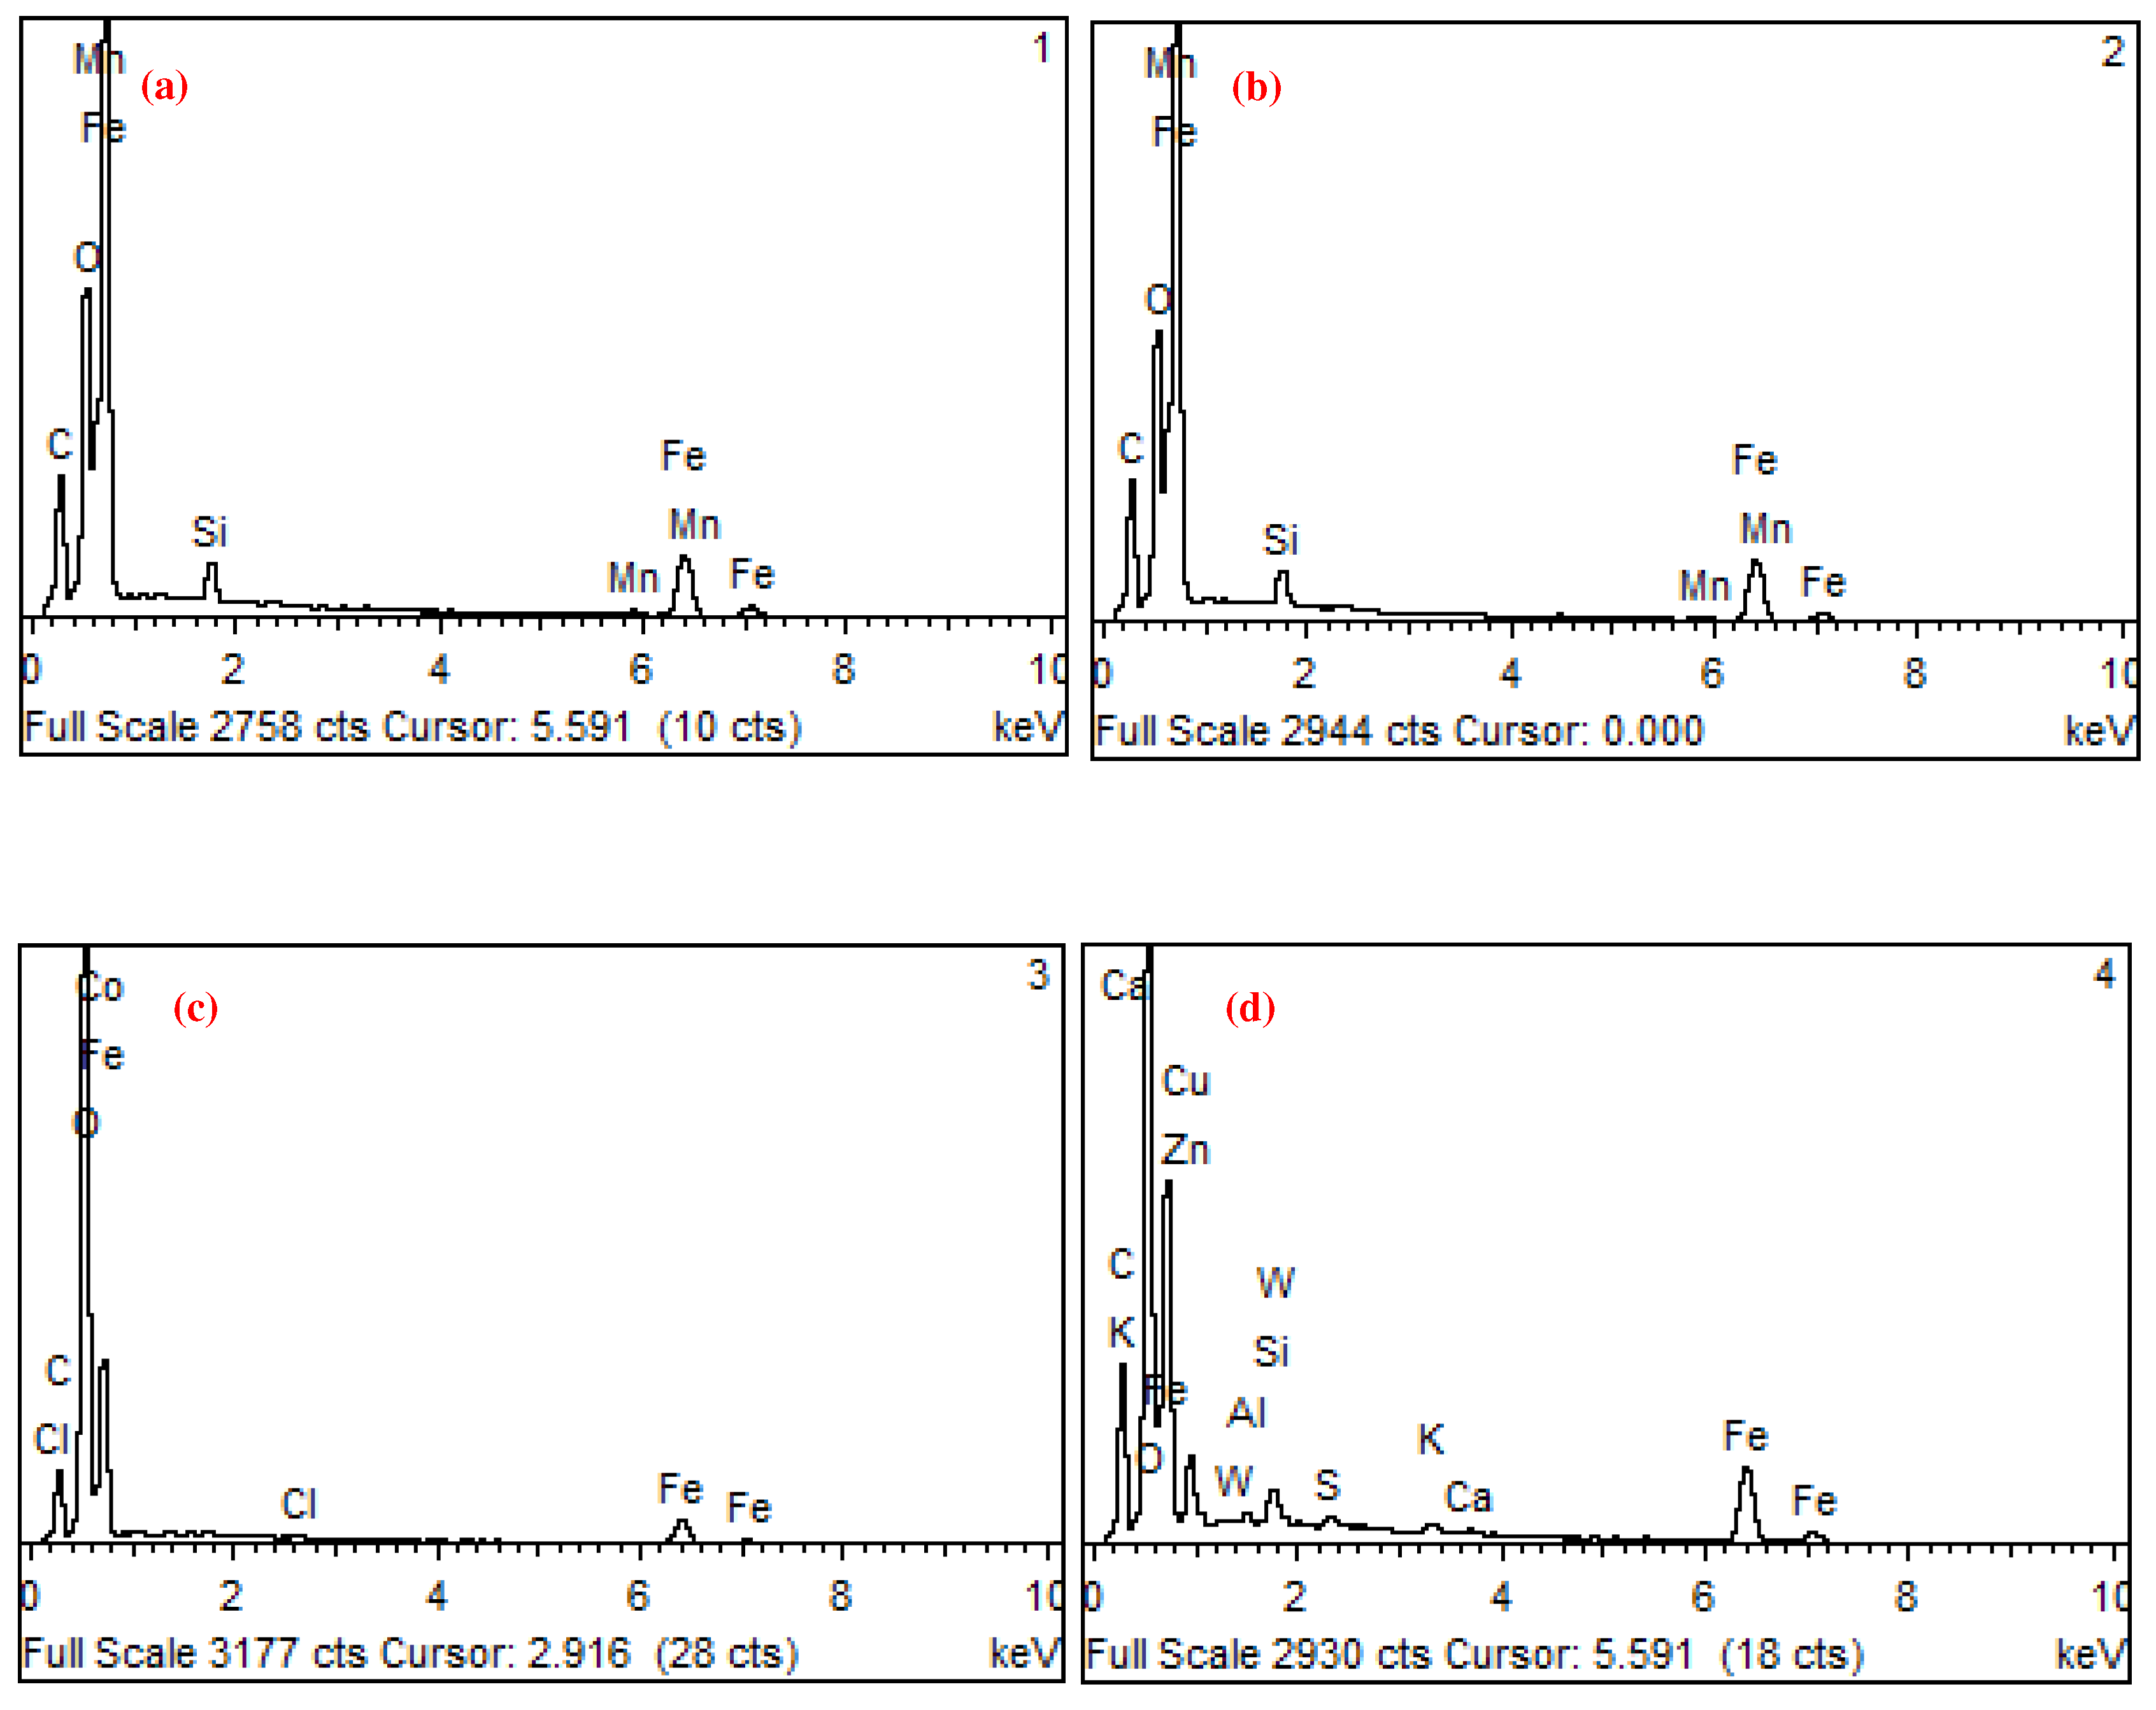
Four sampling locations were selected from the fracture surface and analyzed for their composition, as shown in Figure 4. Figure 5 presents the composition of the fracture surface and provides insights that are further detailed in Table 2, summarizing the results of the EDX test carried out on the fracture surface. The EDX test is a technique that enables the identification and quantification of the elemental composition of a sample based on the characteristic X-rays emitted by the sample under the bombardment of high-energy electrons or photons. Analyzing the results of the EDX test is useful for understanding the chemical composition of the fracture surface and identifying any anomalies with respect to the expected composition. This information, combined with other analyses, could provide a comprehensive understanding of the causes of mold fracture and reveal any corrective or preventive measures that are necessary.
The EDX test results presented in Table 2 indicate that oxygen was detected at all four sampling locations on the fracture surface, with the highest oxygen content being 32.6% at location 3. Since the oxygen content in low carbon steel is typically low, the high oxygen content detected on the fracture surface suggested that the steel surface underwent oxidation or had nonmetallic impurities, such as oxides or manganese oxides, during processing and usage. The mold fabrication, heat treatment, and material selection processes could all contribute to the changes in oxygen content. However, an overly high oxygen content could decrease the steel toughness and ultimately increase the risks of fracture and oxidation. Therefore, the high oxygen content on the fracture surface could have contributed to the fracture.
Manganese was detected at positions 1 and 2, while no relevant element was detected at positions 3 and 4. This result could suggest that the chemical compositions in these areas were not uniform and could have undergone varying heat treatments. Mn is a common alloying element in low carbon steel, improving steel hardness and toughness. However, if the concentration of manganese was too high, it could result in uneven steel strength and increase the susceptibility of these regions to fracture or other damage. These findings could indicate the presence of uneven steel distribution or improper treatment and could have contributed to the mold fracture.
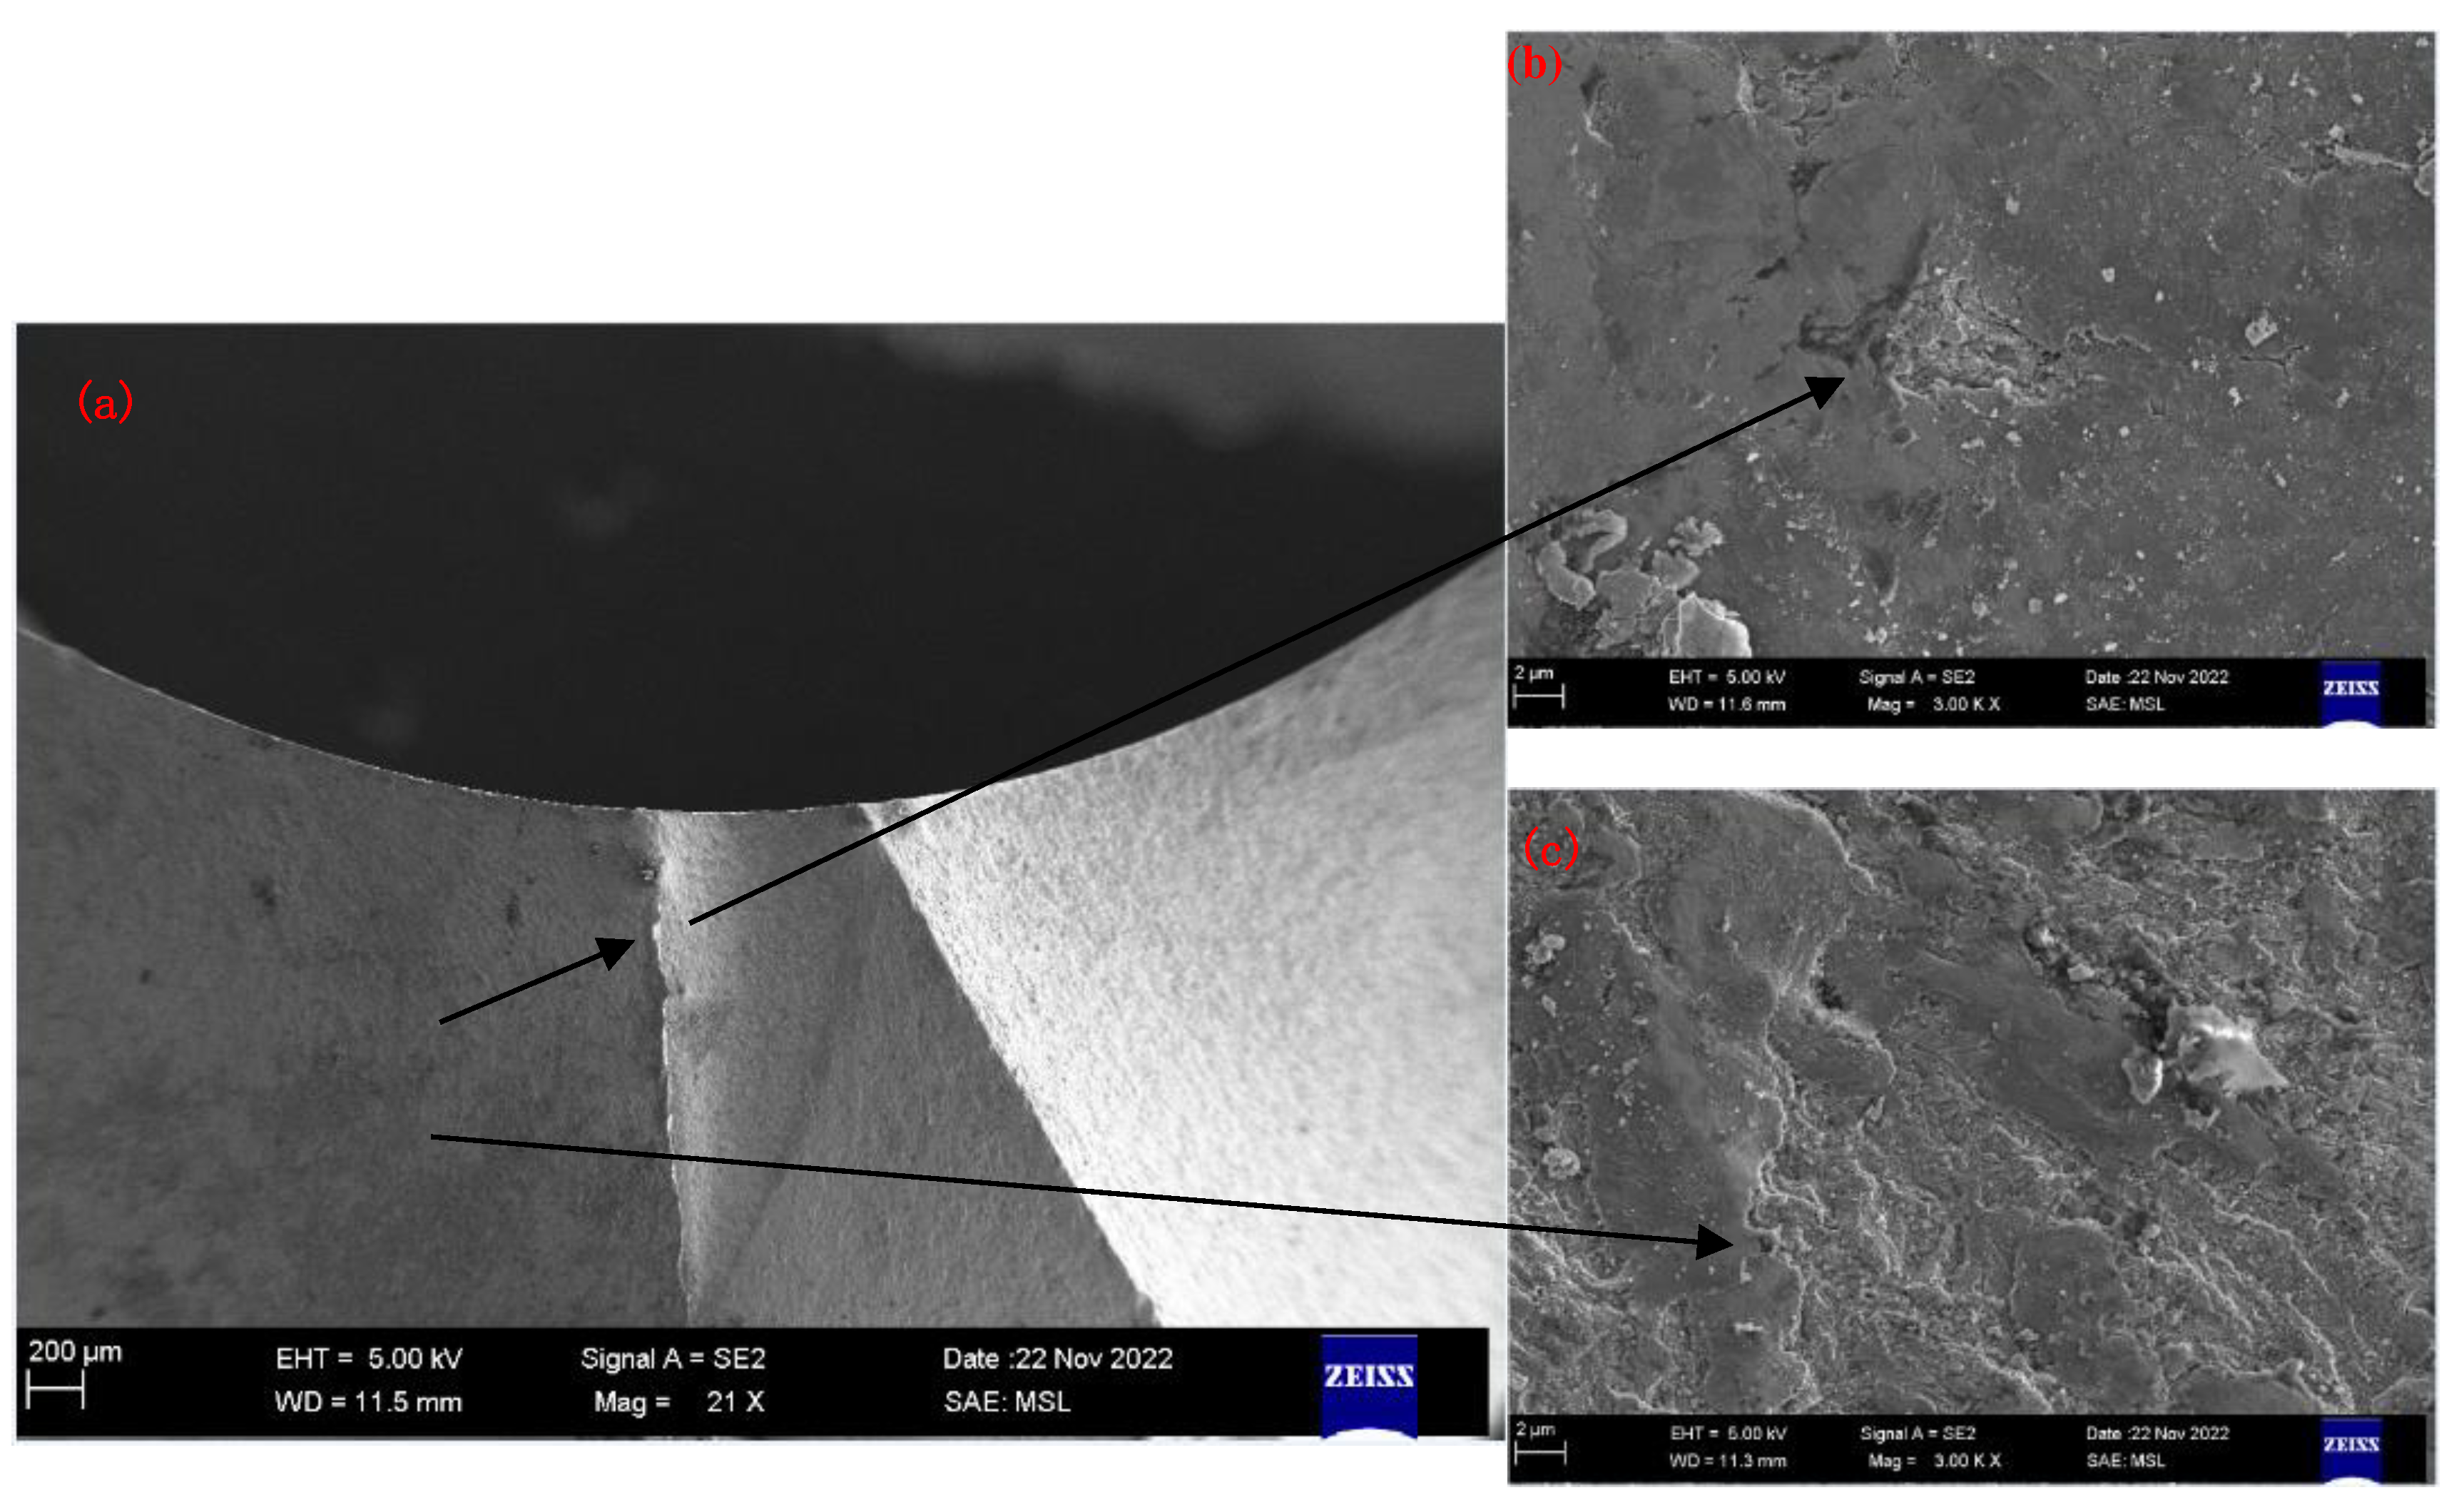
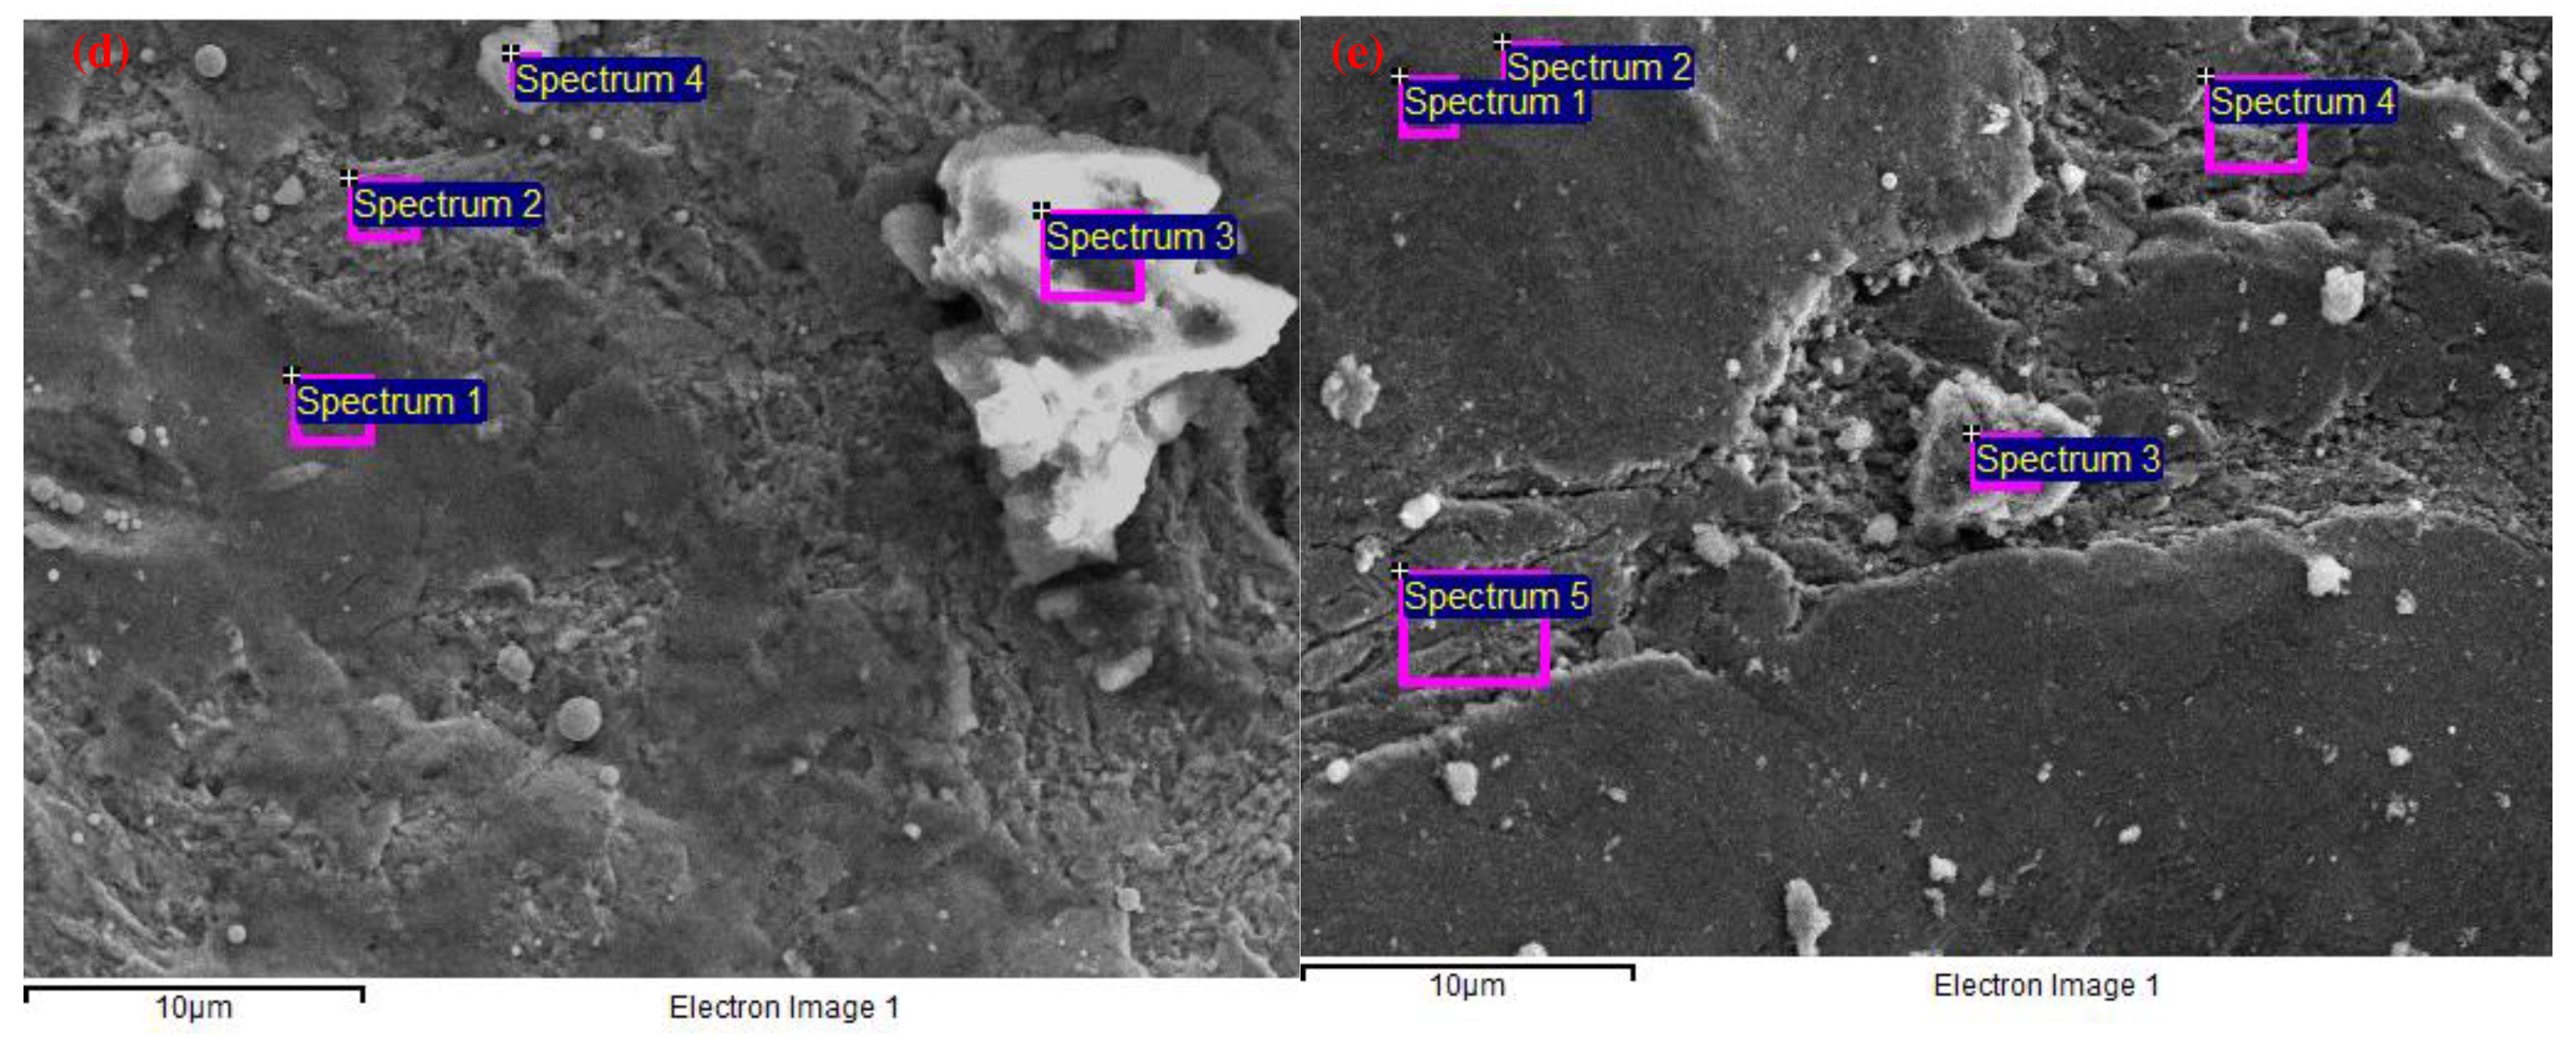
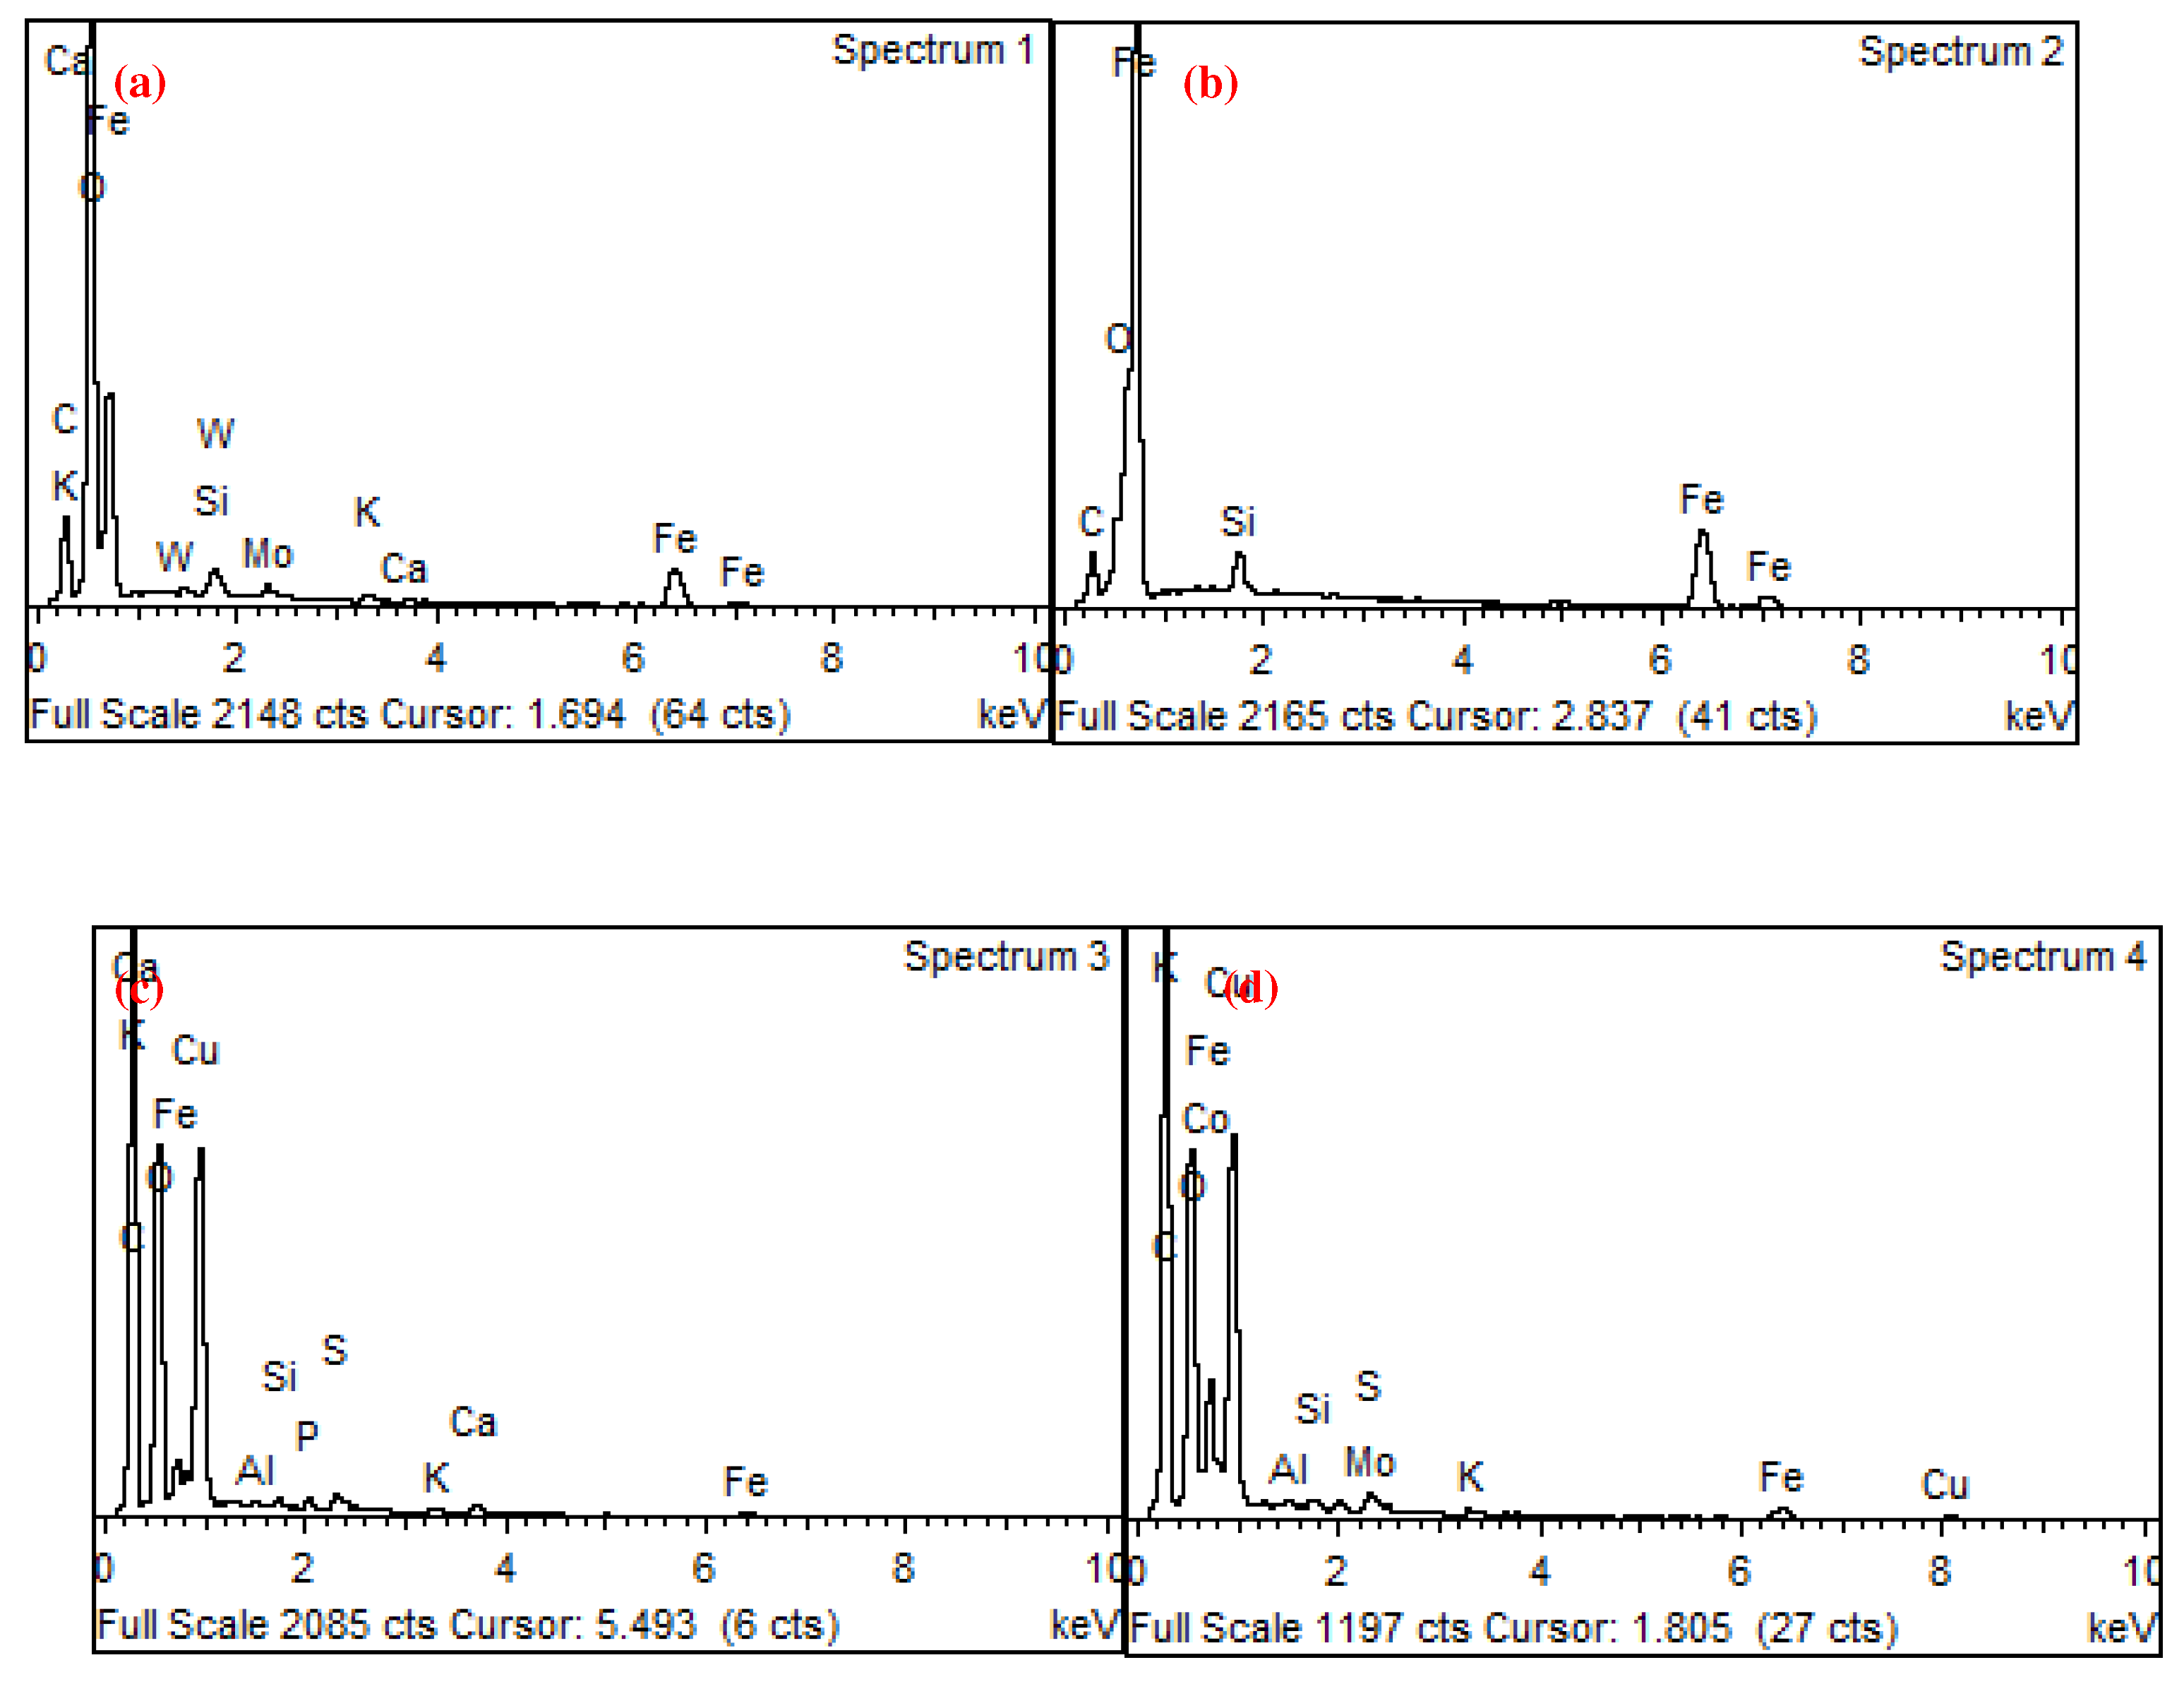
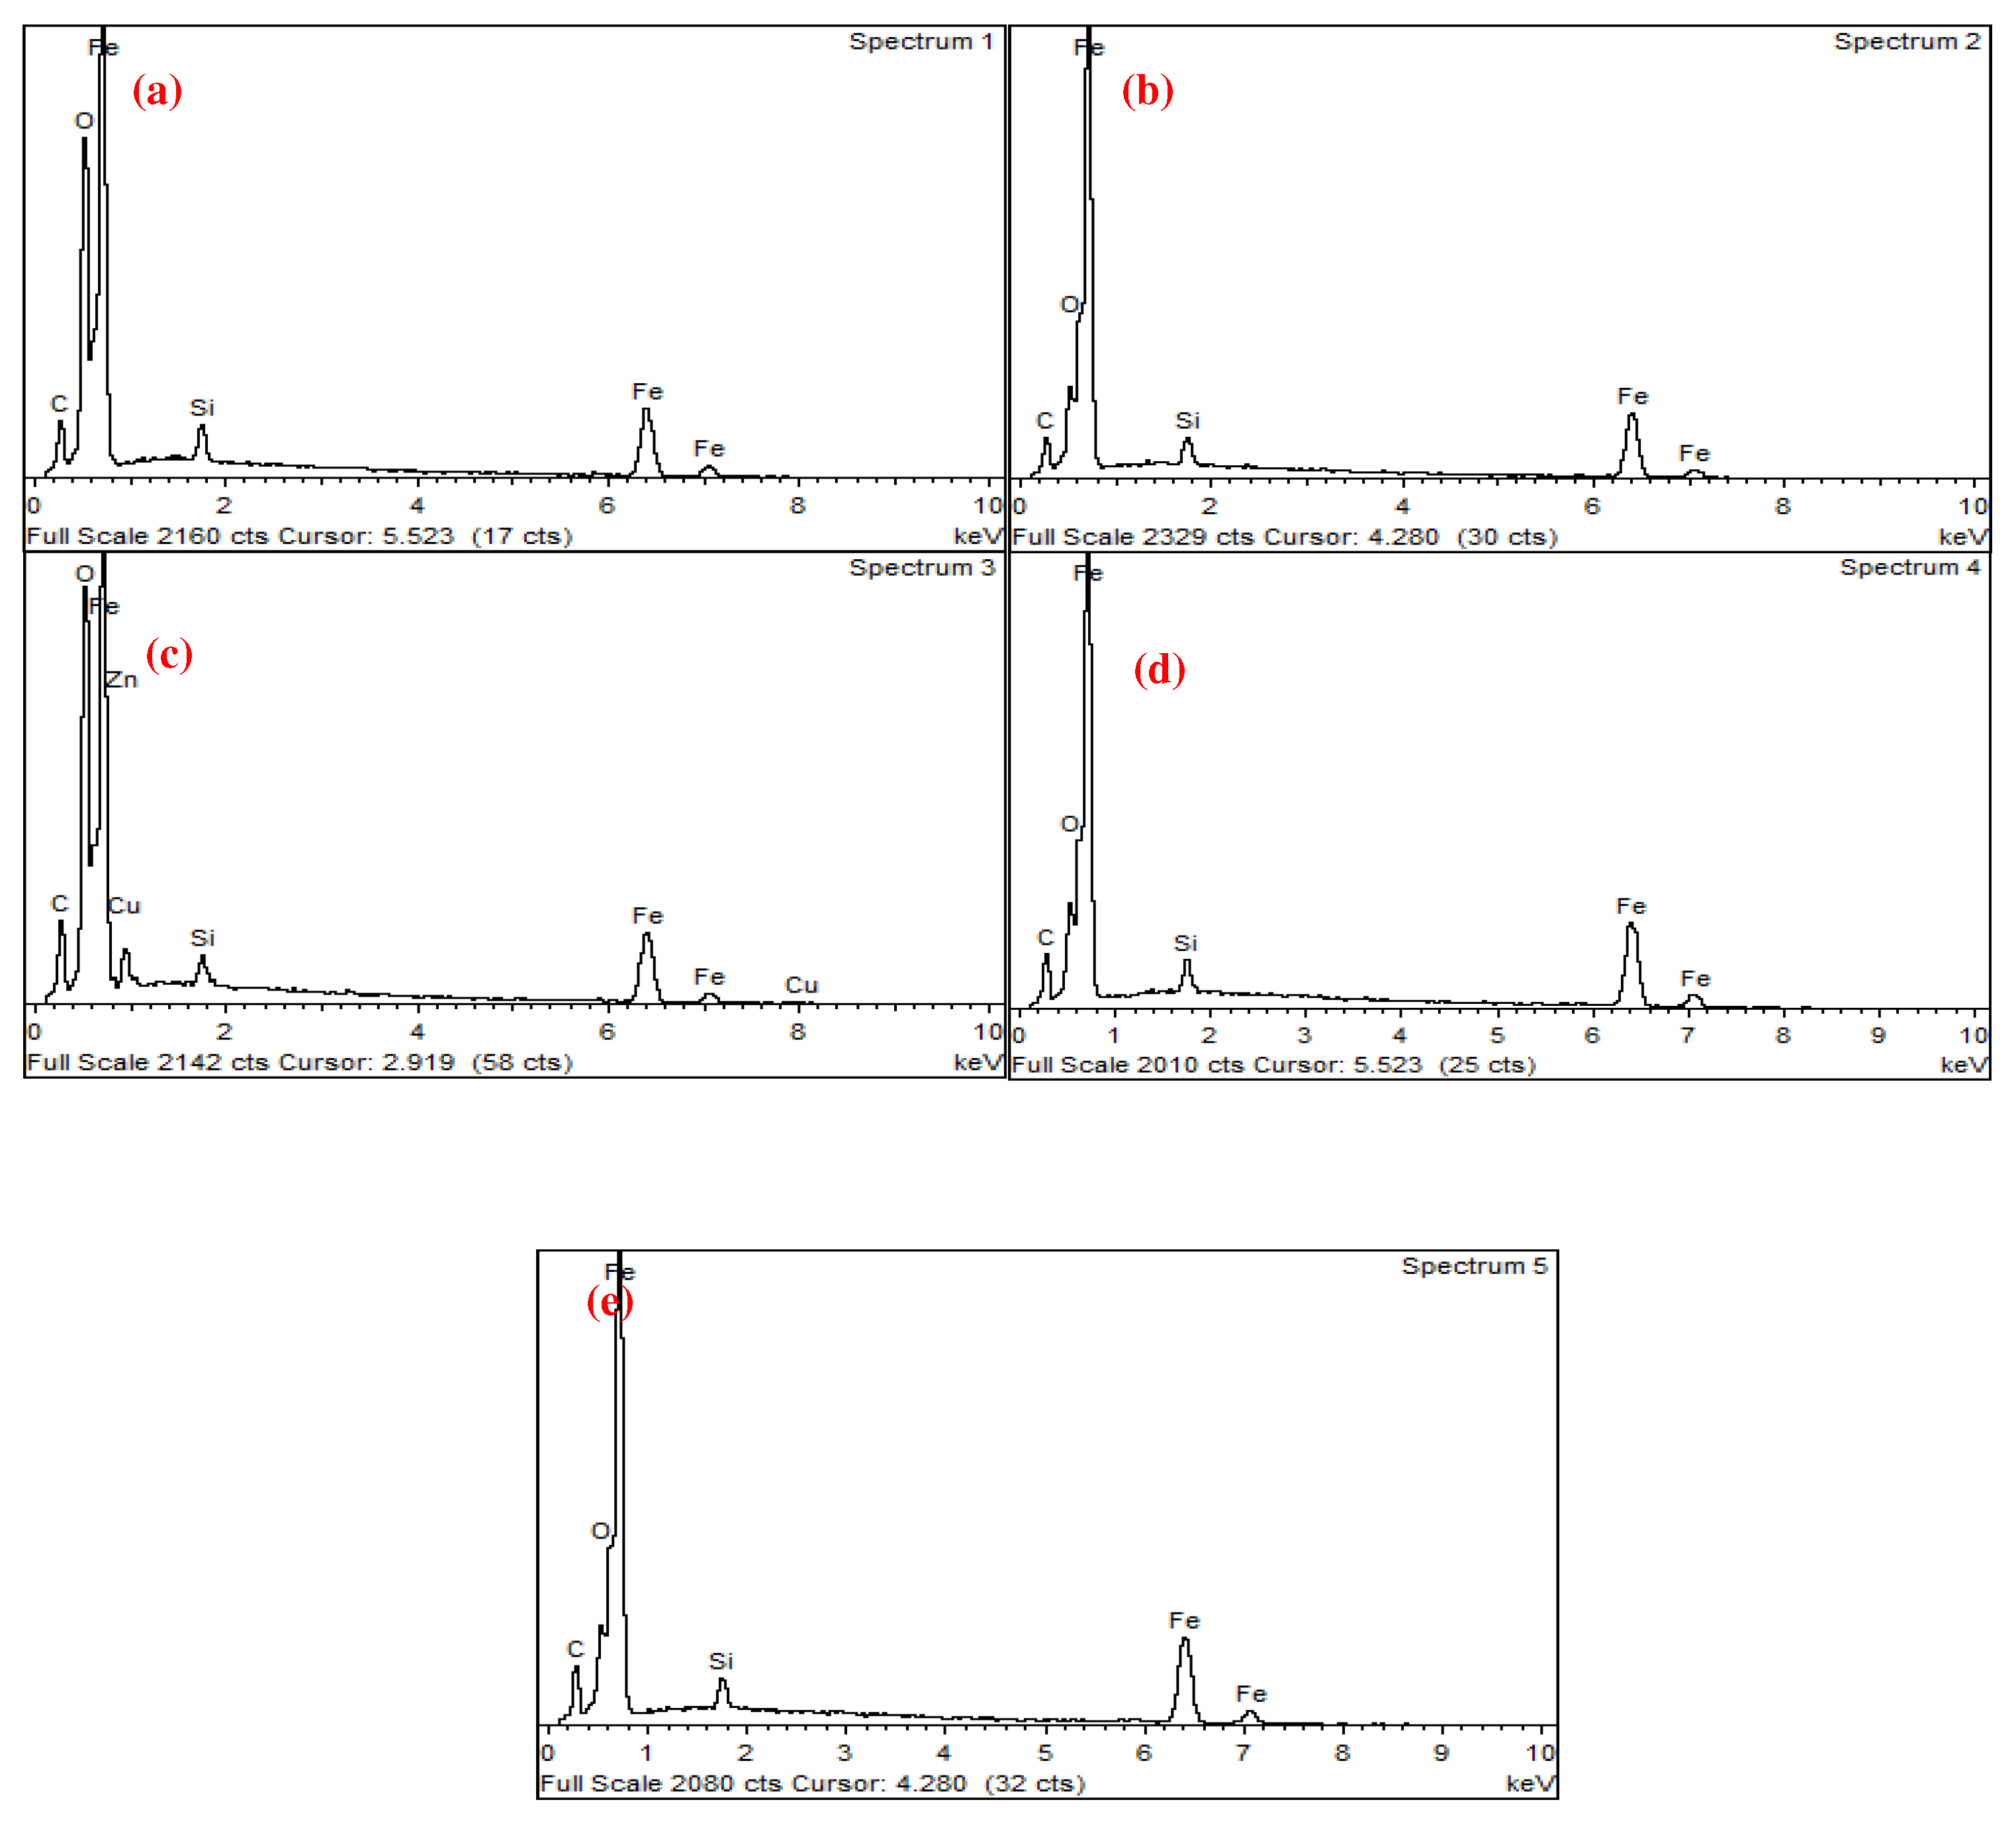
To compare the composition differences between the fracture and normal surfaces, samples were taken from both specimens for composition testing. Figure 6 (a) shows an SEM image that identified the locations corresponding to 6b,c. Four locations on the fracture surface were sampled for composition testing, as shown in Figure 6 (d), while five locations on the normal surface were sampled, as shown in Figure 6 (e). The EDX spectrum chart for the corresponding location of fracture sampling is shown in Figure 7, while the EDX spectrum chart for the corresponding location of normal sampling is shown in Figure 8. The EDX comparative test results are presented in Table 3 for the fracture samples and Table 4 for the normal samples. These results could enable a comparison of the elemental composition of the fracture surface and normal surface and could provide insights into the causes of mold fracture.
A comparison of the composition data obtained from the EDX analysis of the fracture and normal parts of the mold samples revealed that the normal part contained C, O, Si, Fe, Cu, and Zn, while the fracture part contained C, O, Al, Si, P, S, K, Ca, Fe, Co, Cu, Mo, and W. Interestingly, the percentage of Fe in the fracture part significantly decreased. This finding suggested that the mold underwent thermal brittleness during use. Thermal brittleness is a phenomenon causing materials to break easily at high temperatures. This characteristic is often associated with materials absorbing a large amount of oxygen or other impurity elements at high temperatures, leading to changes in the material internal structure that reduce its toughness and ductility.
Based on the comparison of composition data obtained from EDX analysis of fracture and normal parts of the mold sample, it was observed that the mold experienced thermal stress during use that resulted in serious fracture phenomena and a significant decrease in the content of elements such as Fe. The type of steel material used for the mold was Cu0.25Si1.21Mn0.86Cr0.07, which is a heavy-hardened steel, indicating that the possible presence of Cu led to thermal brittleness. The possible causes of mold fracture could be summarized as follows:
(1)
Material internal defects and stress concentration: The presence of different types and sizes of defects, such as inclusions, pores, slags, and internal cracks, could cause stress concentration and expand under stress, leading to brittle fracture. This type of stress concentration could cause brittle fracture of low-carbon steel molds.
(2)
Material quality issues: If the material had uneven quality or inclusions, it could decrease the strength and toughness of the steel, making it increasingly susceptible to fracture under stress. In addition, cracks and corrosion on the surface of the steel could be responsible for static load fracture.
(3)
Mold electroplating quality: The quality of the electroplating coating on the mold surface could lead to mold fracture issues. Possible electroplating issues included the following:
(a)
Uneven thickness of the electroplating coating, which could cause uneven stress distribution on the mold surface, leading to cracks or plastic deformation and affecting the dimensional accuracy and surface quality of the mold.
(b)
The problematic coating structure could affect the strength and toughness of the coating, making it prone to cracks and breakage during mold operation.
(c)
A high number of nonmetallic inclusions in the coating could affect the density of the coating and cause its toughness to decrease, leading to cracking or breakage.
(d)
The poor quality and surface roughness of the coating, which could attract small impurities, such as air and dust, further affecting its appearance and function. The presence of coating bubbles, delamination, or looseness could reduce the corrosion and protection functions, reducing the service life of the mold.
In summary, to avoid mold fractures, it was important to ensure that the material used for molds did not have internal defects or stress concentrations and to maintain even quality and surface finish. Proper quality control was crucial for electroplating coatings, ensuring even thickness, appropriate structure, low surface roughness, and the absence of nonmetallic inclusions.

2.2. Using a double-pulse electrodeposition method for preparing NiCo coatings

To optimize the electroplating qualities of metal surfaces, we implemented a new technique using a double-pulse power supply to replace the traditional Cr layer with a NiCo layer. This technique enhanced electroplating quality and improved mold durability while preventing problems such as fracture. Here, the mechanism by which the double-pulse power supply technique improved coating quality was determined:
  • Uniform coating: The double-pulse power supply ensured highly uniform electroplating deposition, avoiding the formation of thick films and stacking on the workpiece surface.
  • Dense coating: Positive and reverse pulses were used to deposit and redisperse ions in the plating solution. The double-pulse power supply generated additional reverse pulses, resulting in a uniform distribution of ions and a dense coating to prevent defects.
  • Reduced coating looseness and holes: The stability provided by the double-pulse power supply reduced the probability of defects, such as loose coatings and holes.
  • Reduced environmental impact: By reducing the amount of electrolyte needed, the double-pulse power supply minimized the losses of metal ions into sewage and its impact on the environment.
For the experiment, we used the Handan Dashun Plating Equipment Co., Ltd. SMD-500 CNC double-pulse plating power supply. The parameters were set as follows: current density at 1.5 A, Ton at 0.2 ms, Toff at 0.8 ms, and a total electroplating time of 30 minutes.
To prepare the electroplating solution, we added the following components to a beaker containing 50 mL of deionized water: 30.0003 g NiSO4·7H2O, 25.0002 g NiCl·6H2O, 18.0003 g cobalt sulfate heptahydrate, 20.0002 g H3BO3, 0.2503 g sodium dodecyl sulfate, 0.0402 g 1,4-butenediol, and 1.5001 g saccharin. The mixture was heated and stirred in a constant-temperature water bath at 60 °C until all the solutes dissolved. Then, 450 mL of deionized water was added, and the electroplating solution was electrolyzed at a current density of 0.5 A/dm2 to remove impurities. Finally, the pH was adjusted to 3 by adding a 10% sodium hydroxide solution.

3. Results and Discussion

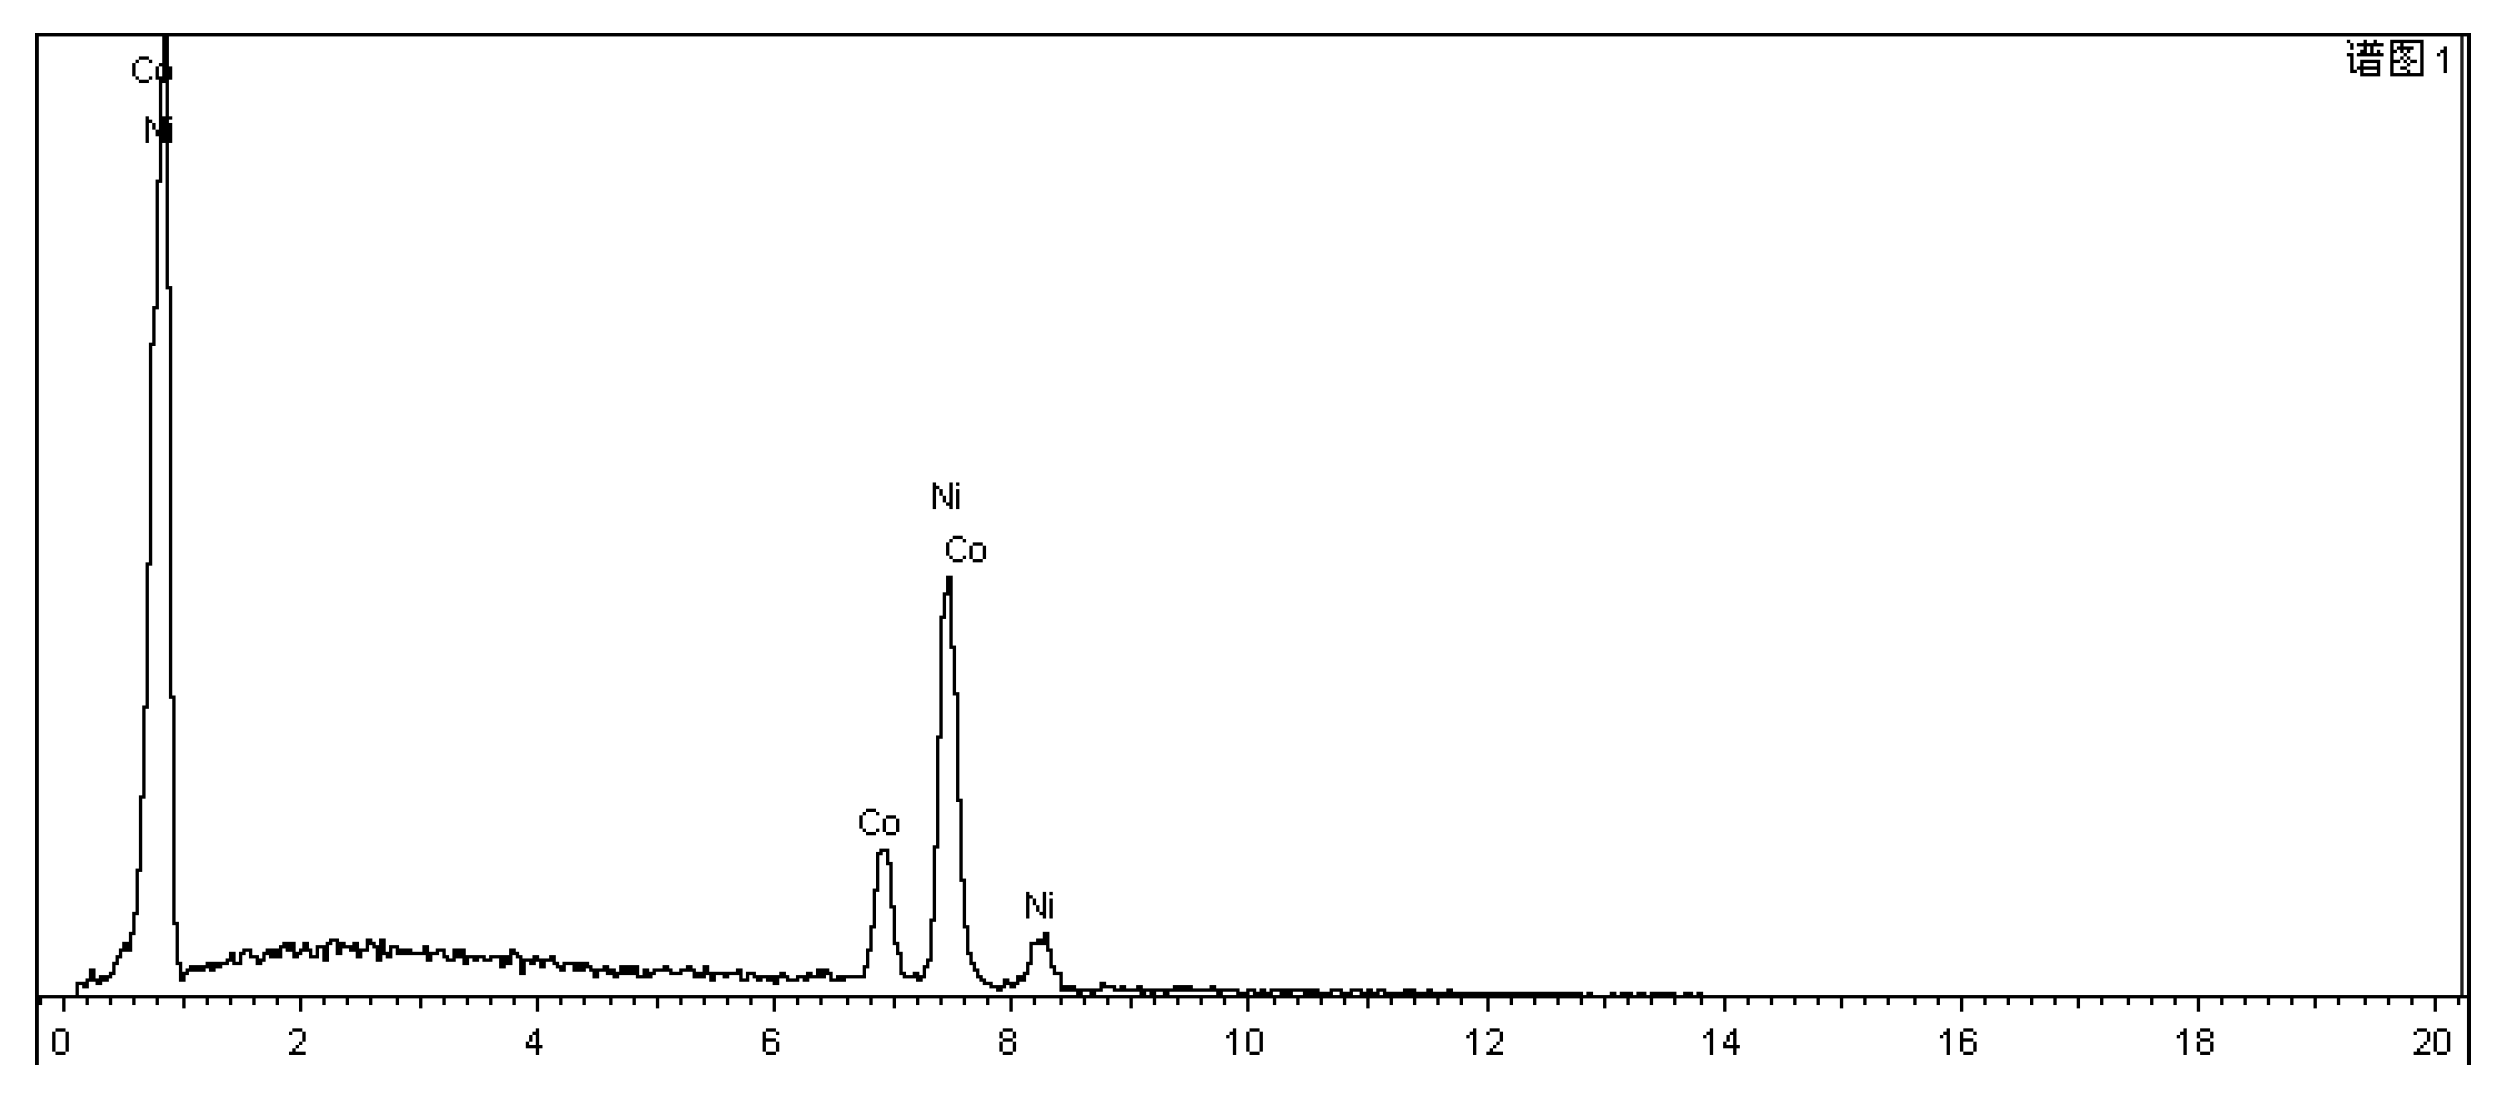
The SEM images of the special NiCo composite coating are presented in Figure 9, with images at 10 μm, 1 μm, and 100 nm scales shown in (a), (b), and (c), respectively. The morphology, roughness, and surface structure of the sample can be observed in Figure 9 (a) at the 10 μm scale, and the surface is found to be very smooth without scratches. Clear details of the coating crystal structure, texture, pores, and spots can be observed in Figure 9 (b) at the 1-μm scale. Details of the morphologies, features, and compositions at the 100-nm scale can be observed in Figure 9 (c). Furthermore, the EDX spectrum chart for the NiCo coating is shown in Figure 10. The results indicate that the coating comprises approximately 77% Ni and 23% Co.
These results demonstrate that the double-pulse power supply technique used in this experiment leads to the formation of a uniform and dense NiCo composite coating, which is smooth and without defects. The use of this technique enables the control of coating quality and helps to avoid problems such as loose coatings and holes. The EDX results indicate that the composition of the coating is well within the expected range, indicating the effectiveness of the electroplating process.
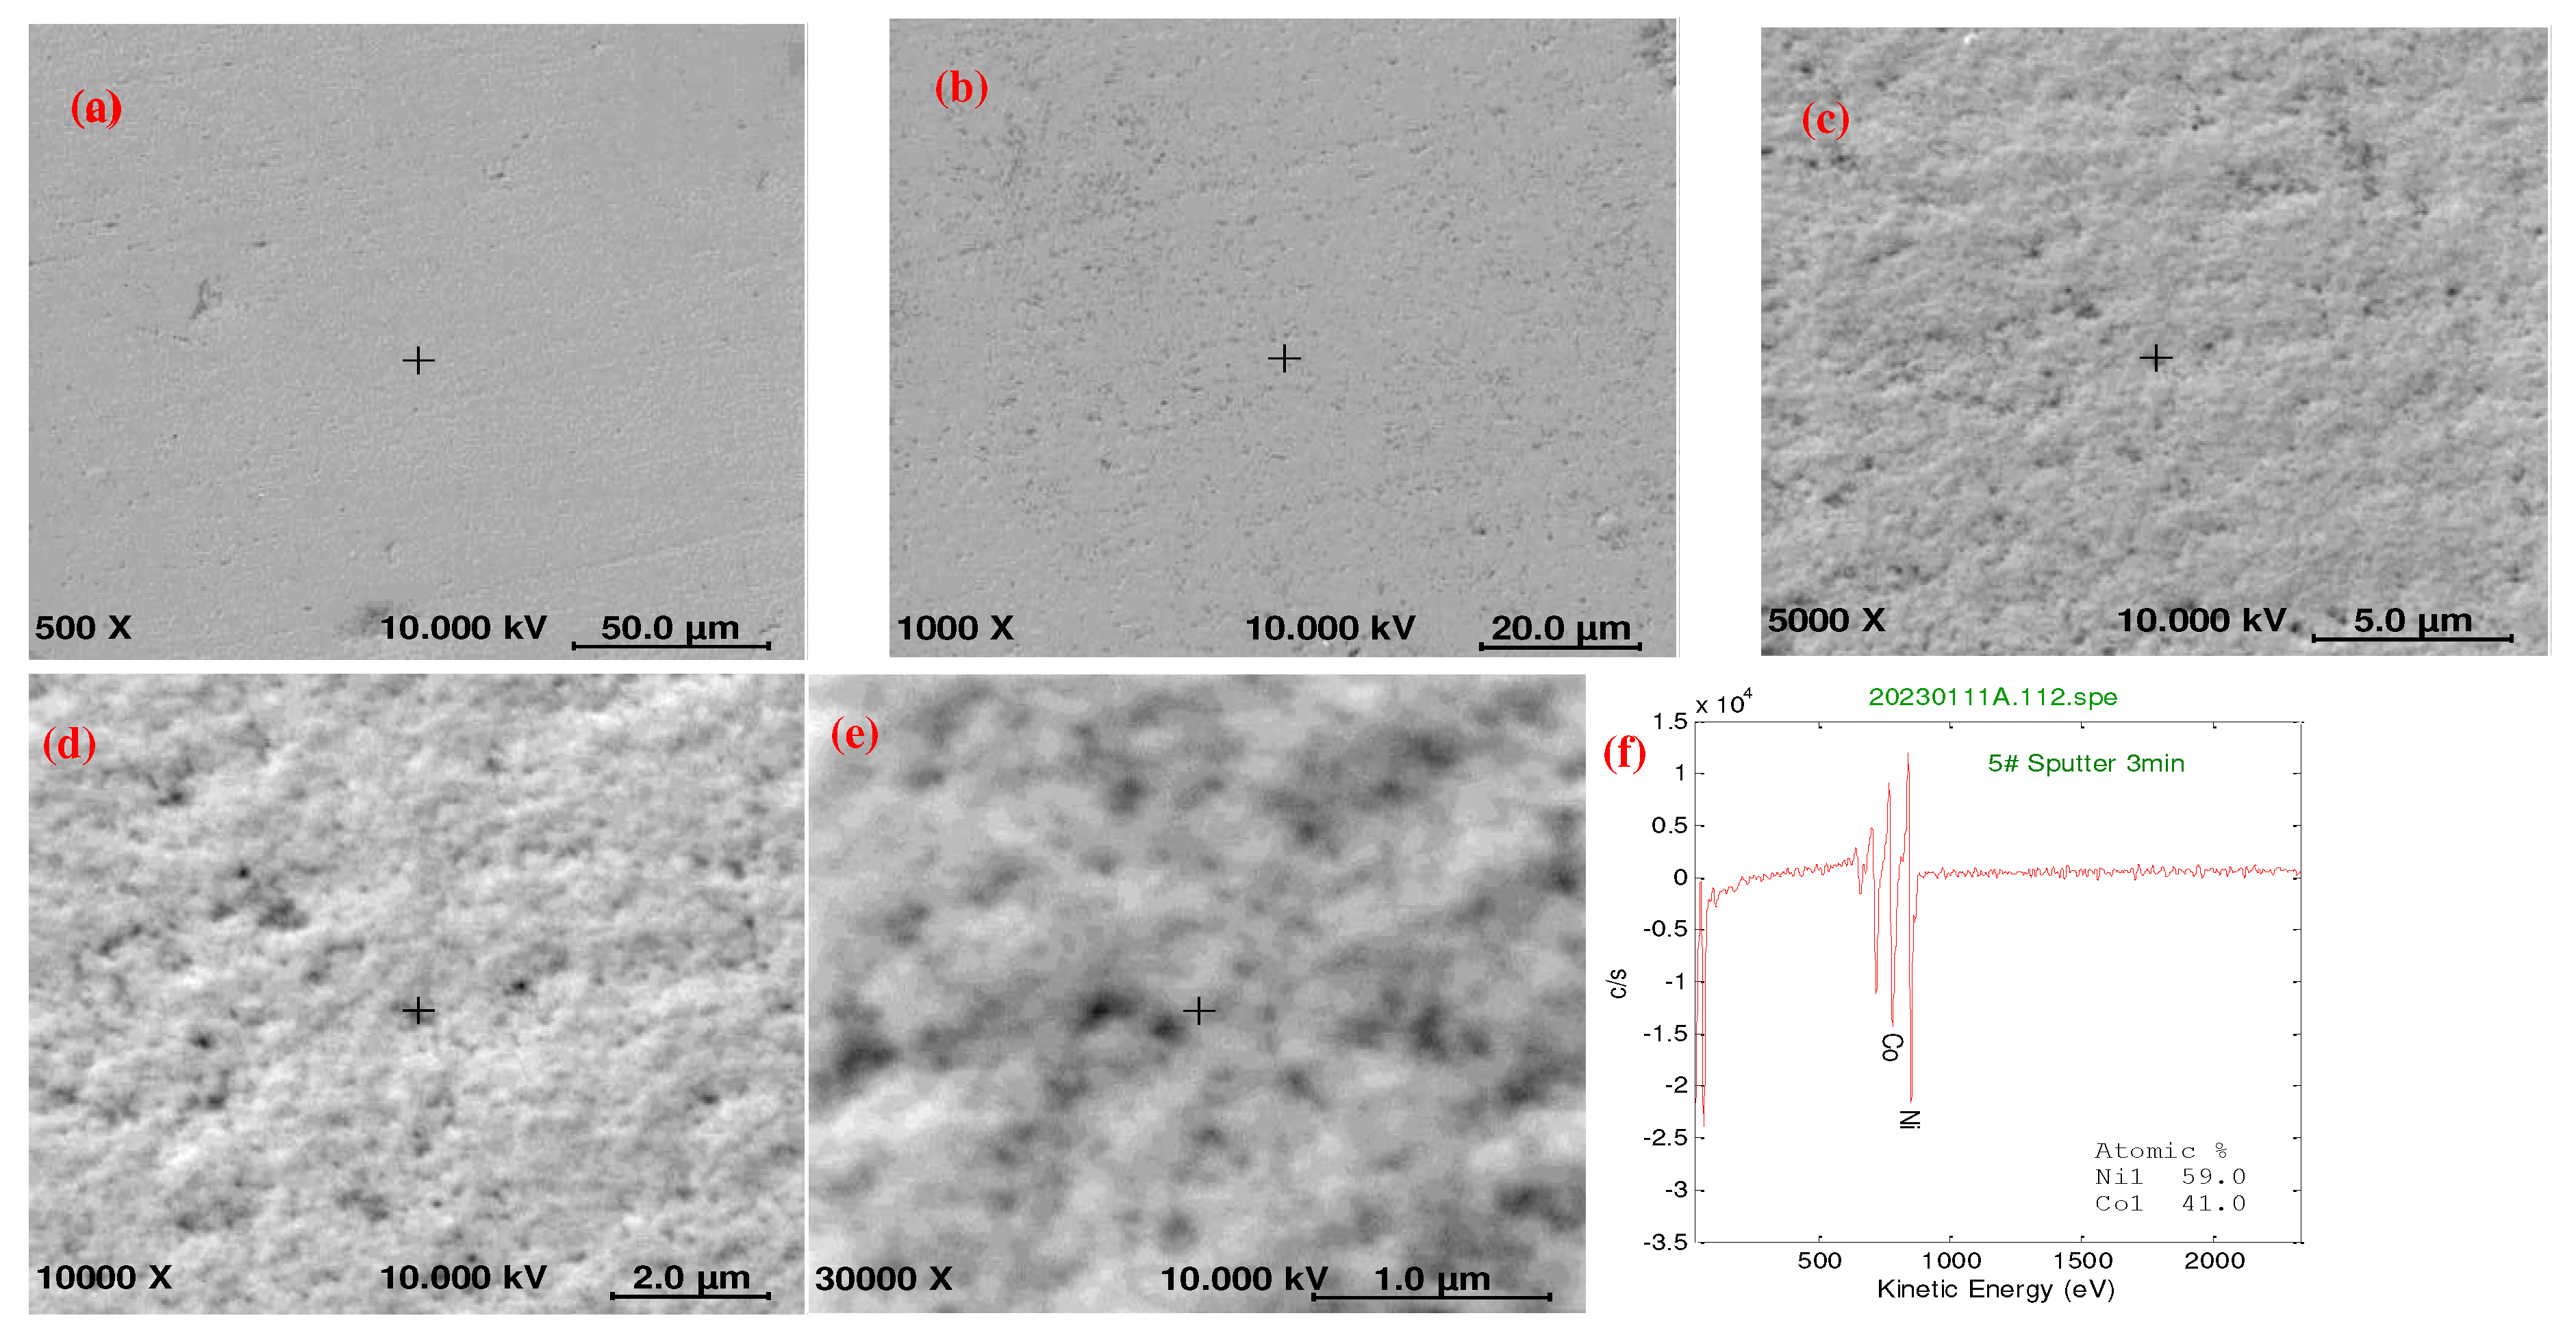
To obtain detailed information about the coating composition, orientation, crystal structure, and surface chemical composition, we perform an AES test. The testing conditions are listed below: instrument signal of PHI 710 AES; electron gun electron beam voltage of 10 kV; and electron beam current of 10 nA. AES testing allows us to determine the elemental composition and surface chemical composition of the coating with a high accuracy and sensitivity. By analyzing the energy levels of the emitted electrons, we can obtain information about the orientation and crystal structure of the coating. The results of the AES test can provide additional insights into the structure and composition of the NiCo composite coating that can complement the SEM and EDX analyses.
The results of the SEM test are shown in Figure 11, with images captured at various magnifications to reveal different features of the coating. At low magnifications, as shown in Figure 11 (a) (500×) and (b) (1000×), the approximate morphology an surface features of the coating and the roughness of the sample surface can be observed. The coating surface is found to be smooth and flat without scratches. At medium magnifications, as shown in Figure 11 (c) (5000×) and (d) (10000×), the coating surface can be observed to be smooth with good density, and the details of the coating surface morphology can be observed clearly. In addition, microfeatures such as surface defects and particles can be detected. At high magnifications, as shown in Figure 11 (d) (10000×) and (e) (30000×), detailed information about the distributions of coating composition and features can be observed. The results confirm that the use of the double-pulse power supply technique significantly reduces the looseness and holes in the coating. Particular attention is drawn to Figure 11 (e), which magnifies the element distribution and interface structure by 10000 times. The results show that the NiCo composite coating is uniform, and the elemental distribution is highly symmetric. The element mapping indicates that the Ni and Co elements in the coating are evenly distributed, with no significant concentration in any specific area. The analysis suggests that the electroplating process is successful in producing a uniform, dense, and stable NiCo composite coating with good adherence to the metal surface.
The AES test result of Figure 11 (f) provides additional insights into the structure and composition of the NiCo composite coating, and it confirms the effectiveness of the double-pulse power supply technique in achieving the desired electroplating quality.
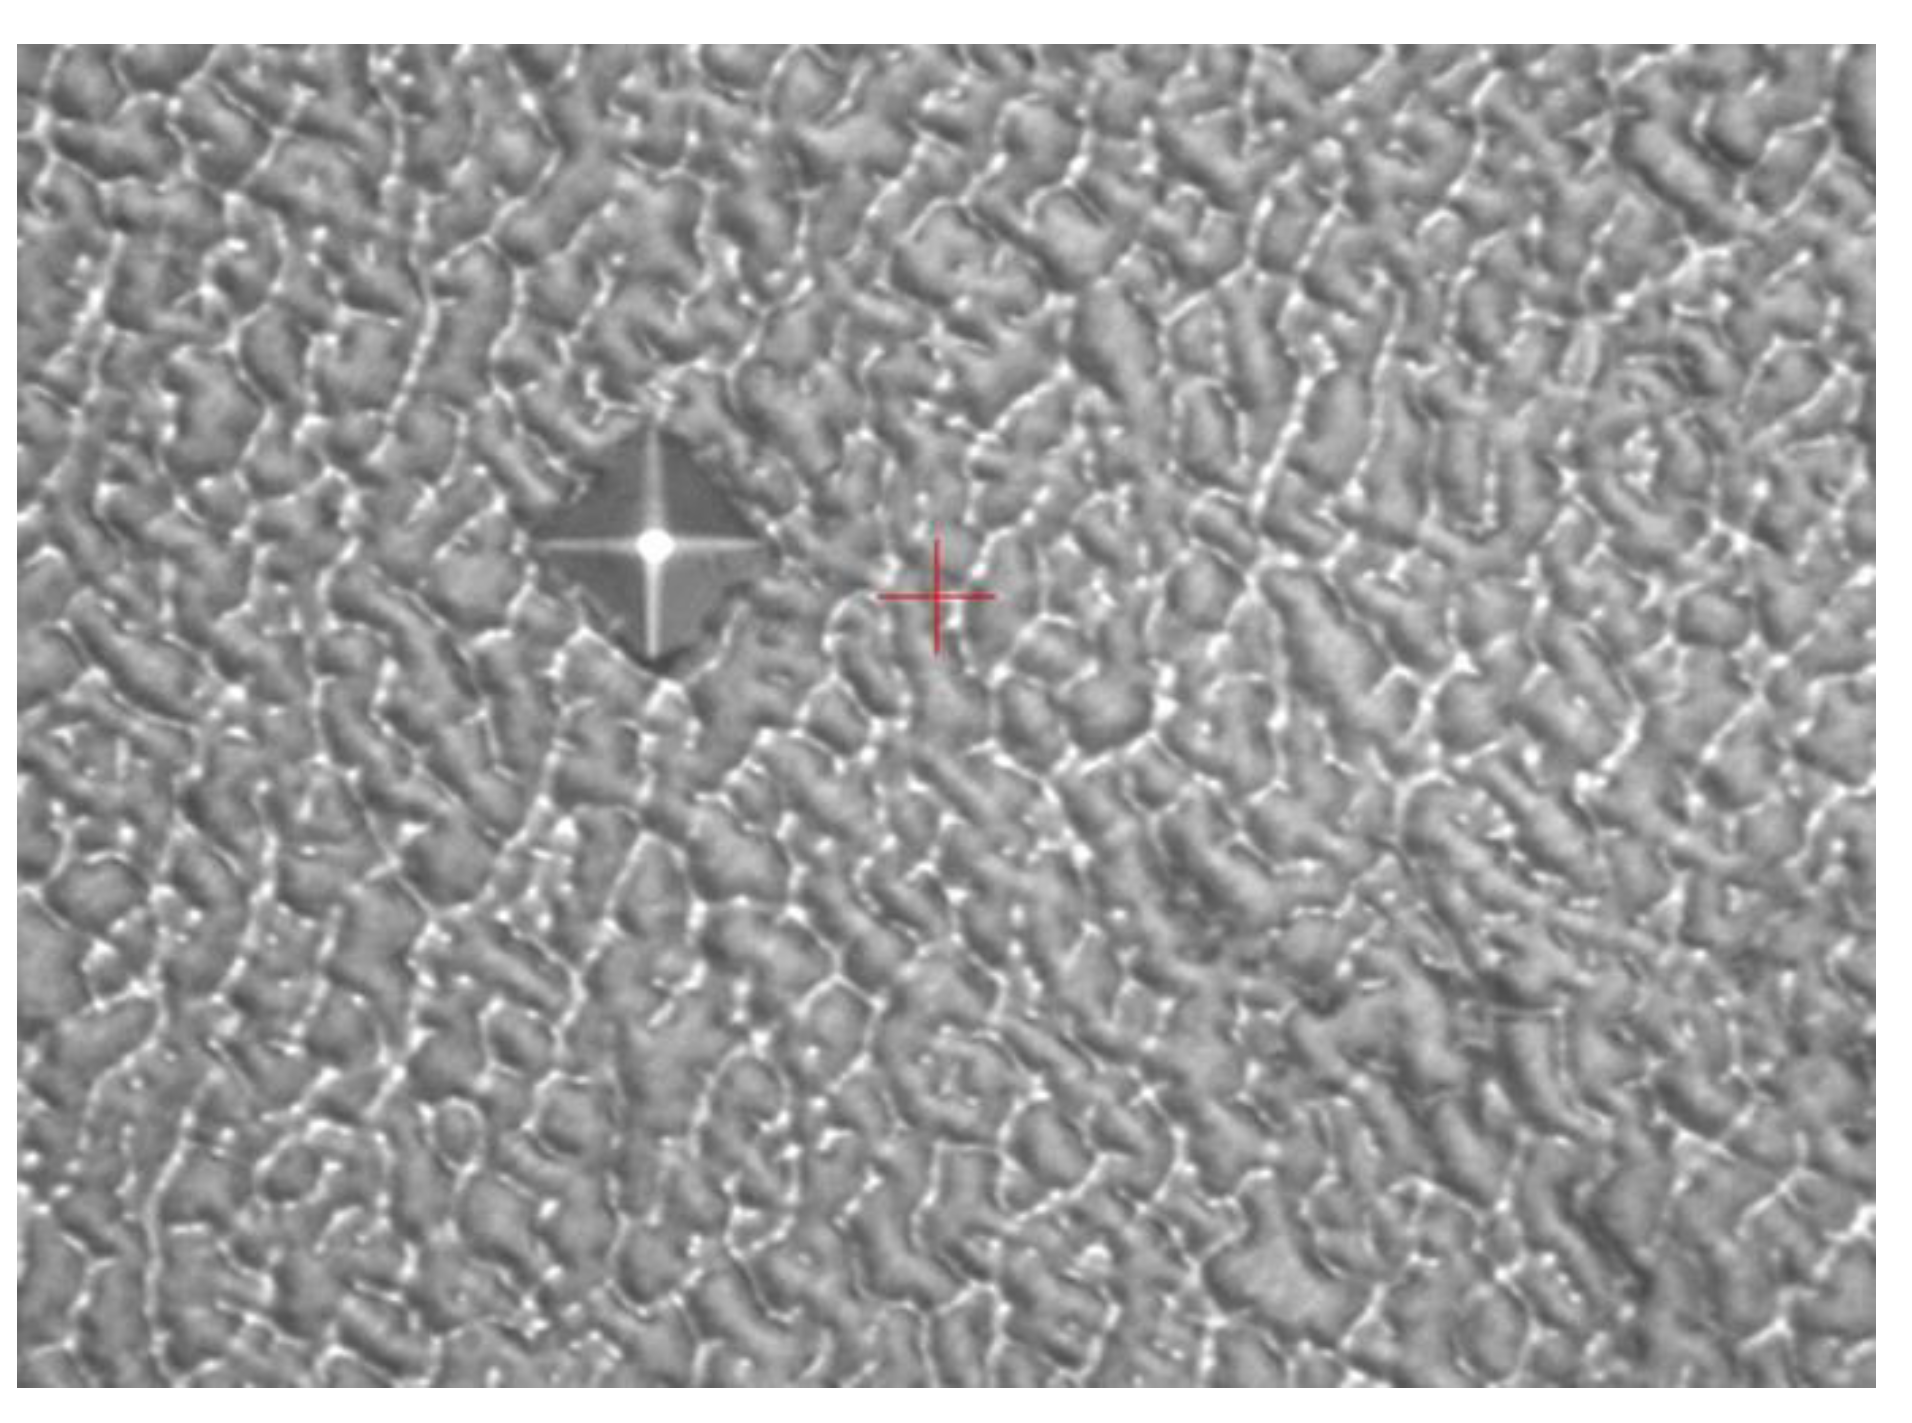
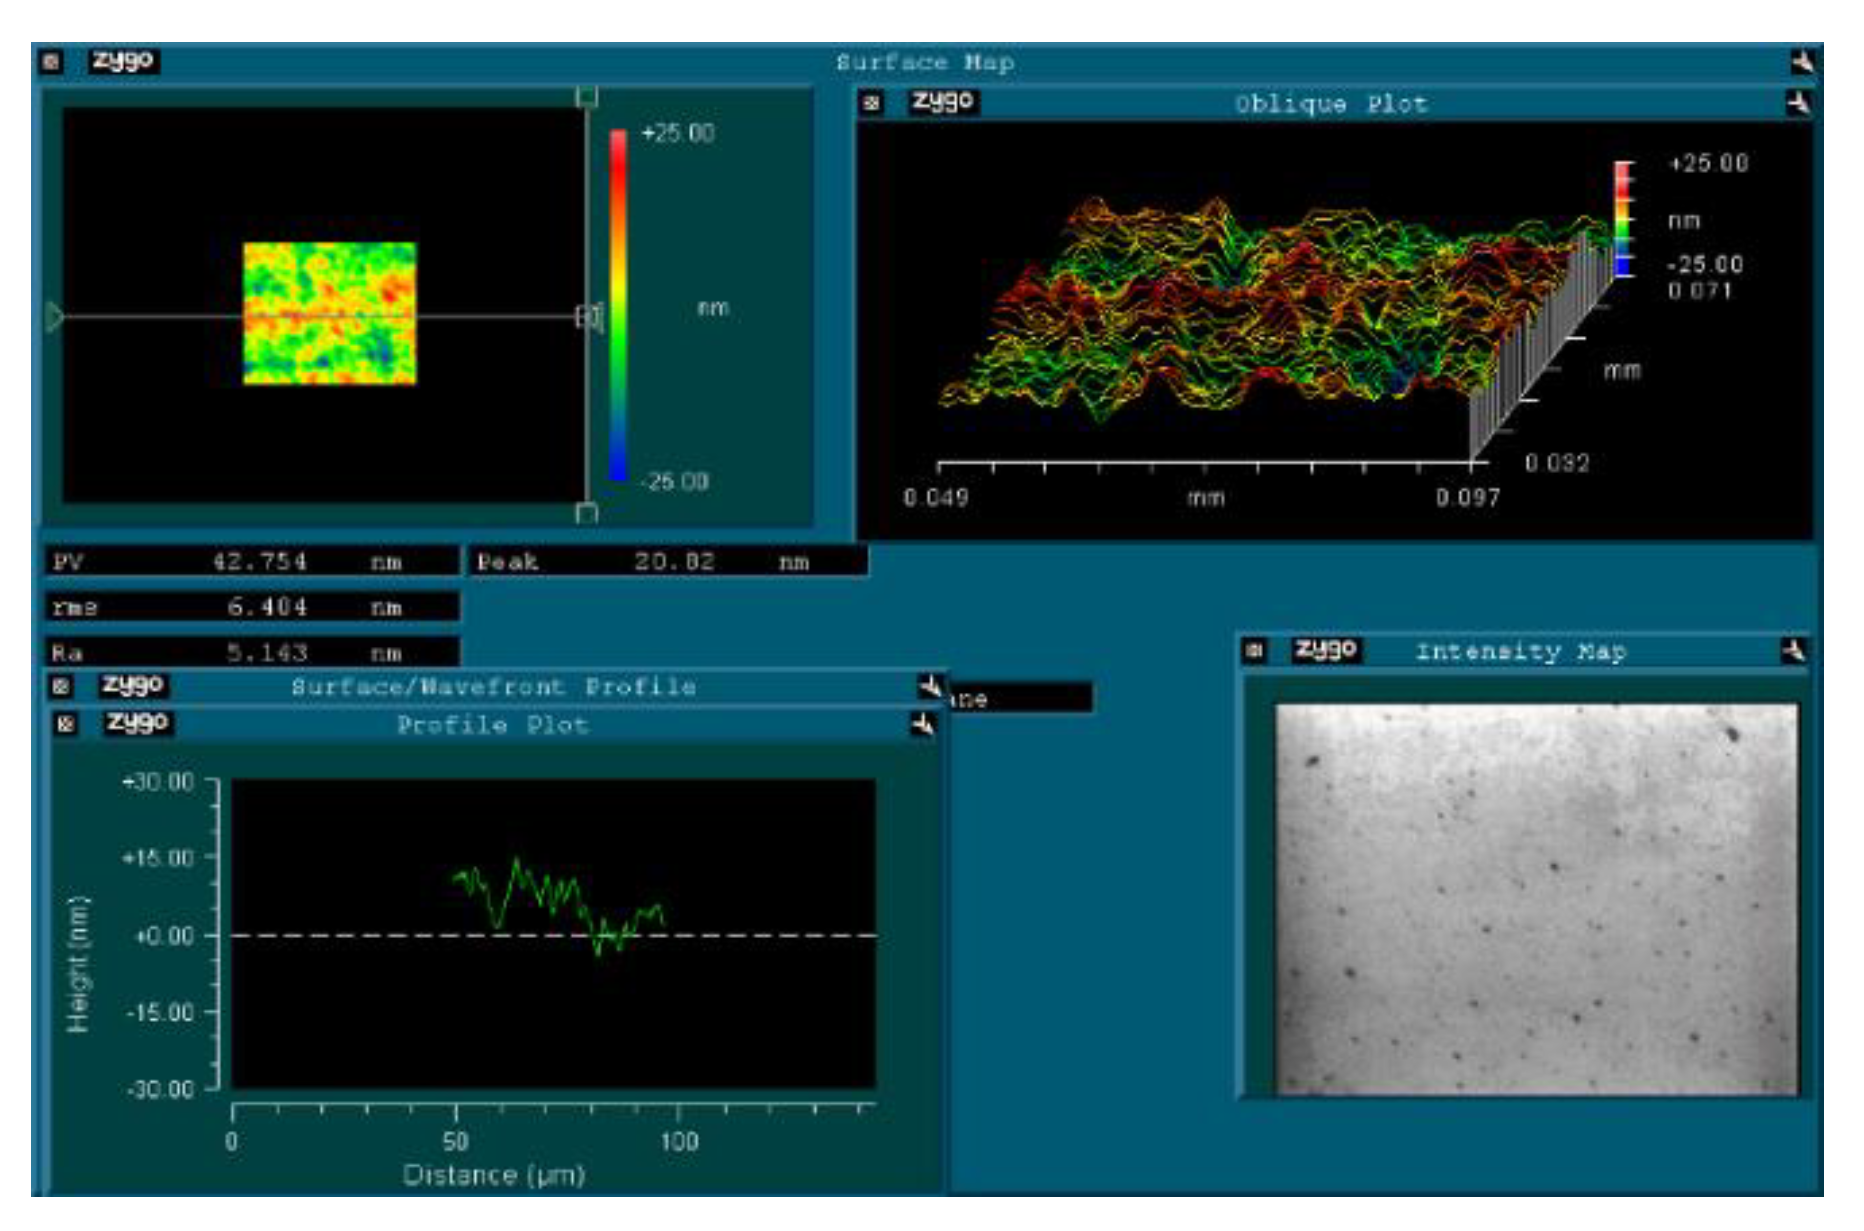
To further investigate the properties of the NiCo composite coating, a hardness test is performed using a SHIMADZU Dynamic Ultramicro Hardness Tester DUH-211S, as shown in Figure 12. The test force range is 0.1–200 gf (0.1–1961 mN), and the measuring range is 0.1–10 µm. The microscope magnification is 500×, and the HV range is 100–900. The maximum permissible percentage errors are 4%–12%. The hardness obtained is 465.257 HV, which is much harder than the raw materials used for the mold. This result confirms that by using the double-pulse power supply technique, the wear resistance is significantly improved. The application of the NiCo composite coating with improved hardness and wear resistance extends the service life of the mold. This hardness test verifies that the electroplating process using the double-pulse power supply technique leads to the formation of a dense and uniform coating with excellent hardness and wear resistance. The surface roughness of the coating shown in Figure 13 is 5.143 nm, which is relatively smooth with few scratches.
To prevent mold fracture during use, it is important to choose a raw material with high yield strength and low fracture strain. This finding ensures that the mold can withstand a large impact load, and materials with high yield strength can effectively minimize damage caused by such impact loads, thereby extending the mold service life. However, if the raw material has a fracture strain that is overly high, it may easily fracture, which significantly impacts the mold service life.
Plastic deformation occurs when a material is subjected to a tensile stress that exceeds its yield strength. For mold materials, the degree of plastic deformation should be determined based on the specific usage scenario. In general, mold materials should possess a certain degree of plastic deformation capability to accommodate deformation during use and subsequent recovery. If the plastic deformation ability is overly low, the material may crack and fracture easily, significantly reducing the mold service life. Conversely, if the plastic deformation ability is overly high, the material cannot fully recover from deformation, resulting in permanent damage to the mold.
To enhance the mold service life and work efficiency, the selection of raw material should comprehensively consider the yield strength, plastic deformation, and fracture strain. By striking a balance among these factors, the optimal material for the mold can be chosen. This phenomenon ensures that the mold can withstand impact loads without fracturing, and it possesses the necessary plastic deformation capability to accommodate deformation.
In Table 5, data about several key indicators impacting the mold service life are presented. A comparison of these indicators reveals that the NiCo special coating developed in this study significantly increases the mold yield strength, slightly improves plastic deformation, and slightly reduces fracture strain. These findings demonstrate that the NiCo special coating can effectively prevent mold fracture and achieve the objective of enhancing the mold service life.

4. Summary

We presented a comprehensive investigation into the fracture of a mold utilizing advanced techniques, such as energy-dispersive X-ray spectroscopy (EDX), scanning electron microscopy (SEM), and Auger electron spectroscopy (AES). In the analysis, we compared a normal part made of low carbon steel to the fractured part exhibiting cracks caused by nonconforming nonmetallic inclusions and reticular carbides. The fractures were a result of agglomeration of microporosity and cleavage fracture. Further examination using SEM and AES was focused on the causes of mold fracture, particularly emphasizing the significance of dimples on the specimen edge. EDX analysis confirmed that the mold suffered from thermal brittleness during its operational use.
To enhance the mold durability and extend its lifespan, a double-pulse electrodeposition method was implemented to create a NiCo alloy coating, replacing the existing chromium (Cr) layer on the metal surface. This specially prepared NiCo coating exhibited a smooth and scratch-free surface. The application of this coating notably increased the mold yield strength by approximately 313.8%, facilitated a 13% increase in plastic deformation, and reduced fracture strain by 25%. As a result, the mold susceptibility to fracture was effectively prevented, leading to a significant improvement in its overall service life.
In summary, this investigation could provide valuable insights into the fracture mechanisms of molds, offering scientific evidence for the application of double-pulse electrodeposition and the use of NiCo alloy coatings as effective strategies for enhancing mold durability. These findings had implications for industries relying on molds, contributing to improved manufacturing processes and increased operational efficiency.

Author Contributions

Conceptualization, Xionghua Jiang and Xiangbin Zeng; methodology, Xionghua Jiang; software, Xionghua Jiang; validation, Xionghua Jiang and Fengyu Kong; formal analysis, Xionghua Jiang; investigation, Xionghua Jiang; resources, Xionghua Jiang; data curation, Xionghua Jiang; writing—original draft preparation, Xionghua Jiang; writing—review and editing, Xionghua Jiang; visualization, Xionghua Jiang; supervision, Xionghua Jiang; project administration, Xionghua Jiang; funding acquisition, Xionghua Jiang. All authors have read and agreed to the published version of the manuscript.

Funding

This research was funded by the Natural Science Foundation of Guangdong Province China, grant number 2023A1515012309 and by the sci-tech commissioner project of Dongguan, grant number 20221800500152.

Institutional Review Board Statement

Not applicable.

Informed Consent Statement

Not applicable.

Acknowledgments

SAE Magnetics (HK) Ltd.

Conflicts of Interest

The authors declare no conflicts of interest. The funders had no role in the design of the study, in the collection, analyses, or interpretation of data, in the writing of the manuscript, or in the decision to publish the results.

References

  1. Zhang, L.; Guo, W.; Lu, Y.; Chen, L. Failure analysis of a plastic injection mold core plate. Eng. Fail. Anal. 2018, 94, 45–55. [Google Scholar]
  2. Liu, H.; Wu, G.; Gong, J.; Zhang, F. Fracture analysis of an aluminum die casting mold. Fatigue Fract. Eng. Mater. Struct. 2020, 43, 1040–1047. [Google Scholar]
  3. Ji, F.; Jia, R.; Zhou, L. Evaluation of the failure of a die casting mold base. Int. J. Adv. Manuf. Technol. 2019, 103, 4015–4015. [Google Scholar]
  4. Wang, Q.; Fang, F.; Zhu, X. Damage and lifecycle of ultra-precision machining mold. Int. J. Precis. Eng. Manuf. 2018, 19, 973–981. [Google Scholar]
  5. Chen, X.; Li, J.; Han, R.; Zeng, Z. Fracture analysis of a plastic injection mold slider. Mater. Sci. Eng. A 2020, 771, 138556. [Google Scholar]
  6. Xu, J.; Luo, R.; Du, W.; Cai, X.; Ding, Y. Microstructure characterization and failure analysis of a high strength steel die casting mold. Mater. Sci. Eng. A 2019, 745, 131–138. [Google Scholar]
  7. Chen, X.; Han, R.; Zeng, Z.; He, G. Structural failure analysis of a thermosetting plastic mold. J. Fail. Anal. Prev. 2019, 19, 412–417. [Google Scholar]
  8. Zhao, W.; Li, M.; Meng, X. The study of multi-scale numerical simulation methodology for mold fatigue failure. Int. J. Adv. Manuf. Technol. 2017, 95, 3835–3850. [Google Scholar]
  9. Gu, J.; Cao, J.; Yang, K. Progress of research on die casting mold failure. J. Mater. Process. Technol. 2018, 252, 869–880. [Google Scholar]
  10. Li, M.; Li, F.; Lu, Q.; Yan, C.; Zhang, X. Failure analysis and evaluation of a high-speed steel cold heading die. J. Mater. Eng. Perform. 2020, 29, 3503–3517. [Google Scholar]
  11. Zhang, Y.; Yu, Y.; Zhao, Y.; Cui, Q. Fracture analysis of an injection mold steel made from a powder metallurgy technique. Mater. Sci. Technol. 2019, 35, 949–956. [Google Scholar]
  12. Chen, Y.; Han, R.; Shao, Y.; Zeng, Z. Failure of plastic injection molds: A review. Polym. Eng. Sci. 2018, 58, 351–362. [Google Scholar]
  13. Bi, X.; Wei, B.; Song, C.; Liu, H.; Fu, C. Failure analysis of a titanium alloy die casting mold. Mater. Sci. Technol. 2019, 35, 1075–1087. [Google Scholar]
  14. Yang, Z.; Zhang, Q.; Zhang, D.; Chen, Y. Fatigue failure analysis of hot work tool steel dies for forging processes. Mater. Des. 2019, 183, 108126. [Google Scholar]
  15. Ren, X.; Li, S.; Miao, H.; Li, M. Investigation of failures in cold forging die steel by FE simulation and metallography analysis. Mater. Des. 2020, 188, 108419. [Google Scholar]
  16. Wang, D.; Huang, K.; Wang, X.; Shen, D.; Qin, P. Severe plastic deformation of a die-material surface for prevention of stress corrosion cracking failure of stainless steel dies. Mater. Sci. Eng. A 2018, 734, 308–318. [Google Scholar]
  17. Li, F.; Li, M.; Lu, Q.; Yan, C. Fatigue fracture characteristics and crack initiation of hot work die steel. Mater. Manuf. Process. 2018, 33, 987–994. [Google Scholar]
  18. Tost, M.; Kiefer, C.; Vollmer, M.; Klocke, F. Impact of heat treatment on wear, toughness, and failure mechanisms of high speed steel dies. Mater. Manuf. Process. 2020, 35, 1056–1066. [Google Scholar]
  19. Zhang, B.; Zhao, T.; Tang, C.; You, X.; Fang, F. Improvement of the quality of TIN/TICN multilayer coatings through negative pulse modulation bipolar intermediate-frequency reactive magnetron sputtering. Surf. Coat. Technol. 2019, 371, 47–57. [Google Scholar]
  20. Guo, J.; Zhang, H.; Duan, X.; Xu, J.; Zhao, X. Analysis of the Failure of High-Speed Steel Milling Cutter Coated by TiAlN. J. Mater. Eng. Perform. 2018, 27, 83–91. [Google Scholar]
  21. Zhang, J.; Zhou, Q.; Wang, L. Study on the Corrosion Resistance and Adhesion of CrN, 2017, TiAlN, and CrAlN Coatings on Dental Burs. Scanning 2017, 7364729. [Google Scholar]
  22. Li, Y. D.; Yue, T. M.; Lee, W. B.; Man, H.C. Influence of coating surface morphology on the delamination behavior of coating/substrate interfaces in multilayer coatings. Appl. Surf. Sci. 2019, 484, 994–1001. [Google Scholar]
  23. Zhang, X.; Xiao, Q.; Wang, Z.; He, Y. Influence of coating parameters on wear and fracture of TiAlN coated cemented carbide cutting tools. Surf. Coat. Technol. 2019, 372, 64–70. [Google Scholar]
  24. Ji, X.; Wang, X.; Du, L.; Song, C. Effects of CrN coating thickness on wear resistance and fracture toughness of coated cemented carbides. Chin. J. Mech. Eng. 2017, 30, 108–116. [Google Scholar]
  25. Wu, M.; Li, R.; Yang, Y.; Zhang, Y. Effect of TiN coating on the adhesion strength of diamond coatings. Thin Solid Film. 2017, 638, 93–98. [Google Scholar]
  26. Wu, M.; Han, X.; Zhang, Y.; Li, R. Improving the adhesion strength of diamond coatings by the interface modification between TiN and Si substrates. Mater. Chem. Phys. 2018, 207, 403–408. [Google Scholar]
  27. Zhang, X.; Chen, Z.; Wang, L. Experimental and numerical investigation of influence of coating morphology on thermal shock resistance of TiAlN coatings. J. Therm. Spray Technol. 2019, 28, 734–743. [Google Scholar]
  28. Nishioka, K. Improvement of fracture resistance for ceramic cutting tools by friction stir processing. Int. J. Refract. Met. Hard Mater. 2018, 76, 339–346. [Google Scholar]
  29. Liu, B.; Chen, X.; He, Y.; Xu, J.; Zhang, Y. Enhancement of wear resistance on a CrN coating by surface modification with a C plasma. Appl. Surf. Sci. 2018, 448, 160–165. [Google Scholar]
  30. Zhou, C.; Zhai, L.; Sun, J.; Li, X. Microstructural analysis of a TiAlN coating on an Al2O3 ceramic substrate. Ceram. Int. 2020, 46, 4753–4759. [Google Scholar]
  31. Dong, Y.; Zhang, W.; Zhou, X.; Chen, P. Improving surface quality of BK7 windows in a complex system through high-speed milling with coated tools. Precis. Eng. 2020, 62, 343–351. [Google Scholar]
  32. Tian, L.; Zhang, G.; Chen, J.; Chen, X. Study on friction and wear behavior of cutting tools coated with tailored diamond-like carbon films under diesel oil lubrication. Tribol. Int. 2019, 132, 16–25. [Google Scholar]
  33. Han, S.; Kang, S.; Jeon, Y. Enhancing the adhesion strength of SiO2 by HfO2 intermediate layer in thin film coating. Surf. Coat. Technol. 2018, 331, 70–74. [Google Scholar]
  34. Ou, M.; Zhu, W.; Dong, Y.; Chen, Y.; Liu, J. Influence of sputtering parameters on the mechanical and tribological properties of Cr-AIN coated ultra-high molecular weight polyethylene. Surf. Coat. Technol. 2018, 349, 711–719. [Google Scholar]
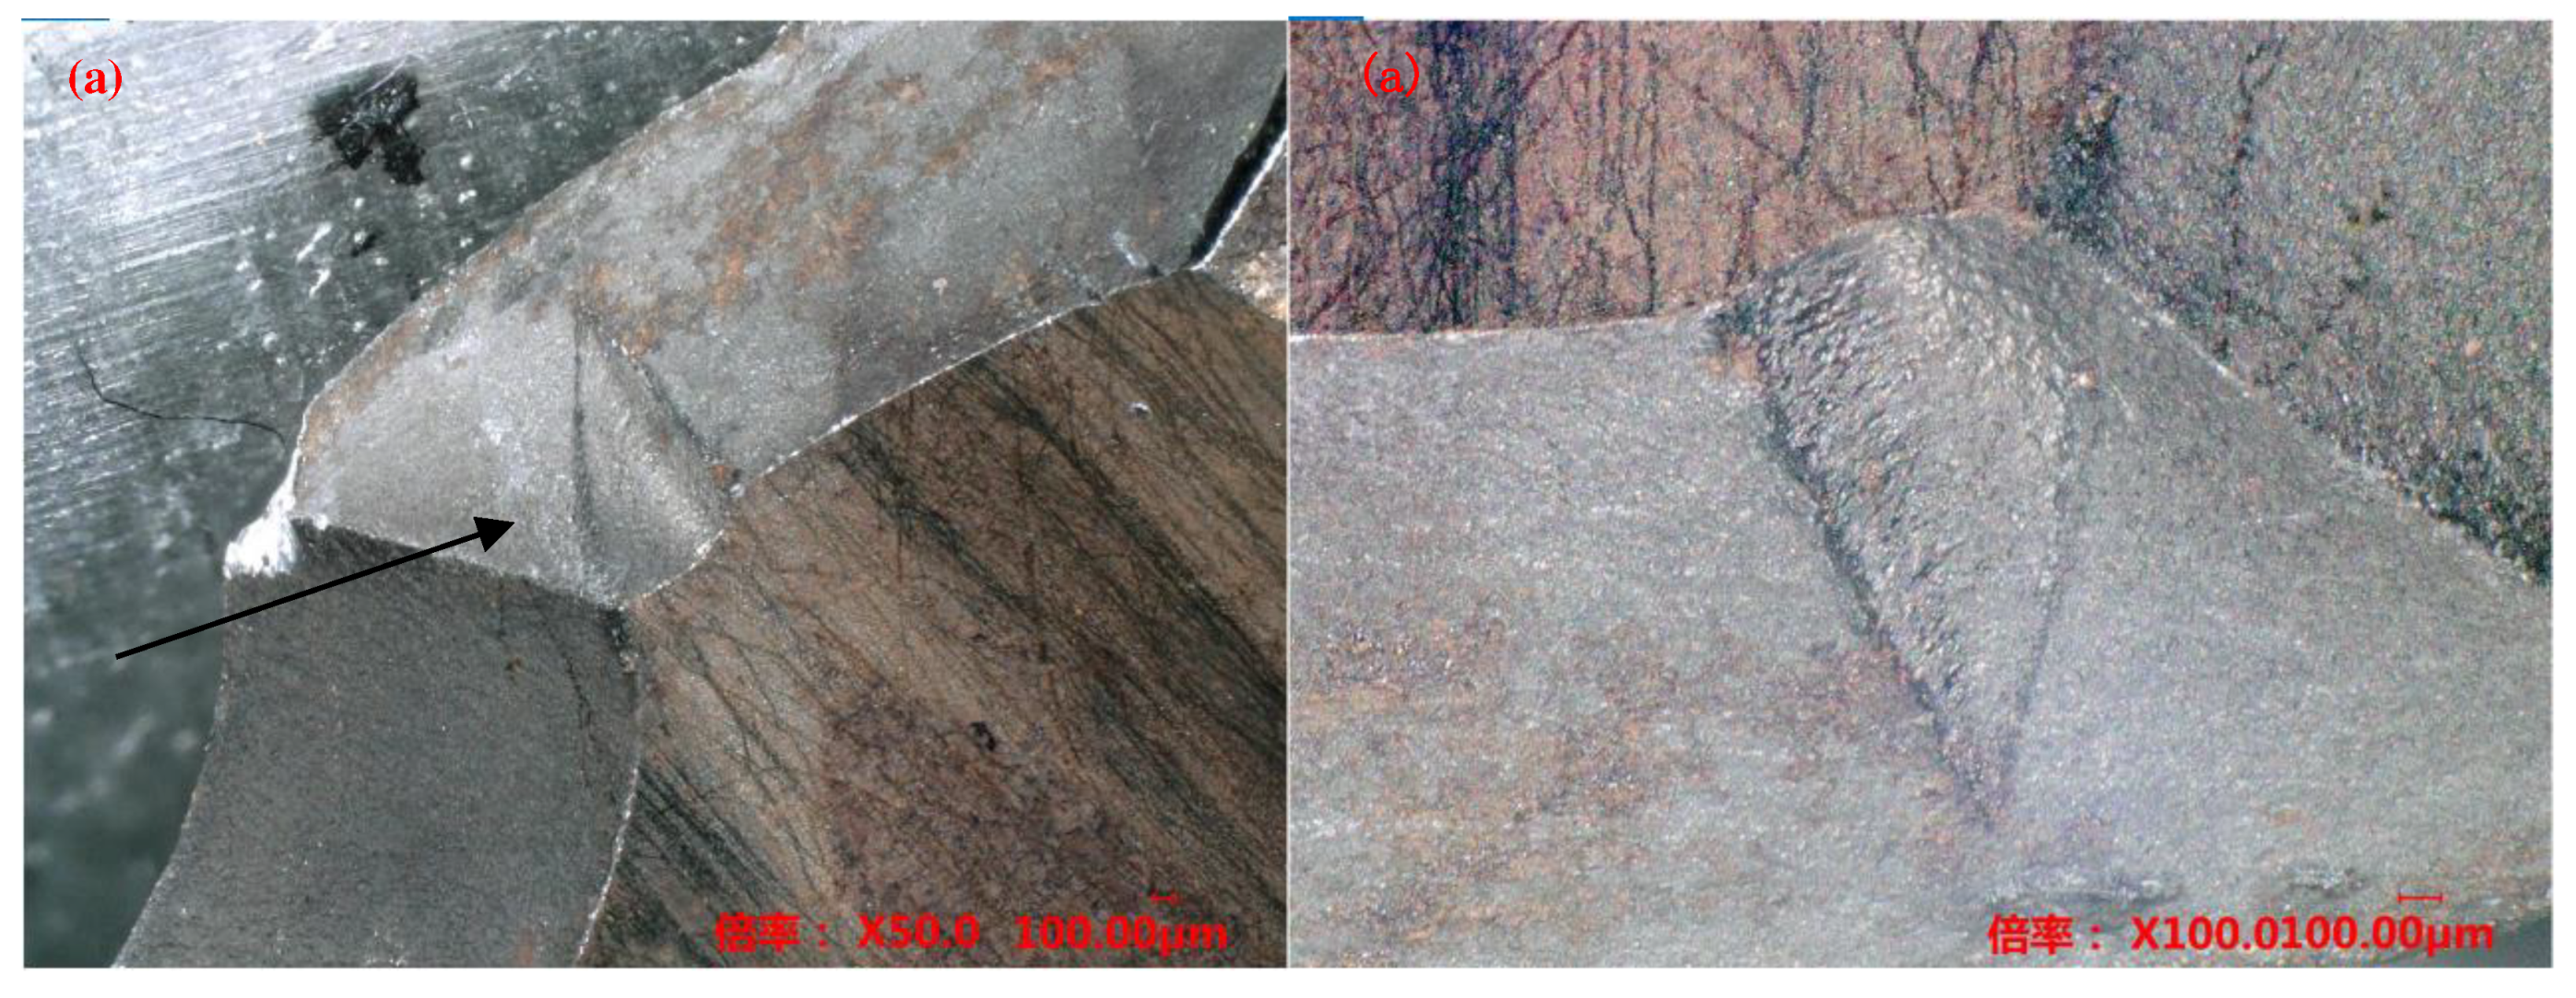
Figure 1. Location of the fracture under a high-power microscope: (a) magnified 50 times and (b) magnified 100 times.
Preprints 88522 g001
Figure 2. Location of the fracture under SEM at different magnification times: (a) 16×, (b) 50×, (c) 100×, (d) 70×, and (e) 350×.
Preprints 88522 g002
Figure 3. Morphologies of the fracture site and the normal site: (a) crack site and (b) normal site.
Preprints 88522 g003
Figure 4. Different positions for the test sample of the crack position.
Preprints 88522 g004
Figure 5. EDX results for different crack positions.
Preprints 88522 g005
Figure 6. (a) SEM images indicating the location of sampling, (b) corresponding fracture locations, (c) normal locations, (d) sampling points of the fracture locations, and (e) sampling points of the normal locations.
Preprints 88522 g006aPreprints 88522 g006b
Figure 7. EDX spectrum chart for the corresponding location of fracture sampling.
Preprints 88522 g007
Figure 8. EDX spectrum chart for the corresponding location of normal sampling.
Preprints 88522 g008
Figure 9. SEM image of the special coating. (a) 10 μm (b) 1 μm (c) 100 nm.
Preprints 88522 g009
Figure 10. EDX spectrum chart for the special coating.
Preprints 88522 g010
Figure 11. SEM and AES results of the special coating under different magnification ratios.
Preprints 88522 g011
Figure 12. Hardness test image for the special coating.
Preprints 88522 g012
Figure 13. Surface test image for the special coating.
Preprints 88522 g013
Table 1. EDX test results.
Unit Test item
Fe Cu Si Mn Cr Co Ni
Sample mold (wt)% 97.609 0.252 1.210 0.855 0.073 NA NA
Table 2. Component testing results at different locations.
wt.% C O Al Si S Cl K Ca Mn Fe Co Cu Zn W
1 9.06 10.2   0.9         0.2 79.7        
2 9.46 9.14 0.8 0.2 80.4
3 7.67 32.6 0.4 57.3 2
4 14.2 20.2 0 0.6 0.3   0.6 0.3   54.9   6.7 0.9 1
Table 3. Components corresponding to different spectrum charts (fracture sample).
wt.% C O Al Si P S K Ca Fe Co Cu Mo W
1 9.57 30.1 0.4 0.7 0.4 55.5 1.4 2
2 4.47 2.67 1 91.8
3 43.9 21.1 0.2 0.2 0.3 0.5 0.3 1.1 8.53 23.9
4 39.6 16.2 0.2 0.2   0.1 0.2   18.8 0.9 22.7 1.2  
Table 4. Components corresponding to different spectrum charts (normal sample).
C O Si Fe Cu Zn
1 4.36 13.19 1.07 81.38
2 4.23 3.77 1.08 90.92
3 5.62 14.38 0.72 73.72 4.78 0.78
4 5.36 4.24 1.21 89.18
5 5.67 3.56 1.11 89.66
Table 5. Comparison of raw materials and special coatings.
Yield strength (MPa) Plastic deformation (%) Fracture strain (%)
Raw materials of mold 420 22 8
Mold with special coating 1738 25 6
Disclaimer/Publisher’s Note: The statements, opinions and data contained in all publications are solely those of the individual author(s) and contributor(s) and not of MDPI and/or the editor(s). MDPI and/or the editor(s) disclaim responsibility for any injury to people or property resulting from any ideas, methods, instructions or products referred to in the content.
Copyright: This open access article is published under a Creative Commons CC BY 4.0 license, which permit the free download, distribution, and reuse, provided that the author and preprint are cited in any reuse.
Prerpints.org logo

Preprints.org is a free preprint server supported by MDPI in Basel, Switzerland.

Subscribe

© 2024 MDPI (Basel, Switzerland) unless otherwise stated