
Submitted:
19 October 2023
Posted:
23 October 2023
You are already at the latest version
Abstract
Water pollution is regarded as a dangerous problem that needs to be resolved right away. This is largely due to the positive correlation between the increase in global population and waste production, especially food waste. Hydrogel beads based on sodium alginate (Alg) and pomegranate fruit peels (PP) were developed for the adsorption of Safranin O dye (SO) in aqueous solutions. The obtained Alg-PP beads were widely characterized. The effects of the contact time (0-180 min) and initial concentration (10-300 mg/l), the initial pH (2-10), the adsorbent dosage (1-40 g/l) and the temperature (293-333 K) were investigated through batch tests. The data proved that the adsorption kinetics of SO reached equilibrium within 30 min and up to 180 min. The adsorption data of SO onto synthesized beads follow the pseudo second-order model. The experimental data fitted very well to both Freundlich and Langmuir models. The maximum adsorption capacity of Alg-PP could reach 8.99 mg/g at 293 K. Calculation of Gibbs free energy and enthalpy indicated that adsorption of SO onto Alg-PP is spontaneous and endothermic. Finally, analysis of diffusion and mass transport phenomena were presented. The reported results revealed that the Alg-PP beads could be used as a novel natural adsorbent for the removal of cationic dye pollutants from aqueous environments.
Keywords:
alginate
; pomegranate
; cationic dye
; adsorption
; adsorbent
; isotherm
1. Introduction
Many different types of pollution affect water resources, harming aquatic organisms. Pollutants can be produced naturally, but a large portion is due to human activities like industrial processes. Many companies use dyes during the production processes [1]. Even at low concentrations, the discharge of effluents containing dyes is highly visible and has undesirable effects. The primary effect is the decrease in sunlight penetration throughout the water body, which has an effect on photosynthetic activity and, as a result, the rate of dissolved oxygen [2].
Safranin-O (SO) is a dye used in the histology and cytology fields of the pharmaceutical and biochemical industries. It is frequently employed for detecting cartilage, mucin, and mast cell granules as well as staining gram-negative bacteria [3]. Furthermore, it is used less frequently in food products, as well as in the coloring and treatment of tannins, cotton, fibers, wool, paper and leather [4]. In addition, SO may cause adverse health effects such as eye irritation, dermatitis, and respiratory allergies [5].
Given these consequences, appropriate wastewater treatment is required. In this regard, there is a great incentive to develop novel and cheap technologies [4]. Although many techniques, including membrane filtration, are suggested for dye removal [6] (such as ion exchange [7], coagulation-flocculation [8], precipitation [9], and electrocoagulation [10]), adsorption is an interesting alternative since its cheapness [11,12,13,14]. Since the high cost of some typical adsorbents, adsorption techniques using unconventional low-cost materials from renewable and cheap biomass or industrial wastes have been investigated to overcome such disadvantages and improve economic viability [15,16].
Many natural and low-cost adsorbents are now being used successfully in the removal of pollutants from aqueous solutions such as peanut hull [17], rice straw [18], date stone [19], forest residue [20], natural fibers [21], pulp and paper [22] and cotton stalks [23]. Agricultural wastes have the benefits of being accessible, cost-effective, and environmentally friendly in addition to being biodegradable, non-toxic, and cheap [24,25,26,27,28,29]. Pomegranate peel waste has been successfully used as an efficient, cost-effective for the removal of pollutants from wastewater [30,31,32]. Despite the effectiveness of these low-cost adsorbents, there are some issues related to their implementation, such as the difficulty of their regeneration and the separation of treated water. The use of biopolymers as carrier to encapsulate these materials could be considered a solution to this issue [33,34].
The most popular polymer for this purpose is alginate, which is an anionic and hydrophilic polymer found mostly in brown algae [35]. Alginate has a number of properties that make it suitable for the adsorption process [36]; one of which is the gelation property, which allows for combining various substances through an egg-box structure [37]. Therefore, the creation of adsorbent composite beads can be used in water treatment processes, particularly continuous ones as opposed to discontinuous ones [11,38,39].
Based on the previously reported statements, the current work aims for fabricating facile, eco-friendly and biocompatible Alg-PP beads for removing SO from water. The adsorbent was widely characterized while the effects of different parameters on the removal of SO process were investigated. Finally, the adsorption kinetics, isotherms and thermodynamics of adsorption of SO were carried out.
1. Materials and Methods
1.1. Reagents and materials
Sodium alginate (C6H9NaO7, 216.12 g/mol, CAS No. 9005-38-3, >91% purity), hydrochloric acid (HCl, 37%), calcium chloride (CaCl2, AR, 96%), sodium chloride (NaCl, AR, 99.5%), sodium hydroxide (NaOH, 99%) were purchased from Sigma Aldrich. Safranin O was purchased from Sigma-Aldrich and was used without further purification. Figure 1 represented the structure of Safranin O dye.
1.2. Preparation of Pomegranate peels powder
Pomegranate was purchased from a local market in Algeria. The peels of pomegranate was washed with distilled water several times to remove the undesirable residues and dried, crushed and sieved through a 63 μm size before its use without any further processing or chemical treatment.
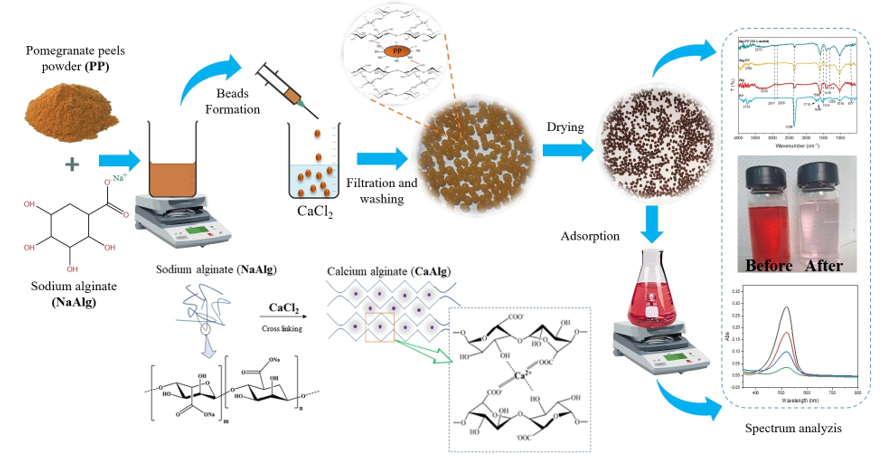
1.3. Preparation of beads
Sodium alginate water solution (3% w/v) was prepared by stirring it for 1 h at 50 °C. Then 3 g of pomegranate peels powder was added into the solution until a homogenous Alg-PP dispersion was obtained. The mixture was dropped through a syringe needle into a 4% (w/v) calcium chloride solution to form beads and left overnight to stabilize. The Alg-PP hydrogel beads were formed through an ion exchange process. The beads were then washed with distilled waterro remove the excess of calcium chloride. Finally, they were dried for 24 in an oven at 50°C.
1.4. Characterization methods
A gravimetric method was used to evaluate the swelling ability of the hydrogel beads [40]. For 6 hours, a certain amount of hydrogel beads was soaked in deionized water at room temperature. The swelling ratio (S%) was calculated using the equation 1 [1]:
where and represent the weights (g) of wet and dried hydrogel beads, respectively.
The water content of the PP/Alg hydrogel was determined by drying beads to a constant weight at 50°C (equation 2):
where and are the weights of hydrogel beads before and after drying, respectively.
ImageJ software (Version 1.53t) was used to digitize photographs and determine the mean diameters and distribution of bead sizes of the hydrogel beads. 80 hydrogel beads were measured. Results were reported as mean±standard deviation.
The surface's functional groups of the beads were investigated using Fourier transform infrared (FTIR) spectroscopy JASCO FT/IR 4600.
In order to investigate the surface charge of the hydrogel beads, the pH-drift method was applied to evaluate the point of zero charge (pHpzc) [41].
1.5. Batch adsorption experiments
The dye adsorption experiments were carried out via a batch adsorption process by fixing a stirring rate of 400 rpm. 500 mg of hydrogel beads into 50 mL of different concentrations of dye solution at room temperature (20°C+2°C). The adsorbed dye amount onto the hydrogel beads was analyzed by using a UV/VIS spectrophotometer (OPTIZEN POP K LAB Co., Ltd) at the wavelength λ= 522 nm. The pH effect on SO adsorption was investigated in the range of 2–10 while the initial dye concentration was fixed at 50 mg/L. The dosage effect of Alg-PP beads was varied from 1 to 40 g/L with a set initial dye concentration of 50 mg/L. The temperature was varied from 30 to 60 °C with a set dye concentration of 50 mg/L. The isothermal adsorption experiments were carried out with 50 mL of dye solutions with different initial concentrations (10–300 mg/L). The adsorption capacity (q) and the removal efficiency (R %) of SO adsorbed onto hydrogel beads were evaluated by the following equations 3 and 4
where and are the initial and equilibrium concentrations of SO, respectively, represents the mass of adsorbent, is the volume.
2. Results and Discussion
2.1. Characterization
2.1.1. Beads size and water content
The Alg-PP beads appeared brown, roughly spherical-shaped with a millimetric size (3 mm, Figure 2a), while the mean diameter of the dried beads was 1 mm (Figure 2b). The diameter distribution of the Alg-PP beads is shown in Figure 2e. The size of the beads varied between 0.6 and 1.4 mm. Finally, the water content of beads was 95.13%.
2.1.2. Swelling ratio
The water swelling ratio of Alg sample was found to be 16.6% while, for Alg-PP was obtained 53.9%. Compared to pure Alg, this increase in water swelling ratio of Alg-PP gel beads can be associated to their higher surface area. Besides, the higher swelling ratio value for Alg-PP sample is related to its higher porosity and the more hydrophilic structure of PP powder [27,41]. Therefore, the swelling ratio studies also suggest that the Alg-PP beads is more suitable to adsorb dye molecules.
2.1.3. FTIR analysis
The analysis of FTIR gives more insight into the presence of the functional groups on the surface of the PP and the hydrogel beads (Figure 3). The FTIR spectra of the Alg-PP, pure Alg and PP powder are shown in Figure 3
For Alg spectrum, broad peaks centered at 3230 cm-1 indicated the presence of hydroxyl (O-H) streching vibrations [42]. Besides, PP and Alg-PP didn’t show any broad peaks apart from medium peaks at higher wavelenghts associated to the presence of O-H streching functional groups. Peak located at 2911 cm-1 and 2850 cm-1 are related to C-H streching of CH2 in the PP, Alg and Alg-PP. All spectra showed a narrow and long band at 2356 cm-1 due to the C ≡ C stretching of alkyne group [43]. The observed peak at 1710 cm-1 in PP spectra corresponds to the C=O streching of the aldehydes, ketones and carbonyl groups. The peak around 1596 cm-1 and 1418 cm-1 can be assigned to the symmetric and antisymmetric stretching vibrations of COO- functional groups [44], the first one clearly overlapping δOH vibration modes of adsorbed molecules of water. The peak at 1514 cm-1 in PP and Alg-PP represents the cellulosic compounds present in the biomaterial [45]. The absorption band at 1314 cm-1 were assigned to the CH streching vibrations. Additionally, the band at 1016 cm-1 is associated with the C-O stretching vibration of lignin and hemicelluloses components [46]. The band observed at 677 cm-1 in the PP spectra is ascribed to C–H in out-of-plane bending [47].
2.2. Adsorption tests
2.2.1. Effect of contact time and initial dye concentration
Figure 4 shows the effect of contact time and initial dye concentration on adsorption.
The adsorption trend was essentially separated into three stages: initial rapid adsorption, slowing of adsorption rate, and eventually achieving the equilibrium state. The adsorbent surface contains active sites, so the SO molecules are accumulated on the monolayer of the adsorbent surface. Pores and active sites were saturated as the adsorption time increased. This is evident in the second step, and the adsorption capacity slowly increases before levelling off. The SO molecules can then penetrate the pores in the final region, before reaching a steady situation due to the repulsive forces between the free SO molecules in solution and adsorbed molecules [48]. The results indicated that the maximum uptake capacities were 0.99, 2.13, 3.99, 8.79, 18.87 and 24.73 mg/g for the 10, 25, 50, 100, 200 and 300 mg/L Safranin O solutions, respectively. The time required to reach plateau regime was reached after 20 minutes for C0= 10, 25, 50 and 100 mg/L SO and after 40 minutes for higher concentrations. The dye adsorption is concentration-dependent due to the higher initial concentration which contributed to increase the driving force overcoming the mass transfer resistance [49].
2.2.2. Effect of initial pH
The pH plays a crucial role [50] since it can affect the surface charge of the adsorbent as well as the adsorbate properties. The pH effect was studied at the following conditions: dosage of 500 mg and an initial dye concentration of 50 mg/L (Figure 5a).
pH seems to have a slight effect on the adsorption of SO onto Alg-PP. The percent of SO removal increased from 68 % to 85 % when the pH changed from 2 to 10. It is observed that maximum dye removal occurs at pH 10. Moreover, even at the lowest pH, the R% is roughly 70% since the presence of active sites. To evaluate the effect of pH on the SO adsorption, the point of zero charge (pHpzc) of the adsorbent must be investigated (Figure 5b). The pHpzc value for the Alg-PP indicates that the surface of the beads is acidic (3.58). At pH > pHpzc = 3.58 the adsorption of cationic dyes is favored due to the presence of functional groups such as OH and the formation of electrostatic forces. The lowest SO removal percent is found in the highly acidic mediums (pH <pHpzc), due to the electrostatic repulsion between the H+ and the cationic SO. In acidic conditions, an amino group (-NH2) of safranin-O dye is protonated (pKa = 11), inhibiting the hydrogen bonds formation between SO dye and Alg-PP [51]. At higher pHs, the deprotonated form of safranin-O dye diminishes the possibility of creating a binding between dye molecules and adsorbents [52]. Due to that behavior, no higher pHs were investigated since the percentage of removal is supposed to decrease.
2.2.3. Effect of adsorbent dosage
Different dosage of Alg-PP beads were put in contact with a constant initial dye concentration of 50 mg/l to study the effect of adsorbent dosage. The % removal and adsorption capacity of dye after a contact time of 3 h are shown in Figure 6. It appeared that the % uptake increased from 58 to 95% when adsorbent dose was increased from 1 to 40 g/l, respectively. The % uptake reached a maximum value at higher adsorbent dosage. As the adsorbent dosage increases, higher number of adsorption sites are available for the adsorption, leading to improvement of dye removal. Also, with increasing adsorbent load, the quantity of dye adsorbed per weight of the adsorbent gets reduced, thus causing a decrease in qe value with increasing Alg-PP beads loading. Beyond 10 g/L, the R% of safranin-O dye may be reduced due to overcrowding of dye molecules since it is prohibited an appropriate binding between the dye groups and adsorbent [53].
2.3. Adsorption kinetics
The adsorption kinetics of SO onto the hydrogel beads were analyzed with pseudo-first-order model (equation 5) [54], pseudo-second-order model (equation 6) [55], intraparticle diffusion model (equation 7) [56] and Elovich model (equation 8) [57]:
where (mg/g) is the adsorption capacity at time (min), (mg/g) is the equilibrium adsorbent capacity, whereas (min-1), (g/mg min) and ki (mg/gmin1/2) are the rate constants of the pseudo-first-order, pseudo-second-order and intra-particle diffusion kinetic models, respectively, (mg/g) is a constant that represents the boundary layer thickness, is the initial adsorption rate in (mg/g min) and (g/mg) is the desorption constant correlated with the degree of the chemisorption surface cover and activation energy. value shows the number of sites available for adsorption while indicates the adsorption quantity. The diffusion coefficient of intraparticle diffusion , for the adsorption of SO onto PP can be calculated using the equation 9 [58]:
Where is the intraparticle diffusion coefficient (cm2 s-1), is the time required to complete half the adsorption (s) and is the beads radius (cm). If the values of Di are in the range of 10−5 to 10−13 cm2/s then intraparticle diffusion is involved as the rate-limiting step, especially for chemisorption systems [58]. Fitting of kinetics models and the derived kinetic parameters for the Alg-PP beads beads at different initial concentrations are reported in Figure 7 and Table 1. The adsorption of SO dye followed the pseudo-second-order mode while the theoretical qe,cal values were in accordance with the experimental data. This suggests the occurring of chemisorption which is considered different interactions between the dye and adsorbent functional groups.
As seen from Figure 7c, the plots of qt against t1/2 give three straight-line with different slopes and intercepts. The higher correlation coefficients R2 have been obtained for the second step (0.81-0.96). On the basis of the ki values, the rate constant related to the external surface adsorption (ki1) was the highest one. This also shows that the diffusion resistance of the boundary layer was lower than the diffusion resistance of the pore diffusion. Therefore, the adsorption kinetics may be governed by external diffusion and intra-particle diffusion at the same time [59]. The value of the pore diffusion coefficient presented in Table 1 is in the range of 10-6 to 10-8 cm2 s-1 indicating that intraparticle diffusion was involved in the adsorption process controlled by chemisorption.
2.4. Adsorption isotherm
The adsorption isotherm models allows to analyze the interactions between the adsorbent and the adsorbate. Langmuir (equation 10) [60], Freundlich [61], Temkin [62] and Dubinin-Radushkevich [63] isotherm models are used to describe the adsorption data of SO on Alg-PP.
- Langmuir isotherm model (equation 9):
Equation can be linearized into the following form (equation 11):
Where (mg L-1) is the dye concentration at equilibrium, (mg g-1) is the equilibrium adsorption capacity,(mg g-1) and (L mg-1) are the Langmuir constants.
- Freundlich isotherm model (equation 12):
Equation can be linearized (equation 13):
Whereand are explained as above, ((mg g-1)*(L mg-1)1/n) and are the isotherm constants.
- Temkin isotherm model (equation 14):
Where B=RT/bT and the Temkin constant related to sorption heat, is the binding equilibrium constant, (8.314 J mol-1 K-1) is a standard gas constant and (K) is the absolute temperature of the solution.
- Dubinin-Radushkevich isotherm model (equation 15):
Where, , and represent the gas constant (8.314 J mol-1 K-1), absolute temperature (K) and equilibrium concentration (mg L-1), respectively. (mol2 kJ-2) was calculated from the slope of the plot of versus and is determined from the intercept. The mean free energy of adsorption was calculated by using the equation 17:
The equilibrium experimental data were fitted using the above reported models and the fitting curves are reported in Figure 8. Data obtained from fitting process are reported in Table 2. Langmuir equation fits the experimental data with a high R2 ≥ 0.934. The constant b, proving a robust dye-adsorbent bonding, is 0.47 L/mg. The Freundlich isotherm, representative of an adsorption process on heterogeneous surfaces, well fits the adsorption data. The value obtained from the Freundlich model is an indicator of adsorption favorability. A value of > 1 indicate a favorable nature of adsorption [64]. 1/n gives an idea of the heterogeneity; if 1/n is close to zero a perfect heterogeneous surface is obtained. For our system the value of 1/n is 0.65. The presence of active functional groups with non-uniform distribution may result in changes in the energy level of the active sites available on the surface of Alg-PP beads. Active sites with greater energy levels create heterolayer SO compounds coverage with strong chemical bonding support, whereas active sites with lower energy levels are responsible for monolayer coverage. The high values of KF justifies the good high adsorption capacity and affinity of adsorbent for SO. Temkin and Halsey models didn’t fit the data with good reliability (low R2). They deviated from linearity, so they are not reliable in describing adsorption data. Moreover, the value of was found to be 1.77 kJ mol-1. The value of is very useful in determining the type of adsorption: if the value is < 8 kJ.mol-1, then the adsorption is physical in nature, while if it is between 8 kJ mol-1 and 16 kJ mol-1, then the adsorption is due to ion exchange [65]. In this study, the value was found to be < 8 kJ mol-1, so the adsorption possesses a physical nature.
2.5. Thermodynamic study
Free energy change (equation 18), enthalpy change (equation 19), and entropy change (equation 20) for SO adsorption on Alg-PP beads were evaluated using the equation reported hereinafter [66].
where is the thermodynamic equilibrium constant at temperature (K) and (L g-1) is calculated by using equation 21:
where is defined as the adsorption affinity [67]. The ln(Kd) was plotted against 1/T (Figure 9):
The thermodynamic values are reported in Table 3.
The values of ΔG<0 proved the presence of a spontaneous process [49]. The positive enthalpy of the adsorption process at different temperatures indicates that the adsorption of SO on Alg-PP sample is endothermic. So, higher temperature contributed to increase in the activity of the adsorbent and the kinetic energy of the adsorbate, leading to higher removal efficiencies [68]. The ΔS>0 demonstrates that the process is irreversible with an increasing system disorder and randomness at the solid-liquid interface [69,70]. Finally, Van der Waals interactions and electrostatic interactions take part in the adsorption process if the enthalpy value lies within 20 kJ/mol [71]. Hydrogen bonding also should be taken into account if values lie inside 25 kJ/mol [72].
2.6. Diffusion coefficients evaluation
For a spherical system, the total amount of dye adsorbed can be calculated by equation 22 [73]:
Where M,t is the amount of dye adsorbed at time t, M,∞ is the equilibrium amount of dye, R is the bead radiuswhile D is the diffusion coefficient. For small times, the equation can be written as equation 23:
The diffusion coefficient D (cm2/s) are reported in Table 4 as function of T and pH:
Empirical models were reported to find a correlation between D and either pH or temperature. Figure 10a reports the diffusion coefficient versus H+ concentration:
A power-law model was proposed to correlate the diffusion coefficient to the H+ concentration (equation 24).
The model forecasts the effect of H+ onto diffusion. of diffusion. As far as Figure 10b concerns, diffusion coefficient D (cm2/s) as a function of T is represented. Besides, an Arrhenius like equation (equation 25) was used (equation 25):
Where A is the pre-exponential factor, R is the universal gas constant, Ea represents the activation energy, T is the absolute temperature. The activation energy (Ea) was equal to 7.67 kJ/mol. These results suggest that the diffusion coefficient is thermally activated or H+ dependent.
2.7. Mass transfer analysis
Adsorption data were modeled through the McKay model to investigate whether the adsorption process is controlled by liquid film diffusion (equation 26) [74]:
where Ci (mg/L), Ct (mg/L), and m (g/L) are the initial dye concentration, the concentration at the time t, and mass/volume ratio, respectively. Kbp is McKay constant, obtained by multiplying qmax and b (Langmuir constant). The mass transfer coefficient is β2 and specific surface per unit volume is Ss. The linearized McKay model allowed to obtain the data reported in Figure 11:
From the plot, β*Ss is calculated and shown in Table 5.
The R2 coefficients confirm that the McKay model is not appropriate to fully describe the investigated phenomena. So, the liquid diffusion is not the main rate limiting step.
2.8. Bangham's and Burt model
Beside, pore diffusion can be the rate-controlled mechanism. The Bangaram and Burt models can determine if the adsorption process is controlled by pore diffusion [75]. Equation 27 represents the Bangham's and Burt model in lineried model:
where Ci (mg/L), m(g), V (L), and qt (mg/g) represent the initial dye concentration (mg/L), mass of adsorbent, volume and adsorption capacity at time t, respectively. α2 and kb are constants. Figure 12 reports the linear plots for SO concentrations ranging from 10 to 300 mg/L.
Table 6 reports the model constants and R2 coefficient. According to R2 values, the diffusion of SO molecules into pores of adsorbent beads can be considered the major rate-controlling step, even if different phenomena are supposed to occur.
3. Mechanism of adsorption
The FTIR spectra shown in Figure 13 are studied for proposing the adsorption mechanisms (Figure 14). For Alg-PP (SO loaded) a peak at 3270 cm-1 indicates the presence of hydroxyl (O-H) streching vibrations [42], while for Alg-PP there were no broad peaks. C-H streching of CH2 assigned to the peak located at 2911 cm-1 and 2850 cm-1 are still present. The spectra showed a long band at 2356 cm-1 which indicates the C ≡ C stretching of alkyne group [43]. The observed peak at 1710 cm-1 in PP spectra corresponds to the C=O streching of the aldehydes, ketones and carbonyl groups. The small peak disappeared for Alg-PP sample. The peak 1514 cm-1 in PP and Alg-PP spectra is representing the cellulosic compounds present in the biomaterial [45]. This peak disappeared after SO adsorption indicating that the SO dye reacted with the PP powder presented in the beads which confirmed that the adsorption nature of SO onto Alg-PP is chemical.
The safranin-O dye is a cationic dye able to interacts with lignin, cellulose, hemicellulose, [76]. The free electron pairs of carbonyl oxygen can bind the SO molecule. Electrostatic interactions between cationic SO dye and polar negative groups of adsorbent are supposed to occur. Non-covalent, weak interactions such as van der Waals forces and π-π interaction are established between aromatic rings of safranin-O dyes and hemicellulose, lignin, cellulose [77]. The possible physical forces involve: (1) diffusion into pore, (2) H-bonding involving carboxyl and hydroxyl groups bonded directly to a N atom of an −NH2 group; (3) π-π interactions; and (4) π+-π interaction, bonding between N+ of the dye and the aromatic rings of the adsorbent.
4. Conclusion
Peels of pomegranate fruit-based hydrogel beads (Alg-PP) were successfully produced in this study. The adsorption of SO cationic dye on Alg-PP beads was mainly affected by adsorption time, Alg-PP dosage, initial SO concentration and slightly affected by initial pH of SO solution. The dynamic adsorption behavior of SO onto Alg-PP can be represented well by the pseudo-second-order model. Adsorption data obeyed Freundlich adsorption isotherm very well with qm value of 8.99 mg/g. The positive value of ΔH indicated the endothermic nature of adsorption, and the negative value of ΔG showed the feasibility, and spontaneity of SO adsorption on Alg-PP beads. An adsorption mechanism was proposed by considering the chemical and physical phenomena which are supposed to occur. Overall, the hydrogel beads synthesized in this study have effectiveness and can be applied to the removal of cationic dyes in wastewater treatment.
Author Contributions
Conceptualization, S.A. (Sihem ARRIS) and A.A. (Amina Abbaz); methodology, A.A. (Amina Abbaz) and S.A.; investigation, A.A. (Amina Abbaz) and A.A. (Asma Ayat) and A.H. and Y.B.; data curation, A.A. (Amina Abbaz) and S.A. and G.V.; writing—original draft preparation, A.A. (Amina Abbaz); writing—review and editing, A.A. (Amina Abbaz) and S.A. and G.V.; supervision, S.A.; project administration, S.A. All authors have read and agreed to the published version of the manuscript.
Funding
Not applicable.
Institutional Review Board Statement
Not applicable.
Informed Consent Statement
Not applicable.
Data Availability Statement
Data is available upon request.
Conflicts of Interest
The authors declare no conflict of interest.
References
- Rivera-Arenas, D.; Macías-Quiroga, I.F.; Dávila-Arias, M.T.; Vélez-Upegui, J.J.; Sanabria-González, N.R. Adsorption of Acid Yellow 23 Dye on Organobentonite/Alginate Hydrogel Beads in a Fixed-Bed Column. Journal of Composites Science 2023, 7, 362. [Google Scholar] [CrossRef]
- Namasivayam, C.; Radhika, R.; Suba, S. Uptake of Dyes by a Promising Locally Available Agricultural Solid Waste: Coir Pith. Waste Management 2001, 21, 381–387. [Google Scholar] [CrossRef]
- Moawed, E.A.; Abulkibash, A.B. Selective Separation of Light Green and Safranin O from Aqueous Solution Using Salvadora Persica (Miswak) Powder as a New Biosorbent. Journal of Saudi Chemical Society 2016, 20, S178–S185. [Google Scholar] [CrossRef]
- Asfaram, A.; Ghaedi, M.; Goudarzi, A.; Rajabi, M. Response Surface Methodology Approach for Optimization of Simultaneous Dye and Metal Ion Ultrasound-Assisted Adsorption onto Mn Doped Fe3O4-NPs Loaded on AC: Kinetic and Isothermal Studies. Dalton Transactions 2015, 44, 14707–14723. [Google Scholar] [CrossRef]
- Fayazi, M.; Afzali, D.; Taher, M.A.; Mostafavi, A.; Gupta, V.K. Removal of Safranin Dye from Aqueous Solution Using Magnetic Mesoporous Clay: Optimization Study. J Mol Liq 2015, 212, 675–685. [Google Scholar] [CrossRef]
- Shao, L.; Cheng, X.Q.; Liu, Y.; Quan, S.; Ma, J.; Zhao, S.Z.; Wang, K.Y. Newly Developed Nanofiltration (NF) Composite Membranes by Interfacial Polymerization for Safranin O and Aniline Blue Removal. J Memb Sci 2013, 430, 96–105. [Google Scholar] [CrossRef]
- Sharma, G.; Gupta, V.K.; Agarwal, S.; Kumar, A.; Thakur, S.; Pathania, D. Fabrication and Characterization of Fe@ MoPO Nanoparticles: Ion Exchange Behavior and Photocatalytic Activity against Malachite Green. J Mol Liq 2016, 219, 1137–1143. [Google Scholar] [CrossRef]
- Ayat, A.; Arris, S.; Abbaz, A.; Aissaoui, H. The Removal of Methylene Blue and COD by Coagulation Using Cactus. Algerian Journal of Engineering Research 2022, 5, 1–6. [Google Scholar]
- Bayat, M.; Javanbakht, V.; Esmaili, J. Synthesis of Zeolite/Nickel Ferrite/Sodium Alginate Bionanocomposite via a Co-Precipitation Technique for Efficient Removal of Water-Soluble Methylene Blue Dye. Int J Biol Macromol 2018, 116, 607–619. [Google Scholar] [CrossRef] [PubMed]
- Hashim, K.S.; Al-Saati, N.H.; Alquzweeni, S.S.; Zubaidi, S.L.; Kot, P.; Kraidi, L.; Hussein, A.H.; Alkhaddar, R.; Shaw, A.; Alwash, R. Decolourization of Dye Solutions by Electrocoagulation: An Investigation of the Effect of Operational Parameters. In Proceedings of the IOP Conference Series: Materials Science and Engineering; IOP Publishing, 2019; Vol. 584, p. 012024. [Google Scholar]
- Kumar, M.; Tamilarasan, R.; Sivakumar, V. Adsorption of Victoria Blue by Carbon/Ba/Alginate Beads: Kinetics, Thermodynamics and Isotherm Studies. Carbohydr Polym 2013, 98, 505–513. [Google Scholar] [CrossRef] [PubMed]
- Nasrullah, A.; Bhat, A.H.; Naeem, A.; Isa, M.H.; Danish, M. High Surface Area Mesoporous Activated Carbon-Alginate Beads for Efficient Removal of Methylene Blue. Int J Biol Macromol 2018, 107, 1792–1799. [Google Scholar] [CrossRef]
- Rocher, V.; Bee, A.; Siaugue, J.-M.; Cabuil, V. Dye Removal from Aqueous Solution by Magnetic Alginate Beads Crosslinked with Epichlorohydrin. J Hazard Mater 2010, 178, 434–439. [Google Scholar] [CrossRef] [PubMed]
- Liu, L.; Wan, Y.; Xie, Y.; Zhai, R.; Zhang, B.; Liu, J. The Removal of Dye from Aqueous Solution Using Alginate-Halloysite Nanotube Beads. Chemical Engineering Journal 2012, 187, 210–216. [Google Scholar] [CrossRef]
- Rafatullah, M.; Sulaiman, O.; Hashim, R.; Ahmad, A. Adsorption of Methylene Blue on Low-Cost Adsorbents: A Review. J Hazard Mater 2010, 177, 70–80. [Google Scholar] [CrossRef] [PubMed]
- Sun, L.; Chen, D.; Wan, S.; Yu, Z. Performance, Kinetics, and Equilibrium of Methylene Blue Adsorption on Biochar Derived from Eucalyptus Saw Dust Modified with Citric, Tartaric, and Acetic Acids. Bioresour Technol 2015, 198, 300–308. [Google Scholar] [CrossRef] [PubMed]
- Ali, R.M.; Hamad, H.A.; Hussein, M.M.; Malash, G.F. Potential of Using Green Adsorbent of Heavy Metal Removal from Aqueous Solutions: Adsorption Kinetics, Isotherm, Thermodynamic, Mechanism and Economic Analysis. Ecol Eng 2016, 91, 317–332. [Google Scholar] [CrossRef]
- Fathy, N.A.; El-Shafey, O.I.; Khalil, L.B. Effectiveness of Alkali-Acid Treatment in Enhancement the Adsorption Capacity for Rice Straw: The Removal of Methylene Blue Dye. ISRN physical chemistry 2013, 2013, 1–15. [Google Scholar] [CrossRef]
- Arris, S.; Abbaz, I.; Kassir, M.; Abbaz, A.; Ayat, A.; Bencheikh Lehocine, M. Optimization of Phenol Sorption in Aqueous Solution by Date Stone through Response Surface Methodology. Algerian Journal of Engineering Research 2022, 5, 28–34. [Google Scholar]
- Tang, Y.; Lin, T.; Jiang, C.; Zhao, Y.; Ai, S. Renewable Adsorbents from Carboxylate-Modified Agro-Forestry Residues for Efficient Removal of Methylene Blue Dye. Journal of Physics and Chemistry of Solids 2021, 149, 109811. [Google Scholar] [CrossRef]
- Viscusi, G.; Lamberti, E.; Gorrasi, G. Hemp Fibers Modified with Graphite Oxide as Green and Efficient Solution for Water Remediation: Application to Methylene Blue. Chemosphere 2021, 132614. [Google Scholar] [CrossRef]
- Chaukura, N.; Murimba, E.C.; Gwenzi, W. Synthesis, Characterisation and Methyl Orange Adsorption Capacity of Ferric Oxide–Biochar Nano-Composites Derived from Pulp and Paper Sludge. Appl Water Sci 2017, 7, 2175–2186. [Google Scholar] [CrossRef]
- Deng, H.; Lu, J.; Li, G.; Zhang, G.; Wang, X. Adsorption of Methylene Blue on Adsorbent Materials Produced from Cotton Stalk. Chemical engineering journal 2011, 172, 326–334. [Google Scholar] [CrossRef]
- Chikri, R.; Elhadiri, N.; Benchanaa, M.; Maguana, Y. Efficiency of Sawdust as Low-Cost Adsorbent for Dyes Removal. J Chem 2020, 2020, 1–17. [Google Scholar] [CrossRef]
- Velmurugan, P.; Rathinakumar, V.; Dhinakaran, G. Dye Removal from Aqueous Solution Using Low Cost Adsorbent. Int J Environ Sci 2011, 1, 1492–1503. [Google Scholar]
- Ferrero, F. Dye Removal by Low Cost Adsorbents: Hazelnut Shells in Comparison with Wood Sawdust. J Hazard Mater 2007, 142, 144–152. [Google Scholar] [CrossRef] [PubMed]
- Ayat, A.; Arris, S.; Abbaz, A.; Bencheikh-Lehocine, M.; Meniai, A.H. Application of Response Surface Methodology for Modeling and Optimization of a Bio Coagulation Process (Sewage Wastewater Treatment Plant). Environ Manage 2021, 67, 489–497. [Google Scholar] [CrossRef] [PubMed]
- Viscusi, G.; Lamberti, E.; Gorrasi, G. Design of Sodium Alginate/Soybean Extract Beads Loaded with Hemp Hurd and Halloysite as Novel and Sustainable Systems for Methylene Blue Adsorption. Polym Eng Sci 2021. [Google Scholar] [CrossRef]
- Viscusi, G.; Lamberti, E.; Gorrasi, G. Design of a Hybrid Bio-Adsorbent Based on Sodium Alginate/Halloysite/Hemp Hurd for Methylene Blue Dye Removal: Kinetic Studies and Mathematical Modeling. Colloids Surf A Physicochem Eng Asp 2022, 633. [Google Scholar] [CrossRef]
- Bellahsen, N.; Varga, G.; Halyag, N.; Kertész, S.; Tombácz, E.; Hodúr, C. Pomegranate Peel as a New Low-Cost Adsorbent for Ammonium Removal. International Journal of Environmental Science and Technology 2021, 18, 711–722. [Google Scholar] [CrossRef]
- Hashem, A.; Aniagor, C.O.; Fikry, M.; Taha, G.M.; Badawy, S.M. Characterization and Adsorption of Raw Pomegranate Peel Powder for Lead (II) Ions Removal. J Mater Cycles Waste Manag 2023, 1–14. [Google Scholar] [CrossRef]
- Anastopoulos, I.; Kyzas, G.Z. Agricultural Peels for Dye Adsorption: A Review of Recent Literature. J Mol Liq 2014, 200, 381–389. [Google Scholar] [CrossRef]
- Lezehari, M.; Basly, J.-P.; Baudu, M.; Bouras, O. Alginate Encapsulated Pillared Clays: Removal of a Neutral/Anionic Biocide (Pentachlorophenol) and a Cationic Dye (Safranine) from Aqueous Solutions. Colloids Surf A Physicochem Eng Asp 2010, 366, 88–94. [Google Scholar] [CrossRef]
- Tezcan, F.; Günister, E.; Özen, G.; Erim, F.B. Biocomposite Films Based on Alginate and Organically Modified Clay. Int J Biol Macromol 2012, 50, 1165–1168. [Google Scholar] [CrossRef] [PubMed]
- Flores-Céspedes, F.; Villafranca-Sánchez, M.; Fernández-Pérez, M. Alginate-Bentonite-Based Hydrogels Designed to Obtain Controlled-Release Formulations of Dodecyl Acetate. Gels 2023, 9, 388. [Google Scholar] [CrossRef] [PubMed]
- Yadav, S.; Asthana, A.; Chakraborty, R.; Jain, B.; Singh, A.K.; Carabineiro, S.A.C.; Susan, M.A.B.H. Cationic Dye Removal Using Novel Magnetic/Activated Charcoal/β-Cyclodextrin/Alginate Polymer Nanocomposite. Nanomaterials 2020, 10, 170. [Google Scholar] [CrossRef] [PubMed]
- Ely, A.; Baudu, M.; Basly, J.P.; Kankou, M.O.S.A.O. Copper and Nitrophenol Pollutants Removal by Na-Montmorillonite/Alginate Microcapsules. J Hazard Mater 2009, 171, 405–409. [Google Scholar] [CrossRef] [PubMed]
- Cheng, Y.; Lu, L.; Zhang, W.; Shi, J.; Cao, Y. Reinforced Low Density Alginate-Based Aerogels: Preparation, Hydrophobic Modification and Characterization. Carbohydr Polym 2012, 88, 1093–1099. [Google Scholar] [CrossRef]
- Abdollahi, M.; Alboofetileh, M.; Rezaei, M.; Behrooz, R. Comparing Physico-Mechanical and Thermal Properties of Alginate Nanocomposite Films Reinforced with Organic and/or Inorganic Nanofillers. Food Hydrocoll 2013, 32, 416–424. [Google Scholar] [CrossRef]
- Witono, J.R.; Noordergraaf, Iw.; Heeres, H.J.; Janssen, L. Water Absorption, Retention and the Swelling Characteristics of Cassava Starch Grafted with Polyacrylic Acid. Carbohydr Polym 2014, 103, 325–332. [Google Scholar] [CrossRef] [PubMed]
- Thagira Banu, H.; Karthikeyan, P.; Meenakshi, S. Lanthanum (III) Encapsulated Chitosan-Montmorillonite Composite for the Adsorptive Removal of Phosphate Ions from Aqueous Solution. Int J Biol Macromol 2018, 112, 284–293. [Google Scholar] [CrossRef]
- Zhong, Z.-Y.; Yang, Q.; Li, X.-M.; Luo, K.; Liu, Y.; Zeng, G.-M. Preparation of Peanut Hull-Based Activated Carbon by Microwave-Induced Phosphoric Acid Activation and Its Application in Remazol Brilliant Blue R Adsorption. Ind Crops Prod 2012, 37, 178–185. [Google Scholar] [CrossRef]
- Ahmad, M.A.; Puad, N.A.A.; Bello, O.S. Kinetic, Equilibrium and Thermodynamic Studies of Synthetic Dye Removal Using Pomegranate Peel Activated Carbon Prepared by Microwave-Induced KOH Activation. Water Resour Ind 2014, 6, 18–35. [Google Scholar] [CrossRef]
- Deng, A.; Wu, S.; Hao, J.; Pan, H.; Li, M.; Gao, X. Photocatalytic Removal of Cr (VI) by Thiourea Modified Sodium Alginate/Biochar Composite Gel. Gels 2022, 8, 293. [Google Scholar] [CrossRef]
- Siddiqui, M.T.H.; Nizamuddin, S.; Mubarak, N.M.; Shirin, K.; Aijaz, M.; Hussain, M.; Baloch, H.A. Characterization and Process Optimization of Biochar Produced Using Novel Biomass, Waste Pomegranate Peel: A Response Surface Methodology Approach. Waste Biomass Valorization 2019, 10, 521–532. [Google Scholar] [CrossRef]
- Ben-Ali, S.; Jaouali, I.; Souissi-Najar, S.; Ouederni, A. Characterization and Adsorption Capacity of Raw Pomegranate Peel Biosorbent for Copper Removal. J Clean Prod 2017, 142, 3809–3821. [Google Scholar] [CrossRef]
- El-Hendawy, A.-N.A. Variation in the FTIR Spectra of a Biomass under Impregnation, Carbonization and Oxidation Conditions. J Anal Appl Pyrolysis 2006, 75, 159–166. [Google Scholar] [CrossRef]
- Li, P.; Yang, C.; Xu, X.; Miao, C.; He, T.; Jiang, B.; Wu, W. Preparation of Bio-Based Aerogel and Its Adsorption Properties for Organic Dyes. Gels 2022, 8, 755. [Google Scholar] [CrossRef] [PubMed]
- Li, H.; Liu, L.; Cui, J.; Cui, J.; Wang, F.; Zhang, F. High-Efficiency Adsorption and Regeneration of Methylene Blue and Aniline onto Activated Carbon from Waste Edible Fungus Residue and Its Possible Mechanism. RSC Adv 2020, 10, 14262–14273. [Google Scholar] [CrossRef]
- Wang, S.; Boyjoo, Y.; Choueib, A. A Comparative Study of Dye Removal Using Fly Ash Treated by Different Methods. Chemosphere 2005, 60, 1401–1407. [Google Scholar] [CrossRef]
- Azimvand, J.; Didehban, K.; Mirshokraie, S.A. Safranin-O Removal from Aqueous Solutions Using Lignin Nanoparticle-g-Polyacrylic Acid Adsorbent: Synthesis, Properties, and Application. Adsorption Science and Technology 2018, 36, 1422–1440. [Google Scholar] [CrossRef]
- Maurya, N.S.; Mittal, A.K. Removal Mechanism of Cationic Dye (Safranin O) from the Aqueous Phase by Dead Macro Fungus Biosorbent. Water Science and Technology 2013, 68, 1048–1054. [Google Scholar] [CrossRef] [PubMed]
- Azimvand, J.; Didehban, K.; Mirshokraie, S. Safranin-O Removal from Aqueous Solutions Using Lignin Nanoparticle-g-Polyacrylic Acid Adsorbent: Synthesis, Properties, and Application. Adsorption Science & Technology 2018, 36, 1422–1440. [Google Scholar] [CrossRef]
- Lagergren, S.K. About the Theory of So-Called Adsorption of Soluble Substances. Sven. Vetenskapsakad. Handingarl 1898, 24, 1–39. [Google Scholar]
- Ho, Y.-S.; McKay, G. Pseudo-Second Order Model for Sorption Processes. Process biochemistry 1999, 34, 451–465. [Google Scholar] [CrossRef]
- Weber Jr, W.J.; Morris, J.C. Kinetics of Adsorption on Carbon from Solution. Journal of the sanitary engineering division 1963, 89, 31–59. [Google Scholar] [CrossRef]
- Kumar, P.S.; Ramalingam, S.; Kirupha, S.D.; Murugesan, A.; Vidhyadevi, T.; Sivanesan, S. Adsorption Behavior of Nickel (II) onto Cashew Nut Shell: Equilibrium, Thermodynamics, Kinetics, Mechanism and Process Design. Chemical Engineering Journal 2011, 167, 122–131. [Google Scholar] [CrossRef]
- Pholosi, A.; Naidoo, E.B.; Ofomaja, A.E. Intraparticle Diffusion of Cr(VI) through Biomass and Magnetite Coated Biomass: A Comparative Kinetic and Diffusion Study. S Afr J Chem Eng 2020, 32, 39–55. [Google Scholar] [CrossRef]
- Phuong, D.T.M.; Loc, N.X. Rice Straw Biochar and Magnetic Rice Straw Biochar for Safranin O Adsorption from Aqueous Solution. Water (Switzerland) 2022, 14, 186. [Google Scholar] [CrossRef]
- Langmuir, I. The Adsorption of Gases on Plane Surfaces of Glass, Mica and Platinum. J Am Chem Soc 1918, 40, 1361–1403. [Google Scholar] [CrossRef]
- Freundlich, H.M.F. Over the Adsorption in Solution. J. Phys. chem 1906, 57, 1100–1107. [Google Scholar]
- Temkin, M.I. Kinetics of Ammonia Synthesis on Promoted Iron Catalysts. Acta physiochim. URSS 1940, 12, 327–356. [Google Scholar]
- Dubinin, M.M. The Equation of the Characteristic Curve of Activated Charcoal. In Proceedings of the Dokl. Akad. Nauk. SSSR; 1947; Vol. 55, pp. 327–329. [Google Scholar]
- Wang, L.; Zhang, J.; Zhao, R.; Li, Y.; Li, C.; Zhang, C. Adsorption of Pb (II) on Activated Carbon Prepared from Polygonum Orientale Linn.: Kinetics, Isotherms, PH, and Ionic Strength Studies. Bioresour Technol 2010, 101, 5808–5814. [Google Scholar] [CrossRef]
- Kundu, S.; Gupta, A.K. Arsenic Adsorption onto Iron Oxide-Coated Cement (IOCC): Regression Analysis of Equilibrium Data with Several Isotherm Models and Their Optimization. Chemical Engineering Journal 2006, 122, 93–106. [Google Scholar] [CrossRef]
- Andersson, K.I.; Eriksson, M.; Norgren, M. Removal of Lignin from Wastewater Generated by Mechanical Pulping Using Activated Charcoal and Fly Ash: Adsorption Isotherms and Thermodynamics. Ind Eng Chem Res 2011, 50, 7722–7732. [Google Scholar] [CrossRef]
- Bhattacharya, K.G.; Sharma, A. Kinetics and Thermodynamics of Methylene Blue Adsorption on Neem (Azadirachta Indica) Leaf Powder. Dyes and Pigments 2005, 65, 51–59. [Google Scholar] [CrossRef]
- Oladipo, A.A.; Ifebajo, A.O. Highly Efficient Magnetic Chicken Bone Biochar for Removal of Tetracycline and Fluorescent Dye from Wastewater: Two-Stage Adsorber Analysis. J Environ Manage 2018, 209, 9–16. [Google Scholar] [CrossRef]
- Guinee, T.P.; Feeney, E.P.; Auty, M.A.E.; Fox, P.F. Effect of PH and Calcium Concentration on Some Textural and Functional Properties of Mozzarella Cheese. J Dairy Sci 2002, 85, 1655–1669. [Google Scholar] [CrossRef]
- Fan, S.; Wang, Y.; Wang, Z.; Tang, J.; Tang, J.; Li, X. Removal of Methylene Blue from Aqueous Solution by Sewage Sludge-Derived Biochar: Adsorption Kinetics, Equilibrium, Thermodynamics and Mechanism. J Environ Chem Eng 2017, 5, 601–611. [Google Scholar] [CrossRef]
- Ghosh, I.; Kar, S.; Chatterjee, T.; Bar, N.; Das, S.K. Adsorptive Removal of Safranin-O Dye from Aqueous Medium Using Coconut Coir and Its Acid-Treated Forms: Adsorption Study, Scale-up Design, MPR and GA-ANN Modeling. Sustain Chem Pharm 2021, 19, 100374. [Google Scholar] [CrossRef]
- Sun, C.L.; Wang, C.S. Estimation on the Intramolecular Hydrogen-Bonding Energies in Proteins and Peptides by the Analytic Potential Energy Function. Journal of Molecular Structure: THEOCHEM 2010, 956, 38–43. [Google Scholar] [CrossRef]
- Crank, J. The Mathematics of Diffusion, 2nd ed.; Clarendon Press, 1979; ISBN 3804204422. [Google Scholar]
- McKay, G.; Otterburn, M.S.; Sweeney, A.G. Surface Mass Transfer Processes during Colour Removal from Effluent Using Silica. Water Res 1981, 15, 327–331. [Google Scholar] [CrossRef]
- Mehmood, A.; Bano, S.; Fahim, A.; Parveen, R.; Khurshid, S. Efficient Removal of Crystal Violet and Eosin B from Aqueous Solution Using Syzygium Cumini Leaves: A Comparative Study of Acidic and Basic Dyes on a Single Adsorbent. Korean Journal of Chemical Engineering 2015, 32, 882–895. [Google Scholar] [CrossRef]
- Ghosh, I.; Kar, S.; Chatterjee, T.; Bar, N.; Das, S.K. Adsorptive Removal of Safranin-O Dye from Aqueous Medium Using Coconut Coir and Its Acid-Treated Forms: Adsorption Study, Scale-up Design, MPR and GA-ANN Modeling. Sustain Chem Pharm 2021, 19, 100374. [Google Scholar] [CrossRef]
- Liu, L.; Gao, Z.Y.; Su, X.P.; Chen, X.; Jiang, L.; Yao, J.M. Adsorption Removal of Dyes from Single and Binary Solutions Using a Cellulose-Based Bioadsorbent. ACS Sustain Chem Eng 2015, 3, 432–442. [Google Scholar] [CrossRef]
Figure 1.
Molecular structure of Safranin O dye.
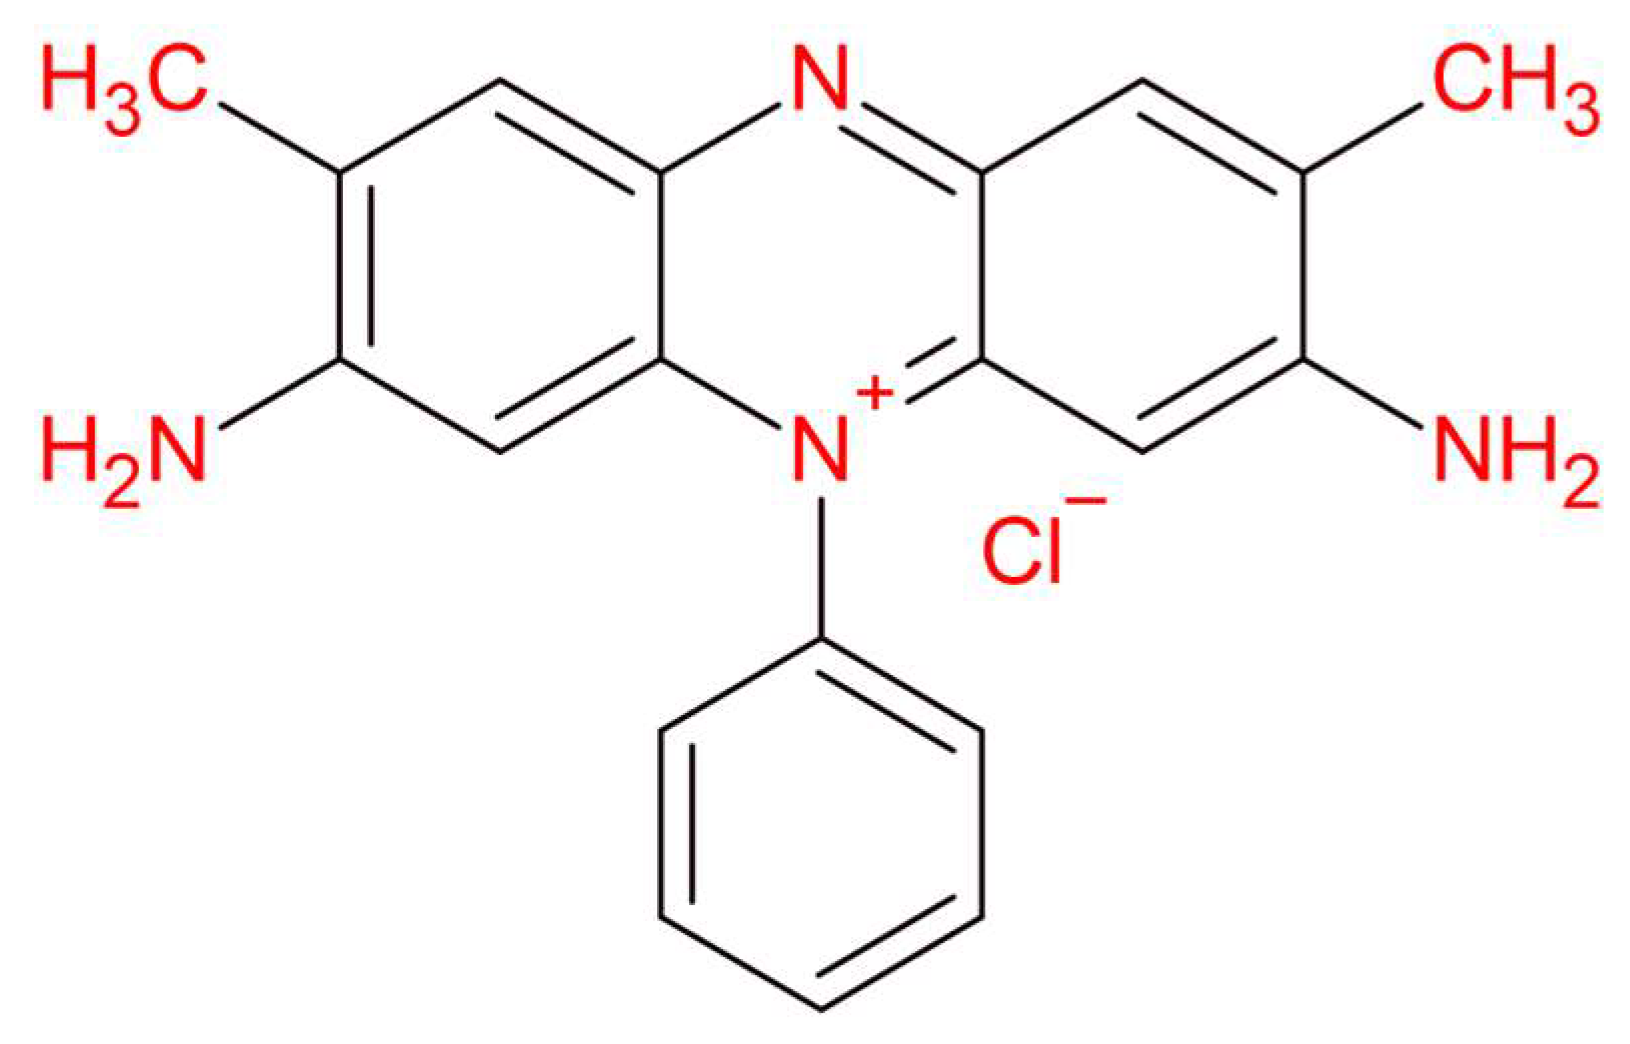
Figure 2.
Photographs of wet pure Alg beads (a), dried pure Alg beads (b), wet Alg-PP beads (c), dried Alg-PP (d), size distribution (diameter) of the dried Alg-PP beads (e).
Figure 2.
Photographs of wet pure Alg beads (a), dried pure Alg beads (b), wet Alg-PP beads (c), dried Alg-PP (d), size distribution (diameter) of the dried Alg-PP beads (e).
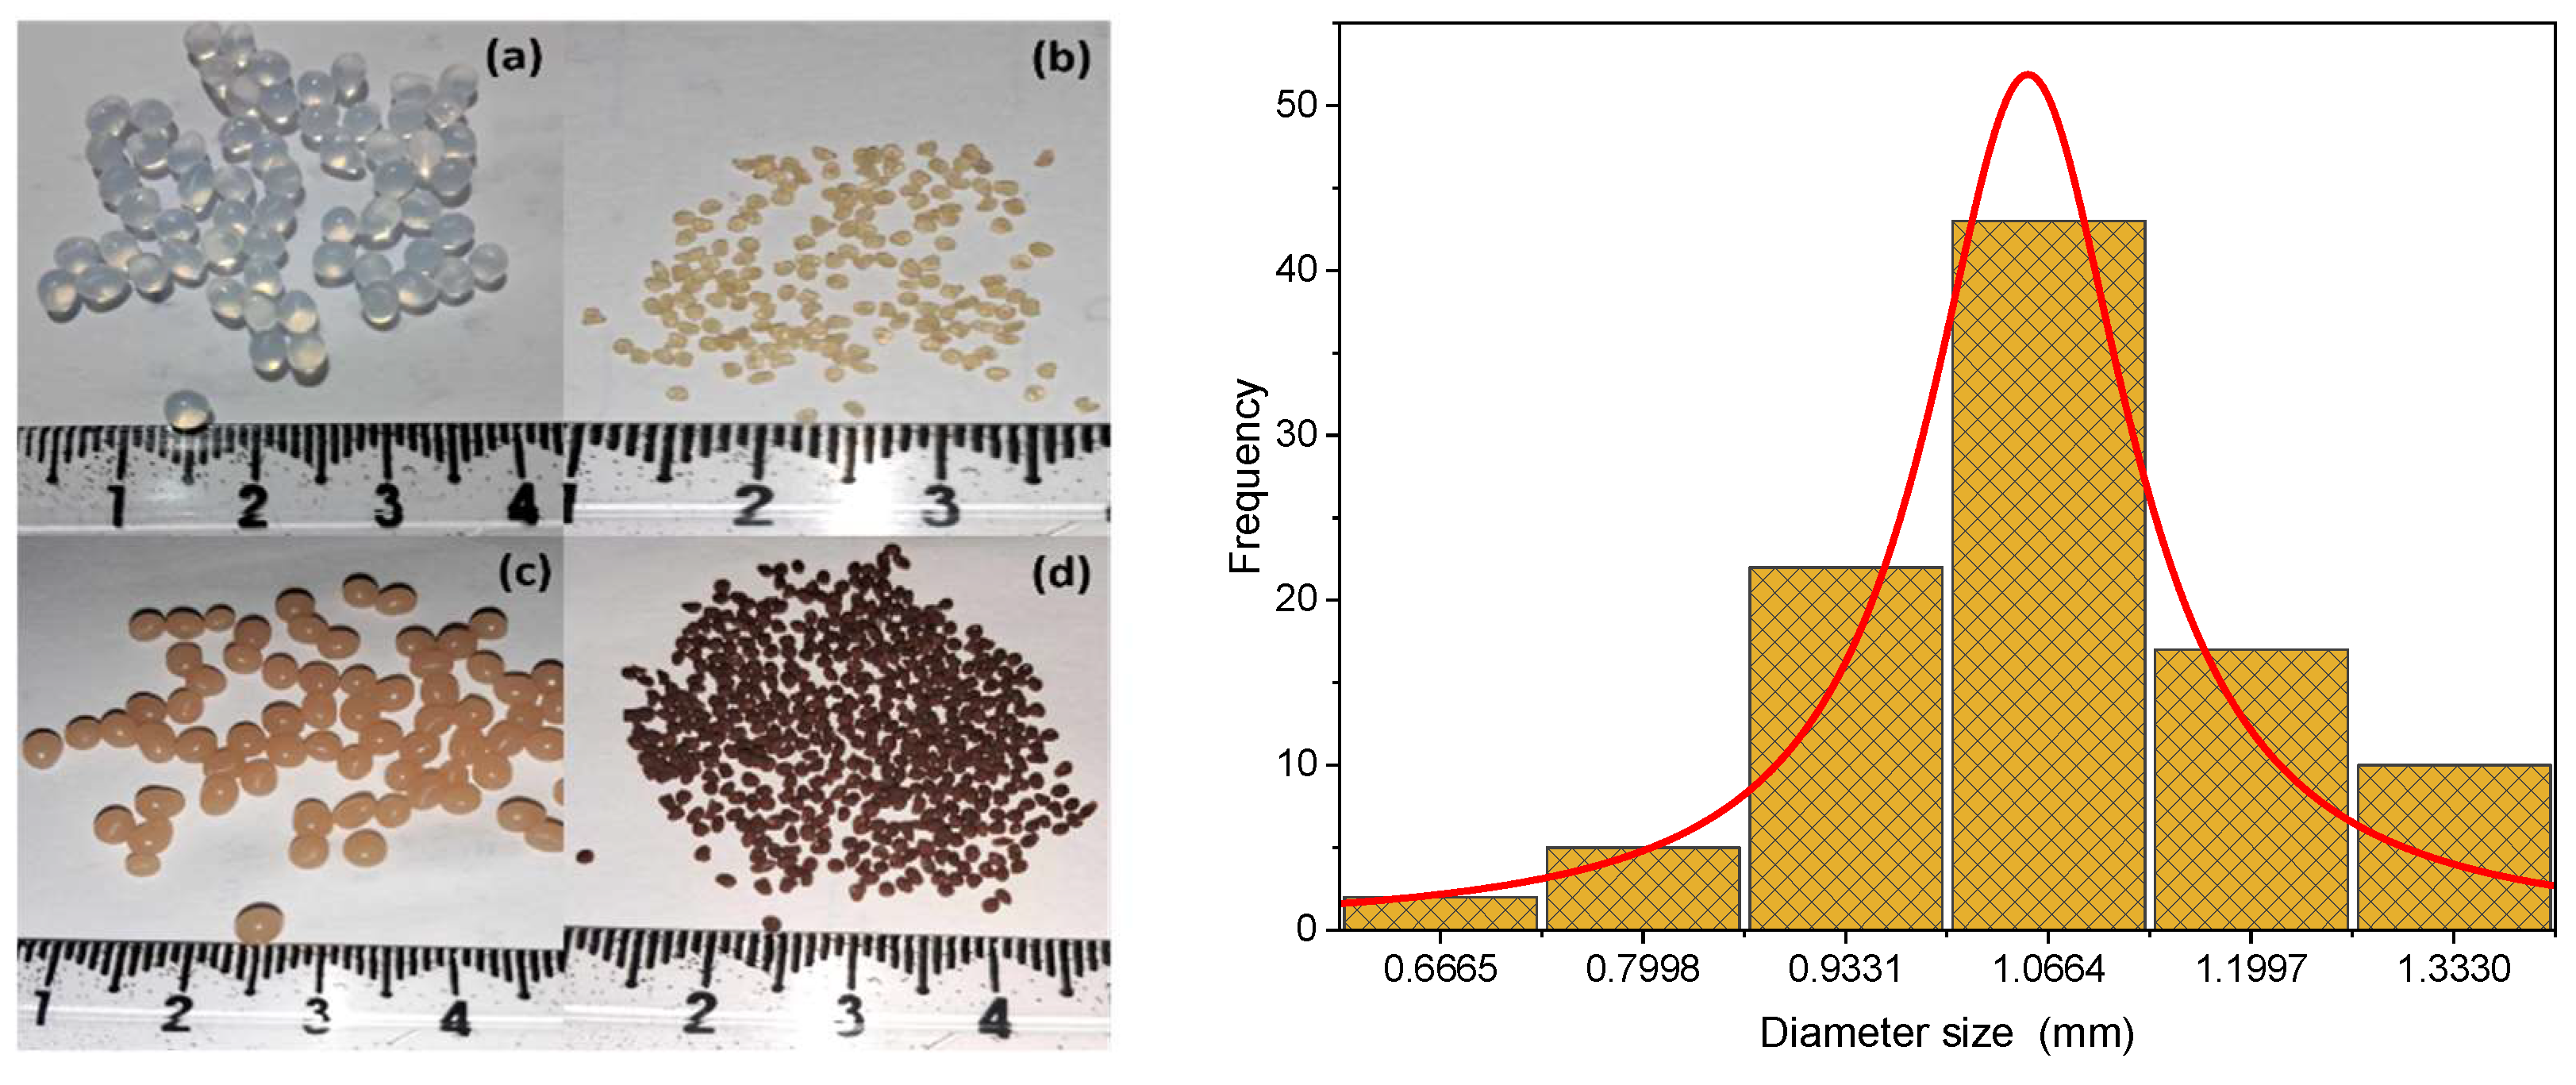
Figure 3.
FTIR spectra of PP, Alg and Alg-PP.
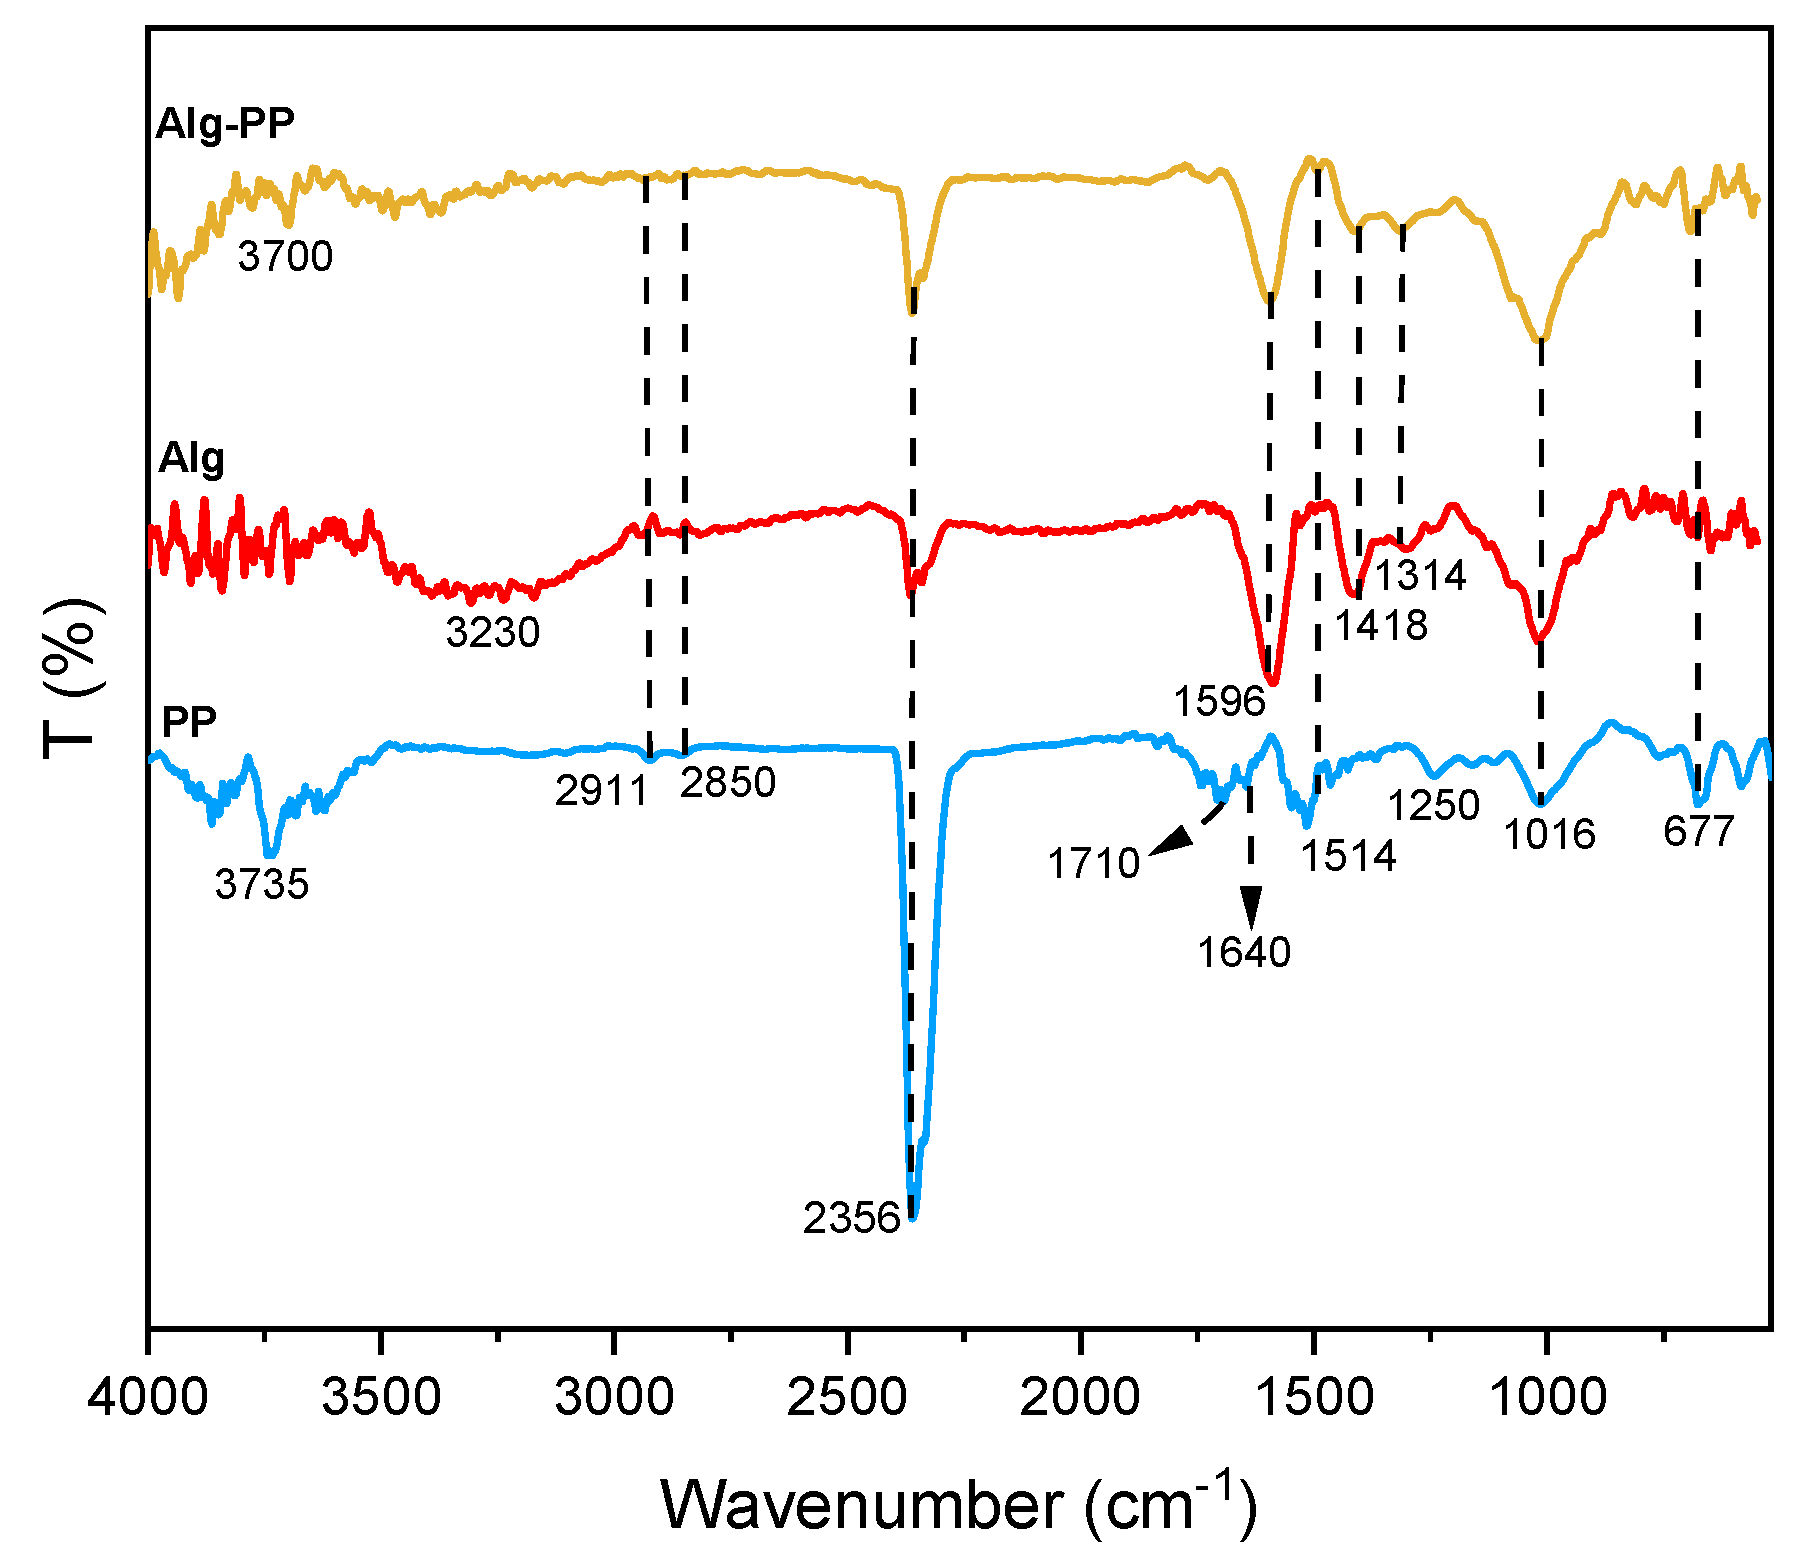
Figure 4.
Effect of contact time on adsorption capacity.
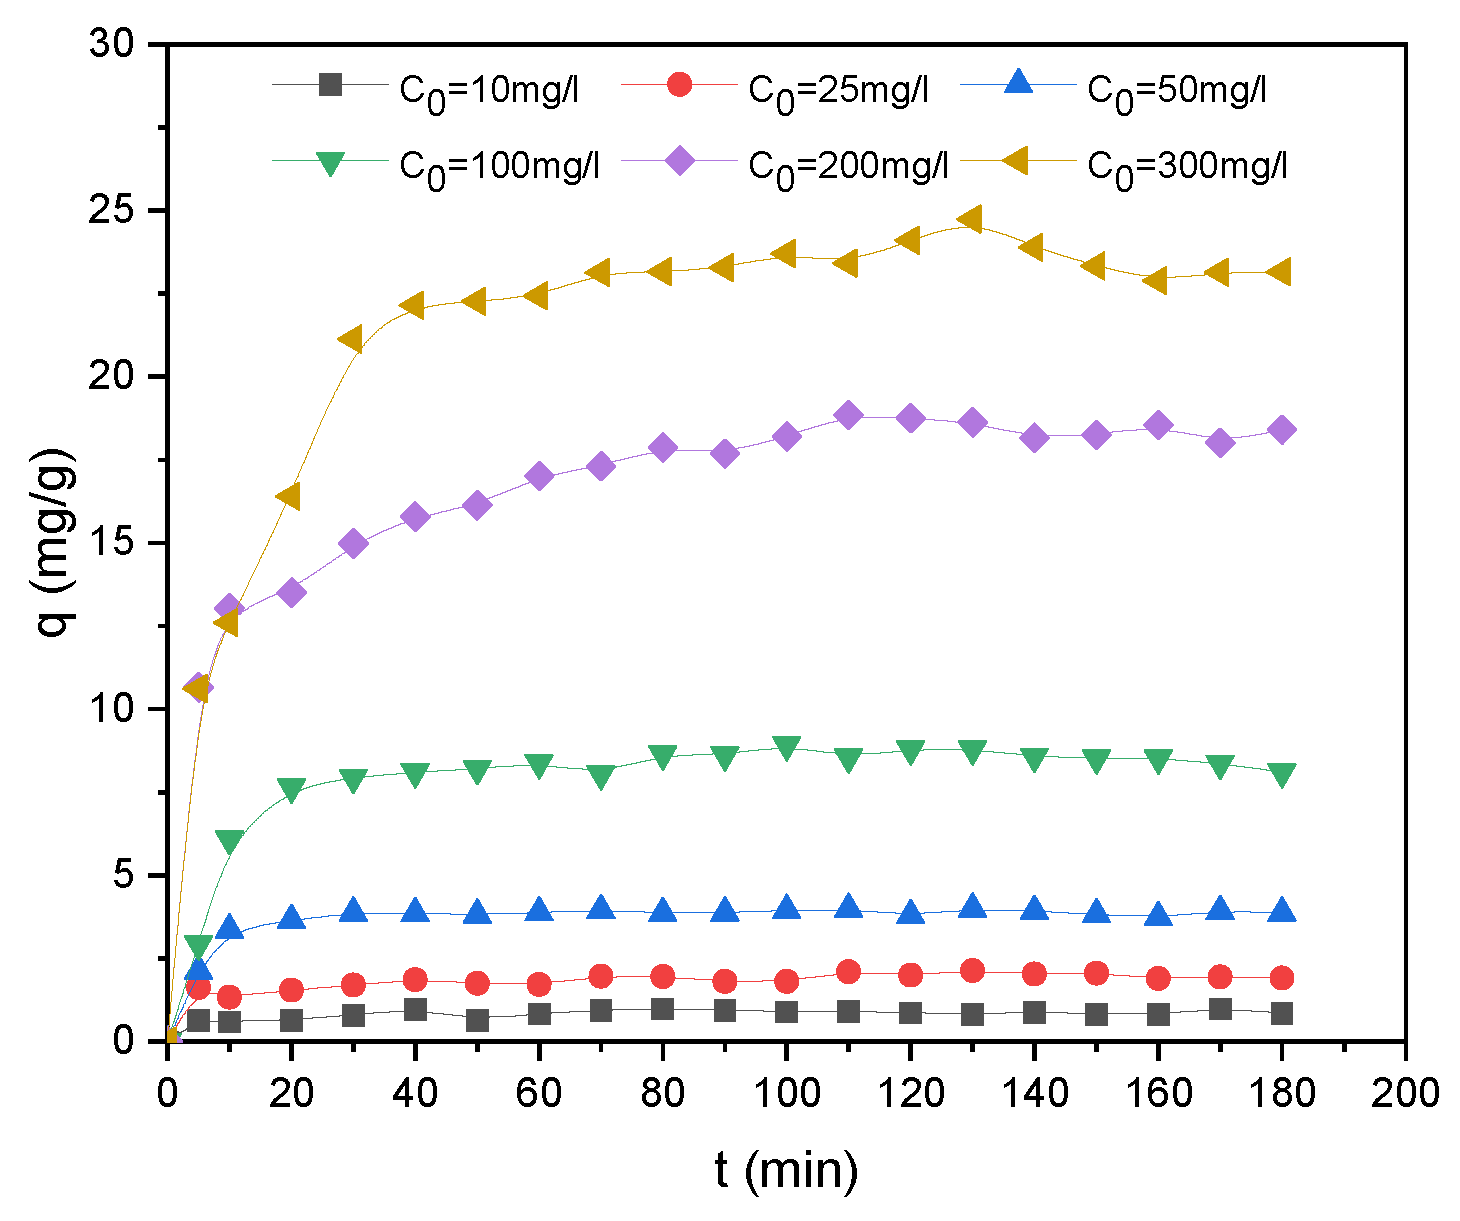
Figure 5.
a) Effect of the initial pH on the removal of SO; b) the point of zero charge of Alg/PP beads.
Figure 5.
a) Effect of the initial pH on the removal of SO; b) the point of zero charge of Alg/PP beads.
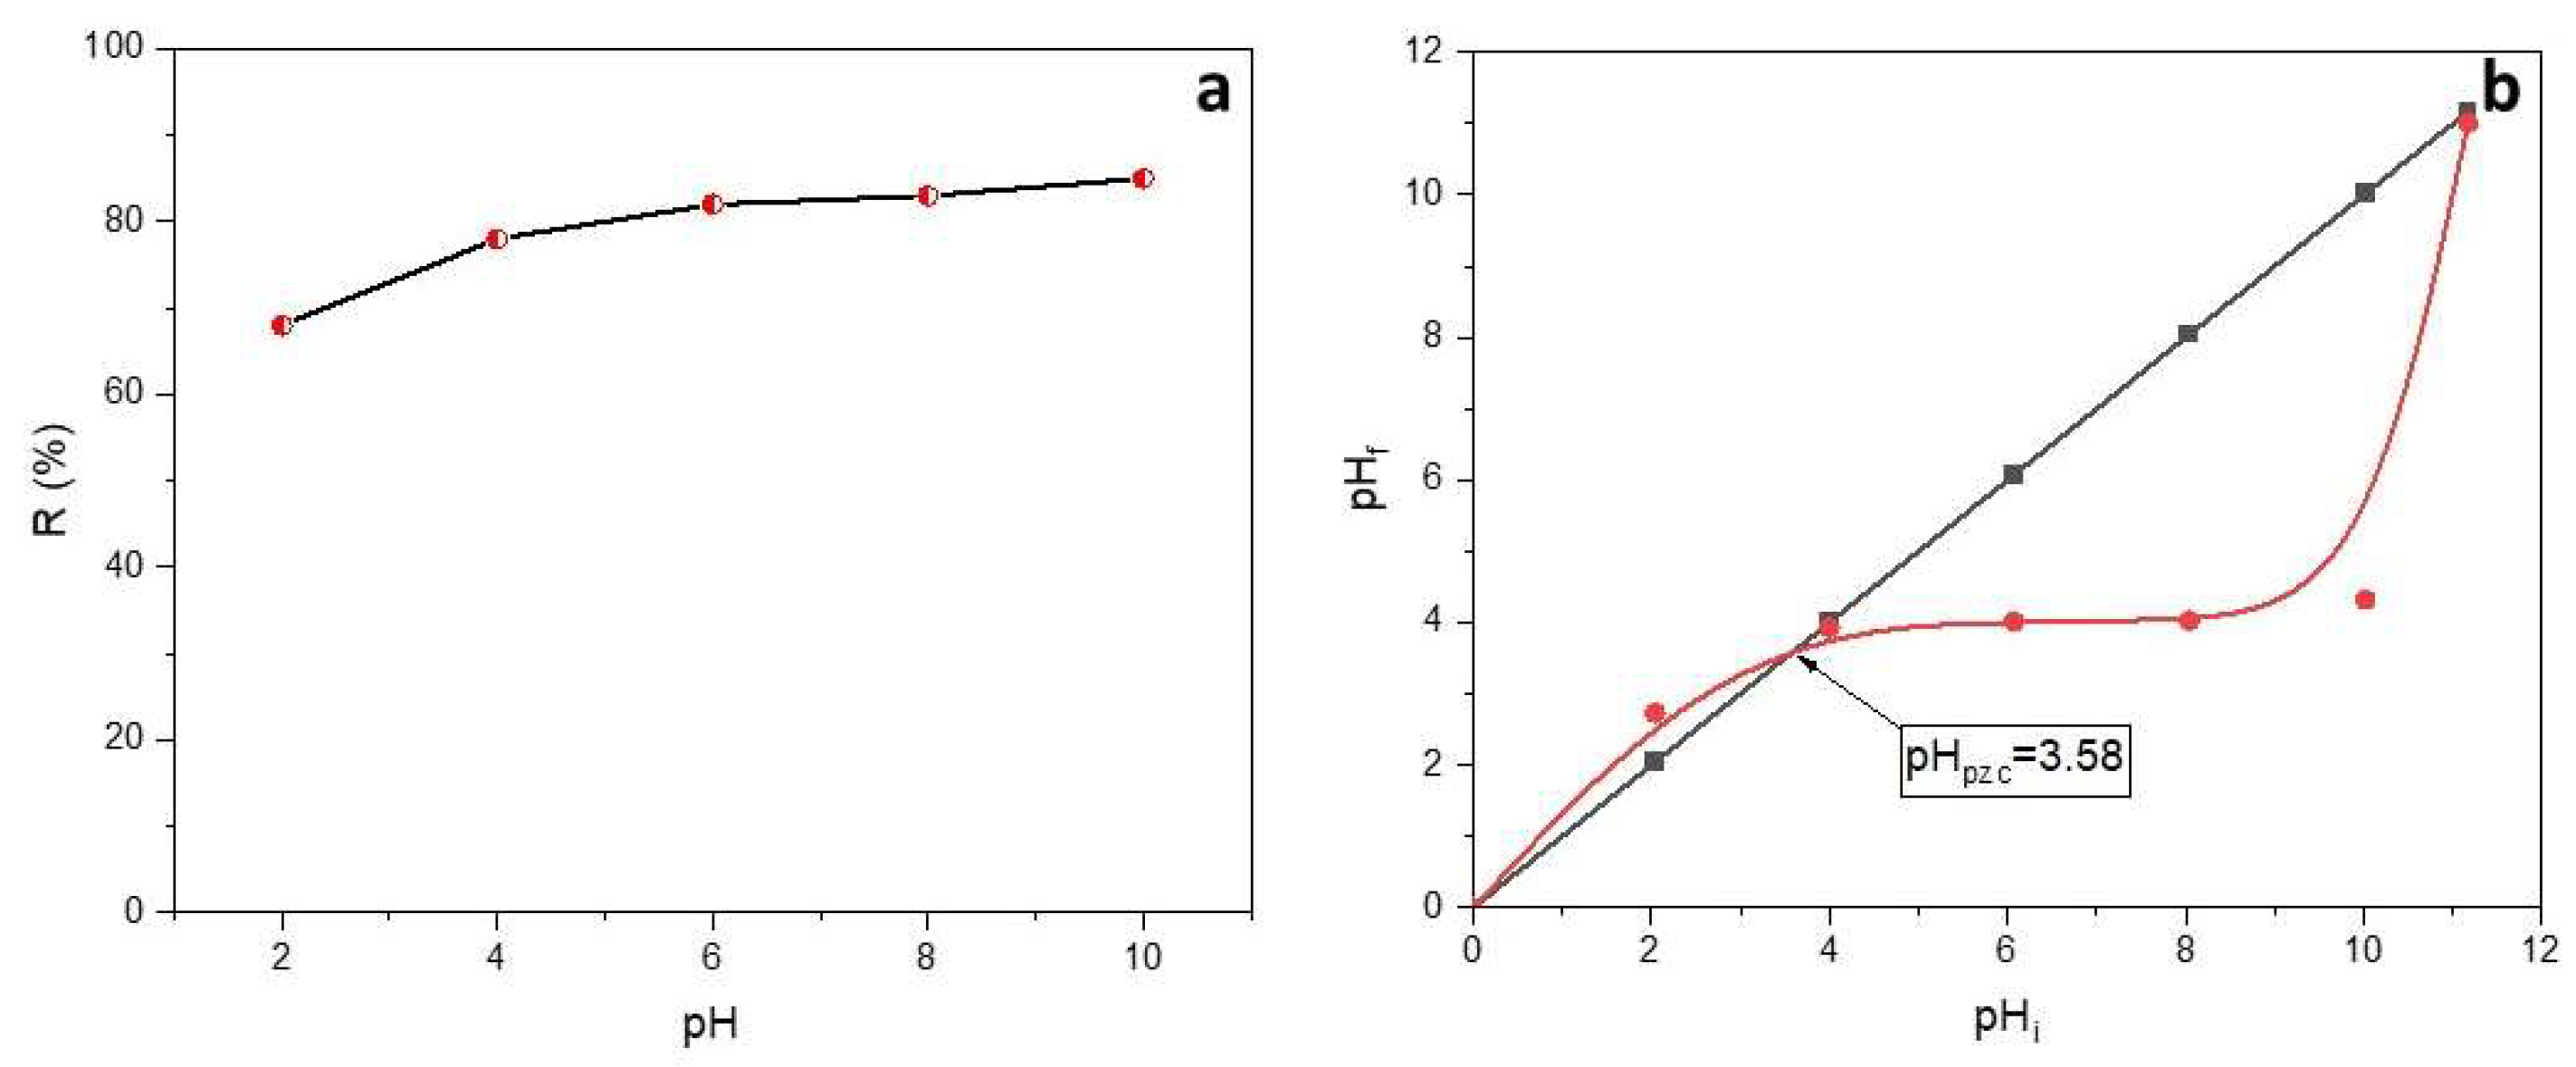
Figure 6.
Effect of adsorbent amount on the capacity and the removal of SO adsorption.

Figure 7.
Fitting of pseudo-first-order (a), pseudo-second-order (b), intraparticle diffusion (c) and Elovich (d).
Figure 7.
Fitting of pseudo-first-order (a), pseudo-second-order (b), intraparticle diffusion (c) and Elovich (d).
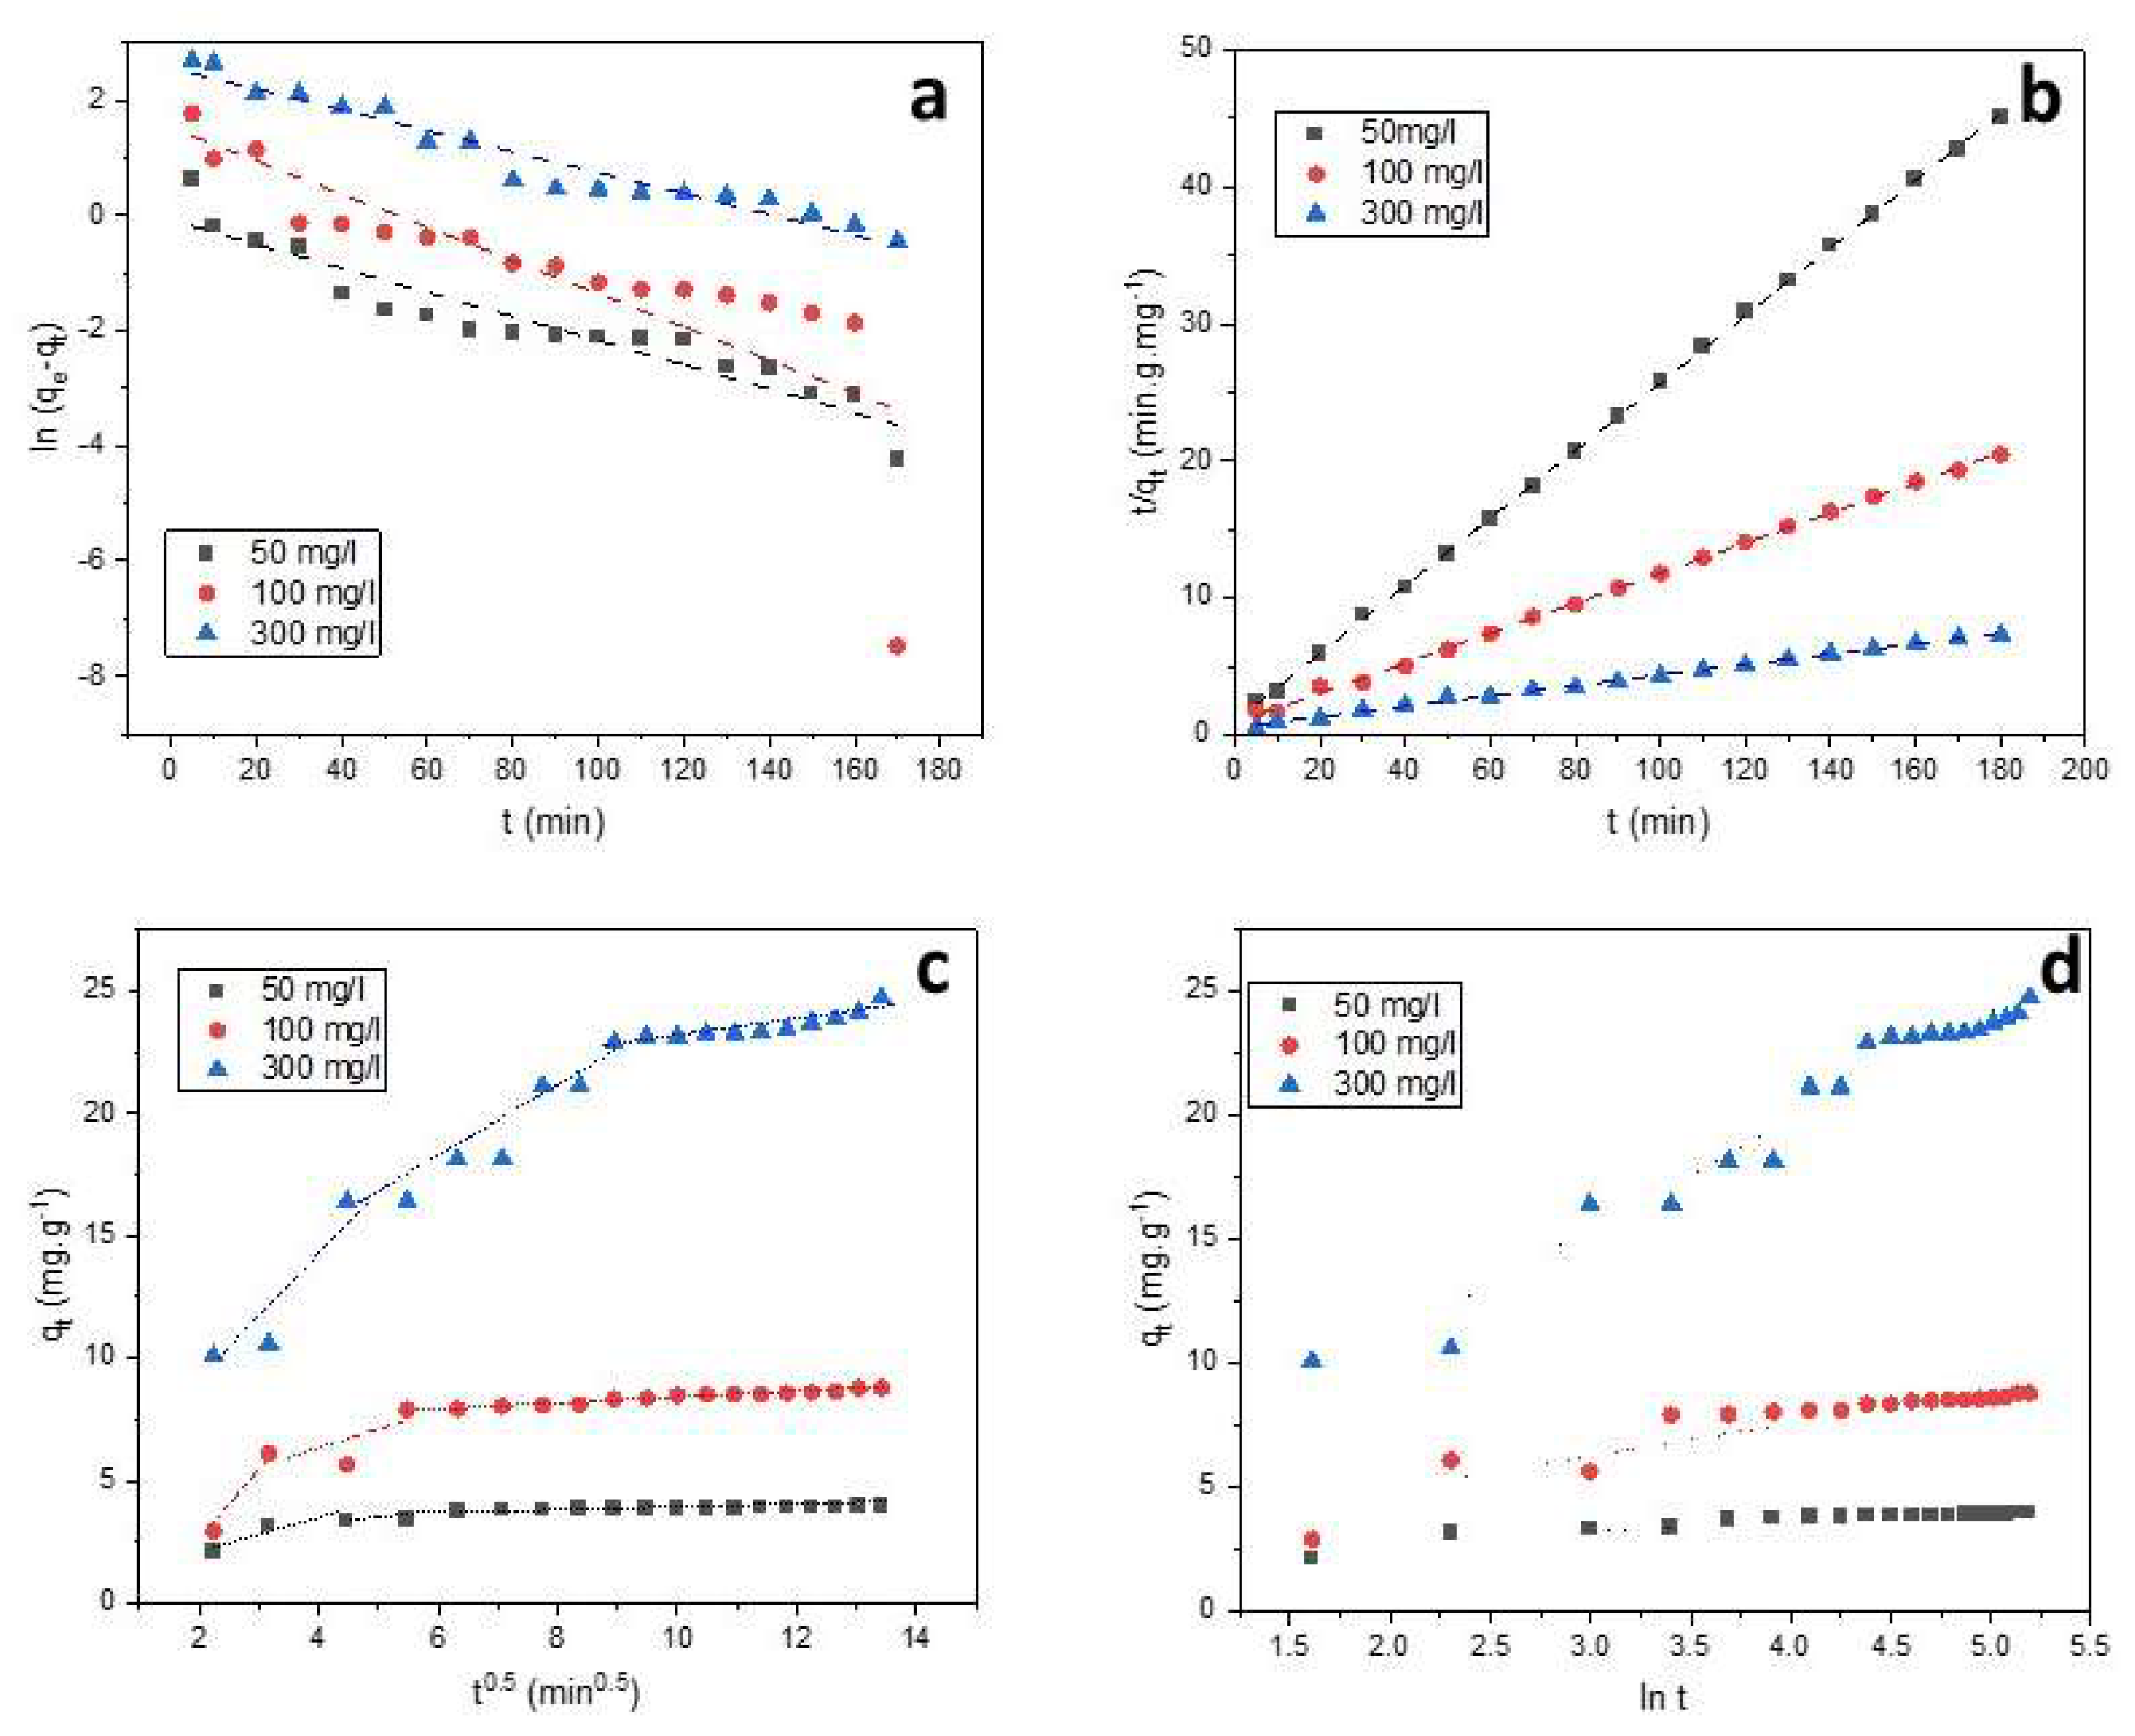
Figure 8.
Adsorption isotherms of SO on Alg-PP (a), the linear form of Langmuir (b), Freundlich (c), Temkin (d) and Dubinin-Radushkevich (e).
Figure 8.
Adsorption isotherms of SO on Alg-PP (a), the linear form of Langmuir (b), Freundlich (c), Temkin (d) and Dubinin-Radushkevich (e).
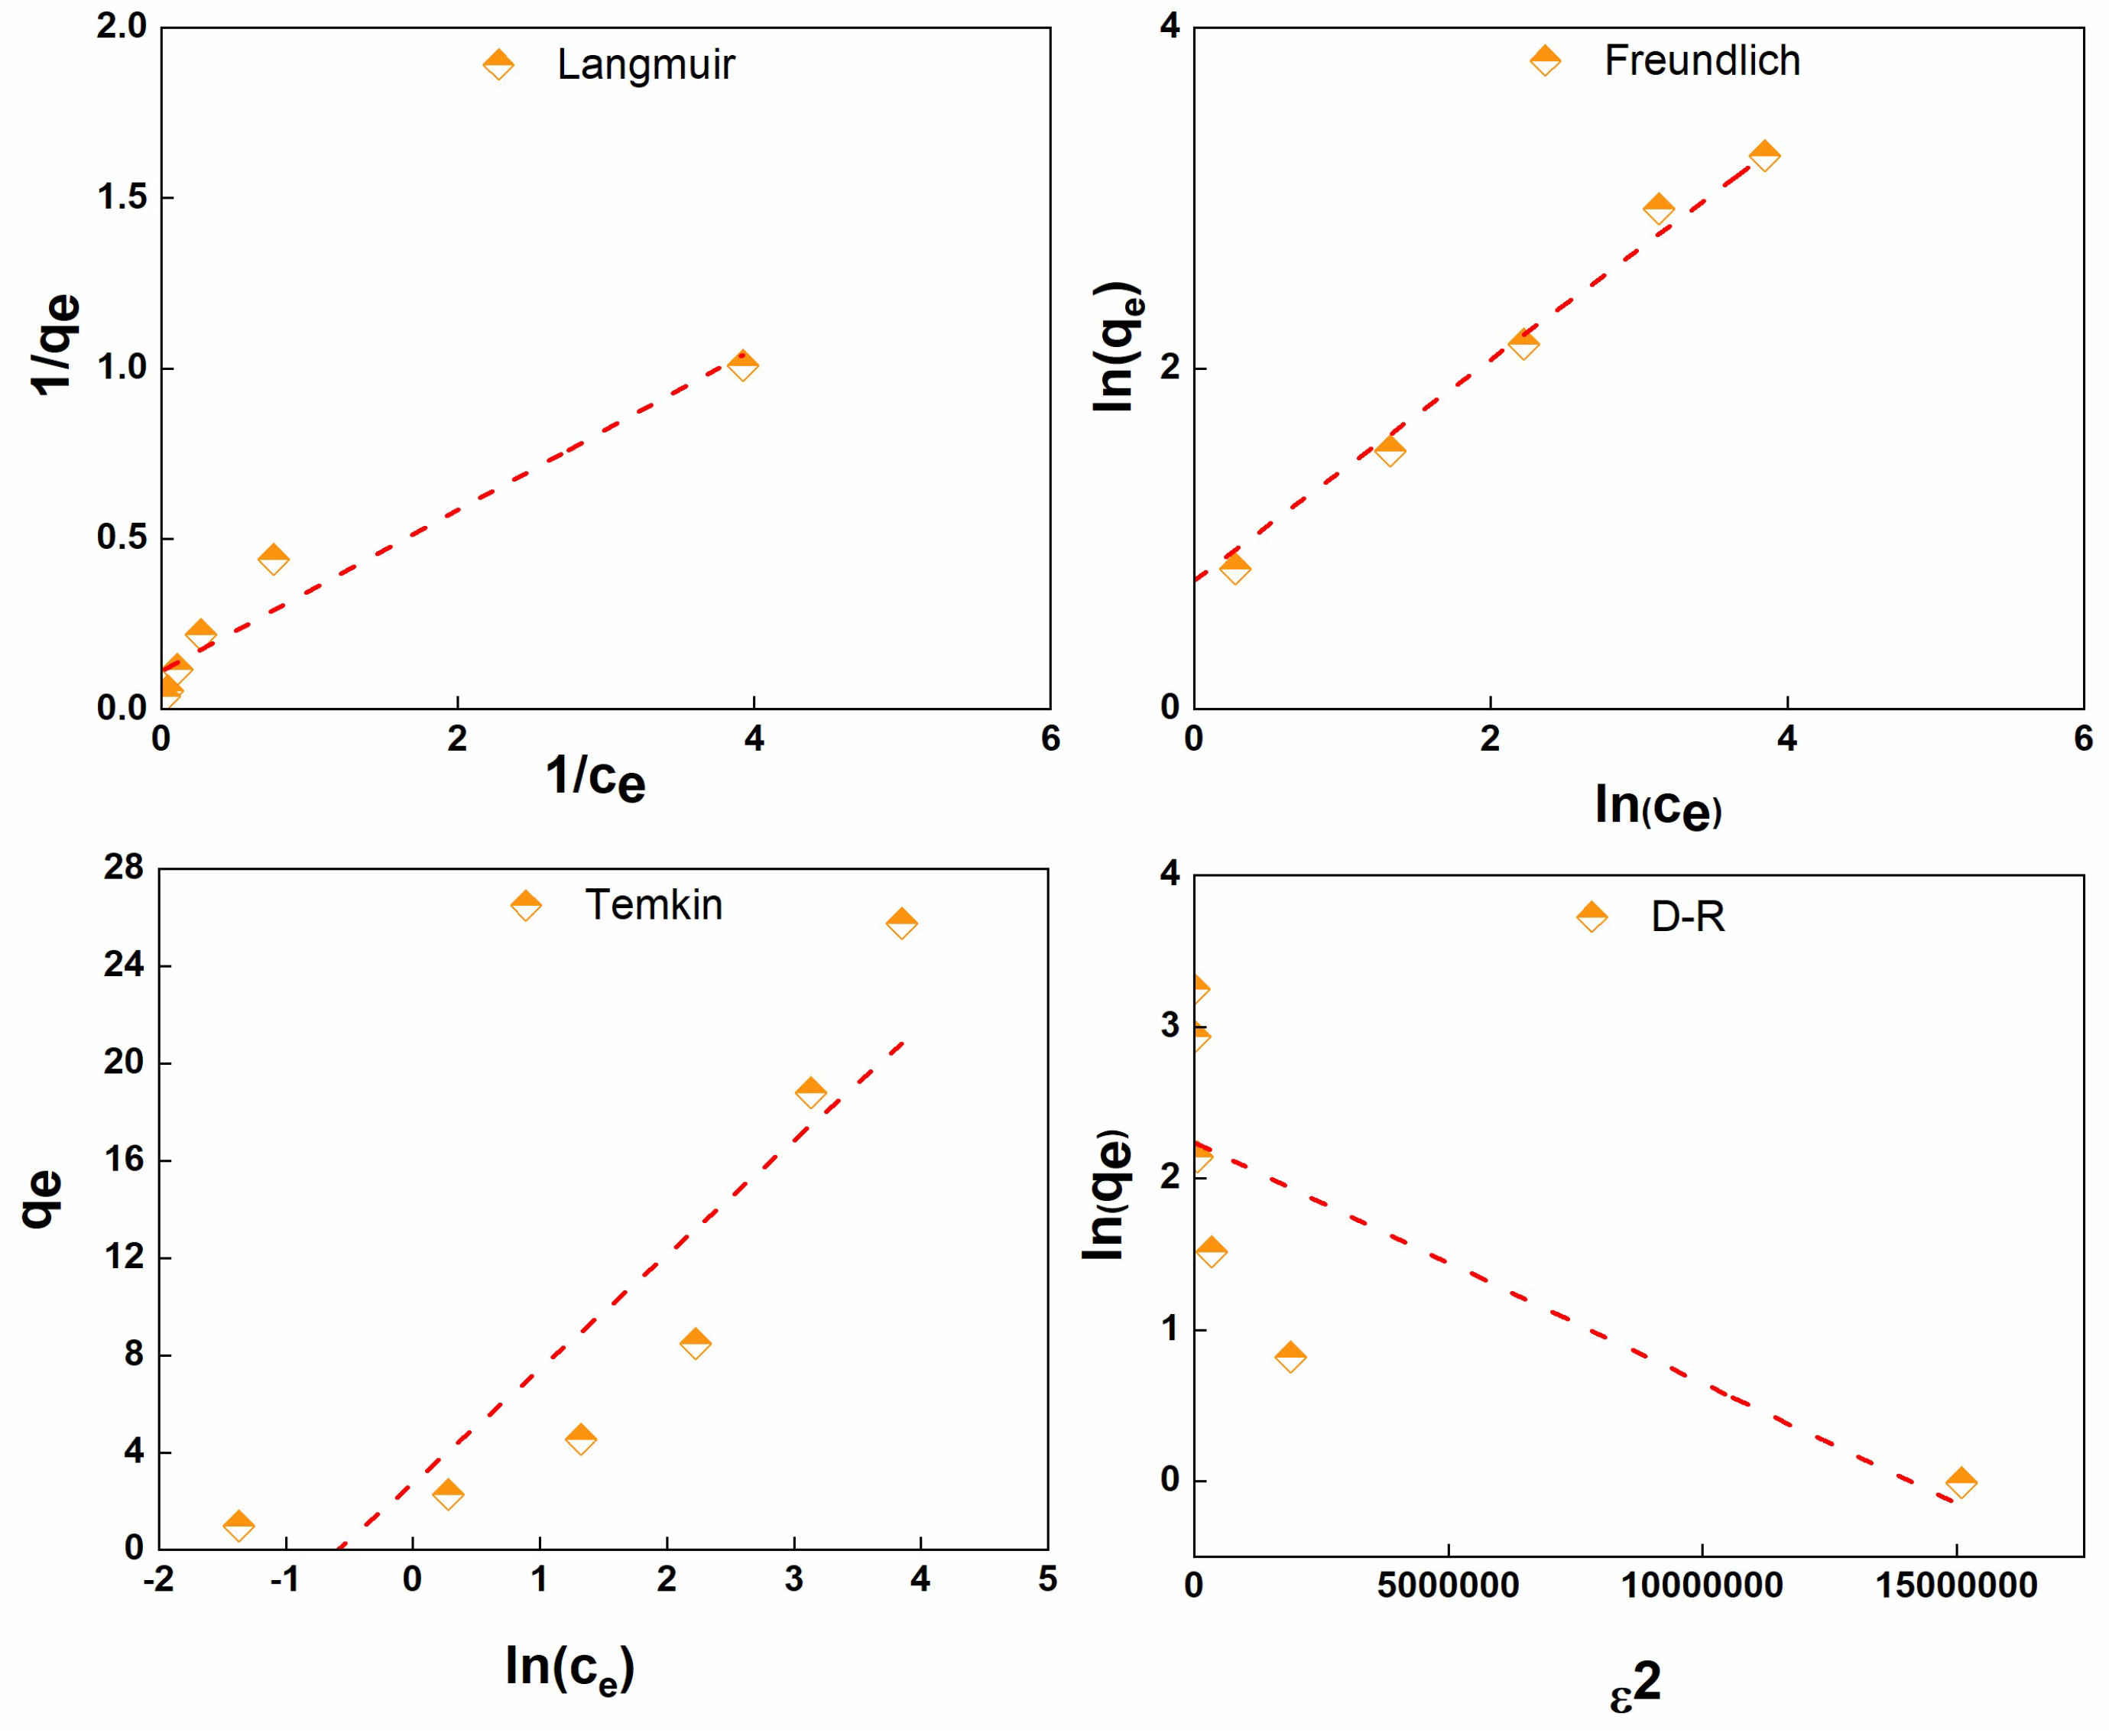
Figure 9.
ln(kd) versus T for the adsorption of SO onto Alg-PP.
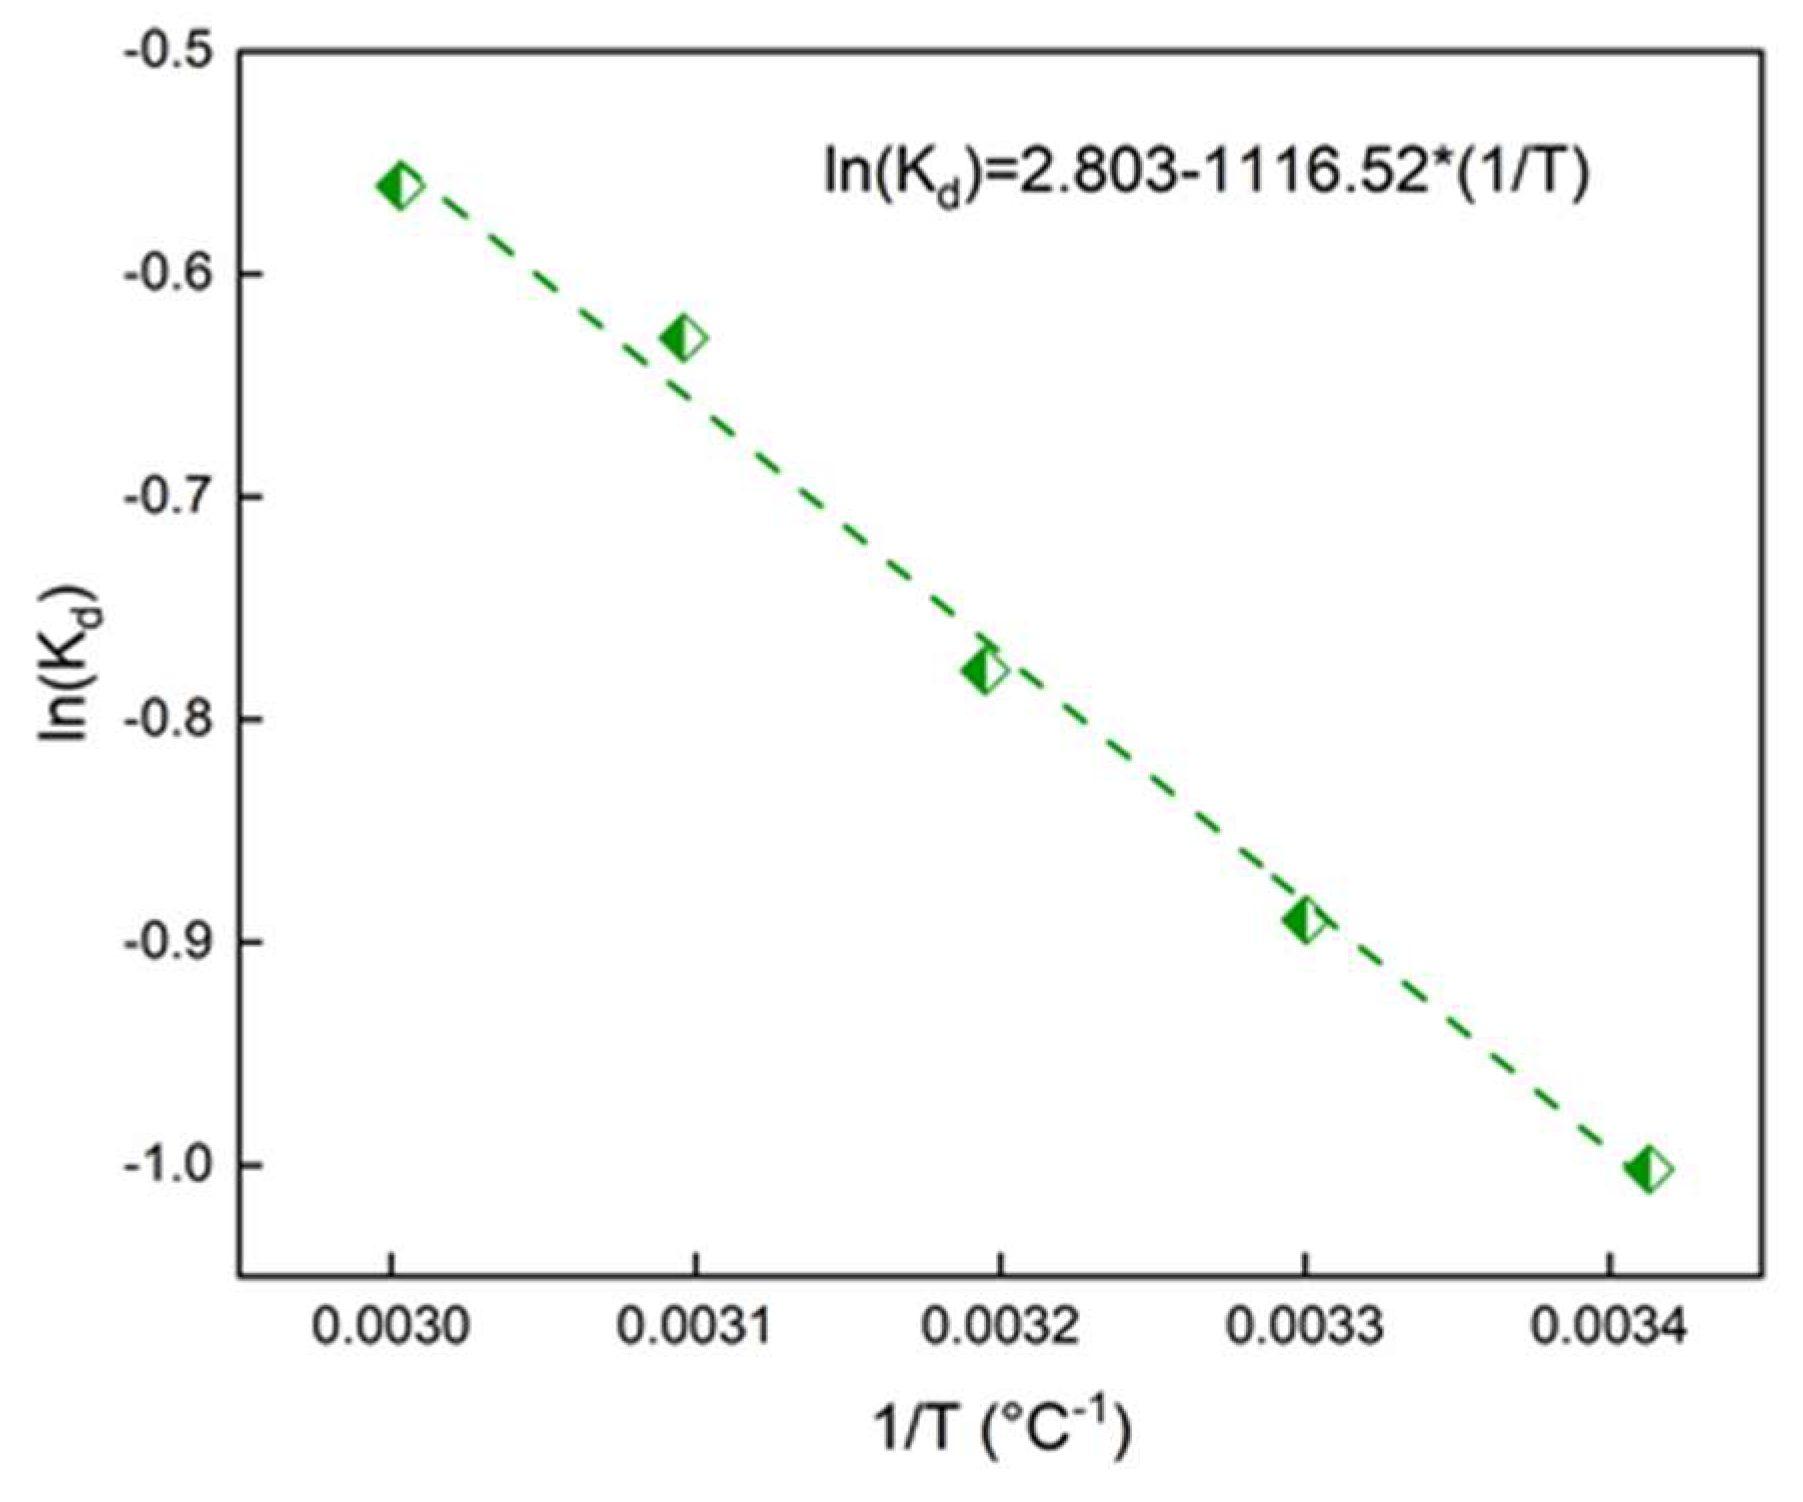
Figure 10.
a) D versus normalized [H+] and b) D versus T for Alg-PP beads.
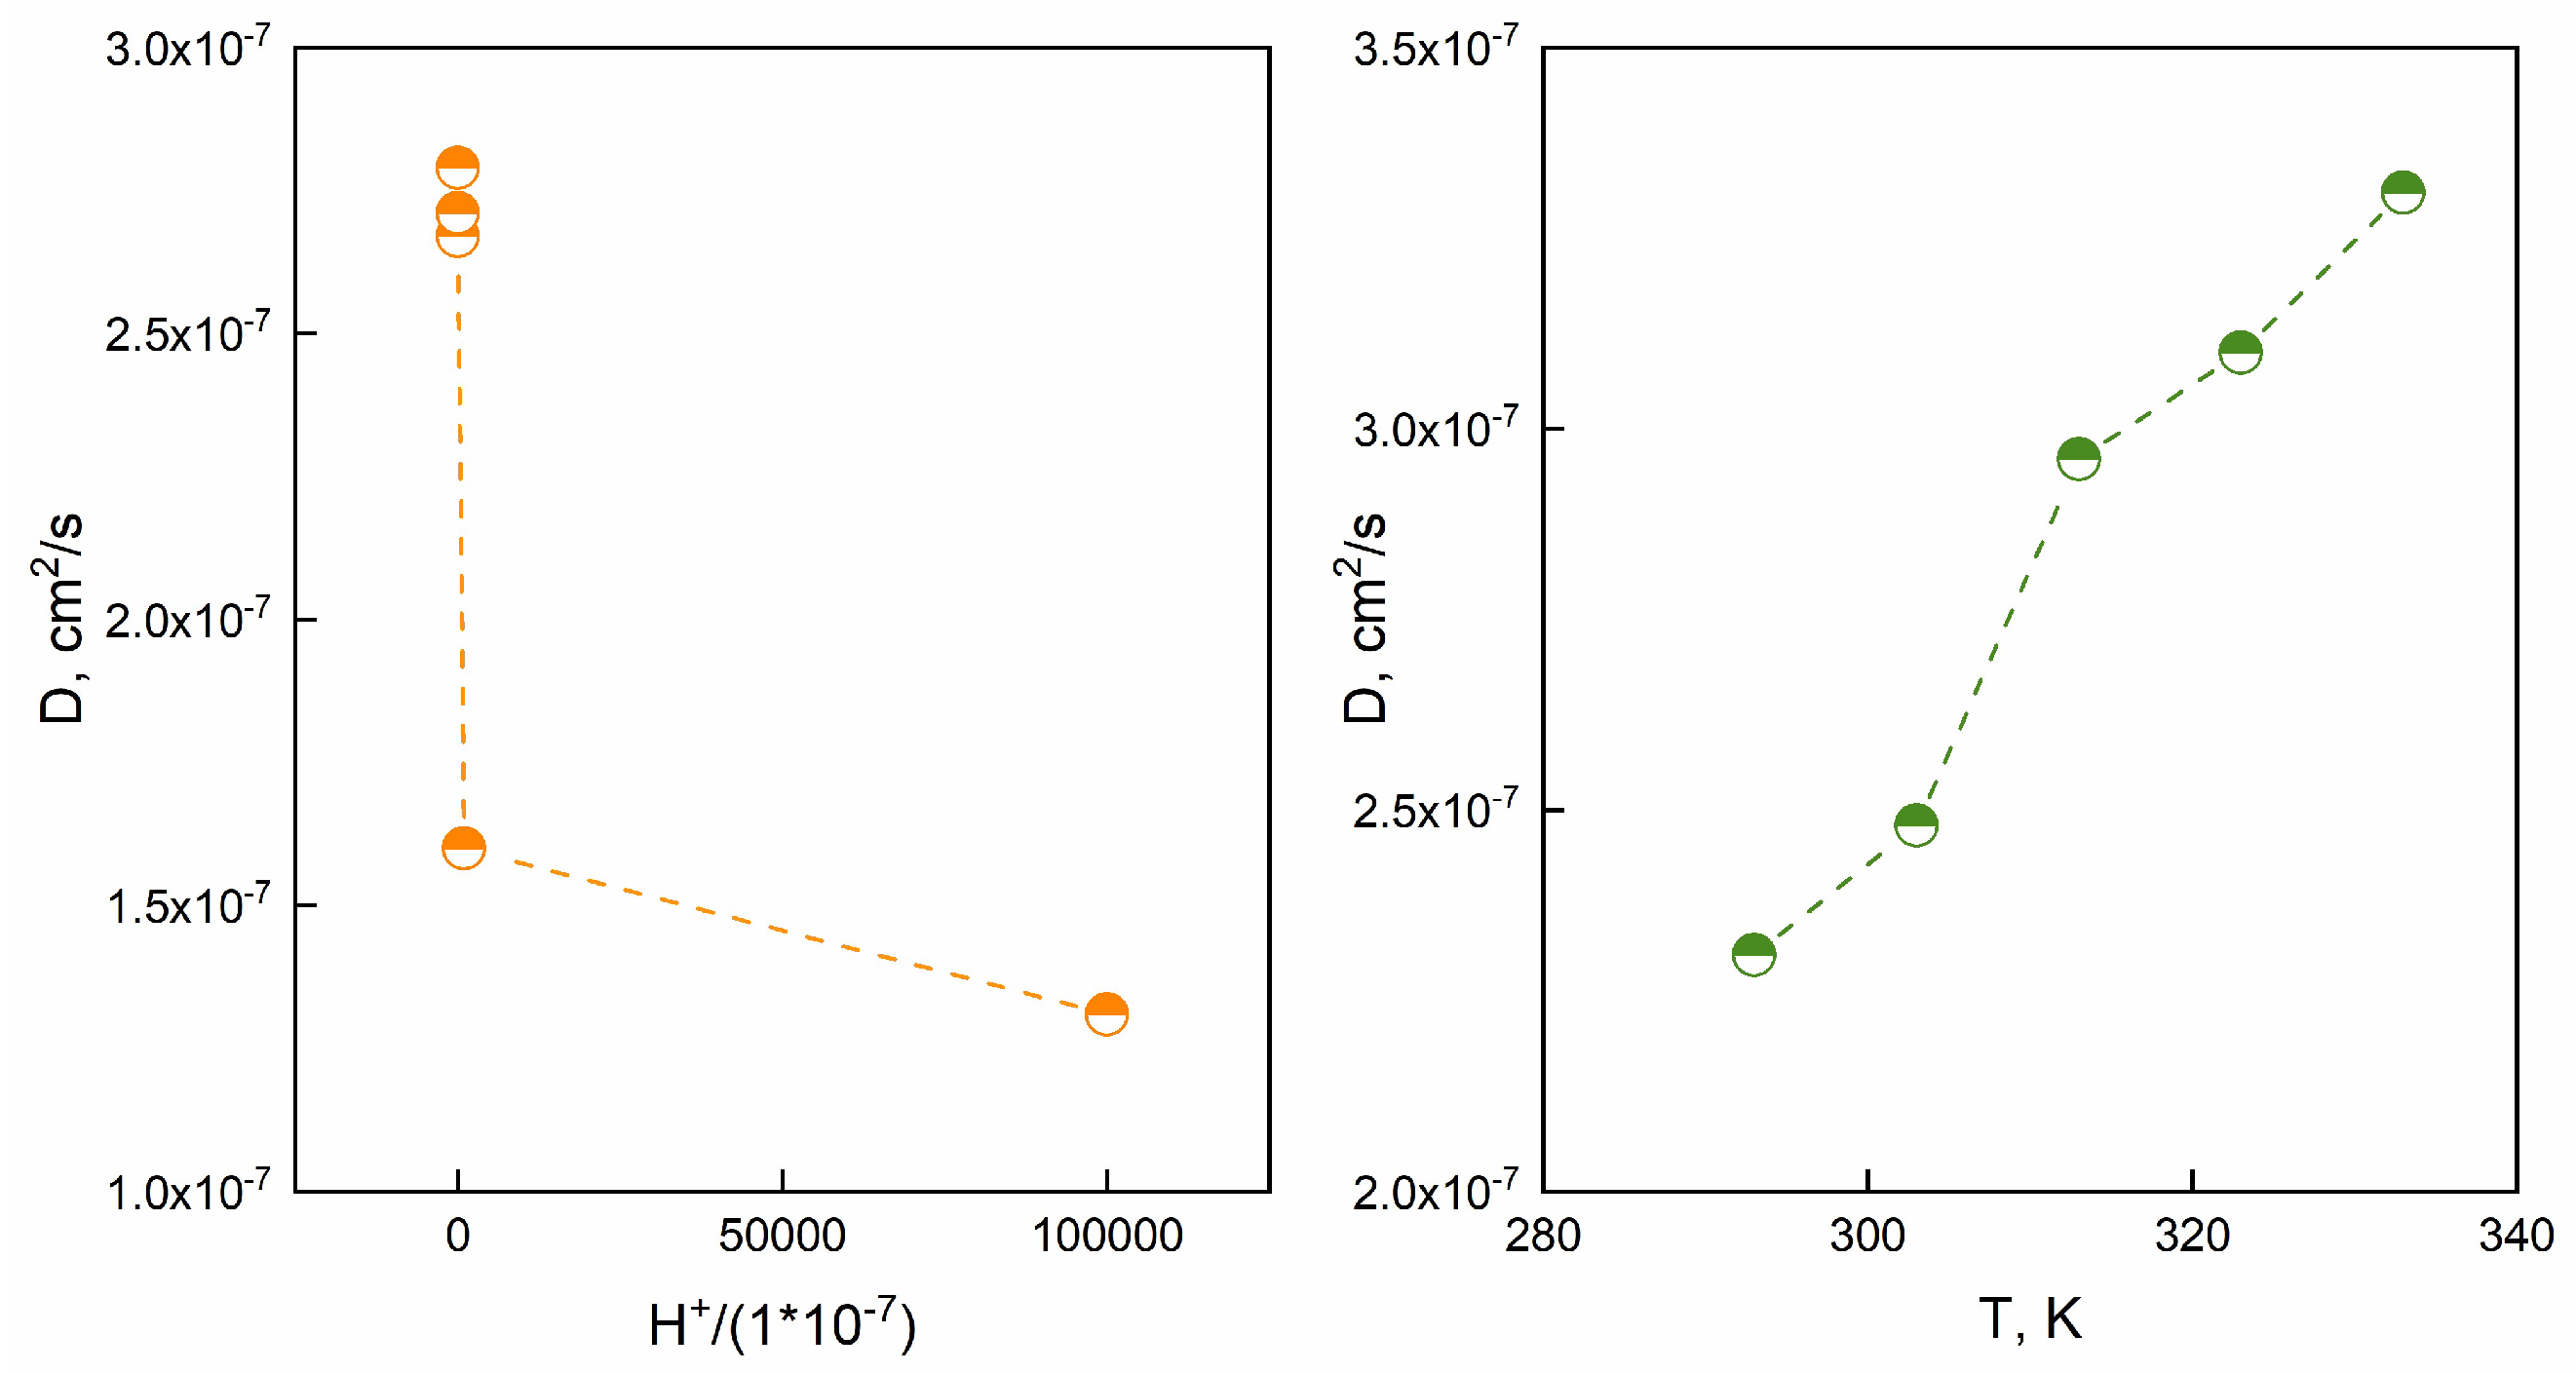
Figure 11.
Experimental data fitted through McKay model.
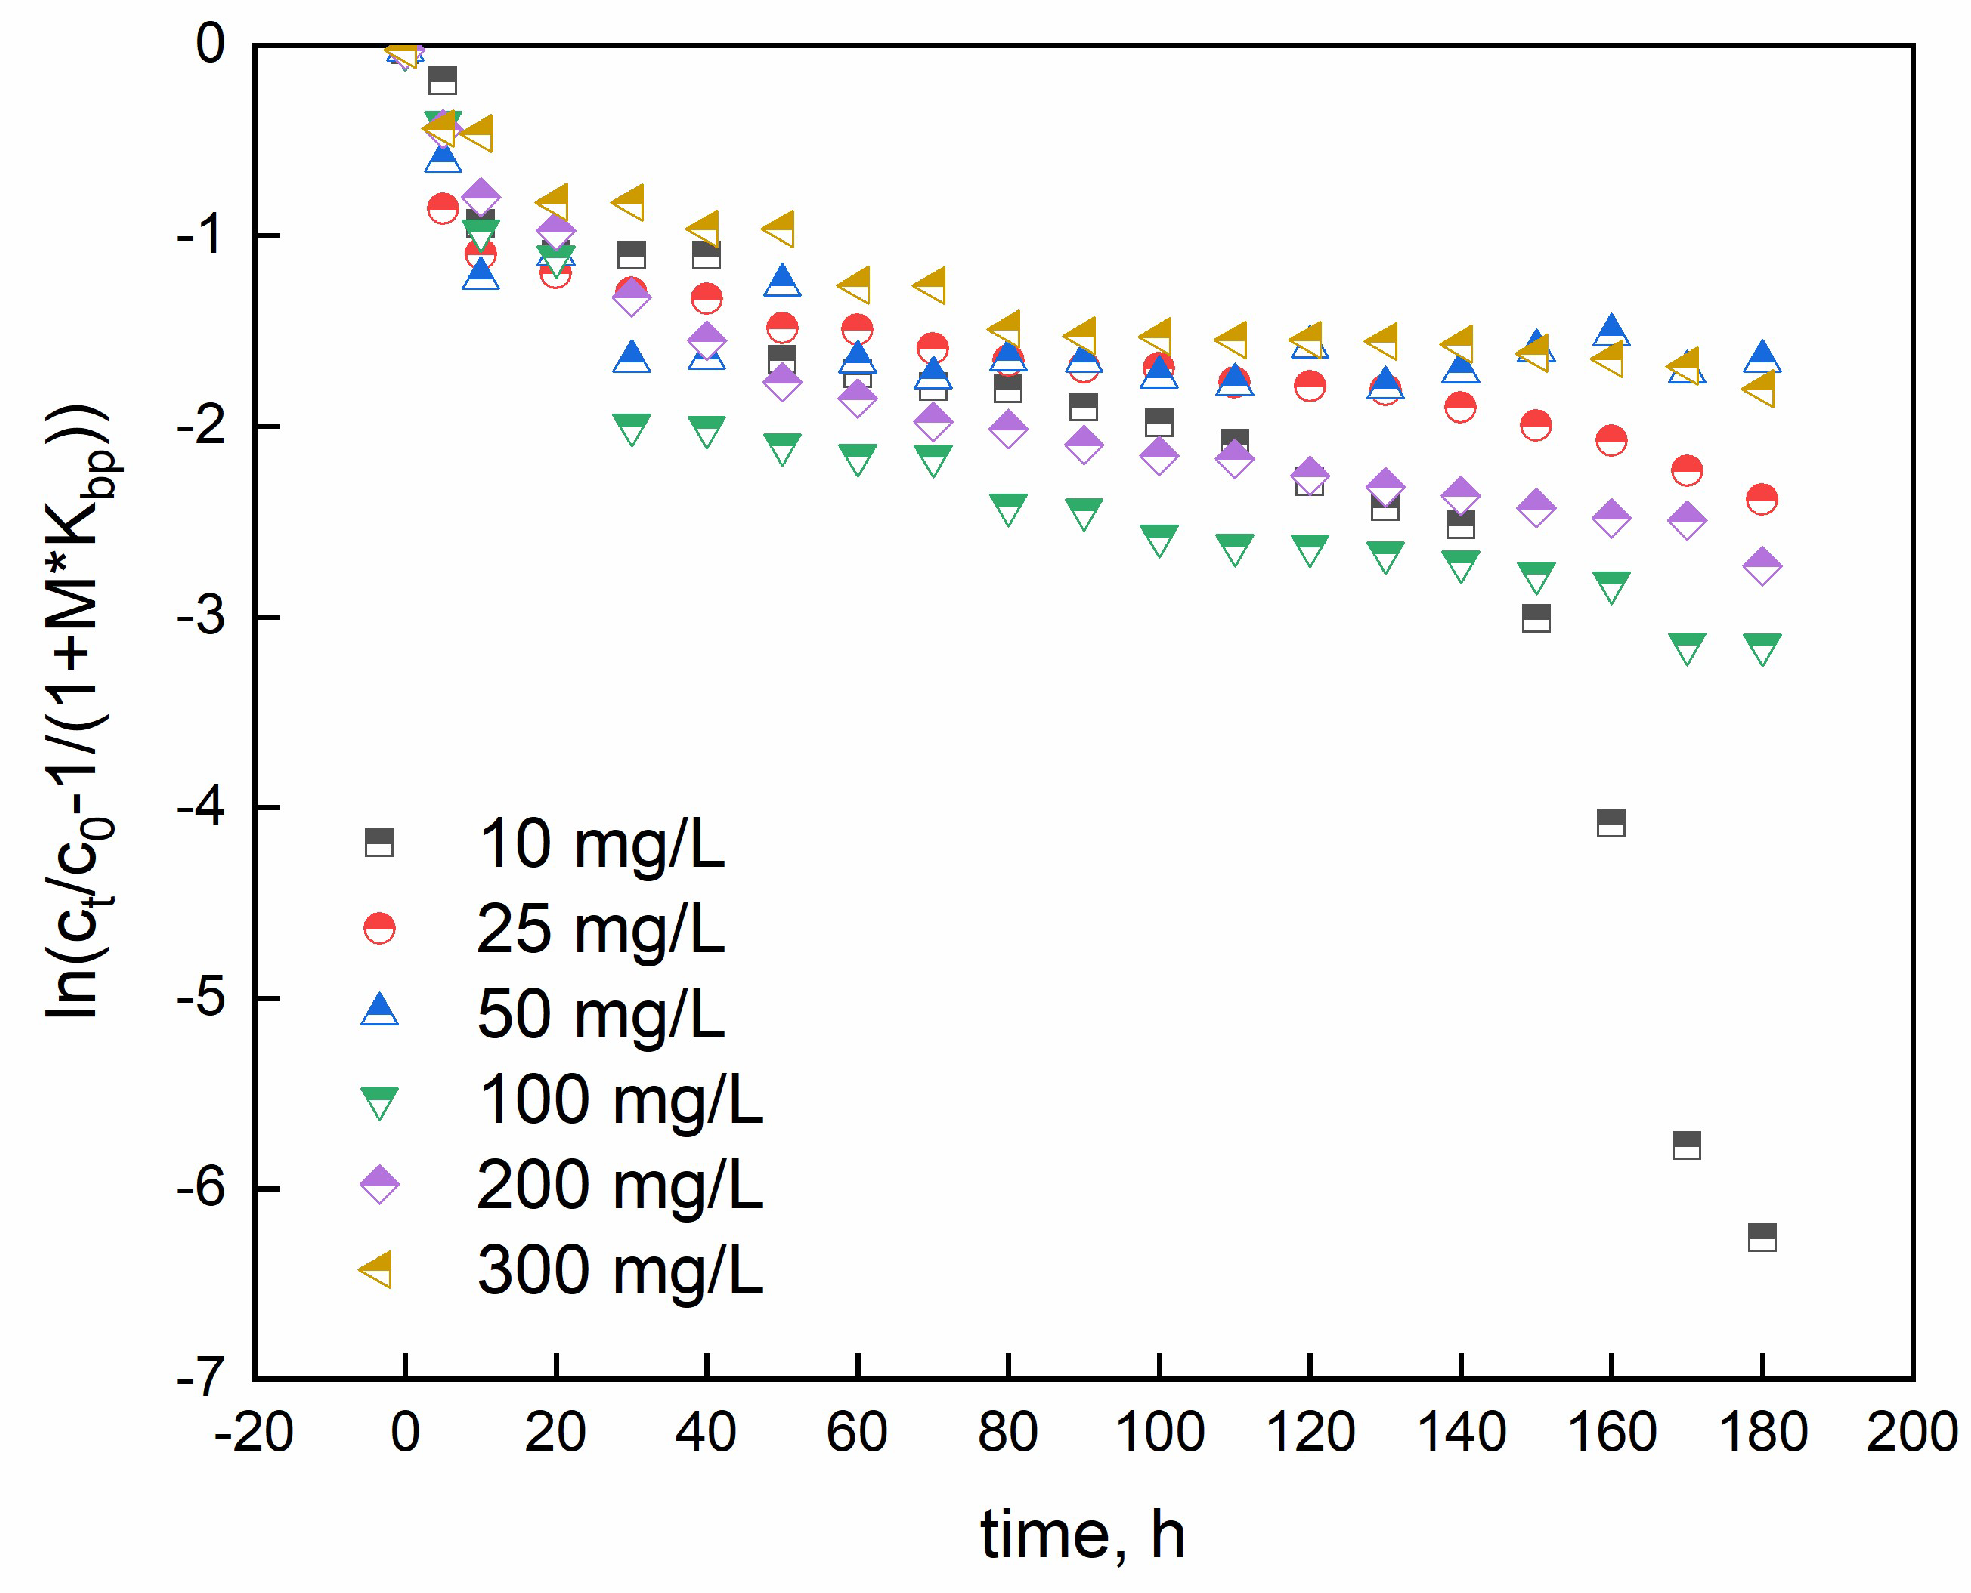
Figure 12.
Bangham's and Burt model data for adsorption of SO.
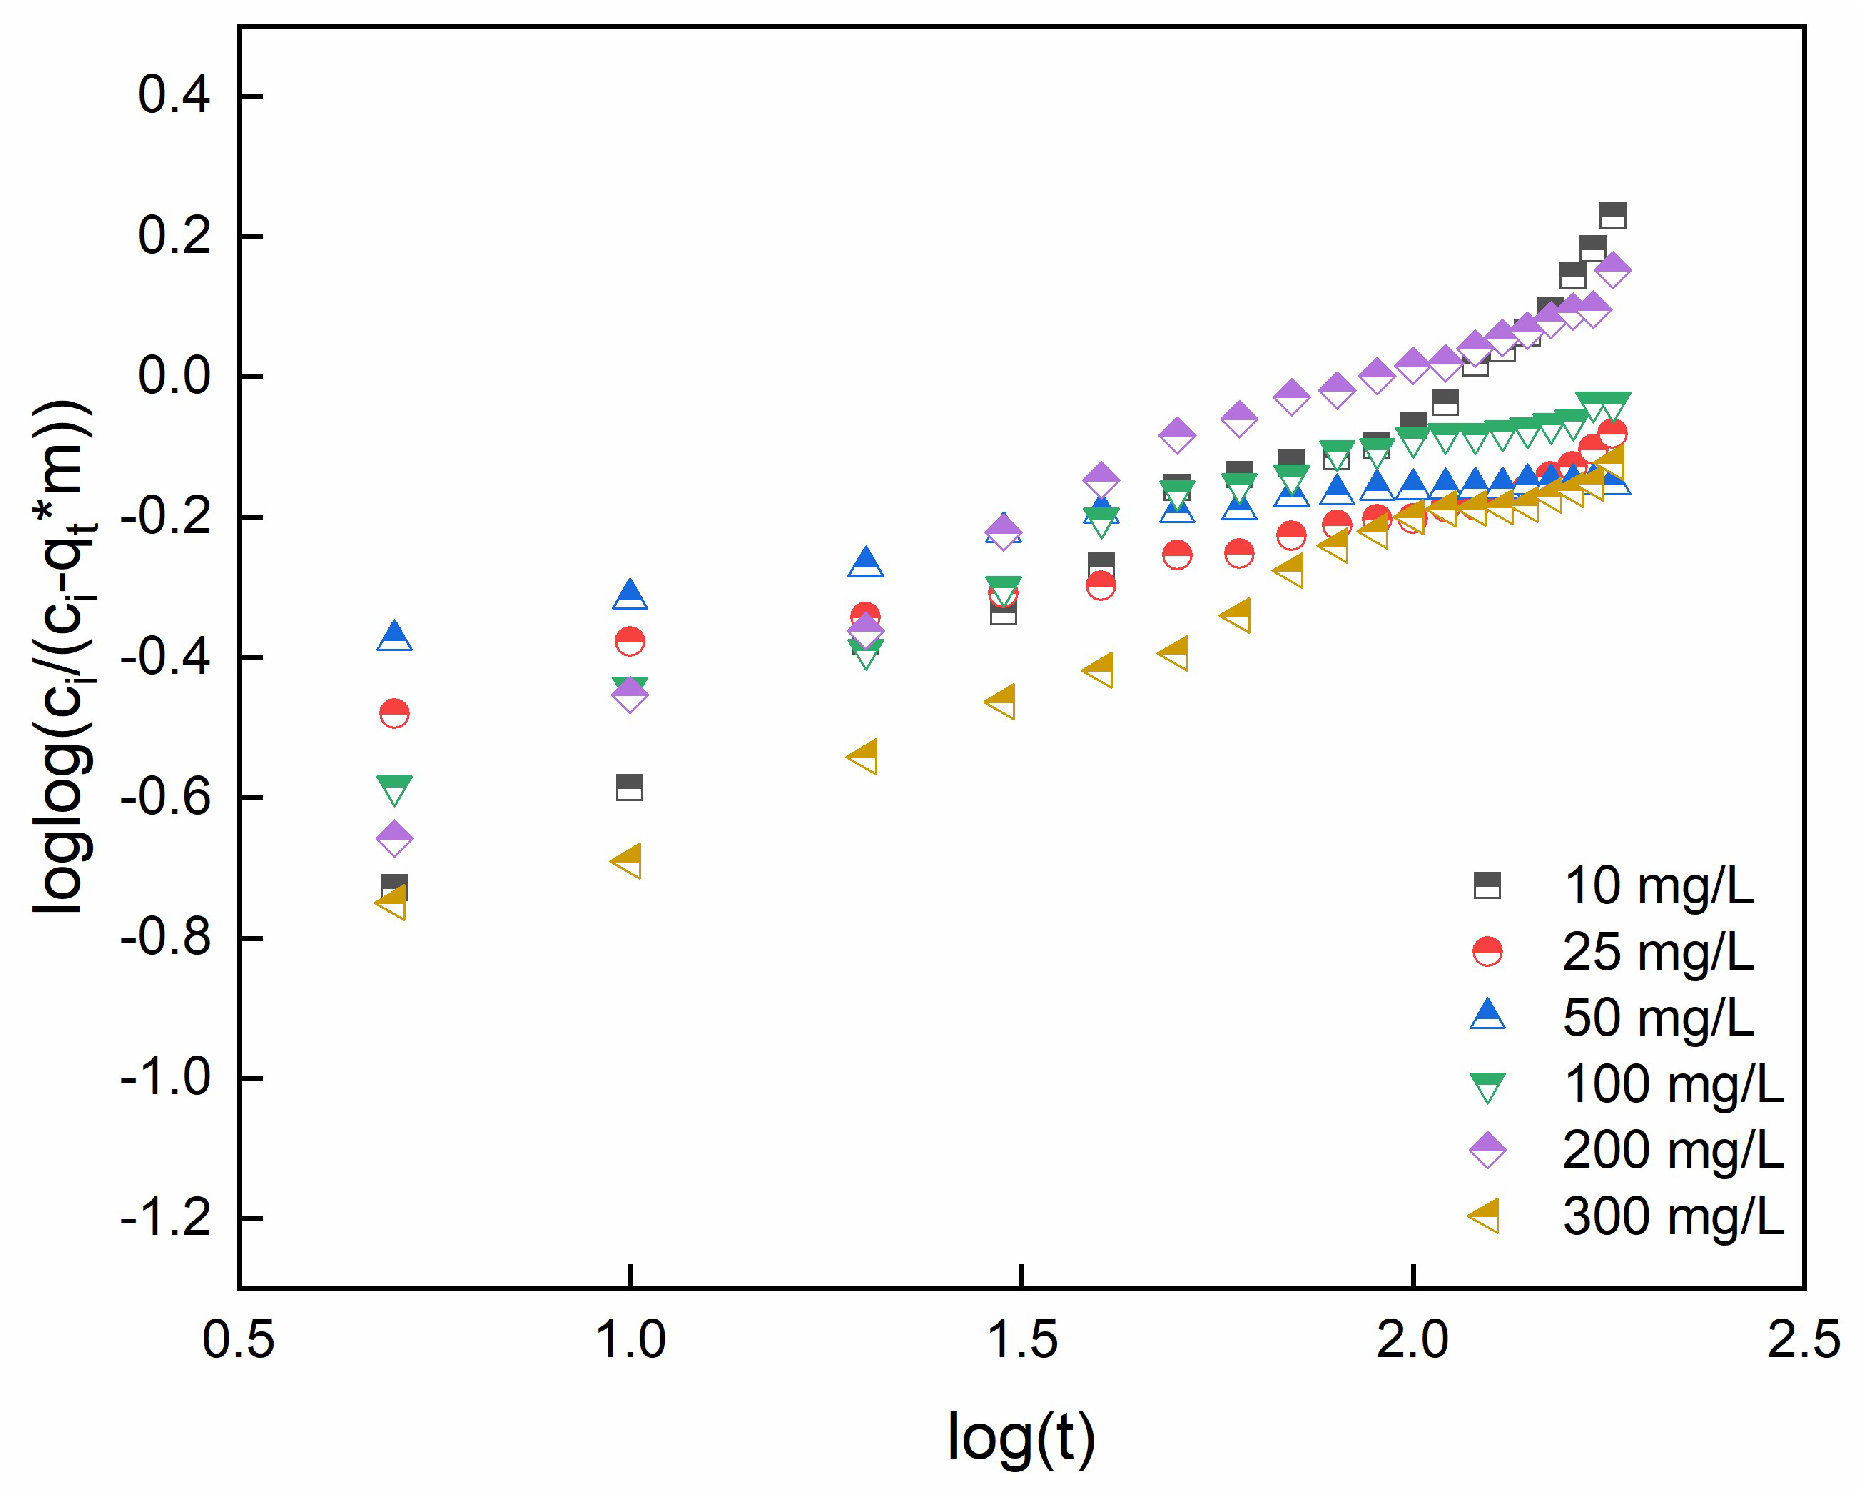
Figure 13.
FTIR spectra of Alg-PP beads before and after the adsorption.
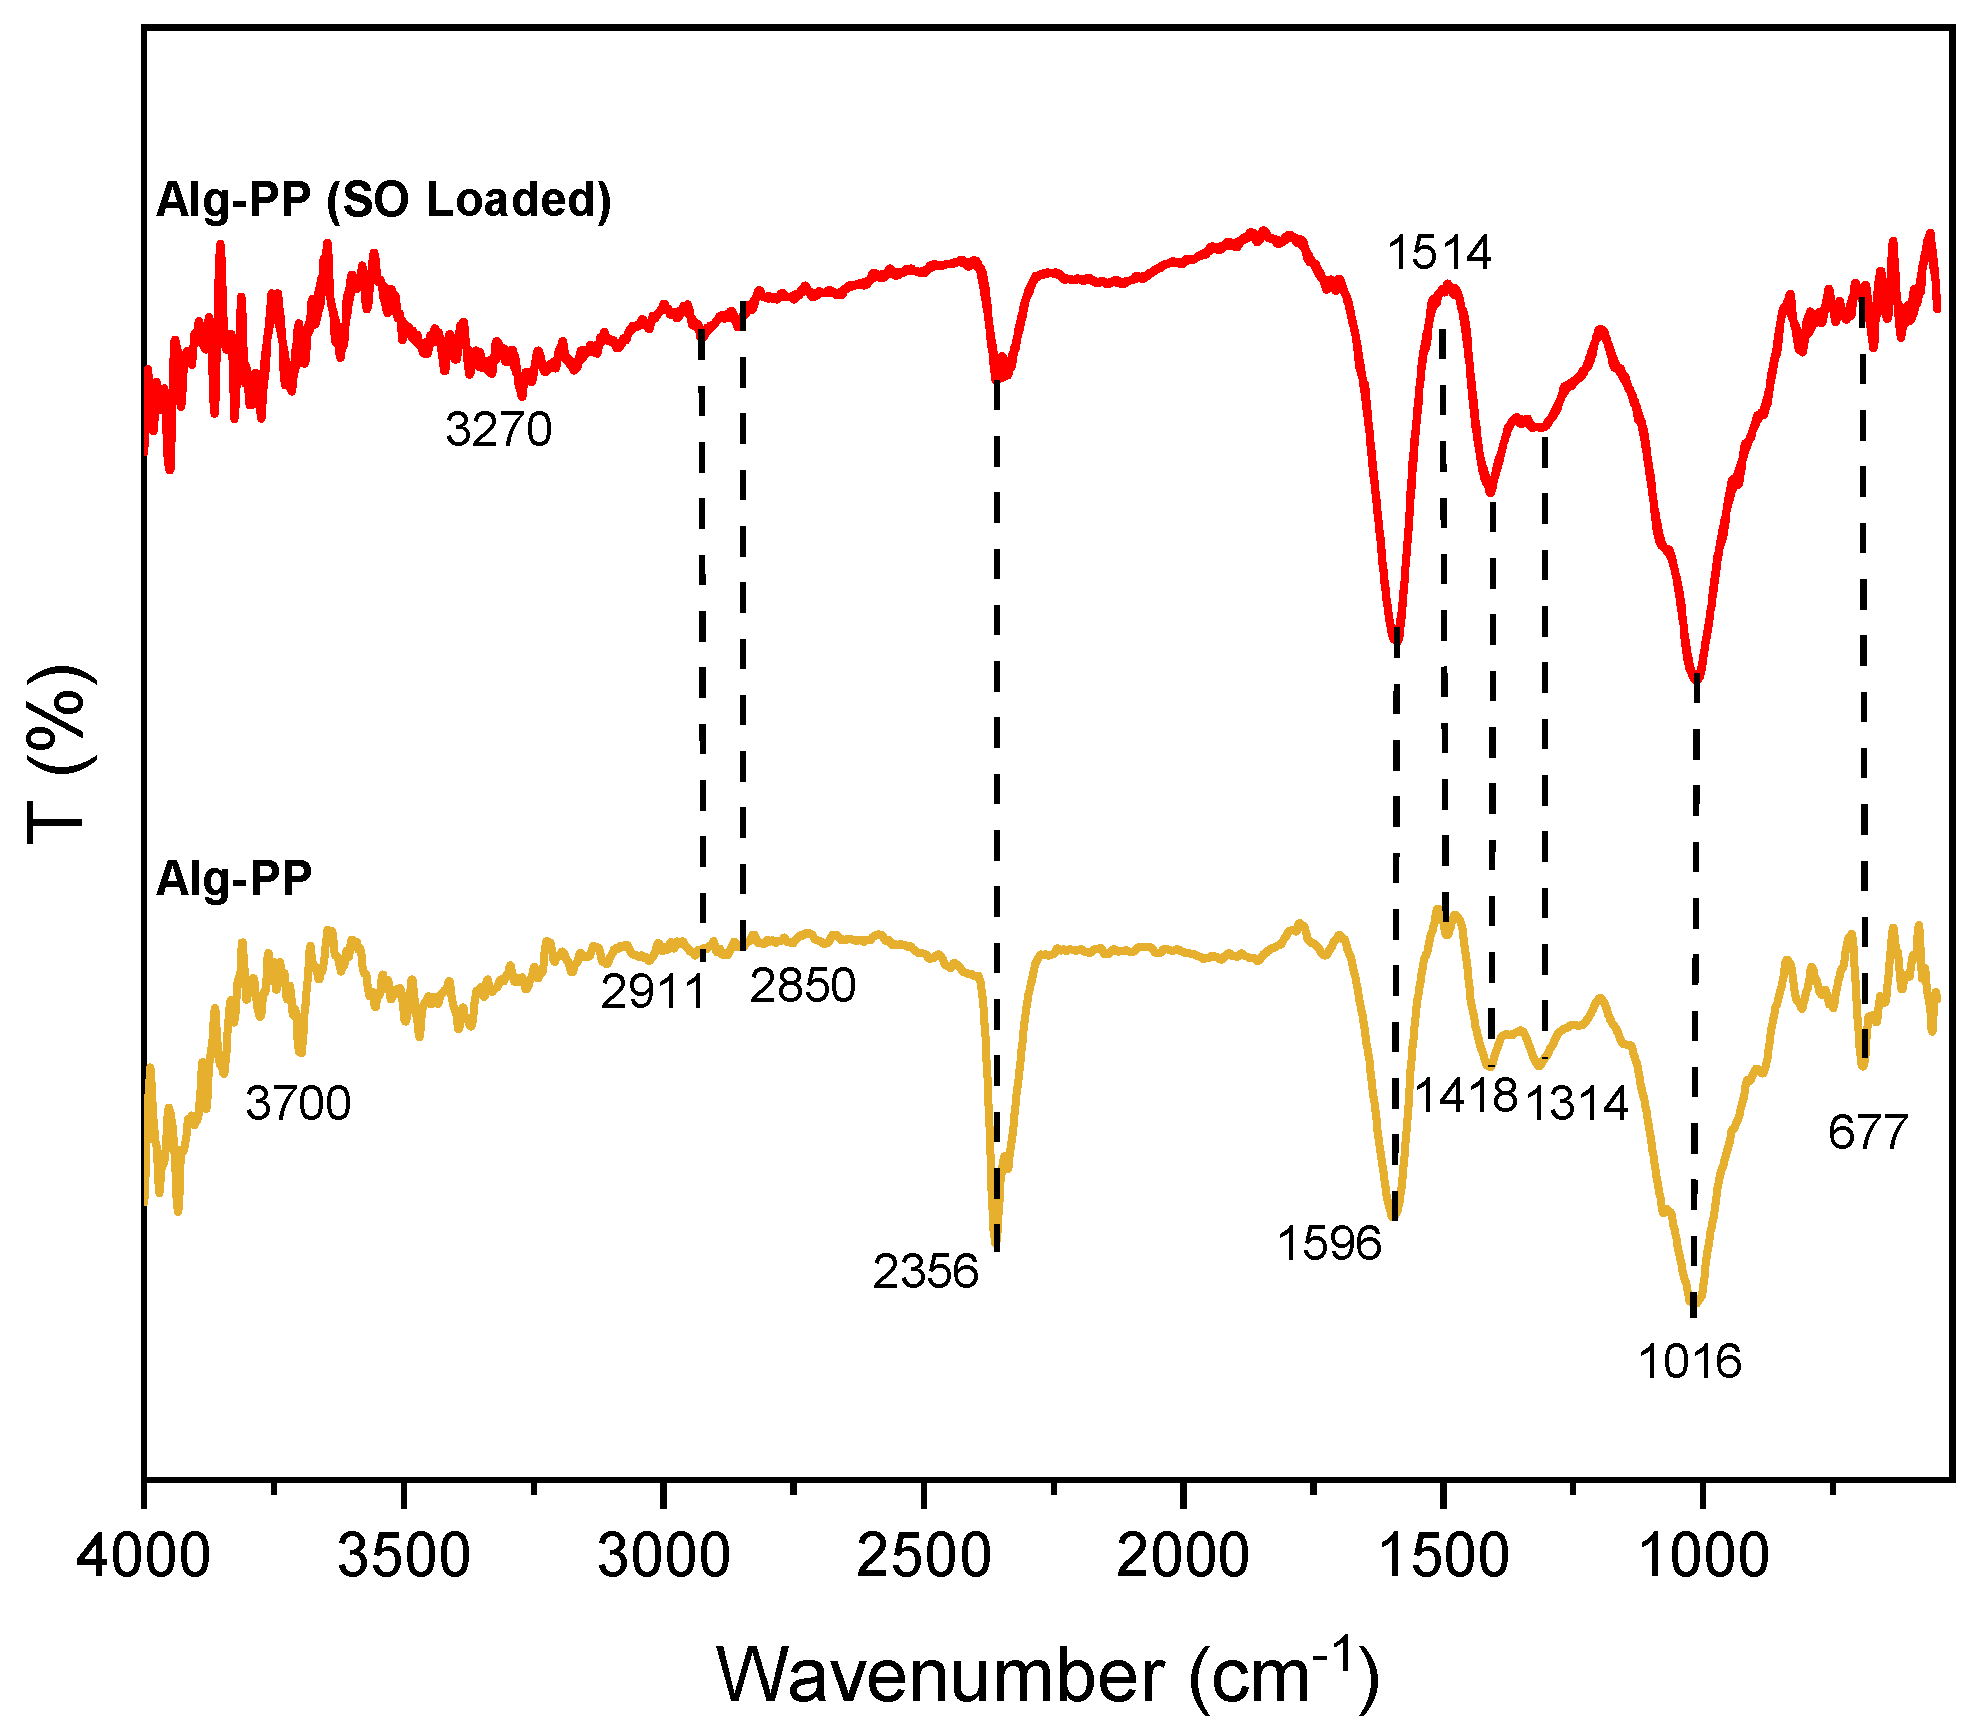
Figure 14.
SO adsorption mechanisms onto Alg-PP beads.
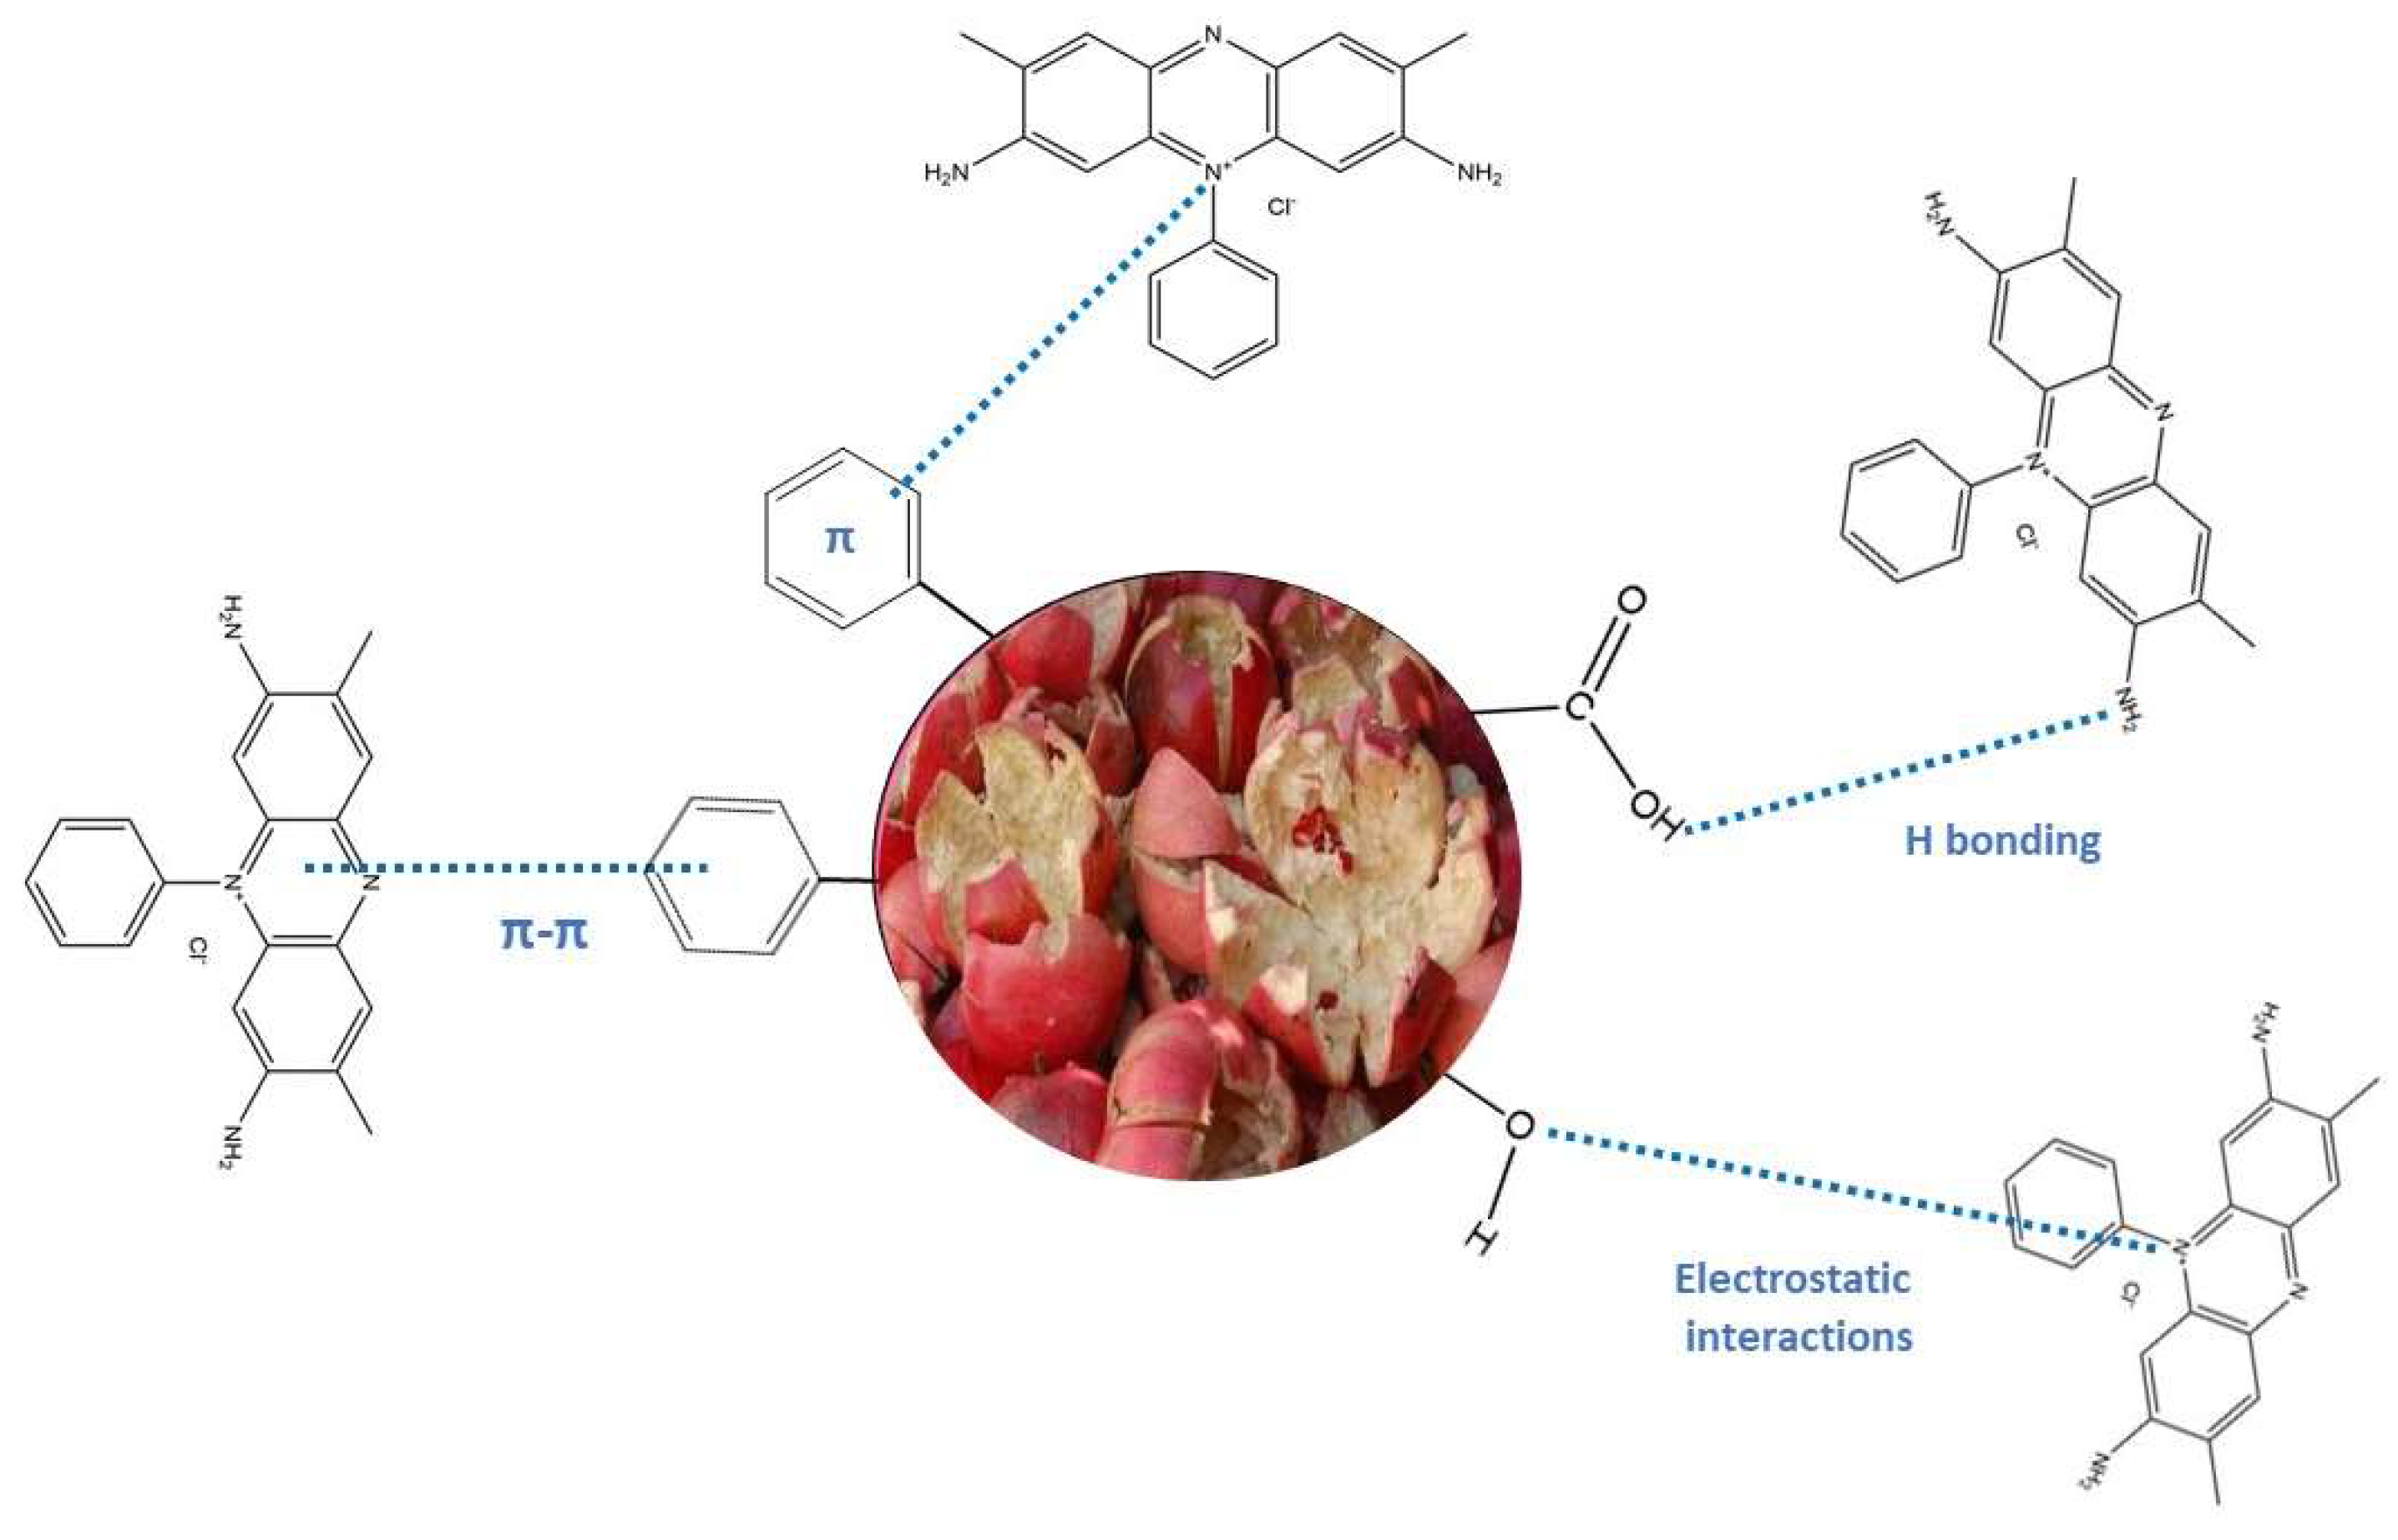

Table 1.
Values of kinetic parameters obtained from fitting process.
| Kinetic model | Coefficients | 50 mg/l | 100 mg/l | 300 mg/l |
| (mg g-1) | 3.992 | 8.7957 | 24.7377 | |
| Pseudo-first-order | (mg g-1) | 0.9217 | 4.6039 | 12.9416 |
| (min-1) | 0.0209 | 0.0288 | 0.01813 | |
| 0.8856 | 0.6071 | 0.9387 | ||
| Pseudo-second-order | (mg g-1) | 4.0541 | 9.1166 | 26.1917 |
| (g mg-1 min-1) | 0.0595 | 0.0141 | 0.0026 | |
| 0.9997 | 0.9988 | 0.9966 | ||
| Elovich | (mg g-1) | 0.4074 | 1.3367 | 4.3697 |
| α (mg/g min) | 54.8413 | 7.2104 | 7.4085 | |
| (g/mg) | 2.4542 | 0.748 | 0.2288 | |
| 0.8304 | 0.8278 | 0.9603 | ||
| Intraparticle diffusion | (mg g-1 min-1/2) | 0.5251 | 1.1135 | 2.9248 |
| (mg g-1) | 1.1566 | 1.2241 | 2.7464 | |
| 0.573 | 0.5325 | 0.8812 | ||
| (mg g-1 min-1/2) | 0.1973 | 0.1176 | 1.5126 | |
| (mg g-1) | 2.43 | 7.2205 | 8.7234 | |
| 0.628 | 0.9580 | 0.9040 | ||
| (mg g-1 min-1/2) | 0.0302 | 0.1149 | 0.3266 | |
| (mg g-1) | 3.5733 | 7.2507 | 19.8407 | |
| 0.9395 | 0.9644 | 0.8199 | ||
| Di (cm2 s-1) | 1.2.10-6 | 1.2.10-6 | 6.2.10-7 |
Table 2.
Parameters of isotherm models.
| Isotherm model | Parameters | Value |
|---|---|---|
| Langmuir | (mg g-1) | 8.99 |
| (L mg-1) | 0.47 | |
| 0.934 | ||
| Freundlich | 1.54 | |
| ((mg g-1)(L mg-1)1/n) | 2.17 | |
| 0.992 | ||
| Temkin | (L g-1) | 1.80 |
| 4.69 | ||
| (kJ mol-1) | 0.52 | |
| 0.815 | ||
| D-R | (mg g-1) | 9.30 |
| (mol2 kJ-2) | 1.6E-7 | |
| (kJ mol-1) | 1.77 | |
| 0.584 |
Table 3.
Thermodynamic parameters for the adsorption of SO onto Alg-PP beads.
| Temperature (K) | ΔG (kJ mol-1) |
ΔH (kJ mol-1) |
ΔS (kJ mol-1 K-1) |
| 293 | -6.82 | 9.30 | |
| 303 | -7.05 | ||
| 313 | -7.28 | 23.30 | |
| 323 | -7.52 | ||
| 333 | -7.75 |
Table 4.
SO diffusion coefficients as function of pH and T.
| Parameters | Value | D, cm2/s |
|---|---|---|
| pH | 2 | 1.31E-7 |
| 4 | 1.60E-7 | |
| 6 | 2.67E-7 | |
| 8 | 2.71E-7 | |
| 10 | 2.79E-7 | |
| T | 293 | 2.31E-7 |
| 303 | 2.48E-7 | |
| 313 | 2.96E-7 | |
| 323 | 3.10E-7 | |
| 333 | 3.31E-7 |
Table 5.
Parameters obtained from McKay’s model.
| Concentration, mg/L | β*Ss, s-1 | R2 |
| 10 | 0.080 | 0.79 |
| 25 | 0.85 | 0.81 |
| 50 | 1.03 | 0.39 |
| 100 | 0.97 | 0.79 |
| 200 | 0.78 | 0.84 |
| 300 | 0.53 | 0.83 |
Table 6.
Constants of Bangham and Burt’s model.
| Concentration, mg/L | α2 | kb | R2 |
| 10 | 0.57 | 0.03 | 0.97 |
| 25 | 0.22 | 0.10 | 0.96 |
| 50 | 0.13 | 0.17 | 0.94 |
| 100 | 0.34 | 0.07 | 0.97 |
| 200 | 0.48 | 0.05 | 0.98 |
| 300 | 0.42 | 0.04 | 0.98 |
Disclaimer/Publisher’s Note: The statements, opinions and data contained in all publications are solely those of the individual author(s) and contributor(s) and not of MDPI and/or the editor(s). MDPI and/or the editor(s) disclaim responsibility for any injury to people or property resulting from any ideas, methods, instructions or products referred to in the content. |
© 2023 by the authors. Licensee MDPI, Basel, Switzerland. This article is an open access article distributed under the terms and conditions of the Creative Commons Attribution (CC BY) license (http://creativecommons.org/licenses/by/4.0/).
Copyright: This open access article is published under a Creative Commons CC BY 4.0 license, which permit the free download, distribution, and reuse, provided that the author and preprint are cited in any reuse.


