1. Introduction
Calcium sulfate (CS) has been used for many years as a filler material for bone defects [
1]. CS-based cements have several unique properties: intrinsic osteogenic potential, a stimulatory effect on angiogenesis, an ability to be completely biodegradable, and the absence of inflammatory reactions after implantation into a bone defect [
2,
3,
4]. At the same time, in contrast to widely used calcium phosphate cements, only a weak thermal effect (up to 27 °C) occurs during a mixing of CS cement, thereby leading to conditions suitable for drug delivery applications [
5]. Despite the advantages, the use of CS is limited due to its high rate of bioresorption [
6]. Kinetics of this resorption depend on many factors including the location, environment, and size of a bone defect and health status of the patient (including comorbidities), and approximately 5–8 weeks is required for complete resorption [
7]. This rate of resorption is therefore acceptable for filling a defect of subcritical size (less than 1 cm). The processes of resorption of an CS implant are caused by physicochemical dissolution. Nonetheless, the resorption is accelerated in osteoporosis, which is associated with increased sensitivity to CS dissolution [
8]. Another disadvantage is an insufficient level of osteogenesis as compared to calcium phosphate cements [
9,
10].
To modify biological and physicochemical properties of CS, it is doped with various ions and functional groups. In refs. [
11,
12,
13,
14], a positive effect of doping with Sr
2+, Zn
2+, or Cu
+ on the cytocompatibility, osteoplastic potency, and mechanical strength of CS-based materials has been demonstrated. Introduction of cations Na
+, K
+, and Mg
2+ helps to control the solubility of CS materials [
15,
16,
17]. According to solubility studies, the introduction of 20.0 mol.% of phosphate groups into CS cements contributes to the formation of a calcium phosphate layer (CPL) on the surface of such samples after 28 days of soaking in Kokubo simulated body fluid (SBF, simulating the composition of human blood plasma) [
18] and Dulbecco’s phosphate buffered saline. In vitro experiments on human osteosarcoma cell line MG-63 cultured on phosphate-doped CS have shown that the cement samples are cytocompatible and have moderate surface matrix properties [
19]. In ref. [
20], it was found that calcium phosphate biocomposite coatings containing lanthanide cations (La
3+, Ce
3+, and Gd
3+) can improve the bone–implant interface on the surface, accelerate osseointegration, and prevent inflammatory complications through antiplatelet activity. Lanthanides have antimicrobial activity, enhance the phagocytic activity of leukocytes, and consequently promote cell proliferation. Tb
3+ is one of the most luminescent biologically active rare earth elements owing to its excellent emission characteristics at a wavelength of 544 nm [
21,
22,
23,
24]. At the same time, terbium has a potential antibacterial activity and is able to inhibit cancer progression [
25]. To evaluate possible biomedical applications of hydroxyapatite (HA) nanorods doped with terbium (Tb
3+) at 25, 50, or 100 μg/ml, the authors of ref. [
26] have performed in vitro and cytocompatibility assays on MC3T3-E1 cells. Their analysis of cell proliferation and cytotoxicity, combined with laser scanning microscopy, showed excellent cell viability without morphological changes at the doses tested. HA samples doped with Tb
3+ at 2.0 at. % prepared by the chemical method manifest good biocompatibility with transformed T-HUVEC epithelial cells [
27]. On the other hand, data on the influence of Tb
3+ on other biomaterials, including CS, are limited at present.
Studies of the effect of terbium on CS cement materials was not found in our literature review. Therefore, the purpose of this work was to develop CS materials containing Tb3+ in the amount up to 2.0 mol.% to determine general patterns of the formation of CS structure depending on the introduction of various concentrations of Tb3+ as well as to evaluate the impact of Tb3+ concentration on chemical and phase composition of powders, crystallite parameters, functional groups, and thermal properties. We have been investigated the cements’ morphology, mechanical strength, setting time, and dissolution kinetics in SBF and studied luminescence spectra as well.
2. Results
2.1. Powder characterization
2.1.1. Powder chemical composition
Table 1 presents theoretical and experimental contents of elements in the synthesized powders.
2.1.2. Thermal analysis
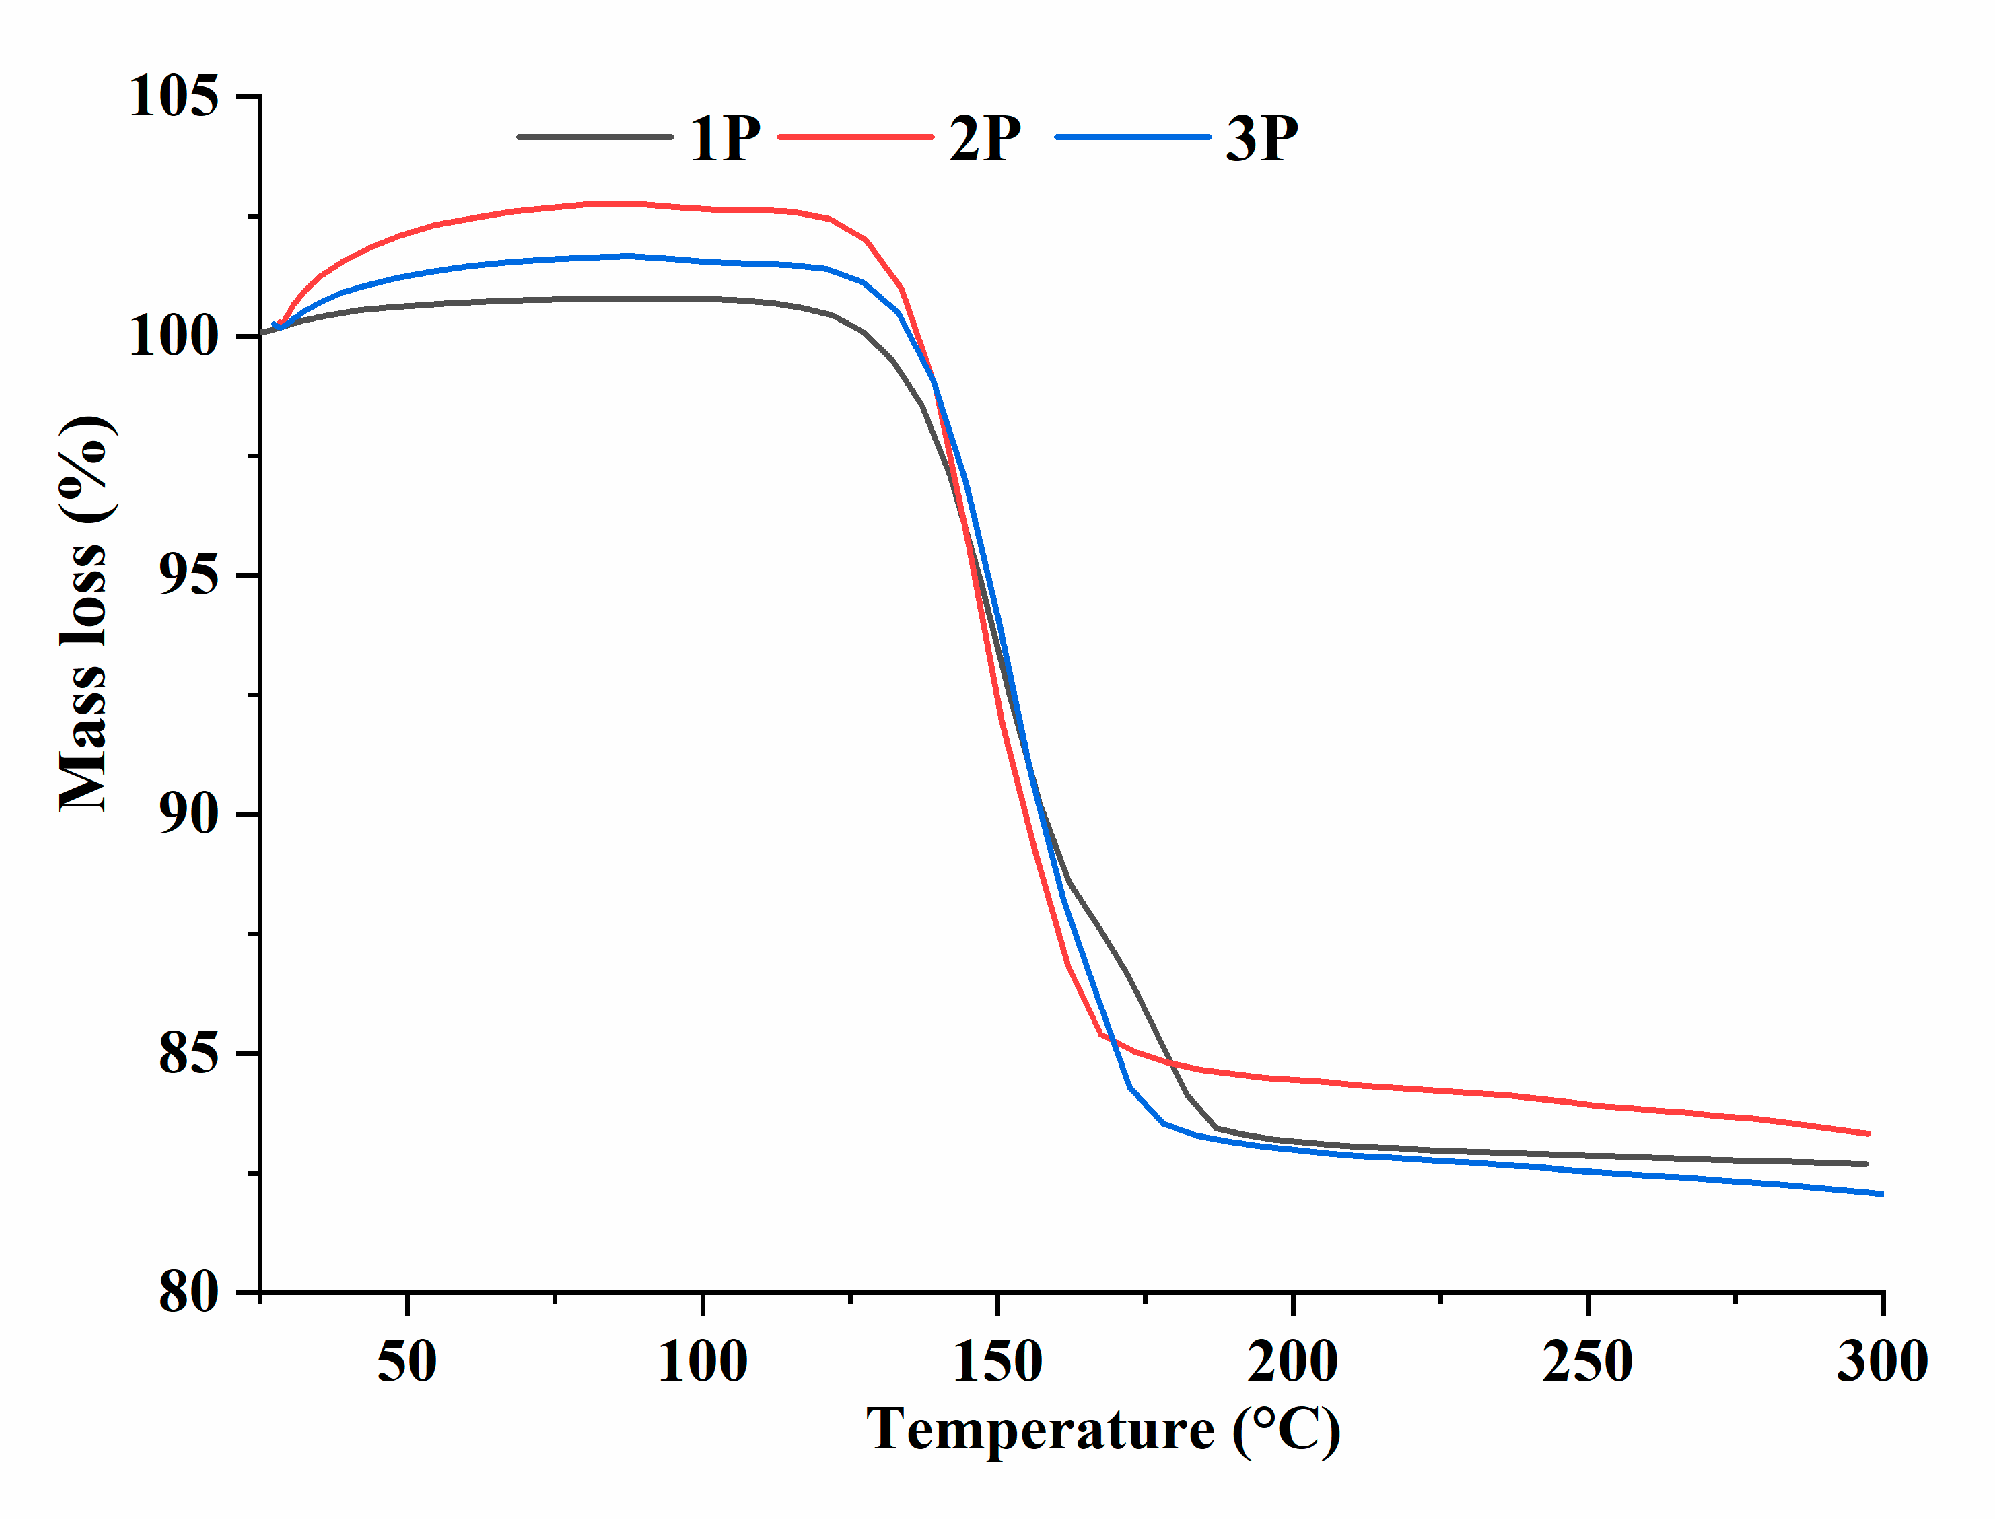
Thermogravimetric analysis showed that for sample 1P (CaSO
4×2H
2O), 1.5 water molecules are lost in the temperature range of 110–160 °C, and the second range of 160–190 °C is responsible for the removal of additional 0.5 water molecules [
28] (
Figure 1). At temperatures above 220 °C, the CS lattice converted from a hemihydrate (CaSO
4×0.5H
2O) to an anhydrous state (CaSO
4), after which it lost its ability to bind water. For materials containing terbium ions, the character of the thermogravimetric curves was different. For example, the range of loss of 1.5 water molecules for all terbium-containing CS samples proved to be slightly higher: for 2P, it is 110–167 °С, and for 3P, 110–172 °С. Similarly, for the loss of 0.5 water molecules, there was a different temperature range: the transition of sample 2P started at 167–178 °C, and that of 3P at 171–178 °C. Thus, we can conclude that the temperature of the onset of the CaSO
4×2H
2O-to-CaSO
4×0.5H
2O transition is higher for terbium-containing materials, and the effect is observed only at temperatures above 160 °C, thereby confirming the presence of a gypsum phase in the synthesized powders (
Figure 1).
2.1.3. XRD investigation of the powders
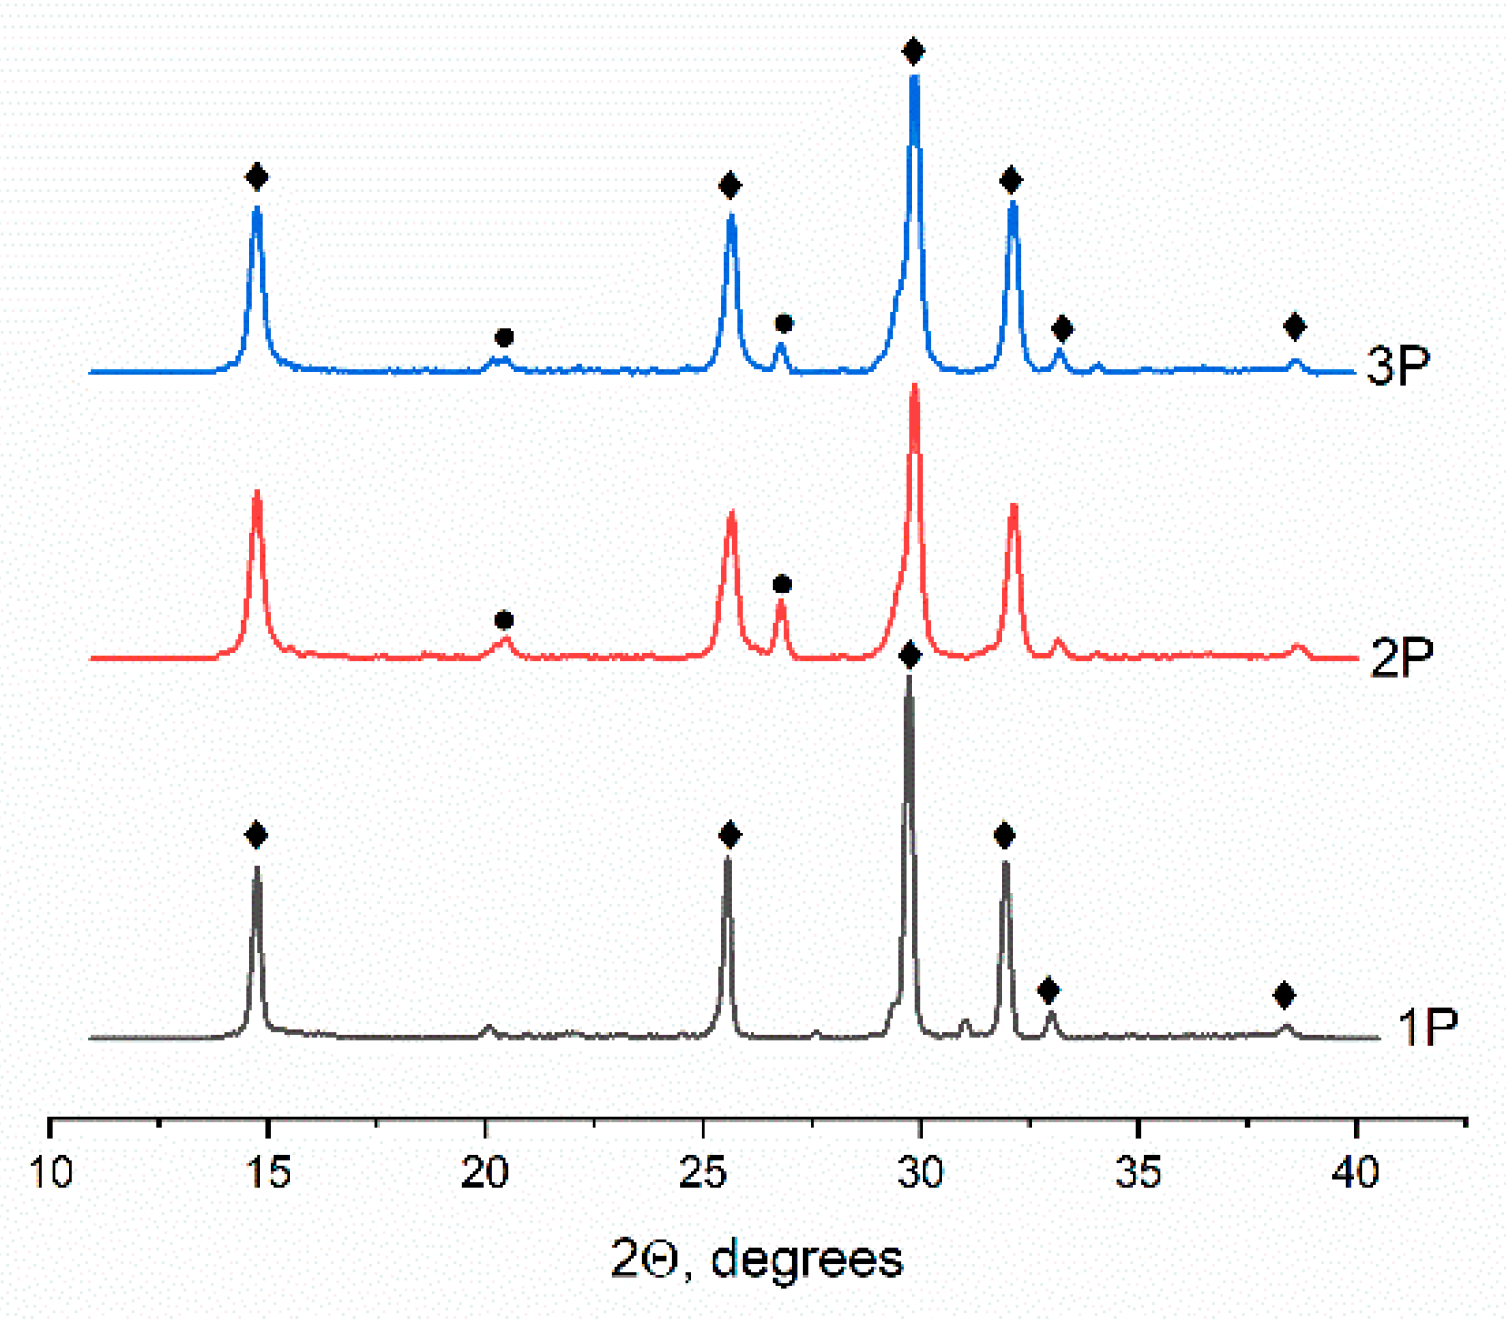
According to XRD data, all the powder materials are characterized by the presence of the main phase of CaSO
4×0.5H
2O (ICDD PDF-2 No. 000-01-0999). The diffraction patterns of powders containing terbium cations also revealed a phase of CaSO
4×2H
2O (ICDD PDF-2 No. 000-33-0311) (
Figure 2). The presence of the second phase in the terbium-containing powders is most likely related to a change in hydration temperature of CS [
28].
Table 2 shows crystal lattice parameters of CaSO
4×0.5H
2O powders heat-treated at 160 °C. One can see that the crystal lattice parameters decreased after the introduction of terbium ions. This outcome is due to the fact that the ionic radius of Tb
3+ is slightly smaller (0.923 Å) than that of calcium (1.0 Å) [
29]. Meanwhile, the increase in the concentration of terbium did not affect the parameters of the crystal lattice, suggesting that only 1.0 mol.% of terbium entered the CS lattice.
2.1.4. FTIR analysis of the powders
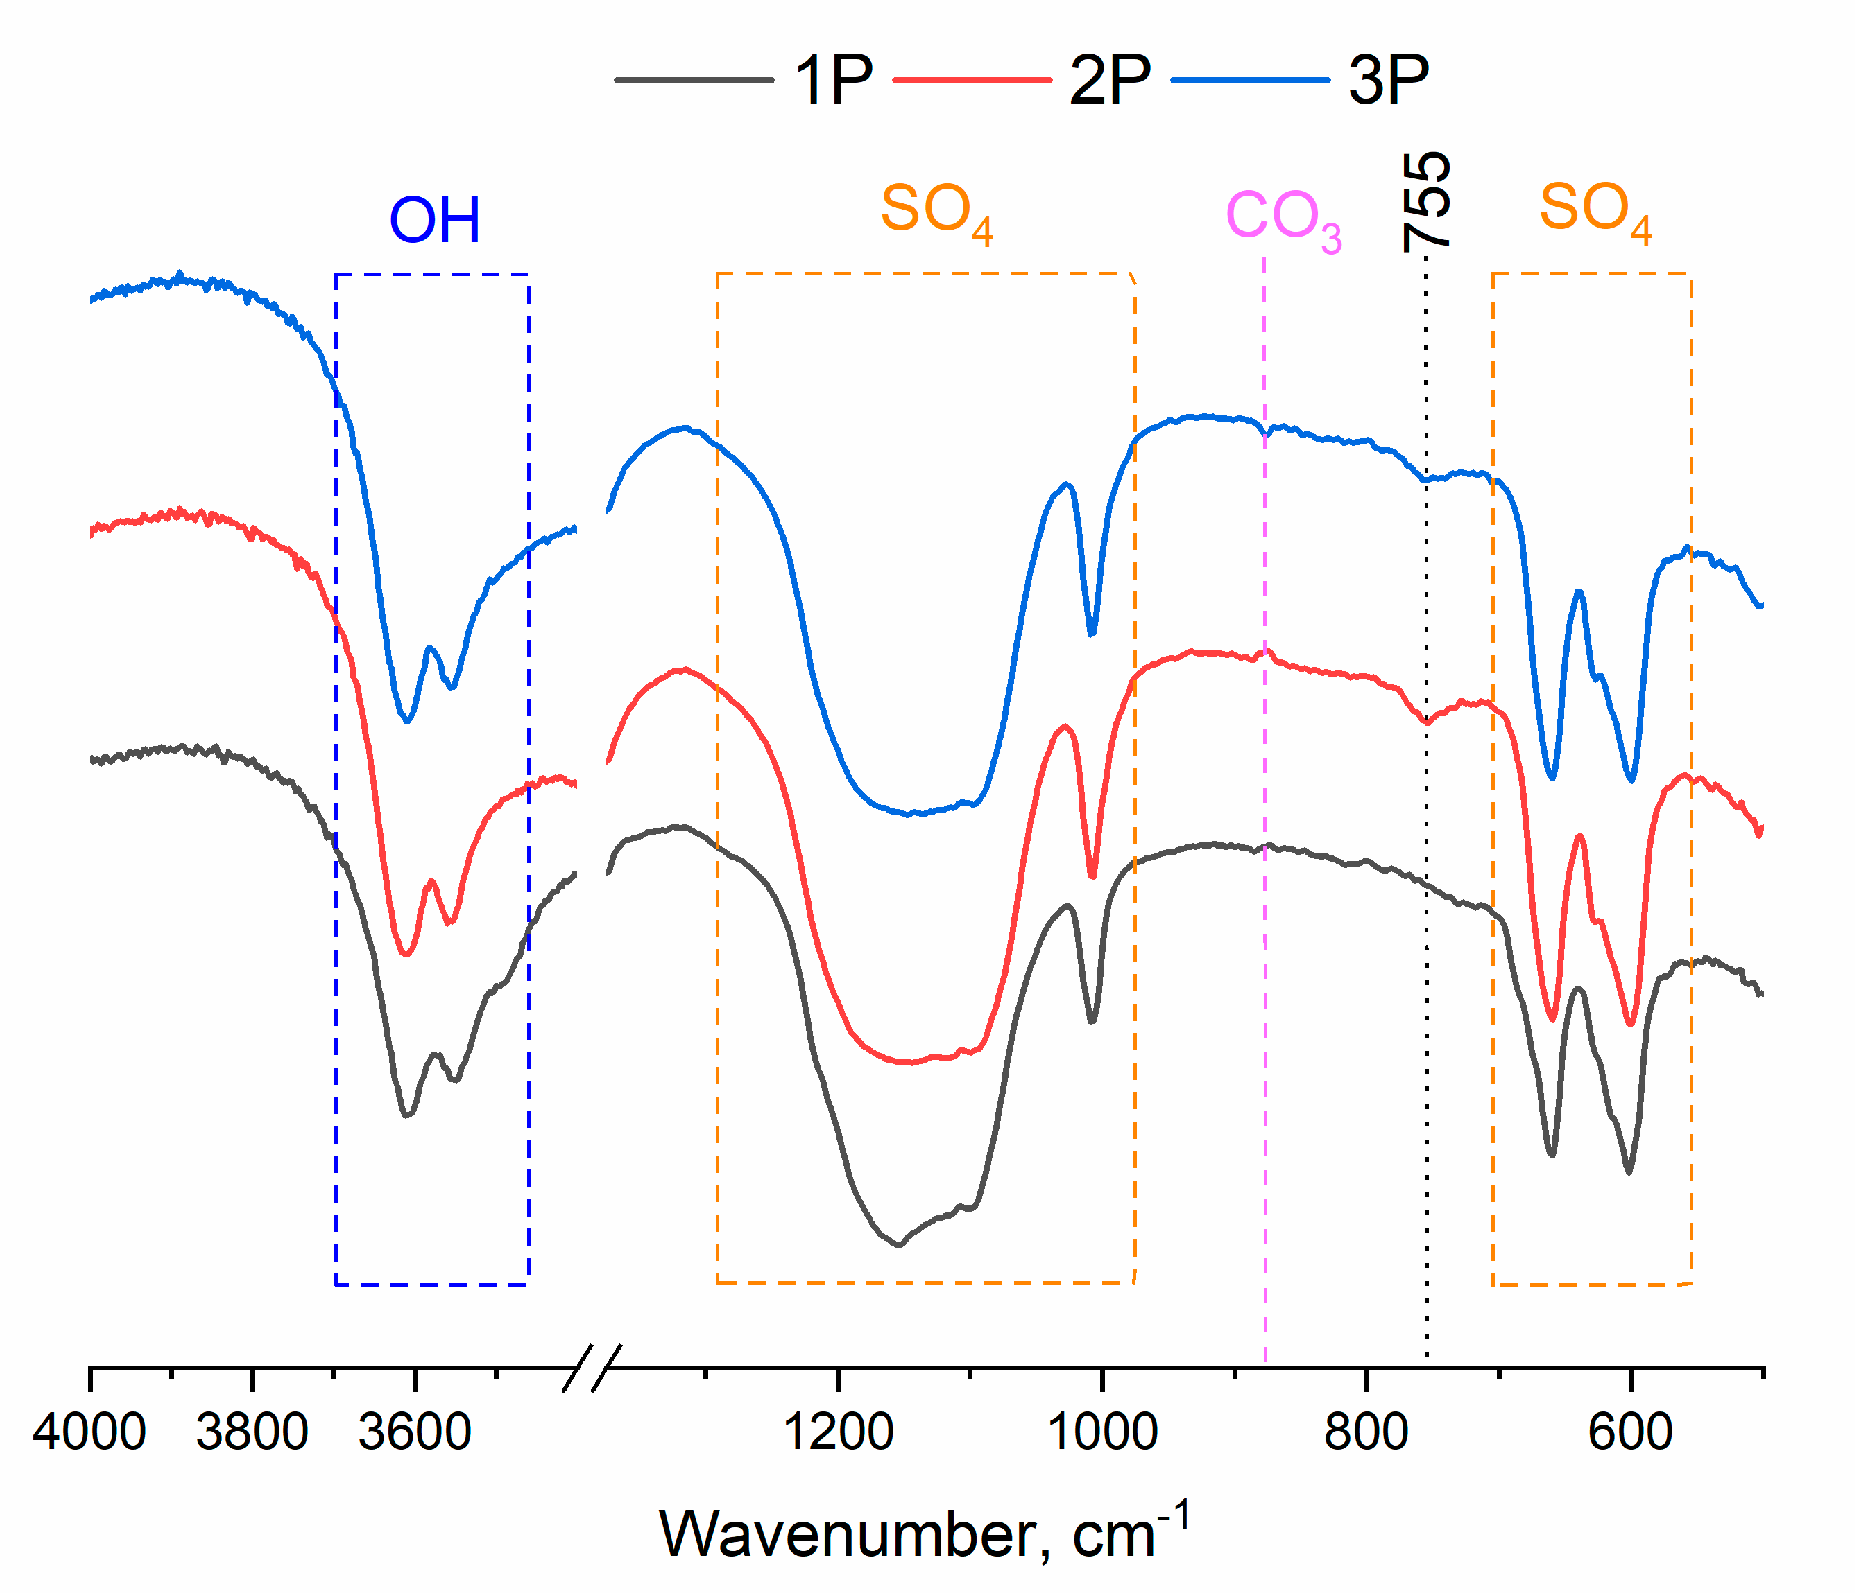
The results of FTIR spectroscopy of the powder materials pointed to the presence of vibrations of sulfate groups in the range of 1282–1048 cm
-1 and their characteristic peaks at 658 and 601 cm
-1 (
Figure 3) [
30]. The peak at 855 cm
-1 belongs to CO
3 groups, which may be due to specific features of the synthesis [
31]. The peaks related to OH
- groups in the range of 3698–3508 cm
-1 give rise to a doublet. The peak at 755 cm
-1 is characteristic of a hydration water molecule that is bound to the rare earth ion (Tb
3+) [
32] and was detectable only in samples 2P and 3P.
2.2. Cement characterization
2.2.1. XRD analysis of the cements
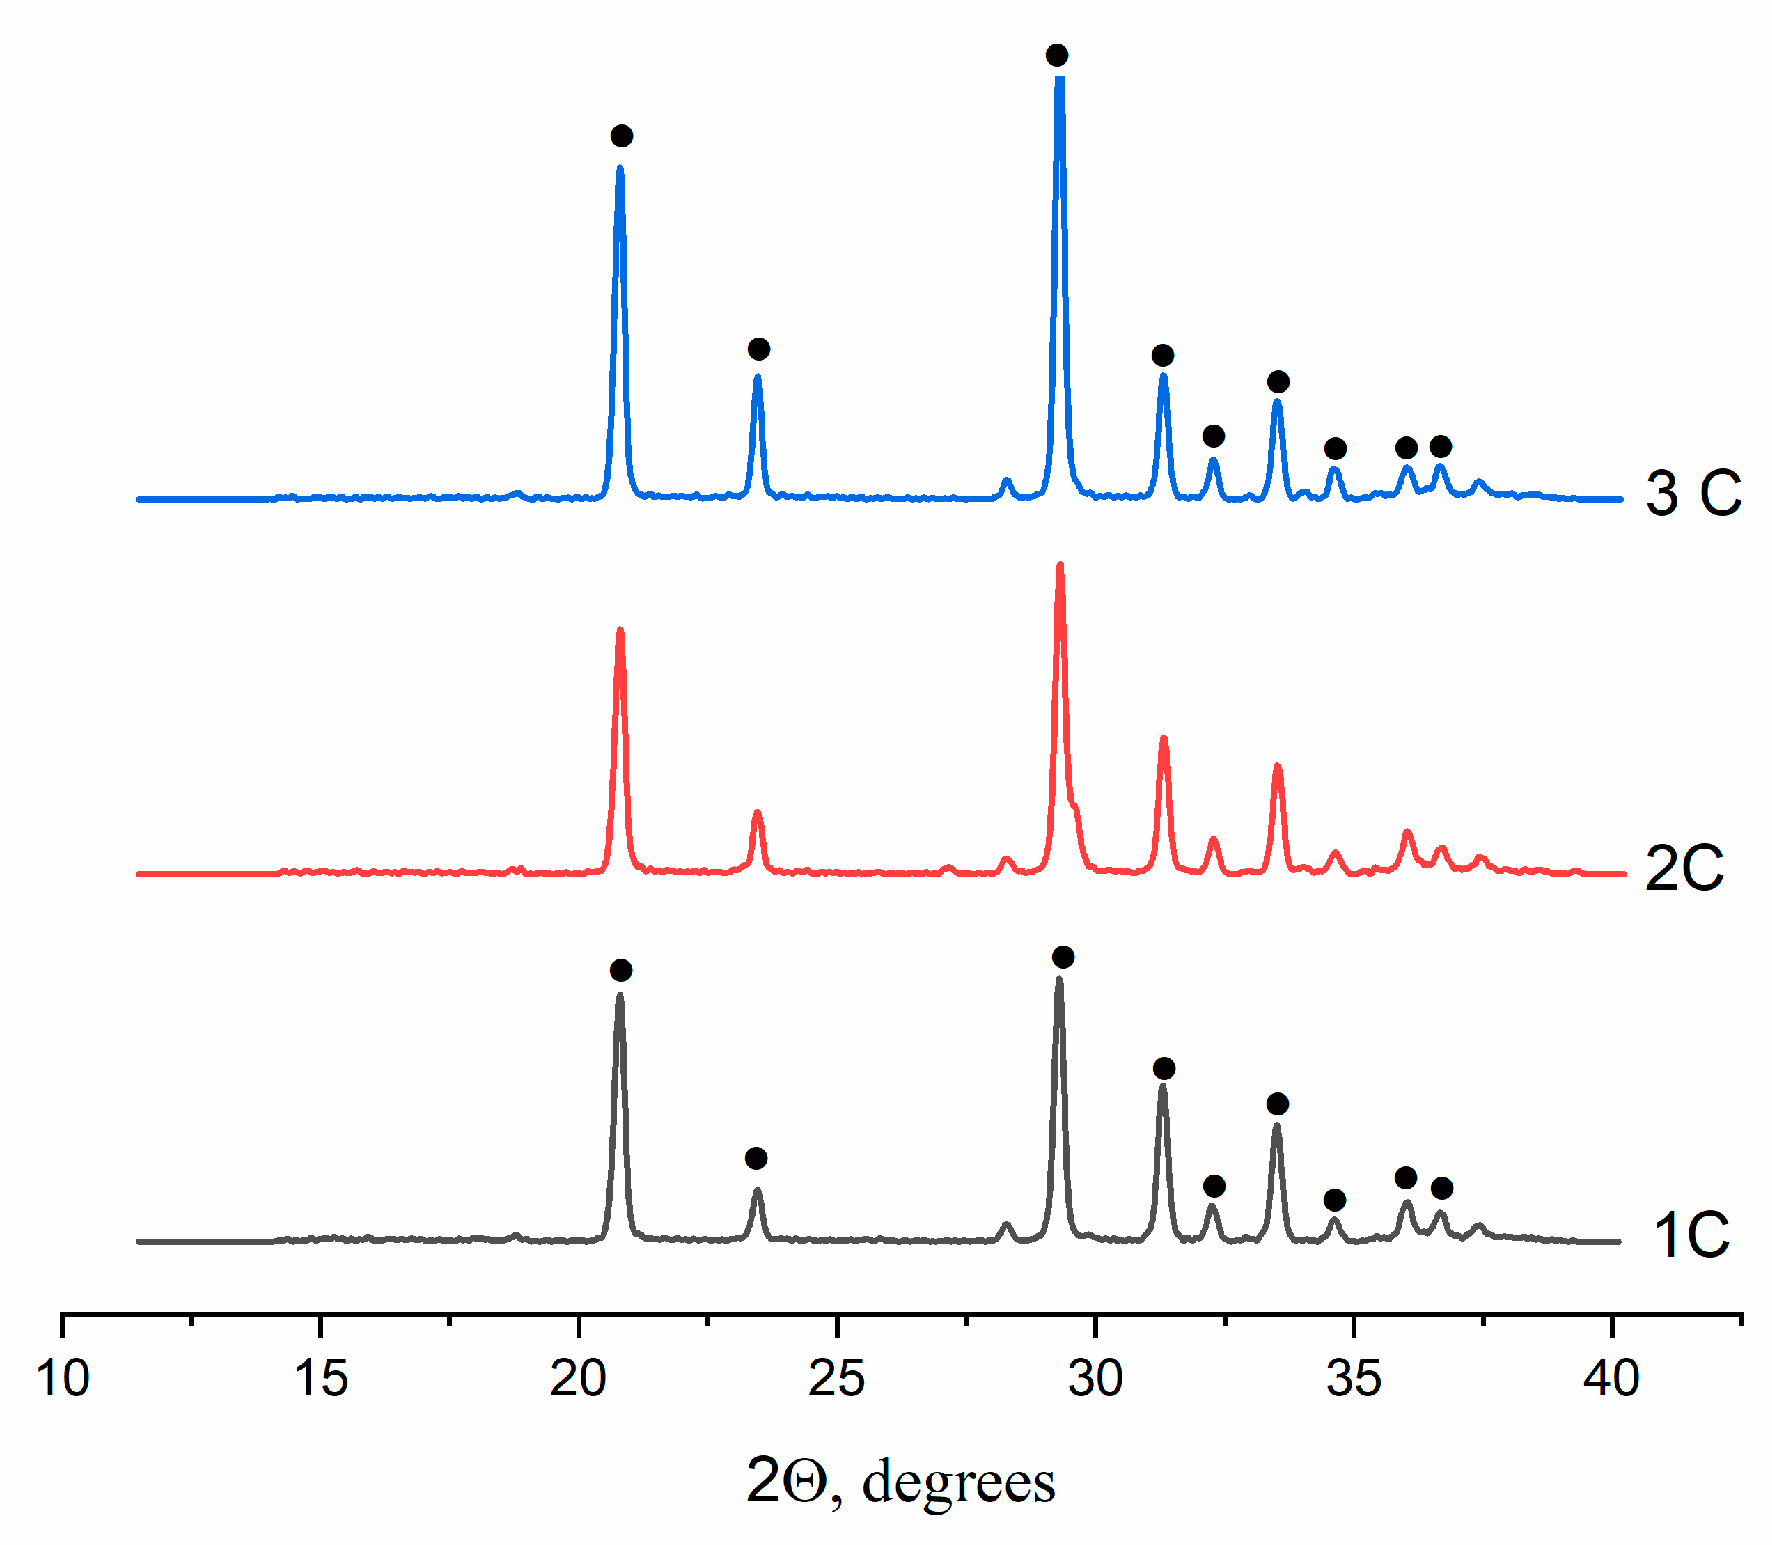
According to XRD data, all cements contained single-phase material CaSO
4×2H
2O (ICDD PDF-2 No. 000-33-0311) (
Figure 4).
2.2.2. FTIR spectroscopy of the cements
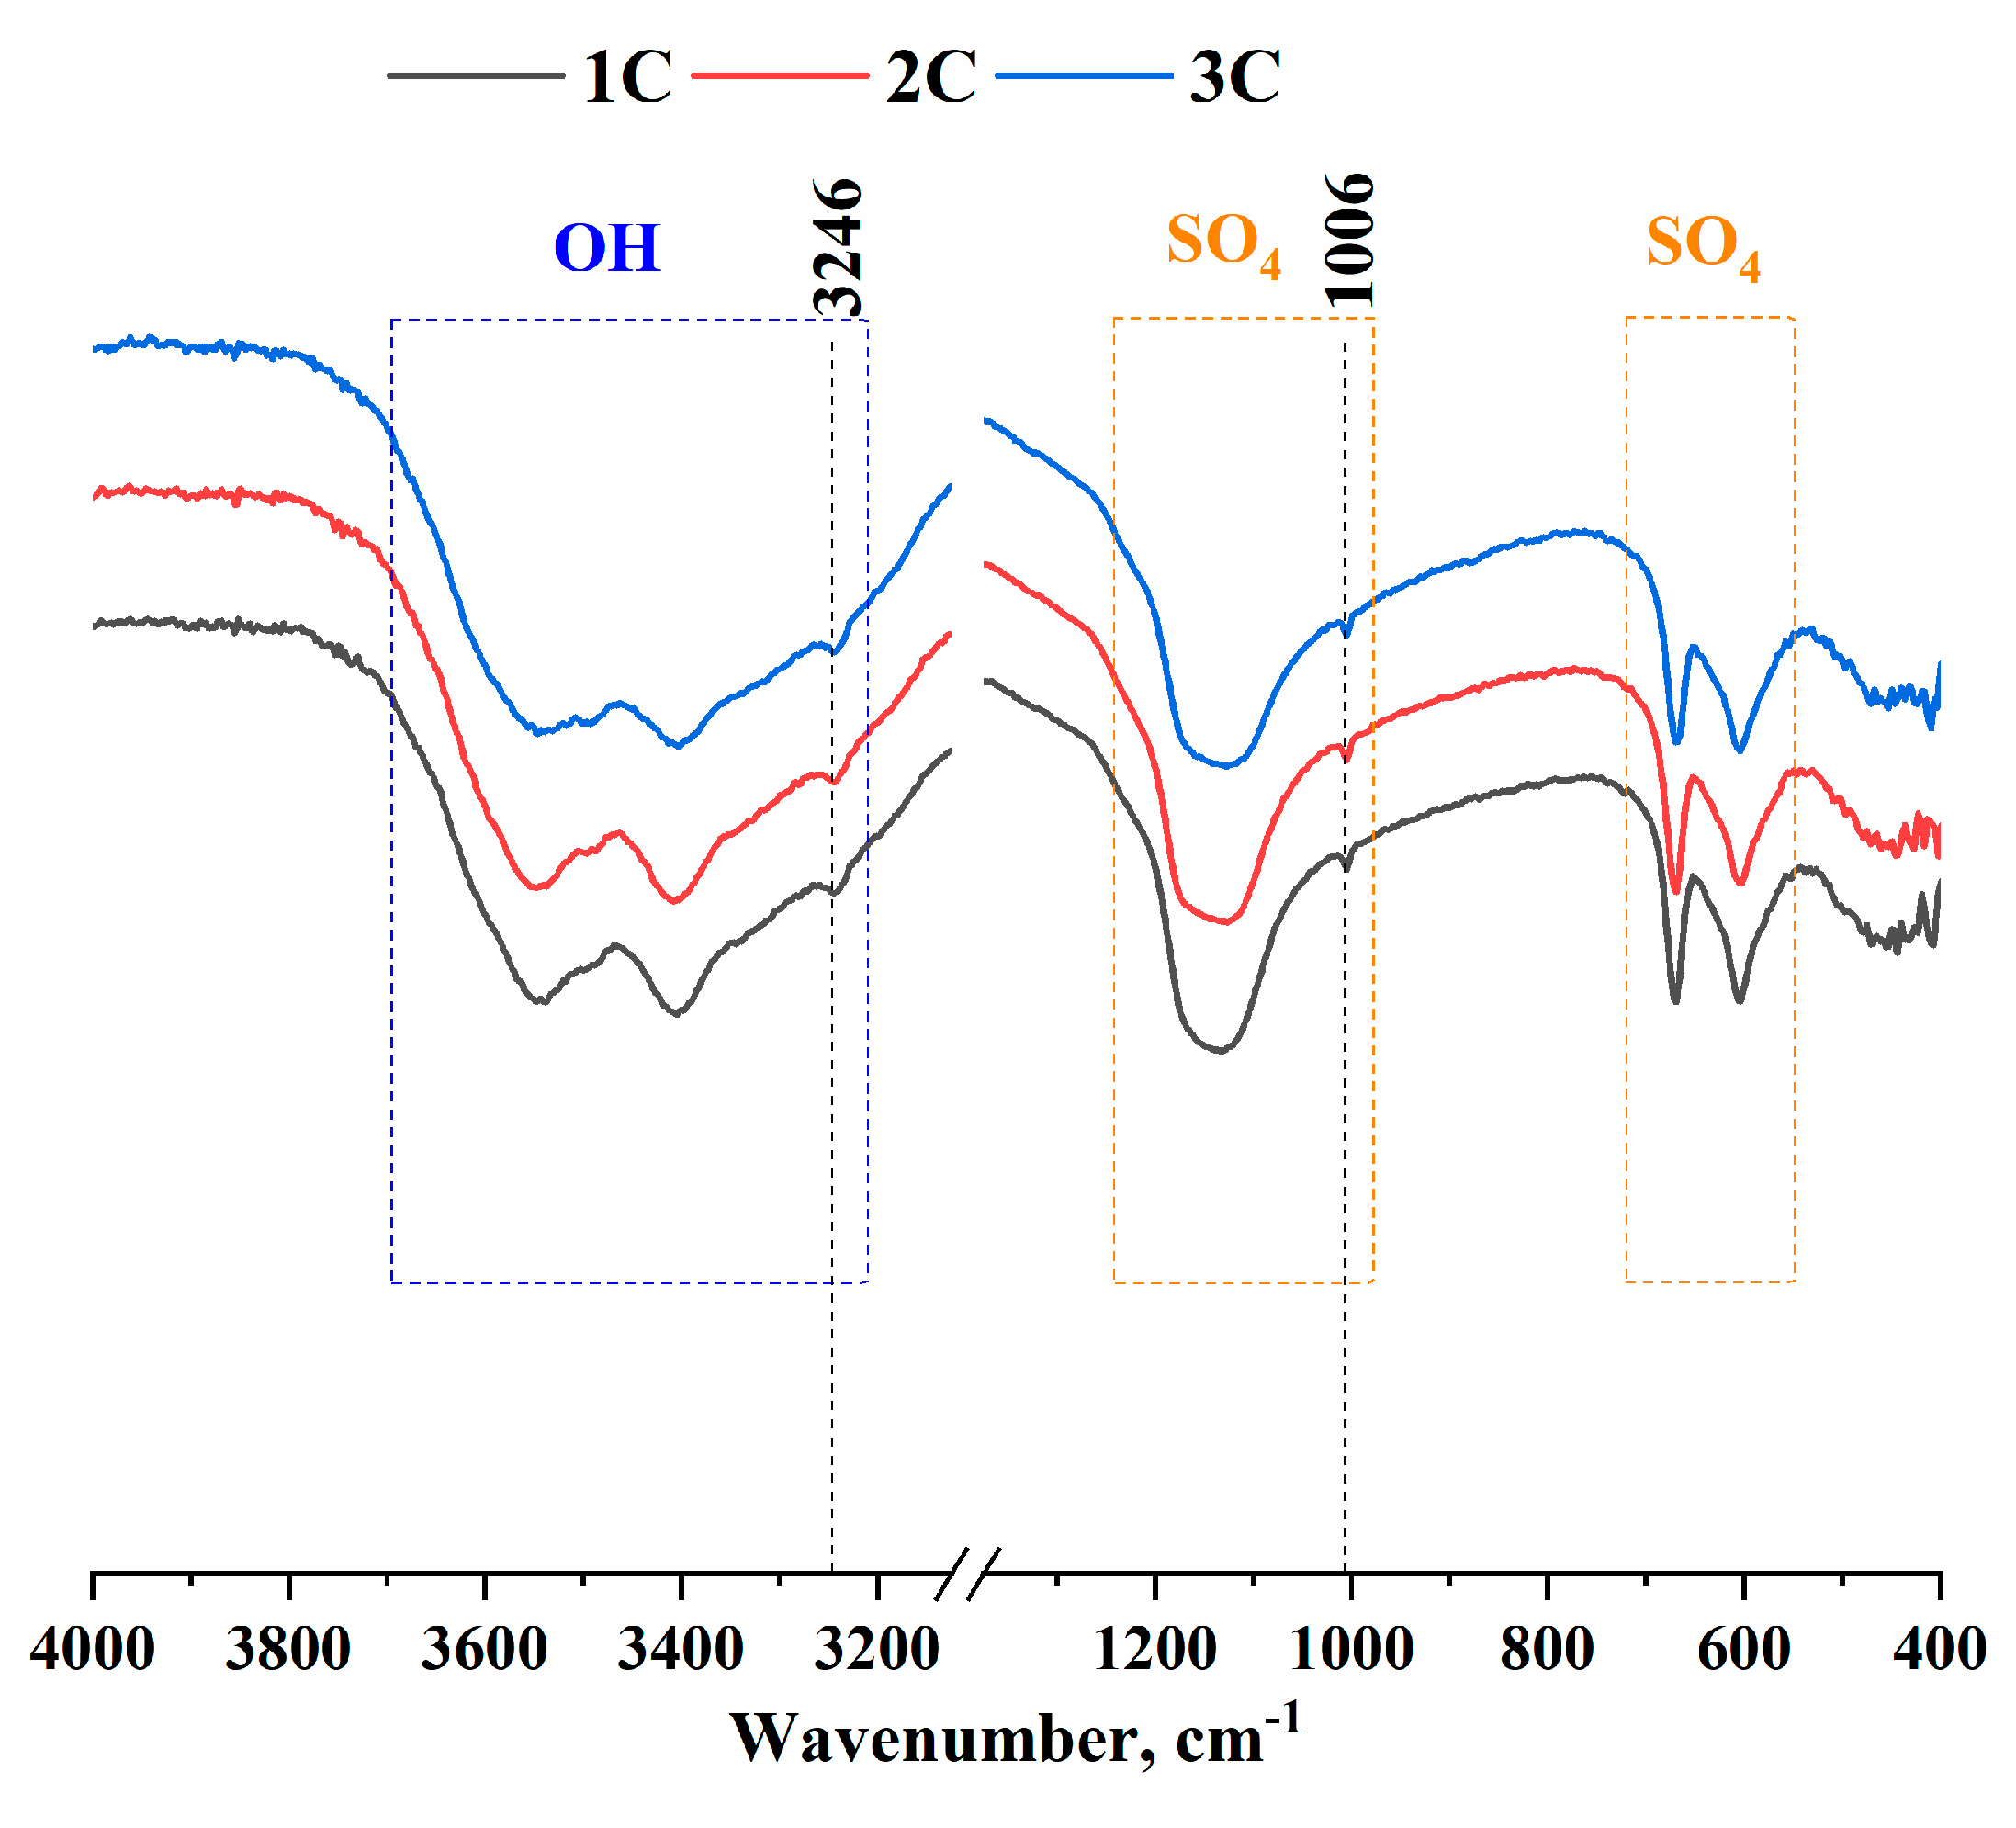
According to these results (
Figure 5), there was SO
42- corresponding to wave numbers 603, 669, and 1006 cm
-1 and the range 1194–1084 cm
-1 as well as OH
- groups matching wave number 3246 cm
-1 and the range 3380–3610 cm
-1. At the same time, in the range of 3610–3380 cm
-1, OH
- groups yielded a triplet characteristic of gypsum [
30].
2.2.3. Setting time
This parameter of cement materials decreased from 15 ± 0.8 to 6 ± 0.3 min with the increase in terbium cation concentration (
Table 3). pH remained neutral.
2.2.4. Microscopic and mechanical analyses
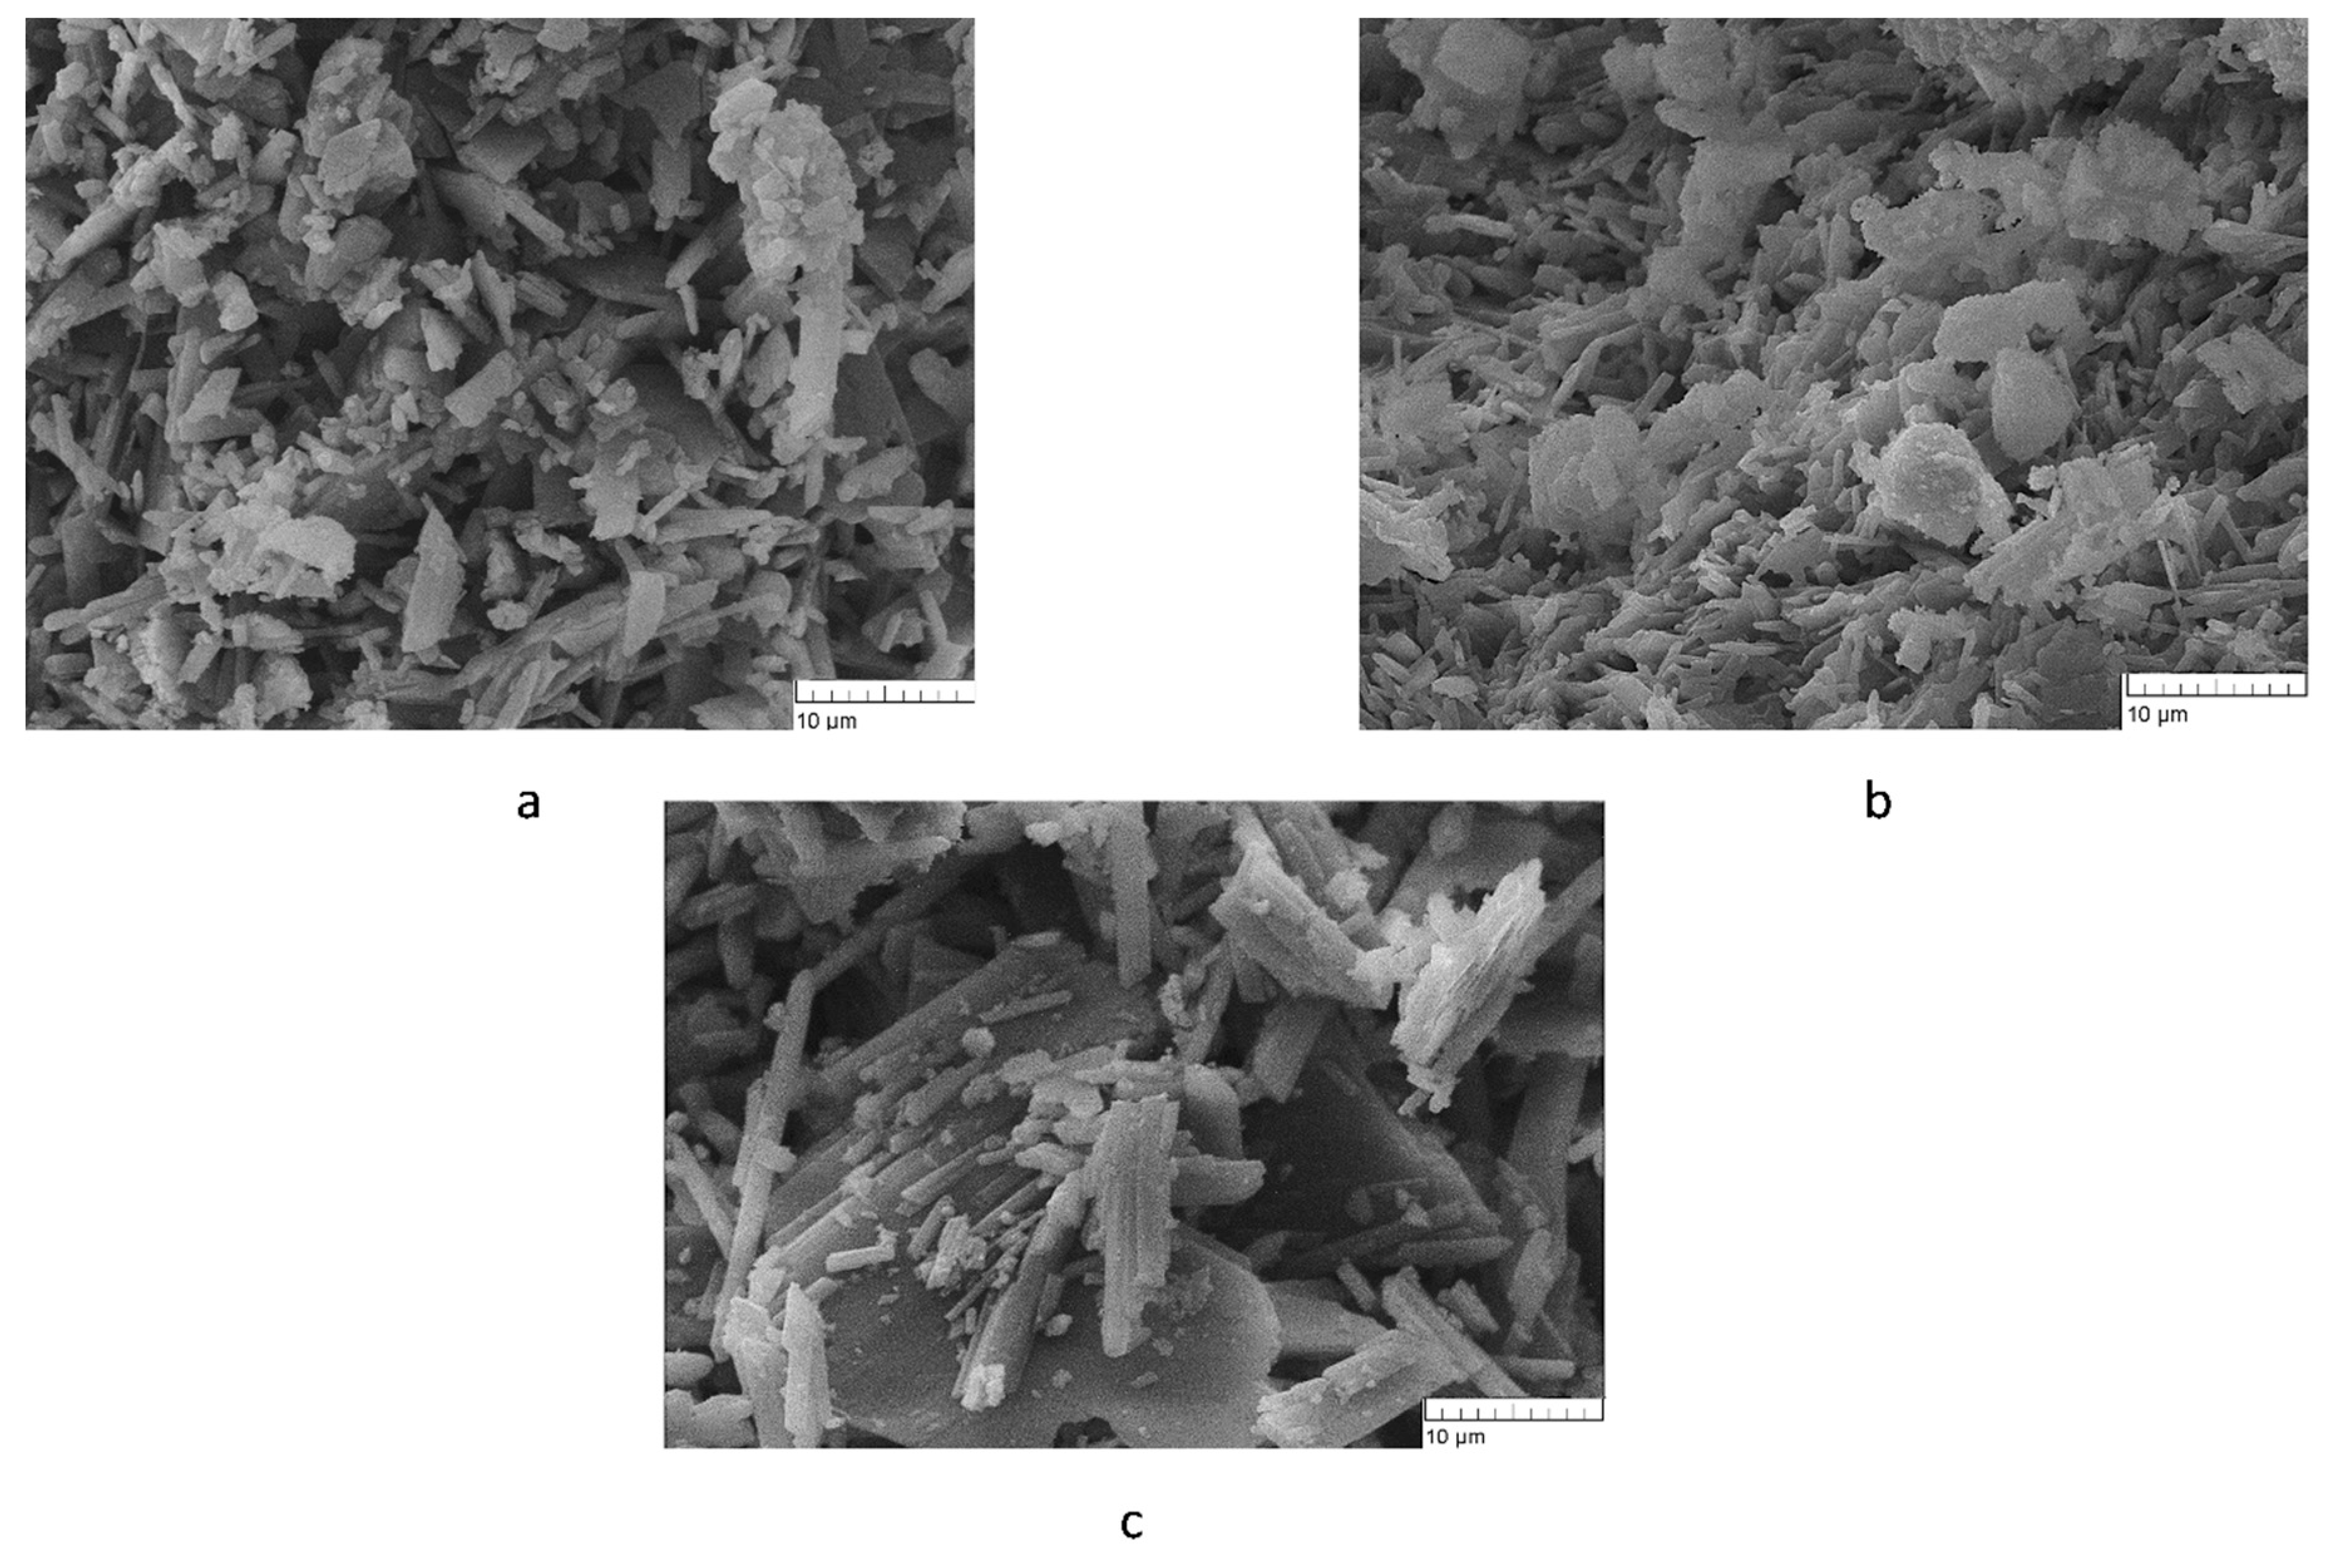
The mechanical strength of cements 1C and 2C was found to be 12.0 ± 0.6 MPa without a significant difference (
Table 3). Sample 3C was significantly different, with a sharp decline down to 2.4 ± 0.1 MPa. This phenomenon can be explained by greater grain size in 3C, as demonstrated later by scanning electron microscopy.
The structure of samples 1C and 2C is represented by prismatic particles whose size is in the range of 2–13 μm (
Figure 6a,b). These cements have very similar microstructure, which is most likely due to the incorporation of Tb
3+ into the CS lattice. In sample 3C, the particle size is much greater, reaching 21–23 μm (
Figure 6c) and resulting in looser more porous structure and lower strength. In this material, Tb
3+ apparently remains in the state of an oxide and is an inert filler that prevents close contact between grains at the time of cement mixing.
2.2.5. Solubility assays
Mass losses of the cements after soaking in SBF are shown in
Table 4. Readers can see that the bulk of mass loss (~20% loss) took place on the first day of the test, with slight growth as the terbium content was increased. Afterwards, there was almost no change in the mass of the samples.
Data on the release of Tb
3+ into the extracts are given in
Table 5. With longer time of exposure of the samples to SBF, the concentration of Tb
3+ in the extract rose. Meanwhile, for 2C materials, the cation release was more uniform, which may be due to the fact that Tb
3+ entered the CS lattice and the matrix was dissolved uniformly just as pure gypsum. In 3C cements, terbium did not fully enter the lattice and was most likely present in the form of insoluble terbium oxide Tb
4O
7, which can slow down sample dissolution [
33].
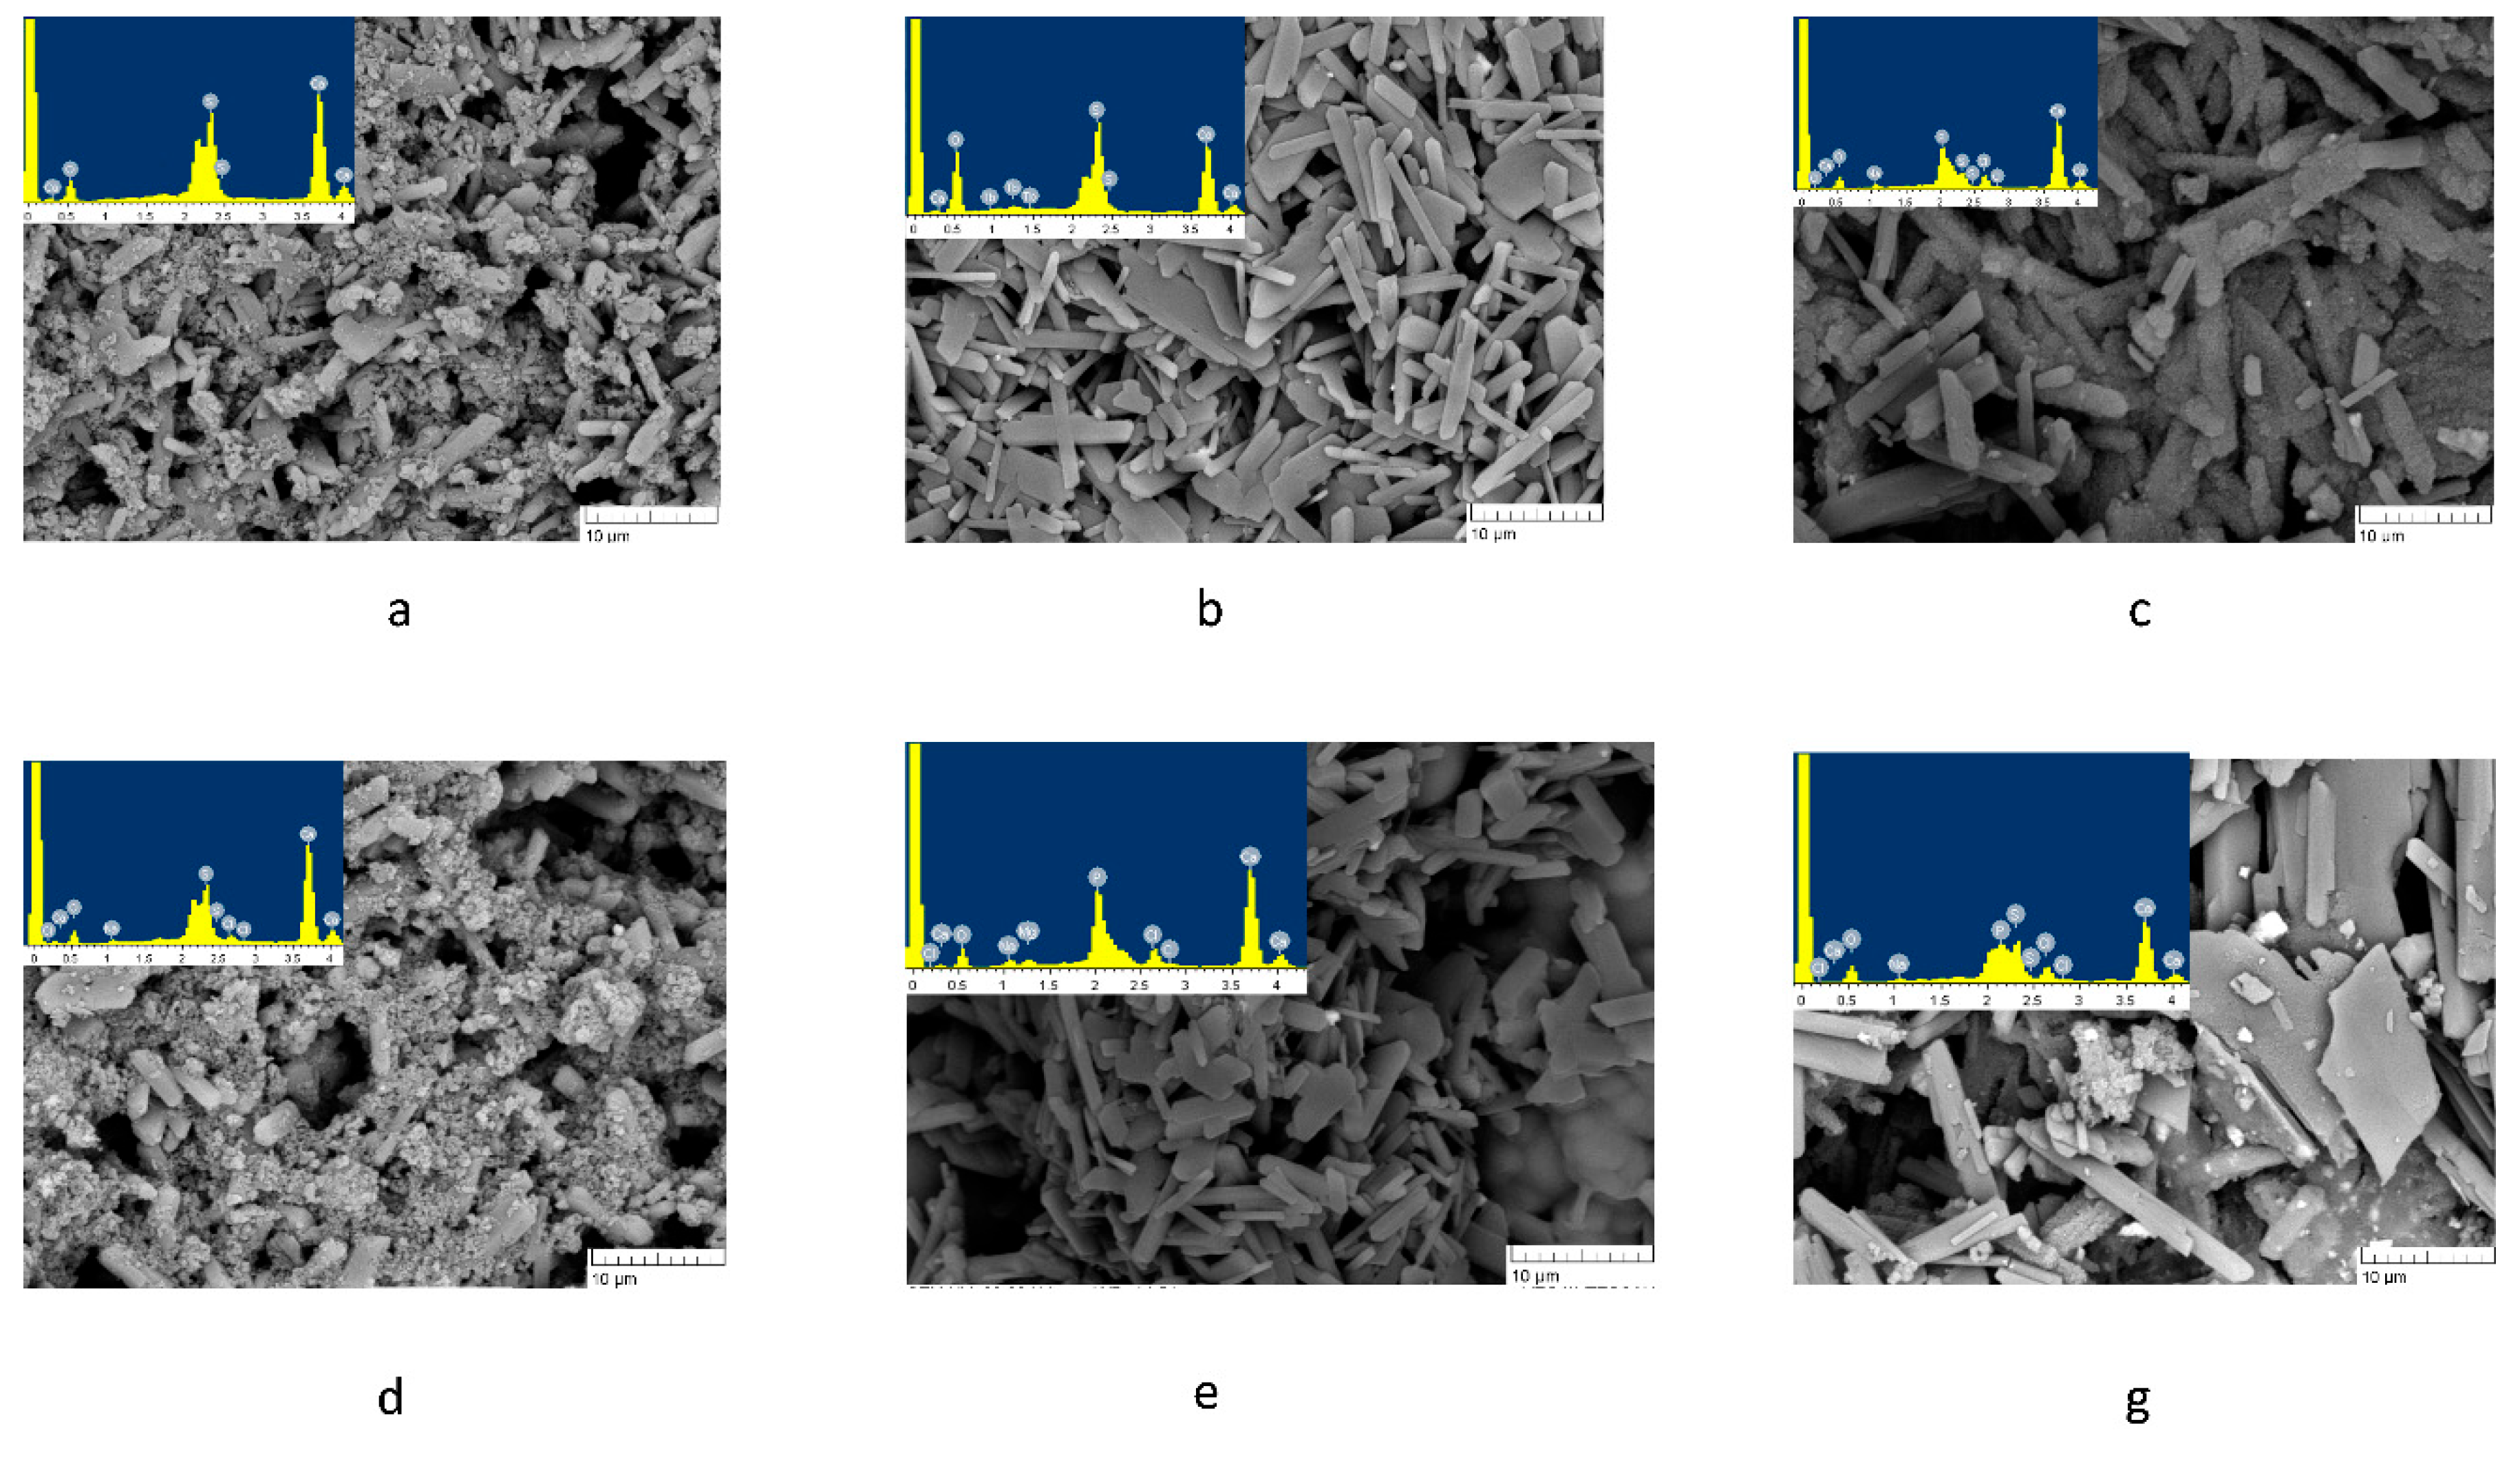
Figure 7 shows micrographs of surface structure of the cements along with energy dispersive analysis data. For sample 1C, on the 7th day of exposure to SBF, elements Ca, S, and O were detectable on the surface, corresponding to the gypsum phase (
Figure 7a). After 14 days of exposure to SBF, sodium chloride was "salted out," confirming the presence of elements Na and Cl (
Figure 7d) [
34]. For 2C cements, aside from the elements corresponding to gypsum, element Tb was detected on day 7 of the experiment but was no longer detectable on day 14 (
Figure 7b,e). At the same time, elements representing sodium chloride and phosphorus were found, indicating the emergence of a CPL on the surface of the samples. In the case of 3C, phosphorus was also registered on the 7th day of the experiment, and the micrographs show particles covered with a loose layer, most probably a mixture of sodium chloride and calcium phosphate (
Figure 7c,f). The absence of Tb can be attributed to the formation of a denser CPL and NaCl on the surface of the sample.
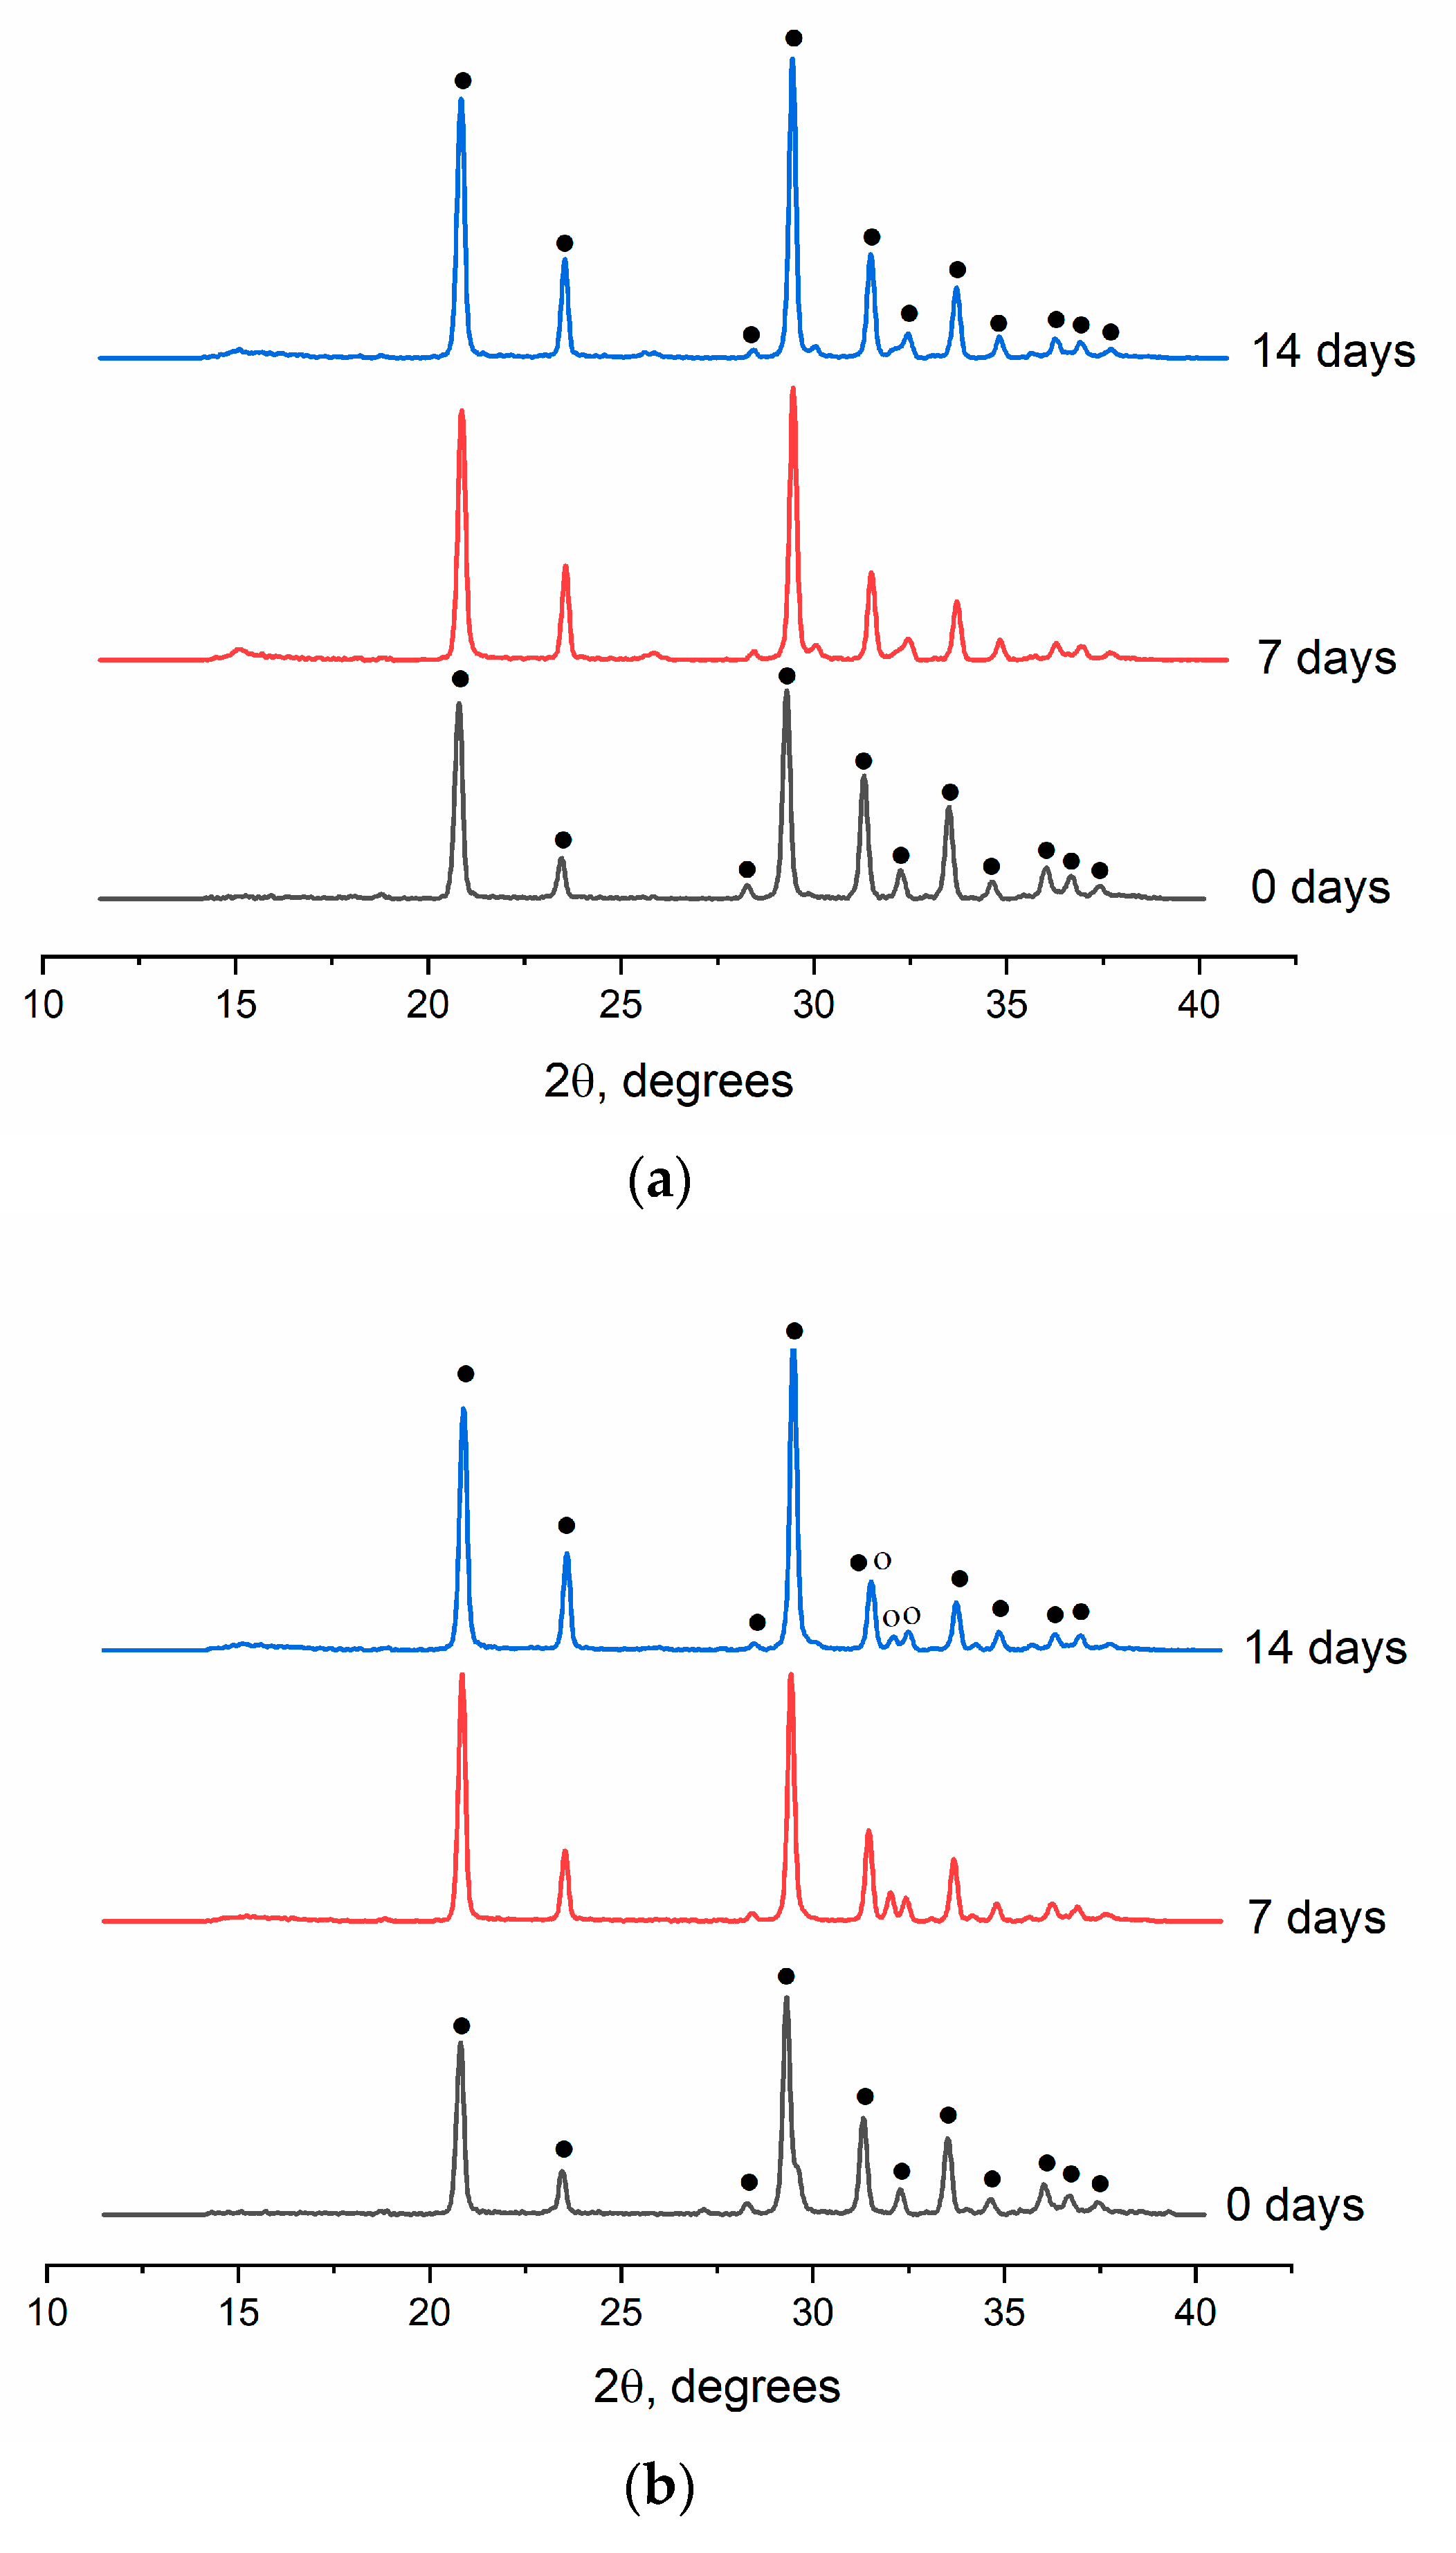
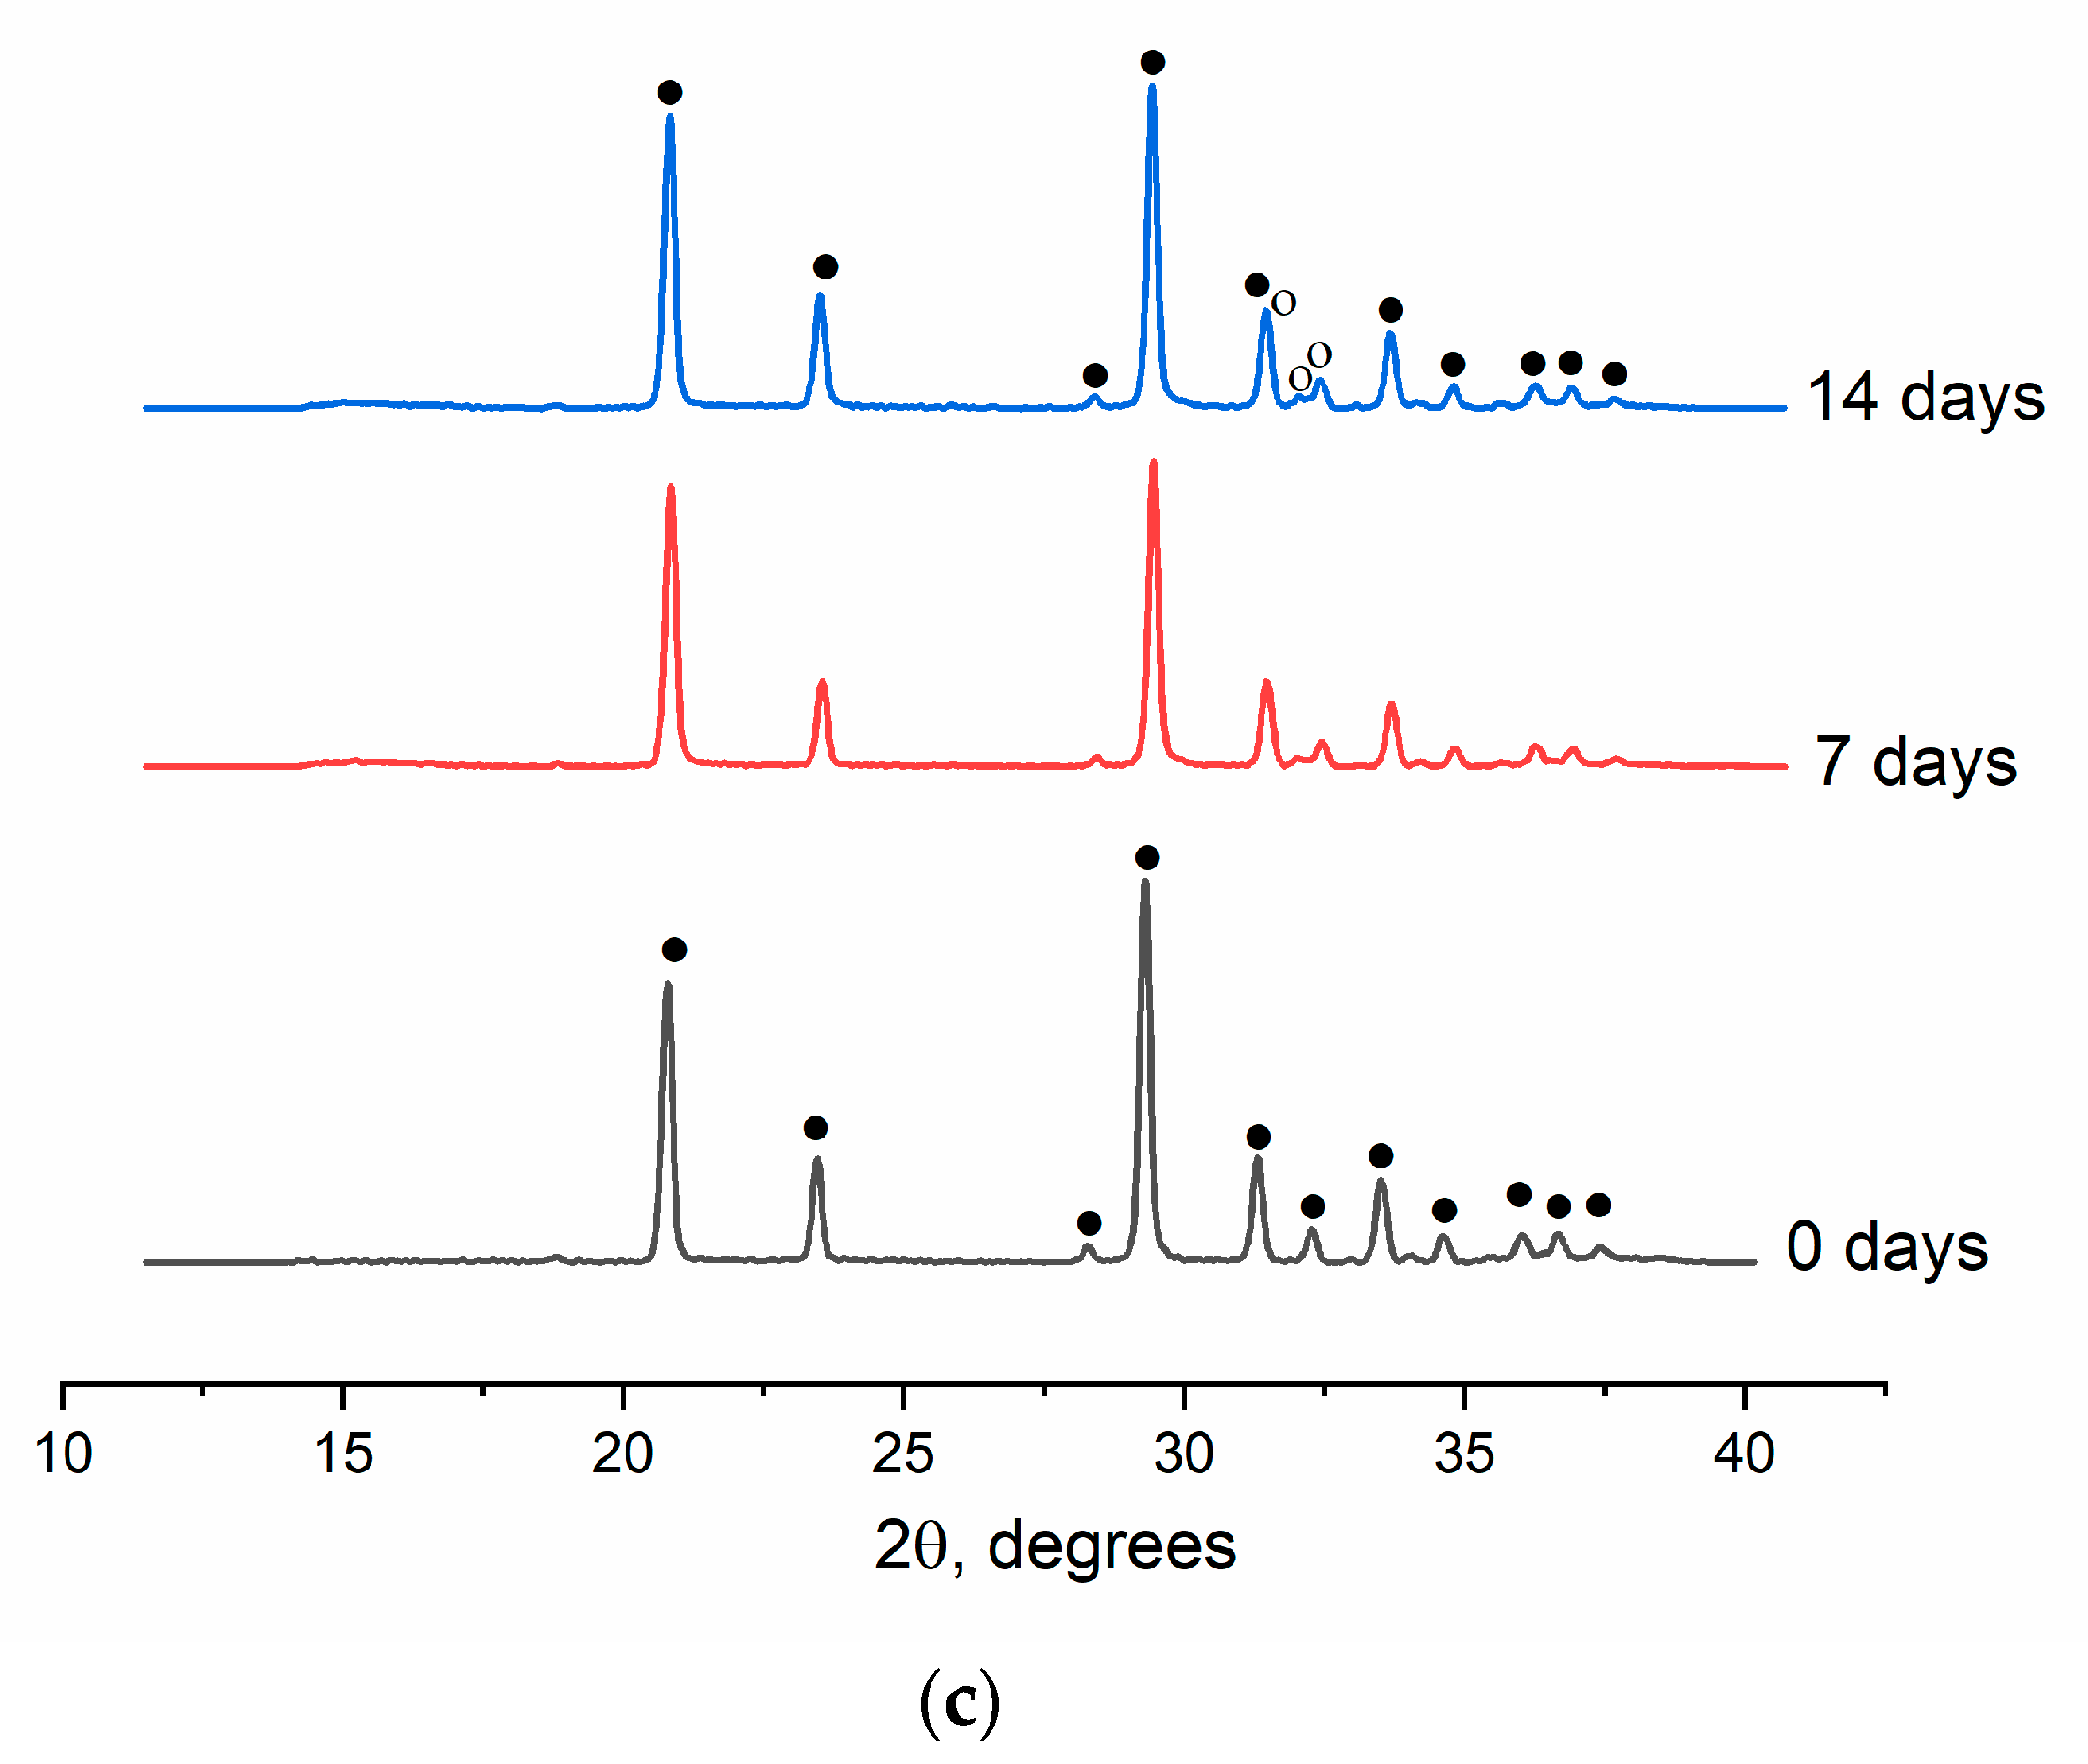
The presence of the CPL on the samples surface was confirmed by XRD data pointing to the presence of an HA phase (
Figure 8). For example, for cement 1C, only the gypsum phase was registered throughout the test (ICDD PDF-2 No. 000-33-0311) (
Figure 8a). For cements 2C and 3C, the second phase (HA) appeared already on the 7th day of the test (ICDD PDF-2 No. 000-09-0432), confirming the formation of the CPL on the surface of the samples (
Figure 8b,c).
2.2.6. Photoluminescence experiments
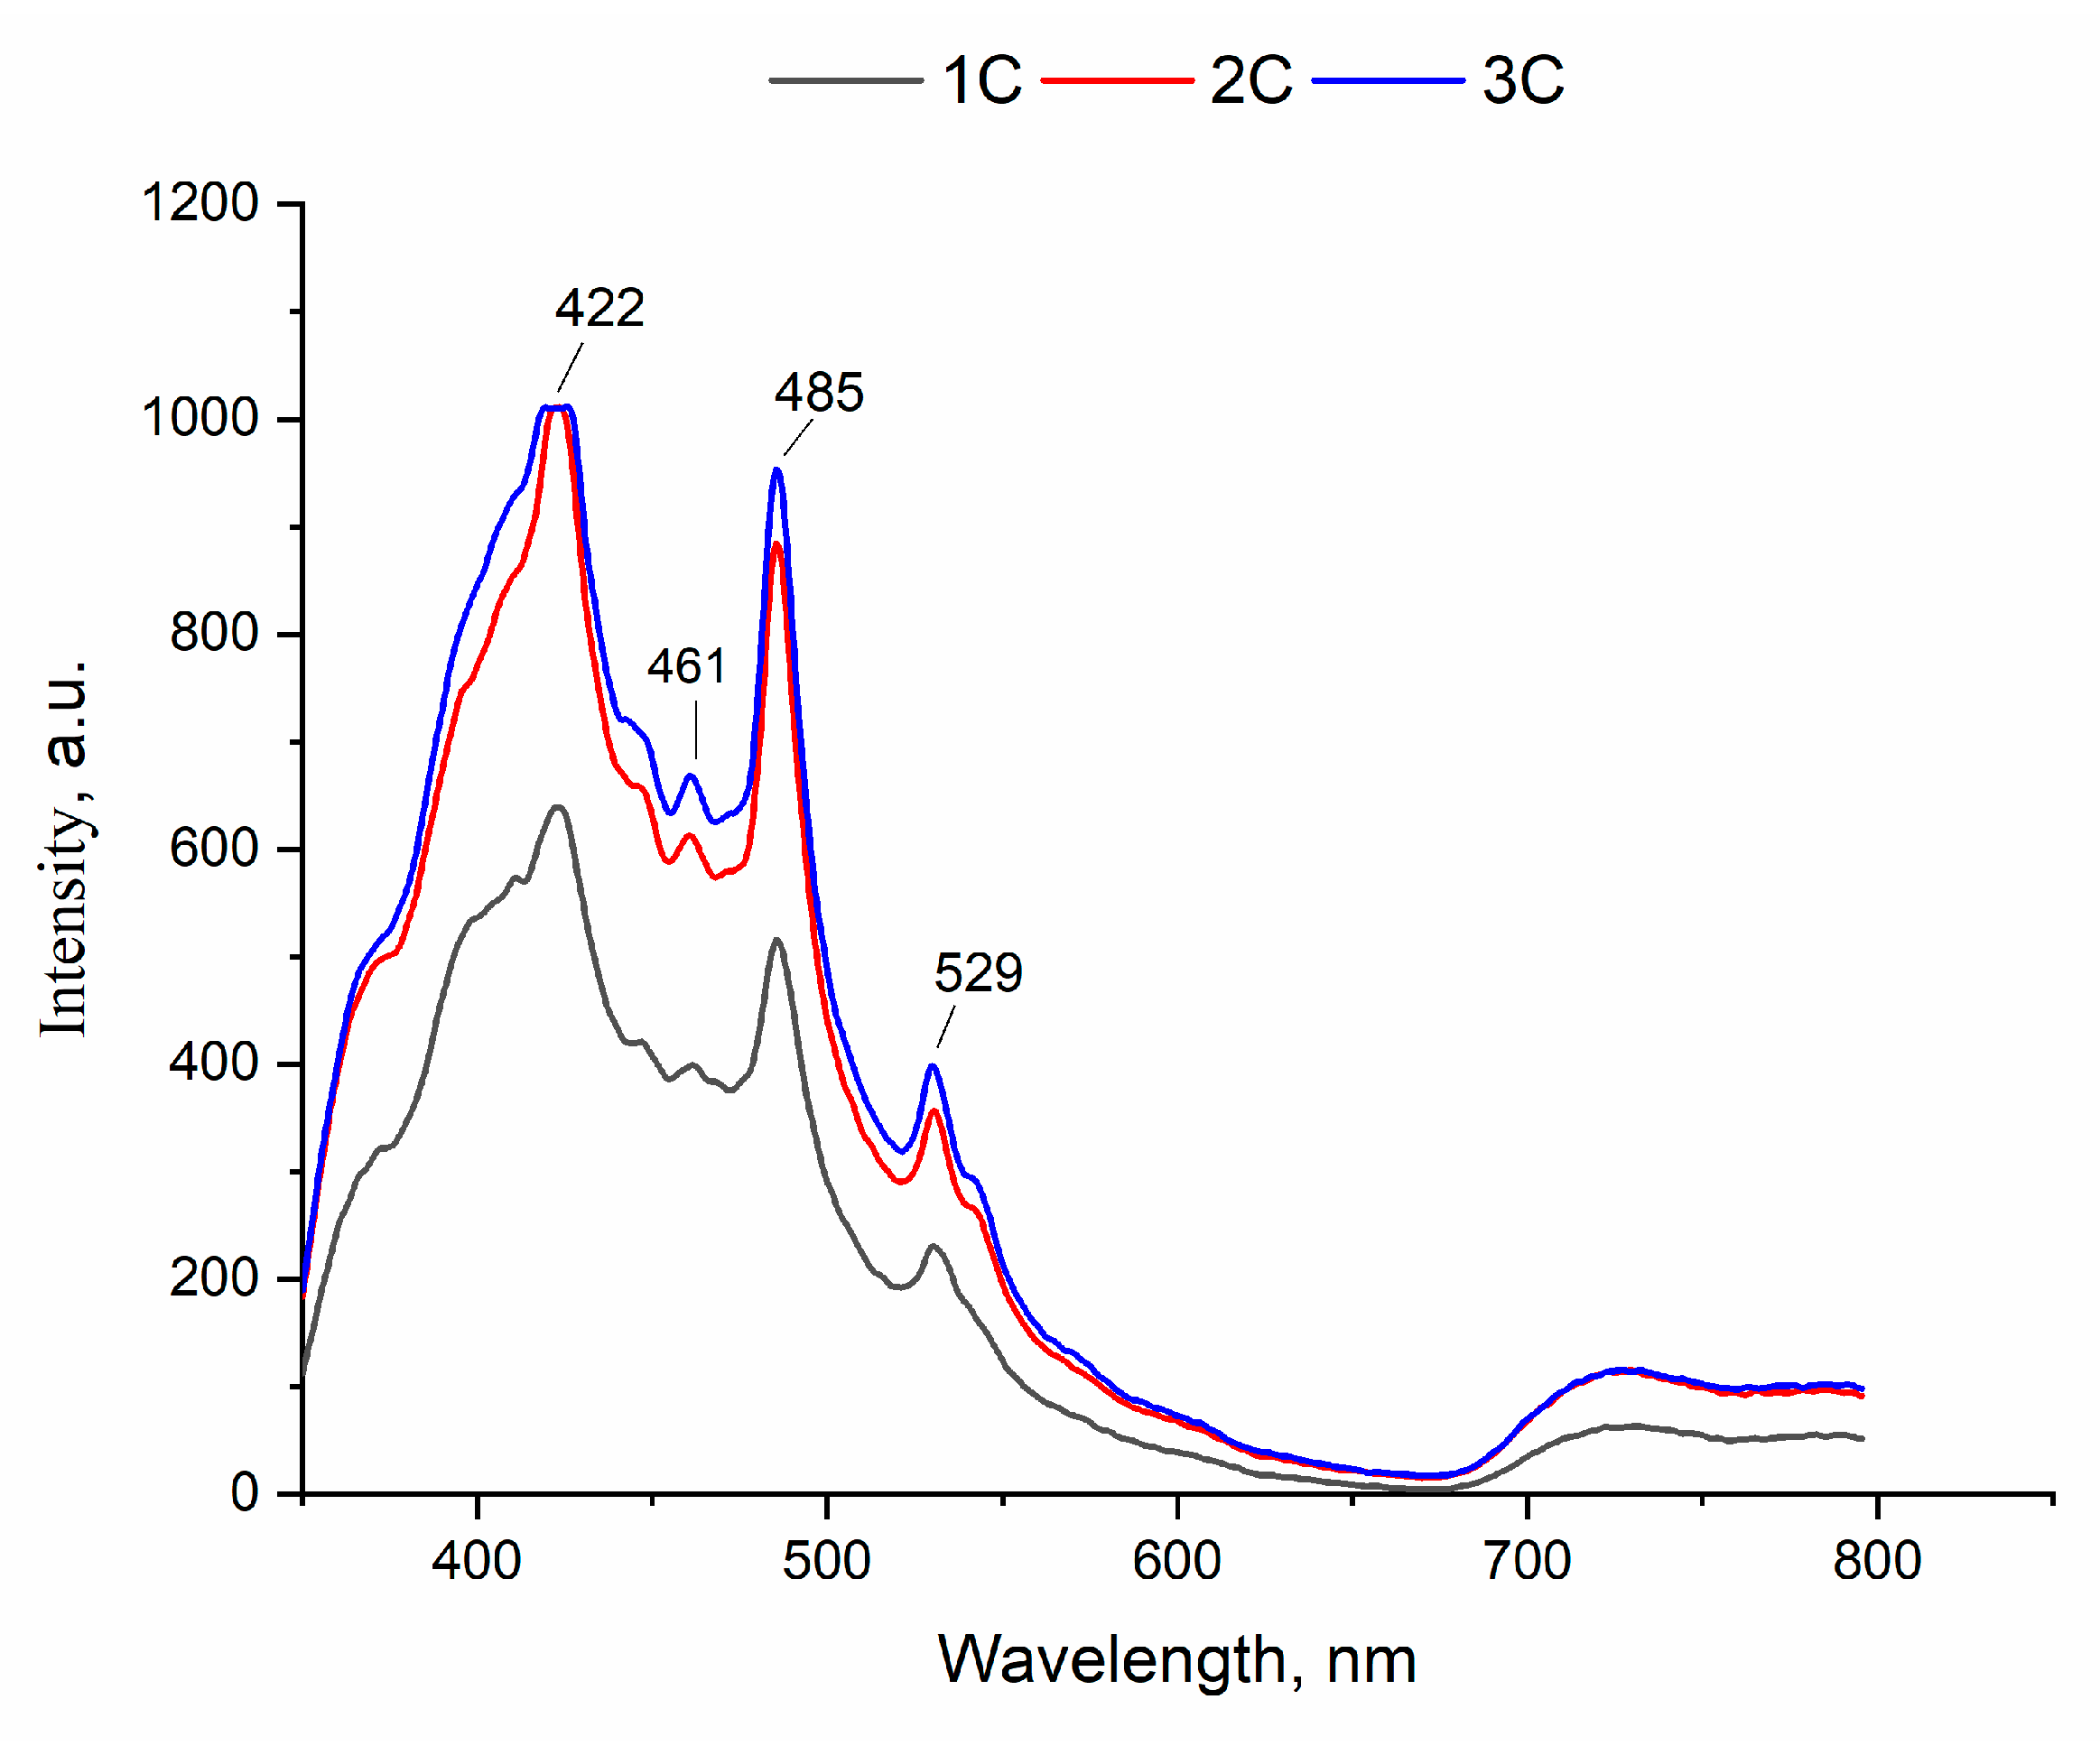
These analyses of the cements were carried out at an excitation wavelength of 276 nm [
35].
Figure 9 depicts the samples emission spectra, consisting of strong emission bands at 422 and 485 nm and weak ones at 461 and 529 nm. It is reported that cements exhibit luminescence in both green (422 nm) and blue (485 nm) regions [
36].
Meanwhile, it is important to note that emission intensity strengthened with the addition of 1.0 mol.% of Tb3+ and did not change with further increases of its concentration.
3. Discussion
Currently, there is only limited investigation about the use of terbium in biomaterials research. There is no information about the doping of gypsum bone cements, while many studies are devoted to the doping of CS phosphors with terbium [
37,
38,
39]. The largest number of research articles deal with the impact of terbium on calcium phosphate [
21,
40], combined bioglasses [
41,
42], organic hydrogels [
43], and some other related topics. A major difference between phosphors and gypsum cements is the heat treatment temperature. For instance, in ref. [
44], a mixture of salts CaSO
4, (NH
4)
2SO
4, Tb
4O
7, TbCl
3, NaCl, NaBr, and Na
2SO
4 was thoroughly ground in an agate mortar and heat treated at 750 °C for 2 h. These synthesis conditions are not appropriate for the production of gypsum cements owing to low temperature (160 °C) of transition of CS hemihydrate to anhydrous CS [
45]. It is known that CS anhydride does not give rise to durable gypsum cement materials [
46].
The introduction of different cations into CS can affect the temperature of hydration of CS dihydrate to anhydrite. For example, the introduction of lithium cations up to 5.0 mol.% shifts the hydration temperature toward lower values [
28]. For instance, the range of loss of 1.5 water molecules by lithium-containing CS samples is shifted from 110–160 to 50–150 °C as compared to control CS samples. Li-CS is characterized by a shift of the temperature range from 160–190 to 150–180 °C for the loss of 0.5 water molecules. In our work, the addition of the terbium cation to CS slightly raised the hydration temperature for the loss of 1.5 water molecules to 110–172 °C, and for the loss of 0.5 water molecules, to 167–178 °C. When HA is doped with Tb
3+, up to 5.0 at. % incorporation into the lattice is observed [
29]. In our case, the introduction of only 1.0 mol.% of Tb
3+ altered lattice parameters [
47] while preserving phase composition (CS), pointing to the incorporation of Tb
3+ into the lattice of CS hemihydrate. We can speculate that this outcome is due to the methods of synthesis of the powder materials. In the case of HA, the materials were obtained by chemical precipitation of salts, whereas in our case, by mechanochemical synthesis. Ref. [
48] suggests that at the pH value 7.4, calcium phosphate doped with 5.0 mol.% of Tb
3+ is barely soluble in phosphate buffer. Our solubility experiment revealed that the terbium doping did not promote mass loss of the cement samples. Previously, the introduction of 1.064 mg/l Mg
2+ into CS has increased solubility from 1.605 to 3.360 mg/l [
49]. Additionally, an assay of the solubility of CS cements—doped with phosphate groups up to 20.0 mol.%—in SBF has uncovered the emergence of a brushite phase on the surface of the samples on the 28th day of the experiment [
19]. In our work, an HA phase formed on the surface of the cements as early as the 7th day of the soaking and showed higher reactivity in vitro. An increase in the concentration of Tb
3+ in HA enhances emission intensity according to spectrophotometric data [
29], in agreement with our data on CS cements. Furthermore, ref. [
50] suggests that CS cement produced in Alberta (Canada) and heat-treated at 28 °C is characterized by broad luminescence bands with the most pronounced peak at 444 nm (falling into the green region) after excitation at 300 nm. At other excitation wavelengths (360 and 436 nm), the luminescence region falls within the green and blue color ranges, consistently with our data.
Luminescence bioimaging is a unique approach to visualization of morphological details of tissues with subcellular resolution and has become a powerful tool for the manipulation and investigation of microspecies of live cells and animals [
51]. The introduction of Tb
3+ into HA nanoparticles substantially improves the visualization of bone defect filling by micro–computed tomography [
52] and of upconversion luminescence–based in vitro confocal imaging of the cytosol of murine macrophages [
53].
The cement materials developed in our work can be used for both bone defect filling and bioimaging and are promising for further investigation in the fields of drug delivery and intrinsic antibacterial properties in the treatment of bone tissue infections [
54,
55,
56].
4. Materials and Methods
4.1. Powder synthesis
The synthesis of powder materials containing terbium cations was carried out by the mechanochemical method [
15] according to the following scheme:
where х is the content of Tb
3+ with х = 0, 0.01 or 0.02.
A mixture of salts [Ca(OH)2 from Labtech (Russia), Tb4O7 from Uralredmet (Russia), and (NH4)2SO4 from Ruskhim (Russia)] was placed in Teflon drums in distilled water as a medium and ground in a planetary mill for 20 min at a speed of 200 rpm. Zirconium dioxide balls were used for the grinding. The weight ratio of the powder material to the balls was 1/10. The resulting solution was evaporated and dried at 160 °C until the liquid phase was completely removed. The resulting precipitate was subjected to decantation in order to remove byproducts while pH was kept at 7.0–7.4.
4.2. Powder characterization
The powder materials were investigated by X-ray diffraction (XRD) phase analysis on a DIFRAY-401 instrument (Russia) using CrKα radiation. Data from ICDD PDF-2 were employed to determine phase composition. Fourier transform infrared (FTIR) spectroscopy was carried out on a Niсolet Avatar 330 FT-IR instrument (ThermoFisher Scientific, USA) in the range of 4000–400 cm–1 in diffuse reflection mode. The samples were prepared as mixtures with KBr.
Specific surface area (SSA) was determined according to Brunauer, Emmet, and Teller (BET) by low-temperature nitrogen adsorption measurements (Micro-metric TriStar Analyzer, Micrometric Instruments, USA).
The pH value of the powders was measured on a Testo 206 device (Testo, Germany).
Synchronous thermal analysis was performed on a Netzsch STA 409 PC Luxx (Netzsch, Germany) thermal analyzer at a heating rate of 10 °C/min. The weight of the samples was at least 10 mg.
To investigate chemical composition of the synthesized powders, the powders were dissolved in an HCl–HNO3 mixture and analyzed by a high-precision technique of atomic emission spectrometry with inductively coupled plasma (AES-ICP, Vista Pro, Varian, Palo Alto, CA, USA).
4.3. Cement synthesis
Cement CS materials were obtained from the synthesized powders (
Table 6) via mixing with distilled water according to the following reaction [
5]:
Table 7 shows optimal powder:water ratios.
4.4. Characterization of the cements
Setting time was determined by means of penetration resistance of a 1 mm Vik needle (Russia) applied to cement under a load of 400 g (ISO 1566 standard).
Scanning electron microscopy (SEM) analyses of the materials were carried out under a Tescan VEGA II electron microscope (Czech Republic) with energy dispersive analyzer INCA Energy 300 (Great Britain).
The resultant cement materials were studied by XRD and infrared (IR) spectroscopy.
To assess mechanical compressive strength, cement samples were prepared by mixing a powder with distilled water on a glass slide, and cylindrical samples 8 × 11 mm in size were shaped in a Teflon mold. The samples were cured for 24 h at 100% humidity. Strength was determined on an Instron 5155 tensile testing machine (Great Britain). The pH value of cements was measured by means of the Testo 206 instrument (Testo, Germany).
An assay of the solubility of each material was performed in a solution simulating human extracellular fluid in terms of mineral composition (SBF: simulated body fluid). For this purpose, samples were prepared in the form of tablets. The required amount of the liquid was calculated from the tablet:liquid ratio, 0.4 g:20 ml. SBF was poured into a container with a tablet and kept in a thermostat at 37 °C for 0, 1, 7, 14, or 21 days. The samples were then removed from the liquid, the pH value of the solution was registered, and the samples were dried at 60 °C until stable weight.
The mass loss of the samples was calculated using the formula:
where m
n is the initial mass of a sample, and m
k is the mass of the sample after soaking in SBF.
Cation concentration in the extracts was measured by inductively coupled plasma mass spectroscopy using an Agilent 7900 ICP-MS instrument (USA).
Excitation and luminescence spectra of the cement samples were recorded at room temperature with the help of a Perkin Elmer LS55 spectrophotometer (USA) in an excitation range (λexc) of 200–800 nm and an emission range (λem) of 300–800 nm at a resolution of 0.5 nm.
5. Conclusions
Powder CS materials doped with Tb3+ at 0, 1.0, or 2.0 mol.% were obtained by the mechanochemical method. It was demonstrated that only 1.0 mol.% of Tb3+ was introduced into the lattice of CS materials according to XRD. As the Tb3+ content increases, SSA rises from 2.1 to 22.5 m2/g and the crystallite size diminishes from 68 to 31 nm. Thermogravimetric curves show that the introduction of Tb3+ slightly raises the temperatures of transition from CS dihydrate to anhydrous CS. Cement materials were synthesized from the obtained powders by mixing with distilled water. As the Tb3+ content goes up, the setting time and mechanical strength of the cements decline. Our analyses of the solubility in SBF indicate that the mass loss does not depend on the Tb3+ content of the cements and reaches approximately 20%. On the 7th day of the experiment, a CPL arises on the surface of the samples containing Tb3+. Emission intensity also increases with the addition of 1.0 mol.% Tb3+. The emission peaks recorded upon excitation at 276 nm indicate that the luminescence of the samples is green and blue. Thus, for the first time, CS-based cement materials were obtained possessing improved bioactivity and luminescent properties. The materials may find promising medical applications as cements for bone tissue replacement with a possibility of noninvasive diagnostics.
Author Contributions
Conceptualization, D.R.Kh., M.A.G.; methodology, P.A.K., T.O.O.; validation, D.R.Kh., E.D.N.; investigation, A.S.F., A.A.E., A.I.O., A.A.K., S.V.S.; data curation, D.R.Kh., A.S.F.; writing—original draft preparation, D.R.Kh., P.A.K., T.O.O.; supervision, S.M.B. and V.S.K. All authors have read and agreed to the published version of the manuscript.
Acknowledgments
The work was supported by the Russian Science Foundation, grant № 23-63-10056.
Conflicts of Interest
The authors declare no conflict of interest.
References
- Ene, R.; Nica, M.; Ene, D.; Cursaru, A.; Cirstoiu, C. Review of Calcium-Sulphate-Based Ceramics and Synthetic Bone Substitutes Used for Antibiotic Delivery in PJI and Osteomyelitis Treatment. EFORT Open Rev 2021, 6, 297–304. [Google Scholar] [CrossRef] [PubMed]
- Barone, A.; Andreana, S.; Dziak, R. Current Use of Calcium Sulfate Bone Grafts. Med Res Arch 2020, 8. [Google Scholar] [CrossRef]
- Hsu, H.J.; Waris, R.A.; Ruslin, M.; Lin, Y.H.; Chen, C.S.; Ou, K.L. An Innovative α-Calcium Sulfate Hemihydrate Bioceramic as a Potential Bone Graft Substitute. Journal of the American Ceramic Society 2018, 101, 419–427. [Google Scholar] [CrossRef]
- Zeng, R.; Lin, H.; Leng, Y.; Xu, J.; Ma, J.; Liu, J. Studies on Hemolysis Properties of Medical α -Calcium Sulfate Hemihydrate. 2017, 23, 16–18.
- Singh, N.B.; Middendorf, B. Calcium Sulphate Hemihydrate Hydration Leading to Gypsum Crystallization. Progress in Crystal Growth and Characterization of Materials 2007, 53, 57–77. [Google Scholar] [CrossRef]
- Le, N.T.N.; Le, N.T.T.; Nguyen, Q.L.; Pham, T.L.B.; Nguyen-Le, M.T.; Nguyen, D.H. A Facile Synthesis Process and Evaluations of α-Calcium Sulfate Hemihydrate for Bone Substitute. Materials 2020, 13. [Google Scholar] [CrossRef] [PubMed]
- Bell, W. Resorption Rates of Bone and Bone Substitutes. Oral Surgery, Oral Medicine, Oral Pathology 1964, 17, 650–657. [Google Scholar] [CrossRef] [PubMed]
- Wang, M.L.; Massie, J.; Perry, A.; Garfin, S.R.; Kim, C.W. A Rat Osteoporotic Spine Model for the Evaluation of Bioresorbable Bone Cements. Spine Journal 2007, 7, 466–474. [Google Scholar] [CrossRef]
- Chai, F.; Raoul, G.; Wiss, A.; Ferri, J.; Hildebrand, H.F. Biomaterials as Bone Substitute: Classification and Contribution. Rev Stomatol Chir Maxillofac 2011, 112, 212–221. [Google Scholar] [CrossRef]
- Fernandez de Grado, G.; Keller, L.; Idoux-Gillet, Y.; Wagner, Q.; Musset, A.M.; Benkirane-Jessel, N.; Bornert, F.; Offner, D. Bone Substitutes: A Review of Their Characteristics, Clinical Use, and Perspectives for Large Bone Defects Management. J Tissue Eng 2018, 9. [Google Scholar] [CrossRef]
- Yang, S.; Wang, L.; Feng, S.; Yang, Q.; Yu, B.; Tu, M. Enhanced Bone Formation by Strontium Modified Calcium Sulfate Hemihydrate in Ovariectomized Rat Critical-Size Calvarial Defects. Biomedical Materials (Bristol) 2017, 12. [Google Scholar] [CrossRef] [PubMed]
- Hesaraki, S.; Nemati, R.; Nazarian, H. Physico-Chemical and in Vitro Biological Study of Zinc-Doped Calcium Sulfate Bone Substitute. J Biomed Mater Res B Appl Biomater 2009, 91, 37–45. [Google Scholar] [CrossRef]
- Aldemir Dikici, B.; Dikici, S.; Karaman, O.; Oflaz, H. The Effect of Zinc Oxide Doping on Mechanical and Biological Properties of 3D Printed Calcium Sulfate Based Scaffolds. Biocybern Biomed Eng 2017, 37, 733–741. [Google Scholar] [CrossRef]
- Huang, L.; Xie, Y.H.; Xiang, H.B.; Hou, Y.L.; Yu, B. Physiochemical Properties of Copper Doped Calcium Sulfate in Vitro and Angiogenesis in Vivo. Biotechnic and Histochemistry 2020, 00, 1–8. [Google Scholar] [CrossRef] [PubMed]
- Khairutdinova, D.R.; Smirnov, V. V.; Antonova, O.S.; Gol’dberg, M.A.; Smirnov, S. V.; Obolkina, T.O.; Barinov, S.M. Effect of Doping with Sodium and Potassium on the Phase Formation in the Synthesis of Calcium Sulfate. Doklady Chemistry 2019, 489, 272–274. [Google Scholar] [CrossRef]
- Xiang, H.; Wang, Y.; Chang, H.; Yang, S.; Tu, M.; Zhang, X.; Yu, B. Cerium-Containing α-Calcium Sulfate Hemihydrate Bone Substitute Promotes Osteogenesis. J Biomater Appl 2019, 34, 250–260. [Google Scholar] [CrossRef] [PubMed]
- Smirnov, V. V.; Khayrutdinova, D.R.; Smirnov, S. V.; Antonova, O.S.; Goldberg, M.A.; Barinov, S.M. Bone Cements Based on Magnesium-Substituted Calcium Sulfates. Doklady Chemistry 2019, 485, 100–103. [Google Scholar] [CrossRef]
- Kokubo, T.; Takadama, H. How Useful Is SBF in Predicting in Vivo Bone Bioactivity? Biomaterials 2006, 27, 2907–2915. [Google Scholar] [CrossRef]
- Khayrutdinova, D.R.; Goldberg, M.A.; Krokhicheva, P.A.; Antonova, O.S.; Tyut’kova, Y.B.; Smirnov, S. V.; Sergeeva, N.S.; Sviridova, I.K.; Kirsanova, V.A.; Akhmedova, S.A.; et al. Peculiarities of Solubility and Cytocompatibility In Vitro of Bone Cements on the Basis of Calcium Sulfate Containing Phosphate Ions. Inorganic Materials: Applied Research 2022, 13, 161–170. [Google Scholar] [CrossRef]
- Prabakaran, S.; Rajan, M.; Lv, C.; Meng, G. Lanthanides-Substituted Hydroxyapatite/Aloe Vera Composite Coated Titanium Plate for Bone Tissue Regeneration. Int J Nanomedicine 2020, 15, 8261–8279. [Google Scholar] [CrossRef]
- Jiménez-Flores, Y.; Suárez-Quezada, M.; Rojas-Trigos, J.B.; Lartundo-Rojas, L.; Suárez, V.; Mantilla, A. Characterization of Tb-Doped Hydroxyapatite for Biomedical Applications: Optical Properties and Energy Band Gap Determination. J Mater Sci 2017, 52, 9990–10000. [Google Scholar] [CrossRef]
- Lu, Y.; Xiao, X.; Zheng, X.; Wu, S.; Liu, R. Hydrothermal Synthesis and Characterization of Tb3+ Doped Hydroxyapatite. Adv Mat Res 2012, 391–392, 709–713. [Google Scholar] [CrossRef]
- Jiménez-Flores, Y.; Suárez-Quezada, M.; Rojas-Trigos, J.B.; Suárez, V.; Mantilla, A. Sol–Gel Synthesis of Tb-Doped Hydroxyapatite with High Performance as Photocatalyst for 2, 4 Dichlorophenoxyacetic Acid Mineralization. Journal of Chemical Technology and Biotechnology 2017, 92, 1521–1530. [Google Scholar] [CrossRef]
- Luque, P.A.; Cervantes, D.; Gomez-Gutierrez, C.M.; Carrillo-Castillo, A.; Mota-Gonzalez, M.L.; Vilchis-Nestor, A.R.; Olivas, A. Synthesis and Characterization of Terbium Doped Hydroxyapatite at Different Percentages by Weight. Dig J Nanomater Biostruct 2017, 12, 135–139. [Google Scholar]
- Sun, L.J.; Ni, P.F.; Guo, D.G.; Fang, C.Q.; Wang, J.; Yang, F.; Huang, X.F.; Hao, Y.Z.; Zhu, H.; Xu, K.W. Synthesis and Characterization of Tb-Incorporated Apatite Nano-Scale Powders. J Mater Sci Technol 2012, 28, 773–778. [Google Scholar] [CrossRef]
- Wei, Y.; He, Y.; Li, X.; Chen, H.; Deng, X. Cellular Uptake and Delivery-Dependent Effects of Tb3+-Doped Hydroxyapatite Nanorods. Molecules 2017, 22, 1–11. [Google Scholar] [CrossRef]
- Mondéjar, S.P.; Kovtun, A.; Epple, M. Lanthanide-Doped Calcium Phosphate Nanoparticles with High Internal Crystallinity and with a Shell of DNA as Fluorescent Probes in Cell Experiments. J Mater Chem 2007, 17, 4153–4159. [Google Scholar] [CrossRef]
- Khayrutdinova, D.R.; Goldberg, M.A.; Krokhicheva, P.A.; Antonova, O.S.; Tutkova, Y.B. Effect of Lithium Ions on the Properties of Calcium Sulfate Cement Materials. Inorganic Materials 2023, 59, 323–332. [Google Scholar] [CrossRef]
- Paduraru, A.V.; Oprea, O.; Musuc, A.M.; Vasile, B.S.; Iordache, F.; Andronescu, E. Influence of Terbium Ions and Their Concentration on the Photoluminescence Properties of Hydroxyapatite for Biomedical Applications. Nanomaterials 2021, 11. [Google Scholar] [CrossRef]
- Prasad, P.S.R.; Chaitanya, V.K.; Prasad, K.S.; Rao, D.N. Direct Formation of the γ-CaSO4 Phase in Dehydration Process of Gypsum: In Situ FTIR Study. American Mineralogist 2005, 90, 672–678. [Google Scholar] [CrossRef]
- Nguyen, H.; Tran, V.; Vo, D. Utilization of Fourier Transform Infrared on Microstructural Examination of Sfc No-Cement Binder. TẠP CHÍ KHOA HỌC VÀ CÔNG NGHỆ ĐẠI HỌC ĐÀ NẴNG 2019, 17, 1–4. [Google Scholar]
- Di, W.; Wang, X.; Pan, G.; Bai, X.; Chen, B.; Ren, X. The Contribution of the Coordinated Water to 5D4 Population in YPO4 Hydrates Doped with Low Concentration of Tb3+. Chem Phys Lett 2007, 436, 129–132. [Google Scholar] [CrossRef]
- Pramanik, S.; Kumari, A.; Sinha, M.K.; Munshi, B.; Sahu, S.K. Valorization of Phosphor Powder of Waste Fluorescent Tubes with an Emphasis on the Recovery of Terbium Oxide (Tb4O7). Sep Purif Technol 2023, 322, 124332. [Google Scholar] [CrossRef]
- Nouri, A.; Castro, R.; Santos, J.L.; Fernandes, C.; Rodrigues, J.; Tomás, H. Calcium Phosphate-Mediated Gene Delivery Using Simulated Body Fluid (SBF). Int J Pharm 2012, 434, 199–208. [Google Scholar] [CrossRef]
- Yashaswini, Y.; Pandurangappa, C.; Dhananjaya, N.; Murugendrappa, M. V. Photoluminescence, Raman and Conductivity Studies of CaSO4 Nanoparticles. Int J Nanotechnol 2017, 14, 845–858. [Google Scholar] [CrossRef]
- Nagabhushana, H.; Nagaraju, G.; Nagabhushana, B.M.; Shivakumara, C.; Chakradhar, R.P.S. Hydrothermal Synthesis and Characterization of CaSO4 Pseudomicrorods. Philos Mag Lett 2010, 90, 289–298. [Google Scholar] [CrossRef]
- Silva, A.M.B.; Junot, D.O.; Caldas, L.V.E.; Souza, D.N. Structural, Optical and Dosimetric Characterization of CaSO4:Tb, CaSO4:Tb, Ag and CaSO4:Tb,Ag(NP). J Lumin 2020, 224. [Google Scholar] [CrossRef]
- Junot, D.O.; Barros, J.P.; Caldas, L.V.E.; Souza, D.N. Thermoluminescent Analysis of CaSO4:Tb,Eu Crystal Powder for Dosimetric Purposes. Radiat Meas 2016, 90, 228–232. [Google Scholar] [CrossRef]
- Silva A. M. B., Souza D. N., Junot D.O., C.L.V.E. Thermoluminescent Analysis of Silver Addition in CaSO4 : Tb. Encontro de Outono da SBF 2019 2021, 716–1.
- Li, X.; Zou, Q.; Chen, H.; Li, W. In Vivo Changes of Nanoapatite Crystals during Bone Reconstruction and the Differences with Native Bone Apatite. Sci Adv 2019, 5, 1–10. [Google Scholar] [CrossRef] [PubMed]
- Neelima, G.; Kummara, V.K.; Viswanath, C.S.D.; Tyagarajan, K.; Ravi, N.; Prasad, T.J. Photoluminescence of Terbium Doped Oxyfluoro-Titania-Phosphate Glasses for Green Light Devices. Ceram Int 2018, 44, 15304–15309. [Google Scholar] [CrossRef]
- Wang, X.; Zhang, Y.; Lin, C.; Zhong, W. Sol-Gel Derived Terbium-Containing Mesoporous Bioactive Glasses Nanospheres: In Vitro Hydroxyapatite Formation and Drug Delivery. Colloids Surf B Biointerfaces 2017, 160, 406–415. [Google Scholar] [CrossRef]
- Wang, Y.; Lu, Y.; Zhang, J.; Hu, X.; Yang, Z.; Guo, Y.; Wang, Y. A Synergistic Antibacterial Effect between Terbium Ions and Reduced Graphene Oxide in a Poly(Vinyl Alcohol)-Alginate Hydrogel for Treating Infected Chronic Wounds. J Mater Chem B 2019, 7, 538–547. [Google Scholar] [CrossRef] [PubMed]
- Kudryavtseva, I.; Lushchik, A.; Lushchik, C.; Maaroos, A.; Nagirnyi, V.; Pazylbek, S.; Tussupbekova, A.; Vasil’chenko, E. Complex Terbium Luminescence Centers in Spectral Transformers Based on CaSO4. Physics of the Solid State 2015, 57, 2191–2201. [Google Scholar] [CrossRef]
- Kontrec, J.; Kralj, D.; Brečević, L. Transformation of Anhydrous Calcium Sulphate into Calcium Sulphate Dihydrate in Aqueous Solutions. J Cryst Growth 2002, 240, 203–211. [Google Scholar] [CrossRef]
- Elert, K.; Bel-Anzué, P.; Burgos-Ruiz, M. Influence of Calcination Temperature on Hydration Behavior, Strength, and Weathering Resistance of Traditional Gypsum Plaster. Constr Build Mater 2023, 367. [Google Scholar] [CrossRef]
- Logvinovich, D.; Börger, A.; Döbeli, M.; Ebbinghaus, S.G.; Reller, A.; Weidenkaff, A. Synthesis and Physical Chemical Properties of Ca-Substituted LaTiO2N. Progress in Solid State Chemistry 2007, 35, 281–290. [Google Scholar] [CrossRef]
- Shang, H.B.; Chen, F.; Wu, J.; Qi, C.; Lu, B.Q.; Chen, X.; Zhu, Y.J. Multifunctional Biodegradable Terbium-Doped Calcium Phosphate Nanoparticles: Facile Preparation, PH-Sensitive Drug Release and in Vitro Bioimaging. RSC Adv 2014, 4, 53122–53129. [Google Scholar] [CrossRef]
- Carlberg, B.L.; Matthews, R.R. Volubility of Calcium Sulfate in Brine; 1973; SPE-4353-MS. [CrossRef]
- Taga, M.; Kono, T.; Yamashita, N. Photoluminescence Properties of Gypsum. Journal of Mineralogical and Petrological Sciences 2011, 106, 169–174. [Google Scholar] [CrossRef]
- Yang, Y.; Zhao, Q.; Feng, W.; Li, F. Luminescent Chemodosimeters for Bioimaging. Chem Rev 2013, 113, 192–270. [Google Scholar] [CrossRef]
- Li, X.; Zou, Q.; Chen, H.; Li, W. In Vivo Changes of Nanoapatite Crystals during Bone Reconstruction and the Differences with Native Bone Apatite; 2019; Vol. 5; [CrossRef]
- Van, H.N.; Le Manh, T.; Do Thi Thuy, D.; Pham, V.H.; Nguyen, D.H.; Hong, D.P.T.; Van Hung, H. On Enhancement and Control of Green Emission of Rare Earth Co-Doped Hydroxyapatite Nanoparticles: Synthesis and Upconversion Luminescence Properties. New Journal of Chemistry 2021, 45, 751–760. [Google Scholar] [CrossRef]
- Gómez-Morales, J.; Fernández-Penas, R.; Romero-Castillo, I.; Verdugo-Escamilla, C.; Choquesillo-Lazarte, D.; D’urso, A.; Prat, M.; Fernández-Sánchez, J.F. Crystallization, Luminescence and Cytocompatibility of Hexagonal Calcium Doped Terbium Phosphate Hydrate Nanoparticles. Nanomaterials 2021, 11, 1–19. [Google Scholar] [CrossRef]
- Tabaković, A.; Kester, M.; Adair, J.H. Calcium Phosphate-Based Composite Nanoparticles in Bioimaging and Therapeutic Delivery Applications. Wiley Interdiscip Rev Nanomed Nanobiotechnol 2012, 4, 96–112. [Google Scholar] [CrossRef] [PubMed]
- Investigation of Anticorrosion, Antibacterial and In Vitro Biological Performance of Terbium / Gadolinium Dual Substituted Hydroxyapatite Coating on Surgical Grade Stainless Steel for Biomedical Applications. Chem Sci Trans 2018. [CrossRef]
Figure 1.
Thermogravimetry data on the CS powders.
Figure 1.
Thermogravimetry data on the CS powders.
Figure 2.
Powder XRD results, where ♦ denotes CaSO4×0.5H2O, and ● represents CaSO4×2H2O.
Figure 2.
Powder XRD results, where ♦ denotes CaSO4×0.5H2O, and ● represents CaSO4×2H2O.
Figure 3.
FTIR spectra of CS powders.
Figure 3.
FTIR spectra of CS powders.
Figure 4.
XRD diffractograms of the cement materials, where ● denotes CaSO4×2H2O.
Figure 4.
XRD diffractograms of the cement materials, where ● denotes CaSO4×2H2O.
Figure 5.
FTIR spectra of the cement samples.
Figure 5.
FTIR spectra of the cement samples.
Figure 6.
Microstructure of the cement materials. a: 1C, b: 2C, and c: 3C.
Figure 6.
Microstructure of the cement materials. a: 1C, b: 2C, and c: 3C.
Figure 7.
Microstructure of the surface of the samples after soaking in SBF on different days of the experiment, where a–c: the 7th day of the experiment, and d–f: the 14th day of the experiment.
Figure 7.
Microstructure of the surface of the samples after soaking in SBF on different days of the experiment, where a–c: the 7th day of the experiment, and d–f: the 14th day of the experiment.
Figure 8.
XRD patterns of the cements after soaking in SBF on different days of the experiment, where a: 1C, b: 2C, c: 3C; ● means CaSO4×2H2O, and ° denotes Ca10(PO4)6(OH)2.
Figure 8.
XRD patterns of the cements after soaking in SBF on different days of the experiment, where a: 1C, b: 2C, c: 3C; ● means CaSO4×2H2O, and ° denotes Ca10(PO4)6(OH)2.
Figure 9.
Photoluminescence emission spectra of the cements.
Figure 9.
Photoluminescence emission spectra of the cements.
Table 1.
Theoretical and experimental concentrations of terbium in the synthesis of initial powders.
Table 1.
Theoretical and experimental concentrations of terbium in the synthesis of initial powders.
| Sample ID |
Added Tb3+, mol.% |
Concentration of elements, wt.% |
| theoretical |
experimental |
| |
Ca |
S |
Tb |
Ca |
S |
Tb |
| 1P |
0.0 |
29.41 |
23.53 |
- |
28.91 |
22.75 |
- |
| 2P |
1.0 |
28.98 |
23.41 |
0.80 |
24.78 |
19.82 |
0.78 |
| 3P |
2.0 |
28.56 |
23.31 |
1.50 |
28.81 |
23.83 |
1.51 |
Table 2.
Crystal lattice parameters, SSA, and crystal size (D) of the powders.
Table 2.
Crystal lattice parameters, SSA, and crystal size (D) of the powders.
| Sample ID |
а, nm |
с, nm |
V, nm3
|
D, nm |
SSA, m2/g |
| Theoretical |
6.76 |
6.24 |
246.94 |
- |
- |
| 1Р |
6.93(8) |
6.29(1) |
262.27(3) |
68 |
2.1 |
| 2P |
6.92(2) |
5.99(5) |
248.27(3) |
40 |
10.3 |
| 3P |
6.92(2) |
5.99(5) |
248.27(3) |
31 |
22.5 |
Table 3.
Cement properties.
Table 3.
Cement properties.
| Sample ID |
Added Tb3+, mol.% |
pH value |
Mechanical strength, MPa |
Setting time, min |
| 1С |
0.0 |
7.3 |
12.0±0.6 |
15.0±0.8 |
| 2С |
1.0 |
7.4 |
12.1±0.6 |
9.0±0.4 |
| 3С |
2.0 |
7.6 |
2.4±0.1 |
6.0±0.3 |
Table 4.
Mass loss of samples during soaking in SBF.
Table 4.
Mass loss of samples during soaking in SBF.
| Sample ID |
Mass loss, % |
| Days |
1 |
7 |
14 |
21 |
| 1C |
17±1 |
20±1 |
21±1 |
20±1 |
| 2C |
18±1 |
19±1 |
21±1 |
19±1 |
| 3C |
20±1 |
18±1 |
20±1 |
22±1 |
Table 5.
Concentration of Tb3+ in SBF extracts depends on the day of the experiment.
Table 5.
Concentration of Tb3+ in SBF extracts depends on the day of the experiment.
| Sample ID |
Concentration of terbium cations, mg/l |
| |
Day 1 |
Day 7 |
Day 14 |
Day 21 |
| 2C |
0.0087 |
0.640 |
0.714 |
0.769 |
| 3C |
0.0570 |
0.326 |
0.340 |
0.772 |
Table 6.
Concentrations of salts and theoretical composition of the synthesized powders.
Table 6.
Concentrations of salts and theoretical composition of the synthesized powders.
| Sample ID |
Added Tb3+, mol.% |
Theoretical formulae |
mCa(OH)2, g |
mTb4O7, g |
m(NH4)2SO4, g |
| 1P |
0.0 |
CaSO4
|
7.66 |
- |
13.66 |
| 2P |
1.0 |
Ca0.99Tb0.0067SO4
|
8.04 |
0.14 |
14.49 |
| 3P |
2.0 |
Ca0.98Tb0.013SO4
|
7.92 |
0.27 |
14.42 |
Table 7.
Cement composition and powder-to-liquid ratios.
Table 7.
Cement composition and powder-to-liquid ratios.
| Sample ID |
Added Tb3+, mol.% |
H2O, ml |
Powder, g |
| 1C |
0.0 |
0.50 |
0.35 |
| 2C |
1.0 |
0.50 |
0.31 |
| 3C |
2.0 |
0.50 |
0.38 |
|
Disclaimer/Publisher’s Note: The statements, opinions and data contained in all publications are solely those of the individual author(s) and contributor(s) and not of MDPI and/or the editor(s). MDPI and/or the editor(s) disclaim responsibility for any injury to people or property resulting from any ideas, methods, instructions or products referred to in the content. |
© 2023 by the authors. Licensee MDPI, Basel, Switzerland. This article is an open access article distributed under the terms and conditions of the Creative Commons Attribution (CC BY) license (http://creativecommons.org/licenses/by/4.0/).
