Submitted:
18 October 2023
Posted:
18 October 2023
You are already at the latest version
Abstract
Background. Type 2 diabetes mellitus (T2DM) is becoming a major global health concern, especially in poorer nations. The high prevalence of obesity and the ensuing diabetes I attributed to rapid economic progress, physical inactivity, consumption of high-calorie foods, and changing lifestyles.
Objectives. We investigated the role of interleukins-10 , 19 and 22 with varying levels of obesity in T2DM in the Asir region of Saudi Arabia.
Materials and methods. 170 confirmed T2DM patients and a control group were enrolled. The demographic data, serum levels of IL-10, IL-19, and IL-22, and biochemical indices were assessed in patients and control groups by standard procedures.
Results. T2DM patients were divided into four groups: A (normal body weight), B (Overweight), C (obese), and D (highly obese). Both male and female T2DM subjects in Group A showed significant decreases in IL-10 levels as compared to controls; however, there were insignificant changes in IL-10 levels in Groups C and D. T2DM patients in groups C and D, in both males and females, depicted very significant (p 0.001) increases in IL-19 levels as compared to controls and group A. Patient groups A to D displayed a progressive elevation of Il-22 levels irrespective of gender, although significant alterations were seen only in groups B to D, with p 0.05 for group B and p 0.01 for groups C and D respectively, as compared to healthy controls.
Conclusions. IL-10 showed a strong relationship with T2DM in males with varying degrees of obesity, but females depicted relatively higher IL-10 levels in obese and highly obese groups, pointing to a protective phenomenon. IL-19 levels showed significant increases in all four groups, irrespective of gender. IL-22 appears to be unrelated to T2DM per se but shows an association with varying degrees of obesity.
Keywords:
Diabetes
; Pro and anti-inflammatory cytokines
; T2DM in Saudi Arabia
; Pathogenesis
; IL-10
; IL-19
; and IL 22
; Obesity
1. INTRODUCTION:
As a complex disease, type 2 diabetes mellitus (T2DM) has rapidly grown into a major public health concern worldwide, especially in underdeveloped regions.[1,2,3,4] Rapid economic strides, increasing physical inactivity, eating calorie-dense foods, and changing lifestyles have played a role in the high incidence of obesity and consequent diabetes. [5] International Diabetes Federation reports that the prevalence of type 2 diabetes mellitus (T2DM) among adults worldwide was predicted to be 536.6 million individuals, accounting for 10.5% of the global population in 2021. Furthermore, the IDF projects that the number of individuals with diabetes will increase to 783.2 million, representing 12.2% of the global population, by the year 2045.[6] Recently, there has been a notable increase in the prevalence of diabetes in China, the largest developing nation with a population accounting for almost one-fifth of the global population.[7] Saudi Arabia with a total population of 24,194,300, has a prevalence of 17.7% for diabetes with about 4274100 adult diabetic patients (https://idf.org/our-network/regions-members/middle-east-and-north-africa/members/46-saudi-arabia.html, accessed on Oct.12, 2023). One of the top 10 global killers, diabetes increases a person's risk of dying from any cause by two to three times.[1,2] T2DM accounts for approximately 95% of all diabetics. The hallmark symptom is chronic hyperglycemia, which can be attributed to either insufficient insulin production or impaired insulin function.[8]
Based on ethnicity and geographic location, it has been demonstrated that the frequency and occurrence of T2DM vary widely around the world, with the highest risks being experienced by Japanese, Hispanics, and Native Americans.[9,10,11] The incidence rates of T2DM among Asians have been observed to be higher compared to white American and UK populations. Notably, the black population represents the highest risk category in both populations.[1] Although the exact etiology remains unknown, several variables have been postulated as potential contributors.[14,15] These include modern lifestyle factors that promote obesity, socioeconomic influences, inherent genetic predispositions, and interactions between genes and the environment. The probability of developing T2DM is substantially impacted by genetic susceptibility. The intricate polygenic characteristics of T2DM have been elucidated via various genome-wide association studies conducted in the last decade. [14,15] The vast majority of these genetic loci boost the risk of type 2 diabetes mellitus by mainly impacting the synthesis of insulin.
Acute complications of type 2 diabetes include diabetic ketoacidosis and hyperosmolar hyperglycemic syndrome, whereas long-term complications include renal failure, blindness, and cardiovascular disease, and diabetic neuropathy. [16] Type 2 diabetes mellitus is distinguished by insulin resistance and reduced insulin production, both of which contribute to the disease's pathogenesis and render glycemic management nearly difficult.[14,15] According to estimates, 90% of people with diabetes are either overweight or obese, and obesity has become one of the major risk factors for T2DM. [17,18]
Inflammation, adipokine dysregulation, changes in gut microbiota, and immunological dysregulation have emerged as significant pathophysiological contributors to T2DM according to recent observations. [3,14] Multiple reports have implicated pro and anti-inflammatory interleukins (IL) including the IL-10 family members in the pathophysiology of T2DM. [14,17,18] IL-10 family comprises of IL10, IL19, IL20, and IL22 among others. [19] The genomic organization, intron-exon organization, and a shared structural fold made of stacked alpha-helices are common motifs in these cytokines.[19] These interleukins are not limited to different populations of T cells but also are synthesized in adipose tissue.[3,14,18] IL-10, a potent anti-inflammatory cytokine, regulates the production of other inflammatory cytokines like IL-19 and IL-22. Reduced levels of IL-10 in the blood have been observed in patients with metabolic syndrome, obesity, and type 2 diabetes.[20,23] The anti-inflammatory actions of IL-10 are thought to be mediated through heterodimeric IL-10 receptors (IL-10R1, IL-10R2).[20]
The cytokine interleukin-19 (IL-19) is a relatively new discovery within the larger interleukin-10 family. IL-19 is released by activated B cells and, to a lesser extent, monocytes.[19,24] This protein can induce IL-10 production in human peripheral blood mononuclear cells.[20,25,26] The response of T-helper2 (Th2) has been implicated in a number of diseases including type 1 diabetes.[27], and cardiovascular disease[28,29], and has been reported to be influenced by IL-19. In addition to playing crucial roles in various inflammatory processes, IL-19 has the ability to stimulate the angiogenic potential of endothelial cells. [28,29,30,31] The dimerization of two subunits of the IL-20 receptor is involved in the signaling pathway of IL-19.[2] Numerous ongoing studies are trying to figure out the precise mechanism by which IL-19 contributes to the etiopathogenesis of T2DM.[24,30,31,32]
Activated CD4+ T helper subsets such as Th1 and Th22 cells, as well as innate lymphoid cells, express IL-22, a tiny molecule that is a member of the IL-10 family of cytokines.[25,33] Although IL-22 and IL-10 share 22% homology, these two molecules play different roles in inflammation. IL-22 appears to play functions in inflammation that are in conflict with those of IL-10.[34,35,36] The role played by IL-22 in the molecular etiopathogenesis of T2DM and as an immunomodulatory agent in the treatment of Chronic immunological disorders including T2DM has been a matter of discussion and different groups have come up with varying reports.[35,36,37]
In this study, we assessed the relationship between selected members of the interleukin-10 family, such as IL-10, IL-19, and IL-22, and the etiopathogenesis of T2DM with varying degrees of obesity as measured by BMI and waist-to-hip ratio (WHR) in the Asir region of Saudi Arabia.
Using body mass index and waist-to-hip ratio as measures of obesity, we assessed the relationship between selected interleukin-10 family members and the etiopathogenesis of type 2 diabetes in the Asir region of Saudi Arabia.
2. Objectives:
- To use anthropometric data and fundamental biochemical parameters to divide T2DM patients into groups with varied degrees of obesity.
- To examine the blood levels of interleukins10,19, and 22.
- To correlate the various levels of obesity in T2DM patients with the blood IL levels.
3. METHODS:
3.1. Study design:
This is a case-control and collaborative study.
3.2. Study setting:
This study was carried out in two cities of Asir region (Bisha and Abha) of Saudi Arabia and the study area has been highlighted in the Saudi map (Figure 1).
3.3. Study participants:
200 T2DM patients and 100 healthy controls were initially recruited for this study. All the study participants were Saudi citizens. The blood samples were collected at the Diabetic Centre of King Abdullah Hospital in Bisha, and Asir General Hospital in Abha. Patients and controls were recruited between March 2020 and May 2022. Before the collection of blood specimens, written consent (on a standard proforma) was provided by each patient and control participant.
3.4. Institutional Review Board Statement:
Ethical approval was obtained from the local RELOC Committee of the College of Medicine, University of Bisha (Ref. No. UB-RELOC H-06-BH-087/ (0504.23) in accordance with the local guidelines which conformed in essence, to the principles of the Helsinki Declaration.
3.5. Informed Consent Statement:
Informed consent was obtained prior to the collection of samples from all patients and control subjects.
3.6. Inclusion criteria:
Only Saudi citizens living Asir region (Bisha and Abha cities and surrounding areas) were enrolled in this study. This study included 200 confirmed T2DM patients, 110 men and 90 women, who were using oral hypoglycemic drugs and/or insulin.
3.7. Requisites for Exclusion from patient group:
Patients with T2DM who suffered from major chronic illnesses or cancer, were disqualified from the patient group. Patients with other types of diabetes were also not included in the study.
3.8. Requisites for control subjects:
A total of 100 control subjects were healthy persons with normal fasting and random sugar indices with no history of diabetes or other significant clinical problems.
3.9. Requisites for Exclusion from Controls:
A total of eighty-five healthy persons (44 men and 41 women) remained in the study after those control subjects with abnormal laboratory indices were eliminated. The other criterion for selecting this limited number of control subjects was the availability of ELISA kits as each 96-well kit was sufficient for less than 88 samples after including the calibrators and QC samples.
3.10. Data collection:
Finally, 170 Saudi citizens with confirmed T2DM (96 males and 74 females) who visited KAH and AGH for regular follow-up and met the inclusion criteria were made a part of the study. WHO guidelines were followed in the diagnosis of T2DM. The case histories, ages, sexes, BMIs, blood glucose (both fasting and random), glycated hemoglobin, triacylglycerol, high-density lipoprotein-cholesterol, and low-density lipoprotein-cholesterol levels of both T2DM patients and controls were all analyzed. Standardized procedures were used to evaluate anthropometric and biochemical parameters.
3.10.1. T2DM patient blood specimen collection:
A 4 mL venous blood sample was extracted from each T2DM patient into a sample collection tube without the use of any anticoagulants. An initial serum sample was kept at -20°C until the interleukin estimate. A second serum aliquot was immediately used for the analysis of biochemical parameters.
3.10.2. Blood samples from healthy controls:
All age-matched, healthy control subjects' sample collection was timed to coincide with routine blood draws for the standard health checkup. There was no longer a requirement for extra phlebotomy. In a red top tube with no anticoagulant, a sample of peripheral blood with a volume of around 4 ml was obtained for each control. An initial serum sample was stored at -20°C until the interleukin estimation. The other serum aliquot was employed right away for biochemical analysis.
3.10.3. Analysis of Biochemical parameters:
All the blood chemistry investigations were performed on a random access, multi-channel analyzer (Roche Diagnostics) in the medical laboratory department KAH, Bisha. The commercially available test kits including the calibrators and internal quality control samples from the manufacturer were used for these analyses.
3.10.4. Estimation of Interleukins:
Using commercially available kits from Thermo Fisher Scientific, USA, ELISA assays were used to measure the serum concentrations of the three IL-10 family members, IL-10, IL-19, and IL-22. Less than 10% of variances occurred both within and between tests. Variations within and across assays were under 10%.
3.10.5. Interleukin-10:
A commercially available kit for IL-10 Human ELISA Kit (Thermo Fisher Scientific, USA, Cat No. BMS215HS) with a sensitivity of 0.05 picograms per milliliter (pg/mL) was used to measure the blood concentrations of IL-10. The assay was performed as per the instructions of the manufacturer and the results were presented as pg/mL.
3.10.6. Interleukin-19:
A commercially available IL-19 Human ELISA Kit (Abcam UK. ab231922) with a sensitivity of 0.65 pg/mL was purchased to quantify the serum level of IL-19. The test was carried out according to the guidelines of the supplier, and the data were presented as pg/mL.
3.10.7. Interleukin-22:
The serum level of IL-22 was quantified by using a commercially available IL-22 Human ELISA Kit (Thermo Fisher Scientific, USA, Cat No. BMS2047) that had a sensitivity of 5 pg/mL. The assay was performed as per the instructions of the manufacturer and the results were reported as pg/mL.
3.10.8. Statistical assessment:
The statistical assessment was carried out utilizing SPSS, version 20. In contrast to data exhibiting a skewed distribution, which was represented by medians (Q1–Q3), data displaying a normally distributed distribution were presented using means accompanied by standard deviations (SD). One-way analysis of variance with the Tukey HSD test was used to figure out the significance of differences for variables with a normal distribution and homogeneous variances; in all other circumstances, Kruskal-Wallis one-way analysis of variance by ranks and the multiple comparison post hoc test were used. Values that were considered significant in this study were those that had a p-value lower than 0.05 (p<0.05).
4. RESULTS:
4.1. Baseline features of the male patient group:
The anthropometric and biochemical indices for male diabetics are shown in Table 1. Based on their BMI scores, the 96 patients were separated into 4 groups. Group A comprised 25 T2DM patients with a BMI of 21.80 ± 2.14 kg/m2); Group B contained 23 patients who were overweight with a BMI of 27.44 ± 2.29 kg/m2; Group C had 24 obese patients with a BMI of 34.94 ± 3.18 kg/m2; and group D comprised of 24 severely obese T2DM patients with a BMI of 47.22 ± 5.70 kg/m2. The 44 males in the control group had a BMI of 21.74 ± 1.78 (mean ± SD) kg/m2 as is depicted in Table 1. Male T2DM patients' ages ranged from 28 to 67, while controls' ages ranged from 28 to 62. The patients belonging to groups C and D exhibited statistically significant changes in WHR in comparison to the control group. However, no noticeable disparity in WHR was seen between groups A and B and the control group.
On a comparative analysis, the patients in group D showed a very significant rise in WHR (p<0.001) in comparison with groups A and B whereas those in group C showed a substantial increase (p<0.01) in WHR in comparison to groups A and B. There was no statistically significant increase in BMI observed among patients with type 2 diabetes mellitus in groups A and B, as compared to the control group. In contrast, groups C and D exhibited a notable and meaningful elevation in BMI.
Patients in Group C with type 2 diabetes mellitus exhibited a body mass index that was notably greater when compared to individuals in Groups A and B, as indicated by a p-value of 0.001. Similarly, patients in Group D had a BMI that was significantly higher than that of Groups A and B, with a p-value of 0.001, and also higher than that of Group C, with a p-value of 0.01. The fasting glucose levels of T2DM patients in groups A, B, and C were not substantially different from controls, whereas group D patients had significantly higher values (p <0.001). Although there were no discernible changes in HbA1c among the different patient groups A, B, and D, all four groups of T2DM patients had significantly higher levels than the control group, with a p-value of 0.001. Patients with T2DM in group C displayed significantly higher HbA1c levels in comparison to groups A, B, and D (p<0.001). T2DM patient groups A to C depicted significant differences in total cholesterol compared to the control group (p<0.01) but group D showed a very significantly increased cholesterol-T level in comparison to the controls(p<0.001). Group A-C did not show any meaningful variations in the cholesterol-T levels mutually. HDL-cholesterol levels were unremarkable in all the T2DM patients compared to the normal controls, although there was an apparent but insignificant decrease in HDL values in the patient groups. LDL cholesterol was similar in control subjects and T2DM patients in group A but was substantially increased in T2DM patients in groups B and C in comparison with controls (p<0.001. Patients in Group D had significantly elevated levels of LDL compared to both group A T2DM patients and controls (p< 0.001). The triglyceride levels in T2DM patients of groups A-C were substantially higher in comparison to the controls (p<0.01). When compared to controls, the TG levels in Group D patients were significantly higher (p <0.001) than in the control group as a whole. In comparison to T2DM patients in groups A through C, group D likewise exhibited significantly higher TG levels with a p-value of <0.01. In comparison to the control group, the patients in group D had significantly elevated TG levels (p <0.001). Group D demonstrated significantly raised TG levels compared to groups A through C, with a p-value of less than 0.01.
4.2. Baseline features of the female patient group:
Table 2 summarizes the anthropometric and biochemical indices for 74 female T2DM patients. Table 2 shows that the age range in the controls was from 27-64 years, while the same was 27-69 years in the 74 female T2DM. When compared to control subjects, WHR was considerably greater in groups C and group D. In comparison to the control group, groups A B, and C patients, group D patients exhibited a statistically significant elevation in waist-to-hip ratio (WHR) (p<0.001). Conversely, group C patients had a substantial increase in WHR (p<0.01) when compared to the control group, groups A and B, and group C.
The female controls had a BMI of 21.20 ± 1.66 kg/m2 which was considered normal. Based on their BMI values, the female T2DM group was further divided into four sub-groups. Group A consisted of 18 individuals who had a normal body weight, as shown by their body mass index (BMI) of 21.41 ± 2.14 kg/m2. Group B comprised 19 individuals who were classified as overweight, with a BMI of 28.22 ± 2.26 kg/m2. Group C consisted of 20 individuals who were classified as obese, with a BMI of 33.88 ± 3.20 kg/m2. Lastly, group D included 17 individuals who were extremely obese, with a BMI of 46.48 ± 5.20 kg/m2. In comparison to the control group, there was no significant rise in BMI observed in groups A and B. However, a substantial increase in BMI was observed in groups C and D (p<0.001). Group D patients exhibited a substantial increase in BMI compared to groups A and B (p <0.001), as well as a significantly higher BMI compared to group C (p<0.01). Additionally, group C patients demonstrated a significantly higher BMI when compared to groups A and B, with a p-value of <0.01.
With a p-value of less than 0.01, the fasting glucose levels of groups A through C were statistically higher than those of the control group. On the other hand, the fasting glucose levels of Group D rose even more than those of the control group, with a p-value of less than 0.001. All four groups of female patients with type 2 diabetes mellitus had statistically significant increases in their HbA1c levels compared to the control group (p 0.001). However, there were no big changes between the HbA1c levels of the different groups of patients (A-D).
Groups A and B had notably elevated levels of total cholesterol in comparison to the control subjects, with a p-value less than 0.01. The patients in the C and D groups had significantly elevated levels of total cholesterol in comparison to the control group, with a p-value of less than 0.001. Diabetics in groups C and D exhibited notably elevated levels of total cholesterol in comparison to groups A and B, with a statistical significance of p< 0.01. There were no big changes in the levels of HDL-cholesterol between groups A and B and the control group. However, groups C and D displayed a little but non-significant drop in HDL-cholesterol levels in comparison to controls. LDL cholesterol concentrations were found to be comparable between the controls and group A T2DM patients. However, a statistically significant increase in LDL cholesterol levels was observed in patient groups C and D when contrasted to the controls (p<0.001). Group D had significantly greater levels of LDL compared to patients in group A (p < 0.001). The triglyceride levels in groups A, B, and C exhibited an increase that was statistically significant when contrasted to the control group (p<0.01). Group D patients exhibited a statistically significant elevation in their TG values in comparison to the controls, with a p-value of less than 0.001. In addition, Group D had markedly elevated levels of TG in comparison to groups A and Group B, with a p-value of less than 0.01.
4.3. Levels of Interleukins
Table 3 presents a summary of the blood concentrations of interleukins 10, 19, and 22 in T2DM male patients and controls.
4.4. Interleukin-10.
The average blood IL-10 concentration in the control group of healthy males was found to be 18.78 ± 2.21 pg/mL. Groups A and B exhibited substantial reductions (p<0.001) in IL-10 levels, measuring 7.89 ± 1.45 and 7.32 ± 1.36 pg/mL, respectively, as compared to the control group. Patients in Group C and Group D had statistically significant reductions in IL-10 levels (11.78±1.87 and 13.56±1.92 pg/mL, respectively) when compared to the control group. The p-values for these comparisons were found to be less than 0.01 and less than 0.05, respectively. The IL-10 levels of patients in groups C and D were found to be significantly lower than those in groups A and B (p < 0.05).
4.5. Interleukin-19.
The IL-19 level (mean ± SD) in the male controls (N=44) was 72 ± 21.45 pg/mL. Male T2DM patients in groups A and B depicted a statistically significant increase (p<0.01) in IL-19 concentrations (232± 21.45 and 273 ± 29.66 pg/mL) respectively, as compared to controls. Group C and D patients displayed very significant increases in IL-19 values (310 ± 32.24 and 356 ± 43.64 pg/mL respectively) in comparison with controls with p values of < 0.001 and < 0.001. Patients in groups C and D had significantly greater IL-19 levels in comparison with those in groups A and B (p<0.05).
4.6. Interleukin-22.
The average serum IL-22 concentration in the male controls (N=44) was found to be 46 ± 12.48 pg/mL. The patients in Group A exhibited a slight, albeit statistically insignificant elevation in IL-22 levels (52± 17.45 versus 46 ± 12.48 pg/mL). Group B patients depicted substantial elevation in IL-22 levels in comparison to both the control group and group A (p<0.05). The levels of IL-22 in group C exhibited a statistically significant rise when contrasted with controls, p<0.01. Patients in Group C had a notable increase in IL-22 levels in comparison to Group B, with p < 0.04. While comparing to both the controls and group A, IL-22 levels were considerably greater in patients in group D (p<0.001). Figure 2 presents the cluster charts depicting the levels of serum interleukin 10 family members in both male control and patient groups.
4.7. Interleukin-10 in Female groups.
Table 4 provides a summary of the serum levels of interleukins 10, 19, and 22 in T2DM female patients (N=74) and 41 individuals serving as control subjects. The average serum IL-10 concentration in the control group of healthy females was found to be 19.12 ± 2.28 pg/mL, a value comparable to that observed in the control group of males. Group A exhibited a statistically significant reduction (p<0.001) in interleukin-10 (IL-10) concentrations as compared to the control subjects. The female patients in group B exhibited a noteworthy reduction in IL-10 levels (11.68 ± 1.55 pg/mL) in contrast to controls, with a p<0.01. Patients in Group C and D had a slight, albeit statistically insignificant reduction in IL-10 levels in comparison with the controls.
4.8. Interleukin-19 in female T2DM patients.
The average blood IL-19 concentration in the control group of female individuals without any medical conditions (N=) was determined to be 67 ± 17.42 pg/mL. Female T2DM patients in groups A and B exhibited statistically significant increases in interleukin-19 (IL-19) concentrations (168± 26.78 and 212± 28.22 pg/mL, respectively) in comparison to controls. The observed increases were highly significant statistically with p<0.01). Simultaneously, it was observed that group B exhibited significantly higher IL-19 levels in comparison to group A (p<0.01). Patients in Group C and Group D exhibited a statistically very significant elevation in IL-19 levels (276± 35.14 and 288 ± 36.98 pg/mL, respectively) when contrasted with controls (p<0.0001). In addition, IL-19 levels were significantly higher in Groups C and D as opposed to Group A (p<0.001).
4.9. Interleukin-22 in Female T2DM patients.
The average blood IL-22 concentration in the control group of healthy females (N=41) was found to be 44± 12.02 pg/mL as are presented in Table 4.. The patients in Group A exhibited a little, albeit statistically insignificant rise in IL-22 levels (48± 14.08 versus 44± 12.02 pg/mL). Group B diabetics had a statistically significant (p<0.01) elevation in interleukin-22 (IL-22) levels in comparison to both the controls and group A. IL-22 values in group C exhibited a statistically significant rise in comparison to the controls, as well as groups A and B, with p-values less than 0.01, 0.01, and 0.04, respectively. The levels of IL-22 in Group D patients were significantly higher than those in the controls (p<0.001). and also, those of groups A (p<0.001) and B p<0.04). The cluster charts of serum interleukin concentrations in 74 female patients and 41 controls are displayed in Figure 3.
5. DISCUSSION:
Insulin resistance and/or defective insulin synthesis is the hallmark in the etiopathogenesis of T2DM.[8,14,15] Obesity has emerged as a significant contributing factor in the progression of T2DM. According to available estimates, over 90% of individuals diagnosed with diabetes exhibit obesity or overweight conditions.[17,18] According to recent observations [3,18], inflammation, adipokine dysregulation, changes in gut microbiota, and immunological dysregulation have emerged as important pathophysiological factors of T2DM. Multiple investigations have established a correlation between the etiology of Type 2 Diabetes Mellitus and interleukins, particularly the IL-10 family.[14,17,18,19,20] Hereby, we made an attempt to assess the concentrations of IL-10, IL-19, and IL-22 in four distinct groups of individuals with T2DM, categorized based on their body mass index (BMI), separately for males and females. These measurements were then compared to those of age-matched healthy individuals serving as controls.
5.1. Interleukin-10.
The mean ± SD values of IL-10 were similar in male (N=4) and female (N=41) controls which are in line with previous studies.[20,21,22,38,39] Diabetic patients in Group A, who have normal body weight and BMI, irrespective of gender, exhibited a substantial reduction in levels of IL-10 compared to control subjects. This reduction was highly significant, with a p-value of less than 0.001. This finding suggests that the diminished anti-inflammatory response of IL-10 is believed to contribute to the occurance of T2DM, as indicated by previous studies.[21,38,39] The male participants in group B who were overweight and had type 2 diabetes mellitus (T2DM) exhibited a statistically significant decrease in IL-10 levels (p<0.001). Similarly, the female participants in group B who were overweight and had T2DM also exhibited a substantial decrease in IL-10 levels, albeit to a lesser extent, with a p-value of less than 0.01, in comparison to the control group. The anti-inflammatory functions of IL-10 have been extensively referenced in the literature.[20,21,24] There is a prevailing belief that elevated levels of IL-10 may confer a protective mechanism in the progression of T2DM and metabolic syndrome. Conversely, it is hypothesized that excessively high levels of IL-10 could have counterproductive effects.[21] This study observed a notable reduction in IL-10 levels among male patients classified as obese and severely obese in categories C and D, in contrast to females in the corresponding categories. Indeed, the concentrations of IL-10 in female T2DM patients belonging to groups C and D were shown to be substantially elevated compared to their male counterparts in the corresponding metabolic groups (C and D) with a p-value less than 0.01. Subramaniam et al.[40] have also documented comparable findings. Pro- and anti-inflammatory interleukins have been shown to display sexual dimorphism in a number of human and animal investigations.41-43.[41,42,43] The elevated concentrations of IL-10 in females who are obese or severely obese may be associated with female sex hormones, as previously suggested [44,45], given that adipose tissue is the primary site for the conversion of female sex hormones.[46] Elevated concentrations of IL-10 have also been observed in post-menopausal females in comparison to their pre-menopausal counterparts.[46] The current understanding of the specific mechanism underlying the elevation of IL-10 concentrations in obese and severely obese female patients with type 2 diabetics remains unclear, but it is hypothesized that this process may be influenced by transcriptional regulation[40] One may propose a hypothesis suggesting that elevated levels of obesity in females, resulting in comparatively increased IL-10 levels, may contribute to a defensive and anti-inflammatory process. However, the precise mechanism underlying this phenomenon remains unclear and warrants further investigation.
5.2. Interleukin-19.
Interleukin-19, a relatively recent addition to the IL-10 family, consists of 159 amino acids that arrange themselves into an α-helical conformation.[24] This cytokine has been implicated in several illnesses, viz. type 1 and type 2 diabetes mellitus.[30,46] The findings of our study indicate a substantial and statistically significant disruption in the concentrations of IL-19 among all four cohorts of patients with T2DM, regardless of gender. These results align with a limited body of prior research.[30,46] Group C and D diabetics, representing individuals with obesity and excessive obesity, respectively, exhibited substantial and statistically significant increases in interleukin-19 (IL-19) levels compared to both control subjects and individuals in group A, who had T2DM and normal body weight (p<0.001). This observation was consistent across both male and female patients. This finding seems to sugges that IL-19 plays a significant role in both T2DM and different degrees of obesity, which aligns with prior research.[30,46] IL-19 appears to possess anti-inflammatory properties, as it acts to decrease the production of adhesion molecules and maybe other processes that are still unidentified.[27,47,48,49] Previous studies have documented the anti-inflammatory, antiatherogenic, and vasculoprotective characteristics of IL-19, suggesting its significant therapeutic value.[7,50] This idea needs to be validated and refined in future studies with bigger sample sizes.
5.3. Interleukin-22.
All the T2DM patient groups A-D displayed a progressive elevation of IL-22 levels irrespective of gender, although significant alterations were seen only in groups B to D (p<0.01 for groups C and D and p<0.05 for group B as compared to healthy controls) which are in close agreement with earlier studies.[25,34,51] Interestingly, the only significant rises in IL-22 levels were associated with T2DM in overweight and patients with varied degrees of obesity, and these changes occurred in both sexes of T2DM patients. This observation is in conformity with the postulation of earlier investigators that IL-22 per se does not qualify as a clear-cut biomarker for T2DM.[25,51] Sex hormones do not seem to be regulators of IL-22 levels as depicted in our studies.[51] Many different types of cells carry the IL-22 receptor complex, which consists of two transmembrane receptors: IL-22 R1 and IL-10 R2. The latter also regulates IL-10, IL-26, IL-28, and IL-29.[52]
Some research has shown that insulin-resistant or type 2 diabetes obese people have greater plasma levels of IL-22 and a larger frequency of IL-22-producing CD4+ T cells than insulin-sensitive obese patients or lean persons.[53,54] These studies have several flaws, such as a lack of replication and a relatively small sample size. In animal models, IL-22 has been shown to reduce both oxidative and endoplasmic reticulum stress.[55] There is no data on the role of IL-22 therapy in humans, despite the fact that systemic injection of exogenous IL-22 can improve metabolic abnormalities in adipose mice.[55] It is worth noting that our study revealed minimal and statistically insignificant alterations in IL-22 concentrations among diabetic individuals across both genders. Notably, the sole noteworthy variations in IL-22 levels were observed in overweight diabetics or those who exhibited varied degrees of obesity. This observation aligns with the hypothesis put forth by previous researchers that IL-22 alone does not meet the criteria to be considered a definitive biomarker for T2DM[25,51] According to the findings of our investigations, it appears that sex hormones do not seem to play a regulatory role in the modulation of IL-22 levels.[51] The receptor complex utilized by IL-22 consists of two distinct transmembrane receptors, namely IL-22 R1 and IL-10 R2. It's important to remember that IL-10 R2 regulates not just IL-10 but also IL-26, IL-28, and IL-29. [52]. Furthermore, IL-10 R2 is expressed by several cell types.[52]
Multiple studies have found that people with insulin resistance or type 2 diabetes mellitus, who are also obese, had higher plasma levels of interleukin-22 and a greater abundance of IL-22-producing CD4+ T cells than insulin-sensitive obese people or people who are lean.[53,54] The research in question is subject to some limitations, namely limited sample numbers and a lack of corroboration from further investigations. Evidence from animal models shows that IL-22 can reduce oxidative and endoplasmic reticulum stress.[55] Although there is evidence that the administration of exogenous IL-22 can ameliorate metabolic dysfunctions in adipose rats[55], there is currently no available research on the therapeutic potential of IL-22 in people.
5.4. Limitations
The study has certain limitations that should be acknowledged. One potential constraint of our investigation was the comparatively limited sample size. Additional investigation is necessary to explore the potential role of IL-10 family members in the pathogenesis of type 2 diabetes mellitus (T2DM) and any potential therapeutic strategies. In order to improve the validity and generalizability of the findings, it is recommended that future prospective research strive to incorporate a sizable sample size.
6. Conclusions
Our investigation revealed that type 2 diabetic individuals of both genders exhibited noteworthy decreases in interleukin-10 levels in comparison to the control group. Nevertheless, males who were obese or severely obese, exhibited notably substantial reductions in IL-10 levels. The levels of IL-10 were found to be greater in female patients. The quantities of IL-19 were found to be higher in all four cohorts, with a particularly notable effect observed in persons who were classified as obese or extremely obese. IL-22 levels increased gradually in both groups, but the relationship between IL-22 and T2DM is inconclusive.
Acknowledgments
The authors are thankful to the Deanship of Scientific Research at University of Bisha for supporting this work through the Fast-Track Research Support Program.
References
- 1. Sun H, Saeedi P, Karuranga S, et al. IDF Diabetes Atlas: Global, regional and country-level diabetes prevalence estimates for 2021 and projections for 2045. Diabetes Res Clin Pract. [CrossRef]
- 2. Yan Y, Wu T, Zhang M, Li C, Liu Q, Li F. Prevalence, awareness and control of type 2 diabetes mellitus and risk factors in Chinese elderly population. BMC Public Health, 2022. [CrossRef]
- 3. Mir MM, Mir R, Alghamdi MAA, et al. Differential Association of Selected Adipocytokines, Adiponectin, Leptin, Resistin, Visfatin and Chemerin, with the Pathogenesis and Progression of Type 2 Diabetes Mellitus (T2DM) in the Asir Region of Saudi Arabia: A Case Control Study. J Pers Med, 1 May 2022. [CrossRef]
- 4. Mir MM, Mir R, Alghamdi MAA, et al. Potential impact of GCK, MIR-196A-2 and MIR-423 gene abnormalities on the development and progression of type 2 diabetes mellitus in Asir and Tabuk regions of Saudi Arabia. Mol Med Rep. [CrossRef]
- 5. Qadir MI, Ahmed Z. lep Expression and Its Role in Obesity and Type-2 Diabetes. Crit Rev Eukaryot Gene Expr. [CrossRef]
- 6. Saeedi P, Petersohn I, Salpea P, et al. Global and regional diabetes prevalence estimates for 2019 and projections for 2030 and 2045: Results from the International Diabetes Federation Diabetes Atlas, 9th edition. Diabetes Res Clin Pract. [CrossRef]
- 7. Zhou X, Guan H, Zheng L, et al. Prevalence and awareness of diabetes mellitus among a rural population in China: results from Liaoning Province. Diabet Med. [CrossRef]
- 8. Moin ASM, Butler AE. Alterations in Beta Cell Identity in Type 1 and Type 2 Diabetes. Curr Diab Rep, 2019. [CrossRef]
- 9. Yin J, Yeung R, Luk A, et al. Gender, diabetes education, and psychosocial factors are associated with persistent poor glycemic control in patients with type 2 diabetes in the Joint Asia Diabetes Evaluation (JADE) program. J Diabetes. [CrossRef]
- Liu M, Lv X, Li Y, Li J, He Y. Prevalence and Control Status of Diabetes and Related Risk Factors Among 4196 Chinese Male Older Elderly Aged ≥80 Years. Int J Gerontol. 2018;12(2):122–126. [CrossRef]
- 11. Wang H, Yao J, Yin X, et al. Organisational and individual characteristics associated with glycaemic control among patients with type 2 diabetes: cross-sectional study in China. BMJ Open, 0363. [CrossRef]
- 12. Irazola V, Rubinstein A, Bazzano L, et al. Prevalence, awareness, treatment and control of diabetes and impaired fasting glucose in the Southern Cone of Latin America. PLoS One, 0183. [CrossRef]
- 13. Hu D, Fu P, Xie J, et al. Increasing prevalence and low awareness, treatment and control of diabetes mellitus among Chinese adults: the InterASIA study. Diabetes Res Clin Pract. [CrossRef]
- 14. Galicia-Garcia U, Benito-Vicente A, Jebari S, et al. Pathophysiology of Type 2 Diabetes Mellitus. Int J Mol Sci, 6275. [CrossRef]
- 15. Abdul-Ghani MA, Jayyousi A, DeFronzo RA, Asaad N, Al-Suwaidi J. Insulin Resistance the Link between T2DM and CVD: Basic Mechanisms and Clinical Implications. Curr Vasc Pharmacol. [CrossRef]
- 16. Forbes JM, Cooper ME. Mechanisms of diabetic complications. Physiol Rev. [CrossRef]
- 17. Niu G, Li J, Wang H, Ren Y, Bai J. Associations of A-FABP with Anthropometric and Metabolic Indices and Inflammatory Cytokines in Obese Patients with Newly Diagnosed Type 2 Diabetes. Biomed Res Int, 8209. [CrossRef]
- 18. Urbanavičius V, Abalikšta T, Brimas G, Abraitienė A, Gogelienė L, Strupas K. Comparison of changes in blood glucose, insulin resistance indices, and adipokine levels in diabetic and nondiabetic subjects with morbid obesity after laparoscopic adjustable gastric banding. Medicina (Kaunas).
- Brocker C, Thompson D, Matsumoto A, Nebert DW, Vasiliou V. Evolutionary divergence and functions of the human interleukin (IL) gene family. Hum Genomics. [CrossRef]
- Cheng, G. Role of interleukin 10 transcriptional regulation in inflammation and autoimmune disease. Crit Rev Immunol. 2012;32(1):23-63. [CrossRef]
- 21. van Exel E, Gussekloo J, de Craen AJ, et al. Low production capacity of interleukin-10 associates with the metabolic syndrome and type 2 diabetes : the Leiden 85-Plus Study. Diabetes, 1092. [CrossRef]
- 22. Snijder MB, Heine RJ, Seidell JC, et al. Associations of adiponectin levels with incident impaired glucose metabolism and type 2 diabetes in older men and women: the hoorn study. Diabetes Care, 2498. [CrossRef]
- 23. Scarpelli D, Cardellini M, Andreozzi F, et al. Variants of the interleukin-10 promoter gene are associated with obesity and insulin resistance but not type 2 diabetes in caucasian italian subjects. Diabetes, 1533. [CrossRef]
- 24. Hofmann SR, Rösen-Wolff A, Tsokos GC, Hedrich CM. Biological properties and regulation of IL-10 related cytokines and their contribution to autoimmune disease and tissue injury. Clin Immunol. [CrossRef]
- 25. Sabat R, Wolk K. Deciphering the role of interleukin-22 in metabolic alterations. Cell Biosci, 2015. [CrossRef]
- 26. Jordan WJ, Eskdale J, Boniotto M, et al. Human IL-19 regulates immunity through auto-induction of IL-19 and production of IL-10. Eur J Immunol, 1582. [CrossRef]
- 27. Ray M, Autieri MV. Regulation of pro- and anti-atherogenic cytokines. Cytokine. [CrossRef]
- 28. Jain S, Gabunia K, Kelemen SE, Panetti TS, Autieri MV. The anti-inflammatory cytokine interleukin 19 is expressed by and angiogenic for human endothelial cells. Arterioscler Thromb Vasc Biol. [CrossRef]
- 29. England RN, Autieri MV. Anti-inflammatory effects of interleukin-19 in vascular disease. Int J Inflam, 3583. [CrossRef]
- 30. Li L, ZHeng-Qing Y, Juan-Yu H, et al. Association between interleukin-19 and angiopoietin-2 with vascular complications in type 2 diabetes. J Diabetes Investig. [CrossRef]
- 31. Li L, Yu ZH, Qian L, et al. Interleukin-19 and angiopoietin-2 can enhance angiogenesis of diabetic complications. J Diabetes Complications. [CrossRef]
- 32. Chen J, Caspi RR, Chong WP. IL-20 receptor cytokines in autoimmune diseases. J Leukoc Biol. [CrossRef]
- 33. Keir M, Yi Y, Lu T, Ghilardi N. The role of IL-22 in intestinal health and disease. J Exp Med, 2019. [CrossRef]
- 34. Shen J, Fang Y, Zhu H, Ge W. Plasma interleukin-22 levels are associated with prediabetes and type 2 diabetes in the Han Chinese population. J Diabetes Investig. [CrossRef]
- 35. Sonnenberg GF, Fouser LA, Artis D. Functional biology of the IL-22-IL-22R pathway in regulating immunity and inflammation at barrier surfaces. Adv Immunol. [CrossRef]
- 36. Zenewicz LA, Flavell RA. IL-22 and inflammation: leukin' through a glass onion. Eur J Immunol, 3265. [CrossRef]
- 37. Wang X, Ota N, Manzanillo P, et al. Interleukin-22 alleviates metabolic disorders and restores mucosal immunity in diabetes. Nature. [CrossRef]
- 38. Yaghini N, Mahmoodi M, Asadikaram GR, Hassanshahi GH, Khoramdelazad H, Kazemi Arababadi M. Serum levels of interleukin 10 (IL-10) in patients with type 2 diabetes. Iran Red Crescent Med J.
- 39. Giulietti A, van Etten E, Overbergh L, Stoffels K, Bouillon R, Mathieu C. Monocytes from type 2 diabetic patients have a pro-inflammatory profile. 1,25-Dihydroxyvitamin D(3) works as anti-inflammatory. Diabetes Res Clin Pract. [CrossRef]
- 40. Subramanian N, Tavira B, Hofwimmer K, et al. Sex-specific regulation of IL-10 production in human adipose tissue in obesity. Front Endocrinol (Lausanne), 2022. [CrossRef]
- 41. Cartier A, Côté M, Lemieux I, et al. Sex differences in inflammatory markers: what is the contribution of visceral adiposity? Am J Clin Nutr, 1314. [CrossRef]
- 42. Camporez JP, Lyu K, Goldberg EL, et al. Anti-inflammatory effects of oestrogen mediate the sexual dimorphic response to lipid-induced insulin resistance. J Physiol, 3885. [CrossRef]
- 43. Mahr S, Menard J, Krenn V, Müller B. Sexual dimorphism in the osteoarthritis of STR/ort mice may be linked to articular cytokines. Ann Rheum Dis, 1234. [CrossRef]
- 44. Verthelyi D, Klinman DM. Sex hormone levels correlate with the activity of cytokine-secreting cells in vivo. Immunology. [CrossRef]
- 45. Mauvais-Jarvis F, Clegg DJ, Hevener AL. The role of estrogens in control of energy balance and glucose homeostasis. Endocr Rev. [CrossRef]
- 46. garkava M, Pantsulaia I, Rukhadze R, Karanadze N, Chikovani T. ASSOCIATION OF IL-10 AND RESISTIN IN APPARENTLY HEALTHY ELDERLY POPULATION. Georgian Med News.
- 47. Cuneo AA, Herrick D, Autieri MV. Il-19 reduces VSMC activation by regulation of mRNA regulatory factor HuR and reduction of mRNA stability. J Mol Cell Cardiol. [CrossRef]
- Ellison S, Gabunia K, Kelemen SE, et al. Attenuation of experimental atherosclerosis by interleukin-19 [published correction appears in Arterioscler Thromb Vasc Biol. 2014 Jan; 34(1): e1. Orr, Wayne [corrected to Orr, A Wayne]]. Arterioscler Thromb Vasc Biol. 2013. [Google Scholar] [CrossRef]
- 49. England RN, Preston KJ, Scalia R, Autieri MV. Interleukin-19 decreases leukocyte-endothelial cell interactions by reduction in endothelial cell adhesion molecule mRNA stability. Am J Physiol Cell Physiol. [CrossRef]
- 50. Ouyang W, O'Garra A. IL-10 Family Cytokines IL-10 and IL-22: from Basic Science to Clinical Translation. Immunity. [CrossRef]
- 51. Herder C, Kannenberg JM, Carstensen-Kirberg M, et al. Serum levels of interleukin-22, cardiometabolic risk factors and incident type 2 diabetes: KORA F4/FF4 study. Cardiovasc Diabetol, 2017. [CrossRef]
- 52. Sabat R, Ouyang W, Wolk K. Therapeutic opportunities of the IL-22-IL-22R1 system. Nat Rev Drug Discov. [CrossRef]
- 53. Fabbrini E, Cella M, McCartney SA, et al. Association between specific adipose tissue CD4+ T-cell populations and insulin resistance in obese individuals. Gastroenterology. [CrossRef]
- 54. Dalmas E, Venteclef N, Caer C, et al. T cell-derived IL-22 amplifies IL-1β-driven inflammation in human adipose tissue: relevance to obesity and type 2 diabetes. Diabetes, 1977. [CrossRef]
- 55. Hasnain SZ, Borg DJ, Harcourt BE, et al. Glycemic control in diabetes is restored by therapeutic manipulation of cytokines that regulate beta cell stress. Nat Med, 1417. [CrossRef]
Figure 1.
Map showing different provinces of Saudi Arabia. The study area is highlighted by green boundary (red arrow).
Figure 1.
Map showing different provinces of Saudi Arabia. The study area is highlighted by green boundary (red arrow).
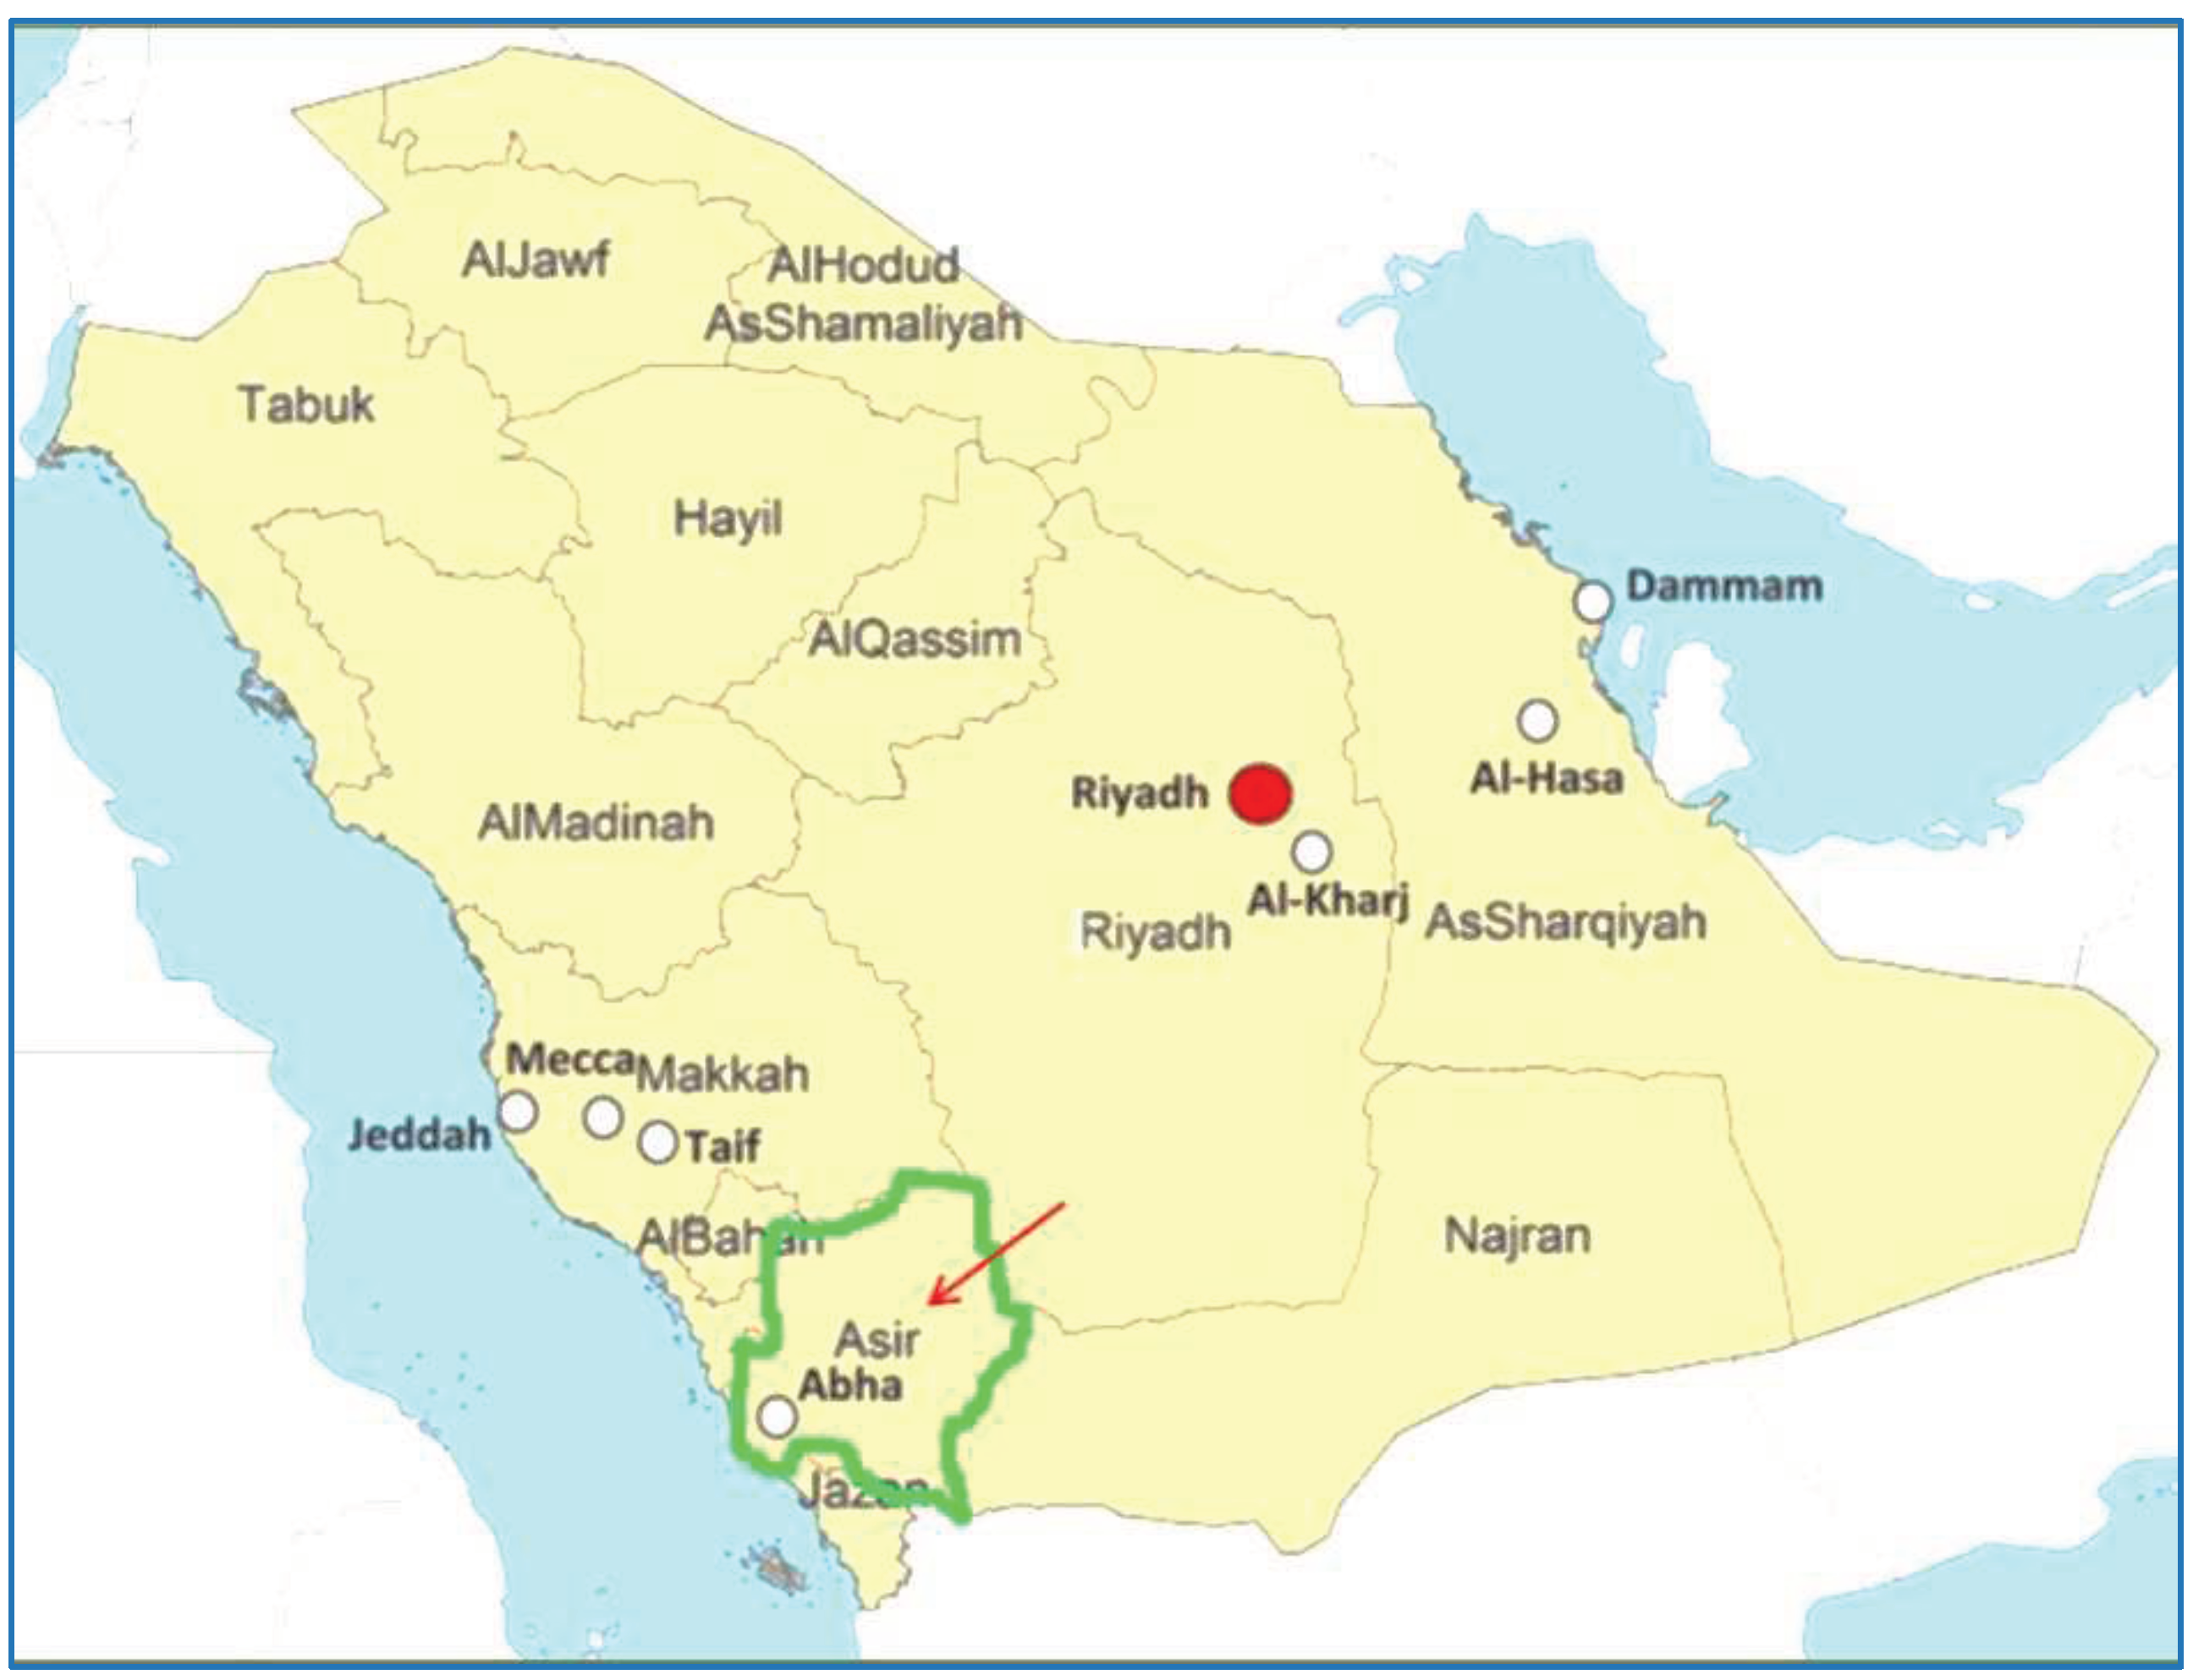
Figure 2.
Cluster charts of Interleukin levels in male controls and T2DM patients.
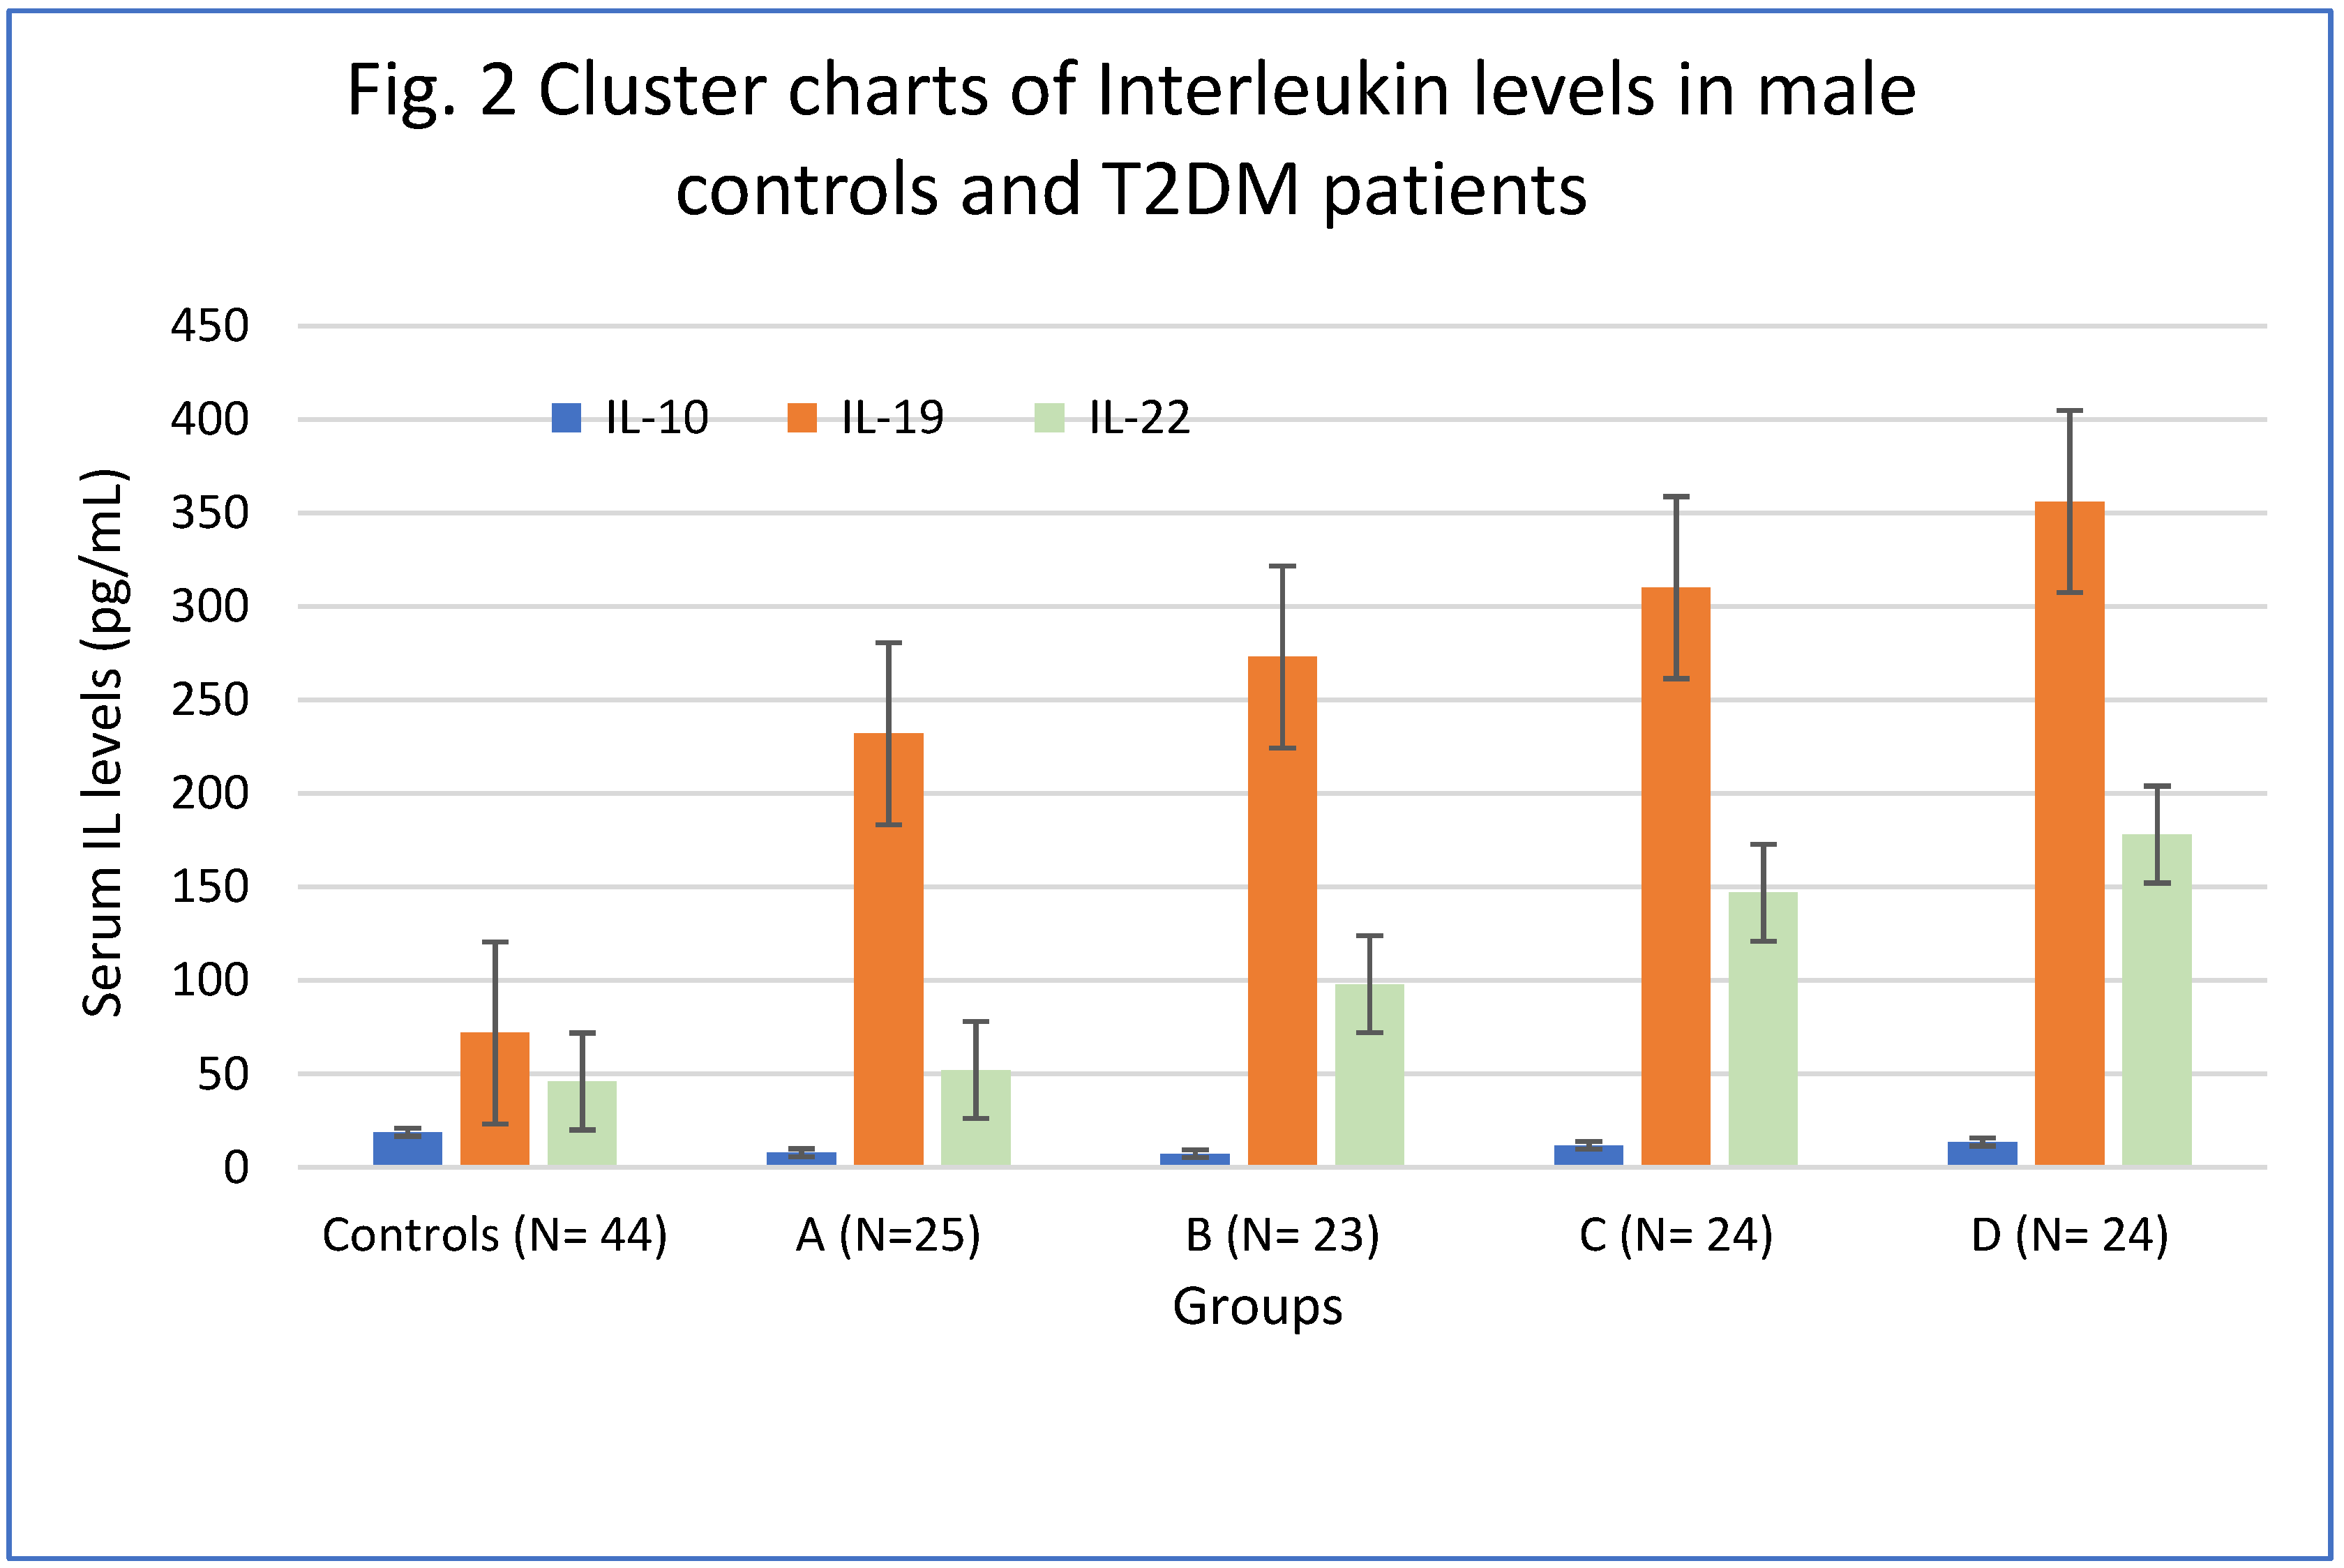
Figure 3.
Cluster charts of Interleukin levels in female controls and T2DM patients.
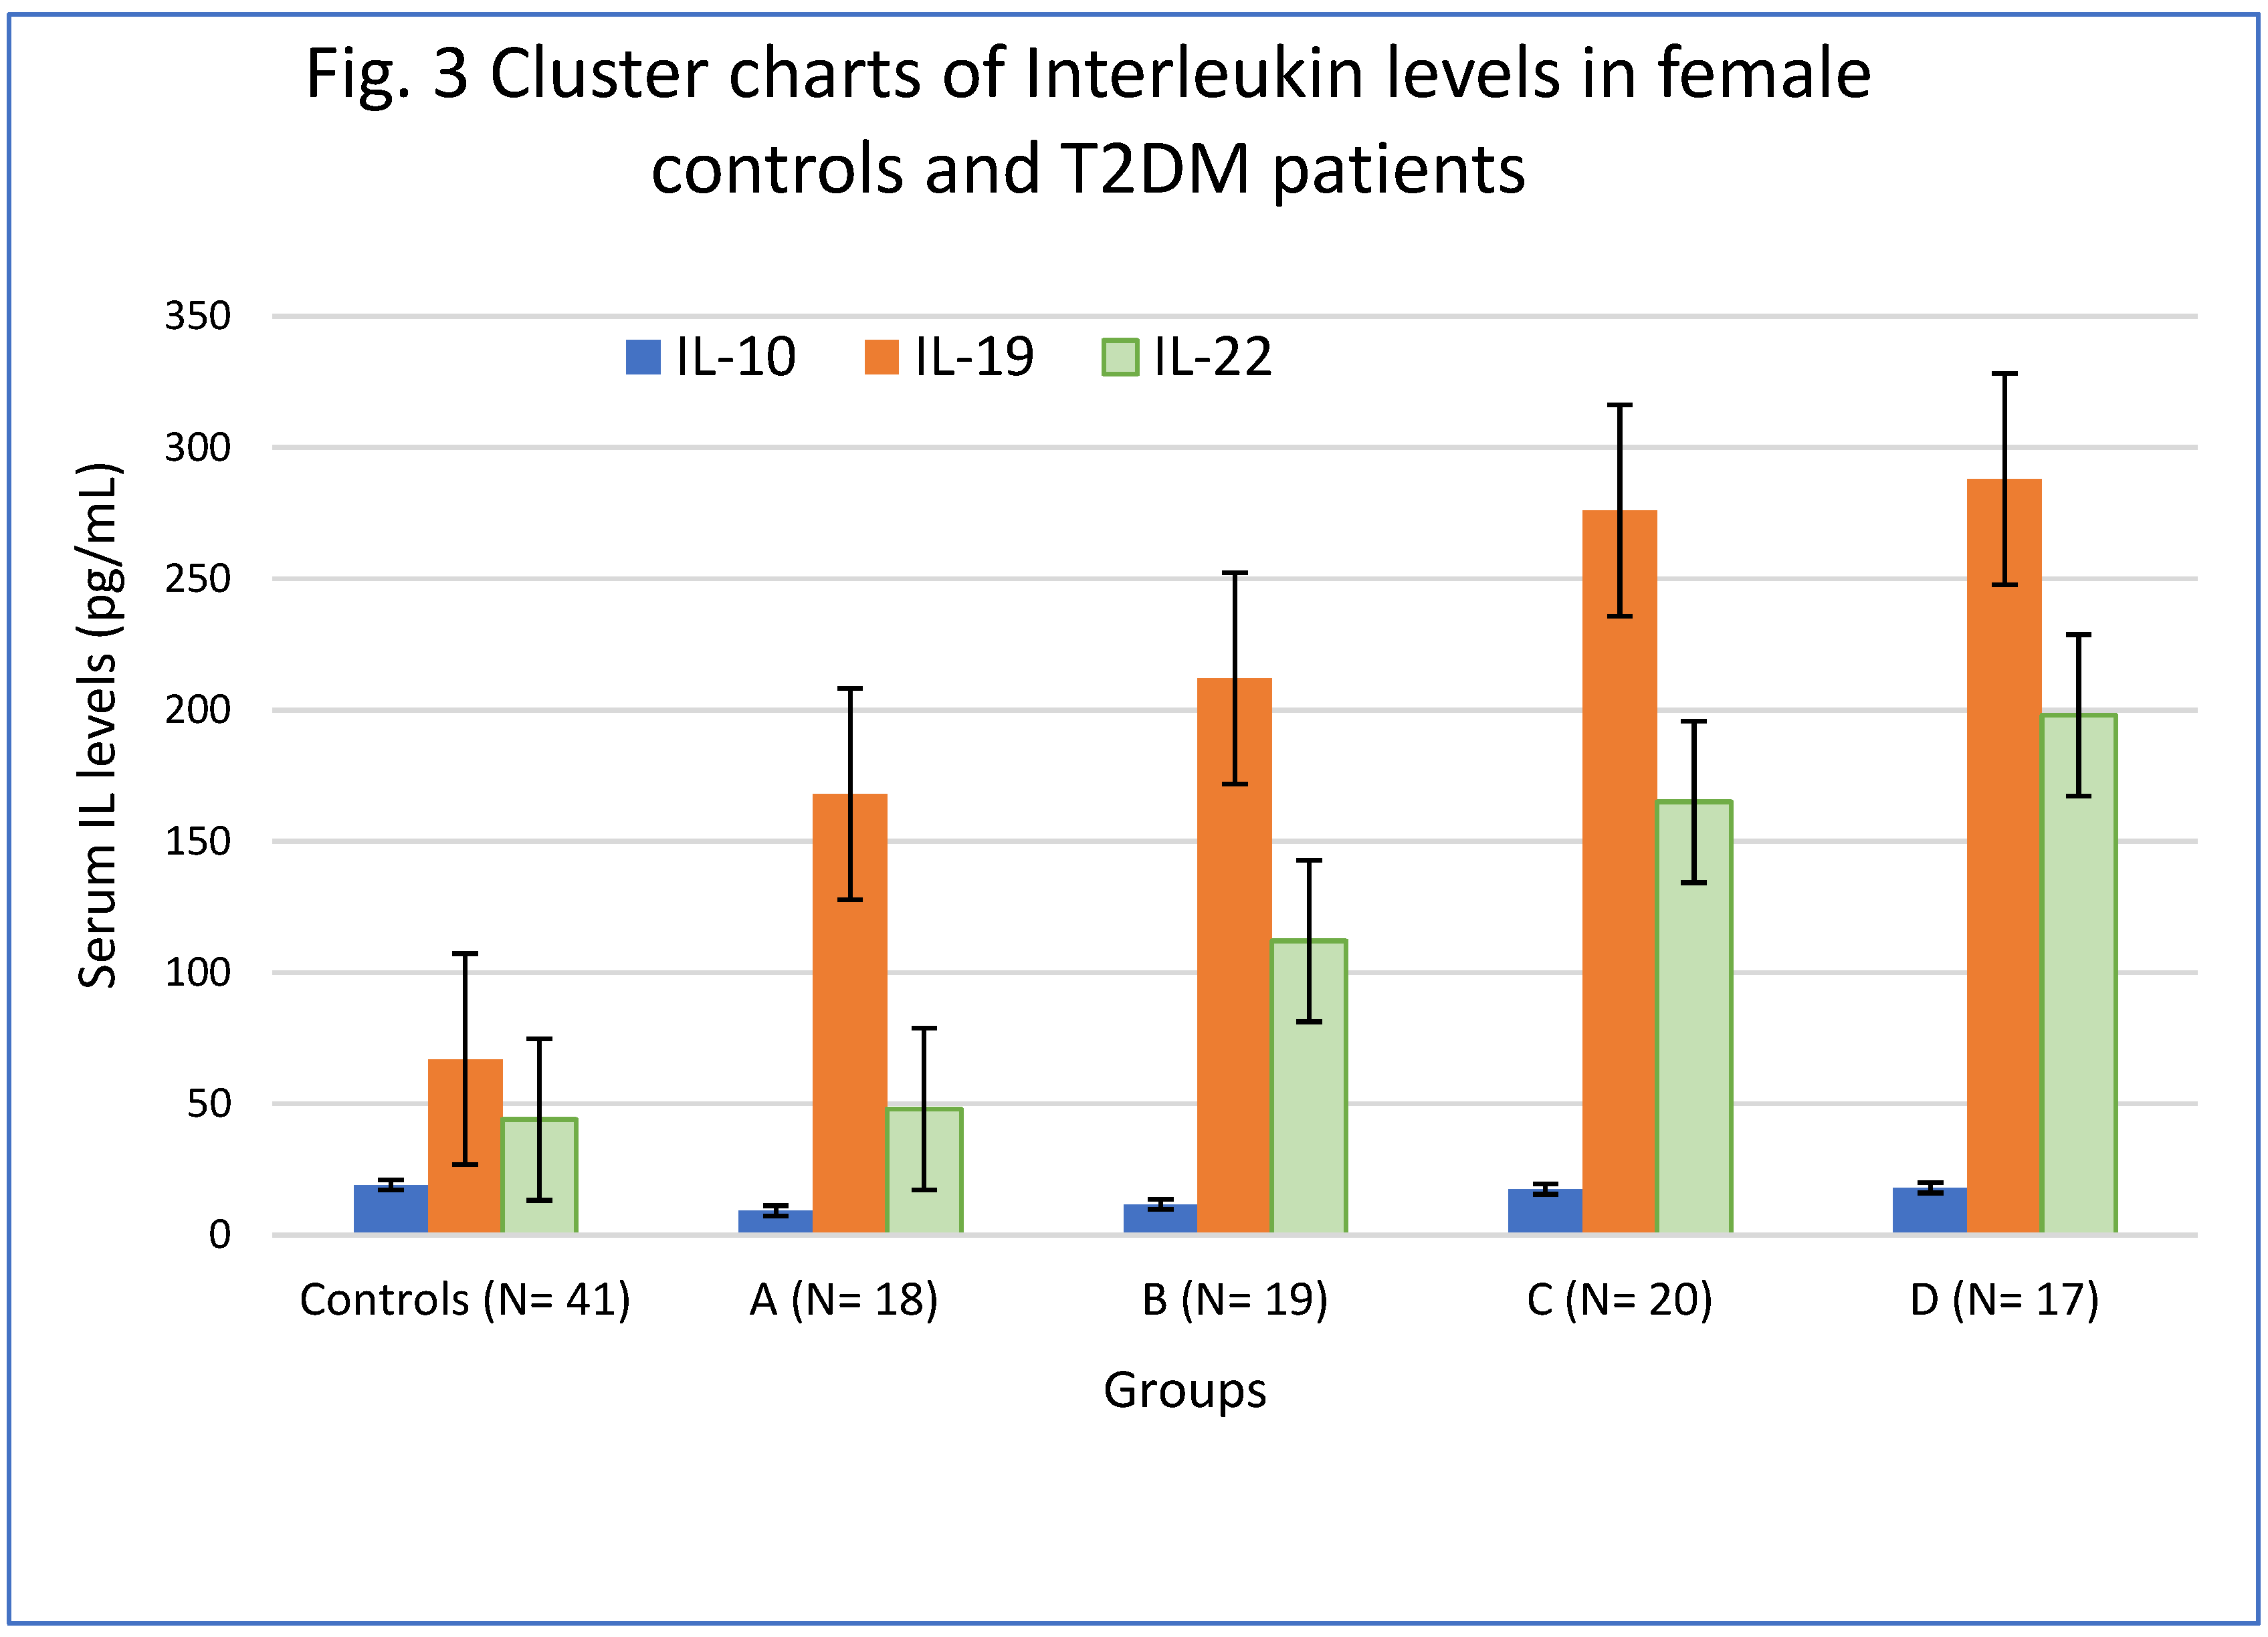

Table 1.
Anthropometric indices and biochemical parameters of T2DM patients and controls (Male group).
Table 1.
Anthropometric indices and biochemical parameters of T2DM patients and controls (Male group).
| Anthropometric and biochemical indices | Controls | Group A | Group B | Group C | Group D |
|---|---|---|---|---|---|
| N= 44 | N=96 | ||||
| 25 | 23 | 24 | 24 | ||
| Age | 46(28-62) | 43(27-51) | 47(29-55) | 49(30-66) | 47(32-67) |
| WHR | 0.86 (0.84-0.95) |
0.92 (0.84-0.1.05) |
0.94 (0.83-1.06) |
1.07**T (0.97-1.11) |
1.14*S (1.02-1.19) |
| BMI (kg/m2) | 21.78 ± 1.78 | 21.80 ± 2.14 | 27.44 ± 2.29 | 34.94 ± 3.18*T | 47.22± 5.70*WX |
| Fasting Glucose(mg/dL) | 92(78-116) | 115(88-130) | 114(92-138) | 116(92-144) | 124(103-152) |
| HbA1c (g/dL) | 4.9±0.88 | 7.4 ±1.02* | 8.1±1.2* | 8.7±1.48*S | 7.6±0.78* |
| Cholesterol-T | 186 (135-224) | 204**(154-230) | 214*(148-232) | 215*(142-240) | 226*(158-258) |
| HDL-C(mg/dL) | 53(38- 63) | 46(36—60) | 48(38-56) | 45(33-58) | 44(28-54) |
| LDL-C(mg/dL) | 94±32.20 | 98 (62-131) | 118** (80-136) | 120** (80-152) | 136*w (95-162) |
| TG (mg/dL) | 116(86-132) | 122(96-136) | 146(98-178) | 232*(162-256) | 242*w(162-286) |
Age is presented in years with the range in parentheses. WHR-waist to hip ratio; BMI-body mass index. HbA1c- Glycated hemoglobin; Cholesterol-T-Total cholesterol; HDL–High density lipoprotein; LDL-Low density lipoprotein; TG-Triglycerides. .Group A -T2DM patients with normal body weight; Group B–overweight T2DM patients; Group C-T2DM patients with obesity and Group D -T2DM patients with severe obesity. *p<0.001 vs control group; **p< 0.01 vs control group, S p< 0.001 vs group A and B, T p< 0.01 vs group A and B; W p< 0.001 vs controls and group A ; X p< 0.01 vs group C.
Table 2.
Anthropometric indices and biochemical parameters of T2DM patients and controls (Female group).
Table 2.
Anthropometric indices and biochemical parameters of T2DM patients and controls (Female group).
| Anthropometric and biochemical indices | Controls | Group A | Group B | Group C | Group D |
|---|---|---|---|---|---|
| N= 41 | N=74 | ||||
| 18 | 19 | 20 | 17 | ||
| Age | 48(27-64) | 44(26-55) | 47(27-57) | 46(28-62) | 48(30-69) |
| WHR | 0.85 (0.78-0.96) |
0.91 (0.82-0.1.04) |
0.92 (0.84-1.05) |
1.06**T (0.97-1.13) |
1.10*S (1.02-1.22) |
| BMI (kg/m2) | 21.2 ± 1.66 | 21.41 ± 2.14 | 28.22 ± 2.26 | 33.88± 3.20*T | 46.48± 5.20*WX |
| Fasting Glucose(mg/dL) | 96(82-114 | 118**(90-141) | 114**(92-138) | 116**(92-144) | 124*(103-152) |
| HbA1c (g/dL) | 4.5±0.43 | 7.8±1.02* | 8.1±1.2* | 8.5±1.48*S | 8.4±0.98* |
| Cholesterol-T | 168 (132-224) | 196**(145-227) | 204**(144-238) | 215**(155-235) | 228**(162-262) |
| HDL-C(mg/dL) | 56(41- 66) | 54 (39—62) | 52(40-63) | 46(35-64) | 44(35-62) |
| LDL-C(mg/dL) | 96±28.22 | 92±28.28 | 111**±33.08 | 108**±30.30 | 132*±32.12 |
| TG (mg/dL) | 96(88-124) | 126**(94-168) | 142**(88-222) | 152**(99- 223) | 195*wx(98-245) |
Age is presented in years with the range in parentheses. WHR-waist to hip ratio; BMI-body mass index. HbA1c- Glycated hemoglobin; Cholesterol-T-Total cholesterol; HDL –High density lipoprotein; LDL-Low density lipoprotein; TG-Triglycerides. Group A -T2DM patients with normal body weight; Group B–overweight T2DM patients; Group C-T2DM patients with obesity and Group D -T2DM patients with severe obesity. *p<0.001 vs control group; **p< 0.01 vs control group, S p< 0.001 vs group A and B, T p< 0.01 vs group A and B; W p< 0.001 vs controls and group A ; X p< 0.01 vs group C.
Table 3.
Serum levels of Interleukins 10, 19, and 22 male T2DM patients and normal controls.
| Groups | IL-10 (pg/mL) | IL-19 (pg/mL) | IL-22 (pg/mL) |
|---|---|---|---|
| Controls (N= 44) | 18.78 ± 2.21 | 72 ± 21.45 | 46 ± 12.48 |
| A (N=25) | 7.89 ± 1.45* | 232± 21.45** | 52± 17.45 |
| B (N= 23) | 7.32 ± 1.36* | 273 ± 29.66** | 98 ± 26.12***M |
| C (N= 24) | 11.78±1.87** S | 310 ± 32.24*S | 147 ± 34.65** L |
| D (N= 24) | 13.56±1.92***T | 356 ± 43.64*T | 178± 38.28*P |
Group A -T2DM patients with normal body weight; Group B–overweight T2DM patients; Group C-T2DM patients with obesity and Group D -T2DM patients with severe obesity. *p<0.001 vs control group;** p<0.01 vs control group; ;*** p<0.05 vs control group; L p< 0.04 vs Group B S p <0.05 compared to patient groups A and B; T p <0.05 compared to patient groups A and B; M p <0.05 compared to controls and patient group A; N p <0.01 compared to controls and patient group A; P p <0.001 compared to controls and patient group A.
Table 4.
Serum levels of Interleukins 10, 19, and 22 female T2DM patients and normal controls.
| Groups | IL-10 (pg/mL | IL-19 (pg/ mL) | IL-22 (pg/ mL) |
|---|---|---|---|
| Controls (N= 41) | 19.12 ± 2.28 | 67 ± 17.42 | 44± 12.02 |
| A (N= 18) | 9.23 ± 1.52* | 168± 26.78* | 48 ± 14.08 |
| B (N= 19) | 11.68 ± 1.55** | 212± 28.22*X | 112 ± 29.56**S |
| C (N= 20) | 17.46±2.10 | 276± 35.14***Y | 165 ± 33.24**SM |
| D (N= 17) | 18.02 ± 2.14 | 288 ± 36.98***Y | 198± 37.82***TN |
Group A -T2DM patients with normal body weight; Group B–overweight T2DM patients; Group C-T2DM patients with obesity and Group D -T2DM patients with severe obesity. *p<0.001 vs control group; ** p<0.01 vs control group; *** p<0.0001 vs control group; X p <0.01 compared to patient groups A; Y p <0.001 compared to patient groups A; S <0.01 compared to patient groups A and controls; T p <0.001 compared to patient group A and controls; M p <0.04 compared to group B; N p <0.01 compared to patient group B.
Disclaimer/Publisher’s Note: The statements, opinions and data contained in all publications are solely those of the individual author(s) and contributor(s) and not of MDPI and/or the editor(s). MDPI and/or the editor(s) disclaim responsibility for any injury to people or property resulting from any ideas, methods, instructions or products referred to in the content. |
© 2023 by the authors. Licensee MDPI, Basel, Switzerland. This article is an open access article distributed under the terms and conditions of the Creative Commons Attribution (CC BY) license (https://creativecommons.org/licenses/by/4.0/).
Copyright: This open access article is published under a Creative Commons CC BY 4.0 license, which permit the free download, distribution, and reuse, provided that the author and preprint are cited in any reuse.


