Preprint
Review

BiFC Magic: Shedding Light on Protein-Protein Interactions

Altmetrics

Downloads

388

Views

188

Comments

0

This version is not peer-reviewed

Submitted:

11 October 2023

Posted:

12 October 2023

You are already at the latest version

Alerts
Abstract
Deciphering protein–protein interactions (PPIs) in vivo is crucial to understand protein function. Bimolecular fluorescence complementation (BiFC) is one of extensively used PCAs over the last decade in many different native contexts, including human live cells. It is based on the reconstitution of a monomeric fluorescent protein (FP) such as cyan fluorescent protein (CFP) and yellow fluorescent protein (YFP) from two complementary nonfluorescent sub-fragments (N- and C-terminal sub-fragments) upon spatial proximity. Interaction between a bait protein and a prey protein fused to such complementary sub-fragments is sufficient to lead to the reconstitution of the FP, resulting in an emission signal upon excitation (Figure 1). In this comprehensive review, we commence by tracing the development of fluorescent proteins (FPs) tailored for BiFC, followed by the highlighting of BiFC advantages over other PPI detection methods. Concurrently, the essential factors and nuanced considerations when employing BiFC are thoroughly explored. To vividly showcase the versatility of BiFC, the implementations at different throughputs are also presented, encompassing both single PPI experiments and large-scale studies, along with noteworthy variants of BiFC.
Keywords: 
Subject: Biology and Life Sciences  -   Biochemistry and Molecular Biology

1. Fluorescent proteins for BiFC assay
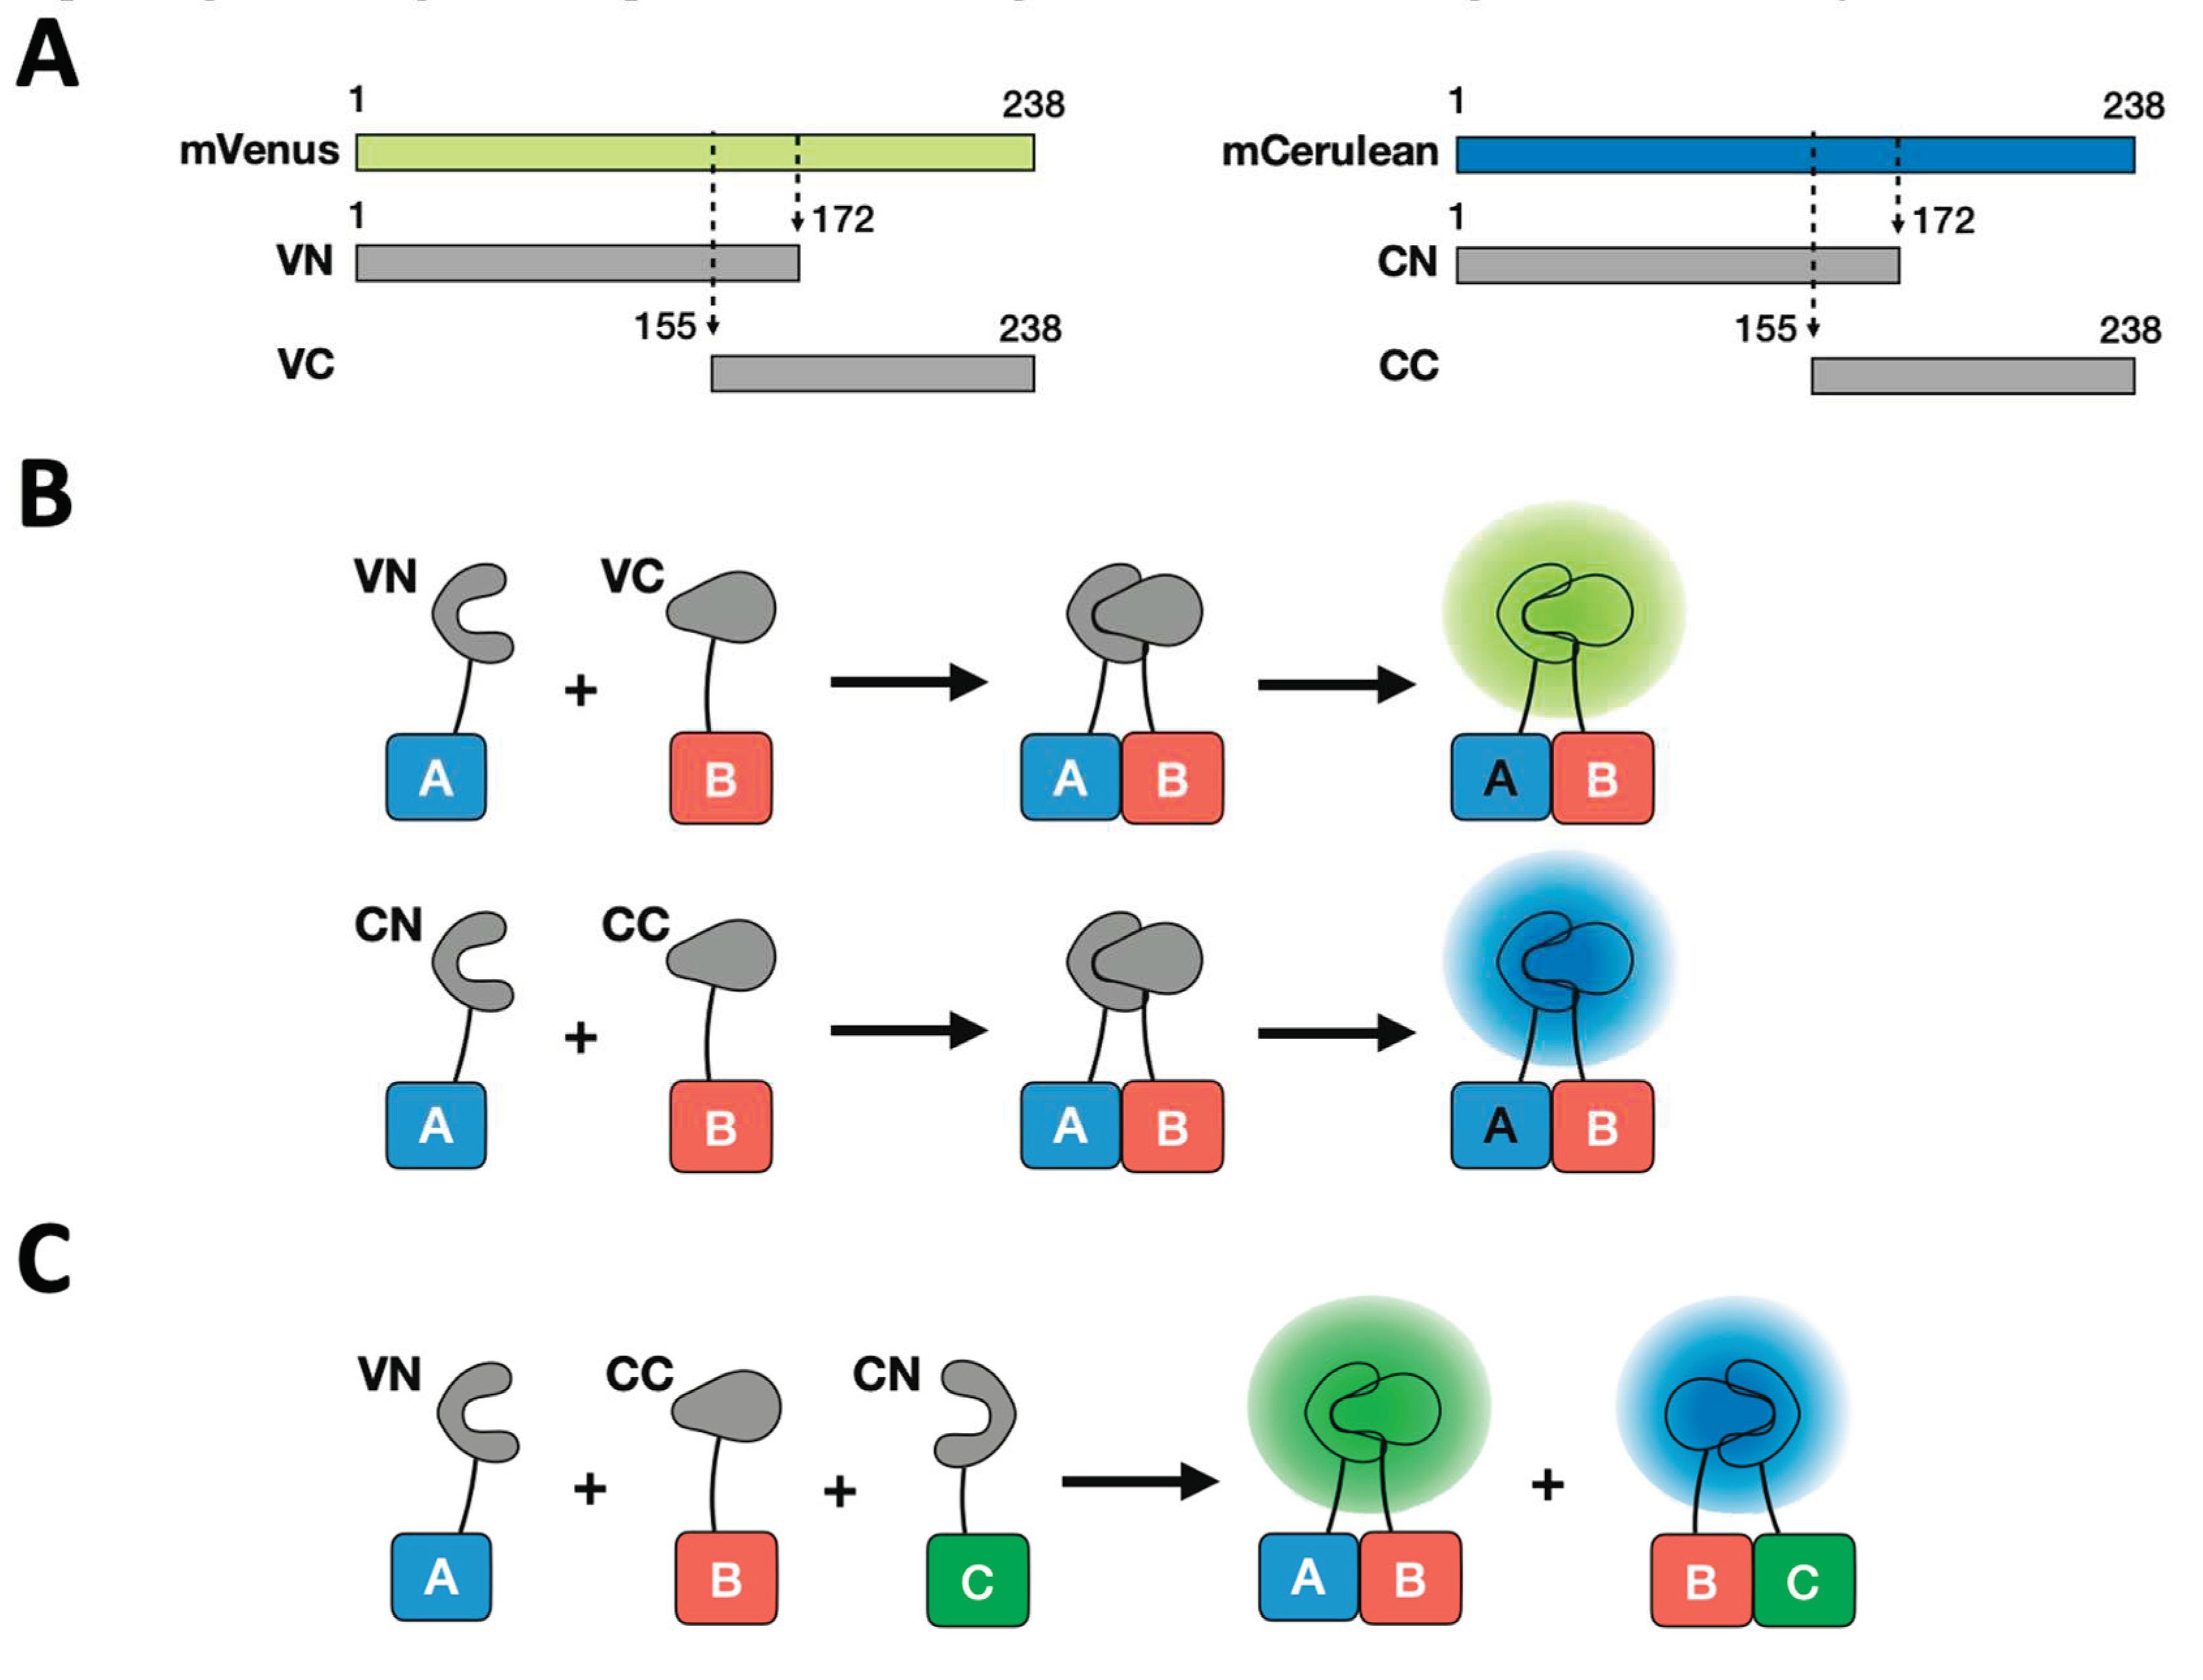
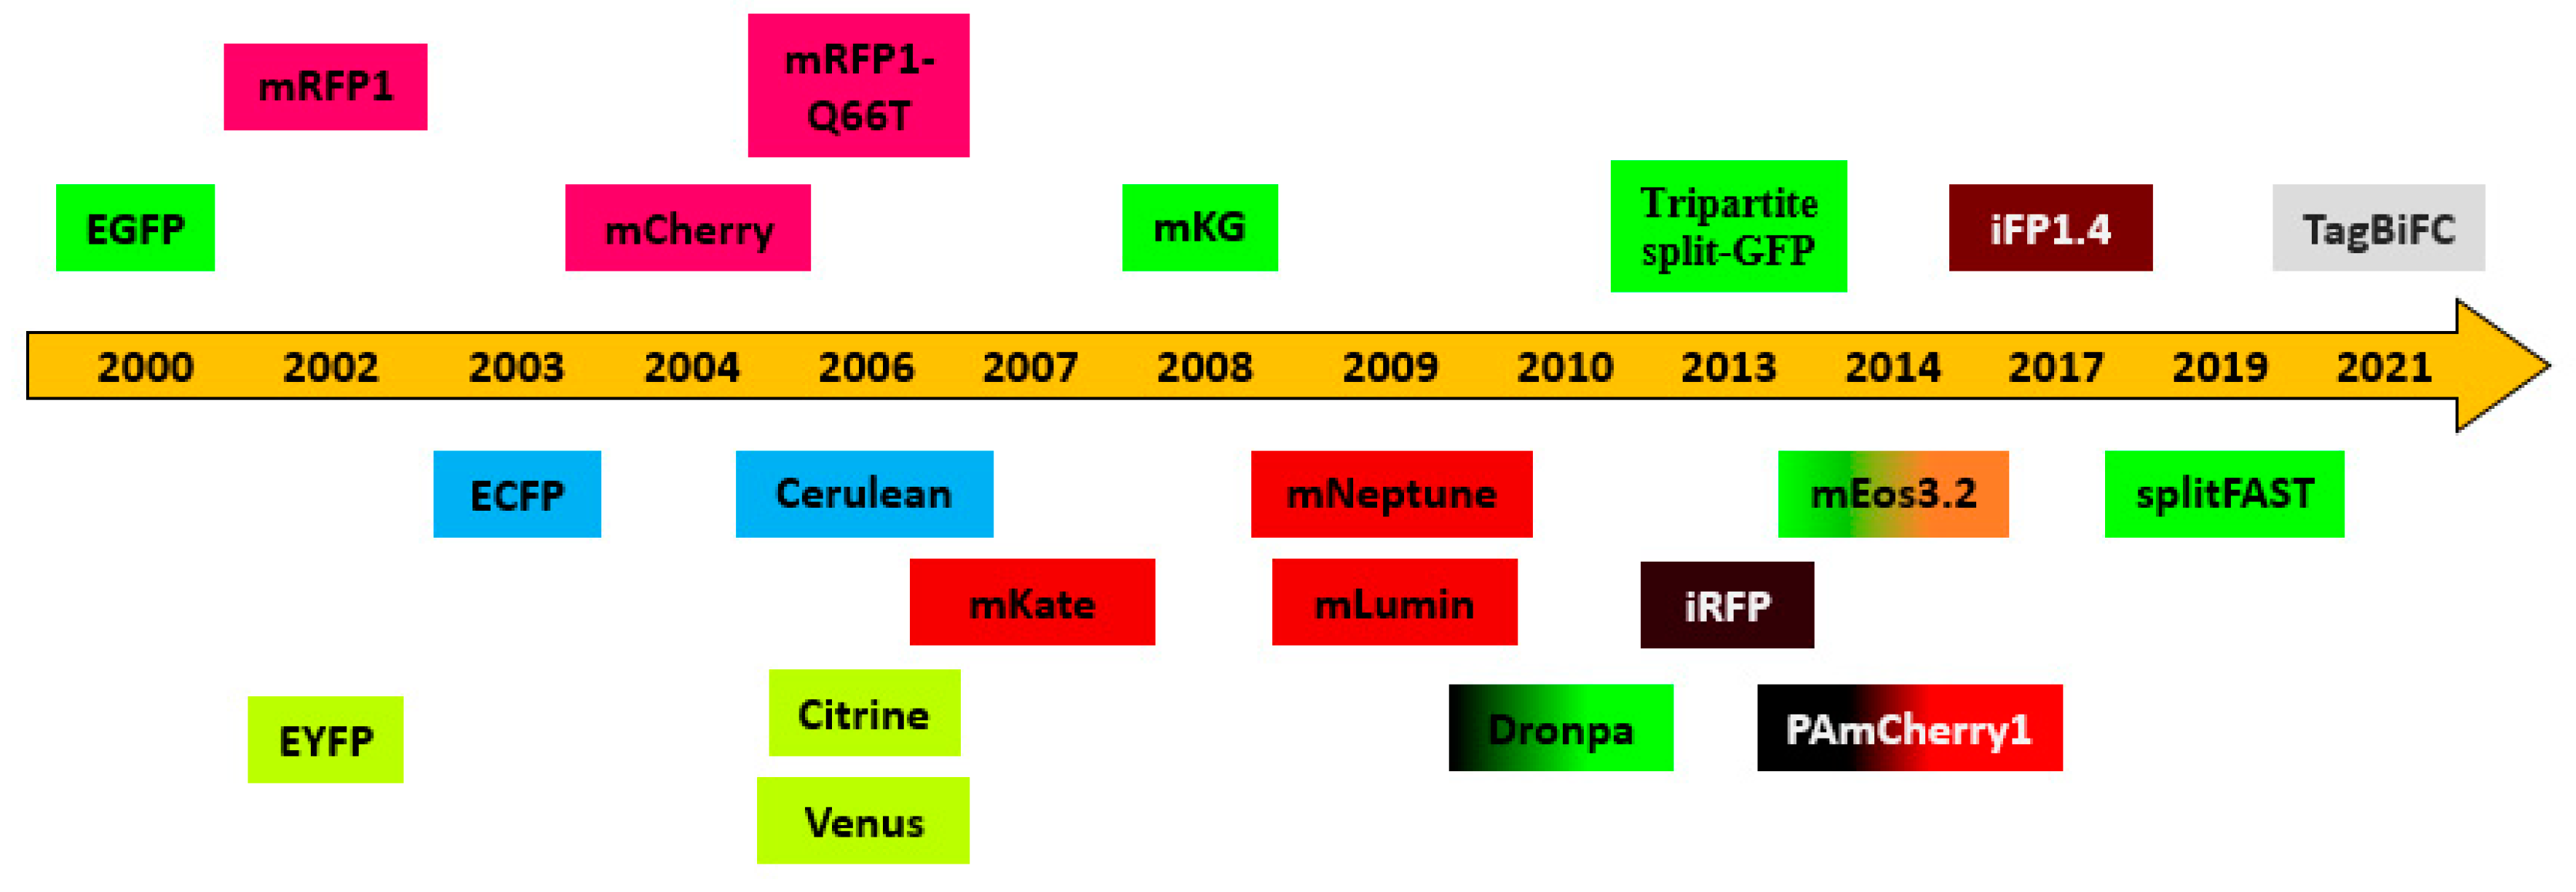
Since 1994, different fluorescent proteins and their variants have been discovered or developed [4,5,6,7]. In the witness of the recent technical progress, many of them have been adopted for BiFC assays (Figure 2).
Figure 1. Principle of BiFC and multicolor BiFC. (A) Diagram of fragments from mVenus [1] fluorescent protein (VN: 1-172aa and VC:155-238aa) and mCerulean [2] (CN: 1-172aa and CC: 155-238aa); (B) The different combination of fragments for BiFC. The protein A and protein B are fused to mVenus fragments (VN and VC) or mCerulean fragments (CN and CC). The interaction between proteins A and B induces the fluorescent protein to be reconstituted, leading to emission of fluorescence upon excitation; (C) For multicolor BiFC, the fusions of A-VN, B-CC and C-CN are constructed. Three-protein interaction are simultaneously visualized by the reconstitution of two different FPs. Reprinted from figure 1 in [3].
Preprints 87525 g001
Figure 2. A timeline of major achievements in BiFC development.
Preprints 87525 g002
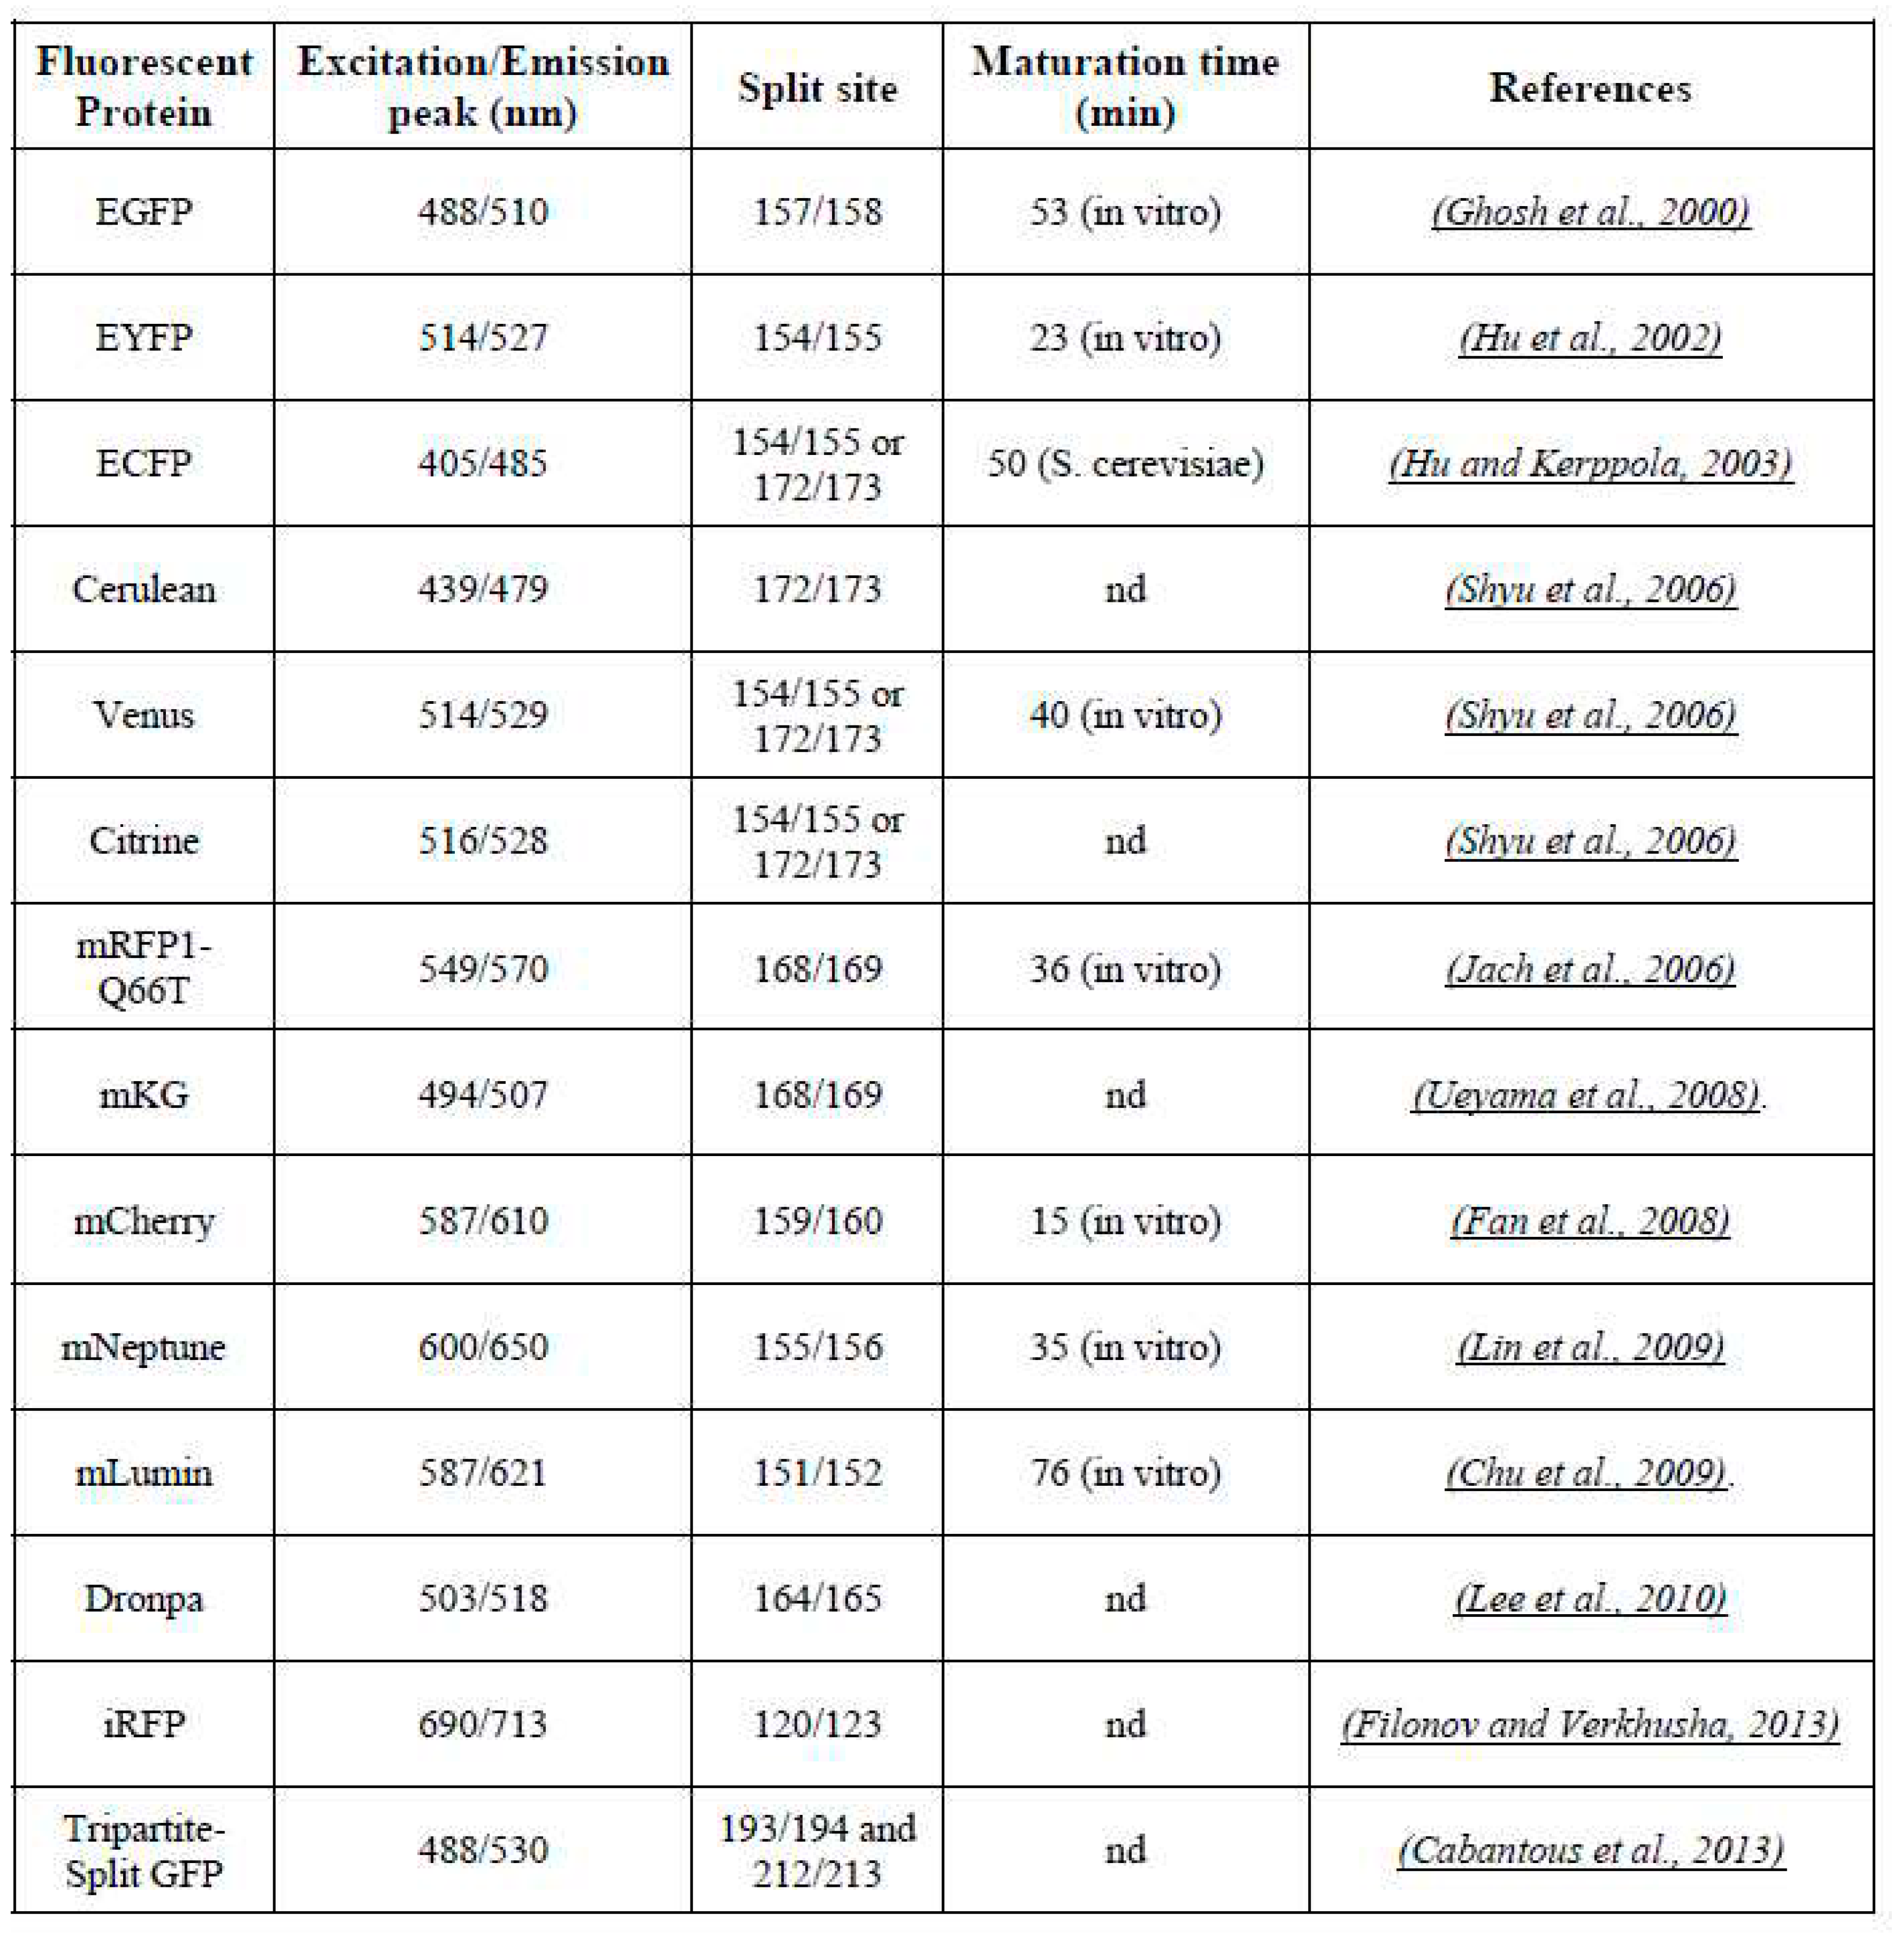
The first application of BiFC can be dated back to the study of Regan and colleagues. Two fragments of GFP (NGFP and CGFP), split in a loop between residues 157 and 158, were fused to antiparallel leucine zippers in Escherichia coli [8]. Subsequently, YFP was successfully reconstituted in mammalian cells using fragmented YFP fused to interacting transcription factors [9]. Since then, the BiFC has been more widely used to visualize the PPIs in biological research, taking advantage of the different characteristics of fluorescent reporter proteins (Table 1).
Following the initial development with GFP, a monomeric Kusabira-Green (mKG) with spectral characteristics similar to GFP has been developed for a BiFC assay [10]. Otherwise, a notable advance in BiFC based on GFP is Tripartite split-GFP [11], in which superfolder GFP was used and will be further described in Section 4.1.
In addition to GFP-based BiFC, the YFP fragments for a BiFC assay were first demonstrated to visualize calcium-dependent PPIs in living cells [12]. Over the past decade, different variants of YFP appeared in succession, such as EYFP (S65G, S72A, T203Y) [9], Citrine ( a PH-resistant YFP variant) [13] and Venus (a rapidly-maturing YFP variant) [13]. A series of efforts have been witnessed on the development of CFP variants in BiFC assays. For example, ECFP split between amino acids 154 and 155 (CN155 and CC155) show fluorescence complementation when fused to bJun and bFos [14]. An improved CFP variant, termed Cerulean (S72A, Y145A and H148D), has also been successfully applied for BiFC assay [13].
In line with sequential application of GFP, YFP and CFP-based BiFC, the red fluorescent protein DsRed [15] would further extend the detection range of BiFC. Continuously, arising from its strong tendency to oligomerize [16], a monomeric RFP, mRFP1, was thus generated [17].As further better performance in BiFC, mRFP1-Q66T was developed with improved fluorescence intensity [18]. The mRFP1-Q66T-based BiFC assay was sensitive enough to catch weak and transient PPIs. Another RFP-based BiFC system is the split mutant monomeric RFP, mCherry, with excitation and emission wavelengths at 587/610 nm [6].
Moreover, the far-red fluorescent proteins are important for imaging deep tissue in animals. To achieve this purpose, a monomeric form of Katushka far-red protein, named mKate [19], was chosen to develop a far-red-based BiFC. This system eventually exhibited high BiFC efficiency in COS-7 cells [20]. Interestingly, the site-mutated mKate-S158A, mLumin, could increase 2-fold the mKate brightness in the same study [20]. Further mutation of mKate is called Neptune, which is the first bright fluorescent protein with an excitation peak reaching 600 nm. The monomeric variant of Neptune, mNeptune [21], has been successfully used for BiFC assays in animal tissues. For whole animal imaging, the near-infrared-based BiFC has been developed in the near past [22]. The near-infrared protein iRFP-based BiFC exhibits high fluorescence intensity and low cytotoxicity and utilizes endogenous concentrations of biliverdin chromophore to acquire fluorescence [23].
Generally, tracking BiFC signals is hindered by repeated capturing. To settle this matter, Dronpa, an artificial GFP-like fluorescent protein cloned from Pectiniidae [24], was used as a BiFC reporter. Dronpa has a reversible photo-switching activity between the fluorescent and non-fluorescent states. The Dronpa-based BiFC was successfully performed in HEK293 cells [25]. It will therefore enable the study of protein complex translocation between various cellular compartments.
Nowadays, the single-molecular PPIs in living cells is coming into focus. Nonetheless, current BiFC is limited by the brightness and photo-stability of fluorescent proteins, resulting in insufficient resolution for single molecule tracking. BiFC coupled with photo-activated localization microscopy (BiFC-PALM) [26,27], largely alleviates this problem, and allows the imaging and tracking of single-molecule PPIs at sub-diffraction resolution in crowded PPI background of living cells, by using split of photo-switchable (mEos3.2) [28] and photo-convertible (PAmCherry1) [29] fluorescent proteins. Likewise, the newly reported TagBiFC [30], which leveraged the split HaloTag system for single-molecule PPI in living cells via super-resolution imaging, provides an alternative approach to tackle this important issue.

2. Advantages of BiFC assay

BiFC is a very sensitive method with minimum background [31], thus it enables direct visualization of PPIs and has been successfully applied in a wide variety of cell types and organisms[32]. Since the inception of PPI study, diverse techniques have been developed, such as FRET, Y2H, and AP-MS. By comparison, BiFC presents several advantages per se over other PPI detection methods.
FRET and BiFC are the two most commonly employed PPI detection methods in cells. Like BiFC, FRET also employs the FPs as reporter signals. It needs energy transfer from an excited donor fluorophore to an acceptor at angstrom distances (10–100Å) [33] and in a permissive orientation. Therefore it is applicable only to analyze bimolecular, direct PPIs [34]. In contrast, BiFC assays may generate positive signals, as long as two tag-fused proteins are present within the same protein complex, including direct and indirect interactions between the two proteins. FRET, moreover, requires confocal image capture of two different FPs, as well as accurate and elaborate computation via time-correlated single-photon counting to predict protein interactions [33].
In an Y2H assay, the system addresses only the qualitative question, yes or no on protein associations. Its experiments drive expression of the target proteins into a rather unnatural context, especially for non-yeast proteins, differing from their native situation. The genetic-manipulated proteins, accordingly, may be misfolded due to the absence of mediating factors. Reciprocally, BiFC conducts context-dependent interaction studies with the native context from which the target proteins derive.
AP-MS method and its variants capture the bait protein complex in the native cellular context, but the weak PPIs will be disrupted by the cell lysis and purification steps [35,36]. Consequently, AP-MS precludes the weak or transient interaction partners from its final candidate list. The proximity-labelling methods, like BioID, have revitalized the detection of transient and low-affinity interactions for the AP-based methods [36]. Nevertheless, paired controls are still necessary to reduce the final false positives [37,38], which would be labor- and time-consuming, as compared to BiFC.
Collectively, these merits make BiFC as one of the most popular methods for the study of PPIs. A whole spectrum of FPs can be used for BiFC analyses, which underpins the multicolor visualization of different protein binding partners at the same time and in the same cell [39]. Throughout the years, BiFC assays have been utilized in high-throughput screens, uncovering novel PPIs in yeast, plant and mammalian cells (see Section 4.2). However, each of these methods has its advantages and limits that make them best suited methods in certain fields. The continuing efforts on BiFC improvement will further extend its application in more extensive circumstances.

3. Critical considerations

Despite these advantages mentioned above, there are some potential problems and critical factors that one should consider when performing BiFC.

3.1. Topology of BiFC-tag fusions

A wrong BiFC-tag orientation could mask the true PPI-based BiFC signals and change the protein localization, as well as inducing abnormal protein expression. Therefore, it is advised to test, firstly, the full-length FP-fused protein in a same vector backbone to the BiFC-vectors [40] , for confirming the target protein localization and expression level. If there is no available localization information, both N- and C-terminal fusion should be made for a subsequent co-localization test. Then choose the one same to the locus of its known interacting protein. When both tag orientations are available, the C-terminal tag fusion is preferable, as it has been reported that N-terminal tag fusion may generate higher background [40]. Once the tag orientation is determined, a corresponding split BiFC-tag will be used to generate final BiFC constructs and test the fluorescence intensity of reconstructed FP.
Another strategy is using the split BiFC-tag to determine optimal positions for the fusions [32]. FP fragments and both terminal ends of each interaction partner will be fused to test for all eight possible combinations (Figure 3). Moreover, the available combinations should go through the protein localization test and expression level comparison, by immunofluorescence or Western blot analysis.

3.2. Linker selection

In general, split BiFC-tags and target proteins are separated by a linker sequence to provide the flexibility of flanking proteins. The linker is crucial for independent motion of the FP fragments and the interaction partners, facilitating FP fragment reconstitution and proper folding of fusion proteins [41]. As a result, different linkers with various lengths have been designed, based on the sequences from natural multi-domain proteins [42]. The most frequently applied linkers in BiFC are composed of non-polar glycine and polar serine amino acids (GS) series, developed by Argos [43]. These flexible GS-based linkers have been widely applied by employing the (GGGGS)n or (GGSGG)n template, where n indicates the GS copy number. For BiFC linkers, empirically, GS-based linkers include about 8-15 amino acids, like DGGSGGS [44], GGGSGGGS [45], or GSSGGGGSGGGGSSG [46]. Sometimes, rigid linkers are also implemented to keep a fixed distance between the domains and to maintain their independent functions, for instance ATGLDLELKASNSAVDGTAGPVAT [32], as well as RSIAT and RPACKIPNDLKQKVMNH linker sequences, which have been used in many fusion constructs for BiFC analysis [9,14]. In addition, researchers have designed many other empirical linkers for some special purposes. Therefore, the linker selection may largely vary on a case-by-case basis.

3.3. Improvement of signal-to-noise ratio

The fluorescence intensity of reconstituted fragments should be comparable to that of independent non-fluorescent fragment self-assembly, which makes the true BiFC bright enough to be distinguished from background signals. This signal ratio between true BIFC and background is the so-called signal-to-noise (S/N) ratio, influenced by three main aspects: property of FPs, split-site, and hydrophobic interactions between split non-fluorescent fragments.
All proteins can be split into non-fluorescent fragments, but that does not mean they can all be used in BiFC; those recommended for BiFC analysis are summarized in Figure 2 and Table 1. To reduce the S/N ratio, the spontaneous self-assembly of split fragments, which is endowed by the inherent property of FPs to a large extent, should be avoided. Against this backdrop, two FPs, EYFP and Venus, have been most extensively used in BiFC [31,40].
Notably, applying different split-sites within same or different FPs shows concomitant variances of S/N ratio. Several studies reported that GFP could be split at different positions, which could lie in a loop between the 6th and 7th, the 7th and 8th, or the 8th and 9th β-strands [47]. Given the structural similarity between GFP and EYFP, fragments of EYFP truncated at residue 155 (designated YN155 and YC155), which are split at a position between the 8th and 9th β-strands, exhibit a relatively high S/N ratio, when used in BiFC [9]. Another split site at residue 173, generating YN173 and YC173, cut in the loop between 7th and 8th β-strands [14]. Similarly, Venus, as a mutated GFP with high fluorescence intensity, can be also truncated at either residue 155 or 173 [13]. A great advantage of Venus-based BiFC is that it avoids a short incubation at 30°C to facilitate fluorophore maturation, which is generally required for split YFP fragments [32]. Moreover, from a split-site screening study, Venus can be split at the loop between the 10th and 11th β-strands, with lower background fluorescence in BiFC application [48]. Compared to previously published sfGFP-based BiFC [49], the Venus-based BiFC assay had the lowest background fluorescence, albeit the same split-site imposed. Prospectively, this differential effect of the same split site might be also linked to the target proteins used in the test.
Decreasing the hydrophobic interactions between split non-fluorescent fragments has been reported to weaken the BiFC background fluorescence, further improving the S/N ratio [50]. In an informative study, Venus was split in two fragments, VN155 and VC155, which were used to test bFos-bJun interaction in the BiFC assay. To test the impact of hydrophobicity in BiFC, four residues L201, L207, V150, and I152 were replaced with other hydrophobic amino acids (L, I, V, and A respectively) by site-directed mutagenesis (Figure 4A). As a result, the V150A mutation increased by 8.6-fold the S/N ratio in the BiFC assay of bFos-bJun interaction, significantly improving the S/N ratio (Figure 4B).

3.4. Controls for BiFC assay

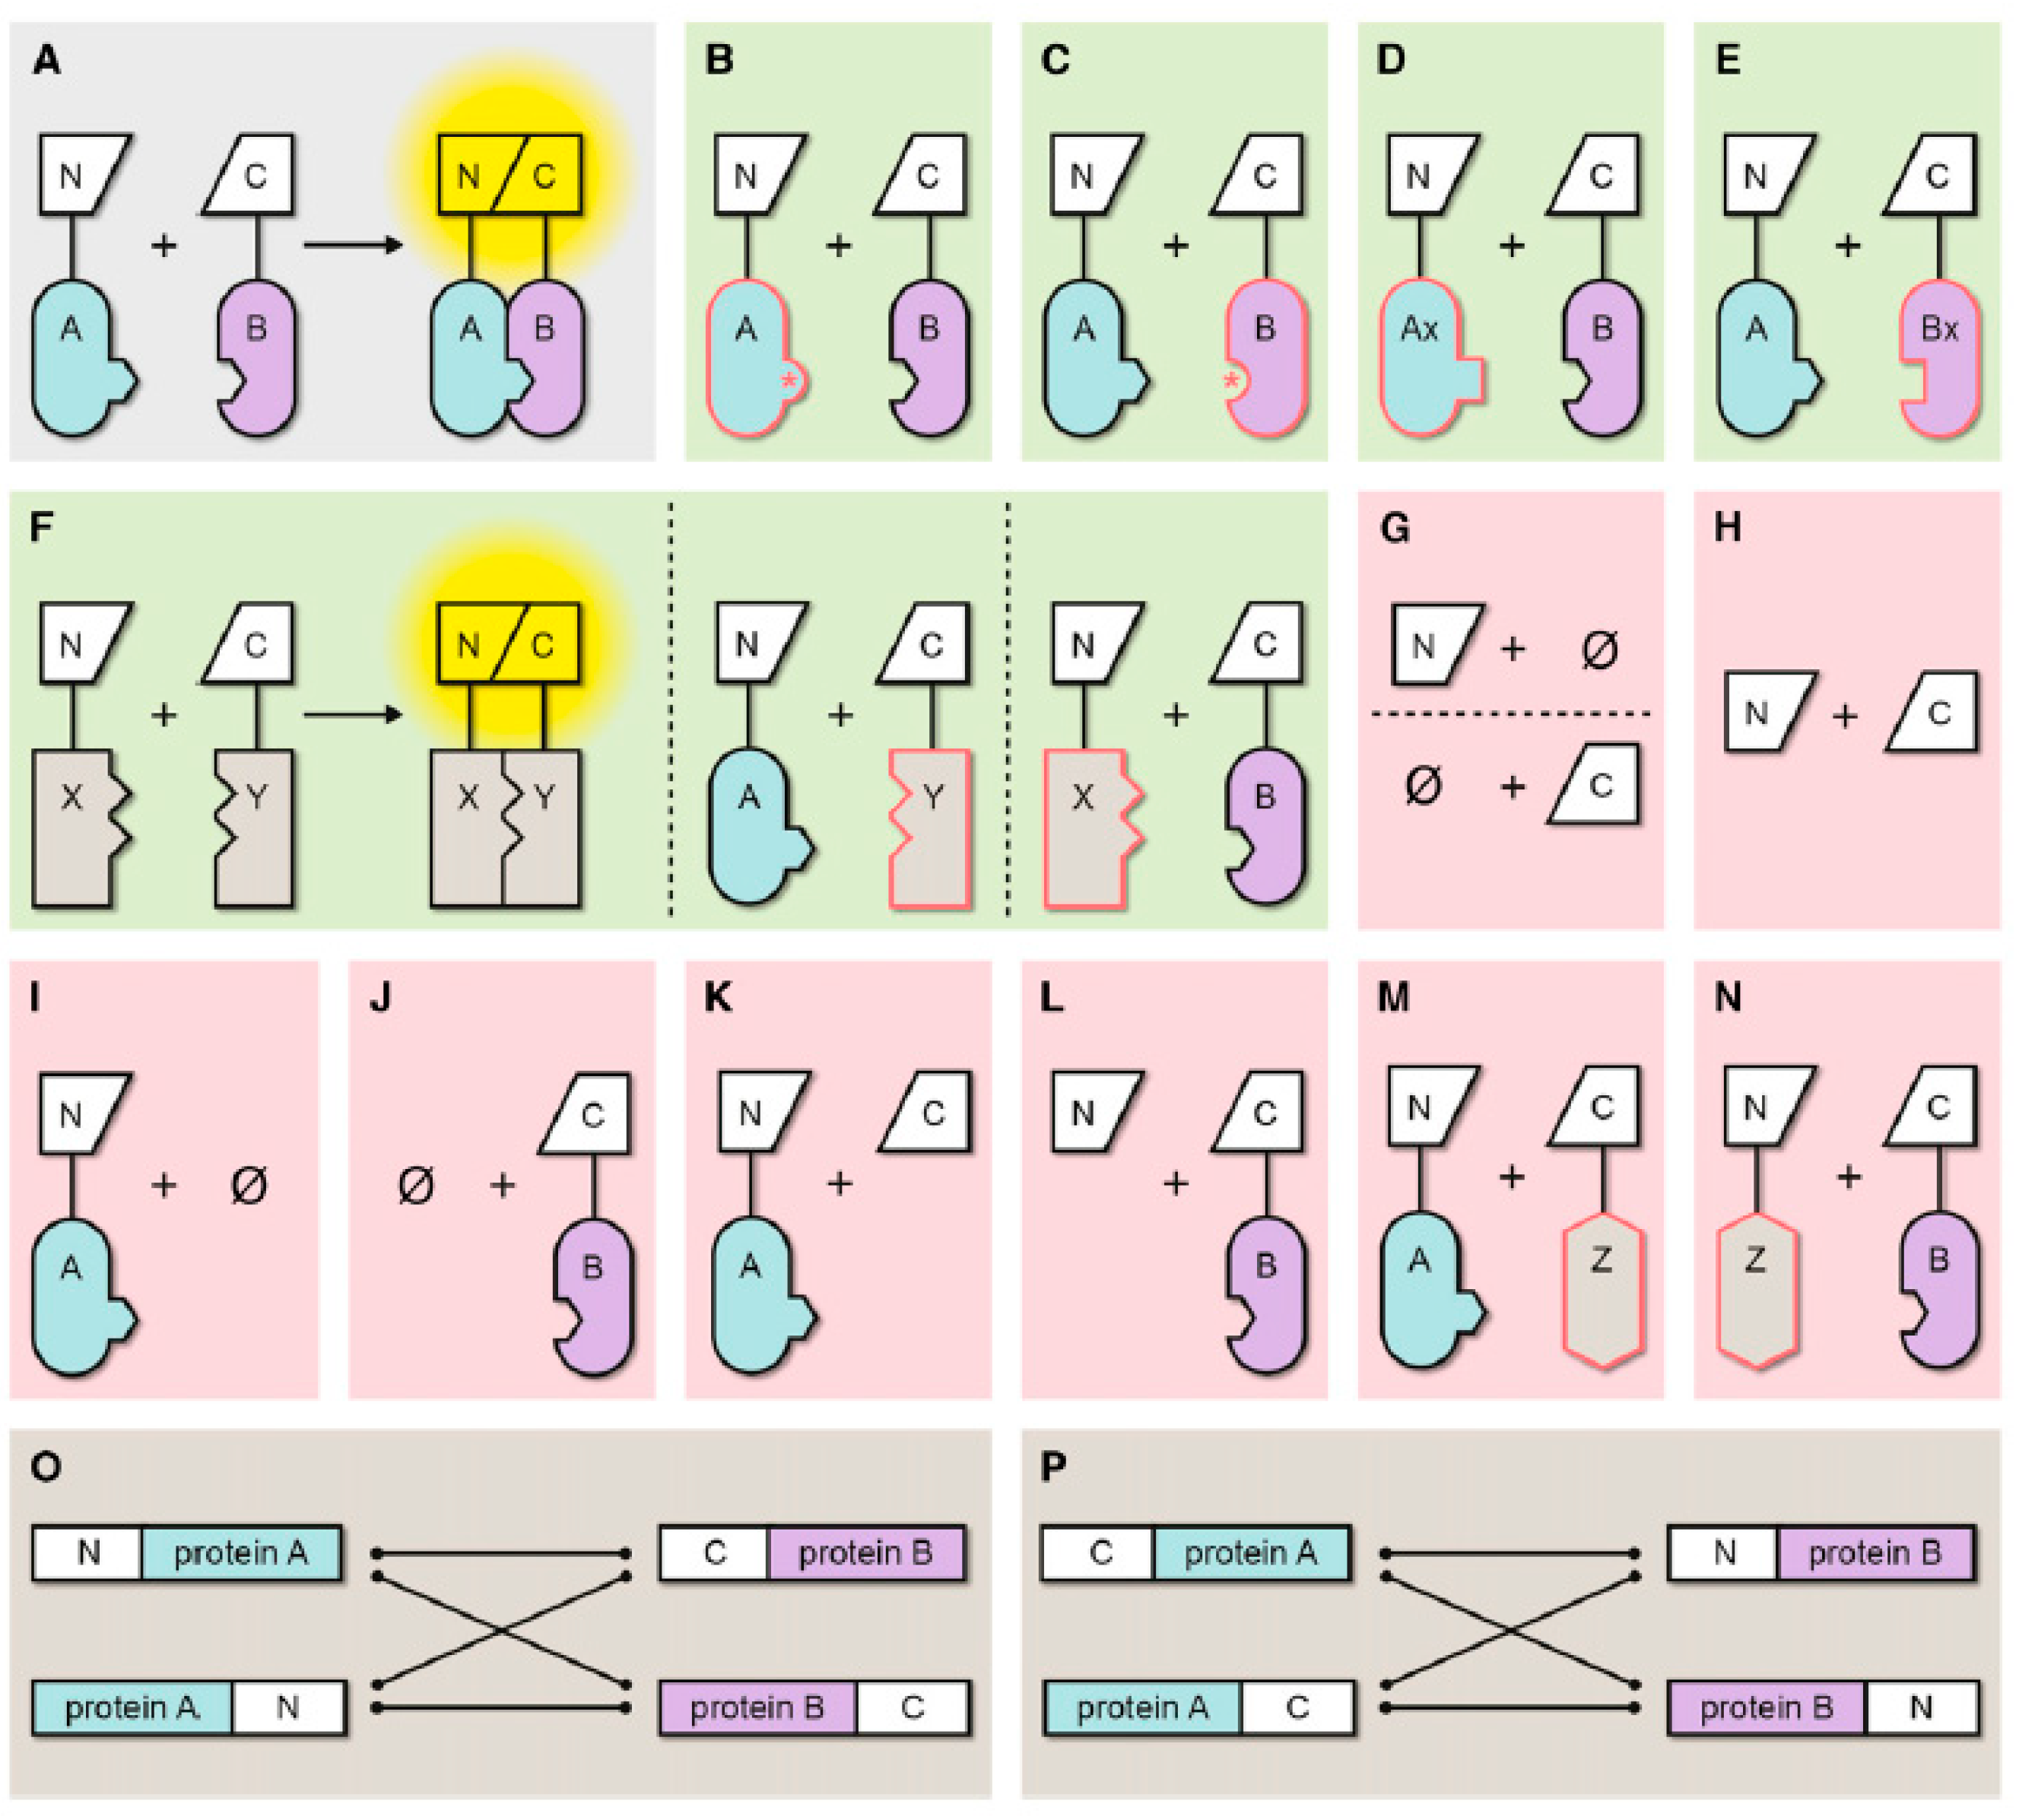
As mentioned previously, the true BiFC fluorescence signals are brought when the two tagged-proteins are interacting with each other and generating a functional FP. Equally, the random collisions of two FP fragments can also occur when they are co-expressed in a limited space of the subcellular compartment. These random encounters can subsequently generate PPI-independent and non-specific signals. Moreover, many BiFC assays, which were routinely implemented by transfection, involve transient overexpression of the candidate proteins. Coupling with the irreversibility of the BiFC, the artificial non-specific signals will be fixed and then measured together with the true PPI-driven fluorescence, contributing to the overall fluorescence signal in the BiFC assay. Accordingly, it is important to design and choose rigorous controls (summarized in Figure 5) for determining this non-specific fluorescence or technical background signal, and faithfully detecting interactions that are truly biologically relevant.
One of the most stringent controls in BiFC assay is the use of a mutant negative control where a single mutation or small deletion is introduced into one of the two interacting proteins (Figure 5B,C). In most cases, nevertheless, it will be challenging to find an appropriate mutated control, due to lack of protein biochemical or structural information, when examining an interaction between two new novel proteins. If so, a very similar protein from the same protein family can be a surrogate negative control (Figure 5D,E). In case this control protein is not available, an unrelated protein can be used as a negative control, when meeting certain conditions. It is desirable that this unrelated control protein co-localizes with the protein of interest in the same subcellular compartment. Moreover, the proof that this unrelated protein can interact with its known interactors using BiFC method, should be reported (Figure 5F). The last negative control assay is, BiFC competition analysis [9]. One of the binding partners is expressed as an untagged protein, which serves as a competitor when coexpressed with the two fusion proteins, to measure the signal difference with original BiFC, validating the true interactions. Retrospectively, a large number of BiFC-based studies have been published with inappropriate controls (Figure 5G–N). For example, the most frequently used controls are combinations of the individual split FP fragments with the complementary split-fragment tagged proteins (Figure 5K,L). In addition, the orientation of protein fusions (Figure 5O,P), should be taken into consideration, when applying BiFC control, to ideally keep the same topology to the tested interaction. Overall, appropriate controls are crucial to validate BiFC data and establish specificity of the observed PPIs.

3.5. Irreversibility of BiFC

The irreversibility of BiFC has been frequently reported [55], as a long-standing limitation. Related to this issue, most fluorescent protein-based BiFC complex formation is irreversible, which largely impedes the analysis of dynamic interactions. Instead, this seeming blemish facilitates the visualization of transient or weak protein-protein interactions [56] and offers a significant advantage for BiFC-based PPI screening [57,58]. Indeed, the reversible BiFC development would expand the BiFC application in monitoring the dynamic PPI, providing one alternative method in this domain. As a response to this need, a reversible BiFC system [59], based on a reconstituted infrared fluorescent protein IFP1.4, has been used to study the spatiotemporal dynamics of protein complexes in yeast and mammalian cells (Figure 6A). Another system named splitFAST [60], which specifically and reversibly binds fluorogenic hydroxybenzylidene rhodanine (HBR) analogs, demonstrated rapid and reversible complementation, allowing the real-time PPI visualization (Figure 6B).
In summary, a good experimental design is a prerequisite for a successful assay. BiFC is a technically straightforward and time-saving PPI detection method. Nonetheless, there are still step-to-step or case-to-case differences in practice. To set up a general standard guide as reference, one protocol was given in [3], which focuses on the visualization of protein interactions in cultured mammalian cells via the BiFC assay, using a true example coupling with published data.

4. Implementation of BiFC

In the last few years, although several other genuine methods have been developed to analyze PPIs, classical methods and their variants are still widely used by scientists, such as the BiFC-based methods.

4.1. Low-throughput BiFC-based applications

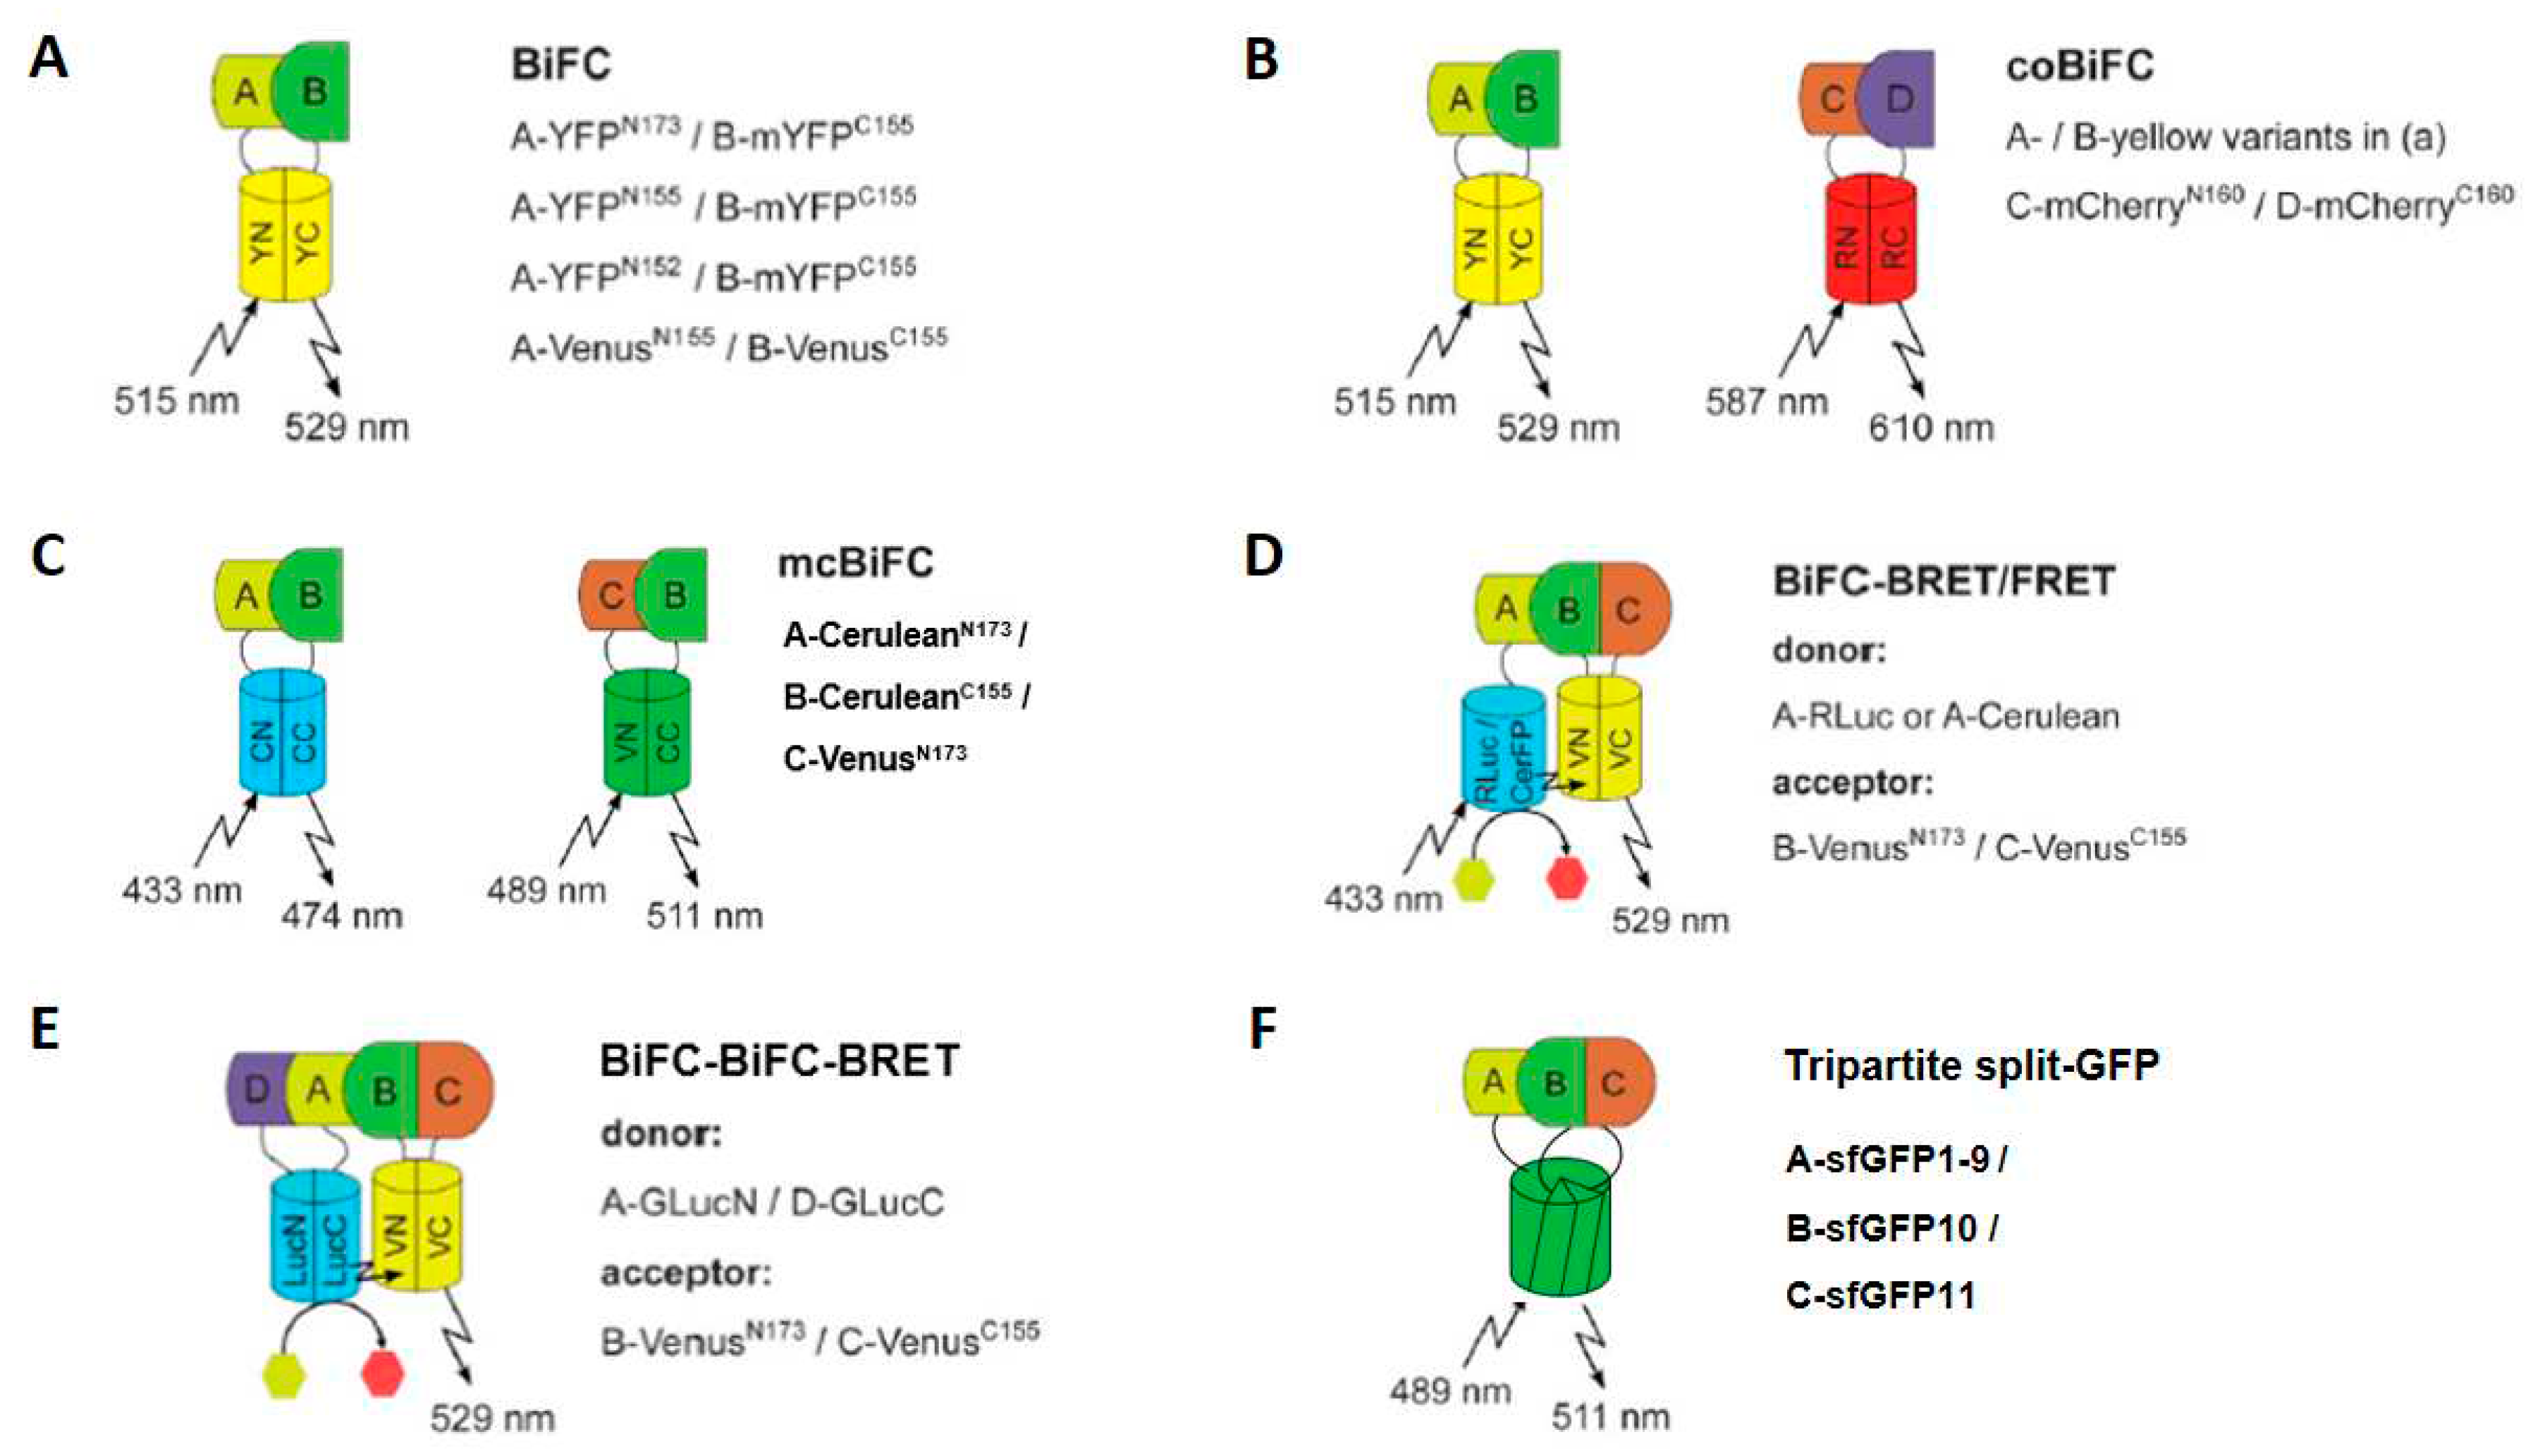
BiFC method has been widely applied to detect binary PPIs in many living systems, as discussed previously, especially EYFP- and Venus-based BiFC assays (Figure 7A). In addition to its generic usage, the use of two distinct FPs with different spectra, such as YFP-based BiFC combined with mCherry-based BiFC, enables the visualization of quaternary protein complex in living cells, or, at least simultaneous visualization of two independent binary PPIs [62]. This double BiFC combined method is designated as coBiFC (Figure 7B).
Besides coBiFC, a lot of attention has been paid on multicolor BiFC, named mcBiFC (Figure 7C), which provides an effective assay to compare the subcellular distributions of protein complexes formed with different binding partners [31]. In several studies, the split-Venus and Cerulean were used to construct the N-terminal part of Cerulean (1-172aa, CeruleanN173) fused Protein A, the C-terminal part of Cerulean (155-238aa, CeruleanC155) fused Protein B, and the N-terminal part of Venus (1-172aa, VenusN173) fused Protein C [63,64,65]. Interaction of proteins A/B produces a Cerulean signal, whereas proteins B/C interaction generates a Venus signal. With imaging via different excitation and emission wavelengths, the mcBiFC allows studying ternary complexes, and investigates the interactions between three different proteins within the same cells. Alternatively, BiFC-based BRET or FRET (Figure 7D), which involves co-expression of two interacting proteins tagged to YFP- or Venus fragments with one interacting protein tagged to Renilla reniformis luciferase (RLuc) or Cerulean, can be also used for the analyses of ternary protein complexes [66,67]. To take a step further, theoretically, the luciferase can still be split for BiLC assay, enabling a secondary binary PPI detection. By combination of BiLC and BiFC-based BRET (Figure 7E), reconstituted Gaussia princeps luciferase (GLuc) was used for BRET on reconstituted Venus and enabled analyses of quaternary protein complex [68].
Moreover, the applications of sfGFP have to be mentioned here. Since the discovery of its third split site [69], tripartite split-sfGFP have been reported in studies of both binary and ternary PPI analyses. sfGFP was split into three parts: sfGFP1-9, sfGFP10, and sfGFP11. Each part can be fused to one of the target proteins. The reconstitution of the FP requires all three parts to be brought into proximity, and then demonstrating a ternary PPIs (Figure 7F) [70,71]. When binary PPIs is needed, only two twenty amino-acids long GFP tags, GFP10 and GFP11, are fused to interacting protein partners, and coexpressed the GFP1-9 fragment as complementary BiFC tag to finally fulfill the GFP-based BiFC investigation [11]. In addition to detecting PPIs, split-sfGFPs (sfGFP1–10 and sfGFP11) were also used for self-assembly, allowing visualization of single protein localization and imaging [72].

4.2. Large-scale applications of BiFC

A large number of high-throughout studies have been performed for scrutinizing complex protein interactomes in diverse organisms, thanks to current advances in various technologies, including that of BiFC-based screening method.
Since its invention in 2000, upon advantages of simplicity and low-cost, BiFC has become a widely used approach for PPI detections, and thereby suitable for large-scale screens. Indeed, several efforts have been witnessed over the past decade, coupling with the availability of nearly complete hORFeome collections [73,74,75,76], which enables prospecting PPIs at unparalleled scale in two different formats, arrayed or pooled BiFC screens. To date, large-scale screens using BiFC assays have been reported in yeast, plant and mammalian cells (Table 2).
The facile genetic manipulation on yeast is one of main advantages for BiFC assay. As the first effort on genome-wide screen, Sung et al. initially developed BiFC-tagged fusion plasmids, which allow expression of tagged target proteins in S. cerevisiae [77]. Subsequently, the construction of a S. cerevisiae fusion library expressing each ORF fused with the N-terminal fragment of Venus (VN) was achieved by Huh lab [78]. To perform a genome-wide BiFC screen for the SUMO interactome, 5,911 VN-tagged fusion (≈95% known yeast proteins) strains were mated with the strain expressing VC-tagged Smt3. Finally, 367 out of 5911 ORFs were identified as Smt3-interacting candidates, by fluorescence microscopy in arrayed format. Similarly, these BiFC-based screenings were also applied to interrogate ABC (ATP-binding cassette) transporter and TORC1 interactomes in yeast [79,80].
In the plant, a different BiFC-tagged ORF delivery system was used in a study of core cell cycle protein interactions [81]. The GFP-fragment fused constructs were transiently co-expressed in leaf epidermal cells of tobacco by A. tumefaciens-mediated leaf infiltration. Then the high-throughput BiFC assays were performed to test a total of 917 PPIs for 58 cell cycle-related proteins. As result, 341 PPIs were identified as BiFC-positive. In another BiFC-based screen, an Arabidopsis cDNA library comprising ~2×10⁵ cDNAs was fused to C-terminal fragment of YFP (CYFP) for PPIs screening of subsets of NYFP-fused baits in Arabidopsis leaf protoplasts [82]. This screen identified single cDNA clones encoding proteins that interact with bait proteins, VirE2 and VirD2, by co-transfection manner in an arrayed format.
Different from the large-scale screen by BiFC with fluorescence microscopy in yeast and plant, many BiFC screens in the mammalian cells were coupled with fluorescence-activated cell sorting (FACS). For instance, one split GFP-based BiFC system was designed to identify proteins interacting with protein kinase B (PKB), in which the BiFC-positive cells were collected by FACS [83]. In this study, C-terminal fragment of GFP (CGFP) was fused to bait PKB, proceeding a large-scale screen with a human cDNA library that expressed NGFP fusions in COS-1 cells, by pooled cotransfection. The resulting DNA, including genome DNA and ORF-containing plasmids, was extracted from BiFC-positive cells, followed by bacterial transformation, and then the single colony derived plasmids were retransfected in COS-1 cells, to perform the second BiFC for removal of false positive candidates. However, usage of the pooled DNA transfection greatly simplified the screening process compared to the one-by-one arrayed format, albeit further improvement is needed. Moreover, application of viral BiFC vectors allows efficient BiFC-based analysis in mammalian cells. Adenoviral BiFC vectors have been generated based on adenovirus high-throughput system and have been used to monitor G protein-coupled receptor (GPCR) activation in human cells by an adenovirus-based β-arrestin BiFC assay [84]. In parallel, a retrovirus-based protein-fragment complementation assay, termed RePCA, was developed to identify protein–protein interactions in mammalian cells [57]. In this study, a host cell line was made for stably expressing the N-terminal fragment of Venus (VN) fused protein AKT1. The screen was executed by infecting this stable bait cell line with prey VN-fusion lentivirus, following single fluorescent cell sorting by FACS. Large-scale screens by BiFC may also facilitate drug discovery. As published, mKG-based BiFC was used to screen for PPI inhibitors in a natural product library based on a cell-free system [85], which provided a deeper understanding of potential drug actions, therefore demonstrating great potential for high-throughput BiFC screening in drug discovery.
Taken together, recent application of BiFC in large-scale studies has demonstrated its potential for uncovering protein interactomes in live cells. In particular, BiFC-tagged cDNA or ORFeome-based cell libraries have allowed BiFC assays to be more widely applied in high-throughput studies. Upon the well-developed genome-wide screens, such as pooled overexpression screen, and drop-out screens (e.g. RNAi/shRNA screen or CRISPR-Cas9 screen), the arrayed large-scale BiFC screens are more popularly used, relying on combining multiple individual BiFCs in a microplate rather than a pooled format. Though, in few studies, pooled transfection or infection was used in BiFC screen, which is far away from one-gene-one-cell output, the current next-generation sequencing (NGS) is hardly implemented during the deconvolution step. This to-be-improved pooled screening to some degree impaired its original intention. Whereas continuous efforts have paved the future for a versatile and easy-taking BiFC-based screening, there is a long way to realize a rigorous quantification-based pooled method.

References

  1. Nagai, T.; Ibata, K.; Park, E.S.; Kubota, M.; Mikoshiba, K.; Miyawaki, A. A variant of yellow fluorescent protein with fast and efficient maturation for cell-biological applications. Nat. Biotechnol. 2002, 20, 87–90. [Google Scholar] [CrossRef]
  2. Rizzo, M.A.; Springer, G.H.; Granada, B.; Piston, D.W. An improved cyan fluorescent protein variant useful for FRET. Nat. Biotechnol. 2004, 22, 445–449. [Google Scholar] [CrossRef]
  3. Jia, Y.; Bleicher, F.; Reboulet, J.; Merabet, S. Bimolecular Fluorescence Complementation (BiFC) and Multiplexed Imaging of Protein-Protein Interactions in Human Living Cells. Methods Mol Biol 2021, 2350, 173–190. [Google Scholar] [CrossRef] [PubMed]
  4. Chudakov, D.M.; Matz, M.V.; Lukyanov, S.; Lukyanov, K.A. Fluorescent Proteins and Their Applications in Imaging Living Cells and Tissues. Physiological Reviews 2010, 90, 1103–1163. [Google Scholar] [CrossRef] [PubMed]
  5. Heim, R.; Prasher, D.C.; Tsien, R.Y. Wavelength mutations and posttranslational autoxidation of green fluorescent protein. PNAS 1994, 91, 12501–12504. [Google Scholar] [CrossRef]
  6. Shaner, N.C.; Campbell, R.E.; Steinbach, P.A.; Giepmans, B.N.G.; Palmer, A.E.; Tsien, R.Y. Improved monomeric red, orange and yellow fluorescent proteins derived from Discosoma sp. red fluorescent protein. Nat. Biotechnol. 2004, 22, 1567–1572. [Google Scholar] [CrossRef]
  7. Stepanenko, O.V.; Stepanenko, O.V.; Shcherbakova, D.M.; Kuznetsova, I.M.; Turoverov, K.K.; Verkhusha, V.V. Modern fluorescent proteins: from chromophore formation to novel intracellular applications. BioTechniques 2011, 51, 313–327. [Google Scholar] [CrossRef]
  8. Ghosh, I.; Hamilton, A.D.; Regan, L. Antiparallel Leucine Zipper-Directed Protein Reassembly:  Application to the Green Fluorescent Protein. J. Am. Chem. Soc. 2000, 122, 5658–5659. [Google Scholar] [CrossRef]
  9. Hu, C.-D.; Chinenov, Y.; Kerppola, T.K. Visualization of Interactions among bZIP and Rel Family Proteins in Living Cells Using Bimolecular Fluorescence Complementation. Molecular Cell 2002, 9, 789–798. [Google Scholar] [CrossRef]
  10. Ueyama, T.; Kusakabe, T.; Karasawa, S.; Kawasaki, T.; Shimizu, A.; Son, J.; Leto, T.L.; Miyawaki, A.; Saito, N. Sequential Binding of Cytosolic Phox Complex to Phagosomes through Regulated Adaptor Proteins: Evaluation Using the Novel Monomeric Kusabira-Green System and Live Imaging of Phagocytosis. The Journal of Immunology 2008, 181, 629–640. [Google Scholar] [CrossRef]
  11. Cabantous, S.; Nguyen, H.B.; Pedelacq, J.-D.; Koraïchi, F.; Chaudhary, A.; Ganguly, K.; Lockard, M.A.; Favre, G.; Terwilliger, T.C.; Waldo, G.S. A New Protein-Protein Interaction Sensor Based on Tripartite Split-GFP Association. Scientific Reports 2013, 3. [Google Scholar] [CrossRef] [PubMed]
  12. Nagai, T.; Sawano, A.; Park, E.S.; Miyawaki, A. Circularly permuted green fluorescent proteins engineered to sense Ca2+. PNAS 2001, 98, 3197–3202. [Google Scholar] [CrossRef] [PubMed]
  13. Shyu, Y.J.; Liu, H.; Deng, X.; Hu, C.-D. Identification of new fluorescent protein fragments for bimolecular fluorescence complementation analysis under physiological conditions. BioTechniques 2006, 40, 61–66. [Google Scholar] [CrossRef] [PubMed]
  14. Hu, C.-D.; Kerppola, T.K. Simultaneous visualization of multiple protein interactions in living cells using multicolor fluorescence complementation analysis. Nature Biotechnology 2003, 21, 539–545. [Google Scholar] [CrossRef]
  15. Matz, M.V.; Fradkov, A.F.; Labas, Y.A.; Savitsky, A.P.; Zaraisky, A.G.; Markelov, M.L.; Lukyanov, S.A. Fluorescent proteins from nonbioluminescent Anthozoa species. Nature Biotechnology 1999, 17, 969–973. [Google Scholar] [CrossRef]
  16. Baird, G.S.; Zacharias, D.A.; Tsien, R.Y. Biochemistry, mutagenesis, and oligomerization of DsRed, a red fluorescent protein from coral. PNAS 2000, 97, 11984–11989. [Google Scholar] [CrossRef]
  17. Campbell, R.E.; Tour, O.; Palmer, A.E.; Steinbach, P.A.; Baird, G.S.; Zacharias, D.A.; Tsien, R.Y. A monomeric red fluorescent protein. PNAS 2002, 99, 7877–7882. [Google Scholar] [CrossRef]
  18. Jach, G.; Pesch, M.; Richter, K.; Frings, S.; Uhrig, J.F. An improved mRFP1 adds red to bimolecular fluorescence complementation. Nature Methods 2006, 3, 597–600. [Google Scholar] [CrossRef]
  19. Shcherbo, D.; Merzlyak, E.M.; Chepurnykh, T.V.; Fradkov, A.F.; Ermakova, G.V.; Solovieva, E.A.; Lukyanov, K.A.; Bogdanova, E.A.; Zaraisky, A.G.; Lukyanov, S.; et al. Bright far-red fluorescent protein for whole-body imaging. Nature Methods 2007, 4, 741–746. [Google Scholar] [CrossRef]
  20. Chu, J.; Zhang, Z.; Zheng, Y.; Yang, J.; Qin, L.; Lu, J.; Huang, Z.-L.; Zeng, S.; Luo, Q. A novel far-red bimolecular fluorescence complementation system that allows for efficient visualization of protein interactions under physiological conditions. Biosensors and Bioelectronics 2009, 25, 234–239. [Google Scholar] [CrossRef]
  21. Lin, M.Z.; McKeown, M.R.; Ng, H.-L.; Aguilera, T.A.; Shaner, N.C.; Campbell, R.E.; Adams, S.R.; Gross, L.A.; Ma, W.; Alber, T.; et al. Autofluorescent Proteins with Excitation in the Optical Window for Intravital Imaging in Mammals. Chemistry & Biology 2009, 16, 1169–1179. [Google Scholar] [CrossRef]
  22. Filonov, G.S.; Verkhusha, V.V. A Near-Infrared BiFC Reporter for In Vivo Imaging of Protein-Protein Interactions. Chemistry & Biology 2013, 20, 1078–1086. [Google Scholar] [CrossRef]
  23. Filonov, G.S.; Piatkevich, K.D.; Ting, L.-M.; Zhang, J.; Kim, K.; Verkhusha, V.V. Bright and stable near-infrared fluorescent protein for in vivo imaging. Nature Biotechnology 2011, 29, 757–761. [Google Scholar] [CrossRef]
  24. Ando, R.; Mizuno, H.; Miyawaki, A. Regulated Fast Nucleocytoplasmic Shuttling Observed by Reversible Protein Highlighting. Science 2004, 306, 1370–1373. [Google Scholar] [CrossRef]
  25. Lee, Y.R.; Park, J.-H.; Hahm, S.-H.; Kang, L.-W.; Chung, J.H.; Nam, K.-H.; Hwang, K.Y.; Kwon, I.C.; Han, Y.S. Development of Bimolecular Fluorescence Complementation Using Dronpa for Visualization of Protein–Protein Interactions in Cells. Mol Imaging Biol 2010, 12, 468–478. [Google Scholar] [CrossRef] [PubMed]
  26. Betzig, E.; Patterson, G.H.; Sougrat, R.; Lindwasser, O.W.; Olenych, S.; Bonifacino, J.S.; Davidson, M.W.; Lippincott-Schwartz, J.; Hess, H.F. Imaging Intracellular Fluorescent Proteins at Nanometer Resolution. Science 2006, 313, 1642–1645. [Google Scholar] [CrossRef] [PubMed]
  27. Hess, S.T.; Girirajan, T.P.K.; Mason, M.D. Ultra-High Resolution Imaging by Fluorescence Photoactivation Localization Microscopy. Biophys J 2006, 91, 4258–4272. [Google Scholar] [CrossRef] [PubMed]
  28. Liu, Z.; Xing, D.; Su, Q.P.; Zhu, Y.; Zhang, J.; Kong, X.; Xue, B.; Wang, S.; Sun, H.; Tao, Y.; et al. Super-resolution imaging and tracking of protein–protein interactions in sub-diffraction cellular space. Nature Communications 2014, 5, 4443. [Google Scholar] [CrossRef] [PubMed]
  29. Nickerson, A.; Huang, T.; Lin, L.-J.; Nan, X. Photoactivated Localization Microscopy with Bimolecular Fluorescence Complementation (BiFC-PALM) for Nanoscale Imaging of Protein-Protein Interactions in Cells. PLOS ONE 2014, 9, e100589. [Google Scholar] [CrossRef] [PubMed]
  30. Shao, S.; Zhang, H.; Zeng, Y.; Li, Y.; Sun, C.; Sun, Y. TagBiFC technique allows long-term single-molecule tracking of protein-protein interactions in living cells. Communications Biology 2021, 4, 1–14. [Google Scholar] [CrossRef] [PubMed]
  31. Kerppola, T.K. BIMOLECULAR FLUORESCENCE COMPLEMENTATION (BiFC) ANALYSIS AS A PROBE OF PROTEIN INTERACTIONS IN LIVING CELLS. Annu Rev Biophys 2008, 37, 465–487. [Google Scholar] [CrossRef]
  32. Kerppola, T.K. Design and implementation of bimolecular fluorescence complementation (BiFC) assays for the visualization of protein interactions in living cells. Nature Protocols 2006, 1, 1278–1286. [Google Scholar] [CrossRef]
  33. Sekar, R.B.; Periasamy, A. Fluorescence resonance energy transfer (FRET) microscopy imaging of live cell protein localizations. Journal of Cell Biology 2003, 160, 629–633. [Google Scholar] [CrossRef]
  34. Sun, Y.; Rombola, C.; Jyothikumar, V.; Periasamy, A. Förster resonance energy transfer microscopy and spectroscopy for localizing protein–protein interactions in living cells. Cytometry Part A 2013, 83, 780–793. [Google Scholar] [CrossRef]
  35. Miteva, Y.V.; Budayeva, H.G.; Cristea, I.M. Proteomics-Based Methods for Discovery, Quantification, and Validation of Protein–Protein Interactions. Anal. Chem. 2013, 85, 749–768. [Google Scholar] [CrossRef]
  36. Roux, K.J.; Kim, D.I.; Raida, M.; Burke, B. A promiscuous biotin ligase fusion protein identifies proximal and interacting proteins in mammalian cells. J Cell Biol 2012, 196, 801–810. [Google Scholar] [CrossRef] [PubMed]
  37. Gingras, A.-C.; Abe, K.T.; Raught, B. Getting to know the neighborhood: using proximity-dependent biotinylation to characterize protein complexes and map organelles. Current Opinion in Chemical Biology 2019, 48, 44–54. [Google Scholar] [CrossRef] [PubMed]
  38. Varnaitė, R.; MacNeill, S.A. Meet the neighbors: Mapping local protein interactomes by proximity-dependent labeling with BioID. Proteomics 2016, 16, 2503–2518. [Google Scholar] [CrossRef] [PubMed]
  39. Kerppola, T.K. Multicolor Bimolecular Fluorescence Complementation (BiFC) Analysis of Protein Interactions with Alternative Partners. Cold Spring Harb Protoc 2013, 2013, pdb–top077164. [Google Scholar] [CrossRef] [PubMed]
  40. Waadt, R.; Schlücking, K.; Schroeder, J.I.; Kudla, J. Protein fragment bimolecular fluorescence complementation analyses for the in vivo study of protein-protein interactions and cellular protein complex localizations. Methods Mol Biol 2014, 1062, 629–658. [Google Scholar] [CrossRef] [PubMed]
  41. Wouters, E.; Vasudevan, L.; Crans, R.A.J.; Saini, D.K.; Stove, C.P. Luminescence- and Fluorescence-Based Complementation Assays to Screen for GPCR Oligomerization: Current State of the Art. Int J Mol Sci 2019, 20. [Google Scholar] [CrossRef]
  42. Gokhale, R.S.; Khosla, C. Role of linkers in communication between protein modules. Current Opinion in Chemical Biology 2000, 4, 22–27. [Google Scholar] [CrossRef]
  43. Argos, P. An investigation of oligopeptides linking domains in protein tertiary structures and possible candidates for general gene fusion. Journal of Molecular Biology 1990, 211, 943–958. [Google Scholar] [CrossRef]
  44. Carayon, K.; Moulédous, L.; Combedazou, A.; Mazères, S.; Haanappel, E.; Salomé, L.; Mollereau, C. Heterologous Regulation of Mu-Opioid (MOP) Receptor Mobility in the Membrane of SH-SY5Y Cells *. Journal of Biological Chemistry 2014, 289, 28697–28706. [Google Scholar] [CrossRef]
  45. Armando, S.; Quoyer, J.; Lukashova, V.; Maiga, A.; Percherancier, Y.; Heveker, N.; Pin, J.-P.; Prézeau, L.; Bouvier, M. The chemokine CXC4 and CC2 receptors form homo- and heterooligomers that can engage their signaling G-protein effectors and βarrestin. The FASEB Journal 2014, 28, 4509–4523. [Google Scholar] [CrossRef] [PubMed]
  46. Cannaert, A.; Storme, J.; Franz, F.; Auwärter, V.; Stove, C.P. Detection and Activity Profiling of Synthetic Cannabinoids and Their Metabolites with a Newly Developed Bioassay. Anal. Chem. 2016, 88, 11476–11485. [Google Scholar] [CrossRef] [PubMed]
  47. Baird, G.S.; Zacharias, D.A.; Tsien, R.Y. Circular permutation and receptor insertion within green fluorescent proteins. Proc Natl Acad Sci U S A 1999, 96, 11241–11246. [Google Scholar] [CrossRef] [PubMed]
  48. Ohashi, K.; Kiuchi, T.; Shoji, K.; Sampei, K.; Mizuno, K. Visualization of cofilin-actin and Ras-Raf interactions by bimolecular fluorescence complementation assays using a new pair of split Venus fragments. BioTechniques 2012, 52, 45–50. [Google Scholar] [CrossRef]
  49. Zhou, J.; Lin, J.; Zhou, C.; Deng, X.; Xia, B. An improved bimolecular fluorescence complementation tool based on superfolder green fluorescent protein. Acta Biochimica et Biophysica Sinica 2011, 43, 239–244. [Google Scholar] [CrossRef]
  50. Nakagawa, C.; INAHATA, K.; NISHIMURA, S.; SUGIMOTO, K. Improvement of a Venus-Based Bimolecular Fluorescence Complementation Assay to Visualize bFos-bJun Interaction in Living Cells. Bioscience, Biotechnology, and Biochemistry 2011, 75, 1399–1401. [Google Scholar] [CrossRef]
  51. Kodama, Y.; Hu, C.-D. Bimolecular fluorescence complementation (BiFC): a 5-year update and future perspectives. BioTechniques 2012, 53, 285–298. [Google Scholar] [CrossRef]
  52. Bracha-Drori, K.; Shichrur, K.; Katz, A.; Oliva, M.; Angelovici, R.; Yalovsky, S.; Ohad, N. Detection of protein–protein interactions in plants using bimolecular fluorescence complementation. The Plant Journal 2004, 40, 419–427. [Google Scholar] [CrossRef]
  53. Horstman, A.; Tonaco, I.A.N.; Boutilier, K.; Immink, R.G.H. A Cautionary Note on the Use of Split-YFP/BiFC in Plant Protein-Protein Interaction Studies. International Journal of Molecular Sciences 2014, 15, 9628–9643. [Google Scholar] [CrossRef]
  54. Kudla, J.; Bock, R. Lighting the Way to Protein-Protein Interactions: Recommendations on Best Practices for Bimolecular Fluorescence Complementation Analyses. The Plant Cell 2016, 28, 1002–1008. [Google Scholar] [CrossRef]
  55. Shyu, Y.J.; Hu, C.-D. Fluorescence complementation: an emerging tool for biological research. Trends in Biotechnology 2008, 26, 622–630. [Google Scholar] [CrossRef]
  56. Morell, M.; A, E.; Fx, A.; S, V. Detection of transient protein-protein interactions by bimolecular fluorescence complementation: the Abl-SH3 case Available online:. Available online: https://pubmed.ncbi.nlm.nih.gov/17352427/ (accessed on Sep 16, 2020).
  57. Ding, Z.; Liang, J.; Lu, Y.; Yu, Q.; Songyang, Z.; Lin, S.-Y.; Mills, G.B. A retrovirus-based protein complementation assay screen reveals functional AKT1-binding partners. Proc Natl Acad Sci U S A 2006, 103, 15014–15019. [Google Scholar] [CrossRef] [PubMed]
  58. Remy, I.; Michnick, S.W. A cDNA library functional screening strategy based on fluorescent protein complementation assays to identify novel components of signaling pathways. Methods 2004, 32, 381–388. [Google Scholar] [CrossRef] [PubMed]
  59. Lönn, P.; Landegren, U. Close Encounters – Probing Proximal Proteins in Live or Fixed Cells. Trends in Biochemical Sciences 2017, 42, 504–515. [Google Scholar] [CrossRef] [PubMed]
  60. Tebo, A.G.; Gautier, A. A split fluorescent reporter with rapid and reversible complementation. Nature Communications 2019, 10, 2822. [Google Scholar] [CrossRef]
  61. Wiens, M.D.; Campbell, R.E. Surveying the landscape of optogenetic methods for detection of protein-protein interactions. Wiley Interdiscip Rev Syst Biol Med 2018, 10, e1415. [Google Scholar] [CrossRef]
  62. Kodama, Y.; Wada, M. Simultaneous visualization of two protein complexes in a single plant cell using multicolor fluorescence complementation analysis. Plant Mol Biol 2009, 70, 211–217. [Google Scholar] [CrossRef]
  63. Dard, A.; Reboulet, J.; Jia, Y.; Bleicher, F.; Duffraisse, M.; Vanaker, J.-M.; Forcet, C.; Merabet, S. Human HOX Proteins Use Diverse and Context-Dependent Motifs to Interact with TALE Class Cofactors. Cell Reports 2018, 22, 3058–3071. [Google Scholar] [CrossRef] [PubMed]
  64. Vidi, P.-A.; Chemel, B.R.; Hu, C.-D.; Watts, V.J. Ligand-dependent oligomerization of dopamine D(2) and adenosine A(2A) receptors in living neuronal cells. Mol Pharmacol 2008, 74, 544–551. [Google Scholar] [CrossRef]
  65. Vidi, P.-A.; Przybyla, J.A.; Hu, C.-D.; Watts, V.J. Visualization of G protein-coupled receptor (GPCR) Interactions in Living Cells Using Bimolecular Fluorescence Complementation (BiFC). Curr Protoc Neurosci 2010, CHAPTER, Unit-5.29. [CrossRef]
  66. Kwaaitaal, M.; Keinath, N.F.; Pajonk, S.; Biskup, C.; Panstruga, R. Combined bimolecular fluorescence complementation and Forster resonance energy transfer reveals ternary SNARE complex formation in living plant cells. Plant Physiol 2010, 152, 1135–1147. [Google Scholar] [CrossRef] [PubMed]
  67. Rebois, R.V.; Robitaille, M.; Galés, C.; Dupré, D.J.; Baragli, A.; Trieu, P.; Ethier, N.; Bouvier, M.; Hébert, T.E. Heterotrimeric G proteins form stable complexes with adenylyl cyclase and Kir3.1 channels in living cells. J Cell Sci 2006, 119, 2807–2818. [Google Scholar] [CrossRef]
  68. Rebois, R.V.; Robitaille, M.; Pétrin, D.; Zylbergold, P.; Trieu, P.; Hébert, T.E. Combining protein complementation assays with resonance energy transfer to detect multipartner protein complexes in living cells. Methods 2008, 45, 214–218. [Google Scholar] [CrossRef]
  69. Cabantous, S.; Terwilliger, T.C.; Waldo, G.S. Protein tagging and detection with engineered self-assembling fragments of green fluorescent protein. Nature Biotechnology 2005, 23, 102–107. [Google Scholar] [CrossRef] [PubMed]
  70. Kellermann, S.J.; Rath, A.K.; Rentmeister, A. Tetramolecular fluorescence complementation for detection of specific RNAs in vitro. Chembiochem 2013, 14, 200–204. [Google Scholar] [CrossRef]
  71. Waldo, G.S.; Cabantous, S. Protein- protein interaction detection system using fluorescent protein microdomains; Los Alamos National Lab. (LANL), Los Alamos, NM (United States), 2010.
  72. Avilov, S.V.; Aleksandrova, N. Fluorescence protein complementation in microscopy: applications beyond detecting bi-molecular interactions. Methods Appl. Fluoresc. 2018, 7, 012001. [Google Scholar] [CrossRef]
  73. Lamesch, P.; Li, N.; Milstein, S.; Fan, C.; Hao, T.; Szabo, G.; Hu, Z.; Venkatesan, K.; Bethel, G.; Martin, P.; et al. hORFeome v3.1: A resource of human open reading frames representing over 10,000 human genes. Genomics 2007, 89, 307–315. [Google Scholar] [CrossRef]
  74. Luck, K.; Kim, D.-K.; Lambourne, L.; Spirohn, K.; Begg, B.E.; Bian, W.; Brignall, R.; Cafarelli, T.; Campos-Laborie, F.J.; Charloteaux, B.; et al. A reference map of the human binary protein interactome. Nature 2020, 1–7. [Google Scholar] [CrossRef]
  75. Rual, J.-F.; Hirozane-Kishikawa, T.; Hao, T.; Bertin, N.; Li, S.; Dricot, A.; Li, N.; Rosenberg, J.; Lamesch, P.; Vidalain, P.-O.; et al. Human ORFeome Version 1.1: A Platform for Reverse Proteomics. Genome Res 2004, 14, 2128–2135. [Google Scholar] [CrossRef]
  76. Yang, X.; Boehm, J.S.; Yang, X.; Salehi-Ashtiani, K.; Hao, T.; Shen, Y.; Lubonja, R.; Thomas, S.R.; Alkan, O.; Bhimdi, T.; et al. A public genome-scale lentiviral expression library of human ORFs. Nat Methods 2011, 8, 659–661. [Google Scholar] [CrossRef]
  77. Sung, M.-K.; Huh, W.-K. Bimolecular fluorescence complementation analysis system for in vivo detection of protein-protein interaction in Saccharomyces cerevisiae. Yeast 2007, 24, 767–775. [Google Scholar] [CrossRef]
  78. Sung, M.-K.; Lim, G.; Yi, D.-G.; Chang, Y.J.; Yang, E.B.; Lee, K.; Huh, W.-K. Genome-wide bimolecular fluorescence complementation analysis of SUMO interactome in yeast. Genome Res 2013, 23, 736–746. [Google Scholar] [CrossRef]
  79. Chang, Y.; Lim, G.; Huh, W.-K. Analysis of the TORC1 interactome reveals a spatially distinct function of TORC1 in mRNP complexes. Journal of Cell Biology 2021, 220, e201912060. [Google Scholar] [CrossRef] [PubMed]
  80. Snider, J.; Hanif, A.; Lee, M.E.; Jin, K.; Yu, A.R.; Graham, C.; Chuk, M.; Damjanovic, D.; Wierzbicka, M.; Tang, P.; et al. Mapping the functional yeast ABC transporter interactome. Nat Chem Biol 2013, 9, 565–572. [Google Scholar] [CrossRef] [PubMed]
  81. Boruc, J.; Daele, H.V. den; Hollunder, J.; Rombauts, S.; Mylle, E.; Hilson, P.; Inzé, D.; Veylder, L.D.; Russinova, E. Functional Modules in the Arabidopsis Core Cell Cycle Binary Protein–Protein Interaction Network. The Plant Cell 2010, 22, 1264–1280. [Google Scholar] [CrossRef]
  82. Lee, L.-Y.; Wu, F.-H.; Hsu, C.-T.; Shen, S.-C.; Yeh, H.-Y.; Liao, D.-C.; Fang, M.-J.; Liu, N.-T.; Yen, Y.-C.; Dokladal, L.; et al. Screening a cDNA Library for Protein-Protein Interactions Directly in Planta. The Plant Cell 2012, 24, 1746–1759. [Google Scholar] [CrossRef]
  83. Remy, I.; Michnick, S.W. Regulation of Apoptosis by the Ft1 Protein, a New Modulator of Protein Kinase B/Akt. Mol Cell Biol 2004, 24, 1493–1504. [Google Scholar] [CrossRef] [PubMed]
  84. Song, Y.B.; Park, C.O.; Jeong, J.-Y.; Huh, W.-K. Monitoring G protein-coupled receptor activation using an adenovirus-based β-arrestin bimolecular fluorescence complementation assay. Analytical Biochemistry 2014, 449, 32–41. [Google Scholar] [CrossRef] [PubMed]
  85. Hashimoto, J.; Watanabe, T.; Seki, T.; Karasawa, S.; Izumikawa, M.; Seki, T.; Iemura, S.-I.; Natsume, T.; Nomura, N.; Goshima, N.; et al. Novel In Vitro Protein Fragment Complementation Assay Applicable to High-Throughput Screening in a 1536-Well Format. J Biomol Screen 2009, 14, 970–979. [Google Scholar] [CrossRef]
  86. Berendzen, K.W.; Böhmer, M.; Wallmeroth, N.; Peter, S.; Vesić, M.; Zhou, Y.; Tiesler, F.K.E.; Schleifenbaum, F.; Harter, K. Screening for in planta protein-protein interactions combining bimolecular fluorescence complementation with flow cytometry. Plant Methods 2012, 8, 25. [Google Scholar] [CrossRef] [PubMed]
  87. Klopffleisch, K.; Phan, N.; Augustin, K.; Bayne, R.S.; Booker, K.S.; Botella, J.R.; Carpita, N.C.; Carr, T.; Chen, J.-G.; Cooke, T.R.; et al. Arabidopsis G-protein interactome reveals connections to cell wall carbohydrates and morphogenesis. Mol Syst Biol 2011, 7, 532. [Google Scholar] [CrossRef] [PubMed]
  88. Lee, O.-H.; Kim, H.; He, Q.; Baek, H.J.; Yang, D.; Chen, L.-Y.; Liang, J.; Chae, H.K.; Safari, A.; Liu, D.; et al. Genome-wide YFP Fluorescence Complementation Screen Identifies New Regulators for Telomere Signaling in Human Cells. Mol Cell Proteomics 2011, 10. [Google Scholar] [CrossRef]
  89. Xia, J.; Kong, L.; Zhou, L.-J.; Wu, S.-Z.; Yao, L.-J.; He, C.; He, C.Y.; Peng, H.-J. Genome-Wide Bimolecular Fluorescence Complementation-Based Proteomic Analysis of Toxoplasma gondii ROP18’s Human Interactome Shows Its Key Role in Regulation of Cell Immunity and Apoptosis. Front Immunol 2018, 9. [Google Scholar] [CrossRef]
  90. Lepur, A.; Kovačević, L.; Belužić, R.; Vugrek, O. Combining Unique Multiplex Gateway Cloning and Bimolecular Fluorescence Complementation (BiFC) for High-Throughput Screening of Protein–Protein Interactions. Journal of Biomolecular Screening 2016, 21, 1100–1111. [Google Scholar] [CrossRef]
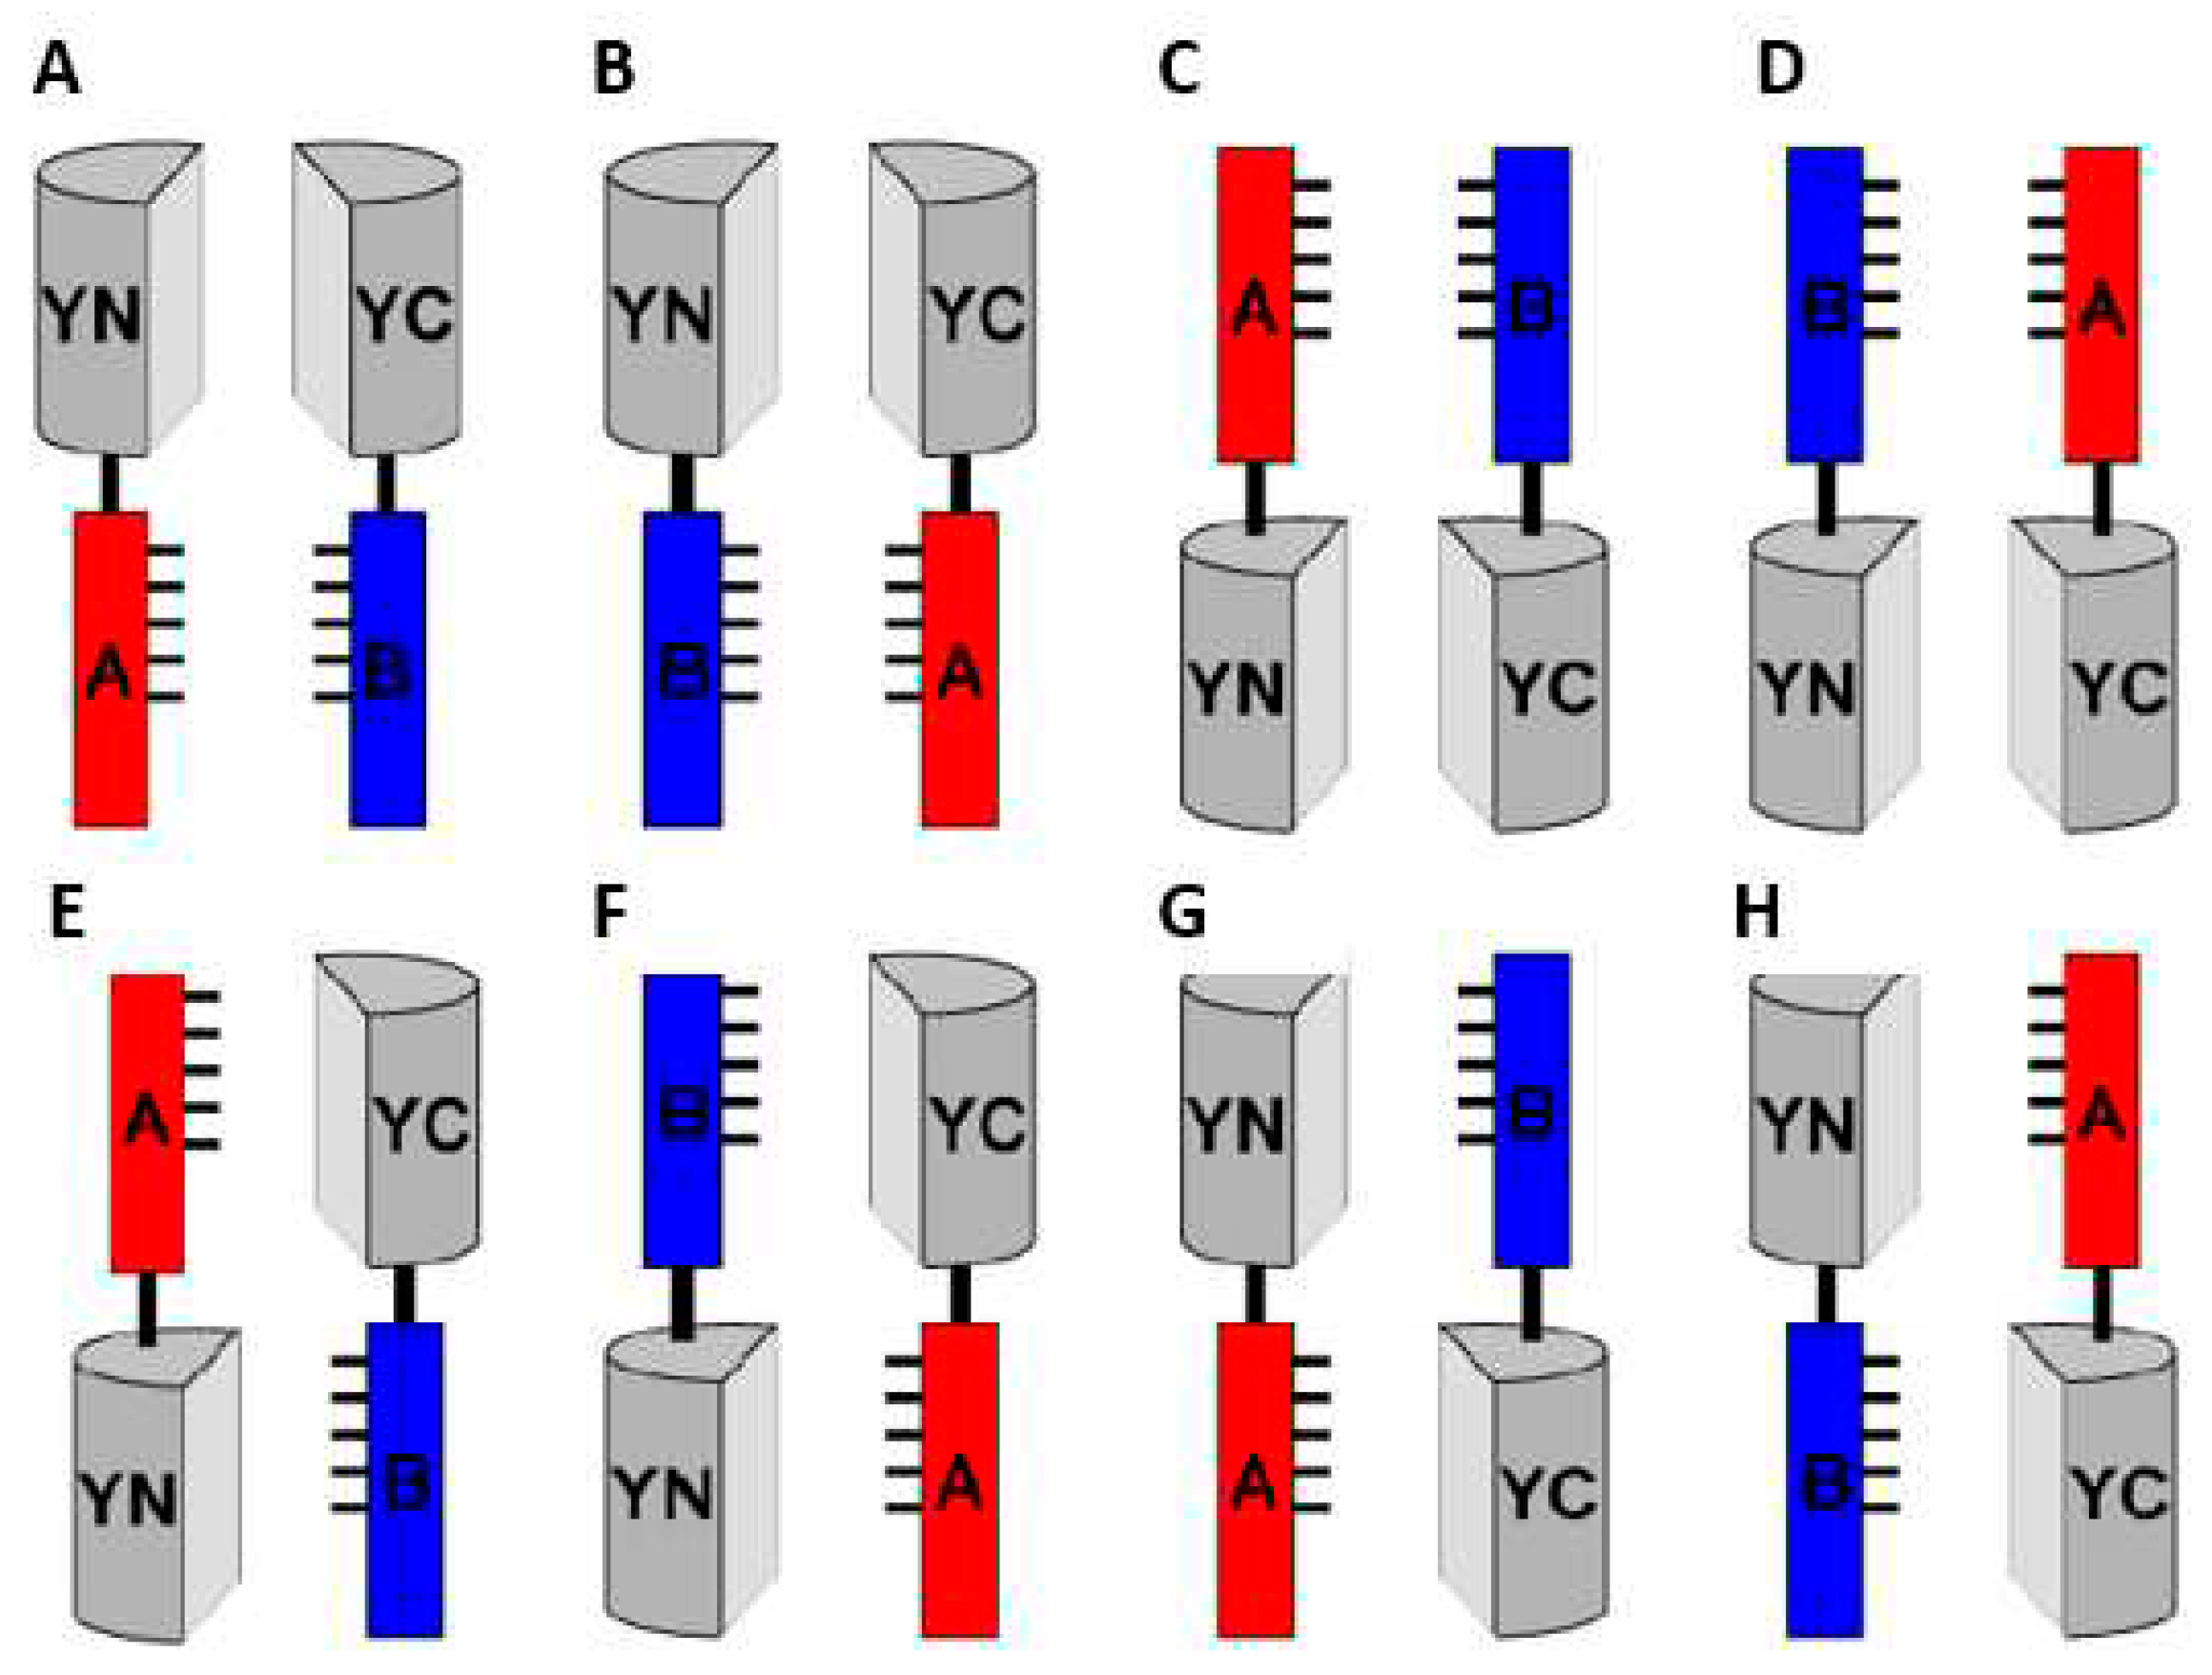
Figure 3. Combinations of fusion proteins to be tested for BiFC. Fusion proteins that produce an optimal signal must generally be empirically determined. Multiple combinations of fusion proteins should be tested for BiFC. N- and C-terminal fusions can be used to test eight distinct combinations (A through H). Although it may appear that combinations E through H might not be favorable for bimolecular complex formation, this will depend on the precise structures and flexibilities of the fusion proteins, which are difficult to predict. For true interaction partners, it is virtually always possible to find fusion proteins that produce a detectable signal. Adapted from figure 2 in [32].
Preprints 87525 g003
Figure 4. Improvement test of S/N ratio in Venus-based BiFC. (A) Mutation sites that increase the S/N ratio in Venus-based BiFC. The three-dimensional structure of Venus (PDB ID: 1MYW from RCSB Protein Data Bank) is shown as generated by the PyMOL software (http://pymol.sourceforge.net/). The 7th and 10th β-strands are shown in yellow and green, respectively. The V150, I152, L201, and L207 residues are indicated in magenta. Reprinted from figure 3 in [51]. (B) Relative BiFC Efficiencies of the Venus Variants. L201 and L207 of bFos-VC155 and V150 and I152 of bJun-VN155 were replaced with amino acids L, I, V, and A by PCR-based site-directed mutagenesis to obtain four substitutions at each position. The replaced bJun-VN155/bFos-VC155 plasmids were transfected into mouse C3H10T1/2 cells. The bFos△ZIP-VC155 plasmid, lacking the carboxy-terminal half of the bFos leucine zipper domain, was used as negative control (background). The mCherry plasmid was also included in the transfection cocktail at a molar ratio of 1:3 to the BiFC plasmids, and was used as internal control for protein expression. Relative BiFC efficiency was calculated from the number of co-fluorescent BiFC cells among mCherry fluorescent cells. The positive BiFC fluorescence signal and the negative backgrounds of the various Venus variants were obtained with bJun-VN155/bFos-VC155 and bJun-VN155/ bFos△ZIP-VC155 respectively. The BiFC efficiency of wild-type bJun-VN155/bFos-VC155 was taken to be 100. Standard deviations were calculated from three independent experiments. Reprinted from figure 3 in [50].
Preprints 87525 g004
Figure 5. Summary of Possible Negative Controls in BiFC Experiments. (A) Interaction of proteins A and B mediates efficient fluorescence complementation and reconstitution of the FP. (B) to (F) Appropriate negative controls (green background). (B) Interaction domain mutated in A, thereby abolishing interaction with B. (C) Interaction domain mutated in B, thereby abolishing interaction with A. Verification that the mutated protein is similarly stable as the wild-type form is additionally required. (D) Ax is closely related to A (e.g., a member of the same protein family) but does no interact with B. (E) Bx is closely related to B but does not interact with A. (F) If none of the controls in (B) to (E) is possible, an unrelated protein, localized in the same subcellular compartment as the proteins of interest, can be used as the last resort. In this case, it is necessary also to provide evidence for this unrelated protein being part of an established interaction (X and Y) that can be reproduced by BiFC. (G) to (N) Inappropriate negative controls (red background). (G) Expression of either the N- or the C-terminal FP fragment alone. (H) N- and C-terminal FP fragments are coexpressed, but without fusion to the proteins of interest. (I) N-terminal FP fragment fused to protein A is expressed alone. (J) C-terminal fragment fused to protein B is expressed alone. (K) N-terminal FP fragment fused to protein A is coexpressed with the unfused C-terminal FP fragment. (L) C-terminal FP fragment fused to protein B is coexpressed with the unfused N-terminal FP fragment. (M) and (N) Unrelated protein Z with different subcellular localization and no positive interaction control for Z and a partner protein (see [F]) is coexpressed with A or B. (O) and (P) Possible orientations of the protein fusions in BiFC assays. It is important to note that the orientation can have a strong impact on the propensity of spontaneous FP reconstitution [52,53]. Hence, it is essential that, for the negative controls, exactly the same orientations are used as for the positive interaction. N, N-terminal fragment of split FP; C, C-terminal fragment of split FP; *, mutation in the interaction site; Ø, no partner protein present; red outline, no interaction with expressed partner protein possible. Reprinted from figure 1 in [54].
Preprints 87525 g005
Figure 6. Reversible BiFC systems based on split FPs that use exogenous chromophores. (A) IFP-based system, is a split version of IFP1.4 that is reported to be reversible. Reconstitution of IFP1.4 due to the interaction of X and Y activates the fluorescence of the bound biliverdin molecule. (B) splitFAST, a reversible split fluorescent reporter that allows real-time monitoring of both formation and dissociation of a protein assembly. This split system was engineered from the fluorescence-activating and absorption shifting tag (FAST), a small protein of 14 kDa that specifically and reversibly binds HBR analogs, like HMBR. HBR, hydroxybenzylidene rhodanine. HMBR, 4-hydroxy-3-methylbenzylidene rhodanine, which provides green-yellow fluorescence. Modified from figure 5 in [61].
Preprints 87525 g006
Figure 7. Different examples for BiFC applications. BiFC can be applied to investigate (A) interactions of single PPI pairs (BiFC), (B) co-localization of different PPI pairs (coBiFC), (C) competition of two protein complex formations enabling visualization of ternary complex (mcBiFC), (D) analyses of ternary protein complex formations (BiFC-based FRET or BRET) and (E) the analysis of quaternary protein complexes (by combining BiLC and BiFC-BRET), as well as (F) tripartite split-GFP, in which sfGFP is split into three parts that are only capable of forming their chromophore when all three are brought together. The protein fragment and/or donor/acceptor combinations recommended for each application and the resulting excitation and emission maxima or substrate catalysis of the respective (complemented) proteins are indicated. The proteins to be investigated for PPI are labeled from A – D. Adapted from figure 1 in [40].
Preprints 87525 g007
Table 1. Main fluorescent proteins used in BiFC assay. nd = not determined.
Preprints 87525 i001
Table 2. Summary of BiFC-based large-scale PPI studies in various contexts. Different colors indicate various organisms, including yeast, plant, mammalian cells or cell-free system.
Fluorescent Protein Bait Prey High-throughput Strategy Pooled screening Experimental cells or Organisms References
Venus VC-SUMO VN-tagged strains
(5911 ORFs)
Individual mating
(array screening)
No Yeast [78]
Venus 17 VC-ABC transporter genes VN-tagged strains
(209 ORFs)
Individual mating
(array screening)
No Yeast [80]
Venus 3 VC-Proteins from TORC1 VN-tagged strains
(5911 ORFs)
Individual mating (array screening) No Yeast [79]
mKG 3 pairs of
mKG_N-ProteinA/
mKG_C-ProteinB
123599 potential PPI inhibitors Protein solution mix (array screening) No in vitro
(Cell-free)
[85]
GFP 58 cGFP-
core_cell_cycle proteins
58 nGFP-core_cell_cycle proteins Transiently coexpressed in leaf by infiltration No Plant (tobacco epidermal cells) [81]
mYFP YN-CPK3 YC-cDNA plasmid library Pooled co-transfection of YN-bait and YC-library Yes Plant (Arabidopsis) [86]
YFP 19 YN- or YC-proteins (G-proteins) 33 YN- or YC-proteins (G-proteins) individual BiFC (cotransfection) No Plant (Arabidopsis) [87]
YFP VirE2/VirD2/CTE-nYFP cYFP-tagged cDNA array library
(~100,000 clones)
Cotransfection in microplate (array screening) No Arabidopsis leaf protoplasts [82]
YFP 6 nYFP-tagged core telomere proteins cYFP-tagged retroviral array library
(hORFeome v3.1)
Coinfection in microplate (array screening) No HTC75 cells [88]
Venus VC-GPCRs VN-β-arrestin 2 adenovirus-based cotransduction (array screening) No U-2 osteosarcoma (OS) cells [84]
GFP GFP[2]-PKB GFP[1]-tagged human brain cDNA library Pooled co-transfection of bait and prey Yes COS-1 cells [83]
Venus Stable bait cell line expressing VN-AKT1 VC-tagged prey lentivirus Pooled infection using VN-AKT1-expressing stable cell line Yes Hela cells [57]
YFP Stable bait cell line expressing ROP18I/ ROP18II-nYFP cYFP-tagged prey retrovirus
(hORFeome v7.1)
Individual infection
(array screening)
No HTC75 cells [89]
Venus VN/VC-AHCY VN/VC-tagged hORFs Cotransfection
(array screening)
No HEK293T cells [90]
Disclaimer/Publisher’s Note: The statements, opinions and data contained in all publications are solely those of the individual author(s) and contributor(s) and not of MDPI and/or the editor(s). MDPI and/or the editor(s) disclaim responsibility for any injury to people or property resulting from any ideas, methods, instructions or products referred to in the content.
Copyright: This open access article is published under a Creative Commons CC BY 4.0 license, which permit the free download, distribution, and reuse, provided that the author and preprint are cited in any reuse.
Prerpints.org logo

Preprints.org is a free preprint server supported by MDPI in Basel, Switzerland.

Subscribe

© 2024 MDPI (Basel, Switzerland) unless otherwise stated