Submitted:
10 October 2023
Posted:
12 October 2023
You are already at the latest version
Abstract
For a comprehensive exploration of the Bimolecular Fluorescence Complementation (BiFC) approach, we critically assess whether protein pairs establish direct or indirect interactions within this context. Emphasizing the multifaceted nature of protein interactions, this review underscores the imperative of delineating macromolecular complex characteristics across five distinct levels: composition, stoichiometry, copy number, topology, and dynamics. A pivotal discussion revolves around the challenges introduced by the overexpression of target proteins and the potential artificial ramifications of fusion proteins. The significance of stoichiometry in protein interactions is illuminated, with the HOXA9/PBX1 interaction serving as a pertinent case study. The research identifies and elaborates on the inherent limitations of prevailing large-scale BiFC screenings, advocating for the incorporation of rigorous negative controls. A novel proposition is introduced in the form of a high-throughput multicolor BiFC strategy, exemplified using the HOXA9 and PBX1 proteins. The paper culminates with an insightful discourse on the implications of tags within the BiFC system, presenting the TriFC (Tripartite Fluorescence Complementation) assay as a promising alternative.
Keywords:
HT-BiFC
; HOXA9/PBX1
; PPI
BiFC approach: direct or indirect interaction interrogation?
Pairs of proteins can form either direct contacts or indirect interactions (Luck et al., 2017). Contrary to Y2H based on direct binary PPIs, the BiFC was considered that fluorescence complementation occurs simply when the two FP fragments are reconstituted, and two POIs are part of a protein complex, not necessary to directly interact with each other (Kerppola, 2006). Reflecting on the target protein overexpression and the FP fragment-tag introduction, we have several points to argue against this explanation of BiFC, giving rise to the question “In BiFC assay, the binary PPIs are direct or indirect interactions ? ” or “Which type of binary PPI is dominant in BiFC assay, direct or indirect ?”
Prior to answering this question, it is important to clarify the different layers of macromolecular complex characteristics, which can be investigated at 5 levels (Figure 1): (A) composition, (B) stoichiometry, (C) copy number, (D) topology, and (E) dynamics.
In BiFC, given the widely used transfection, the overexpression of target proteins is still a key concern of background signal, despite that optimization of plasmid amount and microscopy parameter can abate this side effect, minimizing the non-specific background signal. As previously mentioned (Kerppola, 2006), many interactions can be visualized when the fusion proteins are expressed at concentrations comparable to their endogenous counterparts. Therefore, this problem can be alleviated by expressing the fusion proteins at concentrations approximating their endogenous counterparts.
However, because of the simplicity and convenience of BiFC, many experiments were performed by routine transfection, with strong enough expression regardless of their endogenous expression level. This is not surprising due to the following reasons. First, limited information of protein isoform abundance in given cellular context, thus hindering the antibody selection for the most representative protein blotting. Second, the unavailability of antibodies for certain special proteins, resulting from the binding specificity and technical problem. The last is that not all tested proteins exist in a given cell line. Sometimes, we want to only confirm a new interaction with a candidate protein regardless of the endogenous status. Therefore, in most cases, people prefer to validate only the expression and colocalization of fusion proteins instead of their endogenous counterparts, potentially resulting in artificial/non physiologically relevant expression levels during the BiFC assay.
Besides overexpression, fusion proteins, generally, possess different physiological properties from wildtype proteins, such as the non-native folding and increased protein size, possibly influencing intrinsic dynamics and topology of related protein complex. For example, the binding kinetics of manipulated fusion proteins should be much slower than that of endogenous proteins when interacting with additional cofactors or components that belong to the same protein complex. Consequently, the exogenous overexpressed proteins are prone to interact with each other, forming direct binary contacts instead of indirect PPIs. The overexpressed manipulated proteins, in part, are redundant to well-organized inner microenvironments. As competitors of endogenous proteins for restricted and relatively low-expressed complex components, which have potential to form multimetric protein complex with, the exogenous fusion protein is at a binding disadvantage in this competition and hard to interact with additional limited factors, even of small part, would not enough overrule the main binary direct PPI signals.
Additionally, thinking about the stoichiometry of macromolecular complexes, in BiFC and other PPI individual tests, such as Co-IP, the equal genetic expression of two target proteins (1:1) were traditionally applied in practice. This arbitrary decision conferred the same mole fraction on all resulting target proteins in the complex’s constituents, which is regarded as an extremely rare and ideal simulated situation in a given native context.
In our experiments, we occasionally noticed that stoichiometry could regulate HOX/cofactor subcellular localization in living cells. Indeed, it is infeasible to optimize the mole ratio prior to manipulation, due to the lack of information of the given protein complex in the specific biological context. As such, manipulation of two proteins with comparable expression is a reasonable compromise in protein functional and interaction study.
In our retrospective analysis, fortuitously, it was observed that dose-dependent effect on subcellular localization of HOXA9/PBX1 interaction in living cells, demonstrating the importance of the stoichiometry of the protein complex in PPI detection (Figure 2).
Limitation and future directions of current large-scale BiFC screening
Lack of rigorous negative control
The random collisions of two halves of reporter protein fragments are the main source of BiFC background signals, as well as other PCA-based methods. Thus, in a high-throughput BiFC scan, the negative control is important to non-specific signal removal and subsequent candidate validation. Unlike the loss-of-function screens that the paired negative controls are well defined and integrated in the whole genetic library, such as gRNA or shRNA library, the BiFC negative control is more flexible and very study-dependent. Even for individual BiFC, a rigorous control is not always available, not to speak of a genome-wide BiFC screening. Though sometimes the gain-of function or overexpression screening shares the same hORFeome library with BiFC screening, the control using function-free and fluorescent proteins are not compatible with BiFC. To address this point, four types of negative controls are widely recruited in the BiFC screening: (a) N- and C-terminal FP fragments without fusion to the POI; (b) N-terminal FP fragment fused to POI with the unfused C-terminal FP fragment; (c) C-terminal FP fragment fused to POI with the unfused N-terminal FP fragment. (d) One FP fragment fused to POI alone. As reported, at least one, or up to 3 of the above mentioned controls are used in BiFC screenings (Xia et al., 2018; Yue et al., 2017). Unfortunately, all of these controls fall into the inappropriate controls (Kudla and Bock, 2016).
The splitFAST approach could constitute a promising alternative to FP-based BiFC (Tebo and Gautier, 2019). Indeed, splitFAST is reversible and can therefore be used for selecting interactions that will be specifically affected by a given inhibitor to test. In contrast to FP-based BiFC, where the inhibitor has to be mixed with the fusion proteins for a long time incubation before BiFC signal detection, splitFAST allows testing the inhibitor directly on the fluorescent complexes in real time (Figure 3). This strategy could be suitable for a conventional genome-wide PPI screening (e.g. to know the potential range of action of a therapeutic molecule), and could also be amenable to conduct a TF functional domain screening with a known corresponding inhibitor, as well as drug screening for fitness genes within potential PPIs in human cell lines. Finally, given the reversibility of splitFAST, it allows having access to the PPI dynamics, a key molecular parameter that conventional FP-based BiFC could not approach.
Multicolor BiFC screening
Growing concern regarding the rise in protein complex-specific interactome, the split-BioID was reported as a promising and powerful method to investigate the proximal binding partners of a given binary protein complex, as well as our new developed BibID approach. Likewise, multicolor BiFC analysis provides an effective assay to compare the subcellular distributions of protein complexes formed with different binding partners. Furthermore, this method can be regarded as one single-scale method to verify the binay protein complex-specific cofactors. Although its utility in high-throughput manner is theoretically feasible, multicolor BiFC assay applied for high-throughput screen is as yet unpublished. Owing to the availability of Bi-PTRE, two baits can be easily cloned into the same plasmid, keeping the same system complexity as single bait screening. Here I propose a strategy of high-throughput multicolor BiFC screening, which will break the limit of conventional single target BiFC screening, empowering it with a protein complex-compatible screening, in addition to single bait protein screening (Figure 4).
In principle, split-FP fragments will be used and derived from two different fluorophores, mVenus and mCerulean, with distinct spectra. Either VC155 or CC155 could achieve mVenus-like BiFC with VN173 fragment (Jia et al., 2021). In addition, the CC155 fragment can complement with the CN173 for making mCerulean-like BiFC. This property allows visualizing two different PPIs simultaneously by doing mVenus- and mCerulean-like BiFC with three fusion proteins. The CN173/CC155/VN173 has proven to be the best combination for multicolor BiFC (Shyu et al., 2006). Based on these versatile FP fragments, VN-HOXA9/CN-PBX1 bait proteins were used in plasmid construction (Figure 4A), and the rationale of high-throughput multicolor BiFC was detailed in Figure 4B. Depending on the needs, the double baits are not necessary to be coexpressed. This system can easily be used as conventional single-bait BiFC screening, if keeping one of Bi-PTRE flanks empty. Collectively, proposed high-throughput multicolor BiFC screening enables two interactions to be examined simultaneously, facilitating the detection of binary protein complex-specific partners, as a cost-effective and time-saving method.
The tag effect
There are two main concerns, when applying a tag-based method. One is the biotechniques used for tagged fusion protein introduced into a live context, such as the classical methods, including transfection, transformation or virus-mediated transduction, and advanced approaches, for example, CRISPR-Cas9-mediated gene tagging (Lackner et al., 2015). Though the side effect of tag was largely improved, especially the steric hindrance of interactions caused by overexpression of tagged bait protein, on the other hand, the tag per se, can result in non-native folding of fusion proteins and further influencing the stoichiometry of the complex.
However, the split-FP fragment as tags of tested proteins, is the basis of BiFC principle. The tag is an integral part of the BiFC system, unlike the antibody-based methods such AP-MS or Co-IP, in which alternative tag-free procedure can be performed via endogenous protein-specific antibody. Given that large and bulky fragments impair BiFC fragment solubility and folding, consequently leading to high background signals (Y and Cd, 2010), several efforts have been addressed on the tag minimization, for instance, the micro-tagging system based on tripartite split-GFP (Cabantous et al., 2013).
Concerning our BiFC system, generic and large fragments were used in a large-scale screen, which is potentially aggregation-prone and of high backgrounds from self-assembly. I should still emphasize here that (i) only 1-2% of cells were fluorescent in the HOX screen and (ii) different partners were found with the different HOX proteins, thus making the BiFC background of low incidence for capturing specific signals. In any case, to know whether other BiFC systems could be performed with a minimum background, I tested a tripartite split-GFP system, also known as TriFC (Tripartite Fluorescence Complementation) assay (Figure 5A). As showcase, I generated sfGFP10-HOXA9 and sfGFP11-PBX1 functional fusions in a single pcdna3 plasmid, with a ready-to-use detector plasmid containing sfGFP1-9 fragment fused to mCherry reporter (Figure 5B). The test was performed in HEK cells by transfection. Each plasmid was individually transfected to check the background signals. Preliminary results showed that the TriFC worked properly in a two-plasmid transfection system, comparable to our routine 3-plasmid system. The HOXA9/PBX1 interaction localized in the nucleus as expected (Figure 5C). Only requiring attention is that the reconstituted GFP signal is seemingly much weaker than CC/VN refolded fluorescence, which needs a further evaluation.
Furtherly, upon this verified advanced TriFC method, I present here its applicability in a high-throughput system. There is no difference for the tagged bait protein and prey library preparation (with a small GFP tag in both cases). One more step should be considered is how to introduce the big GFP1-9 detector fragment into the cells. On this point, making a GFP1-9 stable cell line will be best to subsequently be used to generate GFP10 or GFP11-tagged prey cell libraries. The resulting endogenous GFP1-9-expressed prey cell library will function similarly as that used in our previous Cell-PCA. Hopefully, this micro-tagged TriFC screening could minimize the unexpected protein interference and aggregation.
Limited quantitative information
Several screening methods can provide both a final candidate list and quantitative information according to the different selection conditions. For example, the detection of gene-independent cell fitness effects in CRISPR-CAS9 screening (Joung et al., 2017). This quantitative information can help to know the candidate relative abundance compared with the control, as well as their functional potency in a specific phenotype. In terms of PPI study, AP-MS method characterizes the target protein interactome, and the relative abundance of interaction candidates can also be obtained (which requires more materials), giving the quantitative information. Through label-free quantification, the differentially enriched proteins can be defined under the tested conditions (Smaczniak et al., 2012).
The final readout of BiFC screening has also the quantitative information that represents the candidate ORF abundance. More exactly, this abundance deciphered the BiFC-positive cell number during the FACS procedure for a given ORF. It is restricted only for deciding the positive or negative status compared to the fixed BiFC-positive gate. Consequently, this ORF abundance can neither depict the bait/prey interaction intensity, nor the BiFC-positive signal change. As shown in Figure 6, a microplate-based high-throughput BiFC screening was performed coupled with FACS and two ORF interaction profiles were illustrated. They have the same number of positive cells in red, defined by the same gate. The ORF abundance can be calculated as positive ratio (PR). Despite that Intensity of interactions between two different ORFs are quite different, they have the same abundance (PR) as 0.1. Besides, we can assume that two profiles belong to the same ORF. Left one is drug-treated, resulting in a great positive signal loss, but still bigger than the threshold as positive cells. Thus the quantitative information of BiFC screening is limited in that we can know whether a given ORF is positive or not.
In turn, the sequential gates can solve this problem to some degree. Several gates were set along with the signal strength, and count the cell number in different gates. The final calculated weighted positive ratio (WPR) revealed the interaction difference between ORFs (Figure 6). This strategy was described only for individual BiFC signal evaluation. In BiFC screening, five gates represent five positive cell populations, assigning with PPI intensity degree from 1 to 5. The resulting ORFs will be intensity degree-specific candidates, which will be useful for further weak or strong PPI analysis. As example, this strategy has been used in a genome-scale ORFeome screen (Mengwasser, 2018). The whole-genome ORFeome library under TRE promoter control. The screen for PD-L1 responsiveness to IFNγ performed in the presence of 100ng/mL IFNγ. ORF expression was induced for 48 hours with doxycycline, stained the cells with a monoclonal antibody recognizing PD-L1, and FACS sorted the cells into PD-L1high, PD-L1med, and PD-L1low-staining populations. Finally, the validated ORFs were linked to different PD-L1 expression to explain their potency.
Convoluted polyclonal prey cell library
The heterogeneity of cells is mostly resulting from genome instability and cellular division during culturing and passaging, especially in the case of immortalized model cell lines. As such, the cell-to-cell variability is of wide concern for proteomics. However, the cell-based PPI studies have commonly been performed in bulk, with substantial materials that can largely compensate this intrinsic variance, obtaining a global and acceptable proteome profile. Since the emergence of high-throughput screening, the pooled cell library was frequently used in different screening-based approaches. The lentiviruses are frequently used to make the well-known one-ORF-per-Cell library. Due to the random lentiviral insertion of ORF, genetic interruption and insertional mutagenesis were often observed in stable cells. Moreover, the expression of integrated genes will depend on the transcriptional activity of the surrounding sequences at the integration site. Taken altogether, the random insertion will aggravate the library inner variance, which will further influence the screen performance.
Therefore, knock-in at the identical target genomic locus is highly demanded. Generally, there are two well-documented methods to introduce the target DNA sequence to a predefined genome site. First is the Flp-In system that involves introduction of a Flp Recombination Target (FRT) site into the genome of the mammalian cell line of choice (O’Gorman et al., 1991). Once the biotic-resistant Flp-In cell line is established, the subsequent generation of isogenic stable line is rapid and efficient. Consequently, this method was frequently used in function gene stable cell line generation. As the probability of obtaining stable integrants containing a single FRT site or multiple FRT sites, with subsequent chromosomal position effect, this method is as yet not reported to be used in high-throughput study. Second, clustered regularly interspaced short palindromic repeats (CRISPR)/CRISPR-associated protein 9 (Cas9)-based techniques have transformed our ability to genetically manipulate mammalian genomes. Knock-in method with Cas9 RNPs (Cas9-gRNA ribonucleoproteins) mediated homology directed repair template (HDRT) permits alteration of the endogenous sequence or insertion of an exogenous sequence at the target locus. More recently, a method for pooled knockin screens was developed which combines simultaneous delivery of a library of dsDNA HDRTs and Cas9 RNPs by electroporation. The HDRTs are integrated into a single locus (endogenous TCR-α locus), specified by the sgRNA to generate a T cell population expressing on average one insert per cell. The delivery of the library is followed by assays to evaluate the impact of each construct on T cells (Roth et al., 2020). This impactful attempt sheds light on the generation of a pooled and BiFC-compatible tagged prey cell library in means of a unique single integration site. The resulting pooled tagged ORF knock-in involves the same locus being targeted in every cell, however the identity of the genetic modification at this locus differs between the cells in the edited population.
After all, the future pooled prey cell library with identical ORF insert sites will largely decrease the side effects caused by the transcriptional activity of the surrounding sequences for the cell population harboring the same ORF. Given the same ORF flanking sequence, it will further improve the PCR efficiency and bias of target region amplification during the NGS library preparation process. Moreover, the less convoluted cell library will benefit the ORF representation throughout the BiFC screening. In addition, during the sequential gating procedure, the cells with less variance will generate more concentrated cell populations, which could further increase the precision of cell sorting.
A bulk interactome investigation instead of single functional complex
Proteins participate in most cellular processes and fulfil most of their biological tasks in complexes through interaction with other proteins (Alberts, 1998). Protein complexes that are composed of more than one component are found in many different classes of proteins. Like that cell is the fundamental structural and functional unit of all living organisms, the protein complex is the functional unit of cellular biological processes in which proteins involve (Figure 7, center). However, the PPI detection methods are generally performed in bulk manner, which measures only the global interactome of target proteins across a large population of input cells, resulting in a pool of potential interacting candidates regardless of the protein complex integrity (Figure 7, left). For example, BioID-like AP-MS investigates the whole complexome of target protein. In turn, our Cell-PCA generates a collection of possible binary PPIs. These methods do not allow the analysis of specific complexes but rather give an overview of all possible PPIs of a given protein, resulting in one of the most representative interactomes by smoothie-like PPI analysis.
Regarding the growing concern about the intra-tissue heterogeneity as well as the cell-to-cell variability in bulk analysis, single-cell omics gained widespread popularity since 2014 (Kharchenko et al., 2014; Picelli et al., 2014), along with more accessible protocols and lower sequencing costs. Following the first whole-transcriptome analysis of a single cell (Tang et al., 2009), more than 100 different single cell sequencing methods have been published (Wikipedia, 2021). These substantial advances have led to the transition from initial scRNA-seq to single-cell multi-omics, allowing multimodal measurements and integration of transcriptome, proteome, and spatial localization from the same cell. For example, the commercial 10X Genomics Visium solution combines whole transcriptome spatial analysis with immunofluorescence protein detection in the same tissue section, which empowers a deeper, more holistic understanding of tissue organization. Moreover, the classical large-scale genetic perturbation screens stand to benefit from single-cell sequencing. Recently, screens combining genetic perturbations with scRNA-seq readouts have emerged as promising and scalable alternatives over traditional screens, enabling direct readout of transcriptomic changes from the final fitness-responded cell population. As example, Maehr and colleagues combined single-cell RNA-seq with parallel CRISPR perturbations to comprehensively define the loss-of-function phenotype of those factors in definitive endoderm development (Genga et al., 2019). Innovatively, barcoded genome-scale ORF expression libraries were used by Mali lab, to systematically overexpress a pooled library of TFs in hPSCs, coupling scRNA-seq and fitness screen (Parekh et al., 2018). While other groups have demonstrated different scRNA-seq-based screens, notably, scRNA-seq based PPI screens have yet to be demonstrated.
Thanks to the well-performed barcoded ORFeome library (Parekh et al., 2018; Sack et al., 2018) and scRNA-seq (Chromium Single Cell 3’ library) (Genga et al., 2019), herein I present a parallel scRNA-seq BiFC screening method, enabling pooled BiFC screens with single-cell transcriptome resolution (Figure 8). In contrast to the genetic perturbation screens that pooled shRNAs and gRNAs themselves can serve as specific barcodes because they consist of uniquely identifiable DNA sequences, ORF sequences vary substantially in length, introducing bias during PCR recovery, as longer templates are recovered less efficiently by PCR. Thus, pairing ORFs uniquely with DNA BCs of uniform length will provide a marked improvement in screen fidelity, in which the BCs serve as the surrogate reporter to monitor ORF abundance. Moreover, this scRNA-seq-based BiFC screen method, at the time of deconvolution, is based on RNA-seq using a single cell 3’ gene expression library. The resulting CC-ORF was paired with a unique length barcode sequence located 200 bp upstream of the PolyA region (Figure 8C). This yields a polyadenylated transcript bearing the barcode proximal to the 3’ end, facilitating efficient detection in scRNA-seq. Consequently, scRNA-seq based BiFC screening simultaneously assays both bait interacting ORF candidates and PPI-coupled cell-specific changes in transcriptome, more significantly, making a place for high-throughput PPI screening method in this new single-cell era.
As a long-term issue that pooled BiFC screening is restricted to apply in only cell lines or single-cell organisms, the multi-cell self-organized organoid is a potential model to be used in high-throughput BiFC screening. Recent progress in stem cell biology led to a strong revival of the organoid field. Organoid technology can therefore be used to model human organ development and various human pathologies ‘in a dish’’, reflecting key structural and functional properties of organs (Lancaster and Knoblich, 2014). To date, many genetic manipulations have already performed in organoids, such as transfection (Laperrousaz et al., 2018), transduction (Maru et al., 2016) and even CRISPR/Cas9 precision genome editing (Artegiani et al., 2020). In addition, single-cell analyses of matched organoids by FACS was also widely used in different studies (Fujimichi et al., 2019; Rosenbluth et al., 2020). Accordingly, the current achievements have shown that an organoid-based pooled BiFC screening is very promising to be conceived and carried out in the near future. This feasibility opens new perspectives for pooled BiFC screening, as well as high-throughput genetic screening and functional genomic applications, further giving precise and valuable insight into gene function and PPIs in a more human-like context.
Given the applicability of single-cell-based or/and organoid-based pooled PPI screening, it will permit measuring expression levels for each interacting candidate across a population of cells and allow studying new biological questions in which PPI-affected cell-specific changes in transcriptome. However, this single cell-based binary protein complex analysis is still far from a real functional protein complex. To fill this gap, a reverse-ChIP method, named CLASP (Cas9 locus-associated proteome), was reported to capture functionally relevant gene-specific regulators targeted to the gene locus of interest (Tsui et al., 2018). By using purified recombinant catalytically inactive Cas9 (dCas9)–guide RNA ribonucleoprotein (RNP) complexes, CLASP does not require specialized cell lines and can be easily prepared with different guide RNAs to target multiple loci in any cell line or tissue. By fusing dCAS9 to PL enzyme, a new attempt was to fuse dCAS9 with BirA* to create a novel technology CASID, which was applied to analyze binding proteins in the direct vicinity of specific loci (Schmidtmann et al., 2016). Whereas dCAS9-based method enables a single genome locus-proximal proteome analysis, in which may include dozens of functional protein complexes instead of a single functional complex, it still provides insight into the real-time binding activities of these proteins at a specific DNA locus and uncovers the identities of these proteins simultaneously. However, one mentionable caveat is that the dCAS9-based method is designed to focus on only the nuclear protein activities depending on the DNA binding and its highly nucleus-restricted. Referring to the huge number of non-nucleus-localized protein complexes, a global non-compartment-specific detection method is needed, which enables a whole protein complexome analysis, like single transcript-based transcriptome analysis via RNA-seq.
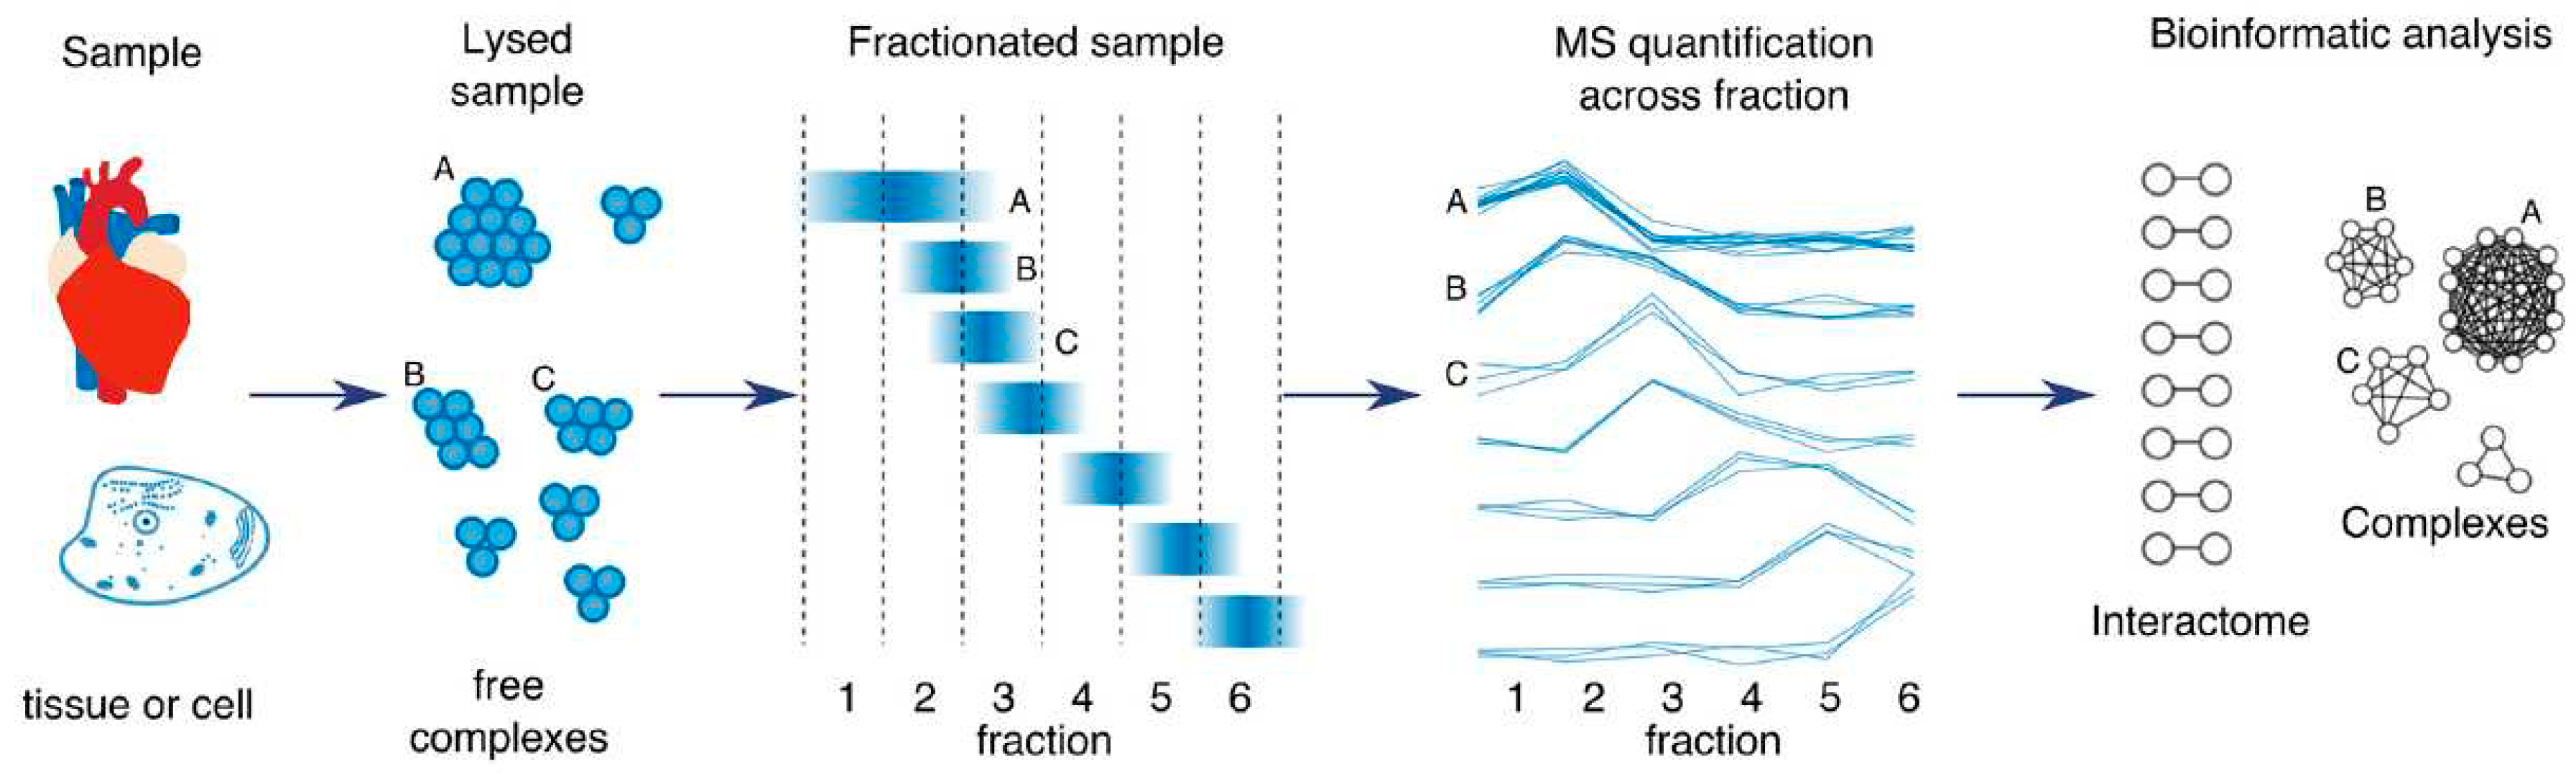
To close this gap, co-elution or co-fractionation (CoFrac) approaches are collectively a global approach used to simultaneously study the whole interactome (Havugimana et al., 2012; Kristensen et al., 2012). They all rely on separation of protein complexes under native conditions, with the fact that proteins belonging to the same complex co-elute or migrate together during separation, showing the same migration profile (Figure 9). As such, hundreds to thousands of protein complexes can be simultaneously and rapidly analyzed by co-elution in a single experiment, enabling the all-to-all protein analysis at single-protein-complex resolution. An added attraction of co-elution is, to date, that generated interactome does not rely on the genetic manipulation of cells or organisms, co-elution has thus been able to predict endogenous and unmanipulated protein complexes on a considerably large scale and in more physiologically relevant manner, as opposed to the results involving the tagged or overexpressed bait proteins. Nonetheless, one main drawback of co-elution that enslaves its popularity, is requirement of sophisticated bioinformatics analyses, facing million pairs of proteins quantified in a sample. However, co-elution is a powerful tool for next-generation interactomics, and it provides higher dimensional data information over existing high-throughput PPI screen methods. Looking forward, co-elution methods will progress toward increasing separation resolution and maximizing quantitation accuracy, along with miniaturization of sensitive MS measurement, and guide future single-cell interactomics.
References
- Alberts, B. (1998). The cell as a collection of protein machines: preparing the next generation of molecular biologists. Cell 92, 291–294. [CrossRef]
- Artegiani, B. , Hendriks, D., Beumer, J., Kok, R., Zheng, X., Joore, I., Lopes, S.C. de S., Zon, J. van, Tans, S., and Clevers, H. (2020). Fast and efficient generation of knock-in human organoids using homology-independent CRISPR/Cas9 precision genome editing. bioRxiv 2020.01.15.907766. [CrossRef]
- Cabantous, S. , Nguyen, H.B., Pedelacq, J.-D., Koraïchi, F., Chaudhary, A., Ganguly, K., Lockard, M.A., Favre, G., Terwilliger, T.C., and Waldo, G.S. (2013). A New Protein-Protein Interaction Sensor Based on Tripartite Split-GFP Association. Scientific Reports 3. [CrossRef]
- Fujimichi, Y., Otsuka, K., Tomita, M., and Iwasaki, T. (2019). An Efficient Intestinal Organoid System of Direct Sorting to Evaluate Stem Cell Competition in Vitro. Scientific Reports 9, 20297. [CrossRef]
- Genga, R.M.J. , Kernfeld, E.M., Parsi, K.M., Parsons, T.J., Ziller, M.J., and Maehr, R. (2019). Single-Cell RNA-Sequencing-Based CRISPRi Screening Resolves Molecular Drivers of Early Human Endoderm Development. Cell Rep 27, 708-718.e10. [CrossRef]
- Havugimana, P.C., Hart, G.T., Nepusz, T., Yang, H., Turinsky, A.L., Li, Z., Wang, P.I., Boutz, D.R., Fong, V., Phanse, S., et al. (2012). A Census of Human Soluble Protein Complexes. Cell 150, 1068–1081. [CrossRef]
- Jia, Y. , Bleicher, F., Reboulet, J., and Merabet, S. (2021). Bimolecular Fluorescence Complementation (BiFC) and Multiplexed Imaging of Protein-Protein Interactions in Human Living Cells. Methods Mol Biol 2350, 173–190.
- Joung, J. , Konermann, S., Gootenberg, J.S., Abudayyeh, O.O., Platt, R.J., Brigham, M.D., Sanjana, N.E., and Zhang, F. (2017). Genome-scale CRISPR-Cas9 knockout and transcriptional activation screening. Nature Protocols 12, 828–863. [CrossRef]
- Kerppola, T.K. (2006). Design and implementation of bimolecular fluorescence complementation (BiFC) assays for the visualization of protein interactions in living cells. Nature Protocols 1, 1278–1286. [CrossRef]
- Kharchenko, P.V. , Silberstein, L., and Scadden, D.T. (2014). Bayesian approach to single-cell differential expression analysis. Nature Methods 11, 740–742. [CrossRef]
- Kristensen, A.R. , Gsponer, J., and Foster, L.J. (2012). A high-throughput approach for measuring temporal changes in the interactome. Nat Methods 9, 907–909. [CrossRef]
- Kudla, J. , and Bock, R. (2016). Lighting the Way to Protein-Protein Interactions: Recommendations on Best Practices for Bimolecular Fluorescence Complementation Analyses. The Plant Cell 28, 1002–1008. [CrossRef]
- Lackner, D.H. , Carré, A., Guzzardo, P.M., Banning, C., Mangena, R., Henley, T., Oberndorfer, S., Gapp, B.V., Nijman, S.M.B., Brummelkamp, T.R., et al. (2015). A generic strategy for CRISPR-Cas9-mediated gene tagging. Nature Communications 6, 10237. [CrossRef]
- Lancaster, M.A. , and Knoblich, J.A. (2014). Organogenesis in a dish: modeling development and disease using organoid technologies. Science 345, 1247125. [CrossRef]
- Laperrousaz, B. , Porte, S., Gerbaud, S., Härmä, V., Kermarrec, F., Hourtane, V., Bottausci, F., Gidrol, X., and Picollet-D’hahan, N. (2018). Direct transfection of clonal organoids in Matrigel microbeads: a promising approach toward organoid-based genetic screens. Nucleic Acids Res 46, e70. [CrossRef]
- Lee, O.-H. , Kim, H., He, Q., Baek, H.J., Yang, D., Chen, L.-Y., Liang, J., Chae, H.K., Safari, A., Liu, D., et al. (2011). Genome-wide YFP Fluorescence Complementation Screen Identifies New Regulators for Telomere Signaling in Human Cells. Mol Cell Proteomics 10. [CrossRef]
- Luck, K. , Sheynkman, G.M., Zhang, I., and Vidal, M. (2017). Proteome-Scale Human Interactomics. Trends in Biochemical Sciences 42, 342–354. [CrossRef]
- Maru, Y. , Orihashi, K., and Hippo, Y. (2016). Lentivirus-Based Stable Gene Delivery into Intestinal Organoids. In Gastrointestinal Physiology and Diseases: Methods and Protocols, A.I. Ivanov, ed. (New York, NY: Springer), pp. 13–21.
- Mengwasser, K.E. (2018). Genetic Screening Approaches to Cancer Driver Characterization and Synthetic Lethal Target Discovery. Harvard University.
- O’Gorman, S. , Fox, D.T., and Wahl, G.M. (1991). Recombinase-mediated gene activation and site-specific integration in mammalian cells. Science 251, 1351–1355. [CrossRef]
- Parekh, U. , Wu, Y., Zhao, D., Worlikar, A., Shah, N., Zhang, K., and Mali, P. (2018). Mapping Cellular Reprogramming via Pooled Overexpression Screens with Paired Fitness and Single Cell RNA-Sequencing Readout. Cell Syst 7, 548-555.e8. [CrossRef]
- Picelli, S. , Faridani, O.R., Björklund, Å.K., Winberg, G., Sagasser, S., and Sandberg, R. (2014). Full-length RNA-seq from single cells using Smart-seq2. Nature Protocols 9, 171–181. [CrossRef]
- Rosenbluth, J.M. , Schackmann, R.C.J., Gray, G.K., Selfors, L.M., Li, C.M.-C., Boedicker, M., Kuiken, H.J., Richardson, A., Brock, J., Garber, J., et al. (2020). Organoid cultures from normal and cancer-prone human breast tissues preserve complex epithelial lineages. Nature Communications 11, 1711. [CrossRef]
- Roth, T.L. , Li, P.J., Blaeschke, F., Nies, J.F., Apathy, R., Mowery, C., Yu, R., Nguyen, M.L.T., Lee, Y., Truong, A., et al. (2020). Pooled Knockin Targeting for Genome Engineering of Cellular Immunotherapies. Cell 181, 728-744.e21. [CrossRef]
- Sack, L.M. , Davoli, T., Li, M.Z., Li, Y., Xu, Q., Naxerova, K., Wooten, E.C., Bernardi, R.J., Martin, T.D., Chen, T., et al. (2018). Profound Tissue Specificity in Proliferation Control Underlies Cancer Drivers and Aneuploidy Patterns. Cell 173, 499-514.e23. [CrossRef]
- Salas, D. , Stacey, R.G., Akinlaja, M., and Foster, L.J. (2020). Next-generation Interactomics: Considerations for the Use of Co-elution to Measure Protein Interaction Networks *. Molecular & Cellular Proteomics 19, 1–10. [CrossRef]
- Schmidtmann, E., Anton, T., Rombaut, P., Herzog, F., and Leonhardt, H. (2016). Determination of local chromatin composition by CasID. Nucleus 7, 476–484. [CrossRef]
- Shyu, Y.J., Liu, H., Deng, X., and Hu, C.-D. (2006). Identification of new fluorescent protein fragments for bimolecular fluorescence complementation analysis under physiological conditions. BioTechniques 40, 61–66. [CrossRef]
- Smaczniak, C. , Li, N., Boeren, S., America, T., van Dongen, W., Goerdayal, S.S., de Vries, S., Angenent, G.C., and Kaufmann, K. (2012). Proteomics-based identification of low-abundance signaling and regulatory protein complexes in native plant tissues. Nat Protoc 7, 2144–2158. [CrossRef]
- Tang, F. , Barbacioru, C., Wang, Y., Nordman, E., Lee, C., Xu, N., Wang, X., Bodeau, J., Tuch, B.B., Siddiqui, A., et al. (2009). mRNA-Seq whole-transcriptome analysis of a single cell. Nature Methods 6, 377–382.
- Tebo, A.G., and Gautier, A. (2019). A split fluorescent reporter with rapid and reversible complementation. Nature Communications 10, 2822.
- Tsui, C. , Inouye, C., Levy, M., Lu, A., Florens, L., Washburn, M.P., and Tjian, R. (2018). dCas9-targeted locus-specific protein isolation method identifies histone gene regulators. PNAS 115, E2734–E2741. [CrossRef]
- Wikipedia (2021). List of single cell omics methods.
- Wohlgemuth, I. , Lenz, C., and Urlaub, H. (2015). Studying macromolecular complex stoichiometries by peptide-based mass spectrometry. Proteomics 15, 862–879. [CrossRef]
- Xia, J. , Kong, L., Zhou, L.-J., Wu, S.-Z., Yao, L.-J., He, C., He, C.Y., and Peng, H.-J. (2018). Genome-Wide Bimolecular Fluorescence Complementation-Based Proteomic Analysis of Toxoplasma gondii ROP18’s Human Interactome Shows Its Key Role in Regulation of Cell Immunity and Apoptosis. Front Immunol 9. [CrossRef]
- Y, K. , and Cd, H. (2010). An improved bimolecular fluorescence complementation assay with a high signal-to-noise ratio (Biotechniques).
- Yue, L. , Li, L., Li, D., Yang, Z., Han, S., Chen, M., Lan, S., Xu, X., and Hui, L. (2017). High-throughput screening for Survivin and Borealin interaction inhibitors in hepatocellular carcinoma. Biochemical and Biophysical Research Communications 484, 642–647. [CrossRef]
Figure 1.
Different layers of macromolecular complex characteristics. Complex composition (A) encompasses the list of complex constituents. Complex stoichiometry (B) defines the abundance of constituents relative to each other, while the copy number (C) quantifies the absolute number of constituents per complex. Complex topology (D) describes the spatial setup of the constituents in the complex. Complex dynamics (E) represent the alterations in composition, stoichiometry, and topology over time. Reprinted from figure 1 in (Wohlgemuth et al., 2015).
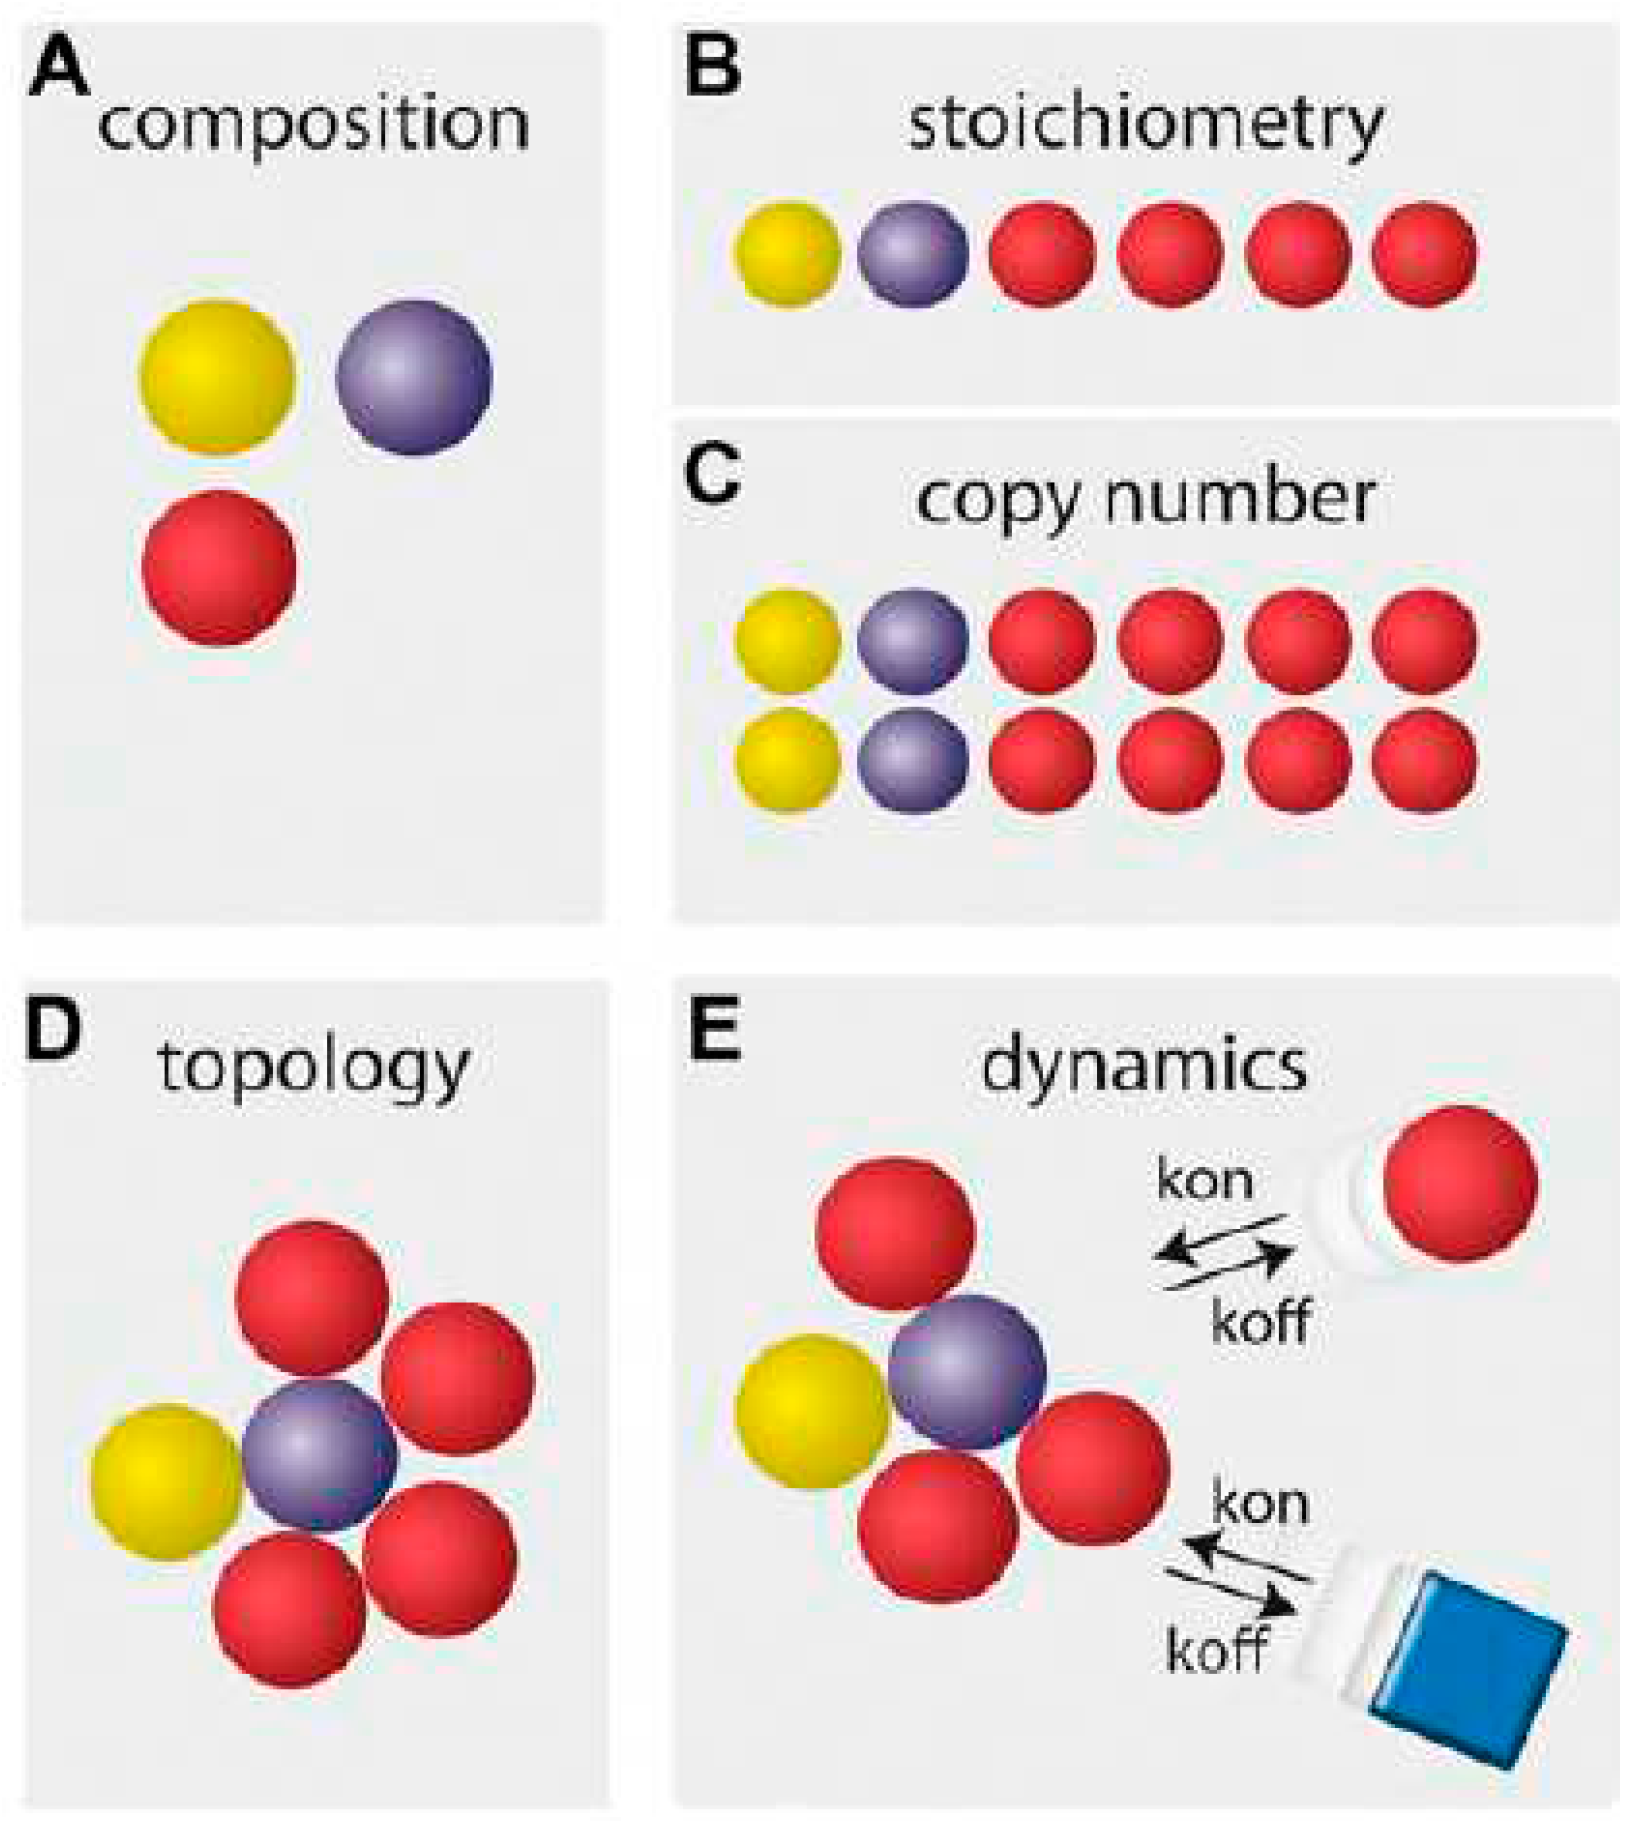
Figure 2.
Hypothesis model and preliminary results of dose-dependent effect in binary PPI. (A) Model of Dose effect in binary PPI. (Upper) Protein A and B as putative interaction partners. Depending on the stoichiometry of A/B complex, the status of A/B abundance ratio was defined as “Balance”, “Moderate imbalance” and “Severe imbalance”. The resulting phenotypes was assigned to different numbers: “1” indicates that the A/B complex was localized in nucleus, upon their interaction. “2” refers to a transitional change of A/B complex localization from nuclus to cytoplasme. “3” means a cytoplasmic localization of A/B complex. The letter size represents the relative abundance comparing to A or B. The bigger size, the higher relative expression in cells. (Lower) For example, in “Balance” range, HOX/cofactor interaction occurs in nucleus, as phenotype “1”. Along with the A/B abundance ratio changing, the corresponding phenotypes will turn: “2” to “3”. (B) The BiFC test in VN-HOXA9 stable cell line. CC-PBX1 was transiently expressed in cells by transfection, under control of Dox concerntraiton. The expression of CC-PBX1 increased in paralle with Dox increasing, resulting in “Moderate imbalance” between HOXA9 and PBX1. A represents VN-HOXA9, B refers to CC-PBX1. (C) BiFC assay for interaction of VN-HOXA9 and CC-PBX1. Expression of VN-HOXA9 was controlled by Dox concentration. CC-PBX1 and VN-HOXA9 was coexpressed in HEK cells by transfection. The BiFC under different Dox concentrations generated three distinct phenotypes, according with dose-dependent model.
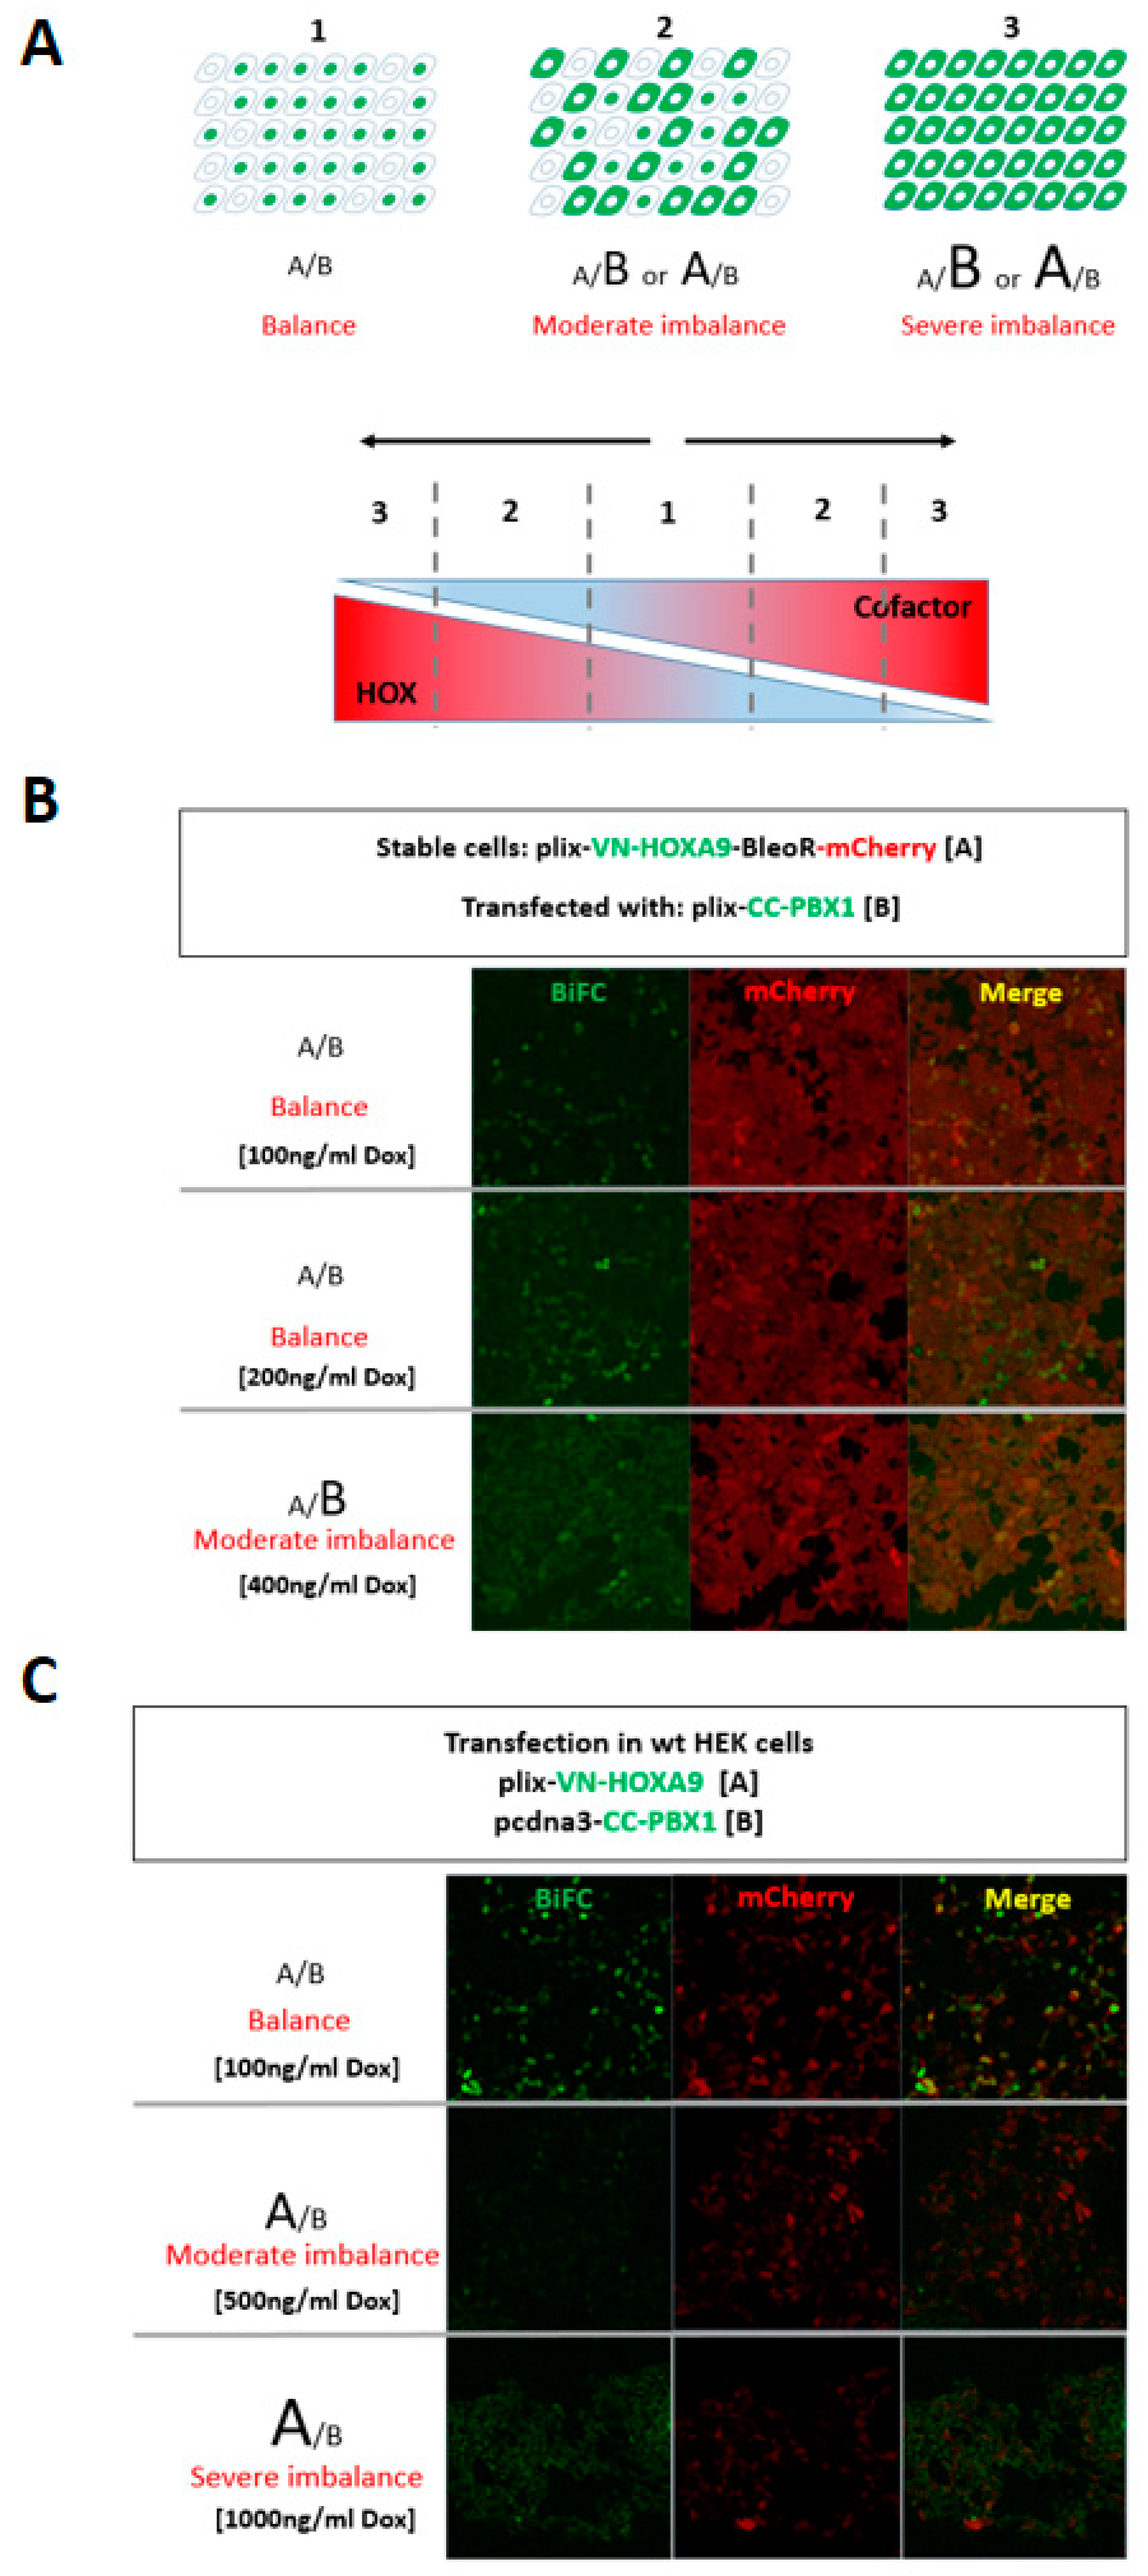
Figure 3.
Schematic of splitFAST-based BiFC screening. (A) Using the Cell-PCA strategy, C-terminal FAST (CFAST)-tagged prey cell library was coexpressed with N-terminal FAST (NFAST) bait protein after HMBR treatment (not shown in the figure). The GFP+ cells were sorted and collected after first round FACS. (B) The GFP+ positive cells will be treated with a given PPI inhibitor to reverse the positive protein interactions, leading to the loss of fluorescence. Only the PPI-independent non-specific signals exist in the cell population. Through the second cell sorting, the true interactor-containing cells with GFP- were sorted and collected. FAST, the fluorescence-activating and absorption shifting tag (Tebo and Gautier, 2019). HMBR, 4-hydroxy-3-methylbenzylidene rhodanine, which provides green-yellow fluorescence.
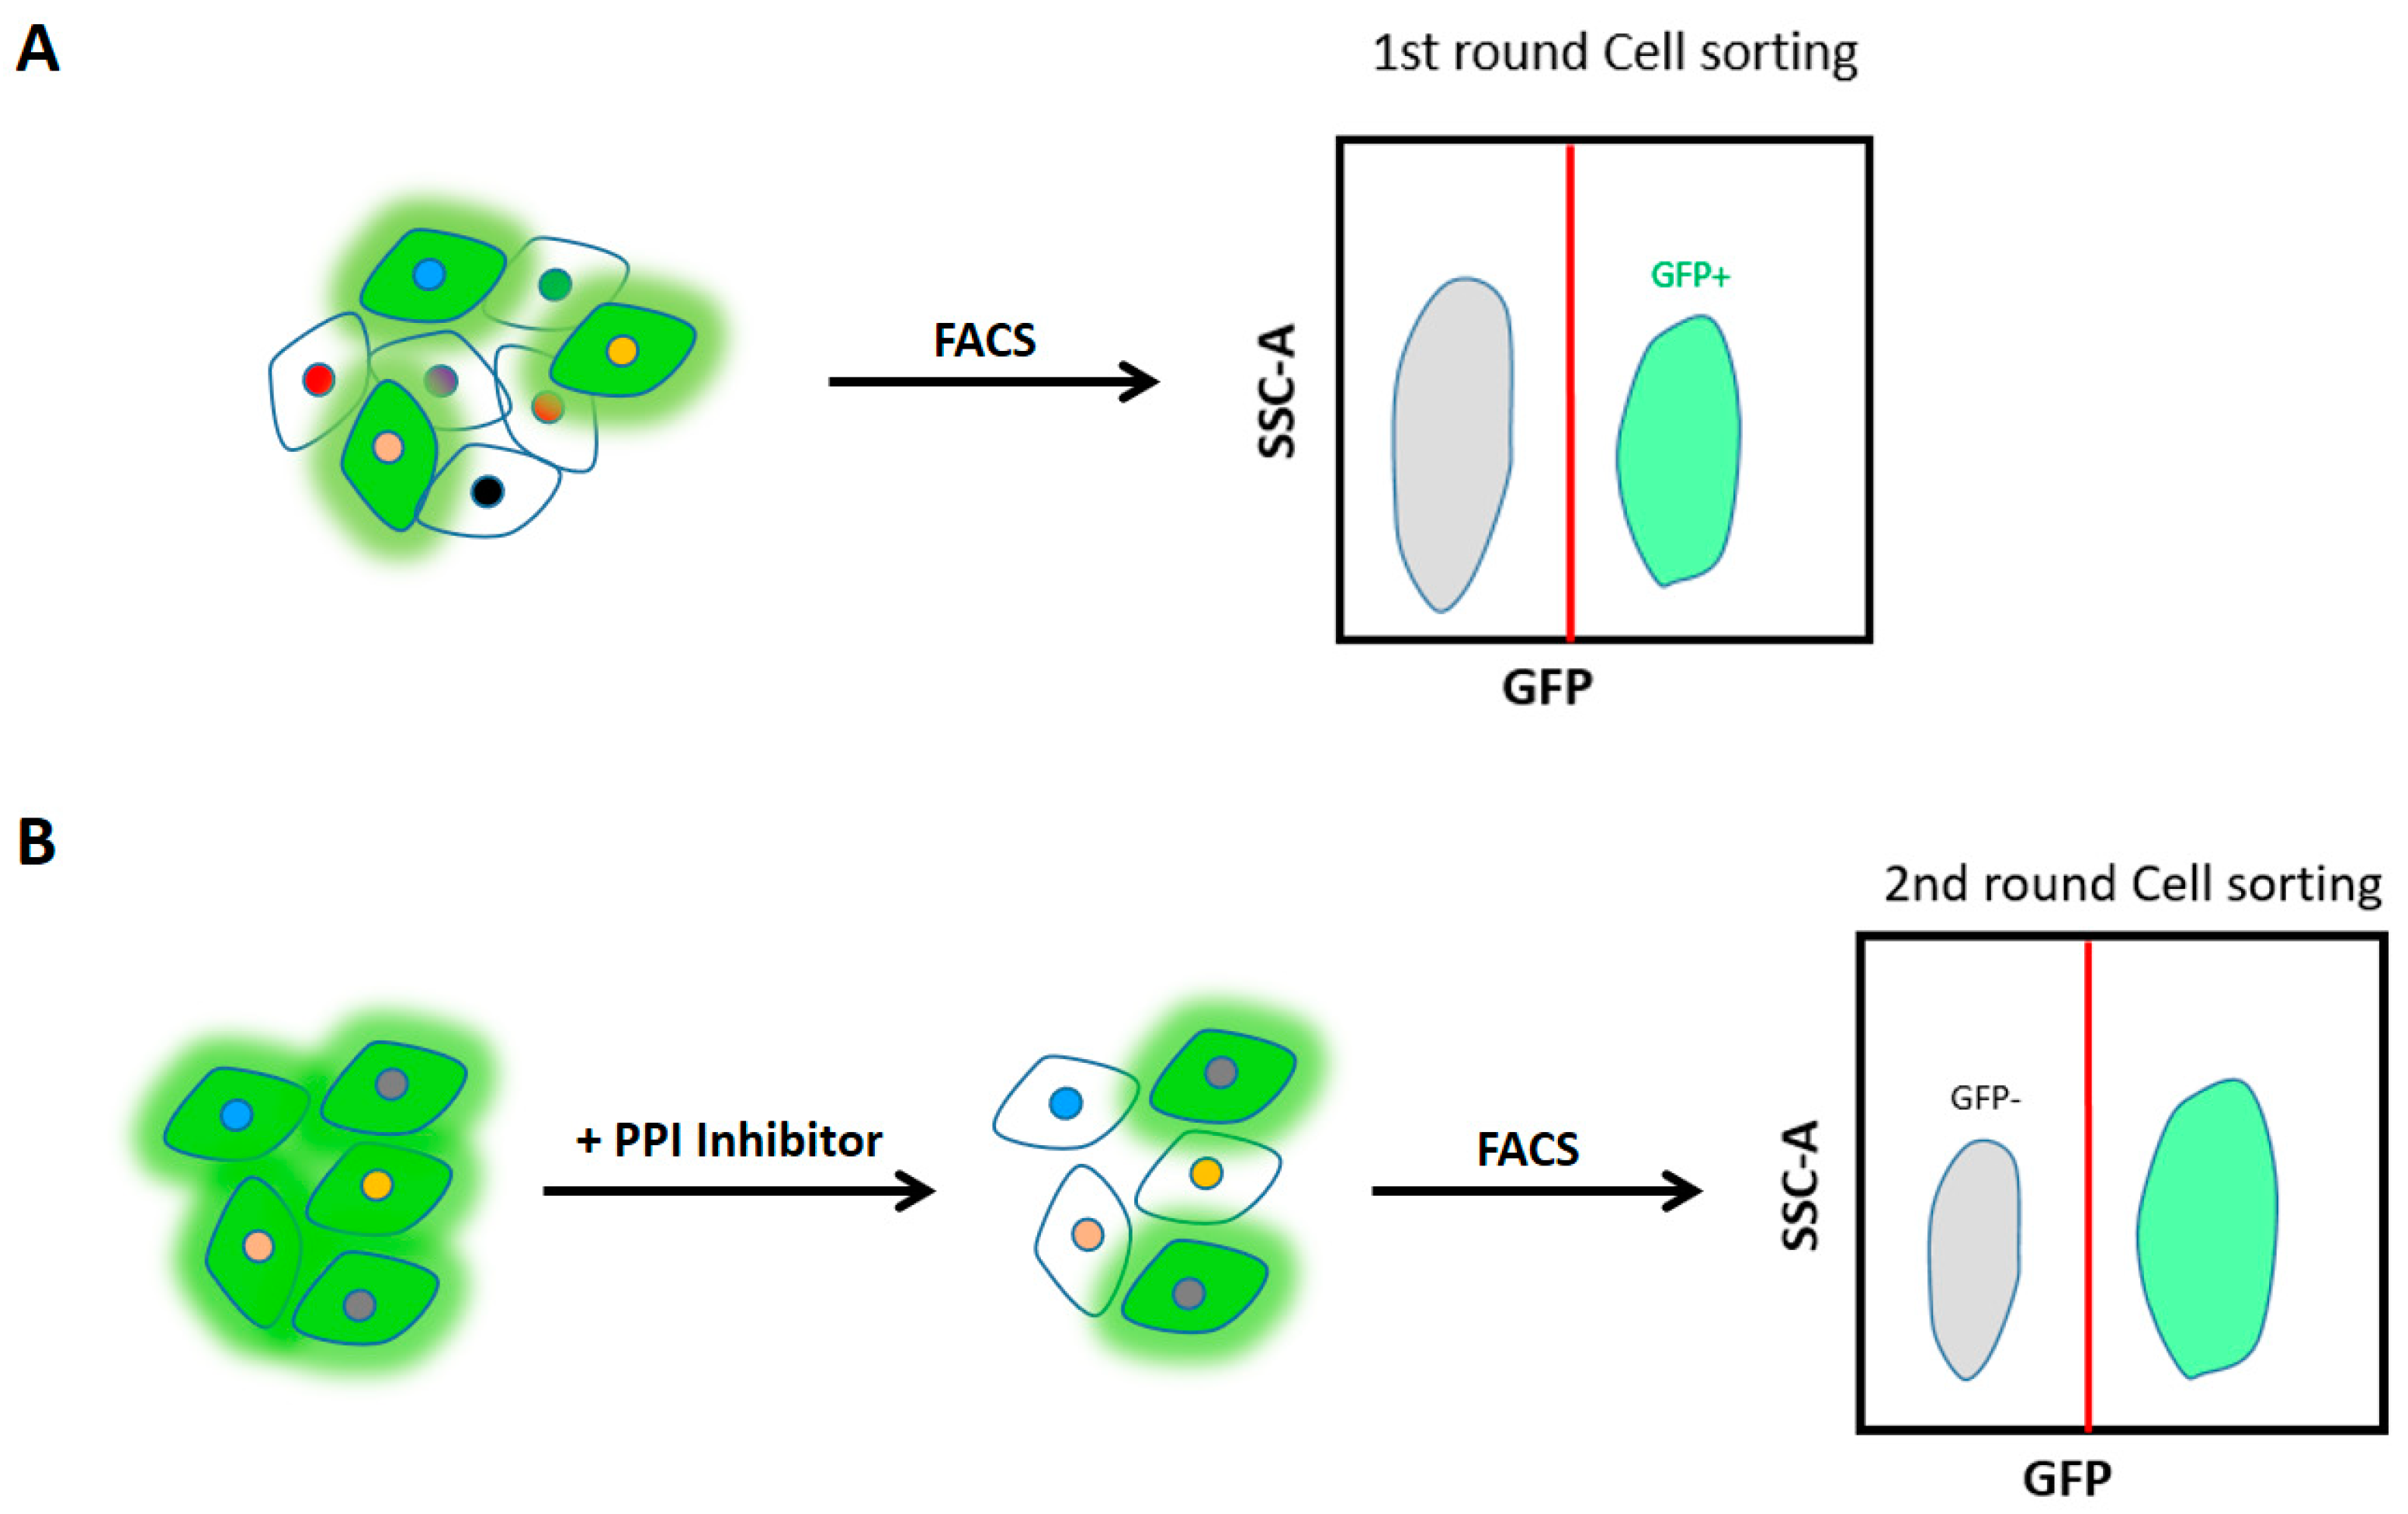
Figure 4.
The strategy of high-throughput multicolor BiFC, examplified by HOXA9 and PBX1. (A) Schema of plasmid construction, illustrated by bait proteins, VN-HOXA9 and CN-PBX1. All constructs are controlled by the Tet-On system, driving the gene expression in presence of Dox. (Upper) Bi- PTRE promotor conducts the tagged bait proteins (VN-HOXA9 and CN-PBX1) at the same time. mCherry element is used as an expression marker of target bait proteins, controlled by an independent hPGK promotor. (Lower) CC-tagged ORFeome (prey) plasmid library was made by Gateway cloning, as described previously. Ptight-TRE, Tet-responsive tight promoter as 2nd generation doxycycline-inducible version, consisting of seven tet operator sequences followed by the minimal CMV promoter. VN, the N-terminal fragments of Venus, 1-173aa. CN, N-terminal fragment of Cerulean, 1-173aa. CC, C-terminal fragment of mCerulean, 155-238aa. T2A, self-cleaving 2A peptides. (B) The red fluorescent cells represent the bait/prey coexpressed cell population, which can be further gated in mCherry+. Upon these mCherry+ cells, multiple gating can be used, dividing total mCherry+ cells into 4 different populations in 4 different quadrants. CC/VN, as GFP+/Cerulean- cell population, represents HOXA9 interacting CC-ORF candidates (residing in cells). VN/CC/VN, as GFP+/Cerulean+ cell population, indicates HOXA9/PBX1 complex interacting CC-ORF candidates. CC/CN, as GFP-/Cerulean+ cell population, refers to PBX1 interacting CC-ORF candidates. CC, as double negative cell population, no interaction between baits and prey library.
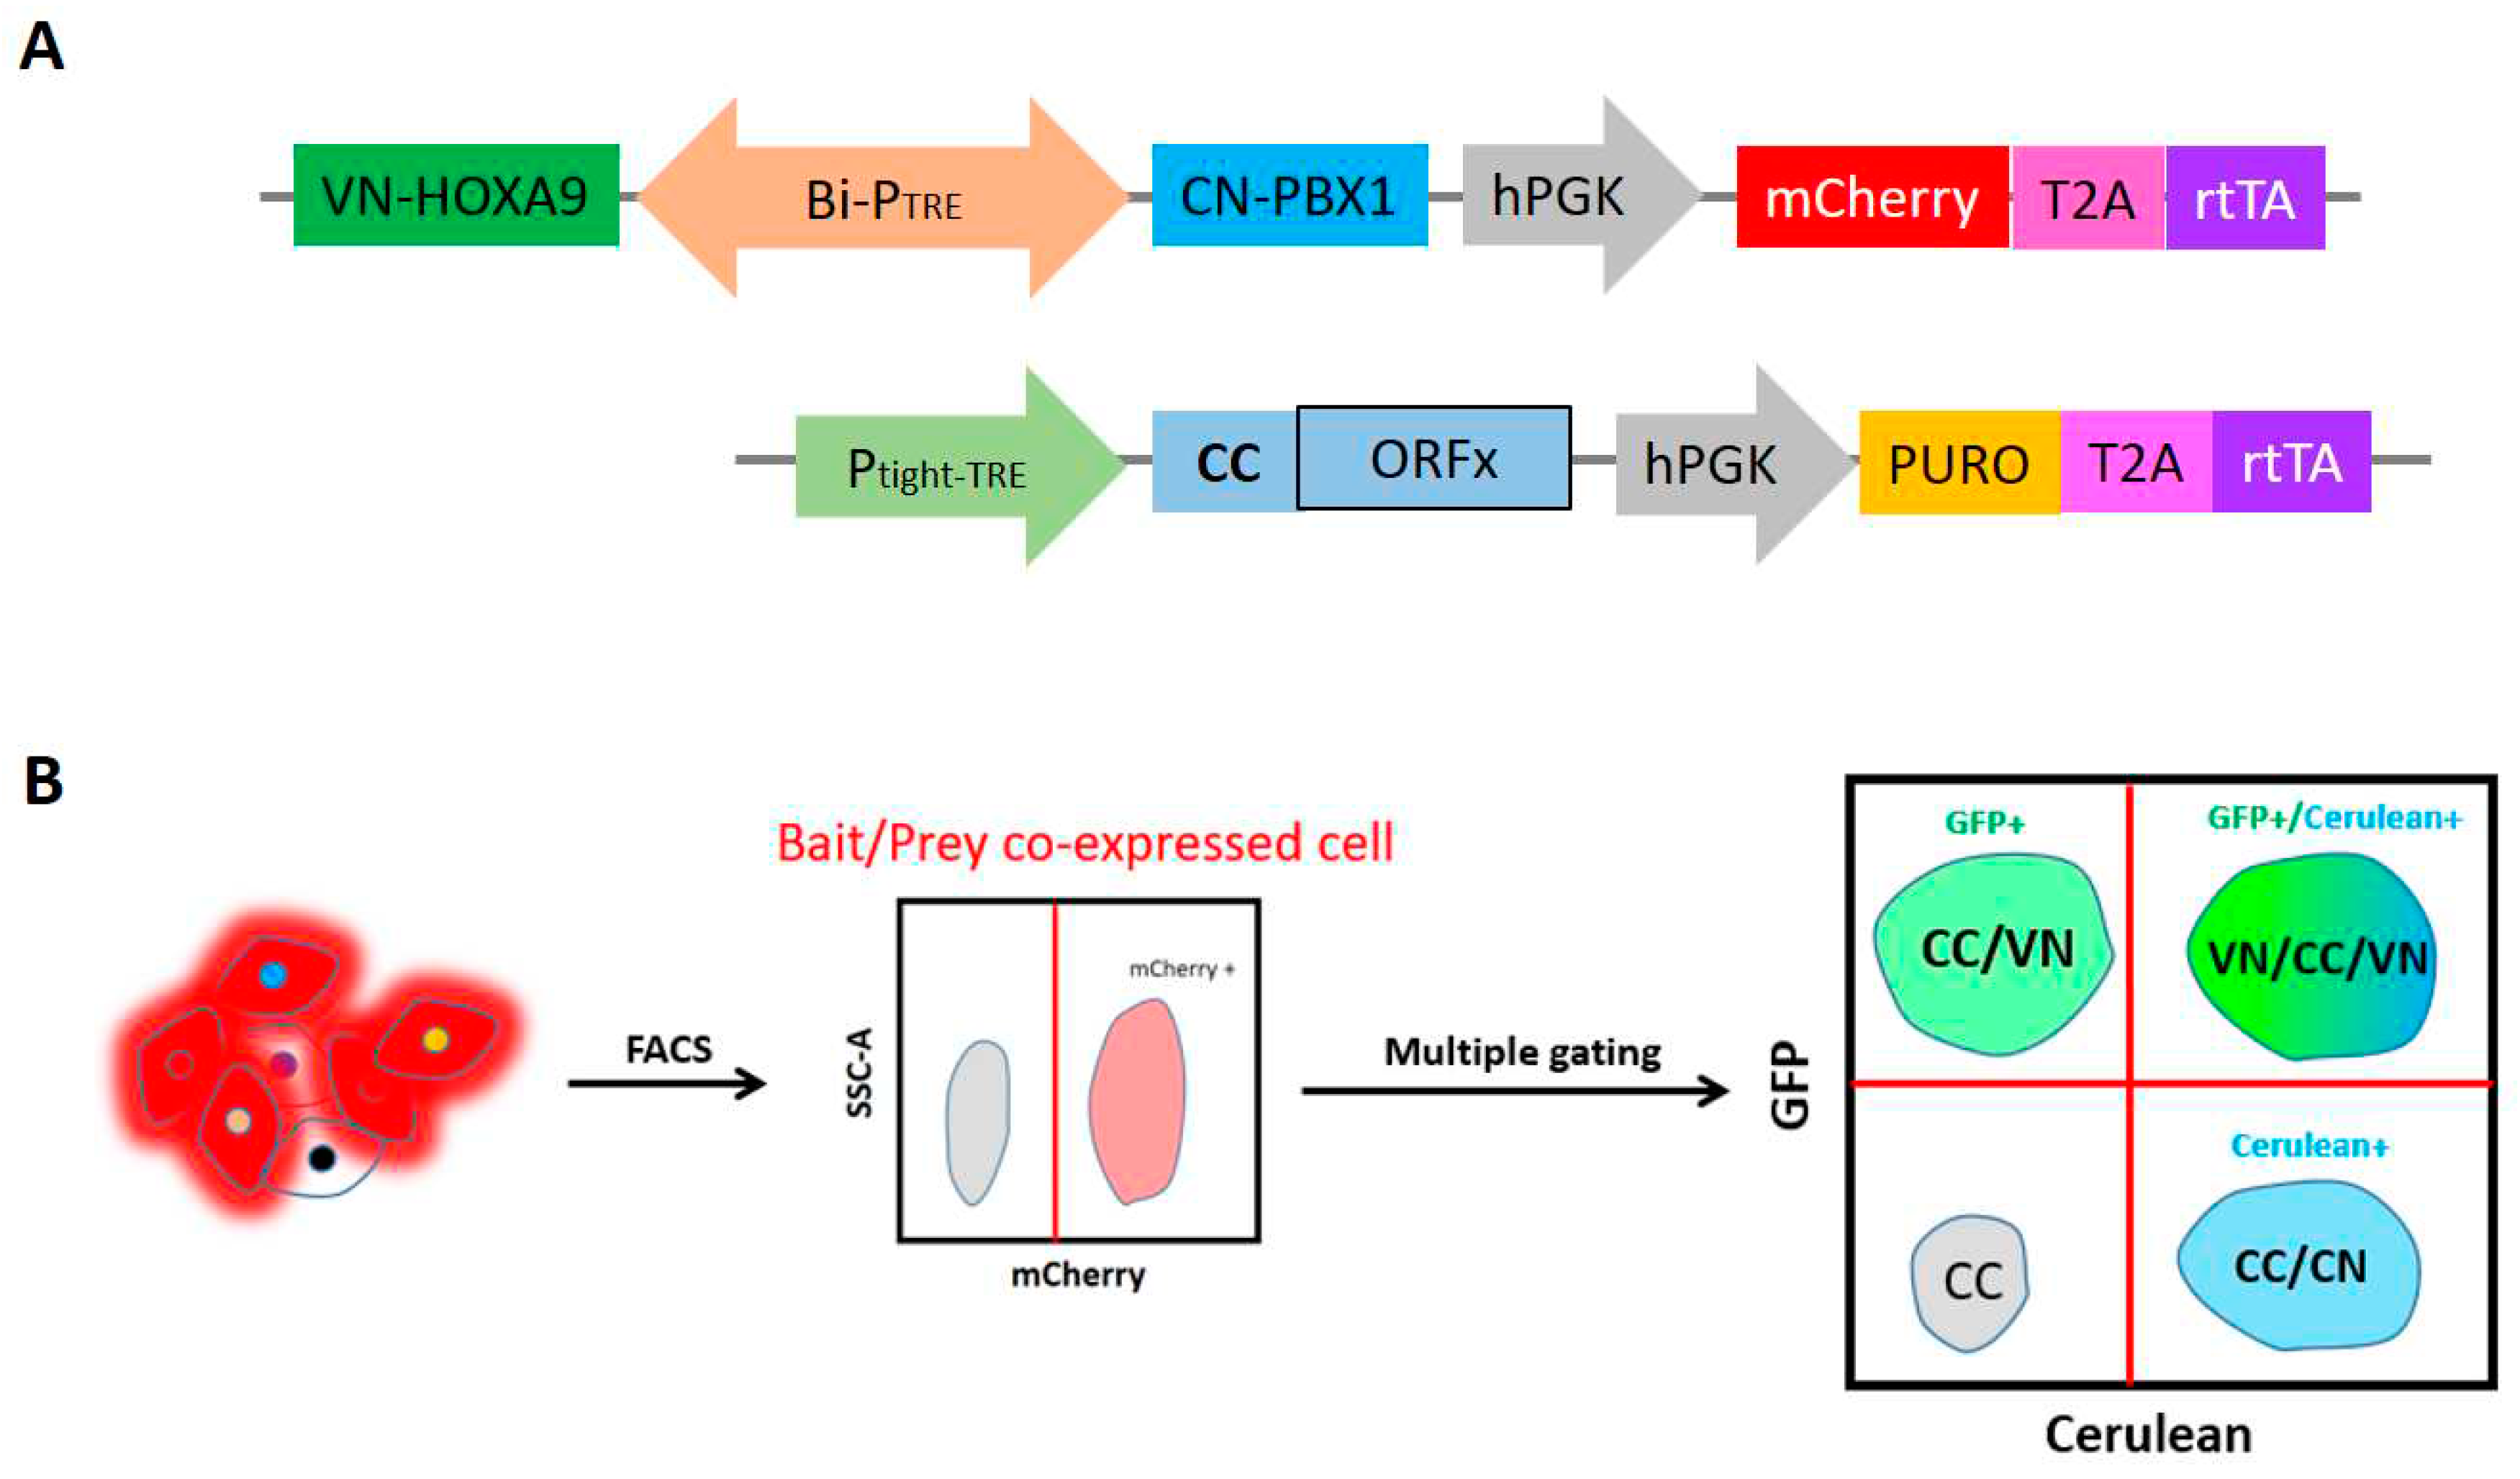
Figure 5.
Schematic of TriFC and preliminary test. (A) Principle of TriFC. beta-strand 10 (GFP10) and beta-strand 10 (GFP11) are fused to bait A and prey B proteins, respectively and the detector fragment GFP1–9 is added separately. When protein interaction occurs, GFP10 and GFP11 are tethered and then spontaneously associate with GFP1–9 fragment to form a full-length GFP. GFP10, 194–212aa. GFP11, 213–233aa. GFP1-9, 1–193aa. OPT, optimized. Adapted from figure 1 in (Cabantous et al., 2013). (B) Illustration of constructs for TriFC. The HOXA9 was fused to GFP11 by a linker, and labeled by HA tag used for further immunostaining test. GFP10 was fused to PBX1 at its N-terminus, coupled with V5 tag for next immunostaining. The functional cassettes were outlined by grey dashed boxes. Detector fragment GFP1-9 was fused to mCherry reporter. All constructs were cloned in pcdna3 plasmid and conducted by CMV promoter. (C) Preliminary test for TriFC. All plasmids were transiently expressed in HEK cells using Jetprime, as described previously. Each plasmid used in different conditions is 0.5ug. (Up panel) GFP11 and GFP10 were coexpressed in HEK cells, to check the background, when GFP1-9 is absent. pcDNA3-mCherry was cotransfected, using for transfection system control. (Middle panel) Single GFP1-9 was transfected to check the background in absence of GFP10 and GFP11. Only the GPF channel needs to be checked. (Bottom panel) complete TriFC system was tested by coexpressing 3 parts of split-GFP. Finally, the moderate GFP-positive signals were generated. Scale bar = 50 μm.
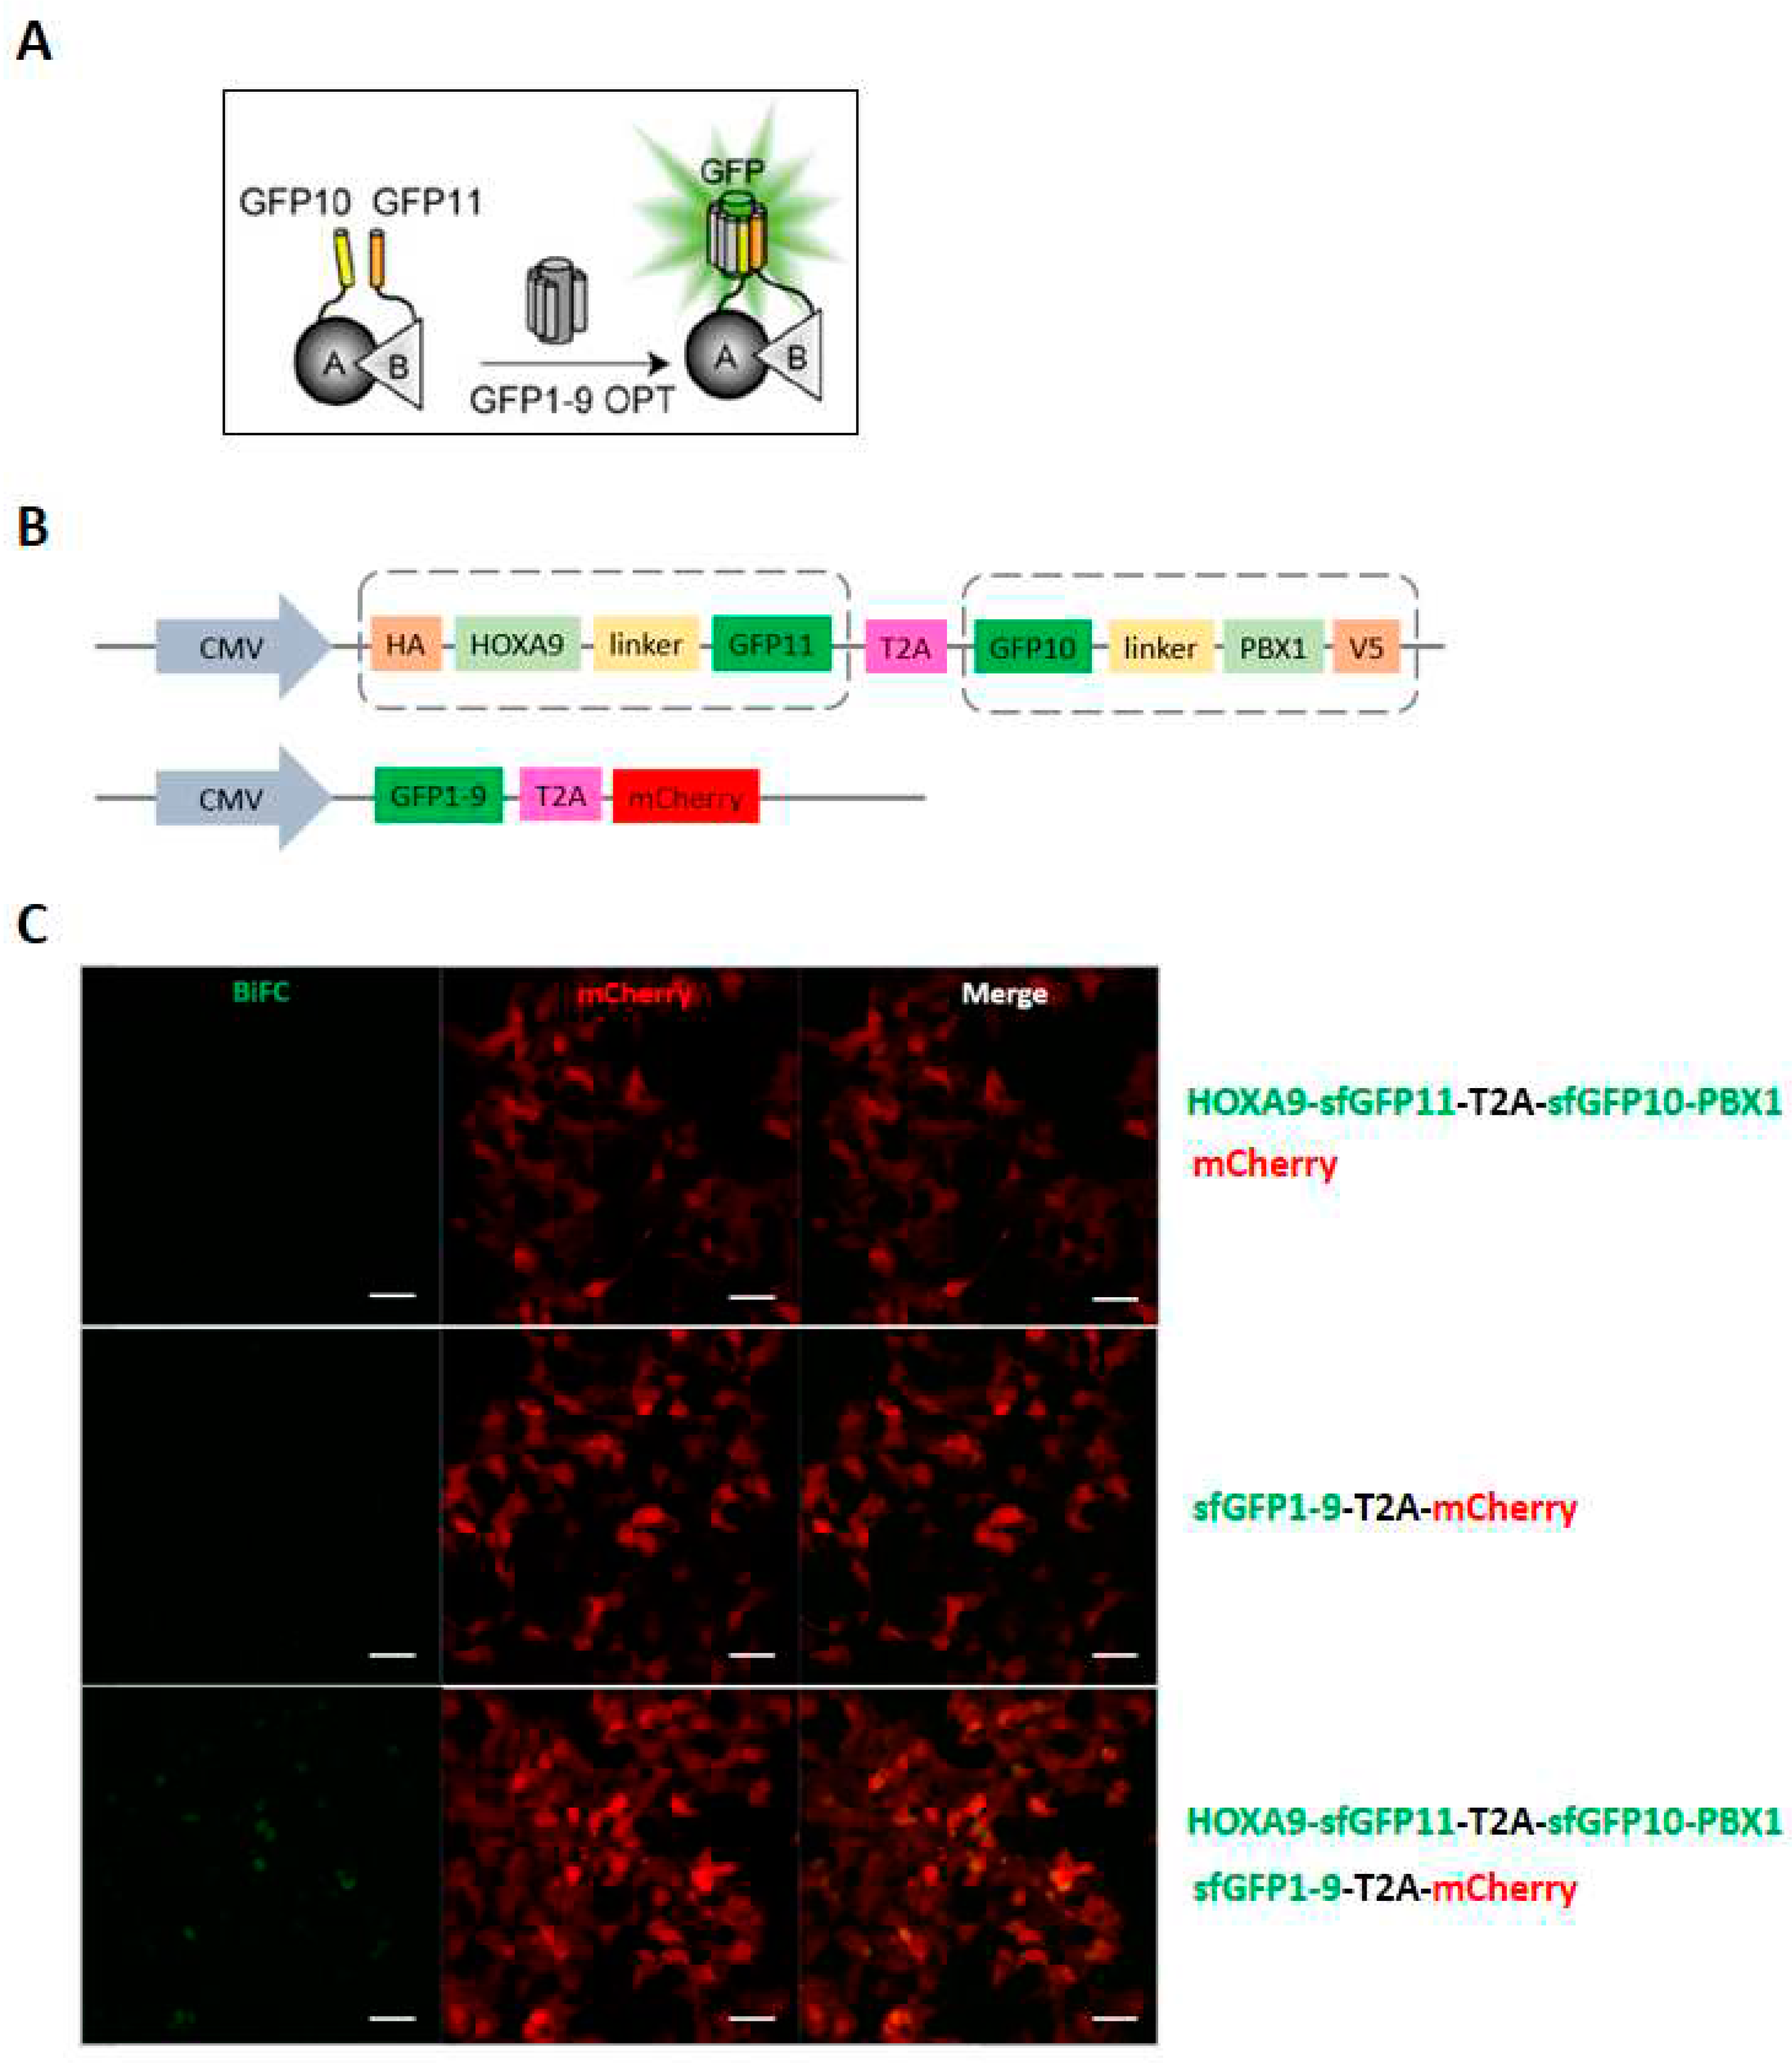
Figure 6.
Calculation of the Weighted Positive Ratio (WPR) and positive ratio (PR). Comparison of WPR and the Positive Ratio (PR) for two hypothetical profiles. (Left) PR= 0.1. (Right) PR = 0.29. Adapted from figure S3 in (Lee et al., 2011).
Figure 6.
Calculation of the Weighted Positive Ratio (WPR) and positive ratio (PR). Comparison of WPR and the Positive Ratio (PR) for two hypothetical profiles. (Left) PR= 0.1. (Right) PR = 0.29. Adapted from figure S3 in (Lee et al., 2011).
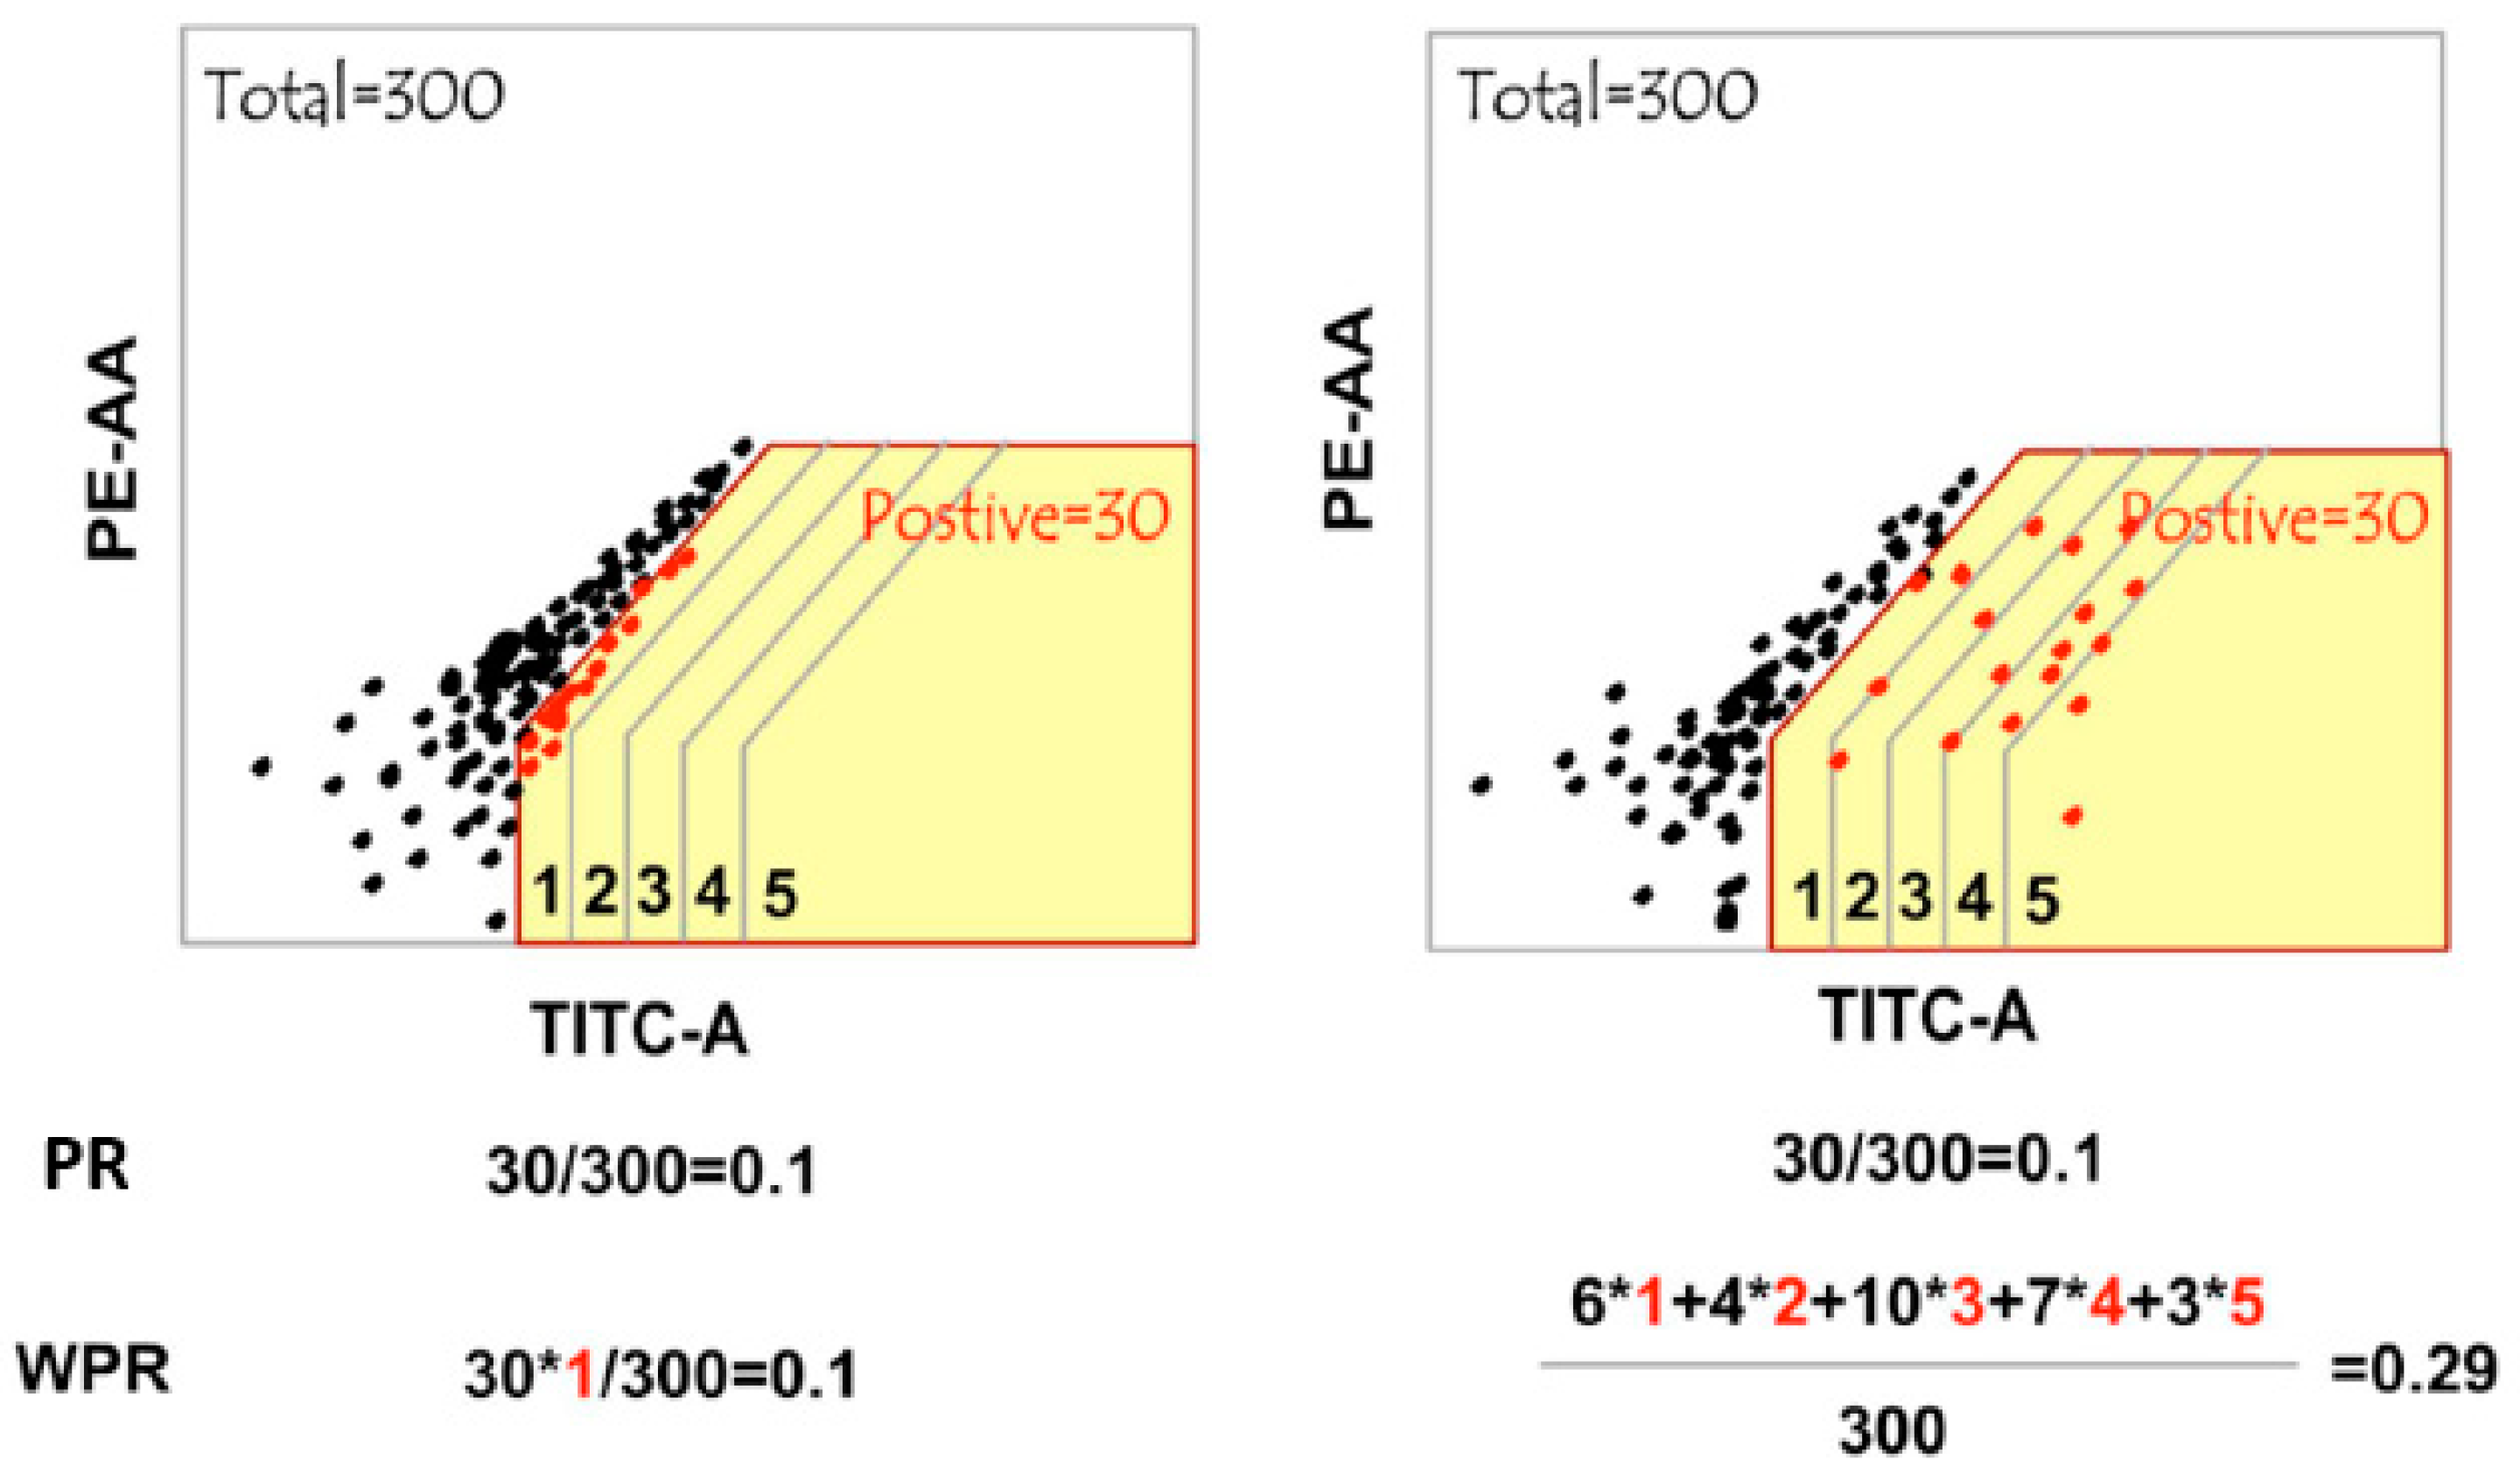
Figure 7.
Protein complexome in cell, illustrated by protein A. The protein complexome refers to the entire set of protein complexes produced in a cell. Each protein has its specific complexome composed of many individual protein complexes. For example, (Centre) protein A complexome is a collection of protein A complexes, potentially, localized in various cellular compartments, including nucleus, cytoplasm, membranes and membrane-bound organelles (not shown). (Left) Protein A interactome includes all protein A interacting proteins in a specific biological context, which can be detected by either co-complex manner (e.g. AP-MS or BioID) or binary PPI screens (e.g. Cell-PCA). The individual protein A complex can perform biological functions in a DNA-binding or -free fashion. (Right)The former, as genome locus-specific protein factors can be deciphered by reverse ChIP method.
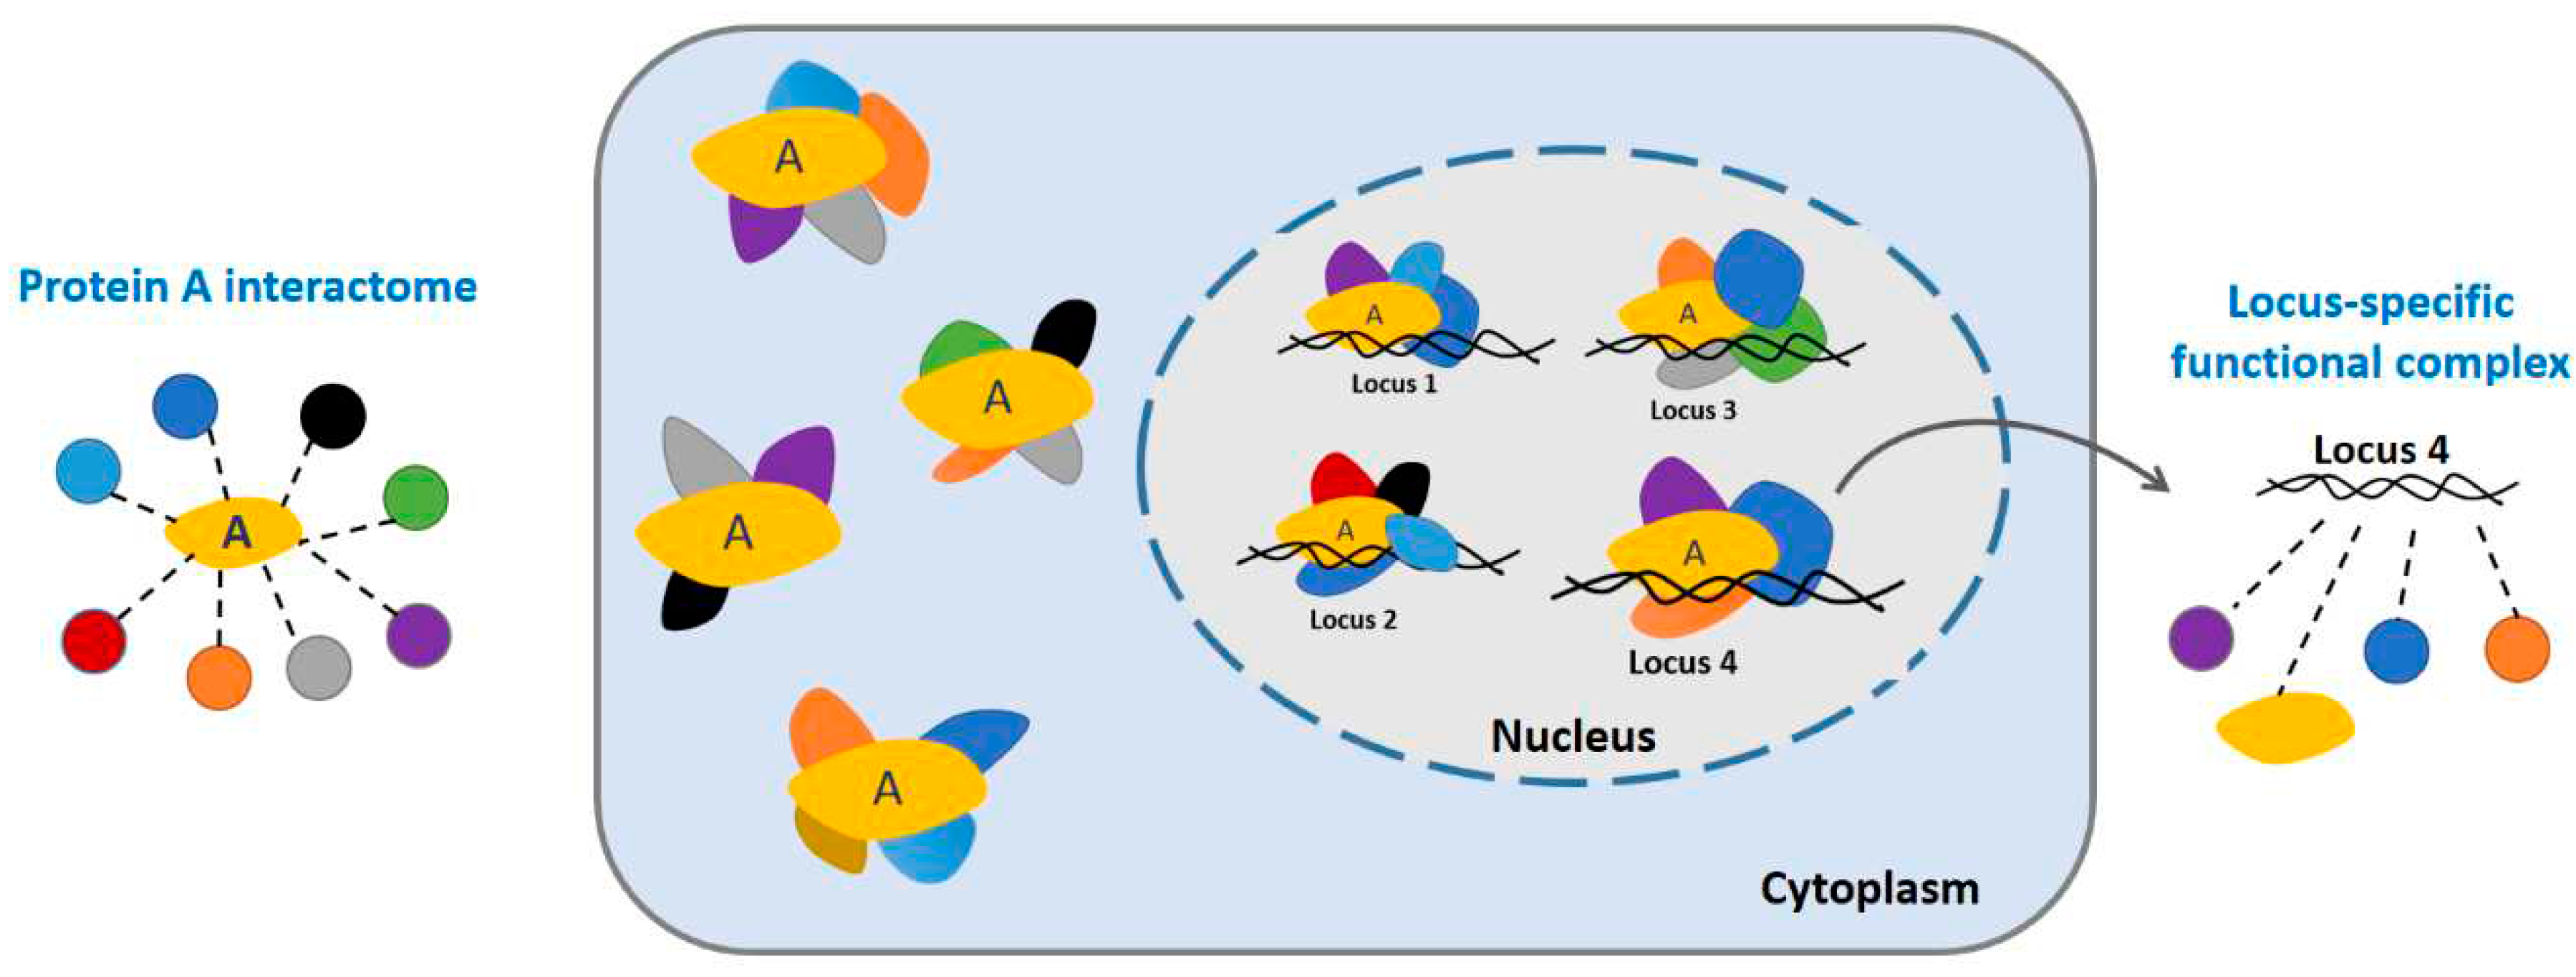
Figure 8.
Schematic of barcoded CC-ORF library generation and capture of ORF candidates during scRNA-seq. (A) Construction of Gateway-compatible pooled barcode library (CC tagging). Prior to barcode sequence integration, the plasmid was inserted with a CC155 fragment (between TRE promotor and Gateway cassette) and UTR-PolyA sequence (between Gateway cassette and PGK promotor). 24 or 30mer barcodes of random sequence were PCR amplified and cloned into plix-CC-Gateway-UTR-PGK-Puro-DEST vector, using rare unique restriction sites I-CeuI and I-SceI. LTR, long terminal repeat; TRE, tetracycline responsive element; UTR, 3′ untranslated region; PolyA, an SV40 polyadenylation signal; PGK, phosphoglycerate kinase 1 promoter; Puro, puromycin resistance gene. (B) Construction of barcoded CC-ORF library expression vector. ORF collections were cloned into Gateway DEST site by LR recombination. The CC-ORF-BC plasmid DNA was then sheared and size-selected to recover 350-550 bp fragments (not shown). Through Illumina paired-end sequencing, allowing identification of the BC sequences uniquely paired to each ORF. (C) Schematic of lentiviral CC-ORF-BC vector and capture of CC-ORF-BC transcript during scRNA-seq. The final pooled CC-ORF-BC library will be used to produce lentivirus, for generating barcoded prey cell libraries. After co-expressed with corresponding tagged bait (VN tagging), the cell library will be sorted by FACS. Fluorescence-positive cells, with paired control, will be used for 10X single cell 3’ gene expression library preparation. The final ORF hits will be deconvolved by BCs. UMI, Unique Molecular Identifier. Adapted from figure 1 in (Parekh et al., 2018).
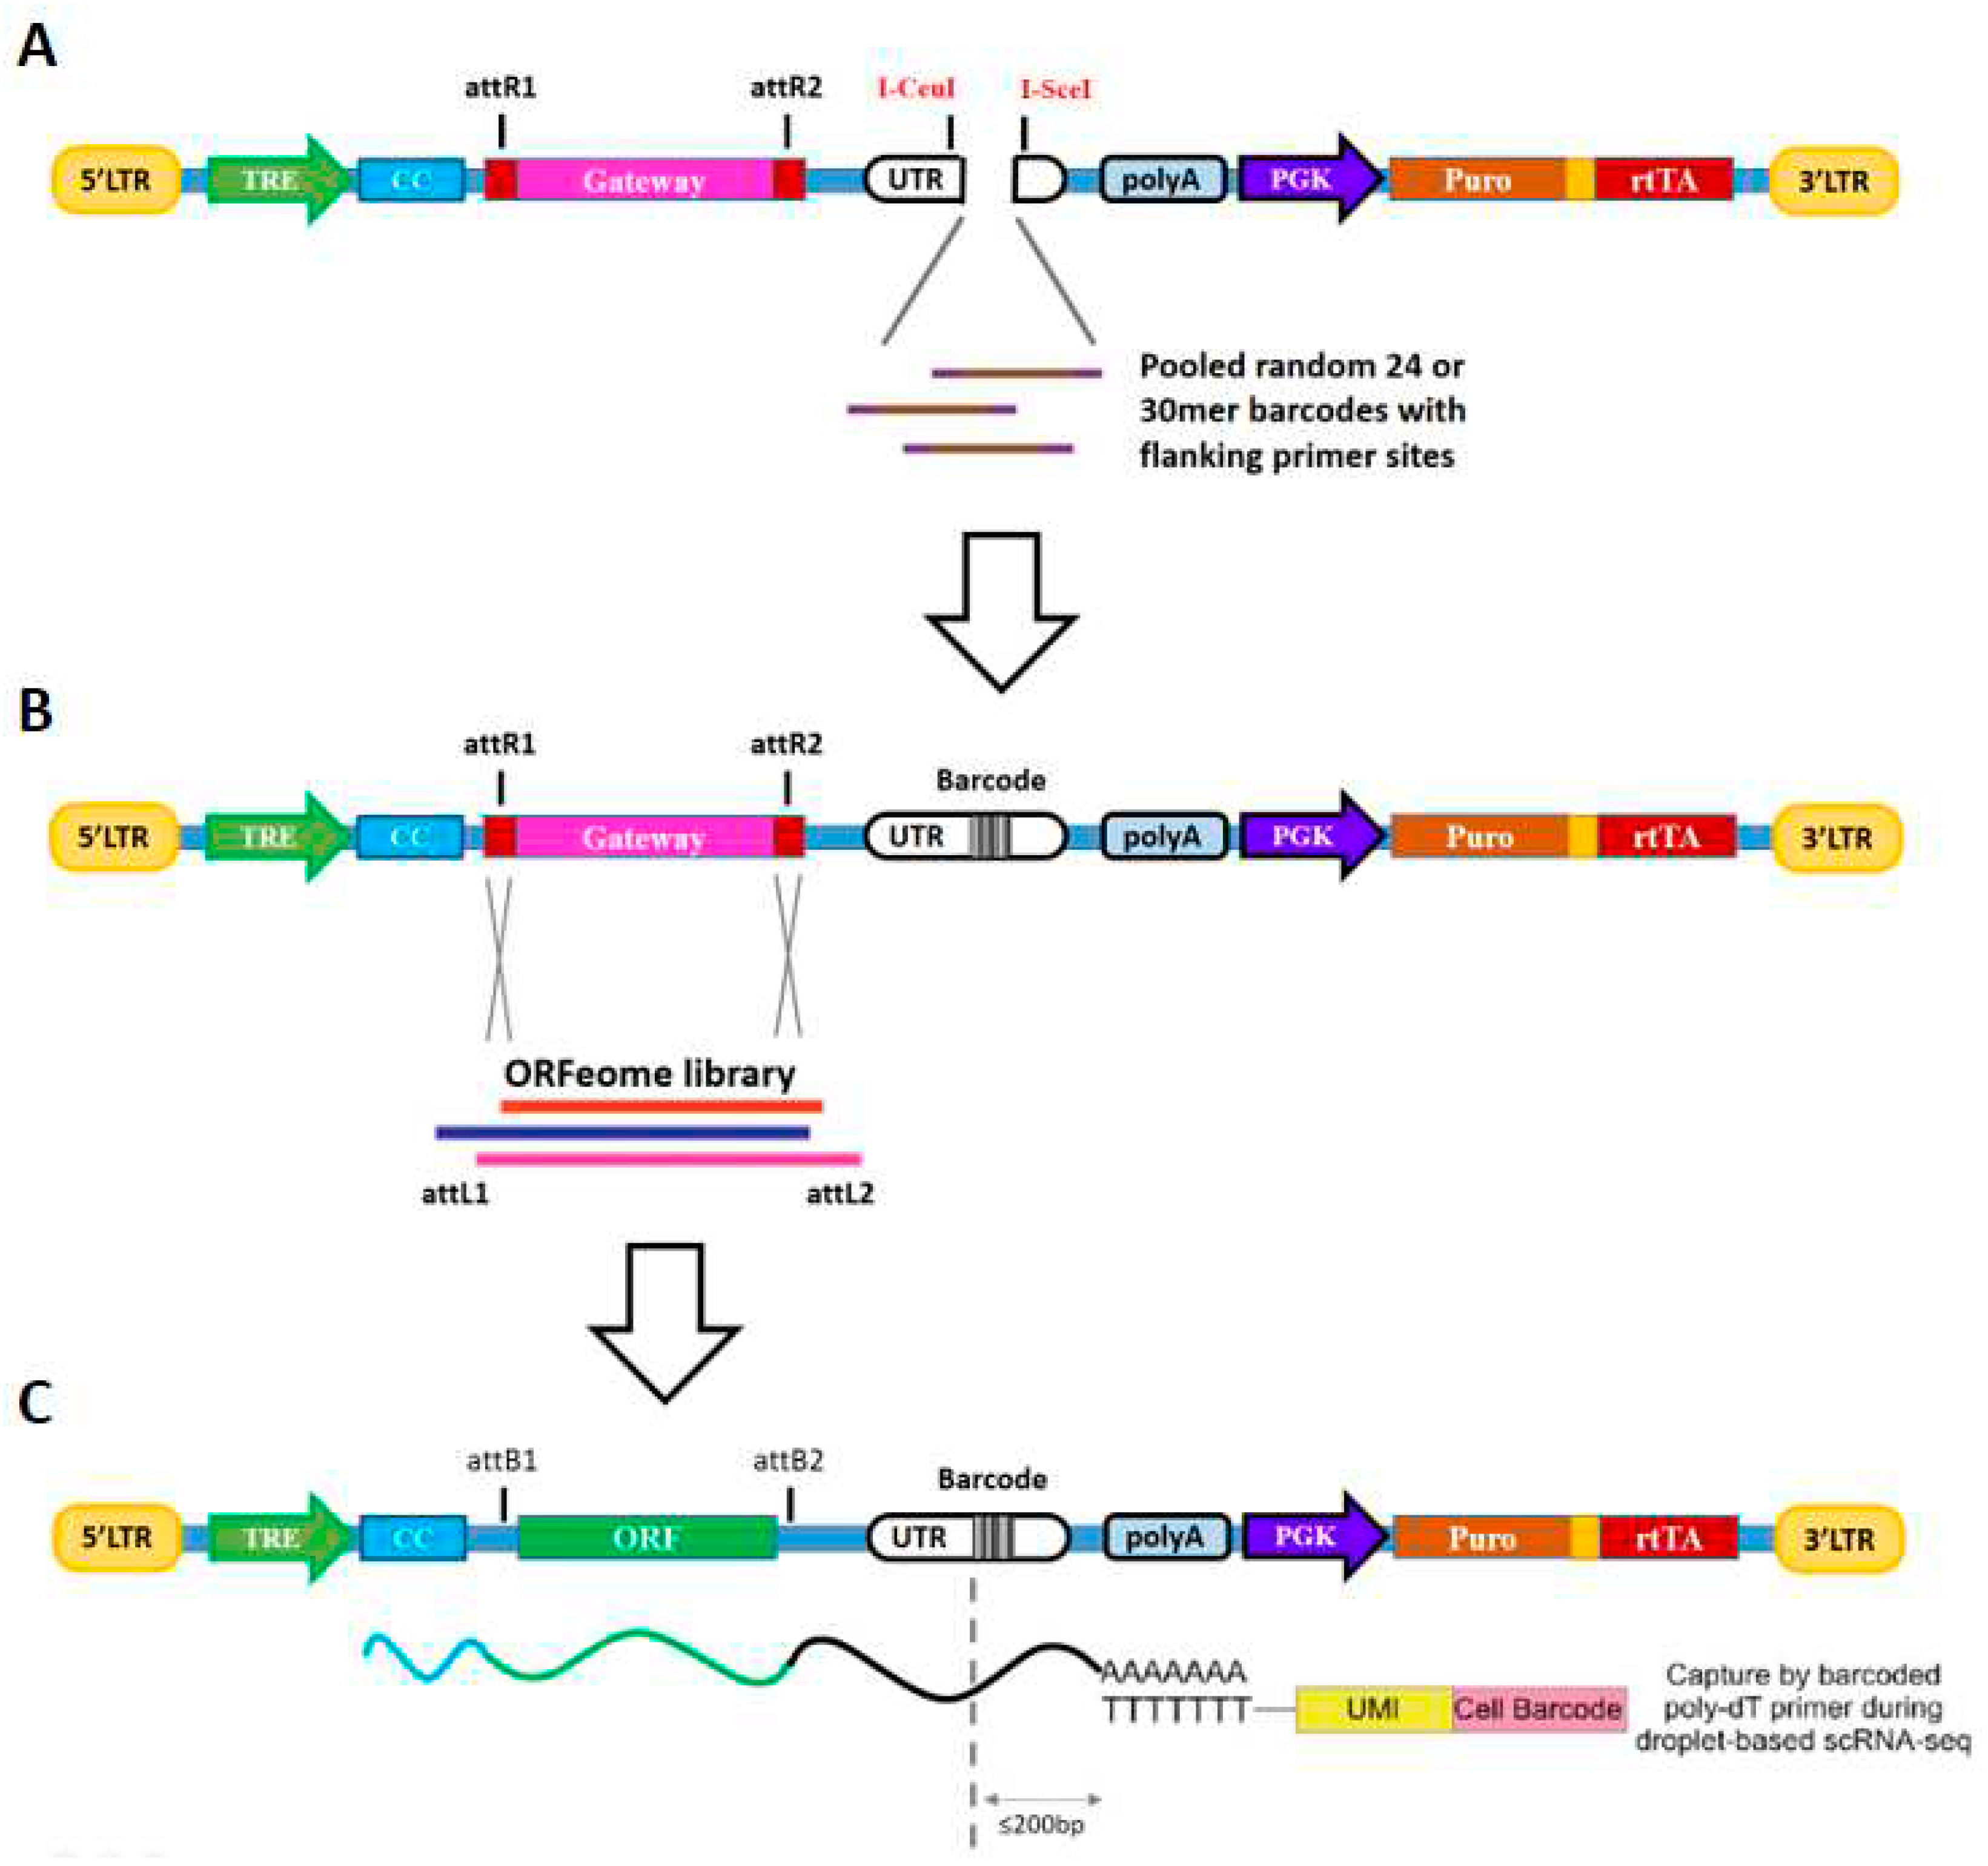
Figure 9.
General workflow of a co-elution experiment. The lysed sample containing protein complexes under native conditions is separated in a set number of fractions. Proteins from the same complex show the same co-elution profile after a bioinformatic analysis to extract an interactome map, including single protein complex info. Adapted from figure 1 in (Salas et al., 2020).
Disclaimer/Publisher’s Note: The statements, opinions and data contained in all publications are solely those of the individual author(s) and contributor(s) and not of MDPI and/or the editor(s). MDPI and/or the editor(s) disclaim responsibility for any injury to people or property resulting from any ideas, methods, instructions or products referred to in the content. |
© 2023 by the authors. Licensee MDPI, Basel, Switzerland. This article is an open access article distributed under the terms and conditions of the Creative Commons Attribution (CC BY) license (http://creativecommons.org/licenses/by/4.0/).
Copyright: This open access article is published under a Creative Commons CC BY 4.0 license, which permit the free download, distribution, and reuse, provided that the author and preprint are cited in any reuse.


