1. Introduction
Microbes, commonly referred to as microorganisms, harbor the potential to constitute a hazard to both human well-being and ecological systems. Among the array of risks they pose, a significant concern involves their role in the emergence of diverse human ailments. These illnesses encompass conditions such as dysentery, tuberculosis, pneumonia, sepsis, typhus, diarrhea, and tetanus [
1]. Moreover, the detrimental impacts of microorganisms extend to the realm of agriculture, specifically concerning the process of soil desalination [
2]. One type of microbe that poses a threat is bacteria in water [
3]. According to the World Health Organization (WHO), approximately 2 billion people worldwide consume feces-contaminated water, which is estimated to cause 525,000 deaths among children under five due to diarrhea. The results of the World Bank report state that poor water quality can limit economic growth, hinder human potential, and obstruct food production [
4].
Bacteria are microscopic organisms that cannot be seen with the naked eye. They are often identified using a microscope, but this process can be time-consuming and labor-intensive. Automatic identification of bacteria in water is a promising new technique that has the potential to improve the speed and accuracy of bacterial identification. Conventional methodologies for identifying bacteria, conducted within laboratory confines, frequently hinge on the expertise of laboratory personnel, engendering notable disparities in outcomes. Moreover, this laboratory-centric approach mandates the adoption of resource-intensive protocols characterized by their high costs and time demands [
5]. Therefore, an artificial intelligence system is needed that can identify bacteria automatically.
Artificial intelligence (AI) systems have emerged as an appealing choice for the purpose of bacterial identification [
4]. In its implementation, one of the important stages is the extraction of bacterial features. The purpose of this feature extraction is to isolate and extract the distinctive features of the bacteria used in the identification process. There are three general categories in feature extraction for the automatic classification of bacteria. First, the category of statistical approaches; second, machine learning techniques such as artificial neural networks and supporting vector machines (SVM); and third, geometric feature extraction from input images [
6].
Panicker and colleagues [
7] proposed an approach for the automatic detection of tuberculosis bacteria from microscopic images of speckled sputum using geometric features, including color averaging of the extracted images. This study shows that color features have discriminatory properties and have a significant effect on improving image recognition. On the other hand, Luo et al. [
8] used segmented images to extract the shape and size of microorganisms and then classify them based on their type. Ernest Bonah [
9] introduced an approach to identifying food-related pathogens based on the dispersal patterns of bacterial colonies. They use a group of features that are analyzed using data mining algorithms to reduce feature dimensions, then adopt SVM in the classification stage.
Convolutional Neural Networks (CNNs) have also become an interesting method for feature extraction and classification of bacterial images [
10]–[
14]. In addition to pre-processing approaches such as segmentation, CNN also utilizes data augmentation and transfer learning to improve the ability to classify and identify images. Despite having a high success rate in classification, this approach requires significant computational power and is often time-consuming. In addition, the success of CNN in the classification task requires computer hardware with a high configuration, such as a graphics processing unit (GPU) or multi-CPU, to complete the task properly.
Zieliński et al. [
15] employed the Deep Convolutional Neural Networks (CNN) technique for the recognition of bacterial genera and species. Within this investigation, CNN was utilized to extract distinctive attributes, while the classification phase involved Support Vector Machines (SVM). This approach is associated with limitations, including substantial resource consumption, a need for enhanced accuracy, and struggles in discerning-colored bacterial images. These complexities underscore the impetus for continued research in advancing more effective strategies for both feature extraction and classification.
In recent years, various types of orthogonal moments have been developed to describe and extract features from color images, including quaternion moments [
16]–[
20] and multi-channel moments [
21]. Orthogonal functions with an order of fractions have been shown to have a better ability to represent the fine details of a given function compared to functions that have an order of integers. The interesting characteristics of fractional successive orthogonal moments have led the authors to develop Hu Moment Invariants and Zernike moments, which are used to extract fine features from colored images of bacteria.
This study applies feature selection techniques in order to reduce the number of extracted features and ignore irrelevant features [
22]–[
25]. One approach that is currently widely used is the Swarm Intelligence algorithm [
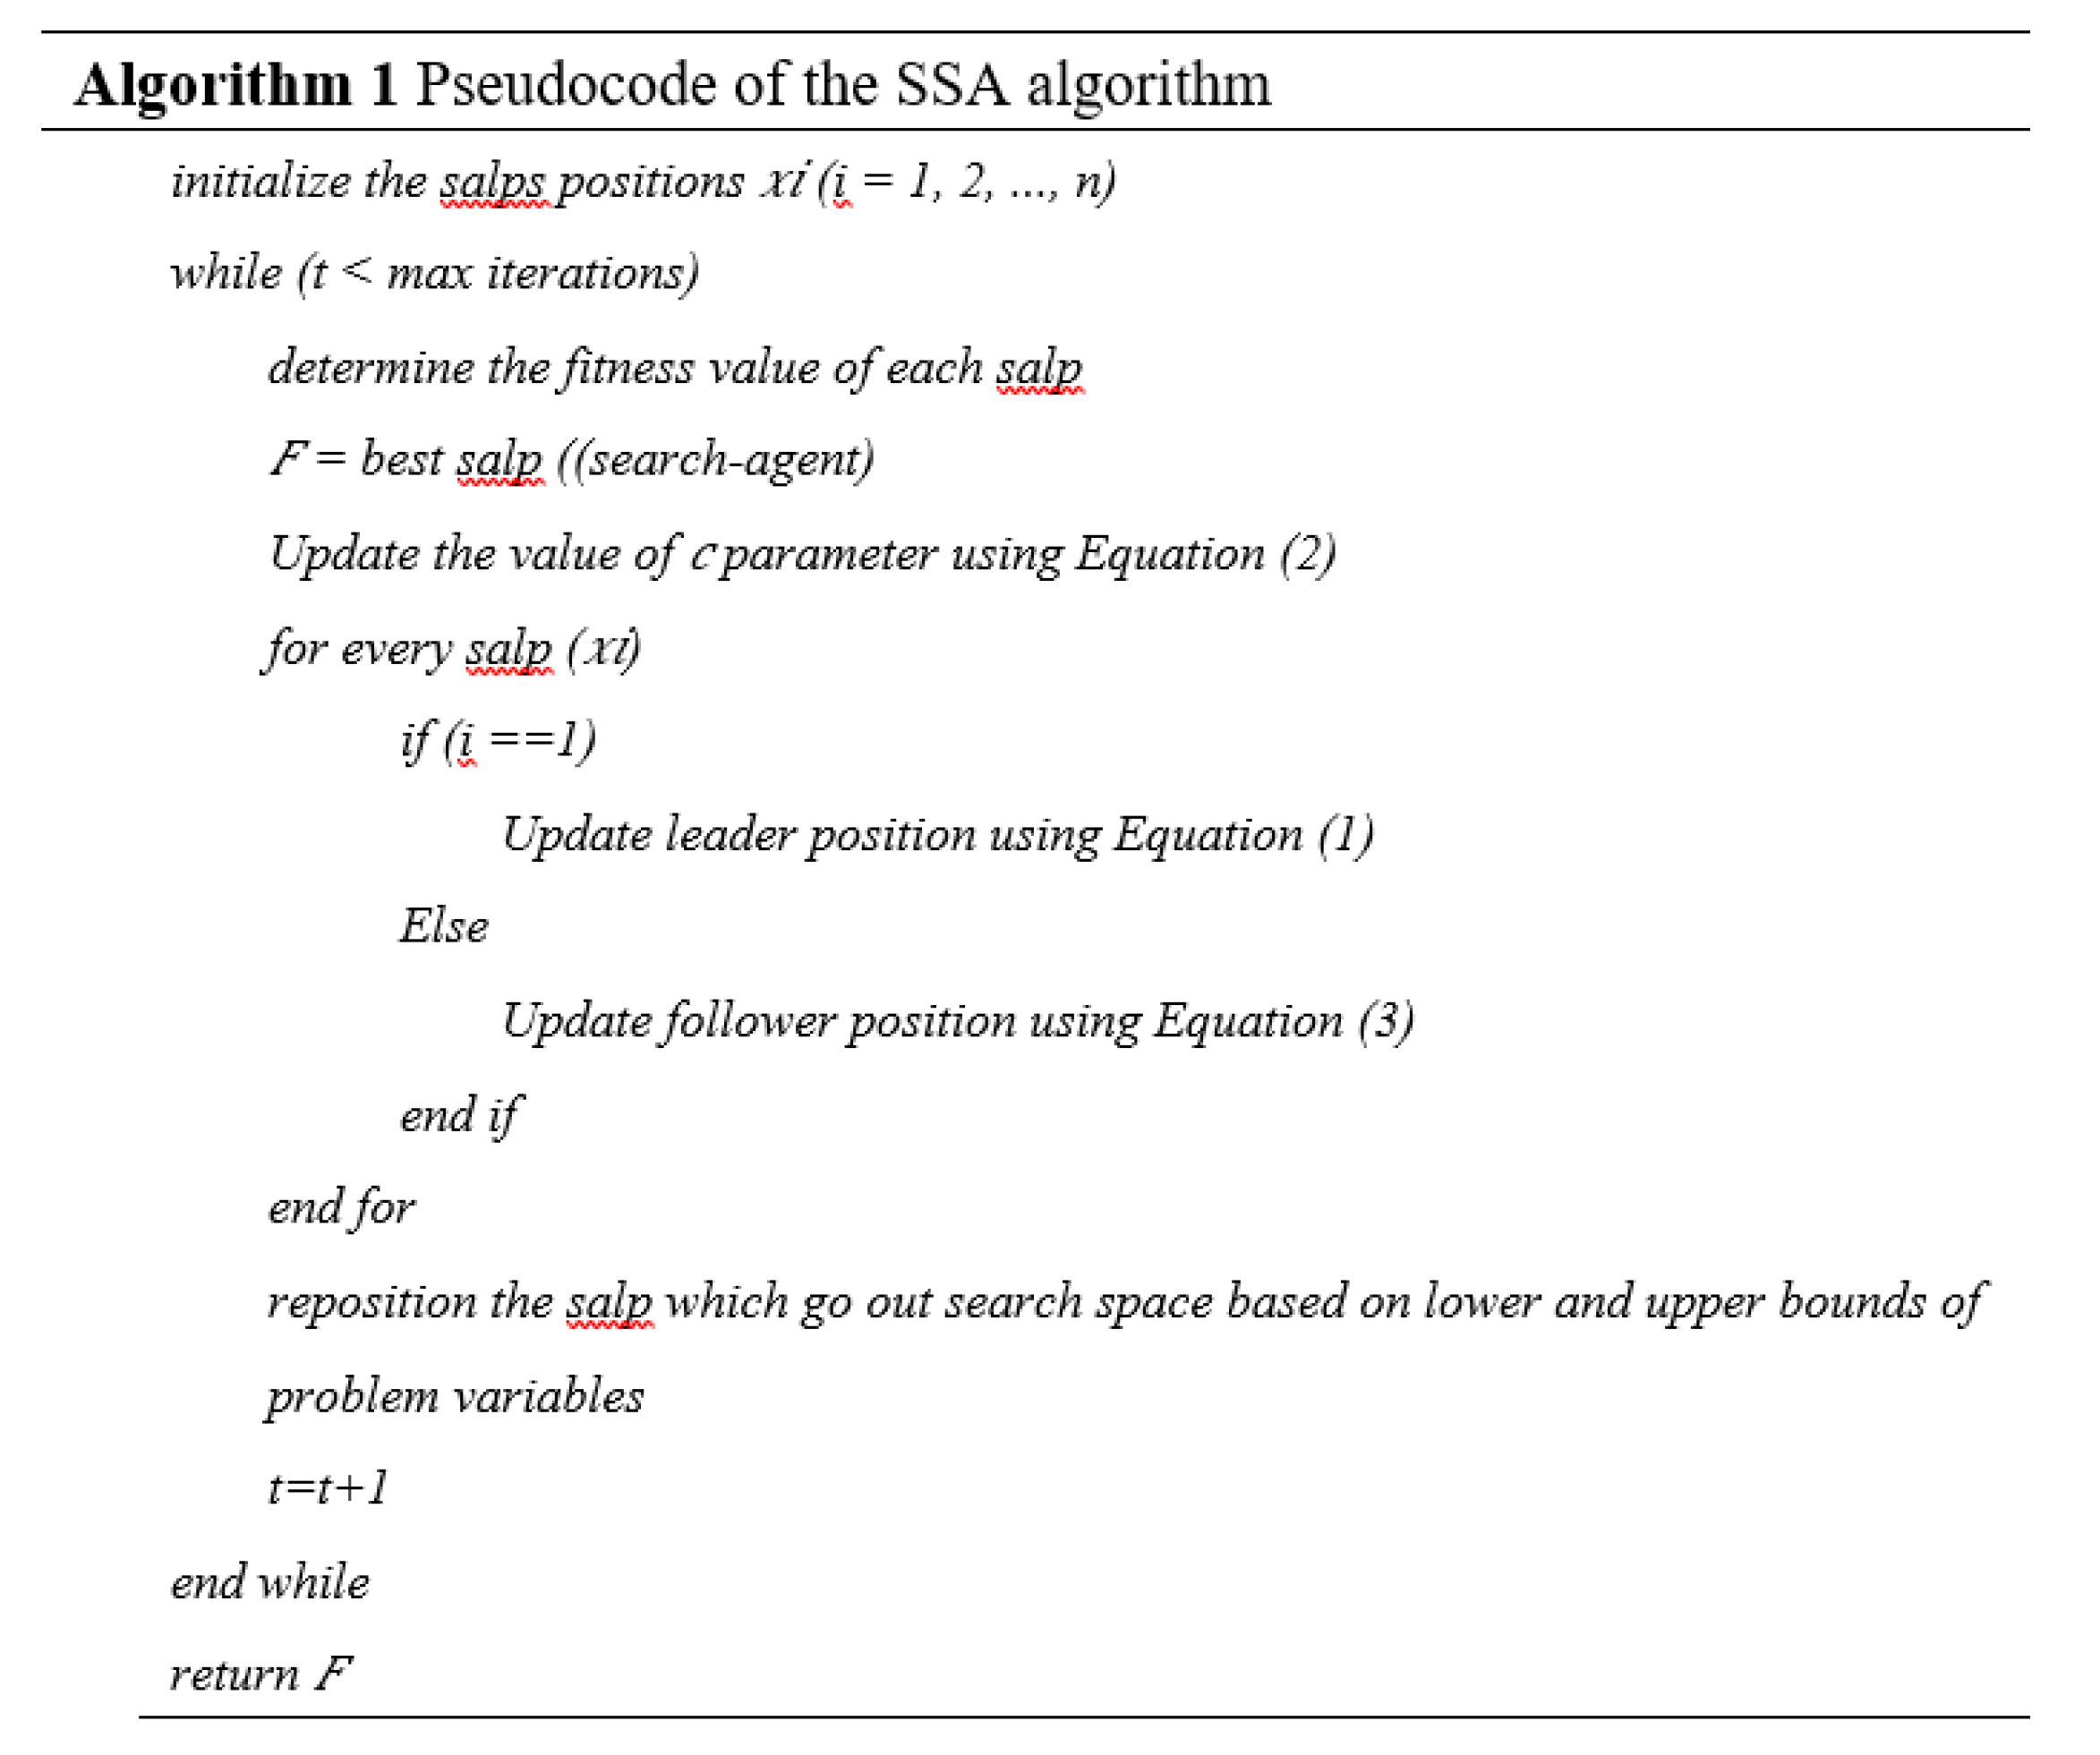
26]. The Salp Swarm Algorithm (SSA) is one of the swarm intelligence algorithms that has proven effective in identifying the most informative subset of features [
27]. Miodrag Zivkovic [
28] developed an improved Salp Swarm algorithm for feature selection from 21 benchmark datasets. Sarra Ben Chaabane and friends [
29] discuss about optimizing the process of selecting feature weights before creating a machine-learning model for blind modulation identification. This study uses Salp Swarm Optimization to minimize the misclassification rate in blind modulation identification. Shikai Wang and colleagues [
30] developed a color image segmentation method using the Salp Swarm Algorithm. This study adopts the salp movement behavior to find the optimal threshold set in the multilevel thresholding process. Xiaojun Xie and colleagues [
31] developed an optimal feature selection combination strategy based on the Salp Swarm algorithm for plant disease detection. Although the Salp Swarm (SSA) algorithm has the potential to select image features, some drawbacks need to be considered, namely that it is not always clear when setting parameters and the range for stagnation. To achieve this goal, the authors use a feature selection technique by utilizing the improved Salp Swarm Algorithm (SSA) [
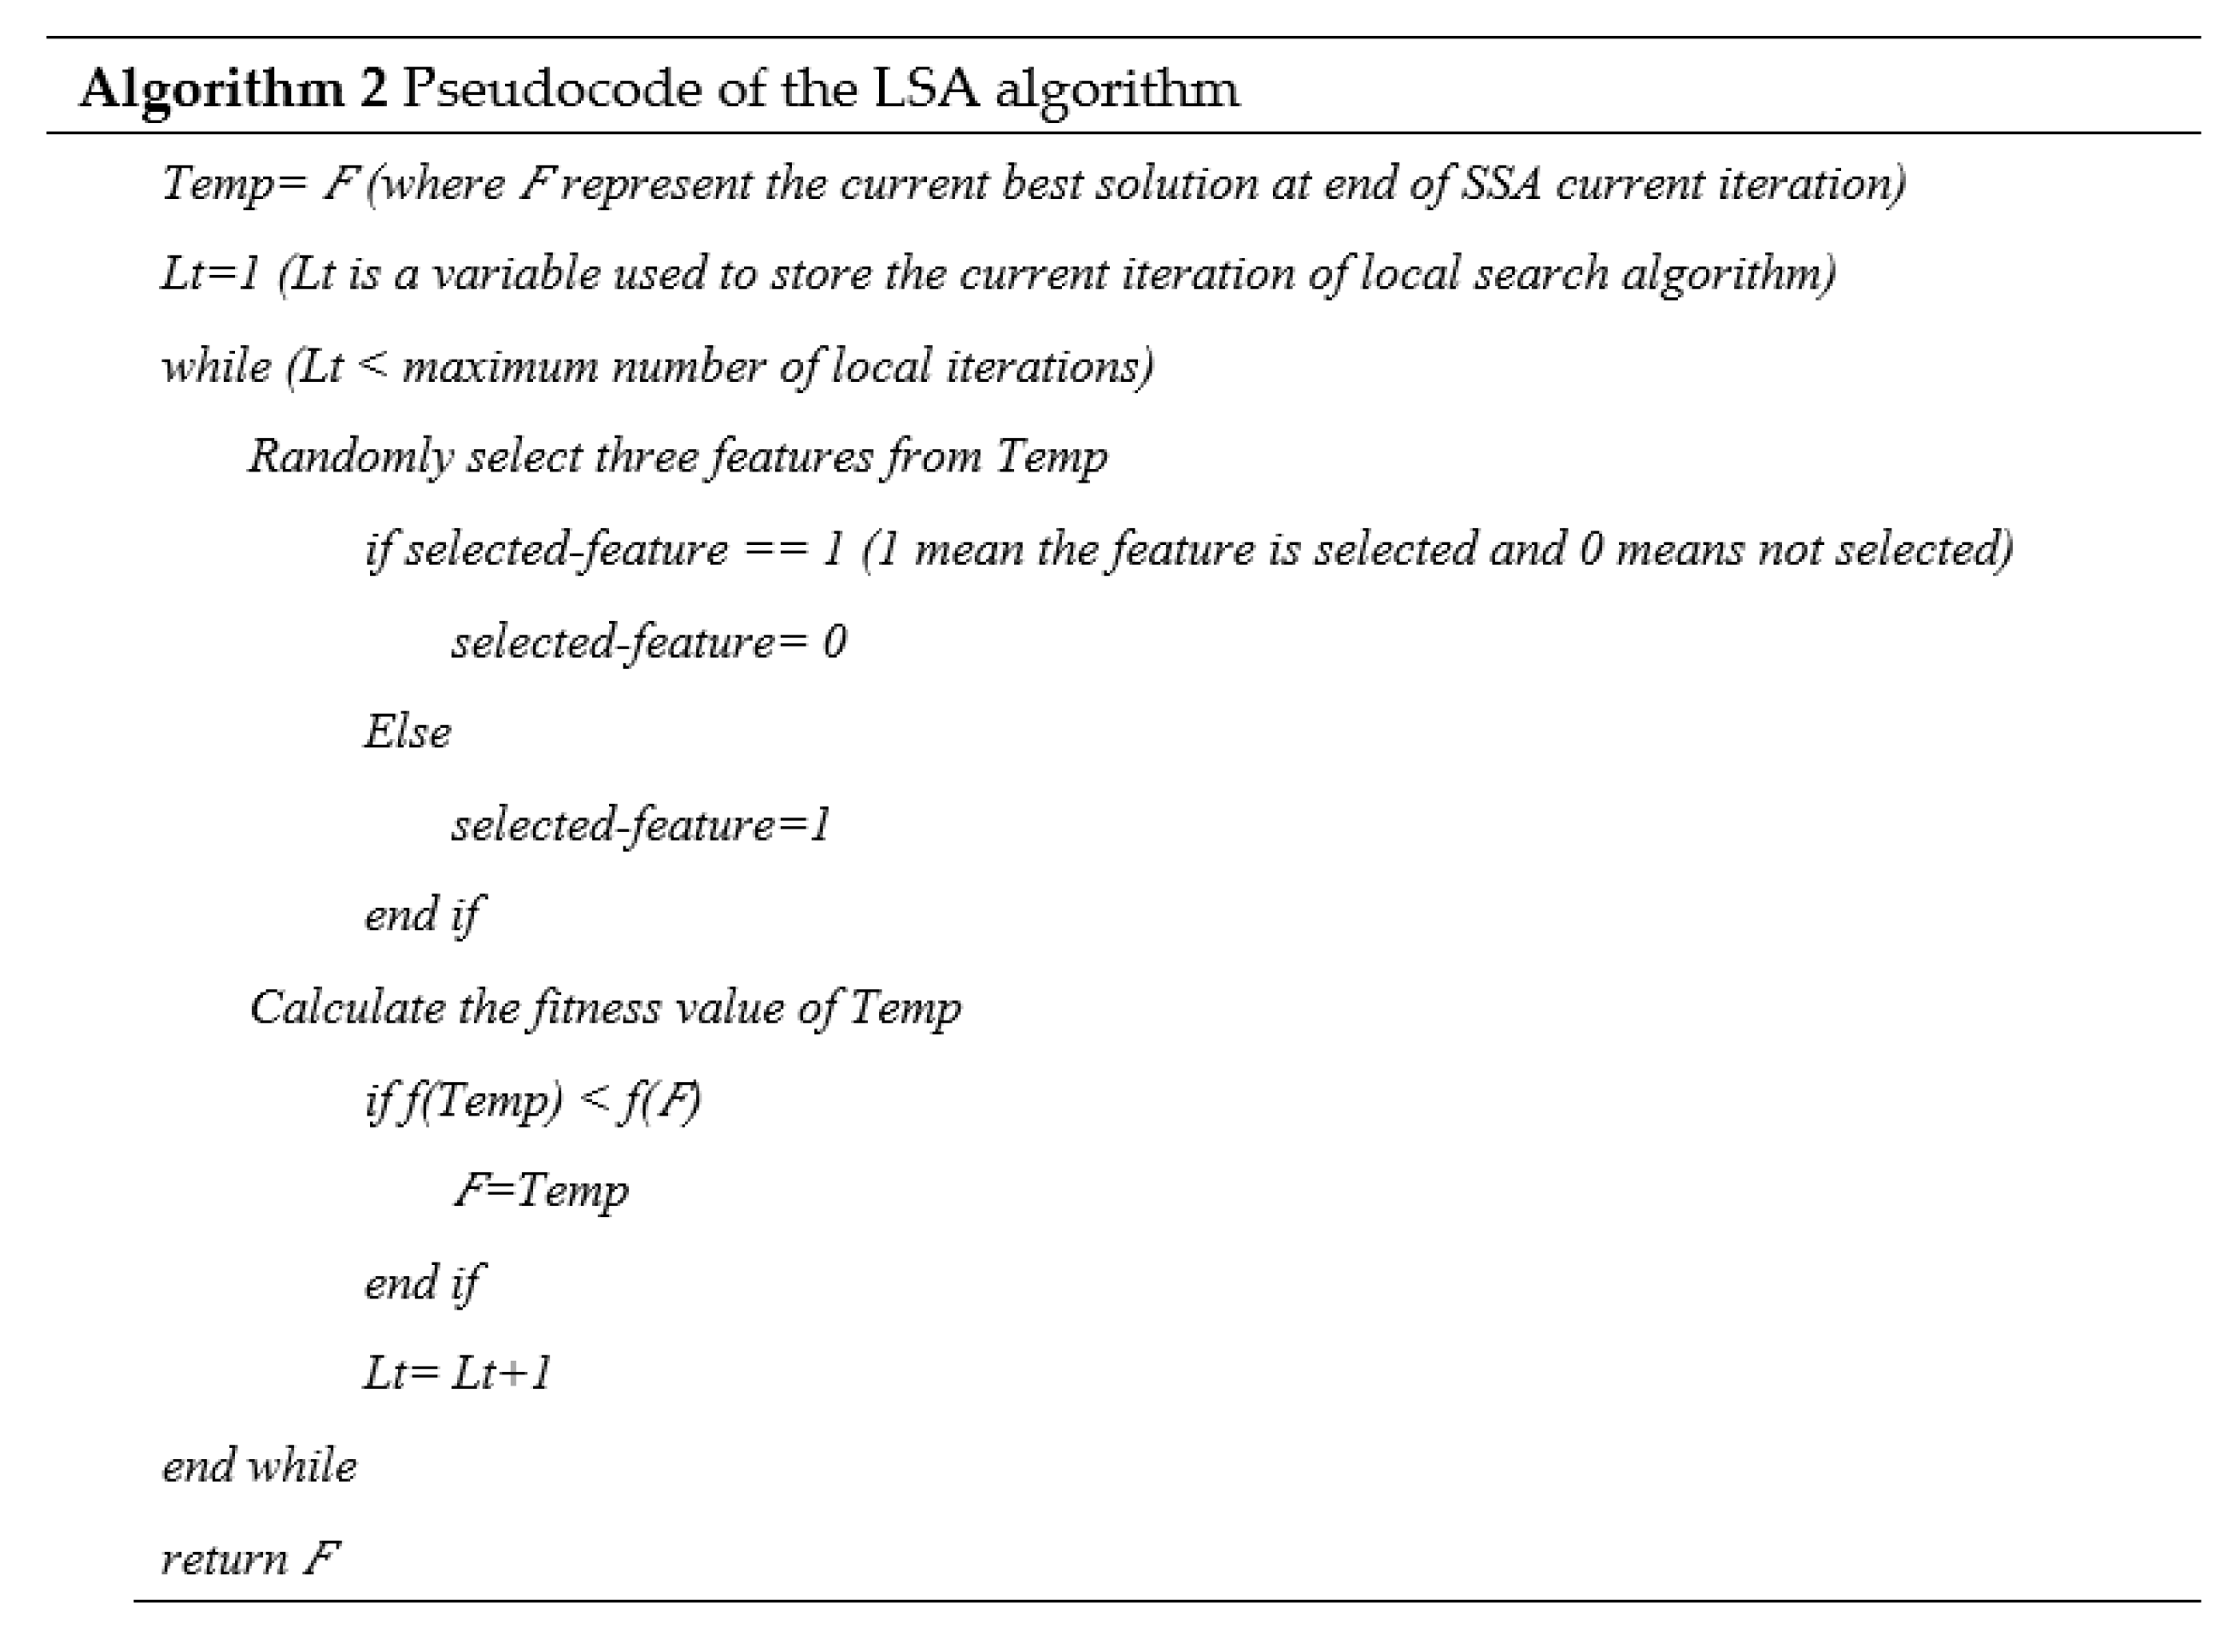
32]. Two major improvements were included in SSA to solve and adapt feature selection issues. The first enhancement includes the use of Opposition Based Learning (OBL) in the SSA initialization phase to increase the diversity of the population in the search space. Meanwhile, the second enhancement involves developing and using the Local Search Algorithm in SSA to improve exploitation. The ISSA algorithm was chosen as a means to optimize the feature selection process to improve the quality of relevant features and classification accuracy.
In this study, the researcher aims to describe several contributions that have been made, including the improvement of the multi-feature selection method of bacterial colonies using the ISSA Algorithm through the integration of the SSA algorithm that has been refined with the OBL strategy and the Local Search Algorithm (LSA). Utilization of OBL with SSA to increase population variation in the search process. Combining LSA with SSA to improve the quality of the identified optimal solution. Comparative analysis of ISSA algorithm performance compared to various other algorithms, such as SSA and PSO, on 19 different bacterial features.
2. Materials and Methods
This section describes all the procedures that have been carried out. In particular, the microbiological methods used to acquire the image database, methods of pre-processing, segmentation, feature extraction, feature selection, and image classification are explained in detail, and step-by-step flowcharts are presented.
2.1. Pre-Processing
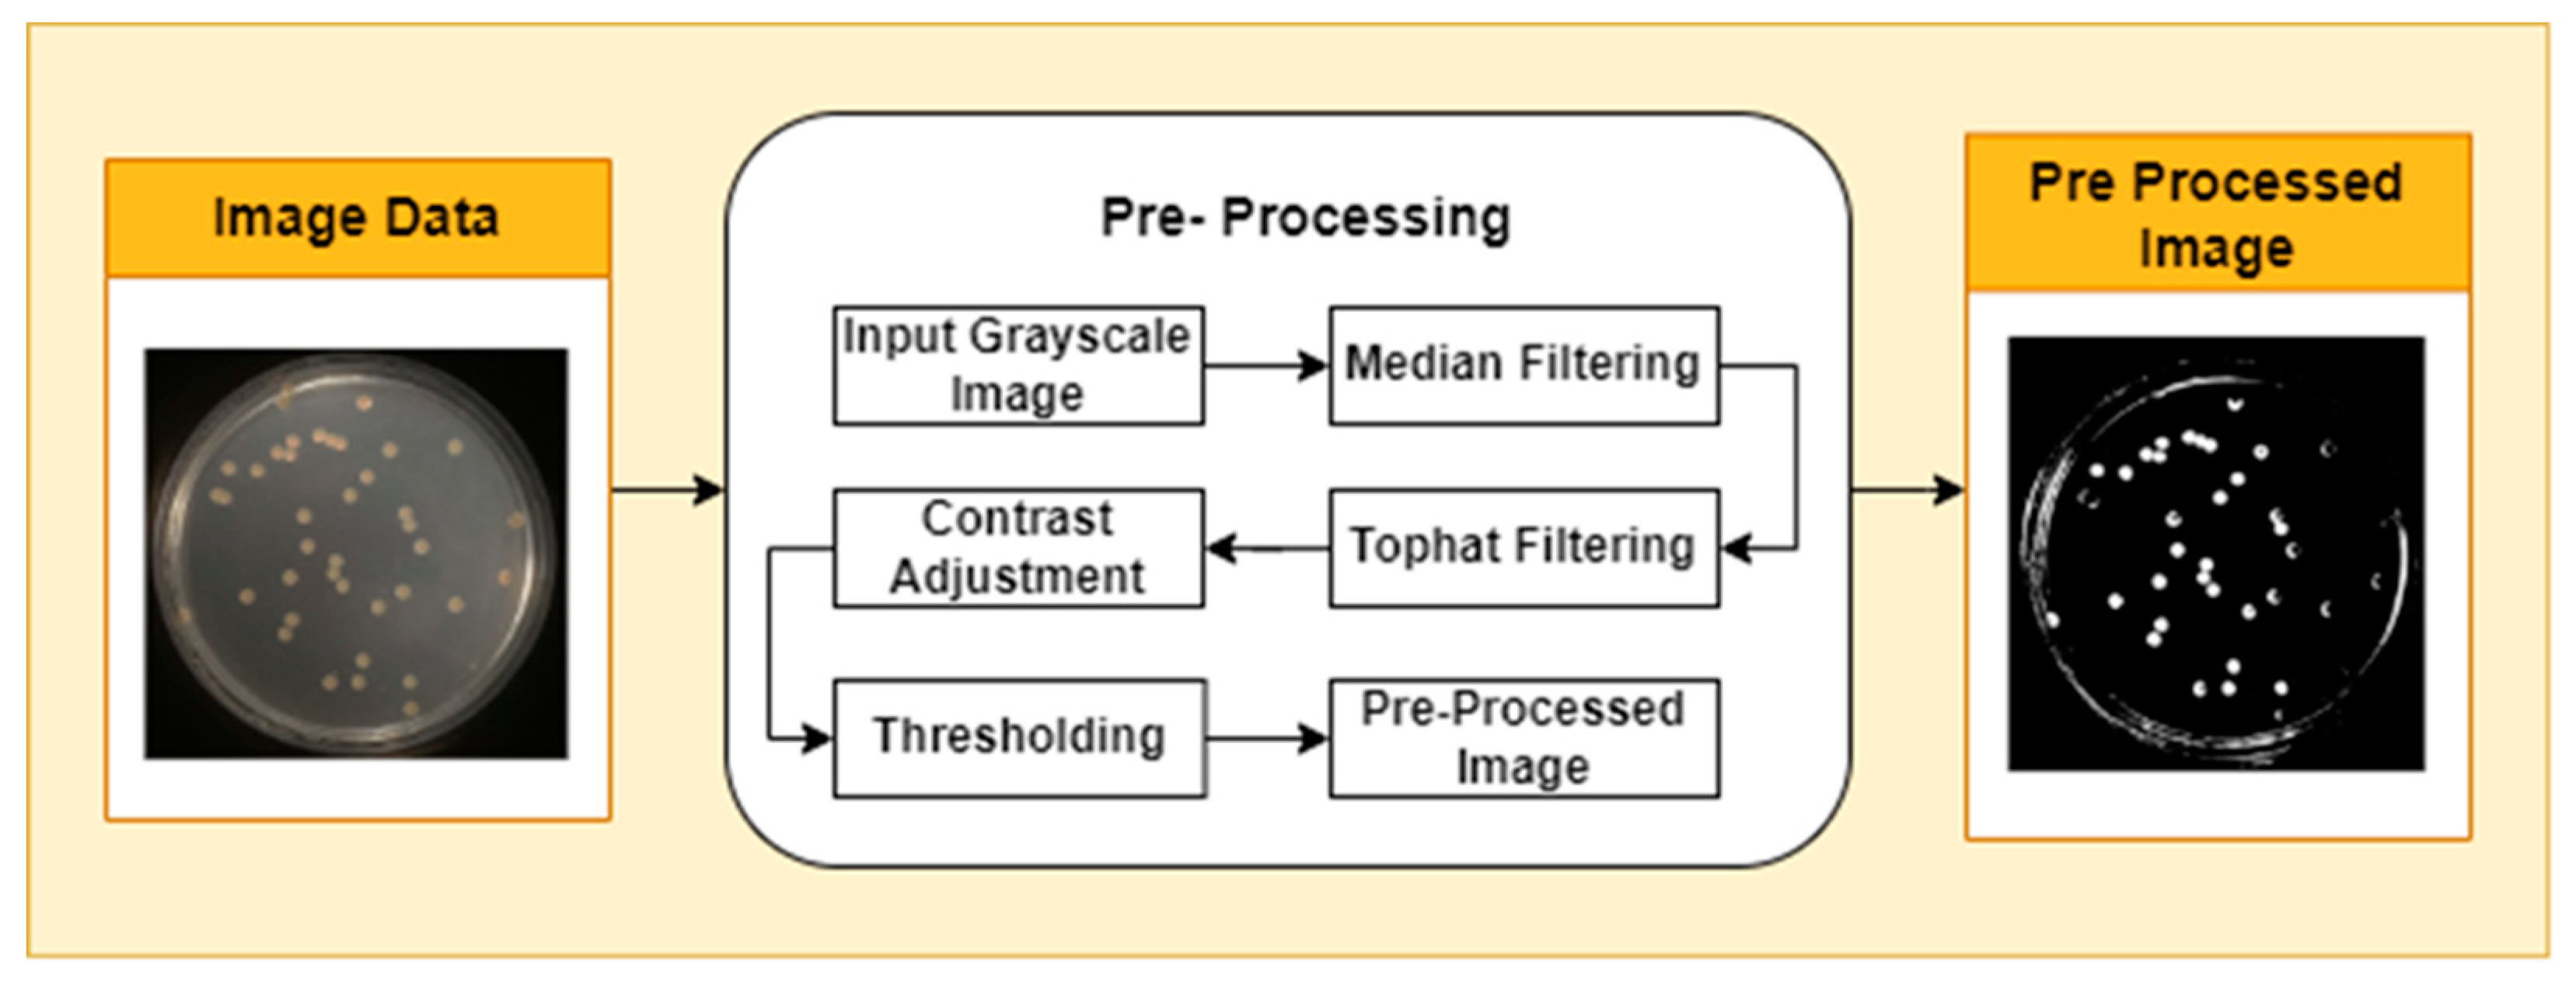
Image pre-processing is the stage of image quality improvement prior to further analysis. The first stage in pre-processing is to change the image color from RGB (Red, Green, and Blue Color Components) to grayscale. This is done using the National Television System Committee (NTSC) formula, namely 0.299* red component + 0.587* green component + 0.114* blue component. The second step applies median filtering to reduce noise in the image without losing contrast. To overcome the possibility of uneven lighting, a top-hat transformation with a radius of 200 pixels is carried out and uses a single disc-shaped structural element. The third step, contrast adjustment, is the process of changing the intensity range of pixels in an image to make the image sharper, clearer, and more detailed so that information in the image can be more easily recognized and understood. In this step, the image is normalized using equation (1): p
adjusted is the replaced pixel value, p is the current pixel value, p
min is the minimum pixel value, NC is the normalization coefficient, and MI is the maximum intensity value of the image.
To separate the object from the background, a binary threshold technique is applied. In this process, each pixel in the image is converted into a binary value, namely black or white, based on a predetermined threshold value. Pixels with an intensity above the threshold are considered white pixels, while pixels with an intensity below the threshold are considered black pixels. The pre-processing stages are shown in
Figure 1.
2.2. Segmentasi
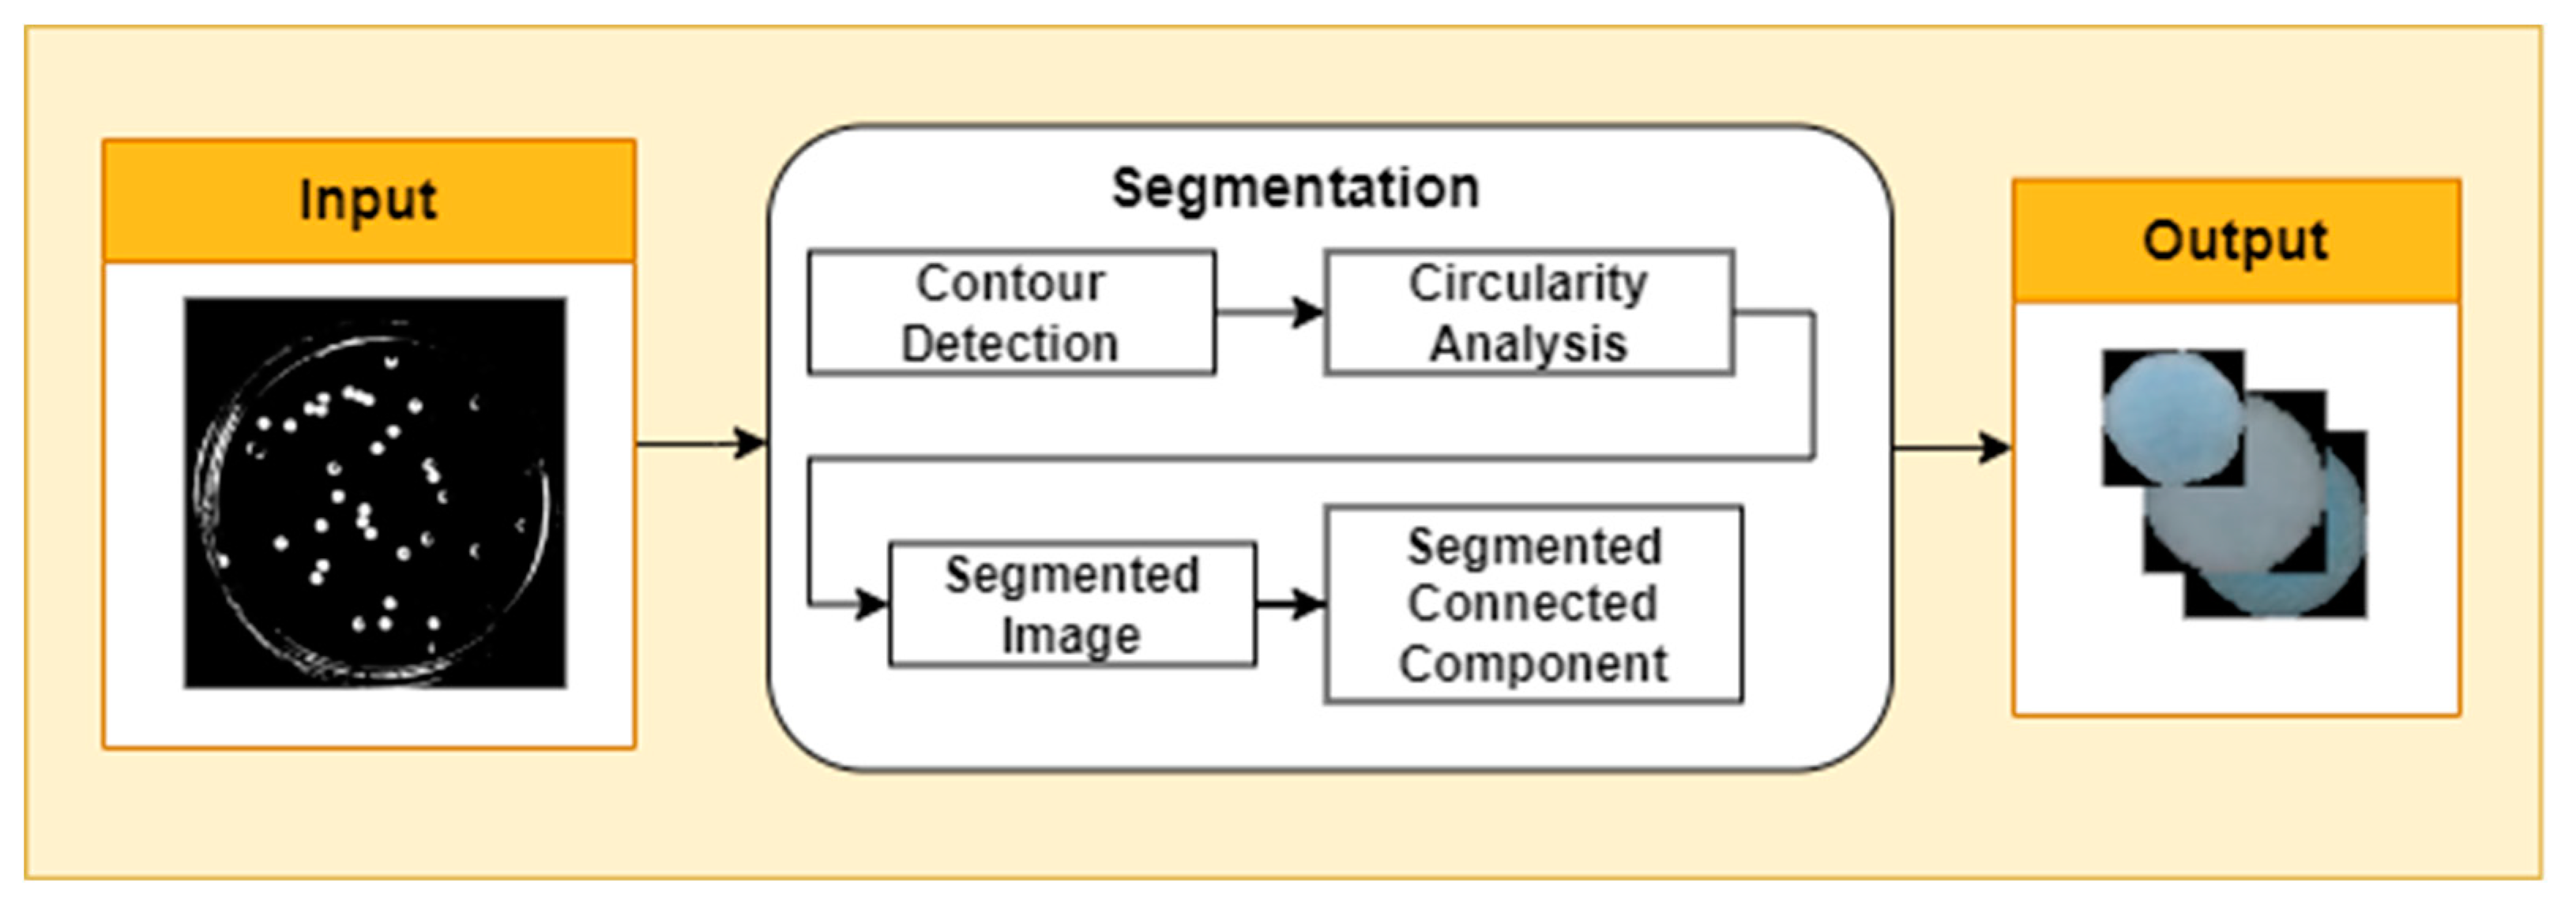
Segmentation is the process of dividing an image into several parts or regions that have certain meanings or characteristics. At this stage, contour detection is carried out in the image, which aims to identify and extract the lines or boundaries that separate objects in the image. Contour detection using Canny's algorithm. After the bacterial contours are detected, the Douglas-Peucker algorithm is applied with epsilon parameters to simplify complex contours. This algorithm depends on the maximum distance allowed between a point on the original contour and the corresponding point on the approximated contour. The determination of the epsilon value needs to be done carefully, according to the level of contour detail that you want to maintain in the simplification process. Furthermore, circularity analysis in images involves measuring the extent to which an object or structure in the image approaches a circular shape (
Figure 2).
2.3. Feature Extraction
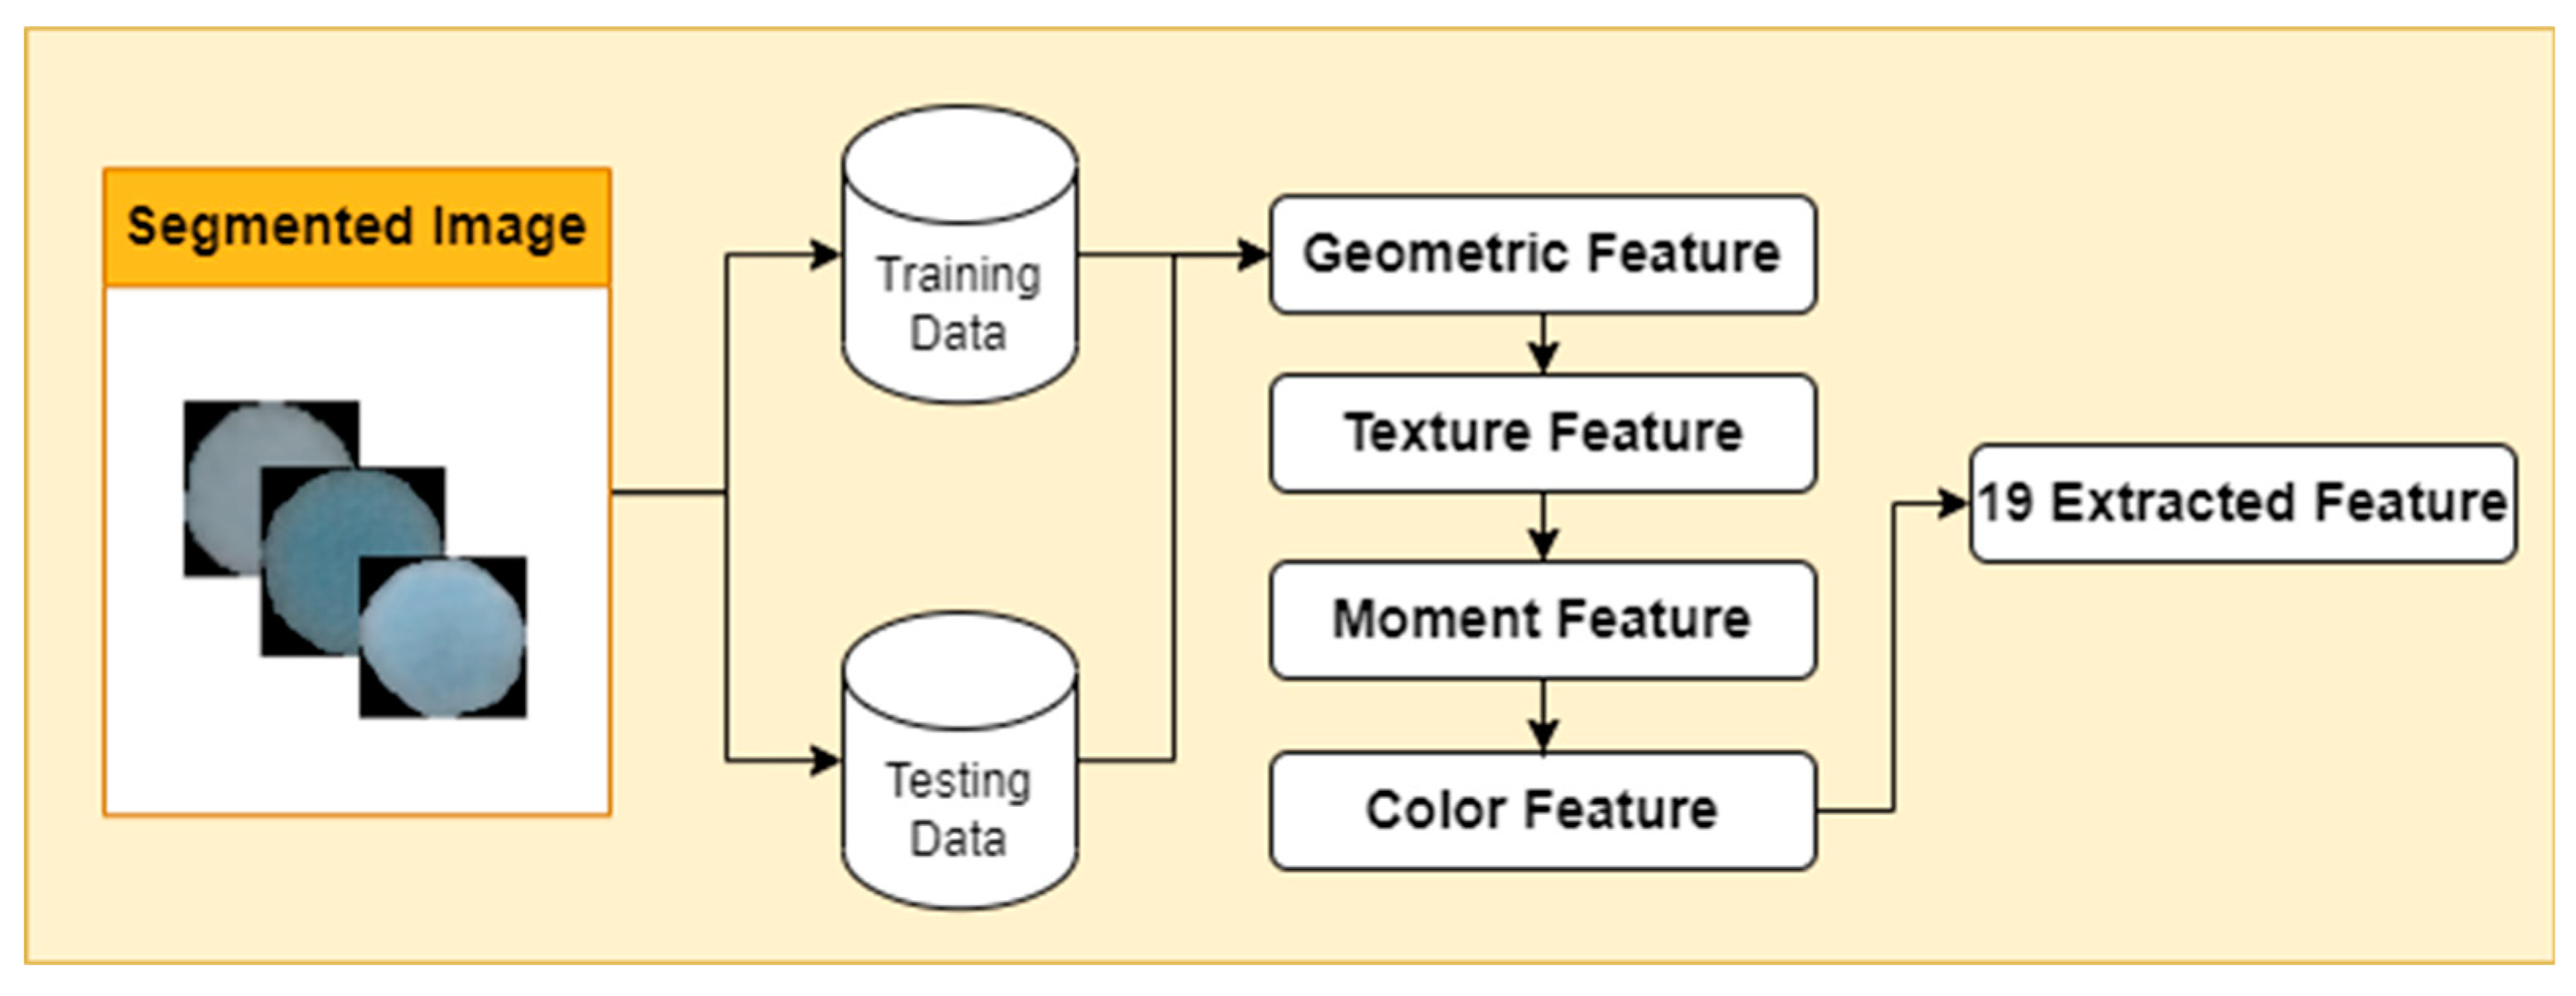
Feature extraction in bacterial images has a crucial role in analyzing bacterial images to identify, classify, and analyze the characteristics of various types of bacteria. There are many types of features that feature extraction from bacterial images. One of them is a geometric feature that provides information about area, circumference, eccentricity, circularity, convex area, and center of mass. Furthermore, there are also color features that are measured using color metrics such as hue, saturation, and value (HSV). Next, the texture feature of an image refers to the visual characteristics produced by the pixel patterns in the image, such as variations, repeated patterns, and the degree of regularity that appears in the image. Then, there are moment features as an additional dimension in image analysis. The moment feature produces a mathematical representation of the geometric properties of an object in the image. In this study, capturing moments features Hu moments and Zernike moments (
Figure 3).
2.4. Feature Selection
2.4.1. Salp Swarm Algorithm
The Salp Swarm Algorithm is a recently developed nature-inspired metaheuristic algorithm that mimics the particular swarming behavior of marine salps. Salps usually live in groups and often form shoals called salp chains. The first salp is referred to as the leader, while the others are followers. In the mathematical model of the salp, the position of the salp leader is updated using equation (2).
Where is the value
indicates the position of the leader in the salp chain and
shows the position of the food source in the j dimension. Besides, it represents the lower bound value of the j dimension.
represents the upper bound value of j. Then, c
1, c
2, and c
3 represent random values; c
1 is the most important controlling parameter in SSA because it is responsible for maintaining the balance between exploration and exploitation in SSA. Equation (3) is used to calculate the value of parameter c.
In equation (3),
represents the current iteration and
represents the maximum number of iterations of the algorithm. Parameter values of
and
denote random values in the range [0,1]. To update the positions of the followers in the salp chain using equation (4),
where
and
is the position of
follower in dimension
search space.
2.4.2. Opposition Based learning
Opposition Based Learning (OBL) is an optimization technique used to improve the quality of the initial solution in a population by introducing variations to the solution. OBL operates by searching in two directions in the search space. Both directions involve the initial solution as well as the opposite direction, which is represented by a solution that has the opposite properties. In the end, OBL chooses the best solutions from all the existing ones.
Opposite numbers, denoted as
defined as a real number on the interval. The opposite number is
denoted as, and to determine its value using equation (5),
Equation (5) can be generalized to apply in a multidimensional search space. Therefore, equations (6) and (7) will represent the position of each search agent and its opposite position in order to generalize this:
The values of all the inner elements
will be determined using equation (8):
In the optimization based on opposed populations approach, the fitness function is represented as f().Therefore, if the fitness value of the opposite solution is superior to that of the initial solution x, then = if not = .
The integration of OBL (Opposite-Based Learning) with SSA (Salp Swarm Algorithm) involves the following steps: initializing the salp positions x as and determining the opposite positions of the salp population OX as , where (i = 1, 2, ..., n); subsequently, the n strongest salps selected from {X ∪ OX} will constitute the new initial population for SSA.
2.4.3. Local Search Algorithm
The developed Local Search Algorithm (LSA) algorithm is shown in Algorithm 2. LSA will be called at the end of each iteration in SSA to improve the best solution. Initially, LSA stores the best solution value obtained from SSA in the last SSA iteration into the Temp variable. LSA does a number of iterations to increase temperature. In each LSA iteration, the LSA randomly selects three features from the Temp. LSA rearranges the selected features based on their values. In addition, LSA will determine the fitness value of the new solution; if it is better than the initial fitness value, it will be set to Temp; otherwise, it will remain unchanged.
2.4.4. Improved Salp Swarm Algorithm
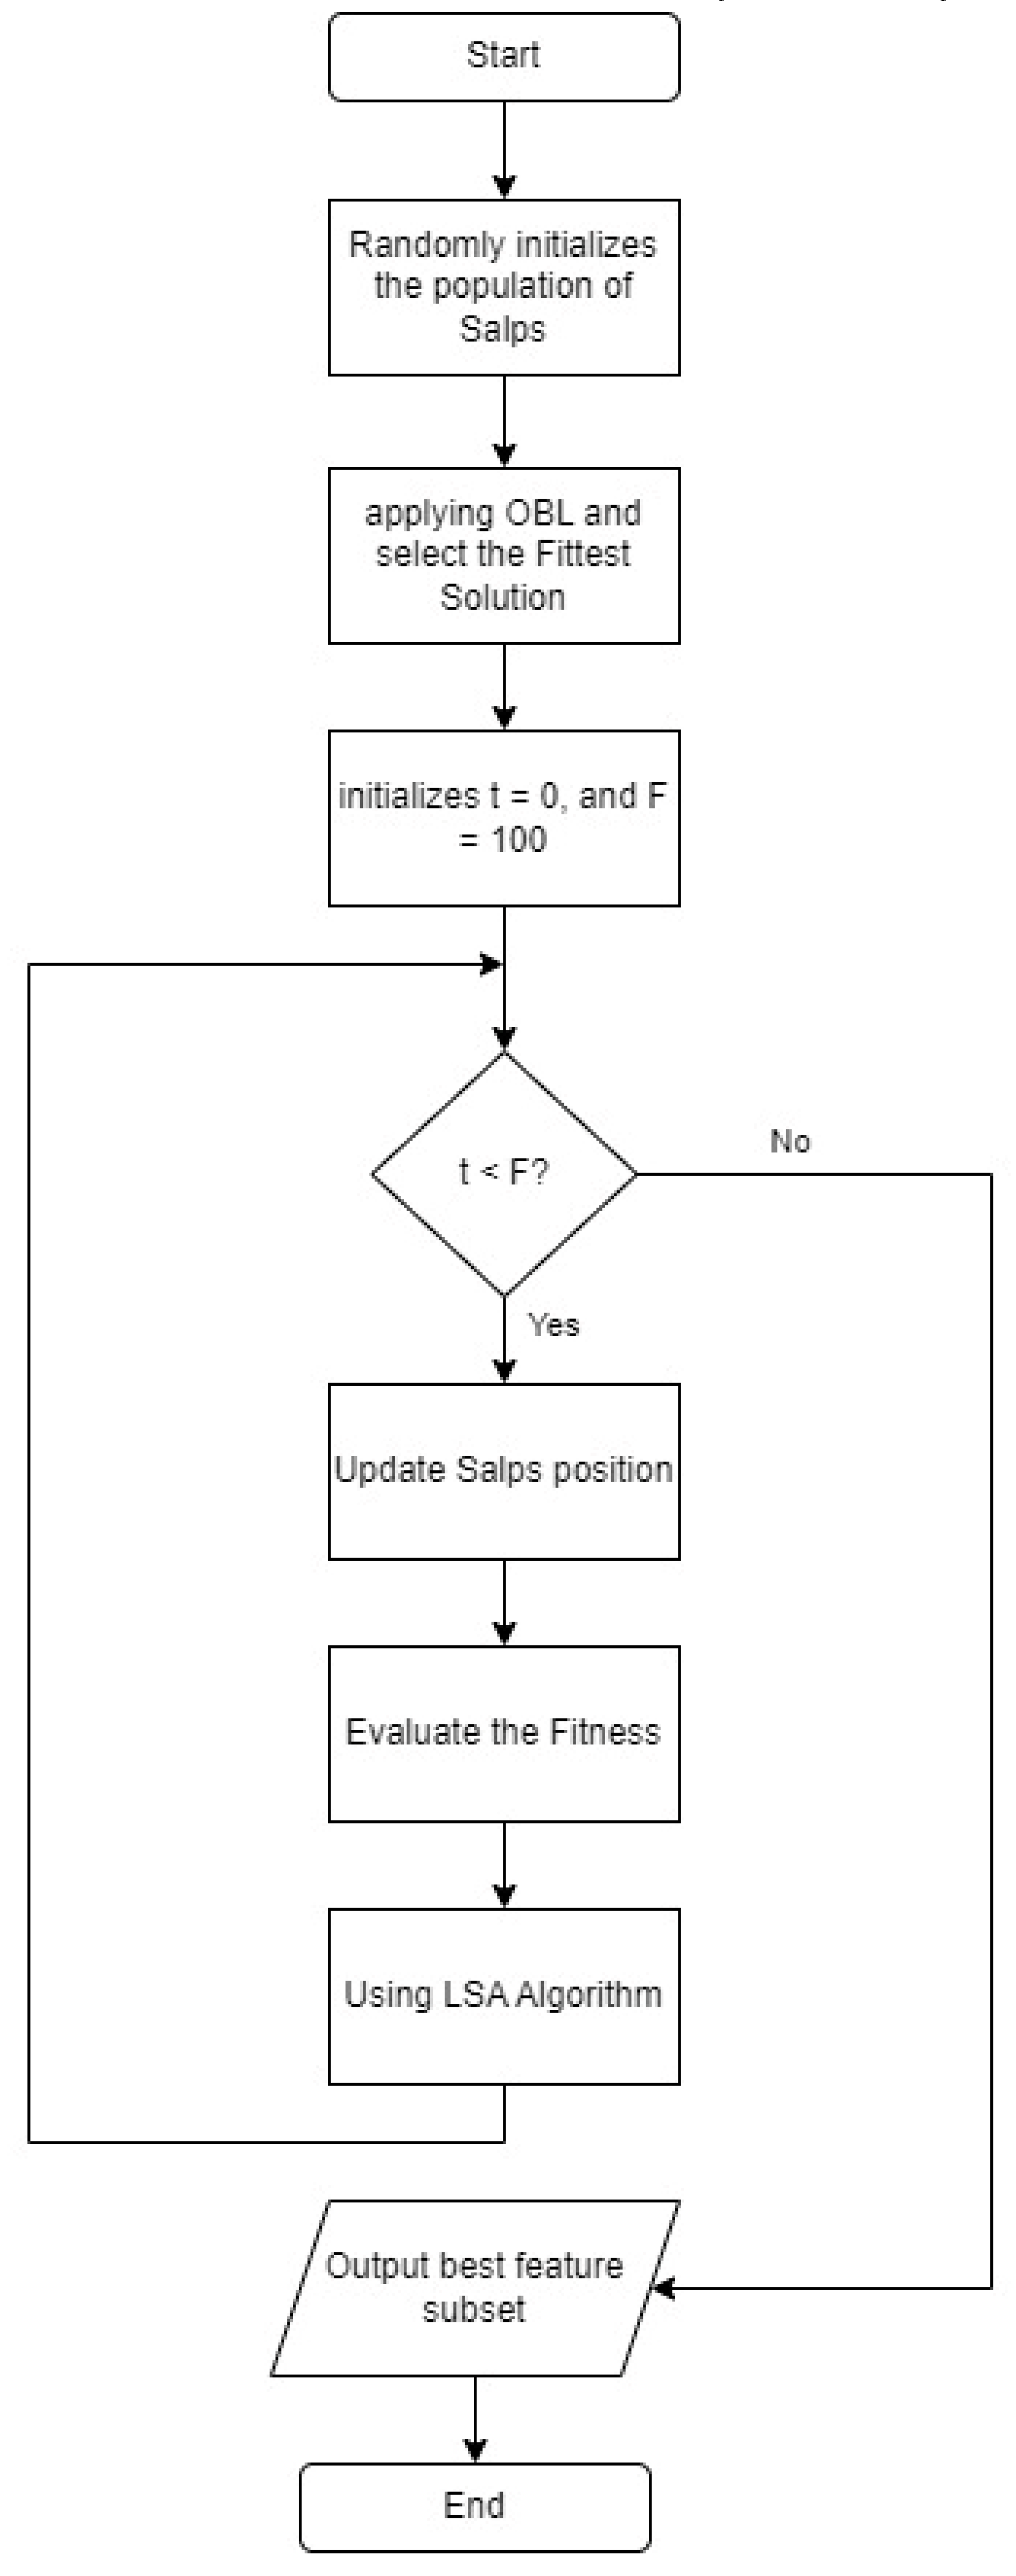
Improved Salp Swarm Algorithm (ISSA) is an improvement on the SSA algorithm. The stages of the proposed ISSA algorithm are shown in
Figure 4. The steps of the ISSA algorithm include initializing SSA by generating the number of salps based on population size and selecting a feature subset randomly from the entire feature set. Followed by the application of OBL to find the opposite solution from each initial solution and the reverse solution, which is calculated based on the KNN classification accuracy error as shown in
Figure 5. Additionally, SSA gives a T value to the best solution that OBL selects as having the lowest classification accuracy error. Depending on whether the salp is the leader or a follower in the salp chain, equation (2) or (4) updates the position of each salp after that. Fitness evaluation is done by determining the fitness values of all salps, and these values are updated if a better solution is found. The LSA algorithm is applied to the t best solution to find a better solution, and the t value is updated if a better solution is found. The ISSA algorithm is repeated in iterations. ISSA returns the best solution that represents the best feature subset. In the testing phase, the features selected for the best solution are used to evaluate ISSA's performance on the test dataset.
3. Results and Discussion
This section may be divided by subheadings. It should provide a concise and precise description of the experimental results, their interpretation, as well as the experimental conclusions that can be drawn.
3.1. Dataset
To evaluate and validate the performance of the ISSA algorithm compared to other algorithms, the bacterial benchmark dataset from the CINATE repository (Center for Innovation and Technological Support, ESB, UCP) was used [
33]. Details of the dataset used can be seen in
Table 1.
3.2. Parameter Setting
All experiments performed used a 10-fold cross-validation method. This validation method is done by dividing the data into ten parts, where 70% of the data is used for the training phase and 30% is used for testing. In addition, the experiment was carried out and repeated 10 times. The results of the average of 10 trials are used as performance indicators. Therefore, the results listed in
Table 2 reflect the average value of 100 iterations in terms of accuracy, suitability, and selected features.
The ISSA algorithm is compared to the standard SSA algorithm and the particle swarm optimization (PSO) algorithm. The population size utilized by all algorithms is 10, the maximum number of iterations for each optimization algorithm is 100, and the number of LSA iterations is fixed at 10. An indicator to evaluate the performance of the optimization algorithm is the classification accuracy using KNN classification.
3.3. Results and Analysis
This section provides a comprehensive summary of the collective particulars and outcomes derived from the conducted experiments. Specifically, the investigation entails a comparative assessment involving SSA, PBO, and ISSA concerning images depicting bacterial colonies. The evaluation of ISSA's efficacy against alternative algorithms is predicated on three key parameters: classification accuracy, the quantity of selected features, and the match value. The findings of the comparative analysis encompassing SSA, PSO, and ISSA are outlined in
Table 2. The ISSA algorithm is superior in classification accuracy on 3 datasets and 19 features compared to SSA and PSO, amounting to 73.75%. In addition, ISSA is also superior in selecting the number of features that are fewer than the total of 10 trials.
Beyond accuracy, ISSA further establishes its heightened performance in match value, with a significantly lower classification error of 0.2623 in comparison to SSA. Evidently, these outcomes underscore ISSA's substantial enhancement over the original SSA algorithm in matters of classification accuracy, feature selection, and match value.
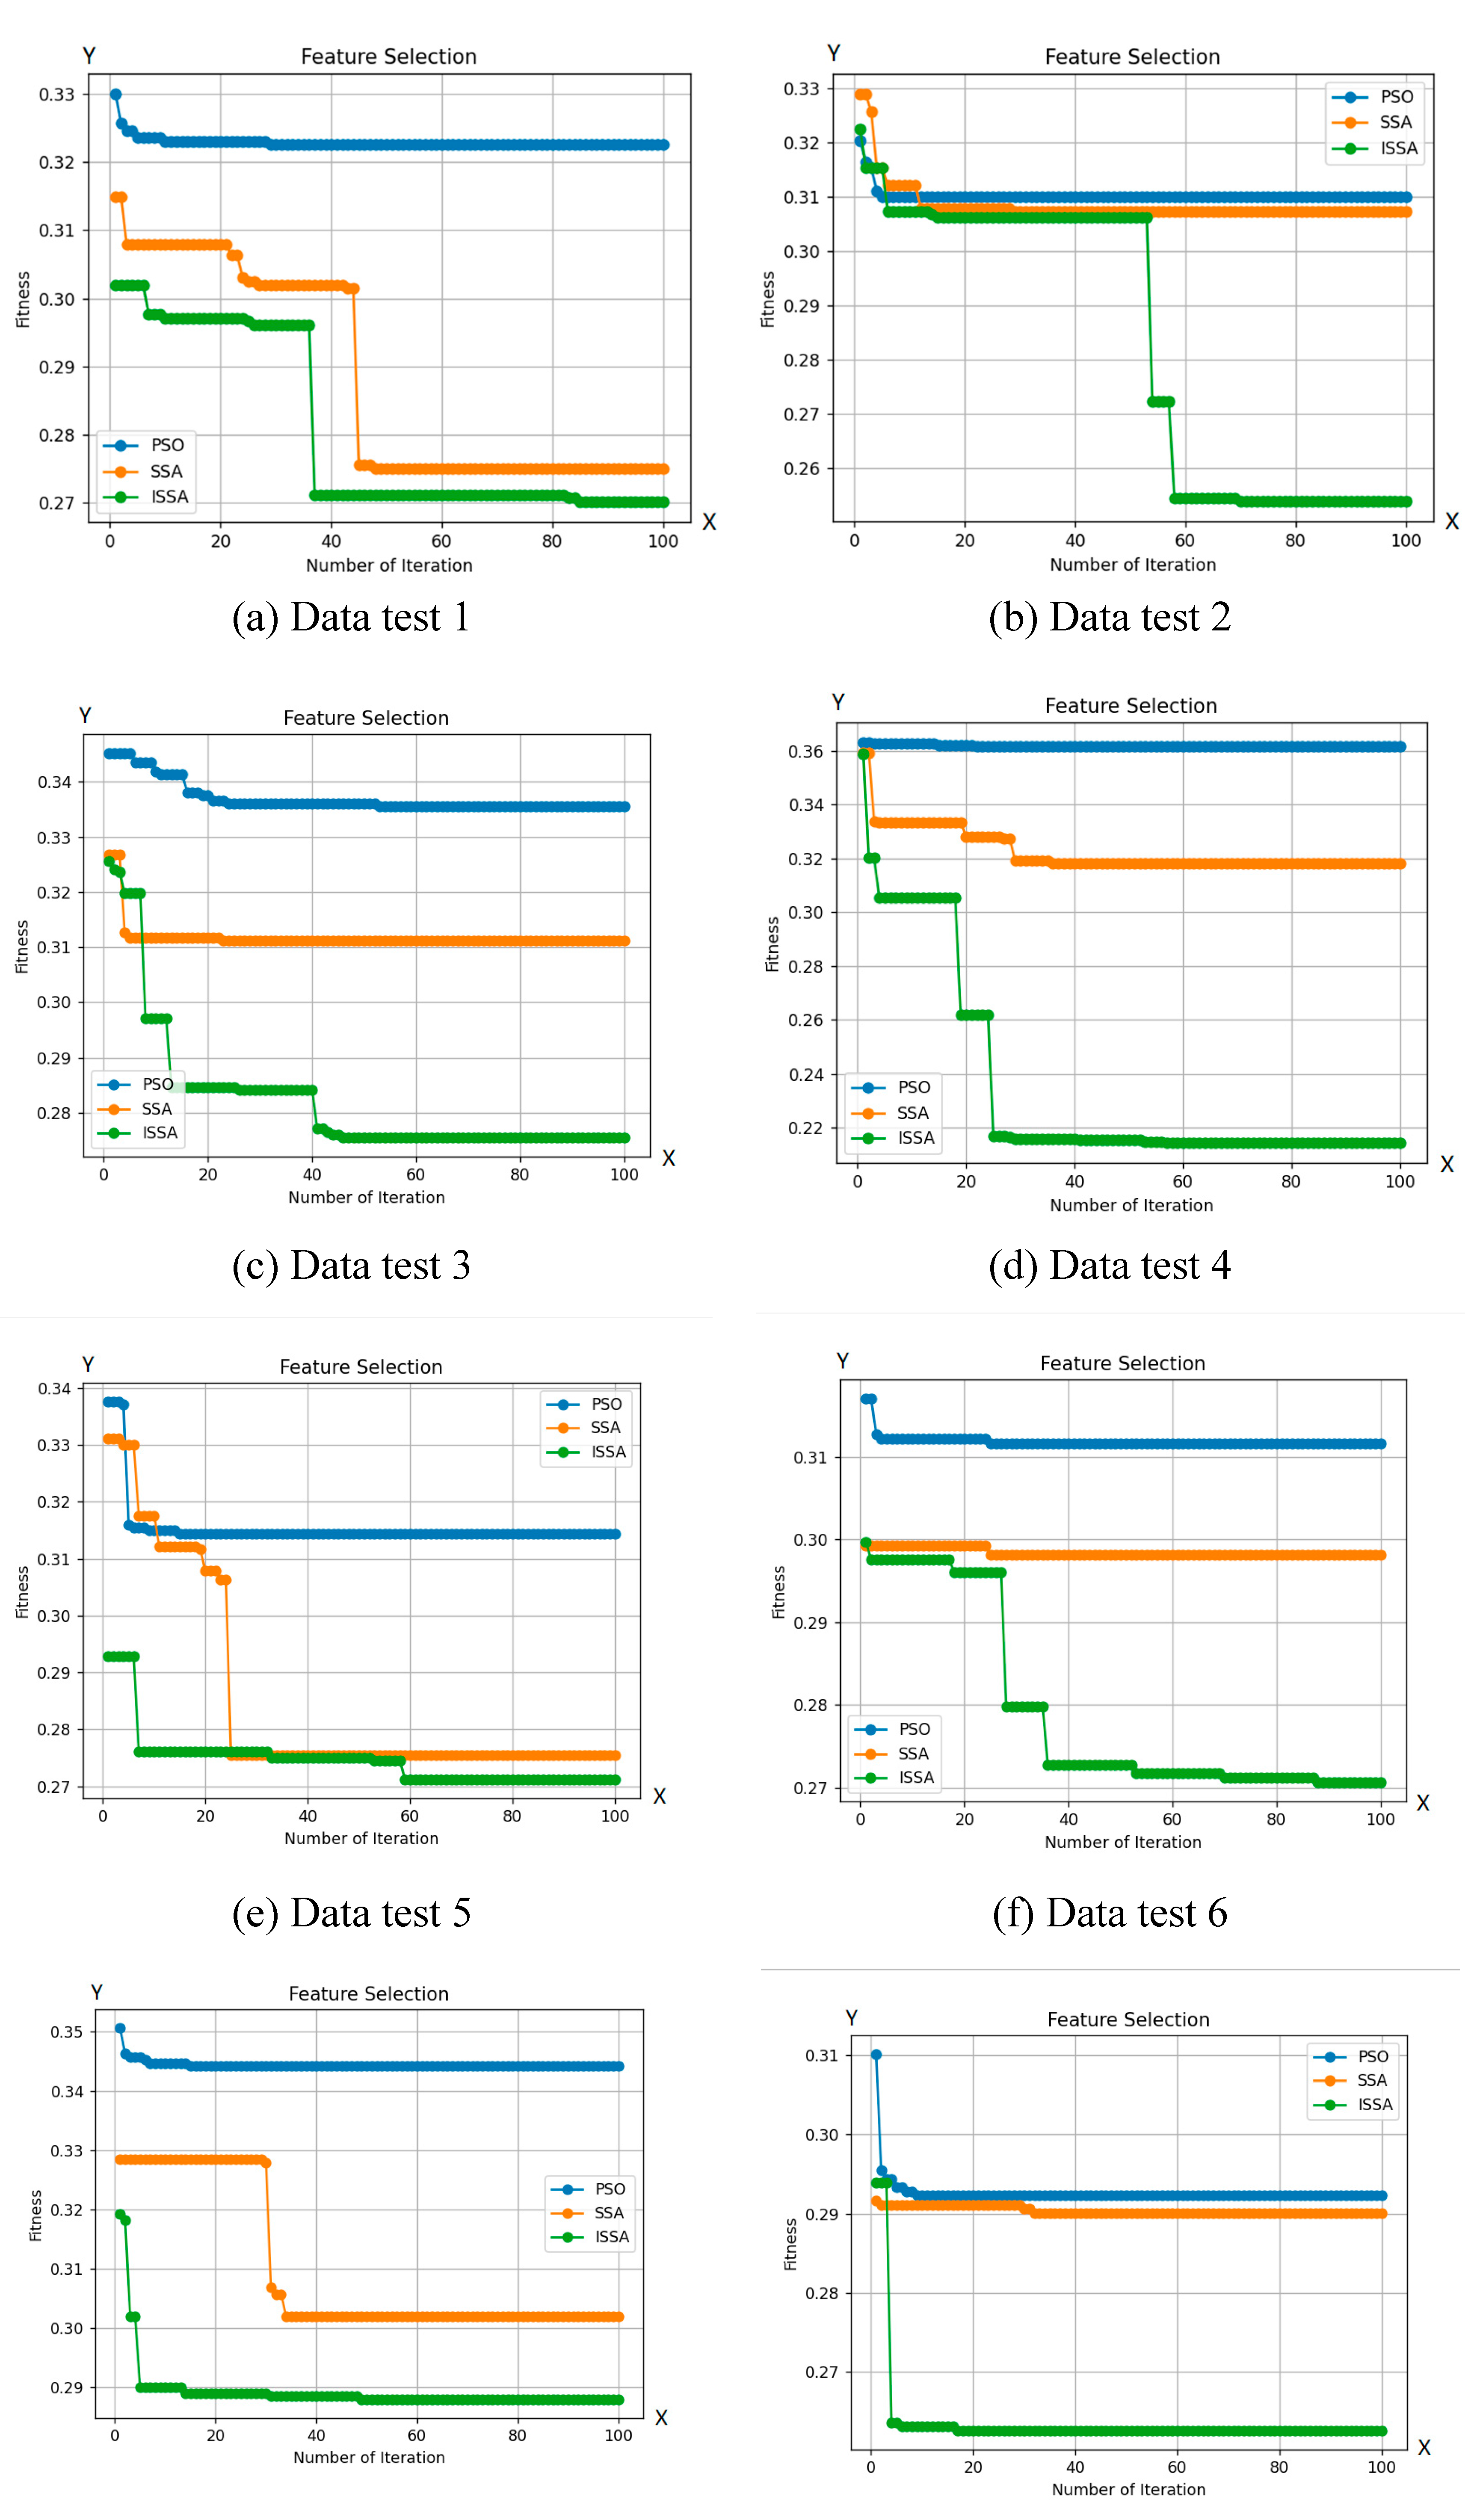
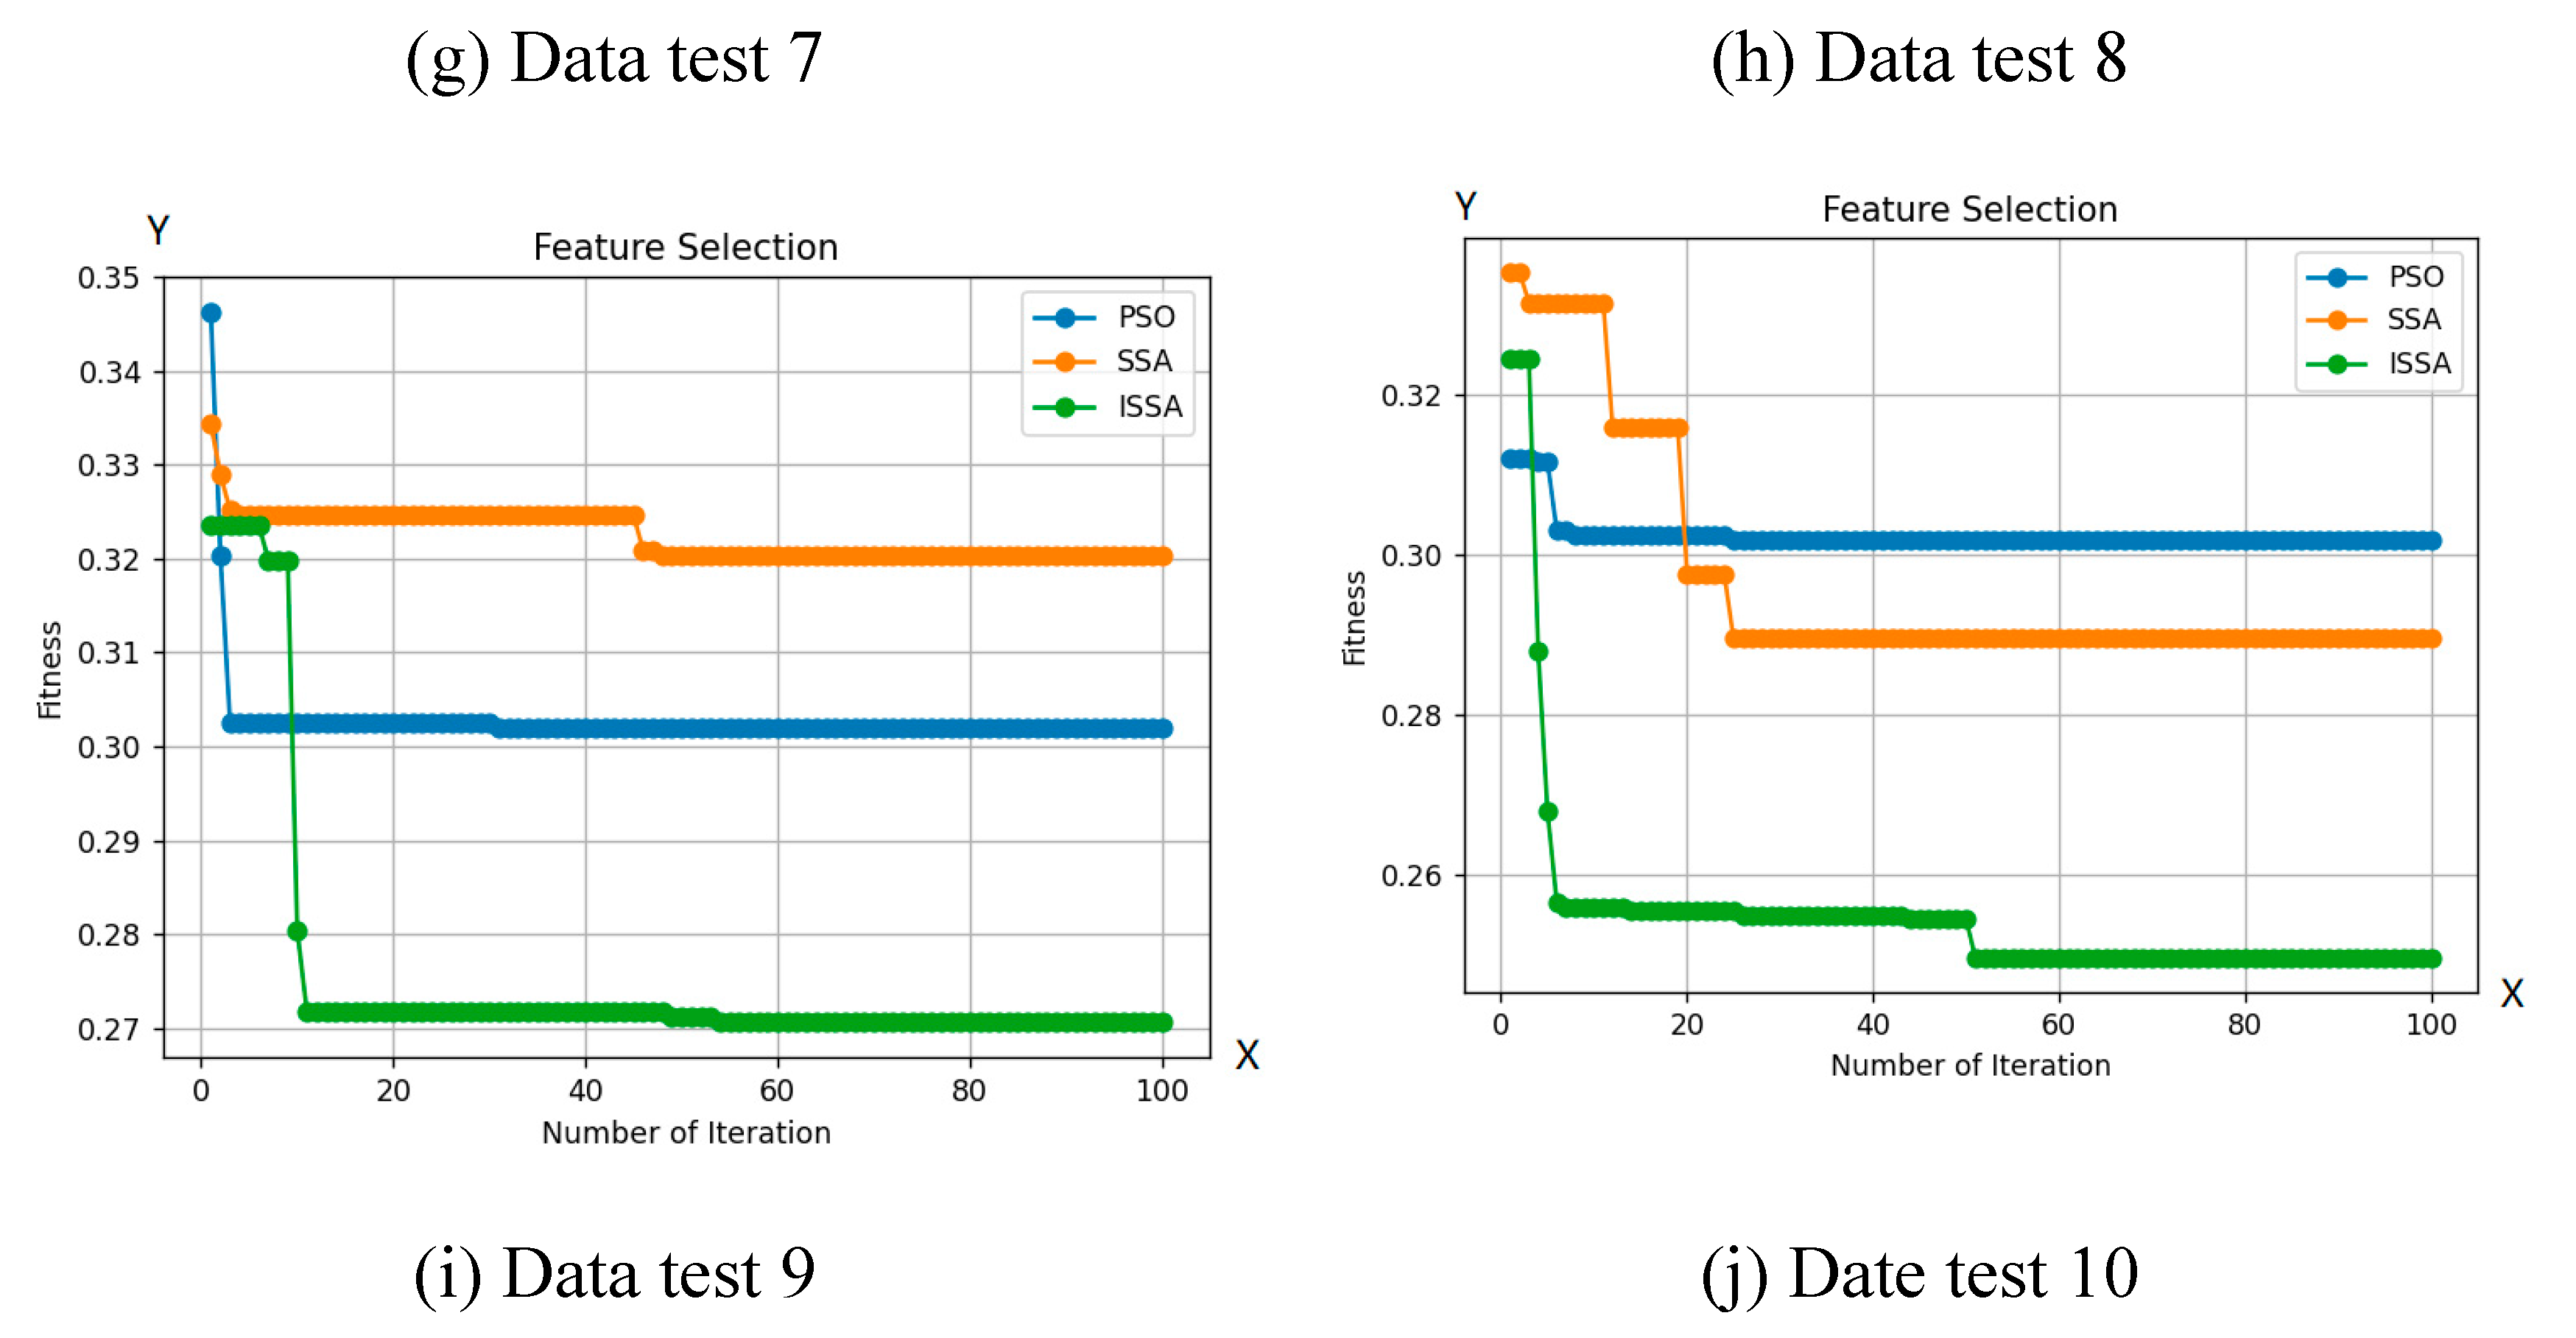
Based on
Figure 6, ISSA shows a superior exploration capability compared to other optimization algorithms. This is clear from ISSA's capacity to explore regions of the search space that other algorithms are unable to access. This fact indicates ISSA's ability to maintain a variety of solutions is better than that of other algorithms. Additionally, as shown in
Table 2, ISSA consistently achieves better-fit values than algorithms, demonstrating its capacity to avoid local optimum points. ISSA is also able to explore its ability to select a smaller number of features compared to other optimization algorithms.
4. Conclusions
In this study, we propose a new multi-feature selection technique for bacterial colony classification. The technique is based on the Salp Swarm Algorithm (SSA), which has been improved by incorporating the Opposition-Based Learning (OBL) and Local Search (LSA) algorithms. The proposed technique, called ISSA, was evaluated on a bacterial colony feature dataset. The results showed that ISSA outperformed several other optimization algorithms in terms of classification accuracy, suitability, and the number of features selected. The results also confirmed that OBL and LSA can improve the performance and solution quality of the SSA algorithm, and that they can help the algorithm converge to optimal solutions more quickly. The proposed technique is a promising new approach for bacterial colony classification. It is more accurate and efficient than previous methods, and it can be used to select a smaller subset of features, which can reduce the computational complexity of the classification task.
Author Contributions
Ahmad Ihsan: Conceptualization, Writing—original draft, preparation, Supervision. Khairul Muttaqin: Methodology, Supervision, Writing – Review & Editing. Rahmatul Fajri: Experimental work, Validation, Visualization, Data curation. Mursyidah: Formal analysis, Investigation. Islam Md Rizwanul Fattah: Writing – Review & Editing. All authors have read and agreed to the published version of the manuscript.
Institutional Review Board Statement
Not applicable.
Informed Consent Statement
Not Applicable.
Acknowledgments
This research was funded by Kementerian Pendidikan, Kebudayaan, Riset dan Teknologi, Republik Indonesia (Ministry of Education, Culture, Research, and Technology Republic of Indonesia), which supported this activity through DIPA DRTPM 159/E5/PG.02.00.PL/2023 in the Penelitian Dasar Kompetitif Nasional (PDKN) funds scheme under Contract Number 054/E5/PG.02.00.PL/2023. Our deepest gratitude to all those who have helped successfully implement this research, especially Direktorat Riset, Teknologi, Pengabdian Kepada Masyarakat (DRTPM) and Lembaga Penelitian Pengabdian kepada Masyarakat - Penjaminan Mutu (LPPM-PM) Universitas Samudra, which already invested trust in our capability to conduct this research.
Conflicts of Interest
The authors declare no conflict of interest.
References
- Liliana Serweci´nska, “Antimicrobials and Antibiotic-Resistant Bacteria :,” Water, vol. 12, pp. 3313–3330, 2020. [CrossRef]
- S. Mokrani, E. H. Nabti, and C. Cruz, “Recent Trends in Microbial Approaches for Soil Desalination,” Appl. Sci., vol. 12, no. 7, 2022. [CrossRef]
- M. Benami, O. M. Benami, O. Gillor, and A. Gross, “Potential microbial hazards from graywater reuse and associated matrices: A review,” Water Res., vol. 106, pp. 2016. [Google Scholar] [CrossRef]
- C. Joy, G. N. Sundar, and D. Narmadha, “AI driven automatic detection of bacterial contamination in water : AA review,” Proc. - 5th Int. Conf. Intell. Comput. Control Syst. ICICCS 2021, no. Iciccs, pp. 1281–1285, 2021. [CrossRef]
- M. R. Nurliyana et al., “The Detection Method of Escherichia coli in Water Resources: A Review,” J. Phys. Conf. Ser., vol. 995, no. 1, 2018. [CrossRef]
- M. A. Elaziz, K. M. Hosny, A. A. Hemedan, and M. M. Darwish, “Improved recognition of bacterial species using novel fractional-order orthogonal descriptors,” Appl. Soft Comput. J., vol. 95, p. 106504, 2020. [CrossRef]
- R. O. Panicker, K. S. Kalmady, J. Rajan, and M. K. Sabu, “Automatic detection of tuberculosis bacilli from microscopic sputum smear images using deep learning methods,” Biocybern. Biomed. Eng., vol. 38, no. 3, pp. 691–699, 2018. [CrossRef]
- J. Luo, W. Ser, A. Liu, P. H. Yap, B. Liedberg, and S. Rayatpisheh, “Microorganism image classification with circle-based Multi-Region Binarization and mutual-information-based feature selection,” Biomed. Eng. Adv., vol. 2, no. October, p. 100020, 2021. [CrossRef]
- E. Bonah, X. Huang, R. Yi, J. H. Aheto, R. Osae, and M. Golly, “Electronic nose classification and differentiation of bacterial foodborne pathogens based on support vector machine optimized with particle swarm optimization algorithm,” J. Food Process Eng., vol. 42, no. 6, pp. 1–12, 2019. [CrossRef]
- H.-C. K. Abdullah, Sikandar Ali,Ziaullah Khan, Ali Hussain, Ali Athar, “Computer Vision Based Deep Learning Approach for the Microscopic Images,” vol. 22, pp. 1–14, 2022. [CrossRef]
- M. F. Wahid, T. Ahmed, and M. A. Habib, “Classification of microscopic images of bacteria using deep convolutional neural network,” ICECE 2018 - 10th Int. Conf. Electr. Comput. Eng., pp. 217–220, 2019. [CrossRef]
- M. Talo, “An_Automated_Deep_Learning_Approach_for_Bacterial_,” pp. 1–5, 2019. [CrossRef]
- S. Li, W. Song, L. Fang, Y. Chen, P. Ghamisi, and J. A. Benediktsson, “Deep learning for hyperspectral image classification: An overview,” IEEE Trans. Geosci. Remote Sens., vol. 57, no. 9, pp. 6690–6709, 2019. [CrossRef]
- H. Yanik, A. Hilmi Kaloğlu, and E. Değirmenci, “Detection of Escherichia Coli Bacteria in Water Using Deep Learning,” Teh. Glas., vol. 14, no. 3, pp. 273–280, 2020. [CrossRef]
- B. Zieliński, A. Plichta, K. Misztal, P. Spurek, M. Brzychczy-Włoch, and D. Ochońska, “Deep learning approach to bacterial colony classification,” PLoS One, vol. 12, no. 9, 2017. [CrossRef]
- C. Singh and J. Singh, “Quaternion generalized Chebyshev-Fourier and pseudo-Jacobi-Fourier moments for color object recognition,” Opt. Laser Technol., vol. 106, pp. 234–250, 2018. [CrossRef]
- C. Wang, X. Wang, Y. Li, Z. Xia, and C. Zhang, “Quaternion polar harmonic Fourier moments for color images,” Inf. Sci. (Ny)., vol. 450, pp. 141–156, 2018. [CrossRef]
- B. Chen, H. Shu, G. Coatrieux, G. Chen, X. Sun, and J. L. Coatrieux, “Color Image Analysis by Quaternion-Type Moments,” J. Math. Imaging Vis., vol. 51, no. 1, pp. 124–144, 2015. [CrossRef]
- C. Huang, J. Li, and G. Gao, “Review of Quaternion-Based Color Image Processing Methods,” Mathematics, vol. 11, no. 9, pp. 1–21, 2023. 2023; 21. [CrossRef]
- B. He, J. Liu, T. Yang, B. Xiao, and Y. Peng, “Quaternion fractional-order color orthogonal moment-based image representation and recognition,” Eurasip J. Image Video Process., vol. 2021, no. 1, 2021. [CrossRef]
- K. M. Hosny, M. M. Darwish, and M. M. Eltoukhy, “Novel Multi-Channel Fractional-Order Radial Harmonic Fourier Moments for Color Image Analysis,” IEEE Access, vol. 8, pp. 40732–40743, 2020. [CrossRef]
- H. Tariq Al-Rayes, H. Tariq Ibrahim, W. Jalil Mazher, O. N. Ucan, and O. Bayat, “Feature Selection using Salp Swarm Algorithm for Real Biomedical Datasets,” IJCSNS Int. J. Comput. Sci. Netw. Secur., vol. 17, no. 12, pp. 13–20, 2017.
- M. A. Elaziz, Y. S. Moemen, A. E. Hassanien, and S. Xiong, “Toxicity risks evaluation of unknown FDA biotransformed drugs based on a multi-objective feature selection approach,” Appl. Soft Comput., vol. 97, no. xxxx, p. 105509, 2020. [CrossRef]
- M. Abd El Aziz and A. E. Hassanien, “An improved social spider optimization algorithm based on rough sets for solving minimum number attribute reduction problem,” Neural Comput. Appl., vol. 30, no. 8, pp. 2441–2452, 2018. [CrossRef]
- A. A. Ewees, M. A. El Aziz, and A. E. Hassanien, “Chaotic multi-verse optimizer-based feature selection,” Neural Comput. Appl., vol. 31, no. 4, pp. 991–1006, 2019. [CrossRef]
- L. Brezočnik, I. Fister, and V. Podgorelec, “Swarm intelligence algorithms for feature selection: A review,” Appl. Sci., vol. 8, no. 9, 2018. [CrossRef]
- S. Mirjalili, A. H. Gandomi, S. Z. Mirjalili, S. Saremi, H. Faris, and S. M. Mirjalili, “Salp Swarm Algorithm: A bio-inspired optimizer for engineering design problems,” Adv. Eng. Softw., vol. 114, pp. 163–191, 2017. [CrossRef]
- M. Zivkovic, C. Stoean, A. Chhabra, N. Budimirovic, A. Petrovic, and N. Bacanin, “Novel Improved Salp Swarm Algorithm: An Application for Feature Selection,” Sensors, vol. 22, no. 5, pp. 1–25, 2022. [CrossRef]
- S. Ben Chaabane et al., “Improved Salp Swarm Optimization Algorithm : Application in Feature Weighting for Blind Modulation Identification To cite this version: HAL Id: hal-03403685 Improved Salp Swarm Optimization Algorithm: Application in Feature Weighting for Blind Modulati,” pp. 0–14, 2023.
- S. Wang, H. Jia, and X. Peng, “Modified salp swarm algorithm based multilevel thresholding for color image segmentation,” Math. Biosci. Eng., vol. 17, no. 1, pp. 700–724, 2020. [CrossRef]
- X. Xie et al., “A Novel Feature Selection Strategy Based on Salp Swarm Algorithm for Plant Disease Detection,” Plant Phenomics, vol. 5, pp. 1–17, 2023. [CrossRef]
- M. Tubishat, N. Idris, L. Shuib, M. A. M. Abushariah, and S. Mirjalili, “Improved Salp Swarm Algorithm based on opposition based learning and novel local search algorithm for feature selection,” Expert Syst. Appl., vol. 145, p. 113122, 2020. [CrossRef]
- F. K. T. Rodrigues, Pedro Miguel,Jorge Luis, “Petri dishes digital images dataset of e.coli, s.aureus and p.aeruginosa,” Centre of Biotechnology and Fine Chemistry, 2022. https://figshare.com/articles/dataset/Dataset_bioengineering_17489364/20109377/2.
|
Disclaimer/Publisher’s Note: The statements, opinions and data contained in all publications are solely those of the individual author(s) and contributor(s) and not of MDPI and/or the editor(s). MDPI and/or the editor(s) disclaim responsibility for any injury to people or property resulting from any ideas, methods, instructions or products referred to in the content. |
© 2023 by the authors. Licensee MDPI, Basel, Switzerland. This article is an open access article distributed under the terms and conditions of the Creative Commons Attribution (CC BY) license (http://creativecommons.org/licenses/by/4.0/).
