Submitted:
08 October 2023
Posted:
08 October 2023
You are already at the latest version
Abstract
Modern countries generally deal with significant budget deficits and public debt. These countries need to rationalize their expenditures and increase revenue without major interference to economic flows. The aim of this paper is to create a model for forecasting public revenue and expenditure based on data from previous years. In the paper we formulated two hypotheses related to the validity of the set models. After detailed analysis, both hypotheses were accepted. The analysis includes all EU Member States and public revenue and expenditure data for the last decade. The significance of the analysis is reflected on the practical foundation of the pre-set theoretical views, which will have their basis in statistically significant results. By analyzing the model, we formulated the regression formulas of revenues and expenditures, which can be efficiently used in predicting these variables.
Keywords:
European Union
; public revenues
; public expenditures
; regression analysis
1. Introduction
In the modern international socio-economic environment, both developed and transition countries face permanent aggravated circumstances on their budget deficits. Particularly, when countries deal with a significant amount of public debt, there is a multitude of aspects to approach this problem. On the one hand, there is an evident budget deficit pressure, and on the other hand, the growth of public debt creates multiple problems for the country and the respective economy [1]. Governments often come borrowing in the markets to refinance the existing public debt and aiming to reduce the budget deficit [2]. Additional borrowing is not a problem itself. However, a problem may arise when borrowing and the allocation is made for activities that cannot be the basis for the creation of new value and should serve as an initial point for the repayment of due liabilities [3]. Moreover, economic growth requires public spending on cost-effective activities [4]. However, if this trend persists in the long run, there will be the danger of becoming chronic, making that then multiple additional efforts will be necessary to solve the problem [5]. This is a strong argument and one important reason for a country focusing on its budget policy [6].
The importance of the budget is a growing topic that goes beyond the context of the European Union and that has a significant impact on other European countries, not members of the European Union [7]. State members’ budgets have an increased importance in the economies either in terms of revenues or expenditures [8]. The compatibility of revenues and expenditures determines the financial system development [9]. The budget policy is crucial and is in the center of contemporary fiscal theory, which involves the synthesis of the government revenues and expenditures as the main factor of the stabilization policy [10]. Foundations of fiscal integration in the European Union were laid back in the 1990s. The most important is that public revenues and public expenditures have a significant impact on the achievement of macroeconomic goals. The importance of an adequate public revenue and expenditure management policy lays in securing funding [11]. Since the 1990s the economic integration process has led to the adoption of some common budgetary rules, both in Western and Central and Eastern European countries that have joined the European Union [12]. The effective fiscal policy management is crucial for the economic development [13]. It is very important to emphasize the way of financing European Union, in terms of a community, where the contribution of Member States should have been a transitional solution which, nevertheless, has been maintained up to the present day as one of the main sources of financing [14]. Public expenditure definition needs to get a more precise delimitation as well as public revenues definition, which allocation depends on each country [15]. The regulation of relations between central, federal and local authorities regarding the distribution of public functions and the funding sources is known under the name of financial federalism [16]. However, there are no two federal states or two integration groups where these relations are regulated in the same way [17].
The EU fiscal system plays an important role in the European Union’s market integration. The structure of the EU fiscal system results for the EU budget as the only fiscal policy instrument from the central, supranational level of the European Union [18]. An adequate budget policy also creates opportunities for a sustainable development [19]. The orderliness of the financial system has positive effects on attracting foreign direct investment. That represent contemporary models of capital movements all around the world [20]. Adopted measures must be related with these categories, since their synchronization in the budget must always find the necessary financial resources for the realization of the obligations.
By integrating the measures of adopted policies there is a more effective cohesion that will have significant positive effects on competitiveness [21]. Otherwise, the lack of funds, considering the period when the obligations are due, creates the imperative of borrowing to fulfill them, increasing the amount of public debt and the associated negative consequences.
The aim of this paper is related to public revenues and public expenditures of EU Member States in the last decade. Similar analyzes were published in earlier researches, but this is the first analysis that relates to all EU member states. Earlier researches on this subject were mostly limited to one country, so in that sense, this paper has left state borders and has the broadest research subject. This research is trying to create a model for predicting public revenue and expenditure at the same, which is not the case for papers that dealt with this issue in the past, which will be presented in the analysis of the results. In addition to the theoretical review, a statistical analysis will be conducted to show whether they can be projected for the upcoming period based on the value of public revenues and expenditures from the past period. The importance of such analysis is great since the eventual realization would reinforce the importance of the adequate budget policy management and adopted measures. The validity of the set model will indicate the need and significance of cautious and conscientious management of public revenue and expenditure. Possible omissions will have consequent negative consequences not only on the country where the omission occurred, but also on the entire European Union. However, it should be borne in mind that the coverage of data is limited to ten years, which can be considered as a limitation of this model, as well as the fact that only one independent variable was considered to predict both categories. Nevertheless, the database is sufficient for the obtained results to be considered statistically significant. In the coming years, the new data will serve as a kind of test of the set model, so the time ahead will be the best judge. An appropriate budget policy is necessary not only in developed countries but also in developing countries [22]. Likewise, public expenditure in transition countries is an important instrument of economic growth [23]. The weight of economic growth and development is in line with monitoring public expenditures and planning public revenues [24].
The paper is structured as follow: the next section (Section 2) deals with the literature review. Section 3 approaches public revenues and public expenditures in the European Union member states. In Materials and Methods section (Section 4) a methodological framework for the research is presented. In Section 5 results are provided and Section 6 was left for Conclusions.
2. Literature review
This paper examines, first and foremost, the possibility of forecasting public expenditures and public revenues based on their values in the previous period in order to demonstrate the importance of policies accepted over a longer period of time. Considering that it is important to study the sustainability of countries fiscal policies.
Gordon and Cosimo [25] examined the sustainability of fiscal policy in EU Member States in the period 1980-2015. A special attention was given to the long-term link between public revenues and expenditures. The obtained results showed that public revenues do not cause public expenditures and vice versa. Results show that public expenditures are growing significantly faster than public revenues. This is a reason why a special attention should be given to policies that define the movement of these categories.
Greiner et al. [26] studied the sustainability of fiscal policies of European Monetary Union Member States with high public debts and GDP deficits. Econometric indicators allow to study the sustainability of fiscal policies. It also imposes the need of analyzing the dependence of public revenues and public expenditures as well as the ability to predict them based on their movements in the previous period, emphasizing the importance of the accepted and implemented policies related to them.
Halásková and Halásková [27] studied public expenditures and their significance in EU Member States. They concluded that the Scandinavian countries and France are among the best rated when considering public expenditure. On the opposite side, Baltic states as well as Cyprus and Romania have the lowest ratings. A unified policy is needed to be applied to all EU Member States [28]. Its conception may result from determining the dependency in the allocation of public expenditures and the possibility of predicting them in the future. The statistical significance of the obtained results can be another indicator of the implemented policies' effects.
Abdallah and Ziad [6] examined the dependence of public revenues and public expenditures in Jordan in 1976-2016 and found a two-way relationship. The importance of examining these categories and predicting them in the future is highlighted. Proving this possibility emphasizes that their effects can be crucial over many years.
Luković and Grbić (2014) studied the relationship between public revenue and expenditure in the Republic of Serbia. They found that there is very high correlation between the considered categories as well as that public expenditures cause public revenues.
Liyambo and Kaulihowa (2020) investigated the causal relationship between public revenue and public expenditure in Namibia. Like most authors who deal with this issue, they found that there is a long-term positive correlation, but also pointed out the importance of an adequate fiscal policy whose regulations will be crucial. They also emphasized that almost all countries overestimate public expenditure and underestimate public revenue, which must not be a practice having in mind the results they have achieved.
3. Public revenues and public expenditures in the European Union member states
Before presenting the methodology that provides a detailed statistical analysis for this issue, it is important to mention Appendix A that presents the share of public revenues in GDP of the EU Member States for the period 2009-2018. Considering the year of 2018 for reference, the table shows that there is a group of countries with a share of public revenues above 50% of GDP, that include Belgium, France, Denmark, Finland and Sweden. If we look at the first and last year of the observed period, it can be seen that there were no significant changes in these countries, in terms of the share of public revenues in GDP. Although in Belgium this share increased by 3%, or in Denmark decreased by 1.7%, there were really small changes reported for Finland (0.6% increase) and Sweden (1.2% decrease). The table used was the table in the Appendix A.
There is a group of 9 countries (in 2018) with a share of public revenues among 30 and 40%. This group of countries includes Bulgaria, Estonia, Ireland, Spain, Cyprus, Latvia, Lithuania, Malta, Romania and Slovakia.
It is worth pointing out the case of Ireland as the country with the lowest share of public revenues, which was only 25.8% in 2018, a rate that was less than half the one of France in the same year.
If the limit moves to the range of 40-50%, there are 13 countries (in 2018) in this group (Czech Republic, Germany, Greece, Croatia, Italy, Luxembourg, Hungary, Netherlands, Austria, Poland, Portugal, Slovenia and UK).
Additionally, public expenditures for the EU Member States are also considered in the Table 4, for the same period. Data can be found also in the Appendix. It can be seen that four countries has a share of public expenditures over 50% of GDP (Belgium, Denmark, France and Finland). This situation relates to 2018 (if the initial year of the analyzed period was observed, the list of countries would be much larger and it would include 11 countries). This leads to obvious conclusion that EU Member States are pursuing restrictive policies as a consequence of the rising of public debt and budget deficit. It is possible to compare the countries with the share of public revenues over 50%, which was discussed in the analysis of the Appendix.
It is found that the same countries are in both cases (with the exception of Denmark, which is on the limit with 49.9% of public expenditures. Higher public expenditures also require higher revenues as a necessary financing source. The manner of collecting these revenues is not discussed because that is not the topic of this research. If the range of public expenditures to GDP was set between 40-50%, then the majority of EU countries would belong to this group. Even 64% of EU Member States (18 out of 28) have a share of public expenditure within these borders. In this group, Sweden has the largest share (49.9%) in 2018 and is at this line since 2015. In previous years, the share was over 50%. The example of Greece is also interesting because this country had the largest share of public expenditures in GDP for several years. The highest value was reached in 2013, 62.3% of GDP. Values have been constantly declining since 2015 and reduced to 46.7% of GDP in 2018. The example of Ireland that shows a very high value (65.1%) for the public expenditure share of GDP in 2010. This participation is also a record in the list of these countries throughout the observed period. Excessive public expenditures, compared to public revenues in the same year, required changes in economic policies. Accepted restrictive measures, which had to be taken, quickly began to give results. From 2011 to 2018, there was a continuous decline in the share of public expenditures in GDP.
4. Materials and Methods. Methodological Framework for Research
Regression analysis was used to define the model for forecasting public expenditures and revenues. However, you should keep in mind the problems that may arise from its use. Its application is simpler if large series of data are processed, which is a characteristic of survey questionnaires [29]. Since it is impossible to use surveys for the issues that are the subject of this article, the results may be questionable. The data we have are based on available statistical reports that do not have a sufficient amount of data. The available data, for most countries, are constant and comparable only in the last decade. This can be a problem as it may call into question the fulfillment of the model justification assumptions [30]. This, in this case, was not a problem, which will be seen in the interpretation of the results and the justification of the model [31]. A common problem arises in connection with multicollinearity, but with the development of sophisticated software, they have been largely overcome, by no means eliminated [32]. The method of inference using regression analysis can be presented in the following figure. The fulfilled conditions allow the transition to the next phase of the analysis, such as returning to the previous result of the unfulfilled conditions of the current one.
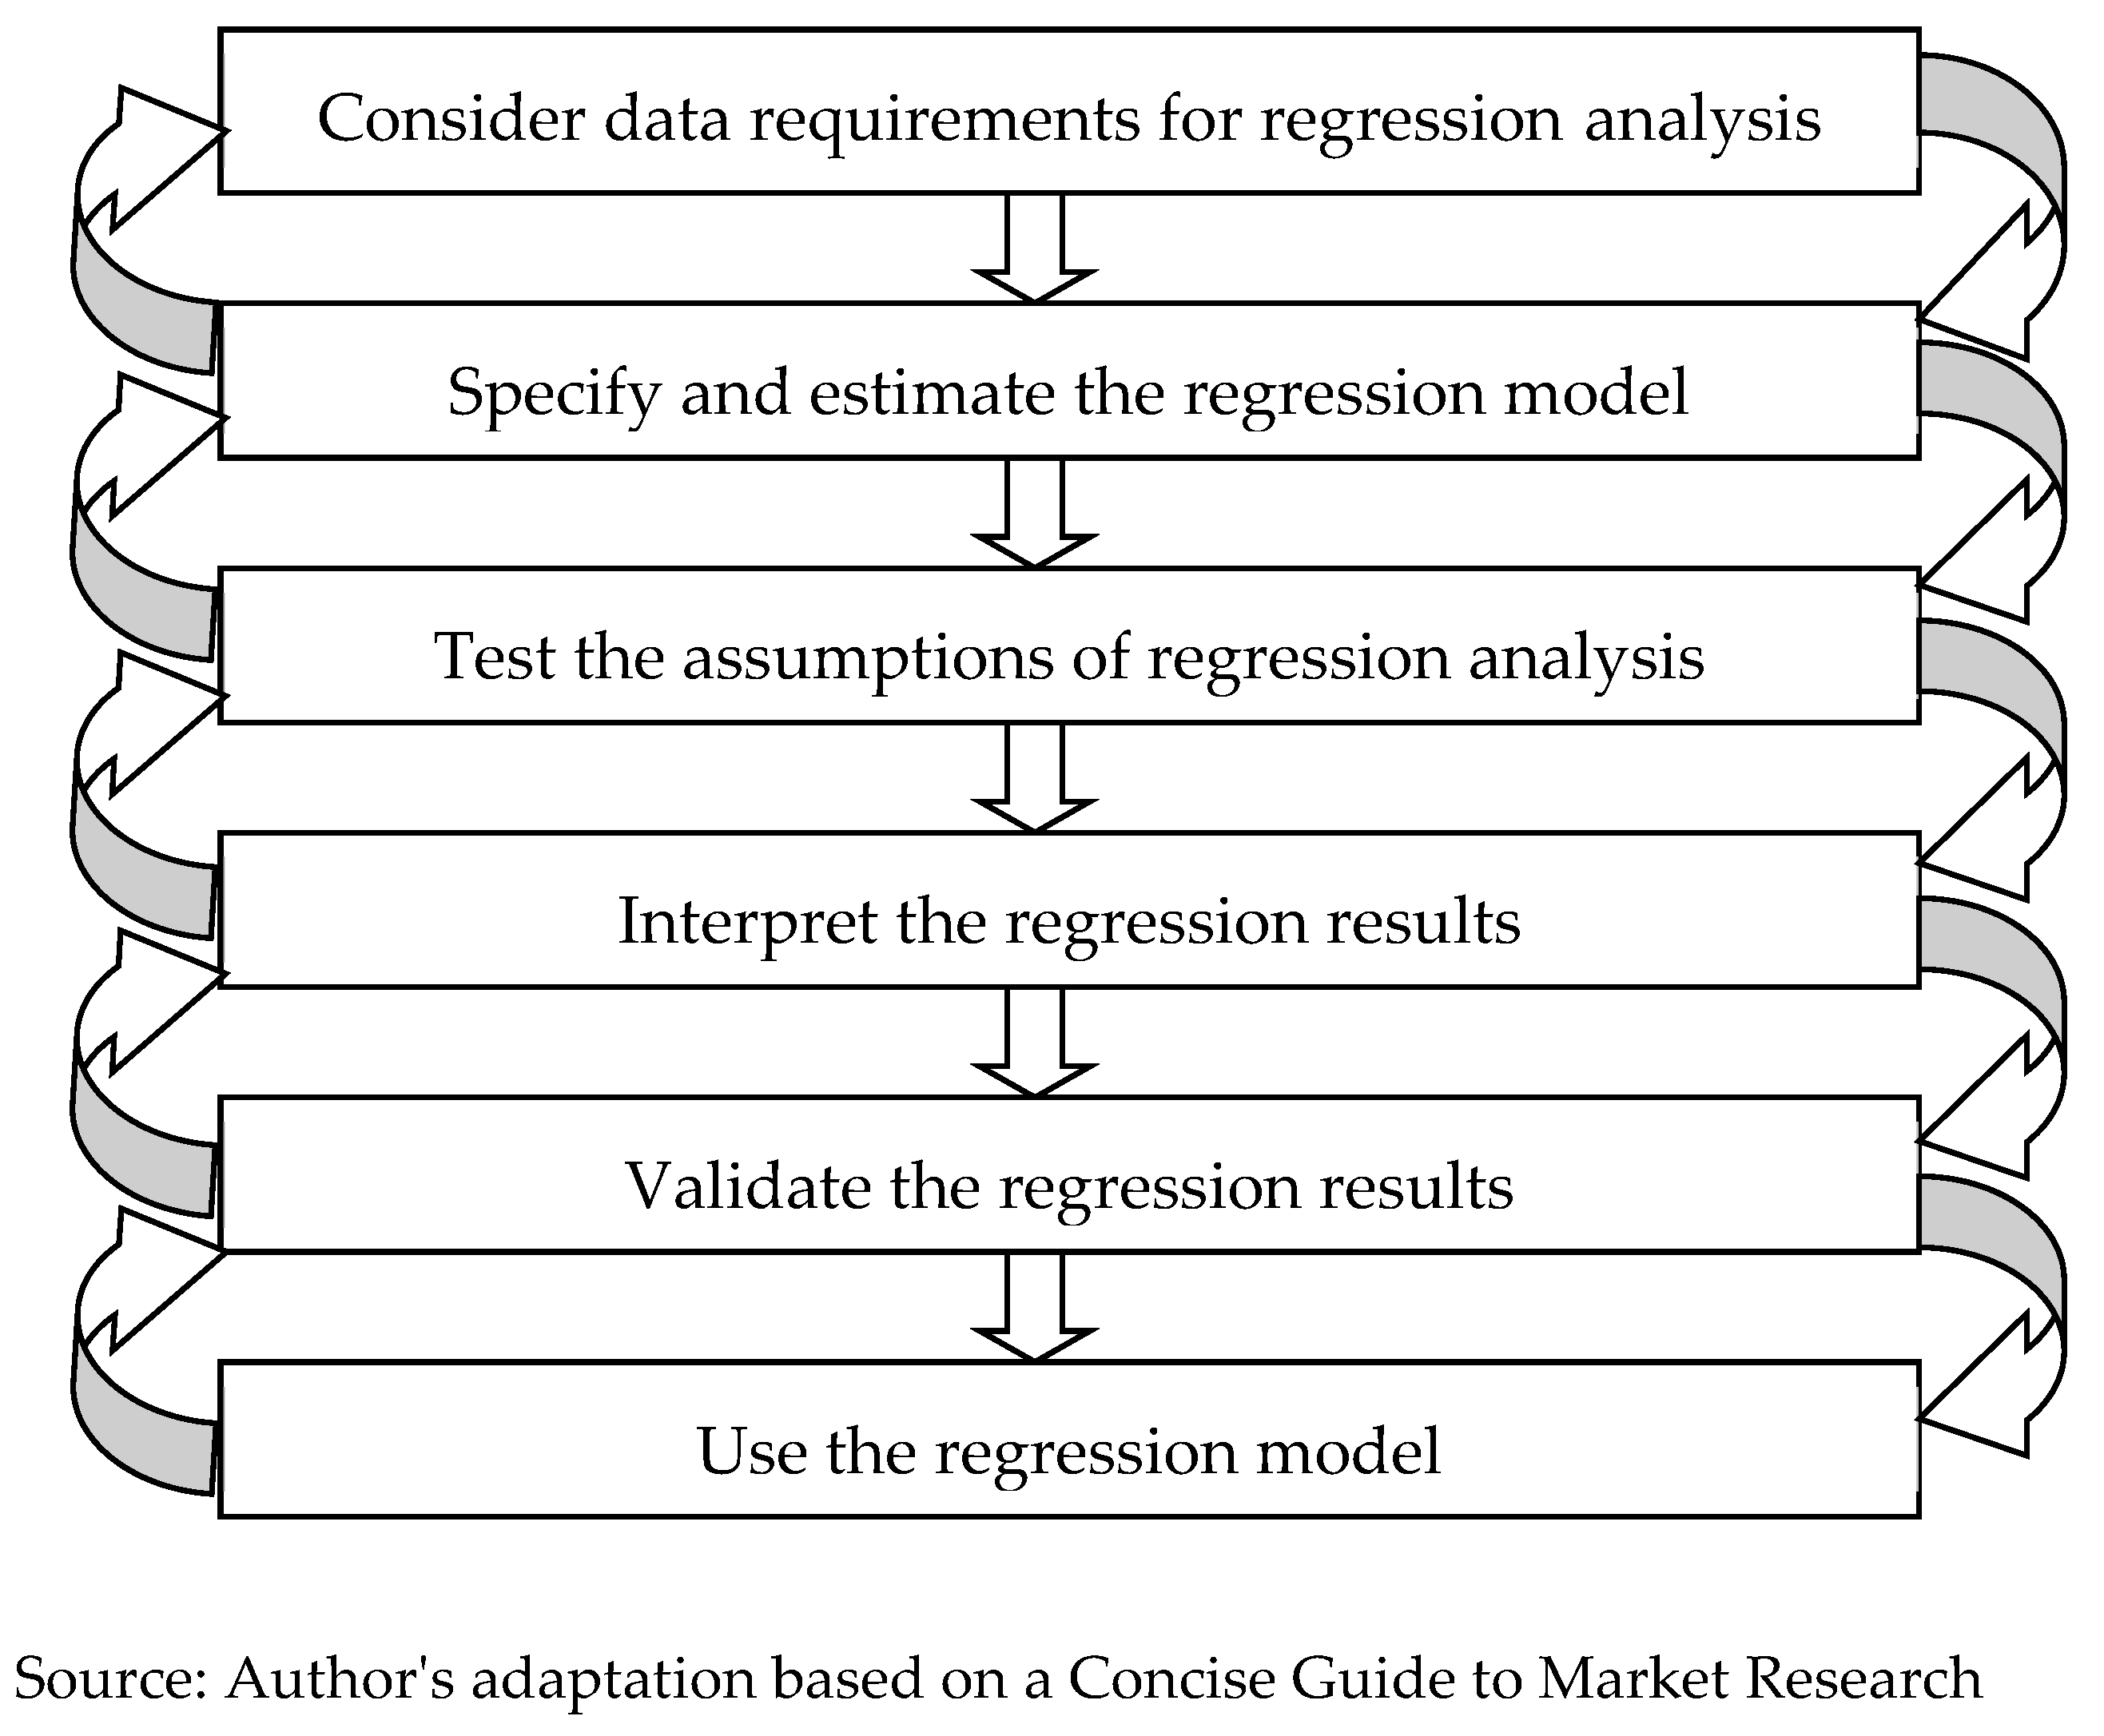
Figure 1.
Conducting a regression analysis.
The collected data was used on the basis of the multiple regression model, that allows to answer the general question of how well a set of independent variables predicts a dependent variable, as will be seen next. The analysis was made in terms of revenues and expenditures of EU Member States in the period 2009-2018. Thus, by using multiple regression analysis, two models are evaluated.
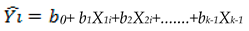
The general model of a multiple linear model can be represented as follows:
where:
Y= β0 + β1X1 + β2X2 + ........ + βk-1Xk-1+ε,
Y - dependent variable (revenues and expenditures for 2018);
X1,X2,.....,Xk-1 - independent (explanatory) variables (revenues and expenditures in 2009-2017);
ε - accidental mistake;
β0, β1, β2, βk-1- unknown parameters;
The corresponding causal regression function can be represented as follows:
 where are
b0, b1, bk-1- parameter estimates;
 - estimated value for Yi.
Given that the real value of the i-th observation Y-Yi is generally not equal to the estimated value , there are differences between Yi i which is, in fact, a residual ei.
, there are differences between Yi i which is, in fact, a residual ei. ei = Yi - respectively Yi = + ei
respectively Yi = + ei
parameter estimates b0, b1, bk-1 are obtained from the condition where the sum:
 is the smallest possible.
The regression model should define two sets of regression equations (revenues and expenditures), which will largely depend on the validity of the obtained results. We will formulate two specific hypotheses related to revenues and expenditures, respectively.
H1= the regression model is well defined and revenues for 2018 can be predicted with certainty.
H2 = the regression model is well defined and expenditues for 2018 can be predicted with certainty.
Interpretation of the obtained results as well as acceptance of H1 / H2 will be discussed more detail in the next section (Results and discussion).
5. Results and discussion
Many authors point out the importance of identifying a model of predictable revenues and expenditures. Table 1 presents descriptive statistics of analyzed data (public revenue).
The Table 2 shows that the multiple regression was used to analyze the data. It emphasizes the relationship of one dependent (continuous) variable and multiple independent variables (predictors). The multiple regression analysis answers the question of how well the set of independent variables (revenues in period 2009-2017) predicts the dependent variable. All data refers to the EU Member States in Table in the Appendix.
Multiple regression analysis was used to assess the possibility of forecasting revenues in 2018 based on national and local revenues of EU Member States from 2009 to 2017. Preliminary analysis showed that the assumptions of normality, linearity, multicollinearity and homogeneity of variances were not compromised. The model as a whole explained 92% of the total variance F (9.18; 28) = 409.57, p<0.005. This is an acceptable result. It can be concluded that the model is effective. In the observed period, beta coefficients for four years are negative, which means that they reduce the value of the dependent variable (public revenue from 2018), while the beta coefficient in the remaining five years is positive, which means that they increase the value of the dependent variable. It should be noted that the results from 2009 and 2013 have the lowest statistical significance. In 2009 (beta = -0.031, p = 0.773) while in 2013 (beta = 0.031, p = 0.895). It is important to emphasize that the values of the beta coefficient are the lowest in the observed period, which is a mitigating circumstance because they have the lowest unique contribution to the set model. There were statistically significant results of revenue from two years to forecast revenue in 2018, both from 2017 (beta = 0.999, p<0.005) and 2010 (beta = -0.001, p <0.05). The validity of the model allows the formulation of a regression equation. Thus, the first specific hypothesis related to revenues can be accepted – H1 = the regression model is well defined and revenue for 2018 can be predicted with certainty.
Abdallah and Ziad [6] came to the conclusion that the movement of revenues is mutually conditioned. This statistically and mathematically confirms their assumptions. Their recommendations are related to the determination of predictable models. They considered the development of public revenue and expenditure in Jordan over the last 40 years and created a model for forecasting them. However, as shortcomings of the created model, they stated insufficient statistical validity and significance, a consequence of many factors. They stated that the most significant ones are inconsistencies and frequent changes in fiscal policy measures, so it is difficult to monitor the movement of revenues and expenditures, and thus set a model that will be authoritative.
Bretschneider and Schroeder [33] stressed the importance of determining the dependence in the movement of public revenues so that the established model could predict their movements and thus highlight on time the advantages or disadvantages of economic policies. Their model explained 81% of the total variance with a level of statistical significance of p <0.005. As in the case of previously analyzed authors, this model was created based on data on the movement of public revenues in one country - Germany in the period 1973-1983.
Caruthers and Wentworth [34] point out that the regression model is the most efficient of forecasting techniques in the movement of public revenues. They also pointed out its shortcomings, which we also mentioned in the conclusion. The model they created explained only 59% of the total variance, which means that it is not well set, regardless of the statistical significance of p <0.005.
The regression equation:
Revenues_2018 = – 0.032*Revenues_2009 – 0.001*Revenues_2010 + 0.212*Revenues_2011 – 0.225*Revenues_2012 + 0.031*Revenues_2013 – 0.167*Revenues_2014 + 0.049*Revenues_2015 + 0.119*Revenues_2016 – 0.964*Revenues_2017

Table 3.
Predicted & Residual Values (Spreadsheet1) Dependent variable: revenues ‘18.
| Observed Value |
Predicted Value | Residual | Standard Pred. v. | Std.Err | Mahalanobis Distance | Deleted Residual |
Cook's Distance | |
|---|---|---|---|---|---|---|---|---|
| 1 | 51.800 | 51.028 | 0.771 | 1.230 | 0.214 | 3.049 | 0.905 | 0.039 |
| 2 | 36.800 | 36.405 | 0.394 | -1.016 | 0.456 | 17.144 | 1.197 | 0.310 |
| 3 | 41.500 | 41.189 | 0.310 | -0.281 | 0.259 | 4.915 | 0.397 | 0.011 |
| 4 | 52.000 | 52.014 | -0.014 | 1.381 | 0.371 | 11.020 | -0.025 | 0.000 |
| 5 | 45.600 | 45.348 | 0.251 | 0.357 | 0.282 | 5.961 | 0.338 | 0.009 |
| 6 | 39.000 | 39.457 | -0.457 | -0.547 | 0.347 | 9.530 | -0.749 | 0.070 |
| 7 | 25.800 | 26.018 | -0.218 | -2.612 | 0.516 | 22.261 | -1.560 | 0.675 |
| 8 | 47.800 | 48.438 | -0.638 | 0.832 | 0.444 | 16.253 | -1.761 | 0.637 |
| 9 | 38.900 | 38.309 | 0.590 | -0.724 | 0.227 | 3.538 | 0.709 | 0.027 |
| 10 | 53.500 | 53.458 | 0.041 | 1.603 | 0.217 | 3.142 | 0.049 | 0.000 |
| 11 | 46.600 | 46.615 | -0.015 | 0.552 | 0.361 | 10.439 | -0.027 | 0.000 |
| 12 | 46.400 | 46.240 | 0.159 | 0.494 | 0.268 | 5.331 | 0.208 | 0.003 |
| 13 | 39.900 | 39.682 | 0.217 | -0.512 | 0.366 | 10.754 | 0.383 | 0.020 |
| 14 | 37.500 | 37.966 | -0.466 | -0.776 | 0.270 | 5.396 | -0.610 | 0.028 |
| 15 | 34.700 | 34.646 | 0.053 | -1.286 | 0.320 | 7.948 | 0.079 | 0.000 |
| 16 | 45.500 | 44.551 | 0.948 | 0.235 | 0.251 | 4.523 | 1.190 | 0.092 |
| 17 | 44.200 | 44.551 | -0.351 | 0.235 | 0.338 | 8.983 | -0.556 | 0.036 |
| 18 | 38.800 | 39.539 | -0.739 | -0.535 | 0.230 | 3.642 | -0.891 | 0.043 |
| 19 | 43.600 | 44.077 | -0.477 | 0.162 | 0.240 | 4.074 | -0.586 | 0.020 |
| 20 | 48.600 | 48.414 | 0.185 | 0.828 | 0.216 | 3.100 | 0.218 | 0.002 |
| 21 | 41.200 | 40.424 | 0.775 | -0.399 | 0.263 | 5.083 | 0.999 | 0.072 |
| 22 | 43.500 | 43.045 | 0.454925 | 0.003 | 0.274 | 5.605 | 0.601 | 0.028 |
| 23 | 32.000 | 31.915 | 0.084 | -1.706 | 0.440 | 15.903 | 0.226 | 0.010 |
| 24 | 43.100 | 43.399 | -0.299 | 0.058 | 0.257 | 4.789 | -0.381 | 0.009 |
| 25 | 39.900 | 40.379 | -0.479 | -0.405 | 0.433 | 15.361 | -1.213 | 0.287 |
| 26 | 52.800 | 53.220 | -0.420 | 1.567 | 0.255 | 4.737 | -0.532 | 0.019 |
| 27 | 50.800 | 51.108 | -0.308 | 1.242 | 0.334 | 8.784 | -0.482 | 0.027 |
| 28 | 42.800 | 43.153 | -0.353 | 0.020 | 0.510 | 21.722 | -2.213 | 0,657 |
Source: Authors’ calculation – SPSS
This is a table obtained by applying multiple regression analysis. Residuals are the differences between the obtained and the predicted value of the dependent variable.
By applying the standard multiple regression, the prediction of the dependent variable (Revenues 2018) is based on the models composed of the independent variables (Revenues 2009-2017).
Multiple regression is very sensitive to atypical points (very large or very small values of the results). Finding and processing atypical points should be part of the initial data cleaning process. This should be done for all variables, both dependent and independent used in multiple regression analysis. The multiple regression program also has special procedures for detecting atypical points.
As the part of a standard multiple regression analysis, this table is used to determine atypical points. Atypical points can be found by reviewing the Mahalanobis residual distances calculated by the program. To identify atypical points, we first need to calculate the critical value for the chi-square, where the number of degrees of freedom is equal to the number of independent variables. With an α level of 0.001 and other independent variables in the model, the critical value for calculating Mahalanobis distances is 18.47. In order to determine whether any of the examined cases has a Mahalanobis distance larger than this number, in the table above we need to find a cell in which the Maximum for Mahalanobis Distance is 17.144. Given that the highest value of Mahalanobis distances is 17.144 and it is less than the critical value of 18.47, we conclude that there are no atypical points. In case there are atypical points, such a variables should be excluded from the model and the whole process should be repeated. The regression equation would be shorter in each subsequent iteration. This would mean that the number of independent variables affecting the dependent one is decreasing. An alternative way of determining atypical points is by looking at the values of the Residuals. In our example, all residuals are rectangularly arranged and most of them are concentrated in the center (around point 0), which once again confirms that there are no atypical points. The problem is cases with standardized residual values greater than 3 and less than -3. In our example, all values are within these limits, so, once again, we can conclude that there are no atypical points. However, the determination of atypical points using the Mahalonobis distance is more precise.
Next, we consider the value of Cook’s Distance. The problem may be cases for which this distance exceeds the value 1. From the table above we see that the maximum value (Maximum) for Cook’s Distance is 0.657 which is less than 1 and indicates that there are no atypical points.
Public expenditures were considered in an identical way. Table 4 presents descriptive statistics of the analyzed data (public expenditures).
Table 4.
Descriptive Statistics.
| N | Minimum | Maximum | Mean | Std. Deviation | |
|---|---|---|---|---|---|
| r18 | 280 | 25.70 | 62.30 | 47.63 | 6.49 |
| Valid N (listwise) | 280 |
Source: Authors’ calculation – SPSS.
A multiple regression analysis was also conducted to answer the question of how well the set of independent variables (expenditures 2009-2017) predicts the dependent variable (Table 3). As with the previous model, all data refer to the EU Member States in Table 5.
Multiple regression analysis was used to assess the possibility of forecasting expenditures in 2018 based on expenditure at national and local level of EU Member States from 2009 to 2017. Preliminary analysis showed that the assumptions of normality, linearity, multicollinearity and homogeneity of variances were not compromised. The model as a whole explained 97% of the total variance F (9.18; 28) = 87.842, which makes the model efficient. In the observed period, beta coefficients have a negative sign for three years, which means that they reduce the value of the dependent variable (public expenditures from 2018), while the beta coefficient in the remaining six years is positive, which means that they increase the value of the dependent variable. It should be noted that the results from 2009 and 2012 have the lowest statistical significance. In 2009 (beta = 0.019, p = 0.907) while in 2012 (beta = 0.143, p = 0.418). It is important to emphasize that the values of the beta coefficient are the lowest in the observed period, which is a mitigating circumstance because they have the lowest unique contribution to the set model. The largest unique contribution to forecasting expenditures in 2018 are expenditures from 2017 (beta is 0.640), 2015 (beta is -0.495) and 2016 (beta is 0.450). The validity of the model allows the formulation of a regression equation. Thus, the second specific hypothesis related to expenditures can be accepted – H2 = the regression model is well defined and expenditures for 2018 can be predicted with certainty.
Grupta et al. [22] argued about the importance of expenditures for the successful functioning of the economy. They considered that one of the main tasks is to determine a model whose application will reduce economic fluctuations. They set up a model for predicting public expenditures that explains 90% of the total variance with exceptional statistical significance p <0.005. Developing countries were analyzed and this is one of the first papers to expand the consideration beyond the borders of one country, which is an outstanding contribution to the scientific literature.
Schroeder [35] also pointed to problems related to the time series of available data. Since his research was conducted in 1980, the data are now statistically more comprehensive.
Alawneh [39] has dealt in his work with the impact of public expenditure and public debt on taxes on the example of Jordan. He tried to set up a model for forecasting public revenues but managed to set up a statistically significant model only for public expenditures. The model explained 69% of the total variance with p <0.005, which guaranteed statistical significance.
The regression equation:
Expenditures_2018= 0.026*Expenditures_2009 – 0.313*Expenditures_2010 + 0.218*Expenditures_2011 + 0.144*Expenditures_2012 – 0.159*Expenditures_2013 + 0.400*Expenditures_2014 – 0.478*Expenditures_2015 + 0.424*Expenditures_2016 + 0.612*Expenditures _2017
The data in Table 6 show that there are no atypical points. This claim is based on Mahalanobis Distance which must not be above 18.74, Cook’s Distance which must be within (-1; 1), as well as Residual Values which must be within (-3; 3). A more detailed interpretation of the obtained statistical results can be found in the opus of the Table 3 and is applicable to the Table 6.
6. Conclusions
Synthesis of public revenues and public expenditures is the basis of a stabilization policy that every country must pursue. At the center of contemporary fiscal theory is budgetary macroeconomic policy, which is the strongest lever in both stabilization and development policy. Looking at the data of the share of public revenues and public expenditures in GDP, it is clear that there are significant variations in results of EU Member States. For this reason, they are grouped categorically, among the established limits of 30-40%, 40-50% and more than 50%. Countries with a higher share of public expenditure also have a higher share of public revenue in GDP. This proportion is necessary because higher expenditures also require higher revenues as a necessary condition of their financing. A more detailed statistical analysis concerned the possibility of forecasting public expenditures and public revenues based on their values in previous years. Therefore, multiple regression analysis was used and significant statistical results were obtained. Namely, in the case of public revenues and public expenditures, the assumptions of normality, linearity, multicollinearity and homogeneity of variance are satisfied. In both cases, the forecasting models were well fitted and the results obtained were statistically significant, which allowed the creation of regression equations for both public revenues and public expenditures. Both hypotheses (H1/H2) have been confirmed. A comparison was made with previous similar research and attempts to create a model for forecasting public revenues and expenditures, which is the initiator of the topic of this paper. Previous research has created models for forecasting both categories but related to individual countries and the authors examined either public revenues or expenditures. In that sense, this research is more comprehensive than all the previous ones, which has achieved a significant scientific contribution on this topic. This claim is based on the possibility of implementing the model in all EU member states whose data was taken into consideration.
The limitations of the model represent a smaller statistical coverage base, so the results would be much more authoritative if the data was available for a longer period of time. Certainly, in the years and decades to come, the coverage of data will be wider, and thus the significance of the obtained results. Creating this or similar models is difficult to implement in developing countries due to poor statistical coverage of the required data. In some cases, data are not available even on an annual basis. There is also a problem with monthly reports, which generally do not provide an opportunity to perform an analysis. In addition, as a shortcoming of the model, we can mention the consideration of only one independent variable in the prediction of the dependent, both in case of public revenue and in the case of public expenditure. The challenge for future authors may be to include some more independent variables in forecasting the categories of public revenues and expenditures. Also, it would be interesting to make forecasting models in developed and underdeveloped countries and see what the differences and similarities are in that case. It would be challenging for authors on this topic to create a forecasting model of total public revenues and public expenditures where their categories would be set as independent variables and examined which one have the biggest impact and statistical significance. This would be of big importance, especially in the crisis periods we are facing, because governments could focus on certain categories when quick and positive results are needed, regardless the fact that they would still be unsustainable in the long term. Facing management of public revenues and expenditures through future surveys, authors should specify the most effective measures and instruments.
This model, on the other hand has possibility of application in practice. One of the most important is certainly the prediction of defined categories. The ability to predict trends of public revenues and expenditures facilitates the precision of defining budget policies. The ability to predict trends in public revenues and expenditures facilitates the precision of defining budget policies. Thus, problems that may be caused by insufficient or excessive public revenues and expenditures can be seen in time. This leaves enough or at least more space for the creators of macroeconomic policies to be able to adopt measures in time that will bring positive results both in the long term and in the short term and enable the achievement of all macroeconomic goals.
Author Contributions
All authors contributed equally to this work. All authors wrote, reviewed, and commented on the manuscript. All authors have read and approved the final manuscript.
Funding
This research received no external funding.
Conflicts of Interest
The authors declare no conflict of interest.
Appendix A
Total public revenues as the % of GDP in the EU Member States
| Years | ||||||||||
| States | '09 | '10 | '11 | '12 | '13 | '14 | '15 | '16 | '17 | '18 |
| Belgium | 48.8 | 49.3 | 50.3 | 51.6 | 52.7 | 52.2 | 51.4 | 50.7 | 51.3 | 51.8 |
| Bulgaria | 35.3 | 33.1 | 31.9 | 34.1 | 37.3 | 37.7 | 38.8 | 35.2 | 36.2 | 36.8 |
| Czech Rep. | 38.7 | 39.3 | 40.3 | 40.5 | 41.4 | 40.3 | 41.1 | 40.2 | 40.5 | 41.5 |
| Denmark | 53.7 | 54.0 | 54.4 | 54.5 | 54.6 | 56.4 | 53.2 | 52.6 | 52.6 | 52.0 |
| Germany | 44.3 | 43.0 | 43.8 | 44.3 | 44.5 | 44.5 | 44.5 | 44.8 | 45.0 | 45.6 |
| Estonia | 43.9 | 40.7 | 38.6 | 39.0 | 38.3 | 38.5 | 39.7 | 39.1 | 38.9 | 39.0 |
| Ireland | 33.2 | 33.0 | 33.7 | 34.0 | 34.2 | 33.8 | 27.0 | 26.9 | 26.0 | 25.8 |
| Greece | 38.9 | 41.3 | 43.8 | 46.9 | 49.1 | 46.6 | 47.9 | 49.4 | 48.1 | 47.8 |
| Spain | 34.8 | 36.2 | 36.2 | 37.6 | 38.6 | 38.9 | 38.5 | 37.7 | 37.9 | 38.9 |
| France | 50.0 | 50.0 | 51.1 | 52.1 | 53.1 | 53.3 | 53.2 | 53.0 | 53.6 | 53.5 |
| Croatia | 42.3 | 41.7 | 40.6 | 42.5 | 42.4 | 42.9 | 45.2 | 46.3 | 46.1 | 46.6 |
| Italy | 45.9 | 45.7 | 45.7 | 47.9 | 48.1 | 47.9 | 47.7 | 46.5 | 46.5 | 46.4 |
| Cyprus | 36.7 | 37.3 | 36.7 | 36.4 | 36.7 | 39.8 | 39.3 | 38.3 | 39.1 | 39.9 |
| Latvia | 35.0 | 36.8 | 36.2 | 36.8 | 36.6 | 36.6 | 36.9 | 37.0 | 37.2 | 37.5 |
| Lithuania | 35.8 | 35.4 | 33.5 | 33.0 | 32.9 | 34.0 | 34.6 | 34.4 | 33.6 | 34.7 |
| Luxembourg | 44.5 | 43.5 | 42.9 | 44.4 | 44.3 | 43.3 | 43.3 | 43.7 | 44.4 | 45.5 |
| Hungary | 45.9 | 44.8 | 44.1 | 46.1 | 46.7 | 46.9 | 48.2 | 45.1 | 44.7 | 44.2 |
| Malta | 38.6 | 38.7 | 38.8 | 39.2 | 39.5 | 39.4 | 38.5 | 37.4 | 39.2 | 38.8 |
| Netherlands | 42.5 | 42.6 | 42.4 | 42.8 | 43.6 | 43.6 | 42.6 | 43.6 | 43.7 | 43.6 |
| Austria | 48.8 | 48.4 | 48.3 | 49.0 | 49.7 | 49.7 | 50.1 | 48.7 | 48.4 | 48.6 |
| Poland | 37.8 | 38.5 | 39.1 | 39.1 | 38.5 | 38.7 | 39.0 | 38.9 | 39.7 | 41.2 |
| Portugal | 40.4 | 40.6 | 42.6 | 42.9 | 45.1 | 44.6 | 43.8 | 42.8 | 42.7 | 43.5 |
| Romania | 30.3 | 33.1 | 34.1 | 33.7 | 33.3 | 34.1 | 35.4 | 31.8 | 30.9 | 32.0 |
| Slovenia | 42.4 | 43.6 | 43.3 | 44.5 | 44.8 | 44.4 | 44.9 | 43.4 | 43.2 | 43.1 |
| Slovakia | 36.3 | 34.7 | 36.5 | 36.3 | 38.7 | 39.3 | 42.5 | 39.2 | 39.4 | 39.9 |
| Finland | 52.2 | 52.1 | 53.3 | 54.0 | 54.9 | 54.9 | 54.3 | 54.2 | 53.4 | 52.8 |
| Sweden | 52.0 | 50.7 | 50.1 | 50.3 | 50.6 | 49.5 | 49.8 | 50.8 | 50.9 | 50.8 |
| UK | 37.2 | 38.3 | 38.8 | 40.2 | 40.6 | 43.7 | 40.6 | 36.9 | 43.8 | 42.8 |
Source: Prepared by authors based on [Eurostat].
Appendix B
Total public expenditures as the % of GDP in the EU Member States
| Years | ||||||||||
| States | '09 | '10 | '11 | '12 | '13 | '14 | '15 | '16 | '17 | '18 |
| Belgium | 54.2 | 53.3 | 54.5 | 55.9 | 55.9 | 55.3 | 53.7 | 53.1 | 52.1 | 52.4 |
| Bulgaria | 39.4 | 36.2 | 33.8 | 34.5 | 37.7 | 43.2 | 40.5 | 35.1 | 35.0 | 34.8 |
| Czech Rep. | 44.2 | 43.5 | 43.0 | 44.5 | 42.6 | 42.4 | 41.7 | 39.5 | 38.9 | 40.6 |
| Denmark | 56.5 | 56.7 | 56.4 | 58.0 | 55.8 | 55.2 | 54.5 | 52.7 | 51.2 | 51.5 |
| Germany | 47.6 | 47.3 | 44.7 | 44.3 | 44.7 | 44.0 | 43.7 | 43.9 | 43.9 | 43.9 |
| Estonia | 46.1 | 40.5 | 37.4 | 39.3 | 38.5 | 37.8 | 39.6 | 39.5 | 39.3 | 39.5 |
| Ireland | 47.0 | 65.1 | 46.6 | 42.1 | 40.4 | 37.5 | 29.0 | 27.6 | 26.3 | 25.7 |
| Greece | 54.1 | 52.5 | 54.1 | 55.7 | 62.3 | 50.2 | 53.5 | 48.9 | 47.3 | 46.7 |
| Spain | 45.8 | 45.6 | 45.8 | 48.1 | 45.6 | 44.8 | 43.7 | 42.2 | 41.0 | 41.3 |
| France | 57.2 | 56.9 | 56.3 | 57.1 | 57.2 | 57.2 | 56.8 | 56.6 | 56.4 | 56.0 |
| Croatia | 48.3 | 48.0 | 48.5 | 47.8 | 47.6 | 48.1 | 48.3 | 47.3 | 45.3 | 46.4 |
| Italy | 51.2 | 49.9 | 49.4 | 50.8 | 51.1 | 50.9 | 50.3 | 49.0 | 48.9 | 48.6 |
| Cyprus | 42.1 | 42.0 | 42.3 | 41.9 | 41.9 | 48.8 | 40.6 | 38.0 | 37.4 | 44.7 |
| Latvia | 44.6 | 45.4 | 40.5 | 38.0 | 37.7 | 38.1 | 38.2 | 37.0 | 37.8 | 38.5 |
| Lithuania | 44.9 | 42.3 | 42.5 | 36.1 | 35.5 | 34.6 | 34.9 | 34.1 | 33.1 | 34.0 |
| Luxembourg | 45.1 | 44.1 | 42.4 | 44.1 | 43.3 | 42.0 | 41.9 | 41.9 | 43.0 | 43.1 |
| Hungary | 50.4 | 49.3 | 49.5 | 48.5 | 49.4 | 49.5 | 50.1 | 46.8 | 46.9 | 46.5 |
| Malta | 41.9 | 41.1 | 41.2 | 42.7 | 41.9 | 41.1 | 39.6 | 36.5 | 35.7 | 36.8 |
| Netherlands | 47.6 | 47.9 | 46.8 | 46.8 | 46.5 | 45.7 | 44.6 | 43.6 | 42.5 | 42.2 |
| Austria | 54.1 | 52.8 | 50.9 | 51.2 | 51.6 | 52.4 | 51.1 | 50.3 | 49.2 | 48.5 |
| Poland | 45.0 | 45.8 | 43.9 | 42.9 | 42.6 | 42.4 | 41.7 | 41.1 | 41.2 | 41.5 |
| Portugal | 50.2 | 51.8 | 50.0 | 48.5 | 49.9 | 51.8 | 48.2 | 44.8 | 45.7 | 44.0 |
| Romania | 39.4 | 40.0 | 39.5 | 37.3 | 35.4 | 35.3 | 36.1 | 34.5 | 33.6 | 35.0 |
| Slovenia | 48.2 | 49.3 | 50.0 | 48.5 | 59.5 | 49.9 | 47.7 | 45.3 | 43.2 | 42.4 |
| Slovakia | 44.1 | 42.1 | 40.8 | 40.6 | 41.4 | 42.0 | 45.1 | 41.5 | 40.2 | 40.6 |
| Finland | 54.8 | 54.8 | 54.4 | 56.2 | 57.5 | 58.1 | 57.0 | 55.9 | 54.2 | 53.6 |
| Sweden | 52.7 | 50.8 | 50.3 | 51.3 | 52.0 | 51.1 | 49.8 | 49.8 | 49.4 | 49.9 |
| UK | 47.3 | 47.6 | 45.9 | 45.7 | 43.9 | 43.0 | 42.2 | 41.4 | 41.0 | 40.8 |
References
- Shkarlet, S.; Dubyna, M.; Hrubilak, O.; Zhavornok, A. Тheoretical and applied provisions of the research of the state budget deficit in the countries of Central and Eastern Europe. Administratie si Management Public, 2019, 32, 120–138. [Google Scholar] [CrossRef]
- Nazari, M.; Asadi, E.; Imanian, M. Uncertainty, budget deficit and economic growth in OPEC member countries. Energy Sources, Part A, Recovery, Utilization and Environmental Effects 2019, 2, 56–67. [Google Scholar] [CrossRef]
- Nöh, L. Increasing public debt and the role of central bank independence for debt maturities. European Economic Review 2019, 119, 179–198. [Google Scholar] [CrossRef]
- Morozumi, A.; Veiga, F.J. Public spending and growth: The role of government accountability. European Economic Review, 2016, 89, 148–71. [Google Scholar] [CrossRef]
- Brückner, M.; Chong, A.; Gradstein, M. Estimating the permanent income elasticity of government expenditure: Evidence on Wagner’s law based on oil price shocks. Journal of Public Economics 2012, 15, 1025–35. [Google Scholar] [CrossRef]
- Abdallah, G.; Ziad, A.L. Causalities between Components of Public Revenues, and Public Expenditures in Jordan. International Journal of Academic Research in Economics & Management Sciences, 2018, 6, 59–71. [Google Scholar]
- Semenova, N.; Ivanovna, O.E.; Filichkina, Y.Y. Improving the Efficiency of the Russian Budgetary Policy in the Context of Economic Growth Fueling. Экoнoмика. Налoги. Правo, 2019, 12, 47–56. [Google Scholar] [CrossRef]
- Mișa, I.; Kagitci, M. An overview of the influence of some macroeconomic variables on public revenues. A panel approach for a sample of european countries. Management and Marketing, 2019, 14, 249–265. [Google Scholar] [CrossRef]
- Grbić, M. The key determinants of development of financial system. Oditor – Journal of management, finance and law, 2019, 5, 7–21. [Google Scholar] [CrossRef]
- Craig, P. The Stability Coordination and Governance Treaty: Principles, Politics and Pragmatism. Oxford legal Studies Research Paper, 2012, 14, 235–247. [Google Scholar]
- Angelov, A. Public expenditure on education in the EU member states: A cluster analysis. Economic archive, 2019, 8, 52–64. [Google Scholar]
- Lupu, D.; Petrisor, M.B.; Bercu, A.; Tofan, M. The Impact of Public Expenditures on Economic Growth: A Case Study of Central and Eastern European Countries. Emerging Markets Finance & Trade, 2018, 54, 552–570. [Google Scholar]
- Veselinović, P.; Dimitrijević, M. , Kostić, M. Significance of fiscal policy for economic development and agriculture. Economics of Agriculture, 2019, 8, 357–373. [Google Scholar]
- Geitzenauer, M.; Blondet, M.; Jessica, K.; Francesca, F.; Metodi, S.; Gerhard, W.; Georg, W. The challenge of financing the implementation of Natura 2000 – Empirical evidence from six European Union Member States. Forest Policy and Economics, 2017, 25, 3–13. [Google Scholar] [CrossRef]
- Vukša, S. Public sector contract revision. Akcionarstvo, 2017, 23, 31–46. [Google Scholar]
- Gnjatović, D. Fiscal integration in the European union. Bankarstvo, 2013, 42, 14–29. [Google Scholar]
- Bird, M. Federal Finance in Comparative Perspective; Canadian Tax Foundation: Toronto, Canada, 1986; pp. 234–257. [Google Scholar]
- Mourre, G.; Poissoner, A. What Drives the Responsiveness of the Budget Balance to the Business Cycle in EU Countries? Intereconomics, 2019, 54, 237–249. [Google Scholar] [CrossRef]
- Milosavljević, S.; Pantelejić, Đ.; Međedović, D. Application and possibility of improvement of economic factors in realization of sustainable development. Održivi razvoj, 2019, 1, 6–15. [Google Scholar]
- Li, Z.; Huang, Z.; Dong, H. The Influential Factors on Outward Foreign Direct Investment: Evidence from the The Belt and Road. Emerging Markets Finance and Trade, 2019, 55, 3211–3226. [Google Scholar] [CrossRef]
- Martins, S.; Veiga, F.J. Government size, composition of public expenditure, and economic development. International Tax and Public Finance, 2014, 21, 578–97. [Google Scholar] [CrossRef]
- Gupta, S.; Benedict, C.; Baldacci, E.; Granados, C.M. Fiscal policy, expenditure composition, and growth in low income countries. Journal of International Money and Finance, 2005, 24, 441–63. [Google Scholar] [CrossRef]
- Bayraktar, N.; Blanca, M.D. How can public spending help you grow? An empirical analysis for developing countries. Bulletin of Economic Research, 2012, 67, 30–64. [Google Scholar] [CrossRef]
- Stanković, B.; Damnjanović, R.; Popović, M. Forms of public expenditure supervision. Oditor - Journal for management, finance and law, 2018, 4, 96–109. [Google Scholar] [CrossRef]
- Gordon, B.; Cosimo, M. Fiscal Sustainability in the EU. Atlantic Economic Journal, 2018, 16, 297–311. [Google Scholar]
- Greiner, A.; Köller, U.; Semmler, W. Debt sustainability in the European monetary union: Theory and empirical evidence for selected countries. Oxford Economic Papers, 2007, 59, 194–218. [Google Scholar] [CrossRef]
- Halásková, M.; Halásková, R. Public expenditures in areas of public sector: analysis and evaluation in EU countries. Scientific Papers of the University of Pardubice. Series D, Faculty of Economics & Administration, 2017, 24, 39–50. [Google Scholar]
- Francesco, N. ; Integration through crises? A quantitative assessment of the effect of the Eurocrisis on preferences for fiscal integration. Comparative European Politics, 2019, 17, 397–425. [Google Scholar]
- Torres-Gutiérrez, T.P.; Correa-Quezada, R.; Río-Rama, M.; Álvarez-García, J. Location Decisions of New Manufacturing Firms in Ecuador. Agglomeration Mechanisms. Matematics 2020, 8, 1–24. [Google Scholar] [CrossRef]
- Sarstedt, M.; Mooi, E. A Concise Guide to Market Research. Regression Analysis, 2014, 1, 193–233. [Google Scholar]
- Crépon, B.; Duguet, E. Estimating the innovation function from patent numbers: GMM on count panel data. J. Appl. Econom. 1997, 12, 243–263. [Google Scholar] [CrossRef]
- Hai-Long, S.; Yan-Ran, L.; Xin-Hui, S. The Four-Parameter PSS Method for Solving the Sylvester Equation. Matematics, 2019, 7, 1–13. [Google Scholar]
- Bretschneider, S.; Schroeder, L. Revenue forecasting, budget setting and risk. Socio-Economic Planning Sciences 1985, 19, 431–439. [Google Scholar] [CrossRef]
- Caruthers, J.K.; Wentworth, C.L. ; Wentworth, C. L. Methods and Techniques of Revenue Forecasting. Wiley Online Library. 2002. [Google Scholar]
- Schroeder, L. Multi-Year Revenue and Expenditure Forecasting: Some Policy Issues. Journal of Urban Affairs 1980, 2, 29–42. [Google Scholar] [CrossRef]
- EUROSTAT. Available online: https://ec.europa.eu/eurostat/data/database (accessed on 3 February 2019 ).
- Luković, S.; Grbić, M. The causal relationship between government revenue and expenditure in Serbia. Economic Themes 2014, 52, 127–138. [Google Scholar] [CrossRef]
- Liyambo, H.; Kaulihowa, T. An assessment of the relationship between public debt, government expenditure and revenue in Namibia. Public Sector Economics 2020, 44, 331–353. [Google Scholar] [CrossRef]
- Alawneh, A. The impact of public expenditure and public debt on taxes: A case study of Jordan. Accounting and Finance Research 2017, 6, 10–23. [Google Scholar] [CrossRef]
Table 1.
Descriptive Statistics.
| N | Minimum | Maximum | Mean | Std. Deviation | |
|---|---|---|---|---|---|
| r18 | 280 | 25.80 | 56.40 | 43.57 | 6.13 |
| Valid N (listwise) | 280 |
Source: Authors’ calculation – SPSS.
Table 2.
Regression model for the dependent variable: 2018 revenues.
| R = .997 R² = .995 ADJUSTED R² = .992 F(9,18) = 409,57 p | ||||||
|---|---|---|---|---|---|---|
| Beta | Std.Err.of Beta | B | Std.Err. of B | t(18) | p-level | |
| Inter | 2.553 | 0.895 | 2.852 | 0.010 | ||
| 2009 | -0.031 | 0.106 | -0.032 | 0.109 | -0.292 | 0.773 |
| 2010 | -0.001 | 0.233 | -0.001 | 0.254 | -0.002 | 0.008 |
| 2011 | 0.202 | 0.163 | 0.212 | 0.171 | 1.239 | 0.231 |
| 2012 | -0.221 | 0.275 | -0.225 | 0.280 | -0.804 | 0.431 |
| 2013 | 0.031 | 0.234 | 0.031 | 0.234 | 0.133 | 0.895 |
| 2014 | -0.161 | 0.149 | -0.167 | 0.155 | -1.07 | 0.295 |
| 2015 | 0.048 | 0.104 | 0.049 | 0.105 | 0.468 | 0.644 |
| 2016 | 0.125 | 0.134 | 0.119 | 0.128 | 0.931 | 0.363 |
| 2017 | 0.999 | 0.101 | 0.964 | 0.098 | 9.827 | 0.001 |
Source: Authors’ calculation – SPSS.
Table 5.
Regression model for dependent variable: 2018 expenditures.
| R = .988 R² = .977 ADJUSTED R² = .966 F (9,18) = 87.842 p | ||||||
|---|---|---|---|---|---|---|
| Beta | Std.Err. of Beta | B | Std.Err. of B | t (18) | p-level | |
| Inter | 5.955 | 3.159 | 1.884 | 0.075 | ||
| 2009 | 0.019 | 0.164 | 0.026 | 0.221 | 0.117 | 0.907 |
| 2010 | -0.294 | 0.120 | -0.313 | 0.128 | -2.440 | 0.025 |
| 2011 | 0.191 | 0.173 | 0.218 | 0.197 | 1.104 | 0.283 |
| 2012 | 0.143 | 0.173 | 0.144 | 0.175 | 0.827 | 0.418 |
| 2013 | -0.181 | 0.122 | -0.159 | 0.107 | -1.479 | 0.156 |
| 2014 | 0.396 | 0.123 | 0.400 | 0.125 | 3.201 | 0.004 |
| 2015 | -0.495 | 0.253 | -0.478 | 0.244 | -1.954 | 0.066 |
| 2016 | 0.450 | 0.432 | 0.424 | 0.408 | 1.040 | 0.311 |
| 2017 | 0.640 | 0.345 | 0.612 | 0.330 | 1.855 | 0.079 |
Source: Authors’ calculation – SPSS.
Table 6.
Predicted & Residual Values (Spreadsheet1) Dependent variable: expenditures ‘18.
| Observed Value |
Predicted Value | Residual | Standard Pred. v. | Std.Err | Mahalanobis Distance | Deleted Residual |
Cook's Distance | |
|---|---|---|---|---|---|---|---|---|
| 1 | 52.400 | 52.675 | -0.275 | 1.439 | 0.470 | 3.074 | -0.324 | 0.001 |
| 2 | 34.800 | 36.278 | -1.478 | -1.050 | 0.953 | 15.597 | -3.823 | 0.605 |
| 3 | 40.600 | 40.154 | 0.445 | -0.461 | 0.488 | 3.385 | 0.530 | 0.003 |
| 4 | 51.500 | 51.259 | 0.240 | 1.224 | 0.683 | 7.559 | 0.350 | 0.002 |
| 5 | 43.900 | 43.676 | 0.223 | 0.072 | 0.491 | 3.436 | 0.267 | 0.000 |
| 6 | 39.500 | 39.231 | 0.268 | -0.602 | 0.949 | 15.464 | 0.686 | 0.019 |
| 7 | 25.700 | 25.570 | 0.129 | -2.676 | 1.193 | 15.020 | 3.443 | 0.770 |
| 8 | 46.700 | 45.114 | 1.585 | 0.291 | 0.995 | 17.106 | 4.794 | 0.039 |
| 9 | 41.300 | 42.630 | -1.330 | -0.085 | 0.605 | 5.725 | -1.768 | 0.052 |
| 10 | 56.000 | 55.384 | 0.615 | 1.850 | 0.596 | 5.534 | 0.810 | 0.010 |
| 11 | 46.400 | 46.093 | 0.306 | 0.440 | 0.651 | 6.778 | 0.429 | 0.003 |
| 12 | 48.600 | 48.738 | -0.138 | 0.841 | 0.360 | 1.405 | -0.152 | 0.000 |
| 13 | 44.700 | 41.683 | 2.016 | -0.229 | 0.930 | 14.817 | 7.259 | 0.080 |
| 14 | 38.500 | 37.078 | 1.421 | -0.929 | 0.611 | 5.857 | 1.901 | 0.061 |
| 15 | 34.000 | 34.635 | -0.635 | -1.300 | 1.078 | 10.264 | -2.975 | 0.469 |
| 16 | 43.100 | 42.965 | 0.134 | -0.035 | 0.746 | 9.206 | 0.215 | 0.001 |
| 17 | 46.500 | 46.240 | 0.259 | 0.462 | 0.622092 | 6.092 | 0.351 | 0.002 |
| 18 | 36.800 | 37.553 | -0.753 | -0.856 | 0.613 | 5.907 | -1.010 | 0.017 |
| 19 | 42.200 | 43.286 | -1.086 | 0.013 | 0.313 | 0.832 | -1.163 | 0.006 |
| 20 | 48.500 | 49.164 | -0.664 | 0.906 | 0.561 | 4.774 | -0.843 | 0.010 |
| 21 | 41.500 | 41.507 | -0.007 | -0.256 | 0.485 | 3.331 | -0.009 | 0.000 |
| 22 | 44.000 | 45.723 | -1.723 | 0.383 | 0.795 | 10.574 | -3.010 | 0.261 |
| 23 | 35.000 | 34.932 | 0.067 | -1.255 | 0.721 | 8.534 | 0.104 | 0.000 |
| 24 | 42.400 | 43.083 | -0.683 | -0.017 | 1.071 | 19.978 | -3.046 | 0.486 |
| 25 | 40.600 | 39.598 | 1.001 | -0.546 | 0.809 | 10.994 | 1.797 | 0.096 |
| 26 | 53.600 | 54.006 | -0.406 | 1.641 | 0.663 | 7.050 | -0.578 | 0.006 |
| 27 | 49.900 | 49.586 | 0.313 | 0.970 | 0.480 | 3.248 | 0.371 | 0.001 |
| 28 | 40.800 | 41.644 | -0.844 | -0.235 | 0.363 | 1.444 | -0.926 | 0.005 |
Source: Authors’ calculation – SPSS.
Disclaimer/Publisher’s Note: The statements, opinions and data contained in all publications are solely those of the individual author(s) and contributor(s) and not of MDPI and/or the editor(s). MDPI and/or the editor(s) disclaim responsibility for any injury to people or property resulting from any ideas, methods, instructions or products referred to in the content. |
© 2023 by the authors. Licensee MDPI, Basel, Switzerland. This article is an open access article distributed under the terms and conditions of the Creative Commons Attribution (CC BY) license (http://creativecommons.org/licenses/by/4.0/).
Copyright: This open access article is published under a Creative Commons CC BY 4.0 license, which permit the free download, distribution, and reuse, provided that the author and preprint are cited in any reuse.


