
Submitted:
02 October 2023
Posted:
03 October 2023
You are already at the latest version
Abstract
The association between obesity and clinical as well as radiological outcomes in patients suffering non-traumatic intracerebral haemorrhage (ICH) remains unclear. The obesity paradox suggests a protective effect regarding in-hospital mortality. This study evaluates the impact of body mass index (BMI) on functional long-term outcome and bleeding volume in patients with non-traumatic ICH. A retrospective cohort study including all consecutive patients with spontaneous ICH treated at a tertiary referral centre between December 2017 and June 2021, aged 80 years or younger (n = 218), were included. Patients were dichotomized into overweight (OW, BMI ≥ 25 kg/m2) and normal weight (NW, BMI < 25 kg/m2). Functional outcomes were assessed by the modified Rankin scale (mRS), extended Glasgow Outcome Scale (GOS-E) and the National Institutes of Health Stroke Scale score (NIHSS) at 1, 3, 6 and 12-months follow-up. Bleeding volumes were calculated as ABC/2. Univariate and multivariate analysis were performed to assess clinical predictors of favourable outcome in the long-term. Of 218 patients (66.04 ± 15.18 years) suffering non-traumatic ICH, 115 (52.75%) were OW (29.72 ± 3.82). Female sex (p = 0.1), NIHSS (p = 0.69), cardiovascular risk factors (p = 0.55), ICH volume (p = 0.19), and presence of anticoagulation (p = 0.67) did not significantly differ between the OW and NW cohort. At discharge, functional outcome did not significantly differ between both cohorts (NW, mRS 3.92 ± 2.54 vs. OW, mRS 3.21 ± 2.43, (p = 0.28)). Multivariate analysis revealed that haemorrhage volume (p = 0.01) was the only robust risk factor to predict functional outcome after 1 year. Our data suggests that in ICH patients, neither obesity nor patient’s age are negative predictors for functional outcome in the long-term. Instead, bleeding volume is a robust risk factor predicting poor functional status after ICH. Therefore, prospective randomized trials analysing this coherence are highly warranted.
Keywords:
Body-mass-index
; intracerebral haemorrhage
; bleeding volume
; functional outcome
Introduction
Obesity in general is associated with increased morbidity and mortality,1 and recently has been studied as predictor for poor outcome in a population of patients suffering from COVID-19.2,3
However, in patients with non-traumatic intracerebral haemorrhage (ICH), previous investigations suggested an obesity paradox, thus protective effects in terms of in-hospital mortality.4 It is undisputed that this physiognomic condition, especially in young adulthood, is associated with increased risk of ischemic stroke,5 and additively correlates with the development of type 2 diabetes and coronary artery disease. However, with regard to ischemic stroke, the TEMPIs trial6 revealed better survival, combined survival and nonfatal functional status outcomes for obese patients compared to those with lower body mass indices (BMI). In almost 100.000 patients suffering ICH, as analysed by Persaud et al., obese patients and those with morbid obesity showed decreased odds of in-hospital mortality.4
Obesity still represents one of the major so-called "diseases of civilization". Until nowadays, and in terms of facing this kind of malnutrition itself, functional outcome assessments have already been performed for ischemic, not for haemorrhagic stroke, so far. Therefore, the impact of obesity on patient's outcome suffering ICH remains a matter of debate. Given the contra intuitive obesity paradox,4 we aimed to elucidate the impact of BMI on long-term clinical and radiological outcome in supra- and infratentorial ICH.
Material and Methods
Study Enrolment and Workup
We performed a retrospective cohort study including all consecutive patients with ICH treated at a tertiary referral centre between December 2017 to June 2021. All patients with typical (basal ganglia, thalamic, cerebellar, pons) and atypical non-traumatic ICH were enrolled. Initial algorithm in terms of blood pressure management was to maintain systolic values < 140 mmHg in all patients. Patients were dichotomized into a normal weight (NW, < 25.0 kg/m2) and overweight (OW, > 25 kg/m2) group. The STROBE guidelines have been strictly followed throughout the whole manuscript.7 Approval was given by our institutional ethics committee (BASEC-Nr. 2022-00026).
Study Inclusion Criteria
Study inclusion criteria were as follows: conservative treatment of spontaneous non-traumatic supratentorial ICH and spontaneous non-traumatic infratentorial ICH, CT or magnetic resonance imaging, clinical follow-up (FU) of at least 4 weeks. Patients with secondary bleedings detected during the course of disease, e. g. through aneurysm, arteriovenous malformation, dural arteriovenous fistula, venous sinus thrombosis, tumour or cerebral amyloid angiopathy have been included as well. Age for inclusion was defined until 80 years, because the nature of outcome in elderly patients suffering ICH is relatively poor.8,9
Study Exclusion Criteria
All patients presenting with traumatic ICH and/or secondary haemorrhagic transformation after ischemic stroke have been excluded from further analysis. Incomplete FU was an exclusion criterion as well. FU at 12 months was performed for all patients by telephone interview.10 After 3 attempts, patients not reached were excluded from further analysis as well.
Baseline Variable
Demographics, baseline characteristics (age, gender, BMI, comorbidities, coagulative status, imaging) and clinical outcomes were analysed. Body weight was measured for every patient at the time of admission, and afterwards every third day, to ensure that there haven't been any relevant changes in body-weight over time. Functional outcomes were assessed by the modified Rankin scale (mRS), extended Glasgow Outcome Scale (GOS-E) and National Institutes of Health Stroke Scale (NIHSS) score at 1, 3, 6 and 12-months FU. Bleeding volumes for each patient were calculated via ABC/2.
Outcome Analyses
Primary endpoint was functional patients’ outcome at discharge and at 1 year FU. Outcome measures to assess patient's functional status were performed by using mRS, GOS-E and NIHSS. Favourable outcome was defined by a mRS ≤ 3. Secondary endpoints analysed affected haemorrhage volumes and hospitalisation times.
Statistics
Data were analysed using IBM SPPS® (version 22, USA) and GraphPad Prism 9.0 (San Diego, California, USA). The sample size per group was determined using an a priori sample size calculation (BiAS.for.Windows™® Version 11, epsilon Verlag, Germany). To achieve n = 0.05 at n = 0.2 with a sigma of 0.2, the sample size calculation showed that n = 62 patients per group were appropriate to have a delta between 0.3 to 0.5. Statistical analyses were performed using the Wilcoxon-Mann-Whitney-U-Test, one-way analysis of variance (ANOVA) followed by Scheffe’s test for post hoc comparisons of mean values and by Tukey’s multiple comparison test. Student’s t-test as well as Spearman’s rank correlation coefficient were used for normally distributed data. A probability value (p) less than 0.05 was considered significant.
Results
Patient Baseline Characteristics
Overall, 218 patients were included in this study, 68 females of 103 NW and 57 of 115 OW patients (Figure 1). Patient’s age with NW was older (66.91 ± 12.10 years) than compared to OW (65.25 ± 14.23 years) (p = 0.168). Except differences in the distribution of male patients (n = 35) to the NW compared to the OW (n = 58) group (p < 0.05), as well as regarding BMI (NW, 21.78 ± 2.14 kg/m2 vs. OW, 29.72 ± 3.83 kg/m2, p < 0.05) and the presence of coagulopathy (NW, 2 vs. OW, 8, p < 0.05), no statistic significant differences have been observed between both groups. Patient characteristics are given in Table 1.
Overall, regarding the initial performed analysis including 238 patients within an age-range upon 95 years, 42.0% (n = 99) presented with typical and 58.0% (n = 139) with atypical bleeding pattern. For typical bleedings, locations were 53.5% (n = 53) basal ganglia, 7.1% (n = 7) pontine, 19.2% (n = 19) thalamic, 1.0% (n = 1) medulla oblongata and 24.2% (n = 24) cerebellar. The NW group was represented by 37.2% (n = 45) typical bleedings, whereas the OW cohort was depicted by 46.2% (n = 54) (p < 0.05). Atypical bleeding patterns were represented by 62.8% (n = 76) compared to 53.8% (n = 63) in the OW group.
In 16 cases responsible for typical bleeding pattern, structural reasons implicated aneurysms 12.5% (n = 2), 31.3% (n = 5) arteriovenous malformations, 18.8% (n = 3) dural arteriovenous fistula, 6.3% (n = 1) venous sinus thrombosis, and 31.3% (n = 5) tumours. 25 cases of atypical bleeding patterns were induced by 8% (n = 2) aneurysms, 40% (n = 10) arteriovenous malformations, 4% (n = 1) dural arteriovenous fistula, 24% (n = 6) venous sinus thrombosis, 16% (n = 4) tumours, and 8% (n = 2) due to amyloid angiopathy.
Univariate analysis revealed age (p = 0.01), hypercholesterinaemia (p = 0.02) and haemorrhage volume (p = 0.002) as significant predictors for favourable outcome defined by a mRS ≤ 3 after 1 year. In multivariate analysis, only haemorrhage volume (p = 0.01) remained a significant predictor for favourable clinical outcome. All values are given in Table 2.
Baseline BMI Characteristics Associated with Functional Outcome
Neither, statistically significant differences between mRS, GOS-E and NIHSS at discharge, 4 weeks, 12 weeks, 6 and/or 12 months were observed. After 6 and 12 months, mRS showed a non-significant trend towards a better patient’s outcome in the OW group (p = 0.1). After 12 months, the mean mRS remained slightly better in the OW compared to the NW group (3.21 ± 2.43 vs. 3.92 ± 2.54, p = 0.1) without reaching significant difference (Table 3).
Baseline BMI Characteristics Associated with Bleeding Volume
Finally, 103 NW and 115 OW patients were analysed. BMI between the two cohorts showed a mean value of 21.78 ± 2.14 kg/m2 vs. 29.72 ± 3.83 kg/m2 (p < 0.05). Interestingly, no statistically differences in mean bleeding volumes were detected with 22.47 ± 28.60 cm3 in the NW vs. 17.83 ± 18.60 cm3 in the OW group (p = 0.19) (Table 1). Univariate and multivariate analysis showed no correlation regarding BMI and haemorrhage volumes (R= -1, p = 0.34).
Baseline BMI Characteristics Compared with Hospitalisation Time
In terms of hospitalization, the NW group showed a mean time of 10.95 ± 6.99 days, whereas the OW group presented a mean time of 12.29 ± 8.06 days (p = 0.20).
Mortality Rates
At discharge, 37 patients (15.5%) had died because of immediate sequelae of ICH. Odds ratio (OR) revealed that OW patients did not show a higher odd of in-hospital mortality than the NW cohort (OR = 0.875).
After 12 months, 67 (47.5%) patients were dead (50 patients died because of the sequelae of ICH, 7 because of other reasons like uncontrolled tumour disease and/or other comorbidities. For 10 patients, reasons of death after one year were not reproducible anymore) with a loss of 97 patients to clinical FU as well.
20 patients with NW died upon discharge, 20 after four weeks and 42 after 1 year. Comparing p values with ANOVA, a p < 0.05 (p = 0.03) was detected from the time point of discharge upon 1 year in the NW group (Figure 2). A non-significant trend was observed after 4 weeks up to 1 year (p = 0.057). For the OW arm, 17 patients died at discharge, 18 after four weeks and 25 after one year, without revealing any significance.
Discussion
The present data suggest that in patients suffering non-traumatic ICH obesity potentially might be one driving factor to influence long-term morbidity in a beneficial fashion. Significant differences in terms of bleeding volumes between NW and OW patients were not detected.
In general it seems comprehensible, that patients with a higher BMI tend to develop bigger bleeding volumes, potentially caused by aggravated venous reflux of the cerebral sinuses, and therefore being independent of active bleeding signs, such as a spot sign, a leakage sign, or anticoagulated status. However, bleeding volumes were the smallest in the OW compared to the NW patient group. Interestingly, univariate and multivariate analysis in our study did not reveal a correlation with BMI and initial haemorrhage volume (p = 0.34). Persaud et al. demonstrated that obesity and morbid obesity were associated with a lower probability of in-hospital mortality. Our results confirm these findings by even demonstrating a trend toward better long-term functional outcomes in the OW compared to NW patient arm after 6 and 12 months.
Functional outcome worsened after 1 year. Compared to discharge, a stronger and more than 3-fold deterioration was observed in the NW arm. We hypothesize that OW patients are more likely to regulate their cholesterol levels, which potentially improves long-term outcomes and therefore decreases morbidity after ICH as well.11 As Persaud et al. pointed out, statins are anti-inflammatory and also antithrombotic, potentially reducing infarct size and therefore being responsible for additive improvements in patients' outcome. Similar effects have already been well-analysed by other groups12 and as well in patients suffering non-aneurysmal subarachnoid haemorrhage.13 Nevertheless, dyslipidemia was not analysed in our patient population.
Kim et al. similarly showed that obesity was associated with lower risks of 30 day mortality after ICH. Our study confirmed this finding as well, revealing that OW patients even tend to have a better mRS than NW ones after 1 year. OR at discharge further on confirmed that OW patients did not present a higher odd of in-hospital mortality than the NW cohort (OR = 0.875). These results are in line with those published by Persaud. Furthermore, it seems reasonable that haemorrhage volumes correlate with favourable clinical outcomes as defined by a mRS ≤ 3 in our series. In multivariate analysis, only haemorrhage volume as robust and significant parameter remained (p = 0.01). Interestingly, age was found to be an independent factor and, therefore, not to correlate with a favourable clinical outcome in our group of patients.
Furthermore, considering a 15.5% mortality rate within 30 days, our results clearly stayed below the nearly 50% of Hemphill et al. reported as 30-day mortality in patients with 152 supra- and infratentorial bleeding pattern.14,15 For sure, beside mainly hypertension as presumed bleeding cause (n = 111), underlying lesions haven't been as accurate defined as in our series, but nevertheless, the main cohorts still remain comparable. The authors hypothesize that these differences in individual patient's mortality might be due to the fact that, compared to intensive care treatment before 20 years, that medical treatment strategies to manage ICH with a conservative approach improved.
NW patients demonstrated an increase in mortality from discharge to 1 year FU (p = 0.03), compared to a non-significant trend in the OW arm. Age, as non-significant variable (mean value of 66.91 years in the NW group compared to 65.25 years in the OW group (p = 0.168)) might to be considered as well in this context. Interestingly, in long-term FU OW patients do not show higher mortality as potentially thought, especially considering secondary sequelae such as coronary artery disease as well as type 2 diabetes.16 These findings (Figure 2) are in line with the short-term data of Persaud.4
In our cohort, only patients aged up to 80 years were analyzed. This circumstance is owed the fact, that in daily clinical practice in over-aged patients another institutional treatment algorithm was performed. Therefore, because medical therapies related to this issue are not standardized, a certain bias has automatically been excluded.
In multivariate analysis, neither age nor BMI were significant predictors of poor patient outcome. The circumstance, that especially OW patients presented a better survival after 1 year FU, is interesting and contra intuitive as well. As discussed above, especially in terms of age, we hypothesize that an improvement in treating patients in an intermediate- and intensive-care setting over the years is mainly responsible, therefore. In line with protective effects on mortality after ischemic and hemorrhagic stroke,4,6 a higher BMI provided beneficial effects on functional patient’s outcome in our series, as well. Accountable mechanisms therefore have not been sufficiently described in literature, yet. Through repetitive body weight measurements every third day, significant changes in the acute in-hospital setting were able to be anticipated and therefore avoided. Therefore, predictions based on this parameter tend to be robust and not misleading.
A larger ICH volume was identified as only significant predictor for poor clinical outcome in uni- and multivariate analysis. This fact seems comprehensible, hence bigger bleeding volumes create more structural defects, neurological impairment and in the acute phase increased intracranial pressure compared to smaller bleedings. This finding is also in line with current data in literature.17,18
Study Limitations
Several limitations apply to our study. First, this is a single-center study lacking external validation. A part of our data was obtained by telephone interview answered on average 6 months and 1 year after bleeding event. A not "face-to-face" analysis of the clinical status is therefore prone to bias. Nevertheless, there is a lot of evidence that telephone interviews are not inferior for assessment of long-term outcomes.10 Further on, supra- and infratentorial bleeding patterns were grouped together, 2 entities, which potentially might be handled different in treatment strategies (conservative vs. operative approach) and therefore might interfere with patient's outcome. Additively, different bleeding etiologies (non-structural vs. structural) have been grouped together. Nevertheless in this context, structural reasons remained the clear minority. Furthermore, the continuous variable weight has been analyzed in an arbitrary definition (NW and OW). Finally, a potential cross over from NW at bleeding to OW at 1 year FU or vice versa could have been happened.
Conclusions
Obesity and patient’s age were not negative predictors for functional patient's long-term outcome. Rather, bleeding volume might play a role in negatively altering patient’s functional status after ICH. This coherence has to be analysed in further studies.
Funding
No funding was received for this work. The authors are solely responsible for the design and conduct of the presented study and declare no competing interests.
Author’s contributions
Conception and design: Wanderer, Andereggen. Acquisition of data: Wanderer, Saemann, Sivanrupan, Muff, Grüter. Analysis and interpretation of data: Wanderer, Andereggen. Drafting the article: Wanderer, Andereggen. Critically revising the article: all authors. Reviewed submitted version of manuscript: all authors. Statistical analysis: Wanderer, Andereggen. Administrative/technical/material support: Schubert, Marbacher, Musahl. Study supervision: Wanderer, Andereggen. All authors have read and agreed to the published version of the manuscript.
Acknowledgments
None.
Conflicts of Interest/Competing Interests
The authors have no financial or commercial interest in any of the drugs, materials or equipment used. The authors are solely responsible for the design and conduct of the presented study. The manuscript complies with all instructions to authors.
Ethics Approval
The project was performed in accordance with the permission of the local ethics committee (BASEC-Nr. 2022-00026, Switzerland). The STROBE checklist has been used.
Consent for publication
The authorship requirements have been met and the final manuscript was approved by all authors. The manuscript has not been published elsewhere and is not under consideration by another journal.
Availability of data material
The authors declare that all supporting data are available within the article and there are no supplementary files.
References
- Flegal KM, Kit BK, Orpana H, Graubard BI. Association of all-cause mortality with overweight and obesity using standard body mass index categories: a systematic review and meta-analysis. JAMA 2013;309(1):71-82. [CrossRef]
- Jayawardena R, Jeyakumar DT, Misra A, Hills AP, Ranasinghe P. Obesity: A potential risk factor for infection and mortality in the current COVID-19 epidemic. Diabetes Metab Syndr 2020;14(6):2199-2203. [CrossRef]
- Qureshi AI, Baskett WI, Huang W, et al. Intracerebral Hemorrhage and Coronavirus Disease 2019 in a Cohort of 282,718 Hospitalized Patients. Neurocrit Care 2022;36(1):259-265. [CrossRef]
- Persaud SR, Lieber AC, Donath E, et al. Obesity Paradox in Intracerebral Hemorrhage. Stroke 2019;50(4):999-1002. [CrossRef]
- Guo Y, Yue XJ, Li HH, et al. Overweight and Obesity in Young Adulthood and the Risk of Stroke: a Meta-analysis. J Stroke Cerebrovasc Dis 2016;25(12):2995-3004. [CrossRef]
- Doehner W, Schenkel J, Anker SD, Springer J, Audebert HJ. Overweight and obesity are associated with improved survival, functional outcome, and stroke recurrence after acute stroke or transient ischaemic attack: observations from the TEMPiS trial. Eur Heart J 2013;34(4):268-77. [CrossRef]
- von Elm E, Altman DG, Egger M, et al. The Strengthening the Reporting of Observational Studies in Epidemiology (STROBE) Statement: guidelines for reporting observational studies. Int J Surg 2014;12(12):1495-9. [CrossRef]
- Inoue Y, Miyashita F, Minematsu K, Toyoda K. Clinical Characteristics and Outcomes of Intracerebral Hemorrhage in Very Elderly. J Stroke Cerebrovasc Dis 2018;27(1):97-102. [CrossRef]
- Umeano O, Phillips-Bute B, Hailey CE, et al. Gender and age interact to affect early outcome after intracerebral hemorrhage. PLoS One 2013;8(11):e81664. [CrossRef]
- Chen XW, Shafei MN, Abdullah JM, Musa KI. Reliability of Telephone Interview for Assessment of Long-Term Stroke Outcomes: Evidence from Interrater Analysis. Neuroepidemiology 2019;52(3-4):214-219. [CrossRef]
- Kim BJ, Lee SH, Ryu WS, Kim CK, Lee J, Yoon BW. Paradoxical longevity in obese patients with intracerebral hemorrhage. Neurology 2011;76(6):567-73. [CrossRef]
- Naval NS, Abdelhak TA, Zeballos P, Urrunaga N, Mirski MA, Carhuapoma JR. Prior statin use reduces mortality in intracerebral hemorrhage. Neurocrit Care 2008;8(1):6-12. [CrossRef]
- Kashefiolasl S, Wagner M, Brawanski N, et al. Statins Improve Clinical Outcome After Non-aneurysmal Subarachnoid Hemorrhage: A Translational Insight From a Systematic Review of Experimental Studies. Front Neurol 2021;12:620096. [CrossRef]
- Hemphill JC, 3rd, Bonovich DC, Besmertis L, Manley GT, Johnston SC. The ICH score: a simple, reliable grading scale for intracerebral hemorrhage. Stroke 2001;32(4):891-7. [CrossRef]
- Hemphill JC, 3rd, Greenberg SM, Anderson CS, et al. Guidelines for the Management of Spontaneous Intracerebral Hemorrhage: A Guideline for Healthcare Professionals From the American Heart Association/American Stroke Association. Stroke 2015;46(7):2032-60. [CrossRef]
- Prats-Sanchez L, Iruzubieta P, Vesperinas A, et al. Frequency, Predictors, Etiology, and Outcomes for Deep Intracerebral Hemorrhage without Hypertension. J Stroke Cerebrovasc Dis 2022;31(3):106293. [CrossRef]
- Goeldlin MB, Siepen BM, Mueller M, et al. Intracerebral haemorrhage volume, haematoma expansion and 3-month outcomes in patients on antiplatelets. A systematic review and meta-analysis. Eur Stroke J 2021;6(4):333-342. [CrossRef]
- Jordan LC, Kleinman JT, Hillis AE. Intracerebral hemorrhage volume predicts poor neurologic outcome in children. Stroke 2009;40(5):1666-71. [CrossRef]
Figure 1.
Patient inclusion criteria. Overall, 238 patients were screened, and finally, 218 patients analyzed. Inclusion criteria were defined as age until 80 years.
Figure 1.
Patient inclusion criteria. Overall, 238 patients were screened, and finally, 218 patients analyzed. Inclusion criteria were defined as age until 80 years.
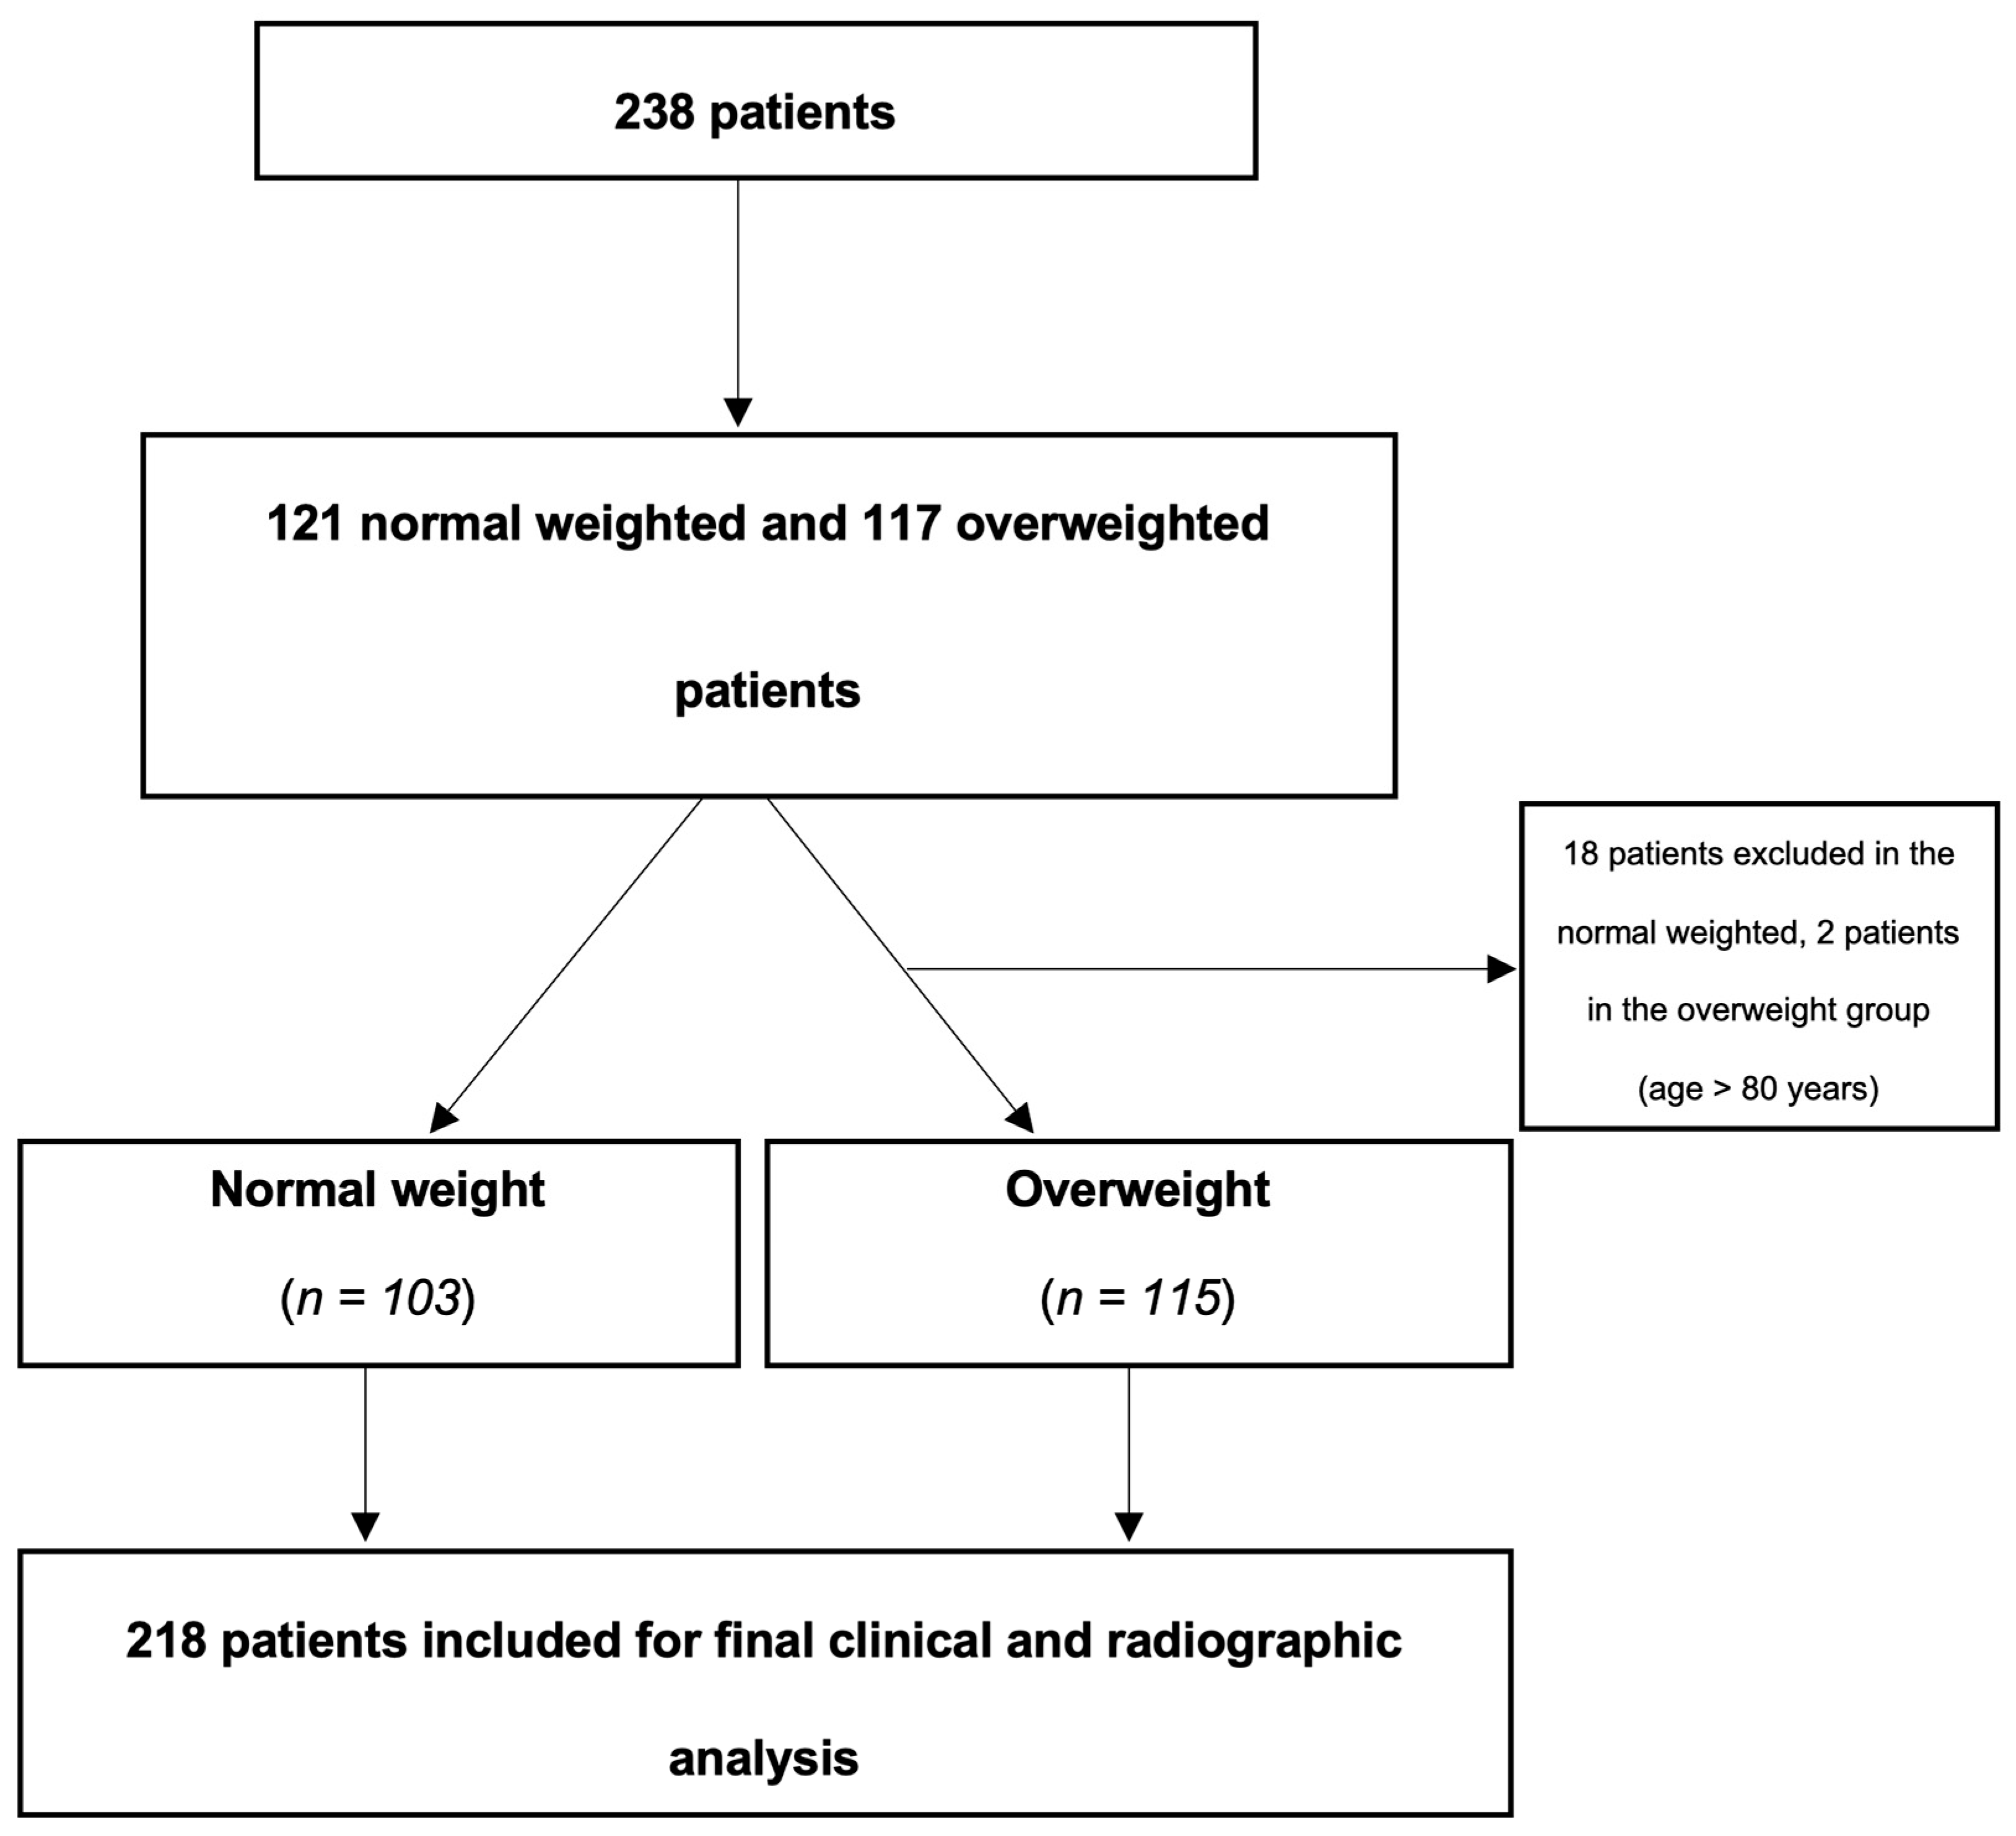
Figure 2.
Overall and weight-dependent mortality. Mortality rates in percent of NW and OW patients are shown (BL = baseline at discharge; early FU = after four weeks; late FU = after one year), with significant difference in the NW group from discharge upon follow up after one year (p = 0.03).
Figure 2.
Overall and weight-dependent mortality. Mortality rates in percent of NW and OW patients are shown (BL = baseline at discharge; early FU = after four weeks; late FU = after one year), with significant difference in the NW group from discharge upon follow up after one year (p = 0.03).
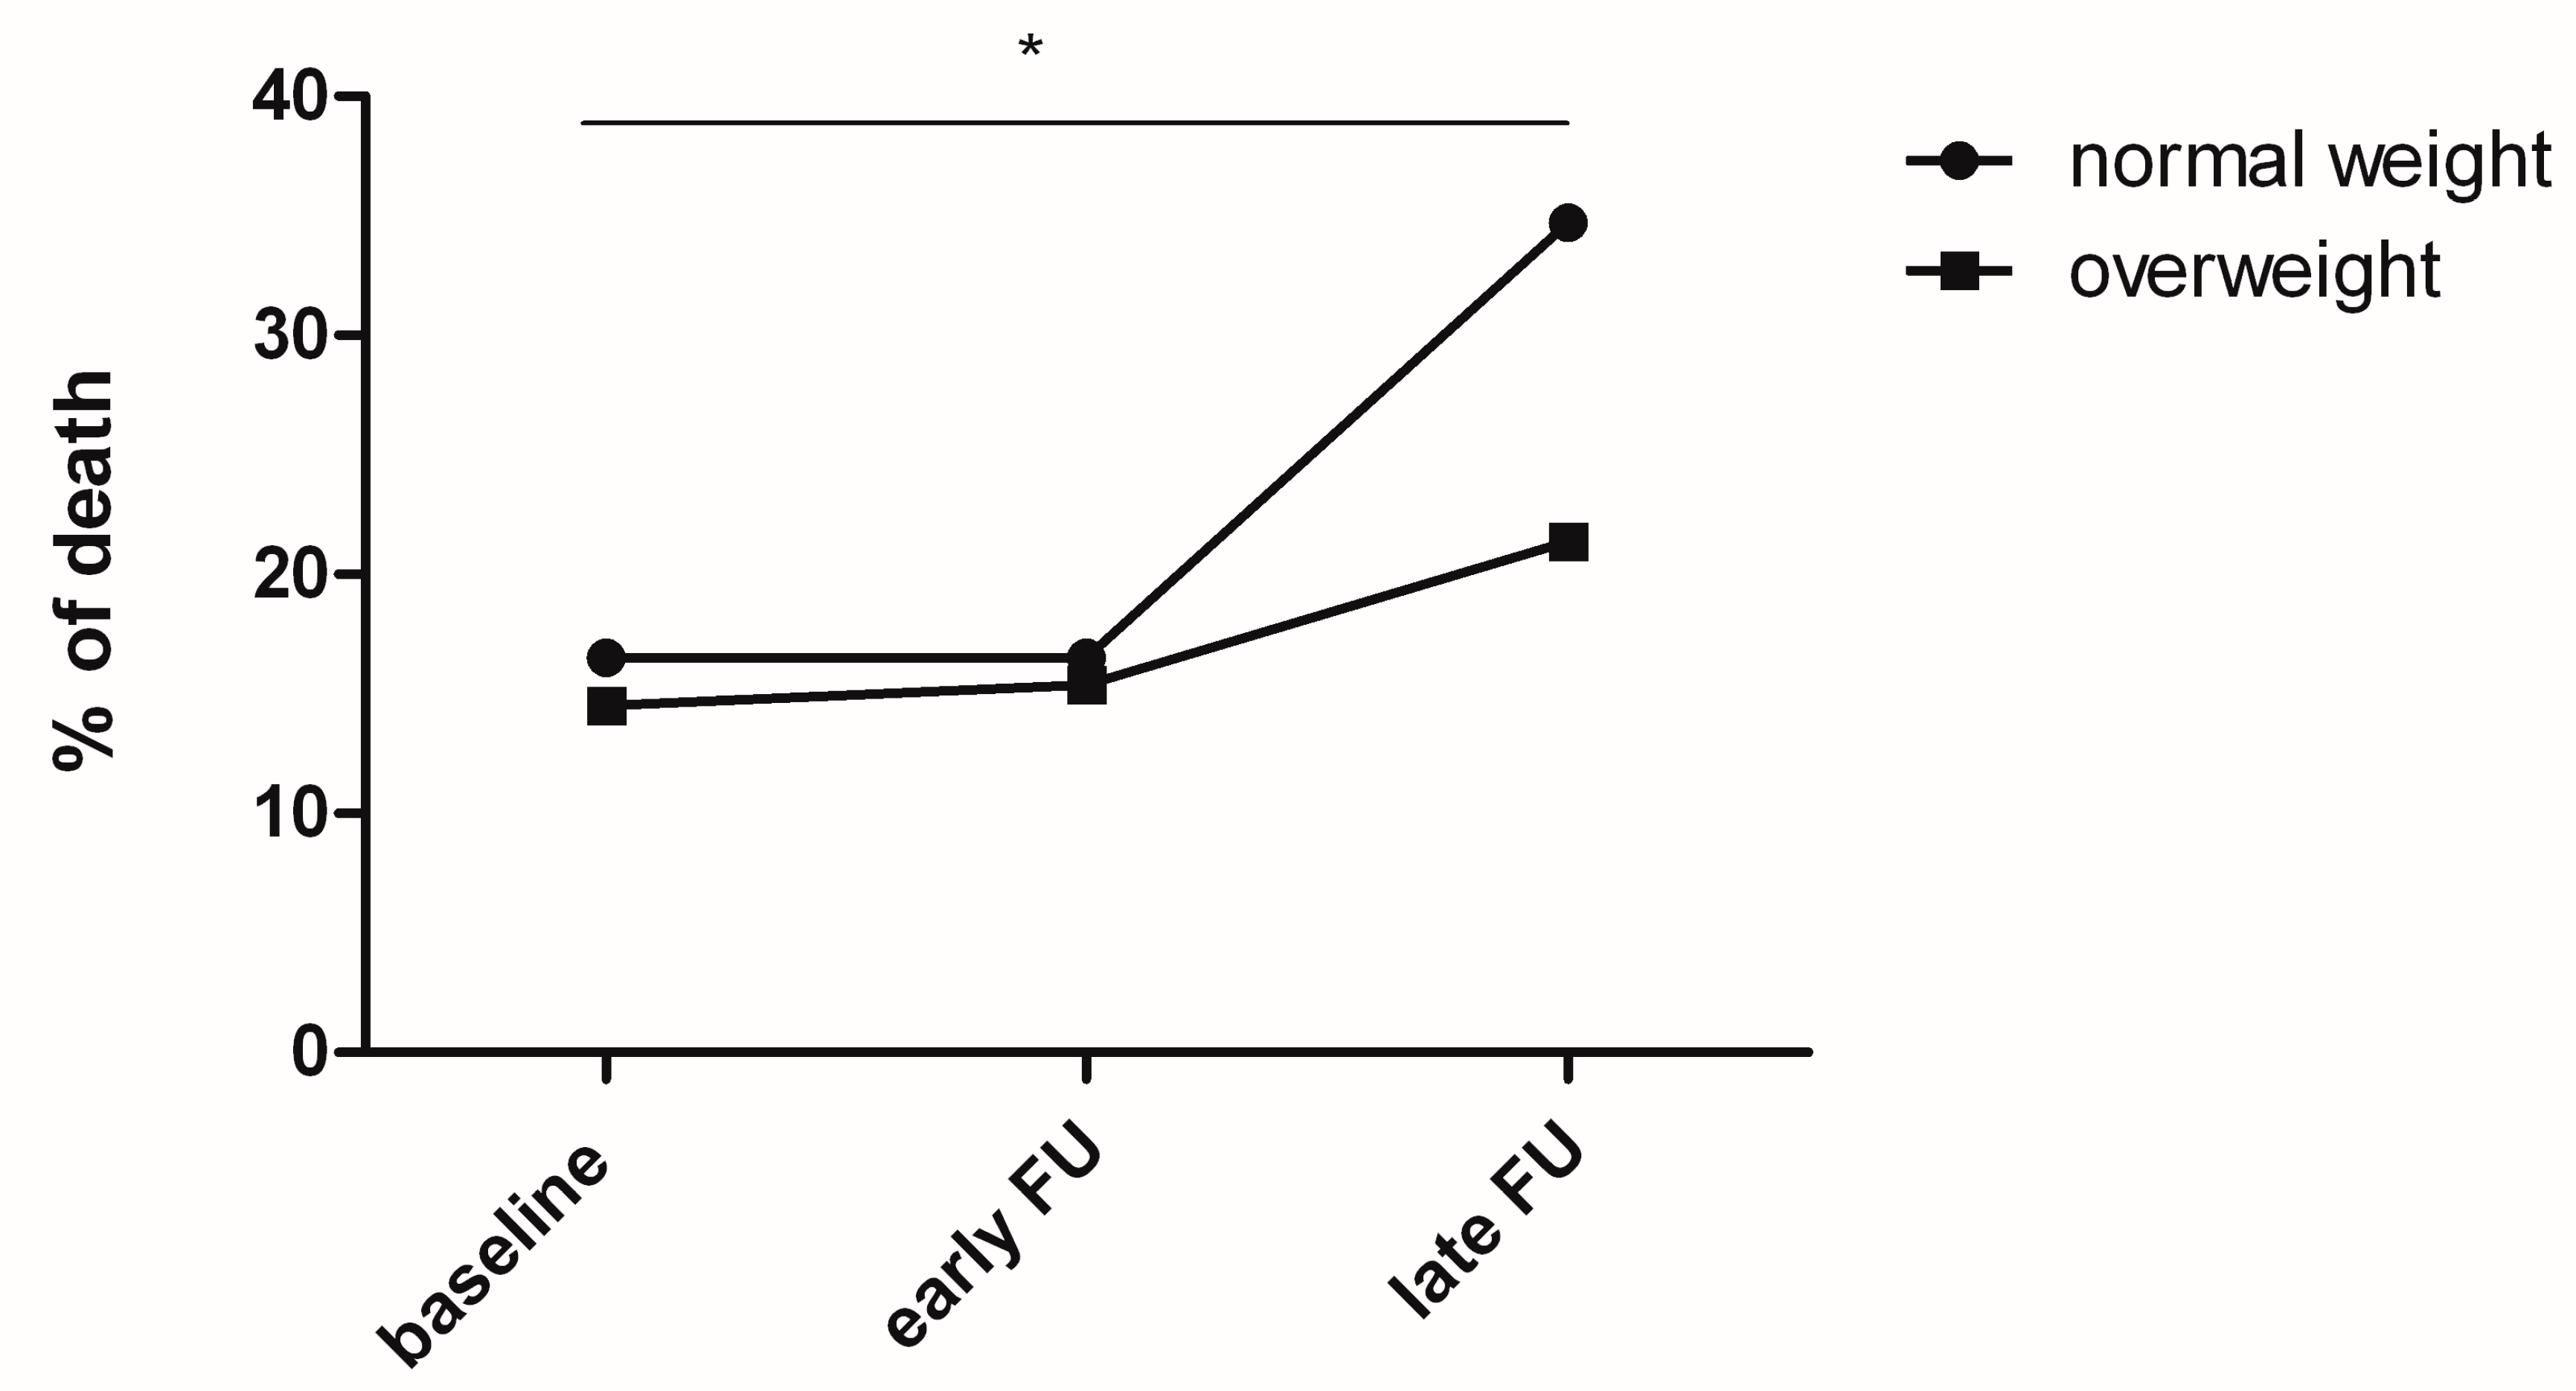

Table 1.
Baseline characteristics. All baseline variables with only values reaching statistically significance are given. Values are given as mean ± standard deviation if not indicated otherwise.
Table 1.
Baseline characteristics. All baseline variables with only values reaching statistically significance are given. Values are given as mean ± standard deviation if not indicated otherwise.
| Normal Weight (n = 103) |
Overweight (n = 115) |
p-Value | |
|---|---|---|---|
| Age (years; mean) | 66.91 ± 12.10 | 65.25 ± 14.23 | p = 0.168 |
| Gender | |||
| -male | 35 | 58 | p < 0.05 |
| -female | 68 | 57 | p = 0.10 |
| BMI (kg/m2) | 21.78 ± 2.14 | 29.72 ± 3.83 | p < 0.05 |
| Presence of preclinical seizures | 17 | 16 | p = 0.61 |
| Preclinical intubation | 15 | 11 | p = 0.77 |
| Hypertension | 87 | 84 | p = 0.82 |
| Systolic blood pressure admission (mmHg; mean) | 171.2 ± 35.61 | 180.9 ± 37.1 | p = 0.53 |
| Diastolic blood pressure admission (mmHg, mean) | 89.12 ± 18.11 | 91.02 ± 26.10 | p = 0.90 |
| Diabetes | 11 | 21 | p = 0.55 |
| Coagulopathy | 2 | 8 | p < 0.05 |
| Alcohol abuse | 5 | 7 | p = 0.94 |
| Anticoagulation | 25 | 30 | p = 0.67 |
| Bleeding volume (mean; cm3) | 22.47 ± 28.60 | 17.83 ± 18.80 | 0.19 |
Table 2.
Clinical predictors for favourable outcome (mRS ≤ 3), OR for uni- and multivariate analysis after 1 year. Only age, hypercholesterinaemia and haemorrhage volume were significant predictors in univariate, haemorrhage volume in multivariate analysis.
Table 2.
Clinical predictors for favourable outcome (mRS ≤ 3), OR for uni- and multivariate analysis after 1 year. Only age, hypercholesterinaemia and haemorrhage volume were significant predictors in univariate, haemorrhage volume in multivariate analysis.
| Clinical Predictors for Favorable Outcome (mRS ≤ 3) at Last Follow-Up |
Univariable Analyses OR (95% CI) |
p-value | Multivariable Analyses OR (95% CI) |
p-Value |
|---|---|---|---|---|
| Age | 1.0 (0.9-1.0) | 0.01 | 1.0 (0.9-1.0) | 0.14 |
| BMI | 1.0 (0.9-1.1) | 0.96 | ||
| Hypertension | 1.8 (0.8-4.3) | 0.18 | ||
| Diabetes | 2.5 (0.8-8.0) | 0.12 | ||
| Coagulopathy | 2.5 (0.3-24.7) | 0.44 | ||
| Alcoholic | 1.6 (0.3-9.5) | 0.57 | ||
| Smoking | 1.0 (0.4-2.5) | 0.93 | ||
| Anticoagulation | 1.2 (0.5-3.2) | 0.68 | ||
| Hypercholesterinaemia | 2.8 (1.2-6.7) | 0.02 | 2.1 (0.8-5.6) | 0.14 |
| Preclinical seizure | 0.8 (0.3-1.8) | 0.56 | ||
| Haemorrhage volume (ABC/2) | 1.0 (1.0-1.0) | 0.002 | 1.0 (1.0-1.0) | 0.01 |
Table 3.
Functional outcomes. No statistical differences regarding functional outcome was reached comparing the two cohorts upon one year.
Table 3.
Functional outcomes. No statistical differences regarding functional outcome was reached comparing the two cohorts upon one year.
| Normal Weight (n = 103) |
Overweight (n = 115) |
p-Value | |
|---|---|---|---|
| Discharge | |||
| -NIHSS | 11.75 ± 15.67 (n = 111) |
10.69 ± 14.77 (n = 115) |
0.69 |
| -GOS-E | 4.55 ± 2.359 (n = 118) |
4.96 ± 2.23 (n = 115) |
0.19 |
| -mRS | 3.26 ± 1.872 (n = 119) |
3.00 ± 1.90 (n = 116) |
0.28 |
| FU 4 weeks | |||
| -NIHSS | 12.76 ± 17.67 (n = 78) |
11.20 ± 16.13 (n = 90) |
0.92 |
| -GOS-E | 4.80 ± 2.61 (n = 81) |
5.02 ± 2.49 (n = 91) |
0.61 |
| -mRS | 3.07 ± 2.14 (n = 81) |
2.81 ± 2.13 (n = 91) |
0.41 |
| FU 12 weeks | |||
| -NIHSS | 16.24 ± 19.35 (n = 57) |
15.41 ± 18.39 (n = 58) |
0.82 |
| -GOS-E | 4.36 ± 2.81 (n = 57) |
4.71 ± 2.74 (n = 60) |
0.51 |
| -mRS | 3.29 ± 2.31 (n = 57) |
3.16 ± 2.21 (n = 60) |
0.79 |
| FU 6 months | |||
| -GOS-E | 3.60 ± 3.09 (n = 75) |
4.53 ± 2.95 (n = 66) |
0.11 |
| -mRS | 3.92 ± 2.54 (n = 75) |
3.21 ± 2.43 (n = 66) |
0.10 |
| FU 12 months | |||
| -GOS-E | 3.60 ± 3.09 (n = 75) |
4.53 ± 2.95 (n = 66) |
0.11 |
| -mRS | 3.92 ± 2.54 (n = 75) |
3.21 ± 2.43 (n = 66) |
0.10 |
Disclaimer/Publisher’s Note: The statements, opinions and data contained in all publications are solely those of the individual author(s) and contributor(s) and not of MDPI and/or the editor(s). MDPI and/or the editor(s) disclaim responsibility for any injury to people or property resulting from any ideas, methods, instructions or products referred to in the content. |
© 2023 by the authors. Licensee MDPI, Basel, Switzerland. This article is an open access article distributed under the terms and conditions of the Creative Commons Attribution (CC BY) license (http://creativecommons.org/licenses/by/4.0/).
Copyright: This open access article is published under a Creative Commons CC BY 4.0 license, which permit the free download, distribution, and reuse, provided that the author and preprint are cited in any reuse.


