1. Introduction
The distribution of the population in sub-Saharan Africa is estimated at 70% of poor people living in rural areas and primarily depending on rainfed agriculture to sustain their livelihoods [
1]. This group of people rely on the rainy season for their agriculture which faces challenges ranging from distorted weather patterns, shrinking rainy season, and incidence of crop pests. In much of the rural areas in Zambia, agriculture is the principal source of food and income with the majority of production from small-scale farmers. The majority of Small-scale farmers in Zambia’s rural areas depend on food and incomes from annual crops harvested between June and July. However, the majority of the rural households’ food reserves start to decline in October. The critical period of food shortages for the majority of households in rural areas is between January and April. During this season, most rural households skip meals as a coping strategy to sustain household food shortages for the next harvest.
Previous studies observed that implementing the expansion of small-scale irrigation is generally a challenge because of the biophysical factors despite the scale having relatively high returns [
2]. Like other small-scale irrigation in sub-Saharan Africa, rural areas in Zambia face the challenges of lacking appropriate low-cost irrigation technologies. Rural small-scale farmers are exclusively dependent on rudimentary irrigation methods thus limiting the extent of expanding irrigation activities. As the demand to produce food all year round increases coupled with livelihood diversification through small-scale dry season irrigation, farmers adopting new strategies of irrigation is inevitable. Therefore, finding alternative low-cost irrigation methods to enhance the rural livelihoods of the majority of the people in Africa is necessary. Small-scale irrigation has proven to produce relatively significant returns per unit compared to pressurized irrigation systems. Small-scale development has been part of agricultural policies of African countries to enhance food security and nutrition for rural communities [
3]. Compared to medium or large-scale irrigation, the area under small-scale irrigation has been increasing by applying strategies for developing and promoting alternative methods of irrigation. Assessments reveal that sub-Saharan Africa’s potential irrigable area for river diversion is up to 20.5 million hectares, of which 3 million are found in southern Africa [
4,
5]. It is of this potential that small-scale irrigation in sub-Saharan Africa is expected to play a vital role in rural areas where there is a need to reduce poverty and enhance food security for the majority of poor people [
6].
In sub-Saharan countries, small-scale farmers in dry season irrigation manually lift water from shallow wells, rivers, and streams using buckets, watering cans, treadle pumps, and plastic containers [
7,
8]. These methods of irrigation are commonly practised in rural areas. Small-scale irrigation in Zambia is commonly becoming important and agricultural extension workers are assisting farmers in its implementation. In the rural areas in Zambia, rivers, streams, and shallow wells make 80% of water sources for irrigation available and distributed using watering cans [
9]. However, in Zambia, most of the rural farmers are abandoning the traditional manual irrigation method of irrigation and increasingly adopting simple weirs. The method is relatively affordable and adaptable to rural environments with irrigation potential. The importance of irrigation technologies is pointed out and proposals for a paradigm of promoting them among smallholder irrigation farmers in sub-Saharan African countries have continued to be a subject in present and past studies [
10]. The exploration of appropriate irrigation methods to cater for small-scale irrigation led to the development and introduction of simple weirs in the northern region province of Zambia. Simple weirs are not only of interest in the promotion of community irrigation in Zambia but there is also demand for the technology from small-scale farmers in Malawi and are now promoted in Mozambique [
11]. Simple weirs are used as the basis for engaging emerging small-scale farmers to pursue food production with irrigation.
Vegetable gardening irrigated with water diverted from rivers is the most predominant livelihood activity and source of income in rural areas. In Muchinga province in Zambia, it was found that 91% of small-scale farmers used simple weirs to divert river water to irrigate vegetable gardens cultivated downstream [
12]. Common crops produced under small-scale irrigation are tomatoes, cabbage, onions, eggplants, out-of-season crops, and indigenous vegetables. Small-scale irrigation in Zambia is merely practised to supplement household food security during the dry season and surplus produce is rarely sold to raise income for household requirements.
Four major forms of weirs are commonly recognized as hydraulic head works. They are (i) Fixed weirs (ii) Gate-type weirs (iii) Combined weirs and (iv) Temporary weirs (Simple weirs). In this paper, '‘temporary weirs’’ are commonly known as ‘‘simple weirs’’ in Zambia. In Zambia’s rural areas of the northern region provinces, small-scale farmers use simple weirs to divert river water for irrigation. Four types of simple weirs generally constructed by farmers on rivers for irrigation are (i) Single line weir (ii) Double line type (ii) Incline weir and (iv) Trigonal type. The single-line weir is a widely constructed type (64%) to divert water for crop production in Luapula, Copperbelt, and North-western provinces. The single-line simple weir is the most preferred type by the farmers because it is easy to construct, a low cost of maintenance and repair. However, some Single-line weirs constructed by individual farmers or groups of farmers have been reported with problems such as often breakdowns, experiencing loose connections, getting damaged, and sometimes flooding consequently affecting water diversion during the irrigation period. A simple weir is a low-head temporary hydraulic structure constructed across the width of a river channel to redirect river water for dry-season irrigation. Simple weirs are widely constructed in the northern region of Zambia where they are increasingly used for dry-season irrigation, supplementary irrigation during dry spells, and water supply for inland fish farming irrigation.
Small-scale irrigation is rapidly becoming one of the chief sources of food and income in rural Zambia. In Zambia, simple weirs are associated with small-scale scale farmers in rural communities where approximately 74% of the human population is estimated to depend on subsistence rainfed agriculture. According to the farmers in Zambia’s rural areas, simple weirs help them access water for irrigation during the seven-month dry season for irrigation of crop fields downstream by gravity between May and November.
Despite being remarkably common in the country's northern region, Single-line weirs promoted for irrigation in Zambia have not been assessed amidst all the related challenges and benefits. Having observed the importance of simple weirs to small-scale irrigation development in rural areas in Zambia, this study conducted a diagnostic assessment to provide an understanding of the appropriateness of the technology focusing on the hydraulic conditions such as the (i) Challenges and predicaments of single-line weirs (ii) River flow rate and upstream water level and (iii) Flow rate and amount of water diverted and accessible for irrigation. The objective of this study was therefore, to diagnose the single-line weirs constructed by farmers themselves for; (i) Physical conditions of the existing simple weirs, (ii) River flow characteristics on which simple weirs are constructed (iii) Explore river flow against flow diverted potentially for irrigation.
2. Materials and Methods
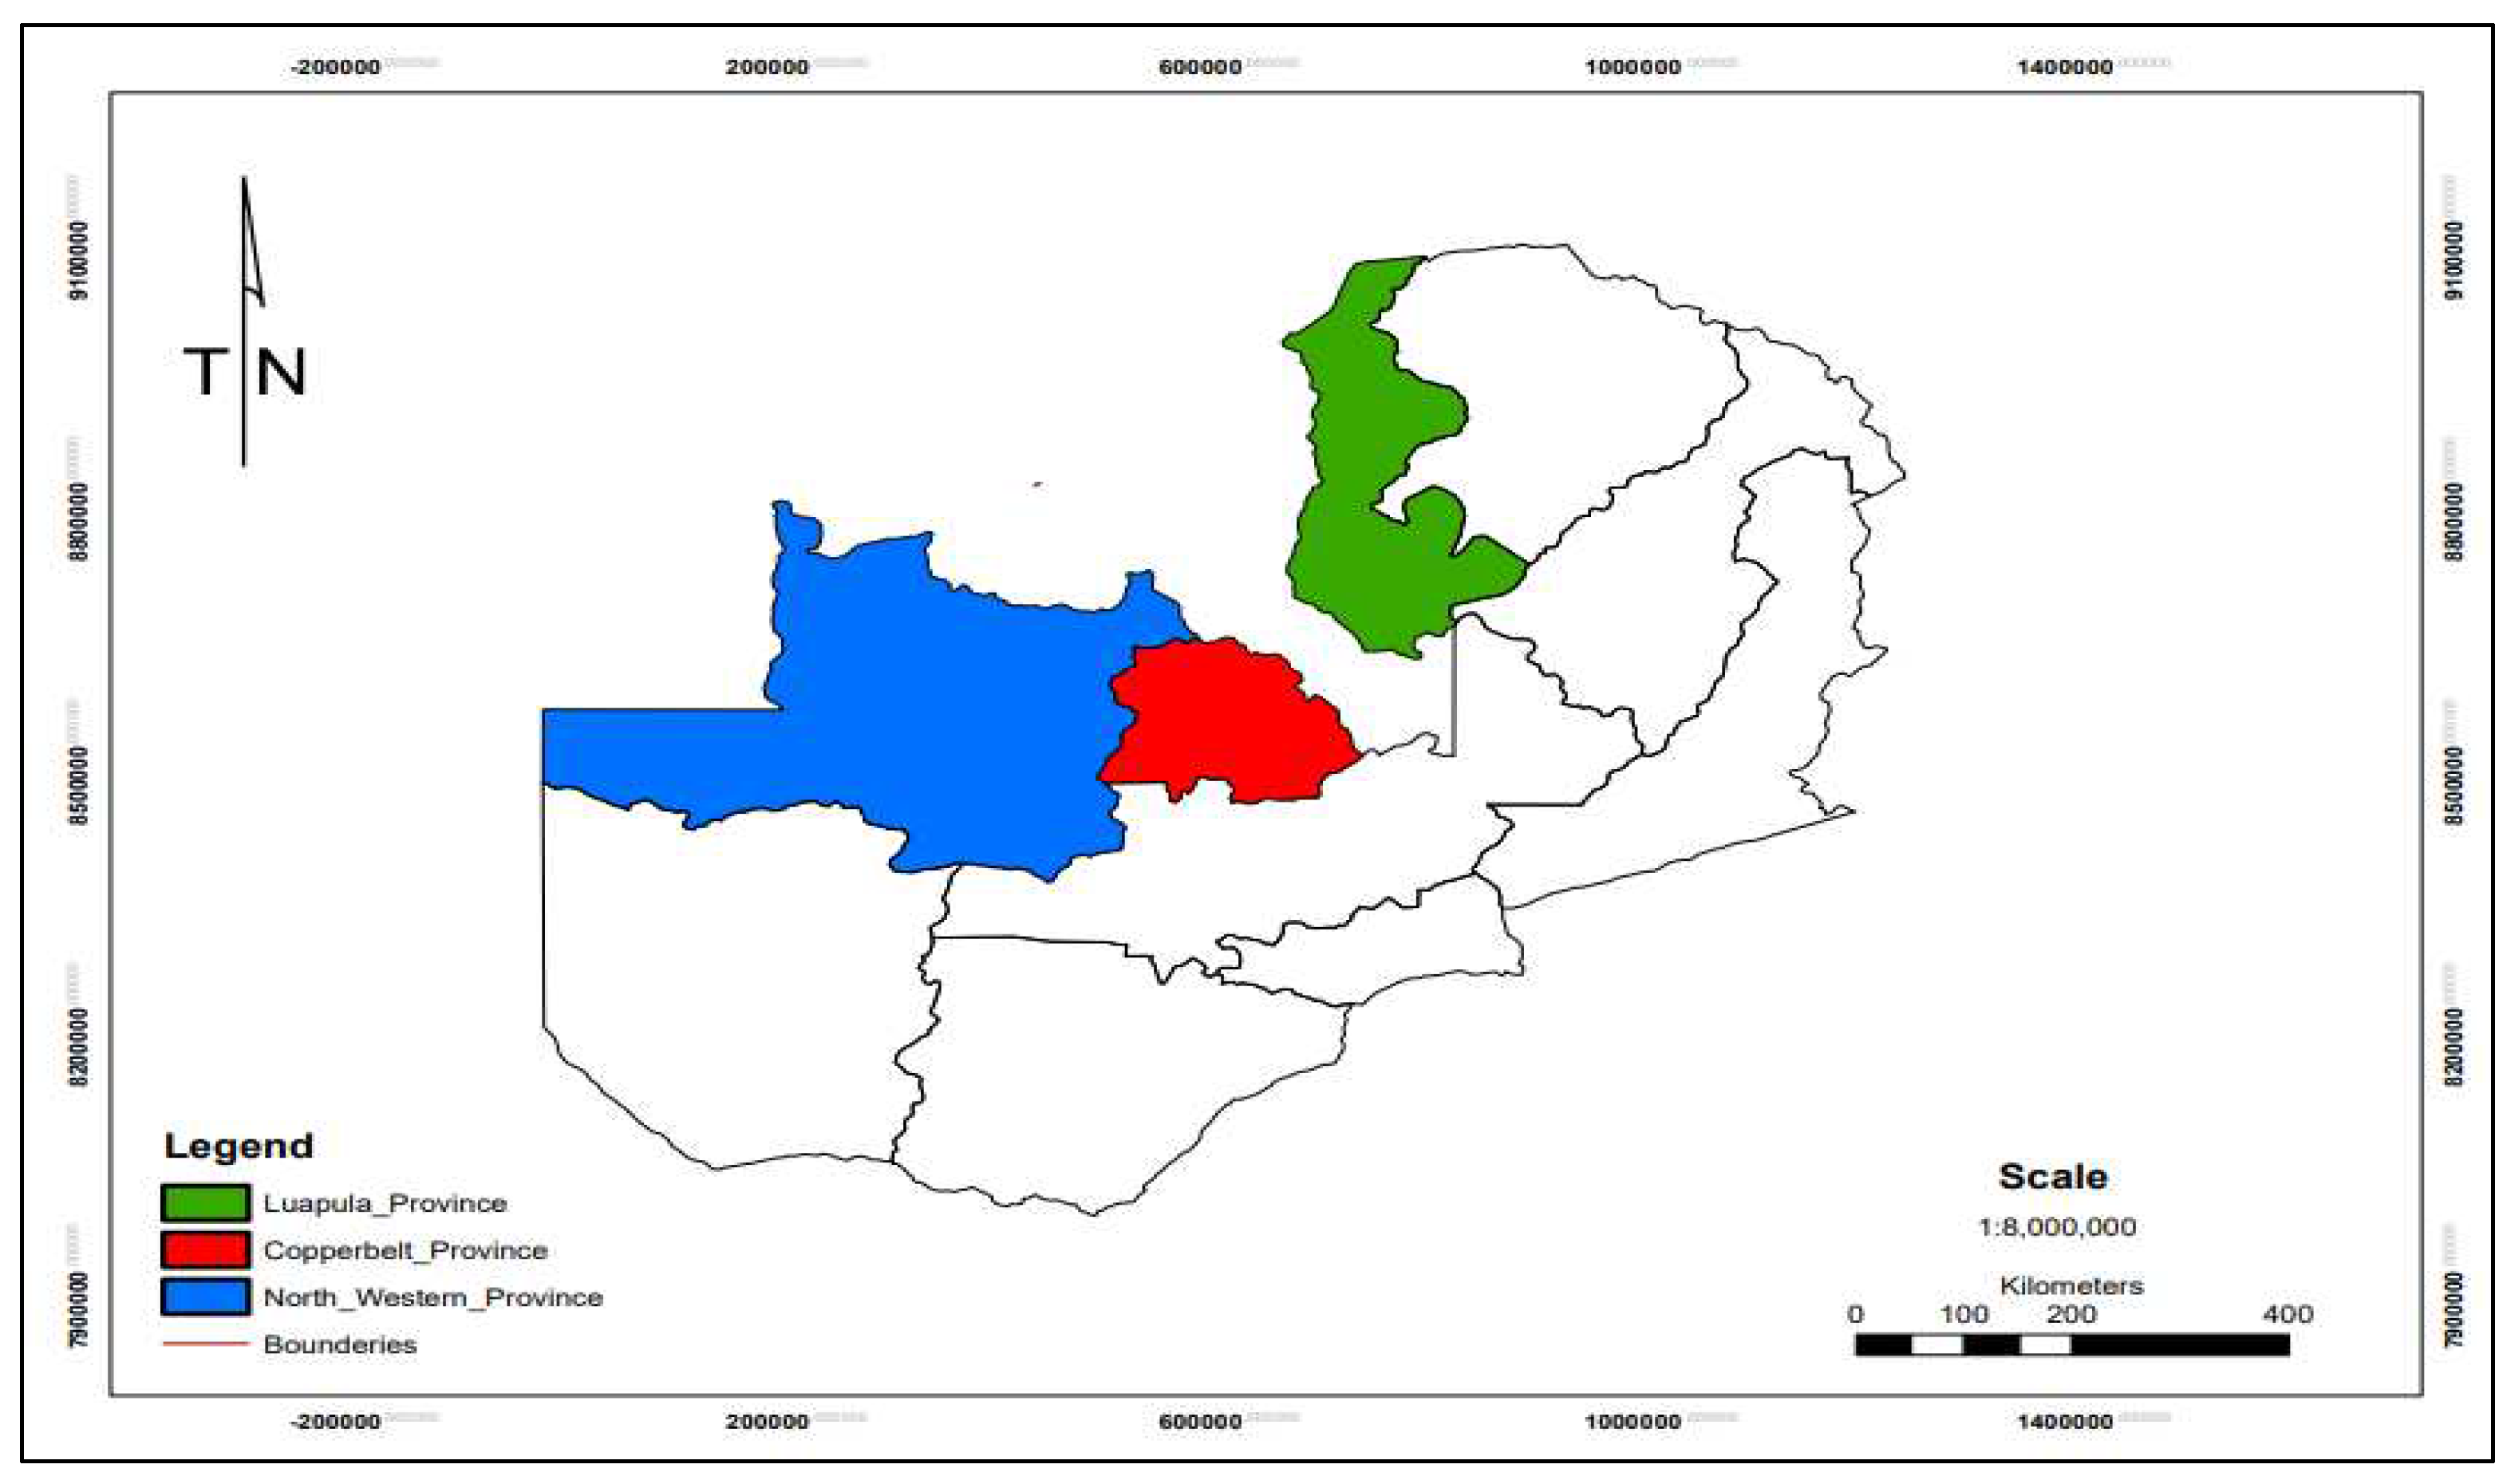
In the northern region provinces of Zambia, single-line simple weirs are generally constructed or repaired between April and June in preparation for dry season irrigation between May and November and sometimes for deficit irrigation between December and March. Radom sampling of the simple weirs was used to collect data, in 3 provinces and 15 single-line weirs, 5 single weirs per province. The diagnostic assessments were carried out between 2022 November- 2023 January in Luapula, Copperbelt, and North-western provinces (
Figure 1). At each single-line weir site, the following data were collected; weir height, the distances between the poles across the river width, river flow discharges, flow water diverted by every single weir, and intake dimension of the off-taking canal.
2.1. Study Areas
Zambia is characterized by two climate seasons. The rainy season is experienced from late December to early April. The rainy season is followed by the dry season occurring from early May to late November. Rainfed agriculture approximately accounts for 90% [
13] of the agricultural activities in Zambia. However, in the country’s northern region, agricultural activities are extended all year round because of irrigation activities due to the suitability of the region’s topography, favourable climate, abundant surface water sources, and rapid emergence of small-scale farmers [
14].
2.2. Data Collection Method
This research used both quantitative involving the administration of the questionnaires with Luapula (participants), n=39, Copperbelt (participants) n=27 and north-western (participants), n=19, totalling 85 participants and qualitative data (gathered through discussions with members of the simple weir irrigation scheme, interviewing agricultural extension officers, vegetable buyers, site visits methods). Much of the secondary data on the single-line weirs was available as a pictorial illustration. The primary data were collected through conducting interviews with the agricultural extension officers who attended the 2022 annual evaluations and inventory of the single-line weirs in the region. These sources provided information on the challenges and constraints of simple weirs based on their field experience with the facilities. The visit to the sites helped in observing the physical conditions of the weirs, conducting onsite interviews of simple weir users, measuring the lengths and heights of weirs, the flow rate of water discharges, water diverted for irrigation, and assessing the degree of weir damage.
2.3. Single-line Simple weir Structural Design Assessment
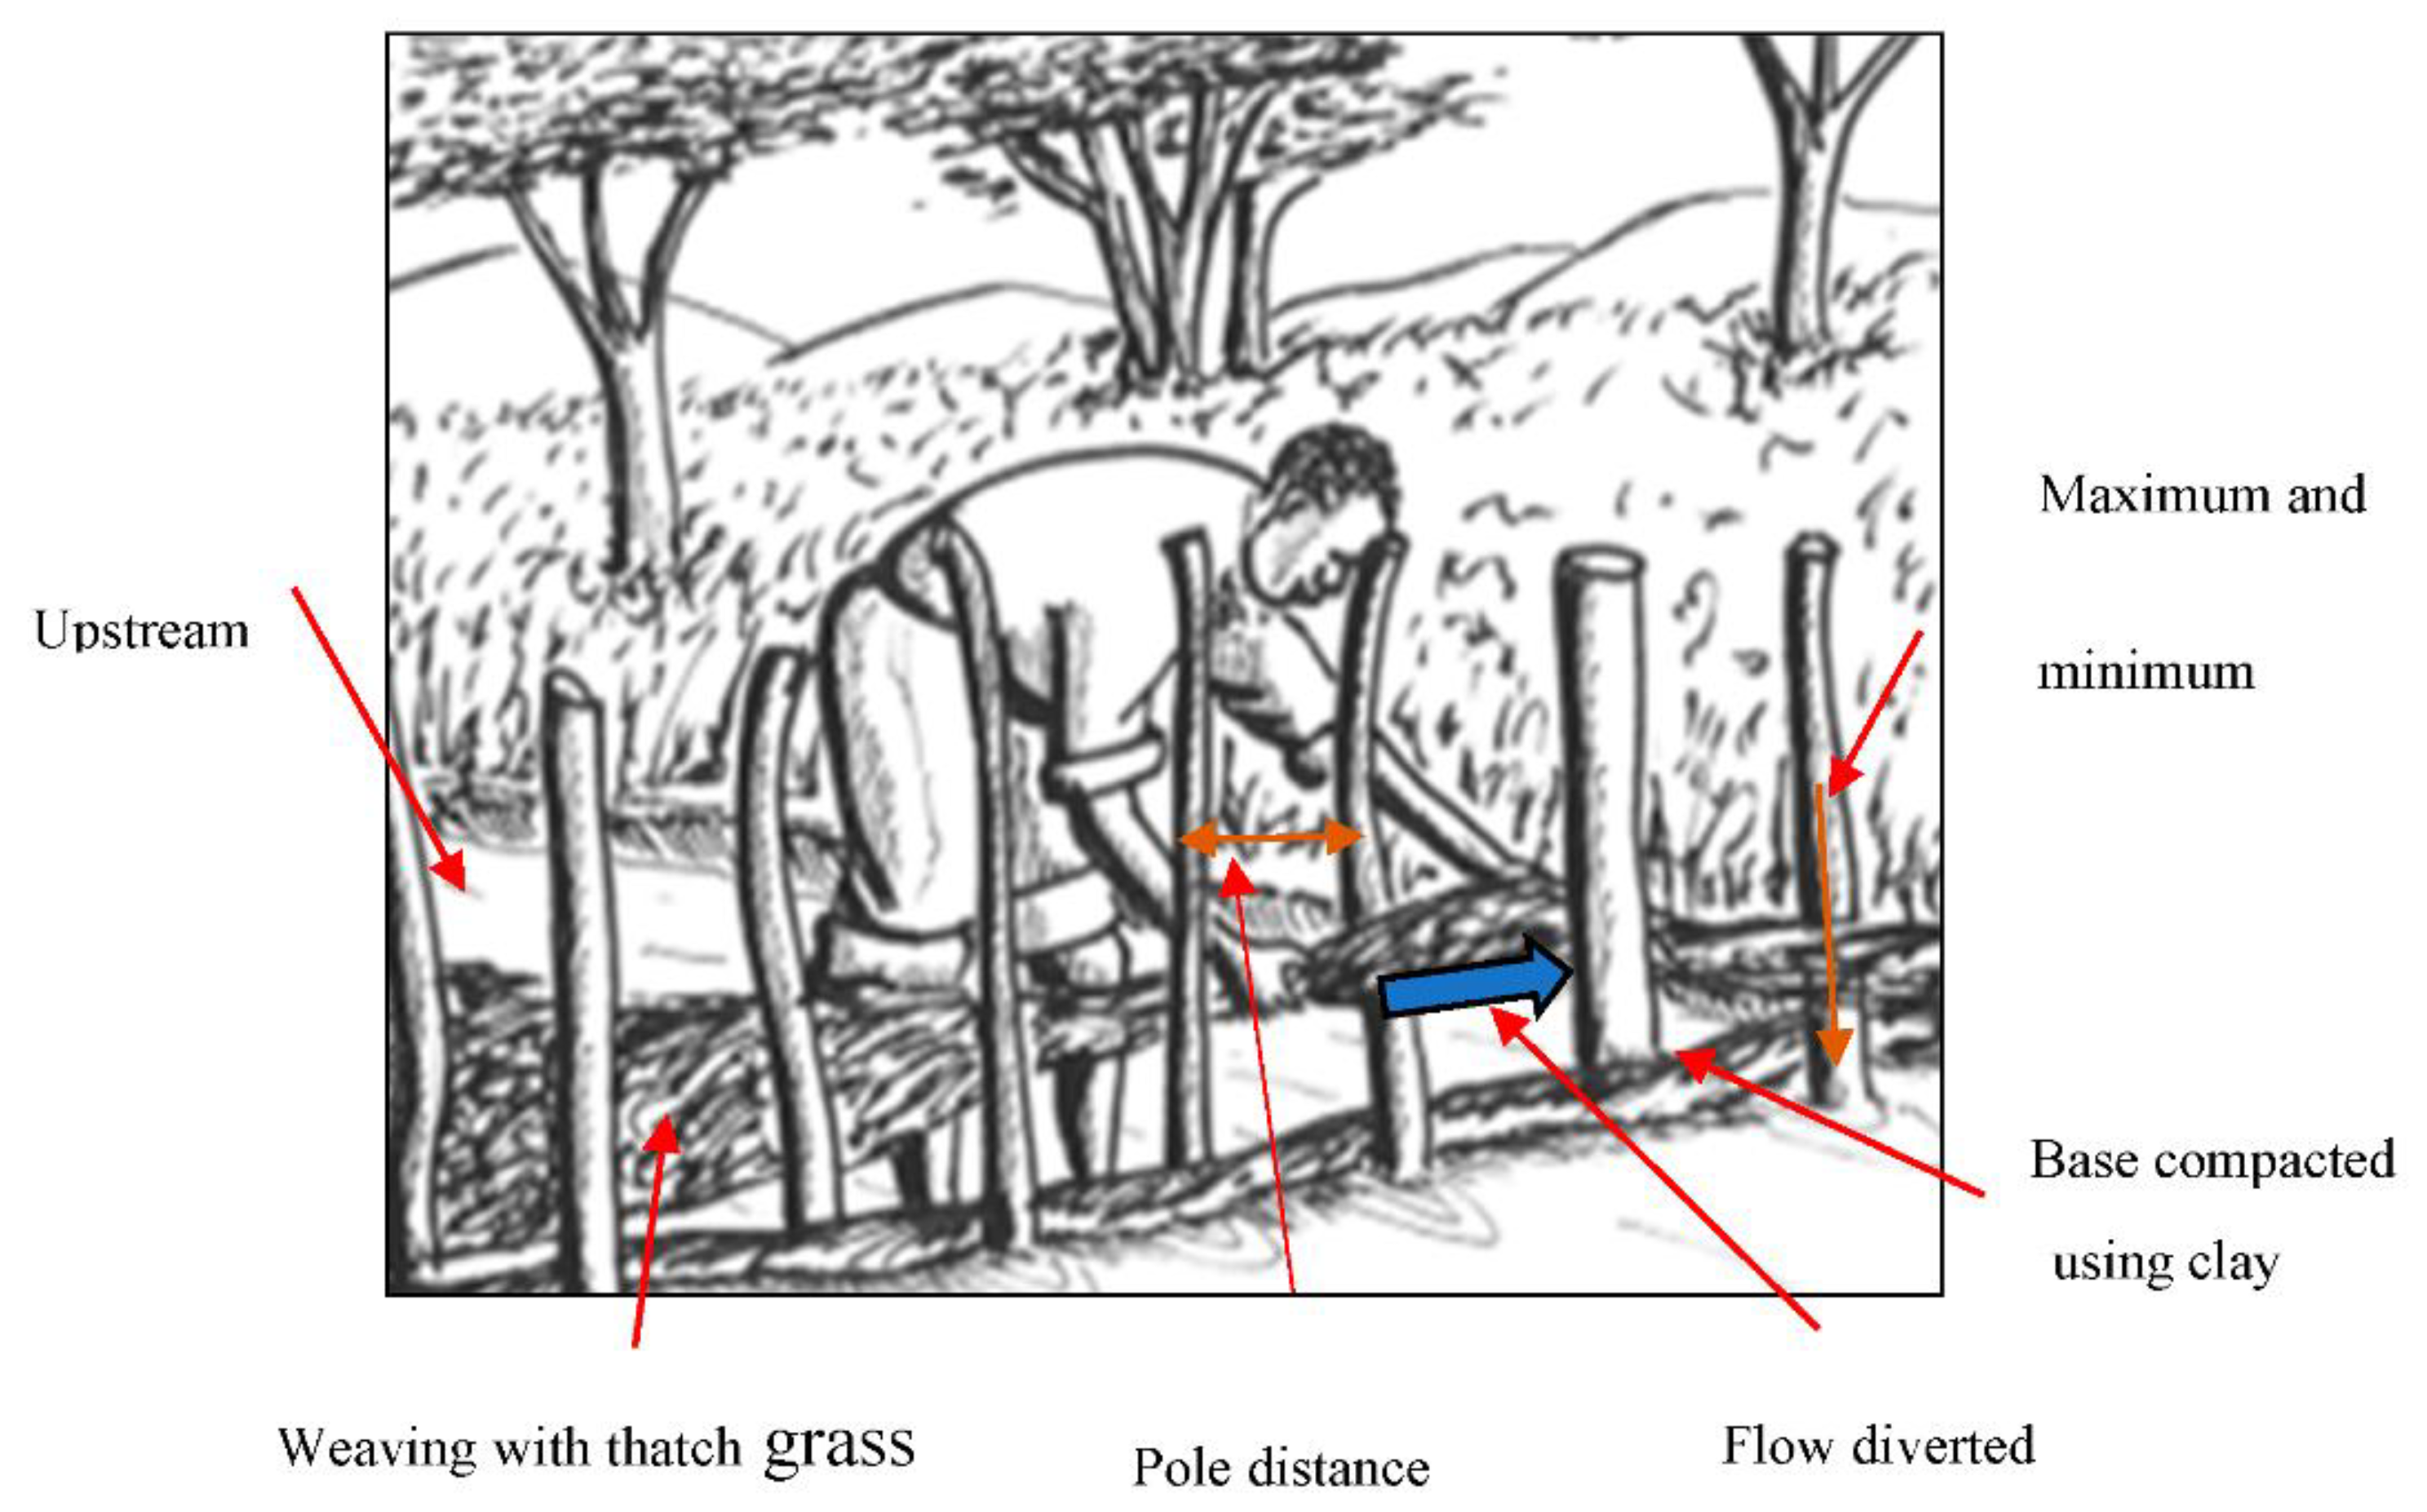
The key materials of single-line weirs are: forest poles, thatch grass, and tree bark strips and the social-economic elements of the facility include local availability of the material, low cost, and simple installation. The single-line weir, shown in
Figure 2 was constructed using wooden poles and thatch grass. Wooden poles were embedded in the riverbed across the width of the river. The base of the weir was compacted using heavy clay soil to enhance anchorage. A bunch of thatch grass was weaved between the poles up to the historical water level.
2.4. Site visits
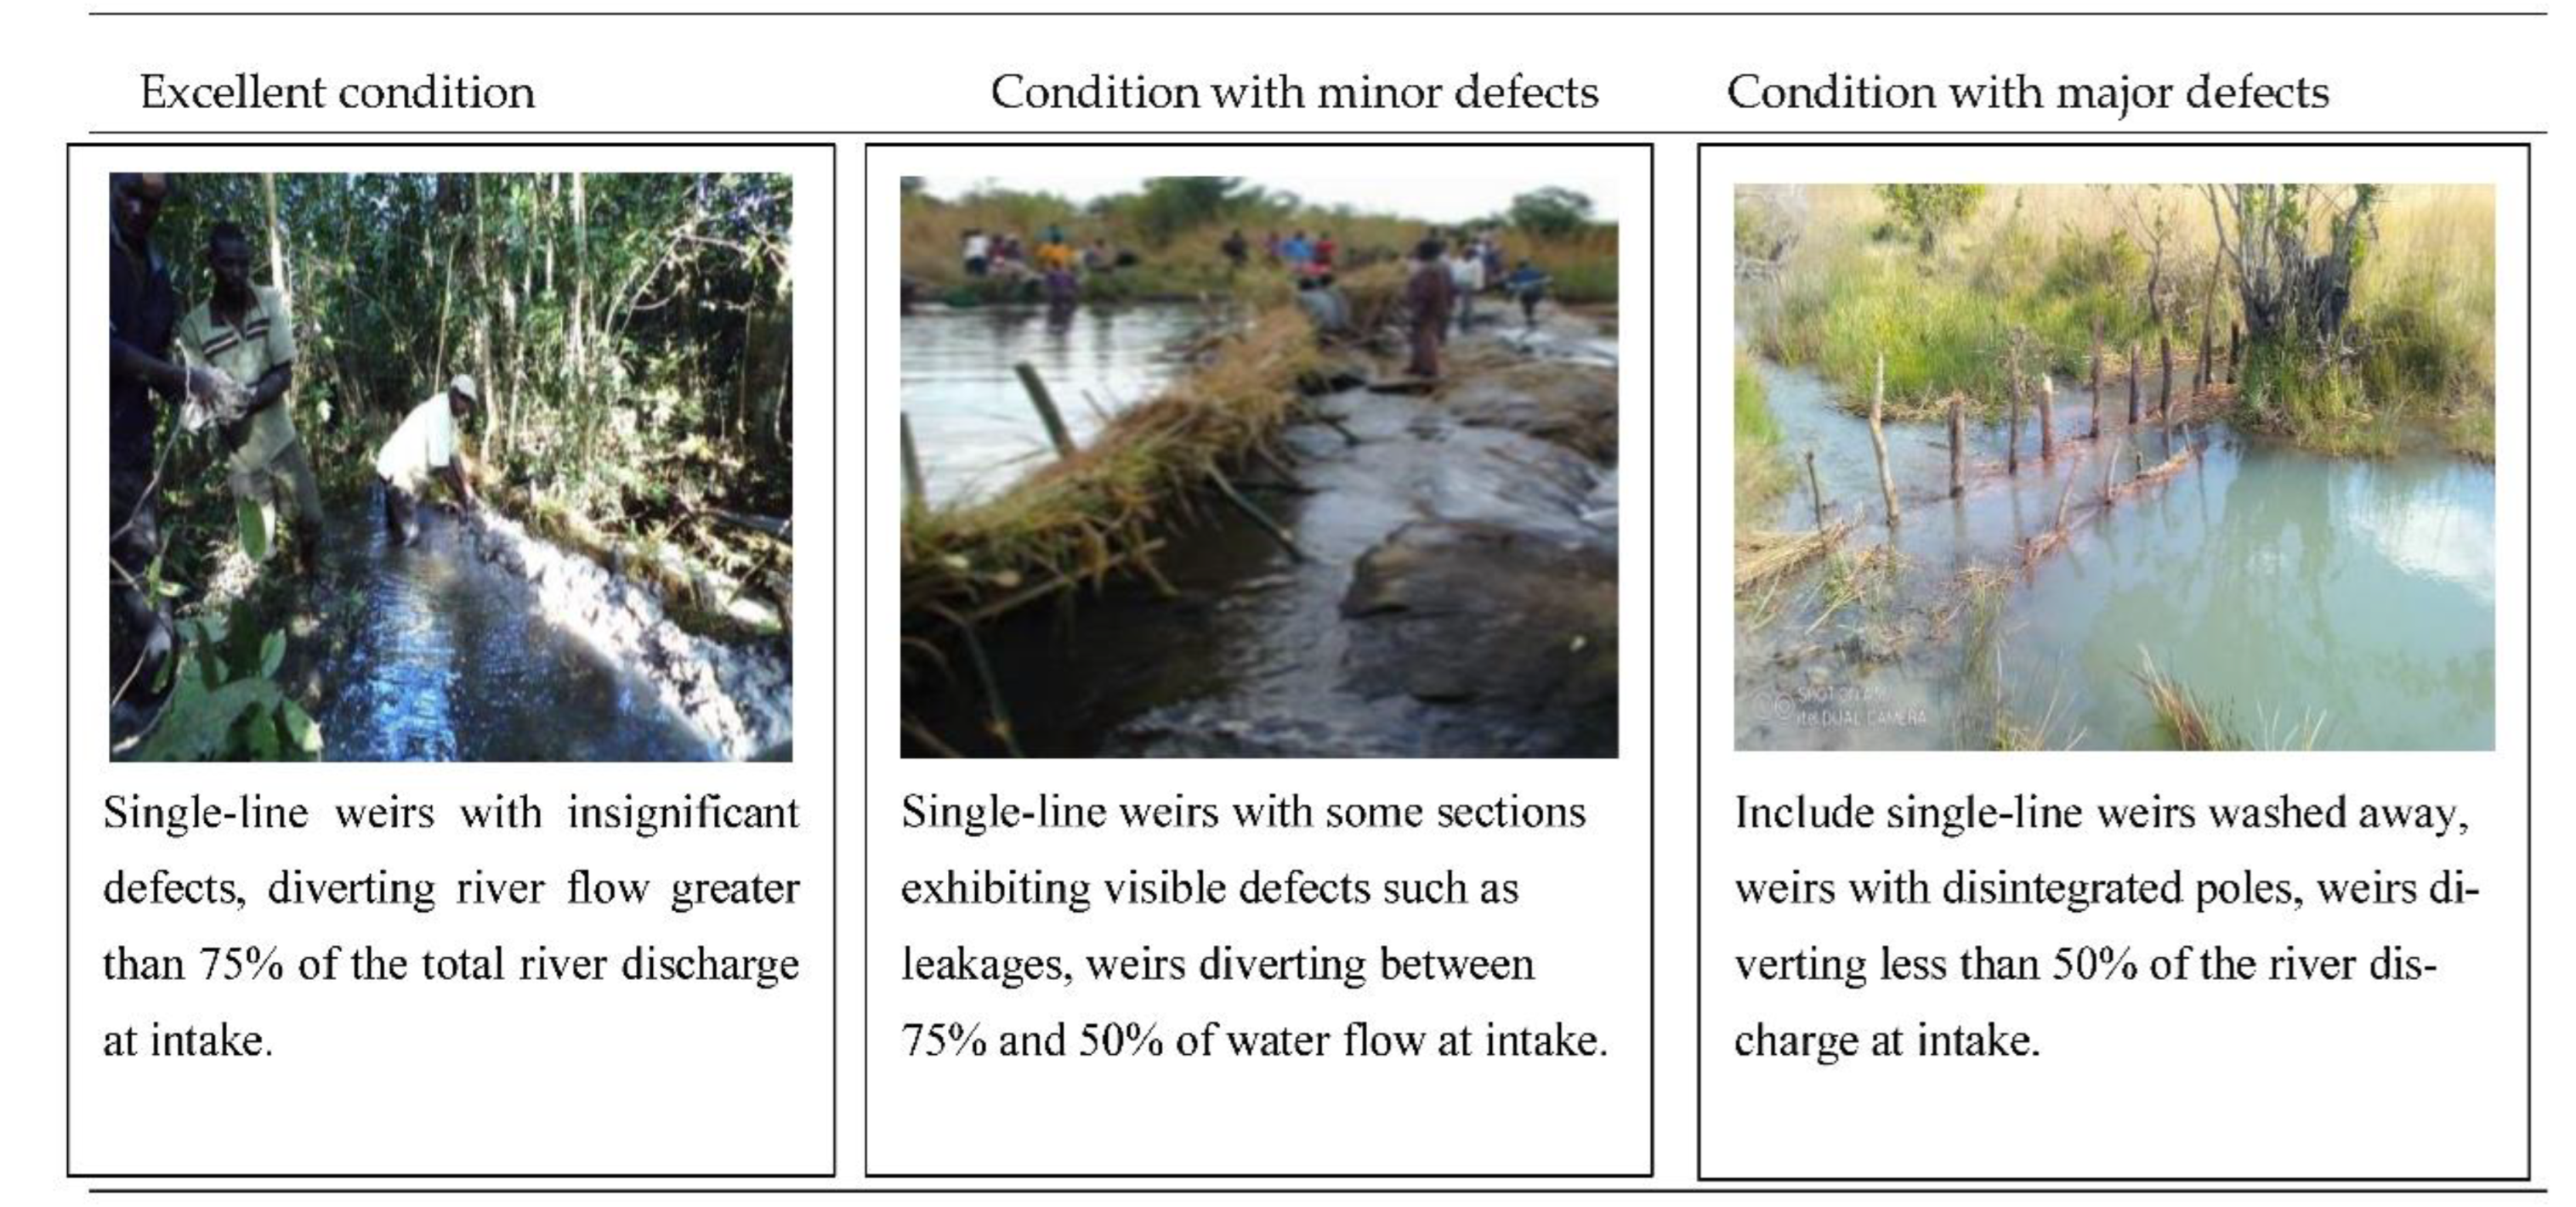
Site visits were conducted to existing single-line weirs used by farmers for irrigation in the northern region provinces in Zambia. 15 sites with single-line weirs were visited, 5 in Luapula province, 5 in Copperbelt province, and 5 in the North-western province. The physical statuses of weirs were assessed and characterized as excellent (newly reconstructed or maintained), with minor defects (loose connections, leakages) and major defects (Collapse, washed away, severe leakages). A schematic illustration of the construction of a single line is shown in
Figure 2.
2.5. Measuring the Discharge of Water in Rivers
A stretch of a river was demarcated by two points and the width (W) measured was relatively uniform and free of vegetation disturbance. The width of the river was measured and divided into equal parts (d
1-d
n)/n. The depths were measured at the points equally spaced across the river width. The average depth (D) of each river was calculated by:
Where d is the depth at equally spaced points across river width (m), D is the average depth across the river (m). The cross-sectional area of each river was calculated using the formula:
Where A is the cross-sectional area (m2), w is the river width (m)
The experiment required the following equipment to be conducted: (i) Stopwatch, (ii). Floater, (iii). Measuring tape, and 4. 2-marking out pegs. The floater was submerged slightly below the river water surface at the first peg of the demarcated section of the river. The floater’s travel time between the distance fixed by the two pegs was recorded and repeated at least three times. The average speed (V) of the water was multiplied by the cross-sectional area to obtain the theoretical river discharge (Q) calculated as:
where
Q is the mathematical volumetric discharge (m
3/s),
V is the average velocity of water in the river channel (m/s) and
A is the cross-sectional area (m
2).
The discharge diverted is regulated by the upstream water level. Therefore, the fluctuation in the volumetric flow rate diverted is due to the changes in the water level upstream. In canals, the mathematical estimation of the water flow rate is adjusted by the factor 0.8 to take into consideration the inherent variations in flow rates and volume of water[
15,
16].
Where Q
a is the actual volumetric discharge (m
3/s),
Q is the mathematical volumetric discharge (m
3/s).
The river’s historical maximum water level determined the flood diversion height for the single-line weir. The height of each single-line weir was constructed relatively higher than the river’s historical water level as a benchmark to obtain the optimal water elevation that could easily be diverted into a canal taking off at the upstream side of the weir. The elevated height of the weir was desired for water to be discharged based on gravity.
2.6. Estimating River Flow Rate and Flow Rate Discharges at the Intake Using Diversion Coefficient
The river discharge diverted into the intake located upstream of each single line weir was determined using Manning’s, and Lenkei’s nomographs and intake dimensions for each site in the study. The important intake dimensions used to estimate the volumetric discharge diverted included canal slope, canal water depth, side slope, and canal soil characteristics. Using the flow measurement method, the principal mass conservation was used to compare the river discharge flowing in and the river diversion flowing out through the off-take canal [
17].
The measure of the amount of water and flow rate used in the evaluation of the single-line weirs was the determination of the flow rate diversion coefficient (Cd), defined as:
The diversion coefficient in the study is expressed as a percentage of the river flow diverted at the intake.
3. Results and Discussion
3.1. Baseline Data of Simple Weir Types Constructed by Farmers
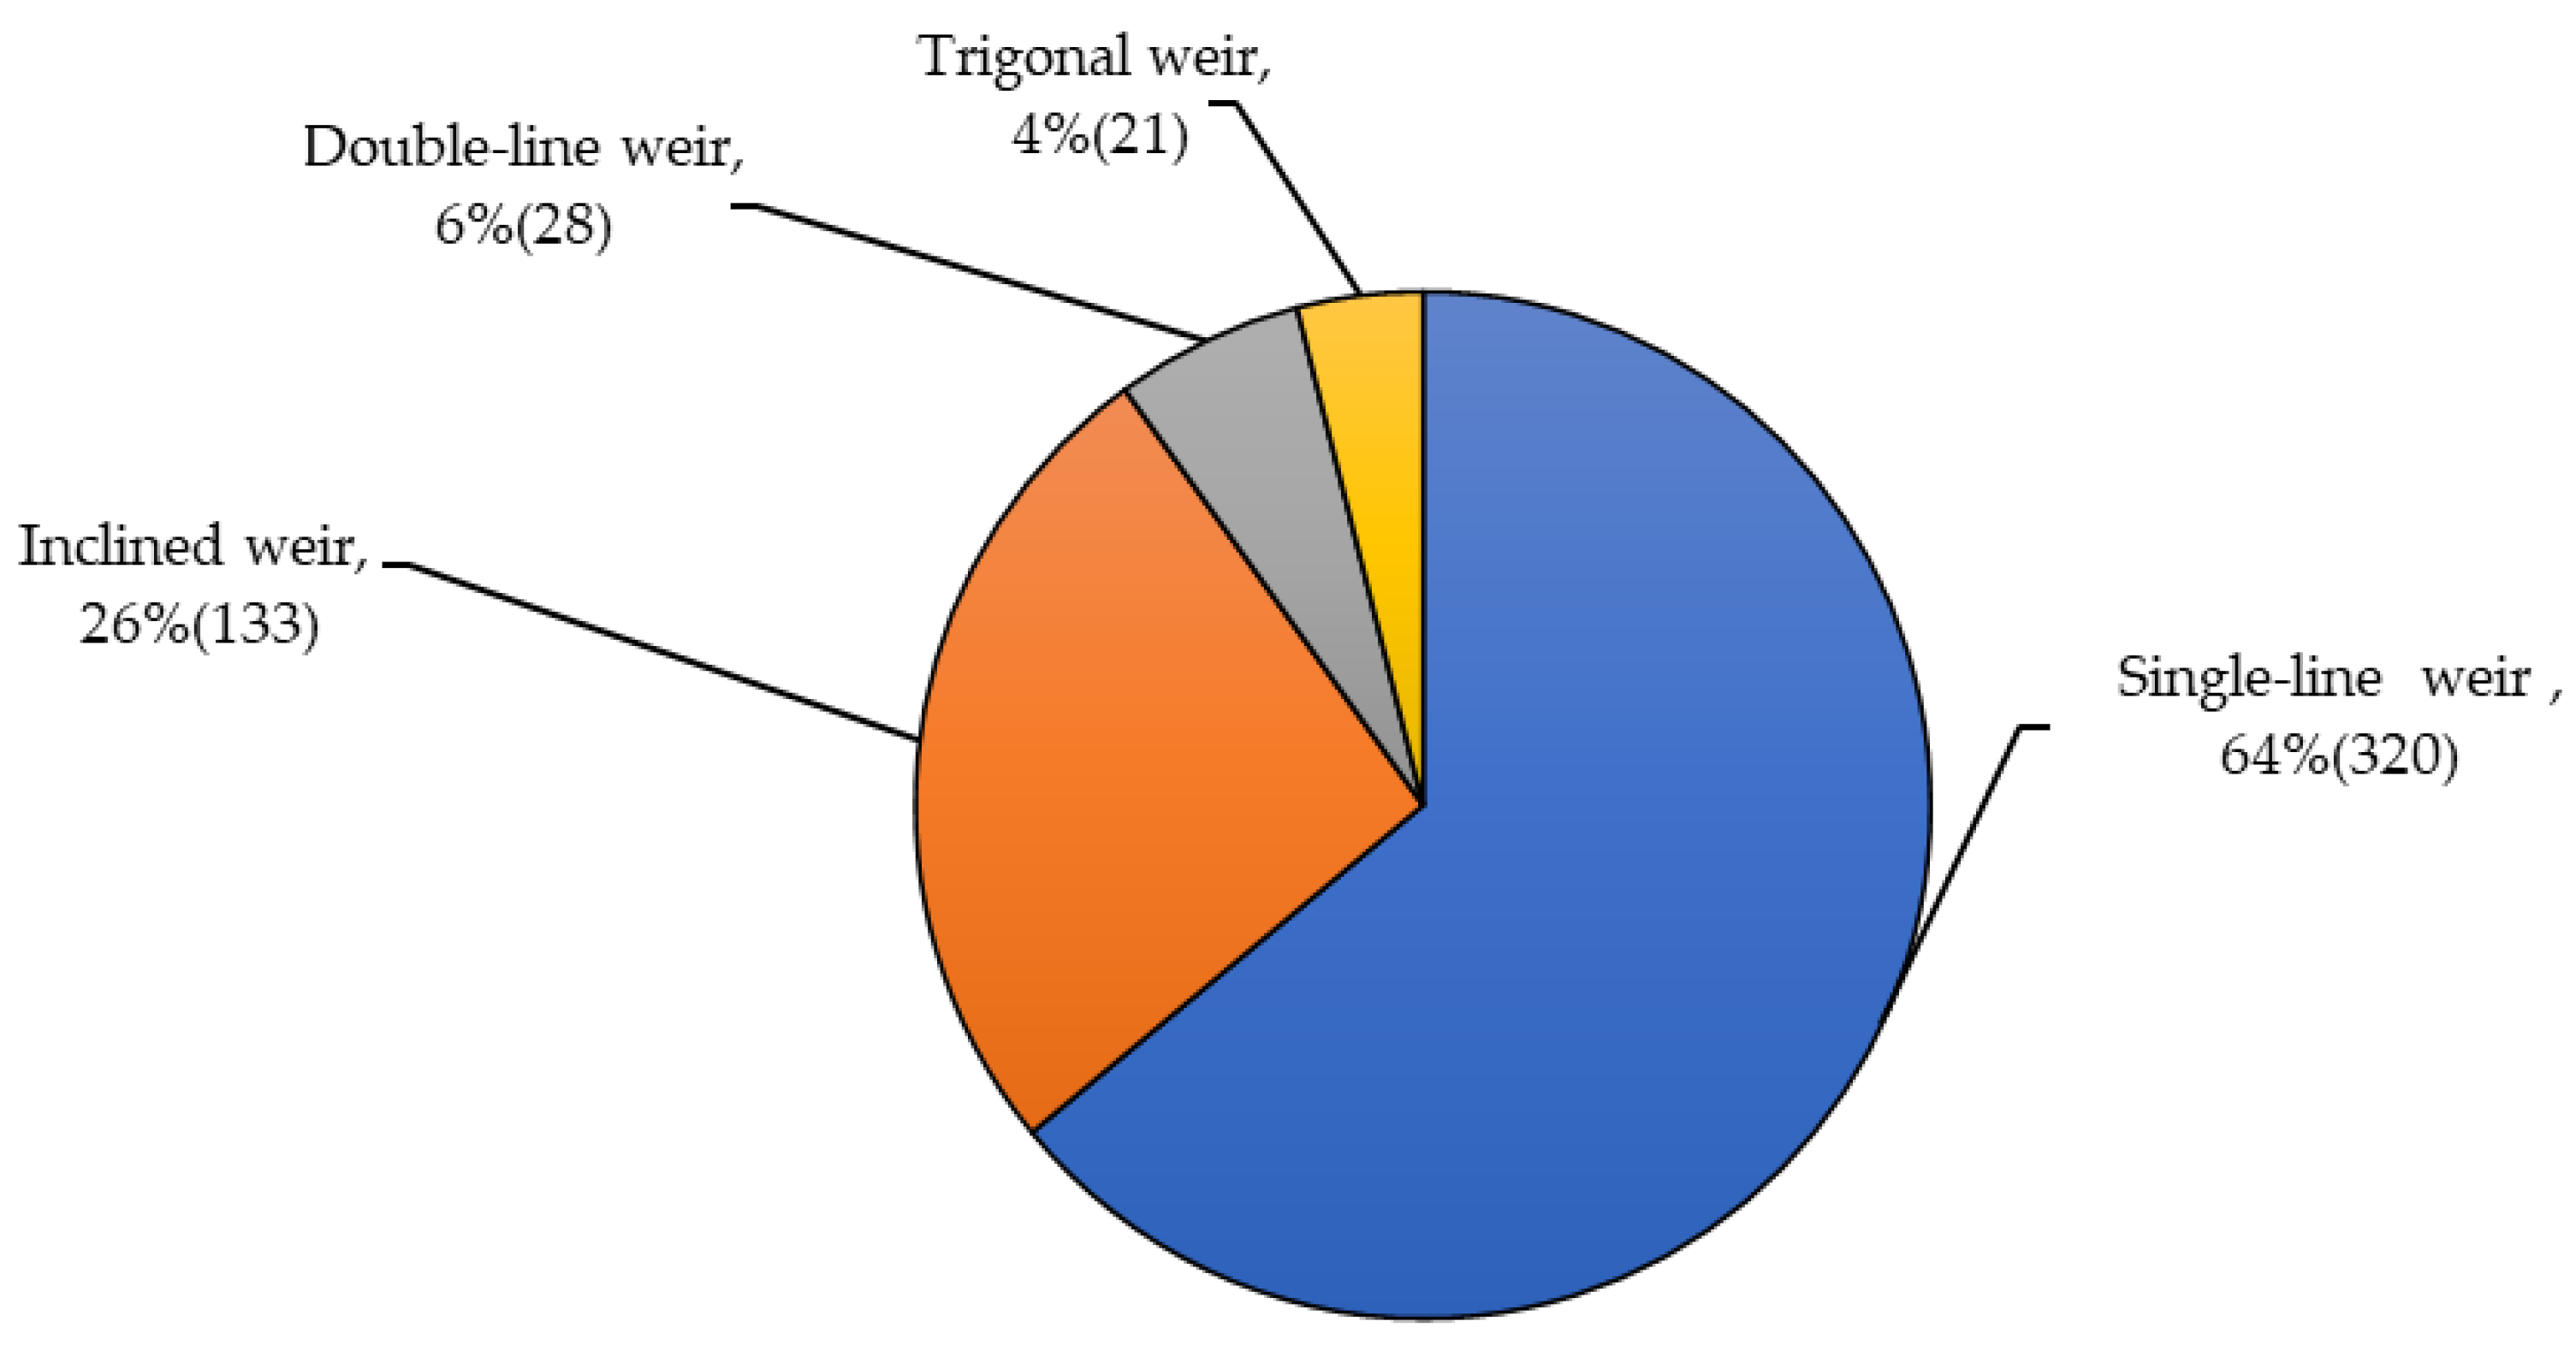
Figure 3 shows the proportions of the four types of simple weirs. The single-line weirs are the widely distributed type and constructed for small-scale irrigation in Luapula, Copperbelt, and North-western provinces. The characterization of simple weir types is based on previous reports [
18]. Five hundred and two simple weirs were constructed between May and August 2022. The following are proportions of simple weir types constructed by farmers, inclined type 26% (133), double-line weir 6% (28), trigonal weir 4% (21), and single-line weir type 64% (320). The data collected was largely provided by field agricultural extension officers (annual reports) based on the interviews with weir users during field visits and verified with District agricultural officials to check the data reliability.
502 simple weirs were constructed between May and August 2022. The following are proportions of simple weir types constructed by farmers, inclined type 26% (133), double-line weir 6% (28), trigonal weir 4% (21), and single-line weir type 64% (320). The data collected was largely provided by field agricultural extension officers ( annual reports) based on the interviews with weir users during field visits and verified with District agricultural officials to check the data reliability.
3.2. Prevailing Physical Condition Based on Rating Criteria of Single-Line Weirs
The results in
Table 1a,b show the existing physical conditions at the time of the field visit. 67% (10) single-line weirs were in excellent condition (newly reconstructed, maintained, or repaired), Luapula 4 weirs, Copperbelt 3 weirs, and North-western 3 weirs. 26% (4) weirs were partly damaged (leaking, loose connection, decaying thatch grass) mainly due to a lack of repair and maintenance, 1 in Luapula, 1 in the Copperbelt, and 2 in Northwestern. While 7% (1) site in the Copperbelt was observed with a washed-away weir, likely caused by the increase in river inflows. The study also revealed that the wet season (November to March) was the period when single-line weirs were most vulnerable to damage. The problems experienced with single-line weirs are due to their susceptibility to flood damage, thus requiring reconstruction sometimes annually [
19]. However, it was also found that 33% (5/15) of the single-line weirs in the study were damaged in the dry season.
3.3. River Geometric and Hydraulic Parameters in Luapula, Copperbelt and Northwestern Provinces
Table 2,
Table 3 and
Table 4 are summaries of data for the rivers diverted by single-line weirs. Characteristics of dimensions and volumetric discharges across 15 single-line weirs obtained between 12/11/2022-30/12/2022. The study showed that regardless of the province river width, depth, and historical flood level have an effect on river water re-directed by the single-line weir. In Luapula, river widths averaged between 2.9 to 7.3m, river depths averaged between 0.98 to 1.4m and river flows averaged between 0.1m
3/s to 0.27m
3/s; in Coppebert, river widths averaged between 5.5 to 9.1m, river depths averaged between 1.1 to 1.6m and river flows between 0.17m
3/s to 0.28m
3/s while in North-western river widths were between 4.9 to 7.1m, river depths between 1.1 to 1.5m and river discharges between 0.17 to 0.32m
3/s. The findings of this study reveal (1) the maximum flood level and (2) the quantity of flow diversion potentially created by the construction of single-line weirs.
3.4. Volumetric River Flow using River width (W), Average River Depth (D), and River Velocity (V)
The continuity equation (1) was used to assess the flow of each river in the study and estimate the flow diverted by the single-line weirs constructed on each river [
20].
3.4.1. River Profiles with Single-Line Weirs in Luapula
Table 5.
Summary of measurements and calculations of river flow for single-line weir site L1.
Table 5.
Summary of measurements and calculations of river flow for single-line weir site L1.
| Date |
A Average
depth(D)
(m) |
River
Width
(m) |
Cross-
sectional area
(m2) |
Average water velocity(V)
(m/s) |
Calculated discharge(Q)
(m3/s) |
Actual river discharge (Multiply by factor 0.8) |
| 12-15/11/2022 |
0.40 |
3.48 |
1.40 |
0.04 |
0.06 |
0.04 |
Table 6.
Summary of measurements and calculations of river flow for single-line weir site L2.
Table 6.
Summary of measurements and calculations of river flow for single-line weir site L2.
| Date |
Average depth(D)
(m) |
River width
(m) |
Cross-sectional area
(m2) |
Average water velocity(V)
(m/s) |
Calculated discharge(Q)
(m3/s) |
Actual river discharge
(Multiply by
factor 0.8) |
| 16-19/11/2022 |
0.30 |
2.60 |
0.78 |
0.02 |
0.02 |
0.01 |
Figure 2.
Details of the river at the single-line weir site L1.
Figure 2.
Details of the river at the single-line weir site L1.
Table 7.
Summary of measurements and calculations of river flow for single-line weir site L3.
Table 7.
Summary of measurements and calculations of river flow for single-line weir site L3.
| Date |
Average depth(D)
(m) |
River width
(m) |
Cross-sectional area
(m2) |
Average water velocity(V)
(m/s) |
Calculated discharge(Q)
(m3/s) |
Actual river discharge
(Multiply by
factor 0.8) |
| 20-23/11/2022 |
0.70 |
5.70 |
3.99 |
0.03 |
0.12 |
0.10 |
Figure 3.
Details of the river at the single-line weir site L2.
Figure 3.
Details of the river at the single-line weir site L2.
Table 8.
Summary of measurements and calculations of river flow of single-line weir site L4.
Table 8.
Summary of measurements and calculations of river flow of single-line weir site L4.
| Date |
Average depth(D)
(m) |
River width
(m) |
Cross-sectional area
(m2) |
Average
Water
Velocity(V)
(m/s) |
Calculated
discharge(Q)
(m3/s) |
Actual river
discharge
(Multiply by
factor 0.8) |
| 24-27/11/2022 |
0.40 |
7.30 |
2.92 |
0.03 |
0.09 |
0.07 |
Figure 4.
Details of the river at the single-line weir site L3.
Figure 4.
Details of the river at the single-line weir site L3.
Table 9.
Summary of measurements and calculations of river flow for single-line weir site L5.
Table 9.
Summary of measurements and calculations of river flow for single-line weir site L5.
| Date |
Average depth(D)
(m) |
River width
(m) |
Cross-sectional area
(m2) |
Average
water velocity(V)
(m/s) |
Calculated discharge(Q)
(m3/s) |
Actual river discharge
(Multiply by factor 0.8) |
| 28-30/11/2022 |
0.50 |
5.20 |
2.60 |
0.03 |
0.08 |
0.06 |
Figure 5.
Details of the river at the single-line weir site L4.
Figure 5.
Details of the river at the single-line weir site L4.
Figure 6.
Details of the river at the single-line weir site L5.
Figure 6.
Details of the river at the single-line weir site L5.
3.4.2. River Profiles with Single-Line Weirs in Copperbelt Province
Table 10.
Summary of measurements and calculations of river flow for single-line weir site C1.
Table 10.
Summary of measurements and calculations of river flow for single-line weir site C1.
| Date |
Average depth(D)
(m) |
River width
(m) |
Cross-sectional
area
(m2) |
Average
water
velocity(V)
(m/s) |
Calculated
discharge (Q)
(m3/s) |
Actual river
discharge
(Multiply by
factor 0.8) |
| 03-04/12/2022 |
0.40 |
6.30 |
2.52 |
0.03 |
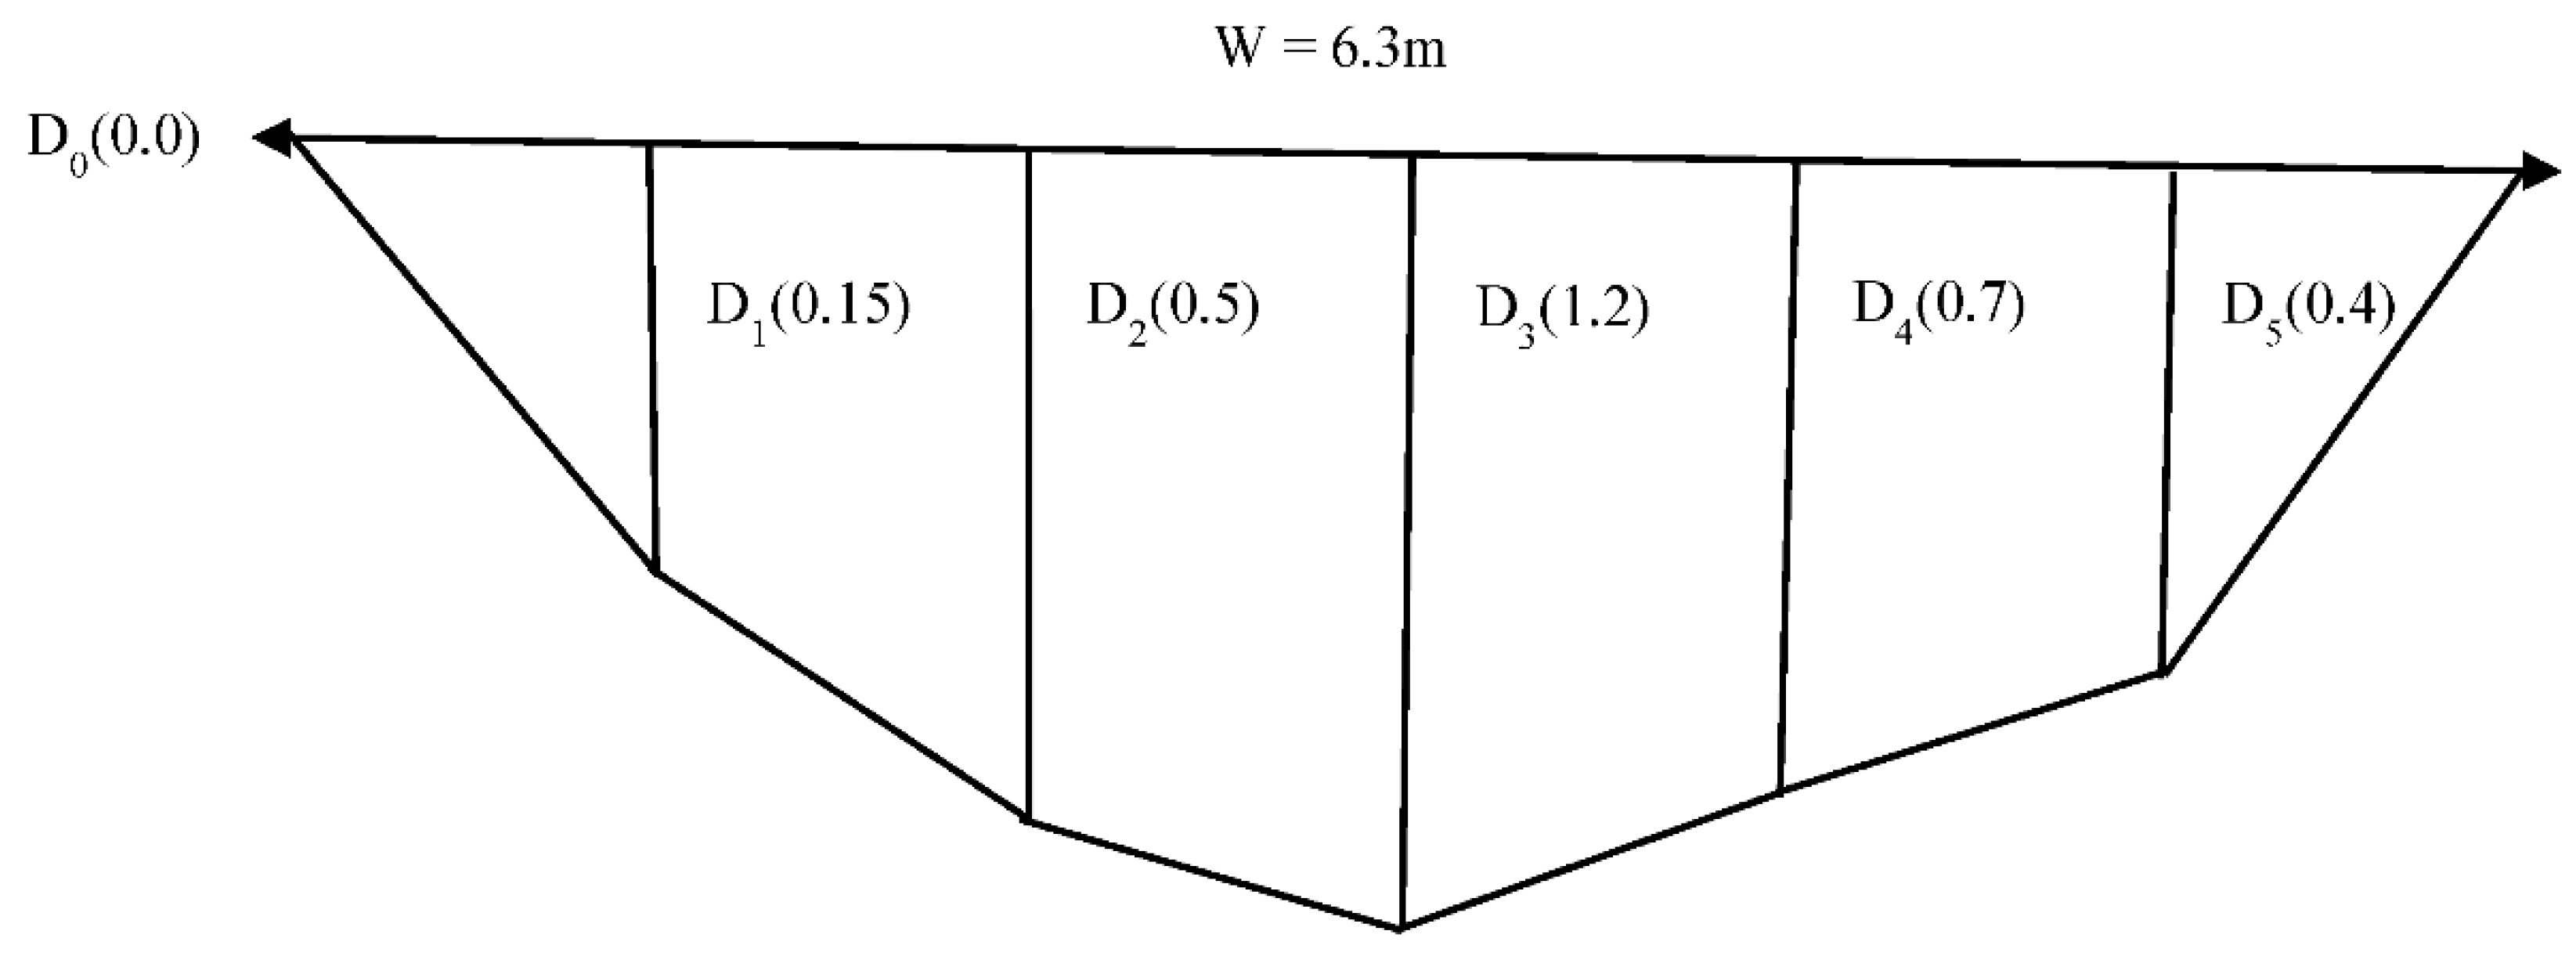
0.08 |
0.06 |
Figure 7.
Details of the river at the simple-line weir site C1.
Figure 7.
Details of the river at the simple-line weir site C1.
Table 11.
Summary of measurements and calculations of river flow for single line weir site C2.
Table 11.
Summary of measurements and calculations of river flow for single line weir site C2.
| Date |
Average
depth(D)
(m) |
River width
(m) |
Cross-sectional
Area
(m2) |
Average
water
velocity(V)
(m/s) |
Calculated
discharge(Q)
(m3/s) |
Actual river
discharge
(Multiply by
factor 0.8) |
| 5-6/12/2022 |
0.40 |
9.10 |
3.64 |
0.02 |
0.07 |
0.06 |
Figure 8.
Details of the rivers at the single-line weir site C2.
Figure 8.
Details of the rivers at the single-line weir site C2.
Table 12.
Summary of measurements and calculations of river flow for single-line weir site C3.
Table 12.
Summary of measurements and calculations of river flow for single-line weir site C3.
| Date |
Average depth(D)
(m) |
River width
(m)
|
Cross-sectional area
(m2) |
Average water
velocity(V)
(m/s) |
Calculated
discharge (Q)
(m3/s) |
Actual river discharge
(Multiply by
factor 0.8) |
| 7-8/12/2022 |
0.30 |
7.40 |
2.22 |
0.02 |
0.04 |
0.04 |
Figure 9.
Details of the river at the single-line weir site C3.
Figure 9.
Details of the river at the single-line weir site C3.
Table 13.
Profile data of the river, single-line weir site C4.
Table 13.
Profile data of the river, single-line weir site C4.
| Date |
Average depth(D)
(m) |
River width
(m) |
Cross-sectional area
(m2) |
Average water velocity(V)
(m/s) |
Calculated discharge(Q)
(m3/s) |
Actual river
discharge
(Multiply by
factor 0.8) |
| 8-9/12/2022 |
0.40 |
5.50 |
2.20 |
0.03 |
0.07 |
0.05 |
Figure 10.
Details of the river at the single-line weir site C4.
Figure 10.
Details of the river at the single-line weir site C4.
Table 14.
Summary of measurements and calculations of river flow for single-line weir site C5.
Table 14.
Summary of measurements and calculations of river flow for single-line weir site C5.
| Date |
Average depth(D)
(m) |
River width
(m) |
Cross-sectional area
(m2) |
Average water velocity(V)
(m/s) |
Calculated
discharge(Q)
(m3/s) |
Actual river
discharge
(Multiply by
factor 0.8) |
| 13-14/12/2022 |
0.50 |
6.70 |
3.35 |
0.02 |
0.07 |
0.05 |
Figure 11.
Details of the river at the single-line weir site C5.
Figure 11.
Details of the river at the single-line weir site C5.
3.4.3. River Profiles with Single-Line Weirs in the North-western Province
Table 15.
Summary of measurements and calculations of river flow for single-line weir site NW1.
Table 15.
Summary of measurements and calculations of river flow for single-line weir site NW1.
| Date |
Average
depth(D)
(m) |
River width
(m) |
Cross
Sectional
area
(m2) |
Average water
velocity(V)
(m/s) |
Calculated
discharge(Q)
(m3/s) |
Actual river
discharge
(Multiply by
factor 0.8) |
| 15-12/12/2022 |
0.40 |
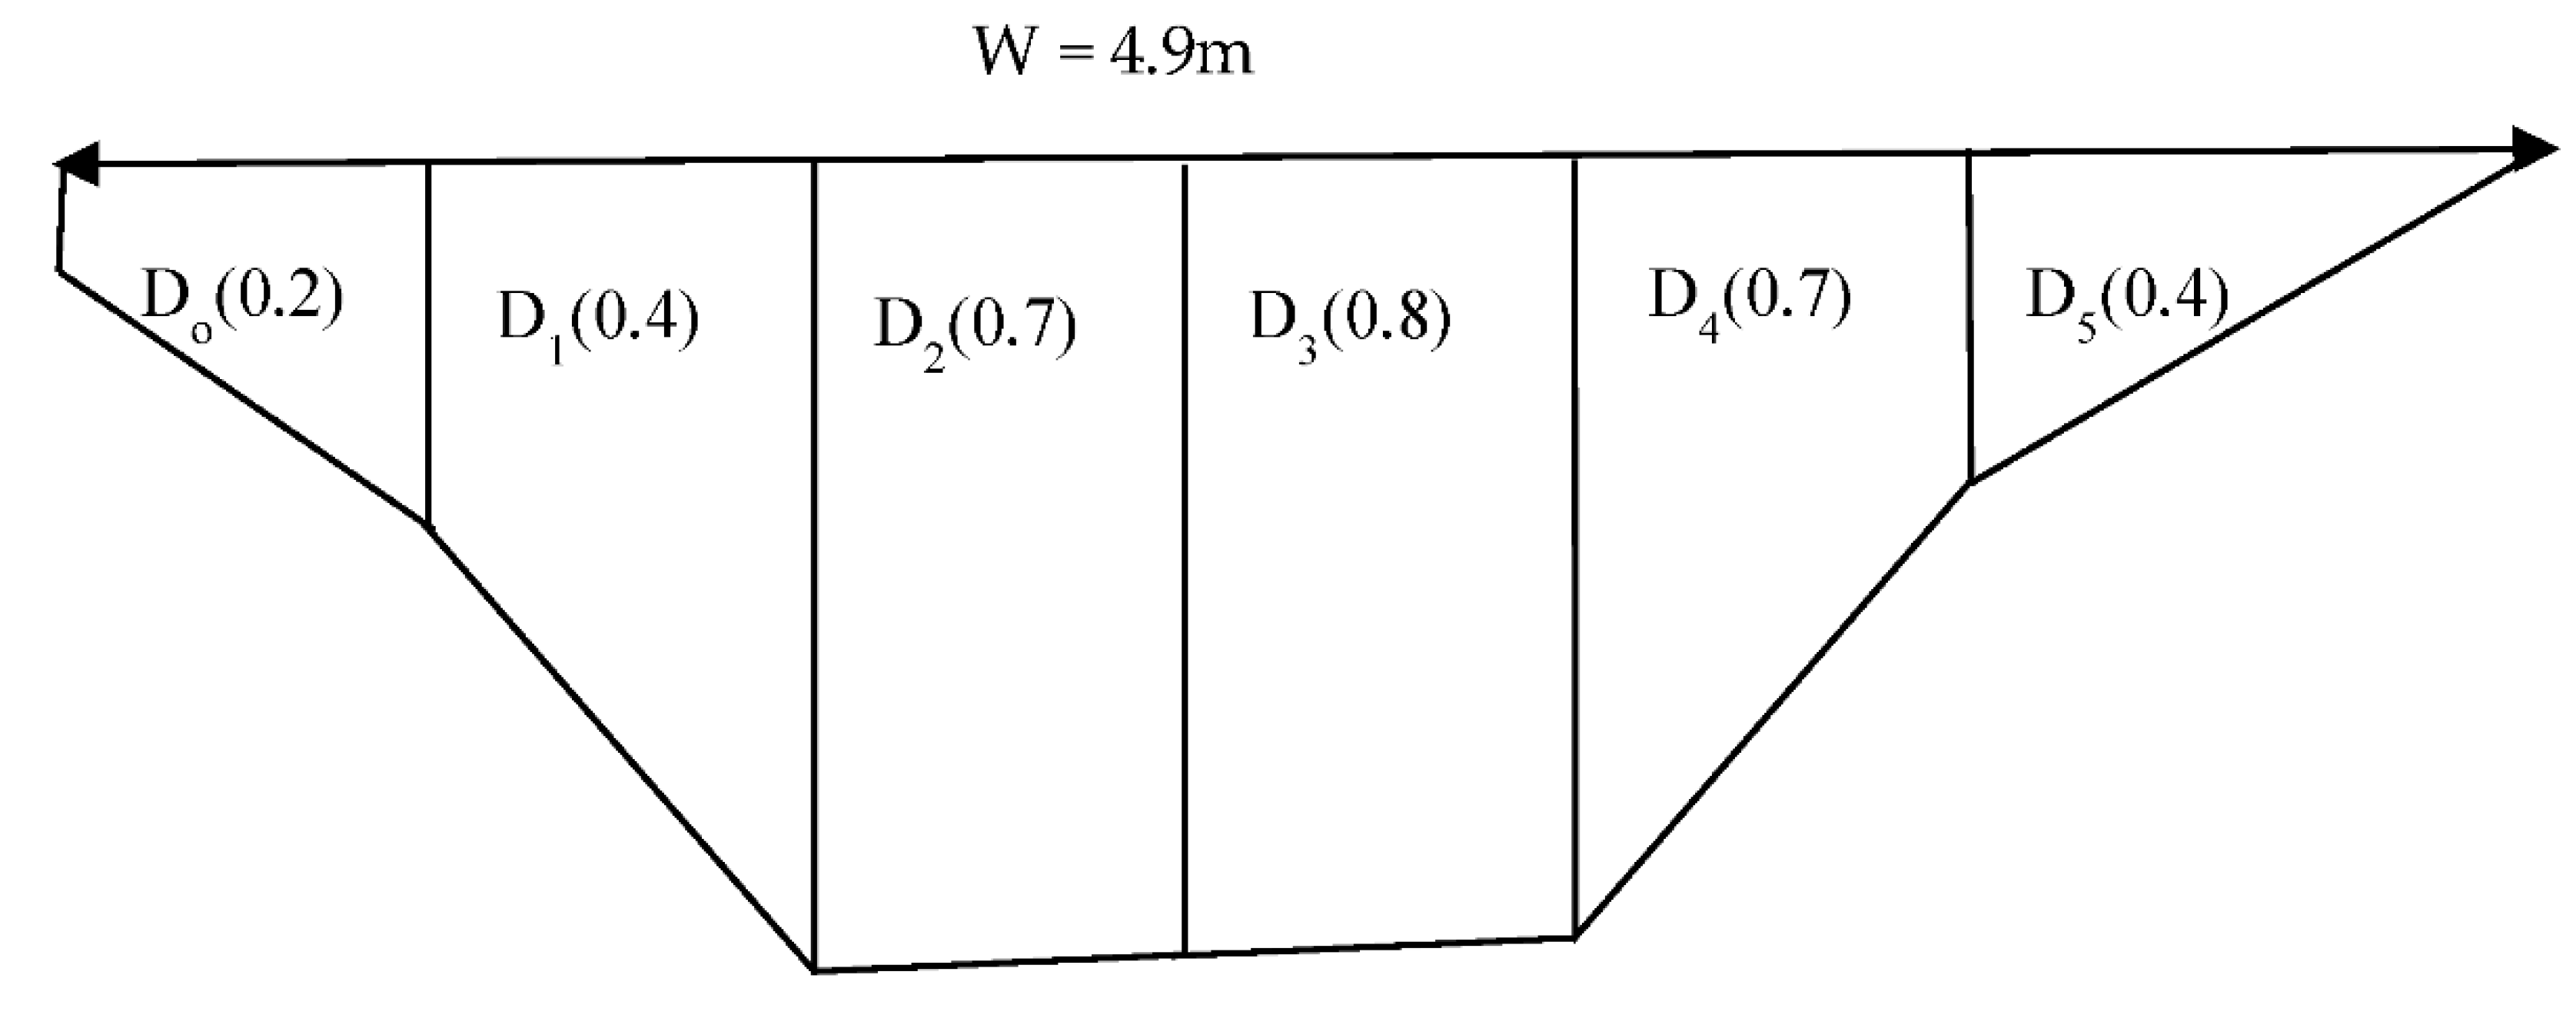
4.90 |
1.96 |
0.04 |
0.07 |
0.06 |
Figure 12.
Details of the river at the single-line weir site NW1.
Figure 12.
Details of the river at the single-line weir site NW1.
Table 16.
Summary of measurements and calculations of river flow for the single-line weir site NW2.
Table 16.
Summary of measurements and calculations of river flow for the single-line weir site NW2.
| Date |
Average depth(D)
(m) |
River width
(m) |
Cross-
sectional area
(m2) |
Average
water
velocity(V)
(m/s) |
Calculated
discharge(Q)
(m3/s) |
Actual river
Discharge
(Multiply by
factor 0.8) |
| 18-20/12/2022 |
0.40 |
5.70 |
2.28 |
0.03 |
0.07 |
0.05 |
Figure 13.
Details of the river at the single-line weir site NW2.
Figure 13.
Details of the river at the single-line weir site NW2.
Table 17.
Summary of measurements and calculations of river flow for single-line site NW3.
Table 17.
Summary of measurements and calculations of river flow for single-line site NW3.
| Date |
Average depth(D)
(m) |
River
Width
(m) |
Cross-
sectional area
(m2) |
Average water velocity(V)
(m/s) |
Calculated
discharge(Q)
(m3/s) |
Actual river
discharge
(Multiply by
factor 0.8) |
| 21-22/12/2022 |
0.40 |
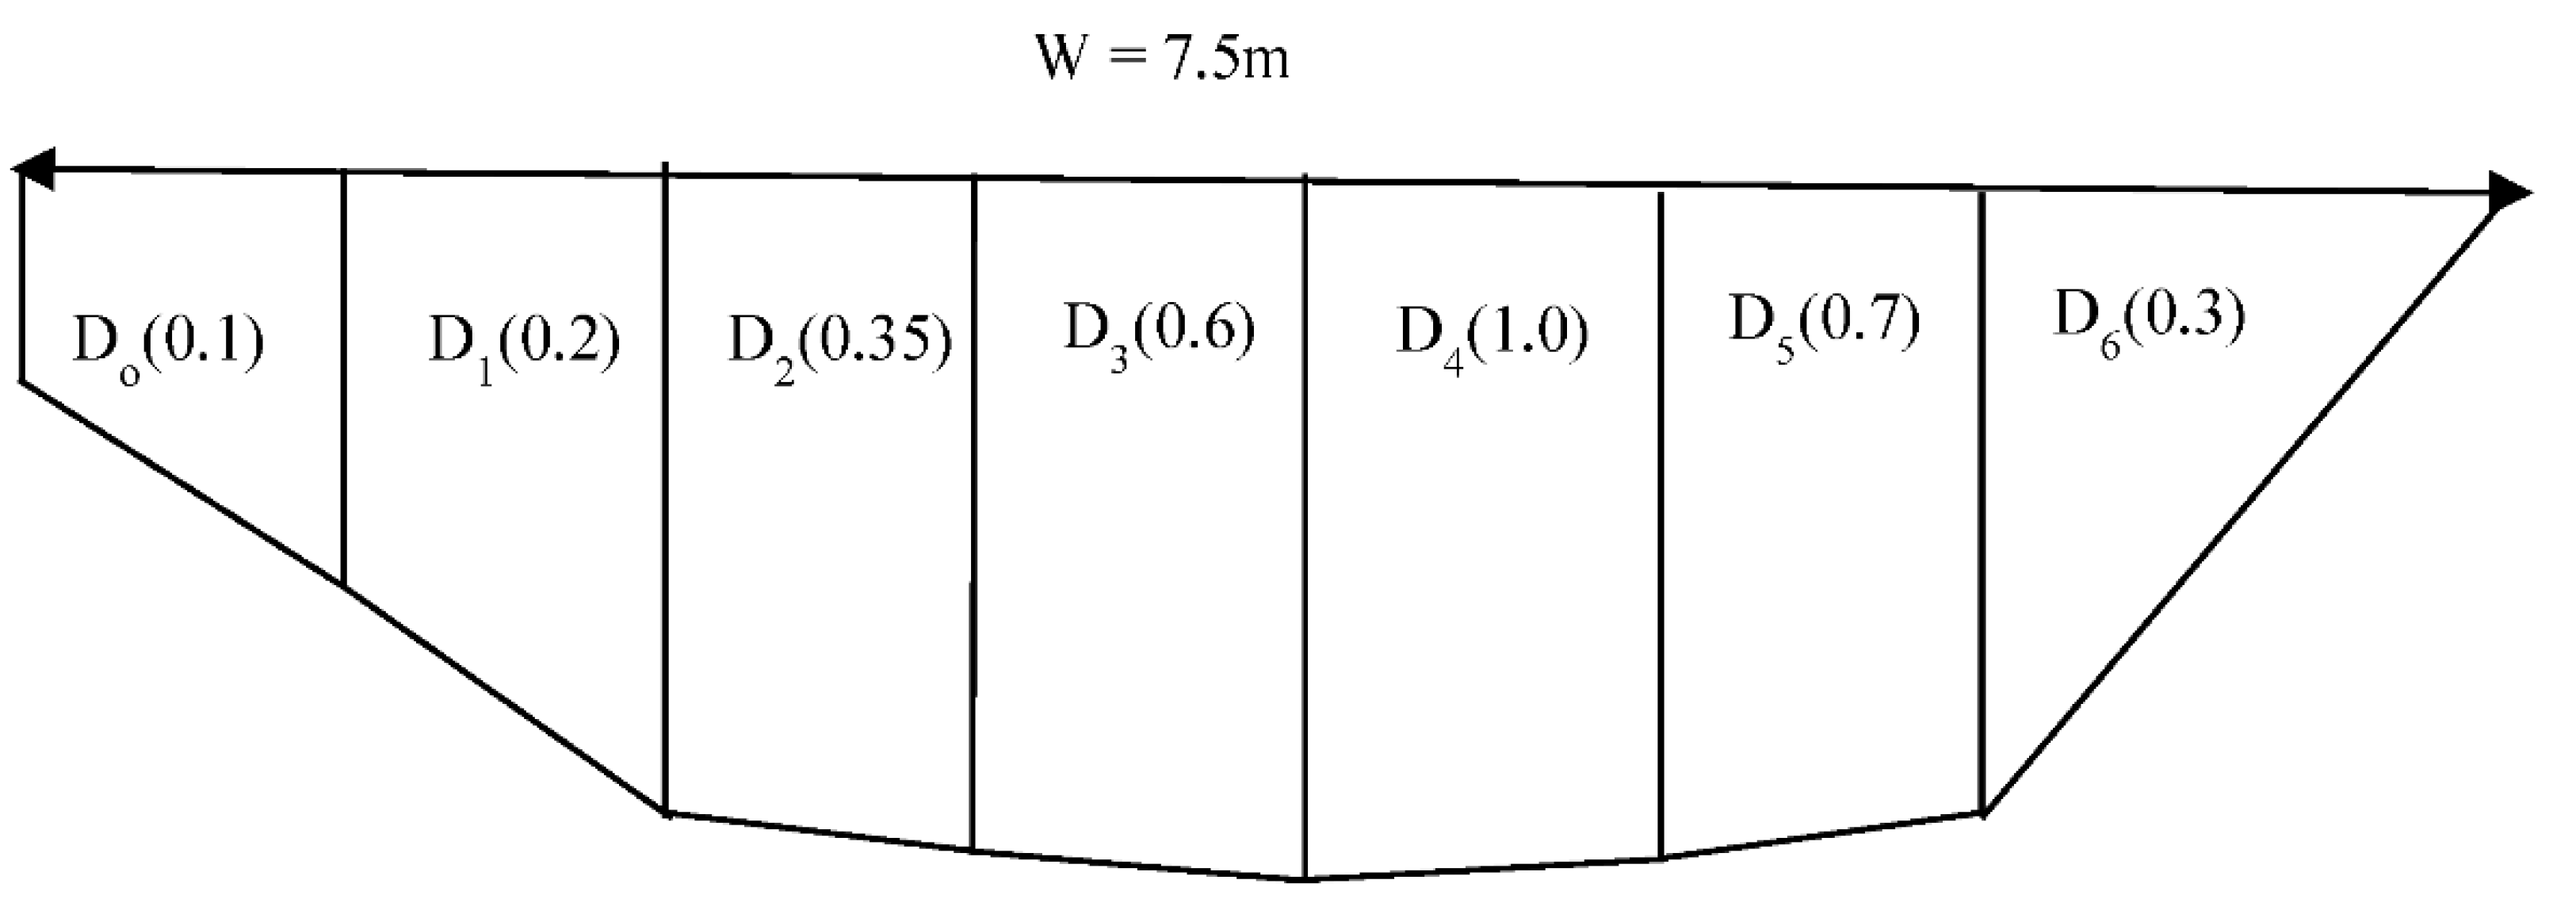
7.50 |
3.00 |
0.04 |
0.12 |
0.10 |
Figure 14.
Details of the river at the single-line weir site NW3.
Figure 14.
Details of the river at the single-line weir site NW3.
Table 18.
Summary of measurements and calculations of river flow for the single-line weir site NW4.
Table 18.
Summary of measurements and calculations of river flow for the single-line weir site NW4.
| Date |
Average depth(D)
(m) |
River width
(m) |
Cross-sectional area
(m2) |
Average water velocity(V)
(m/s) |
Calculated discharge(Q)
(m3/s) |
Actual river
discharge
(Multiply by factor 0.8) |
| 23-26/12/2022 |
0.30 |
6.30 |
1.89 |
0.02 |
0.04 |
0.03 |
Figure 15.
Details of the river at the single-line weir site NW4.
Figure 15.
Details of the river at the single-line weir site NW4.
Table 19.
Summary of measurements and calculations of river flow for the single-line weir site NW5.
Table 19.
Summary of measurements and calculations of river flow for the single-line weir site NW5.
| Date |
Average depth(D)
(m) |
River width
(m) |
Cross-
sectional area
(m2) |
Average water
velocity(V)
(m/s) |
Calculated discharge(Q)
(m3/s) |
Actual river
discharge (Multiply by factor 0.8) |
| 27-30/12/2022 |
0.20 |
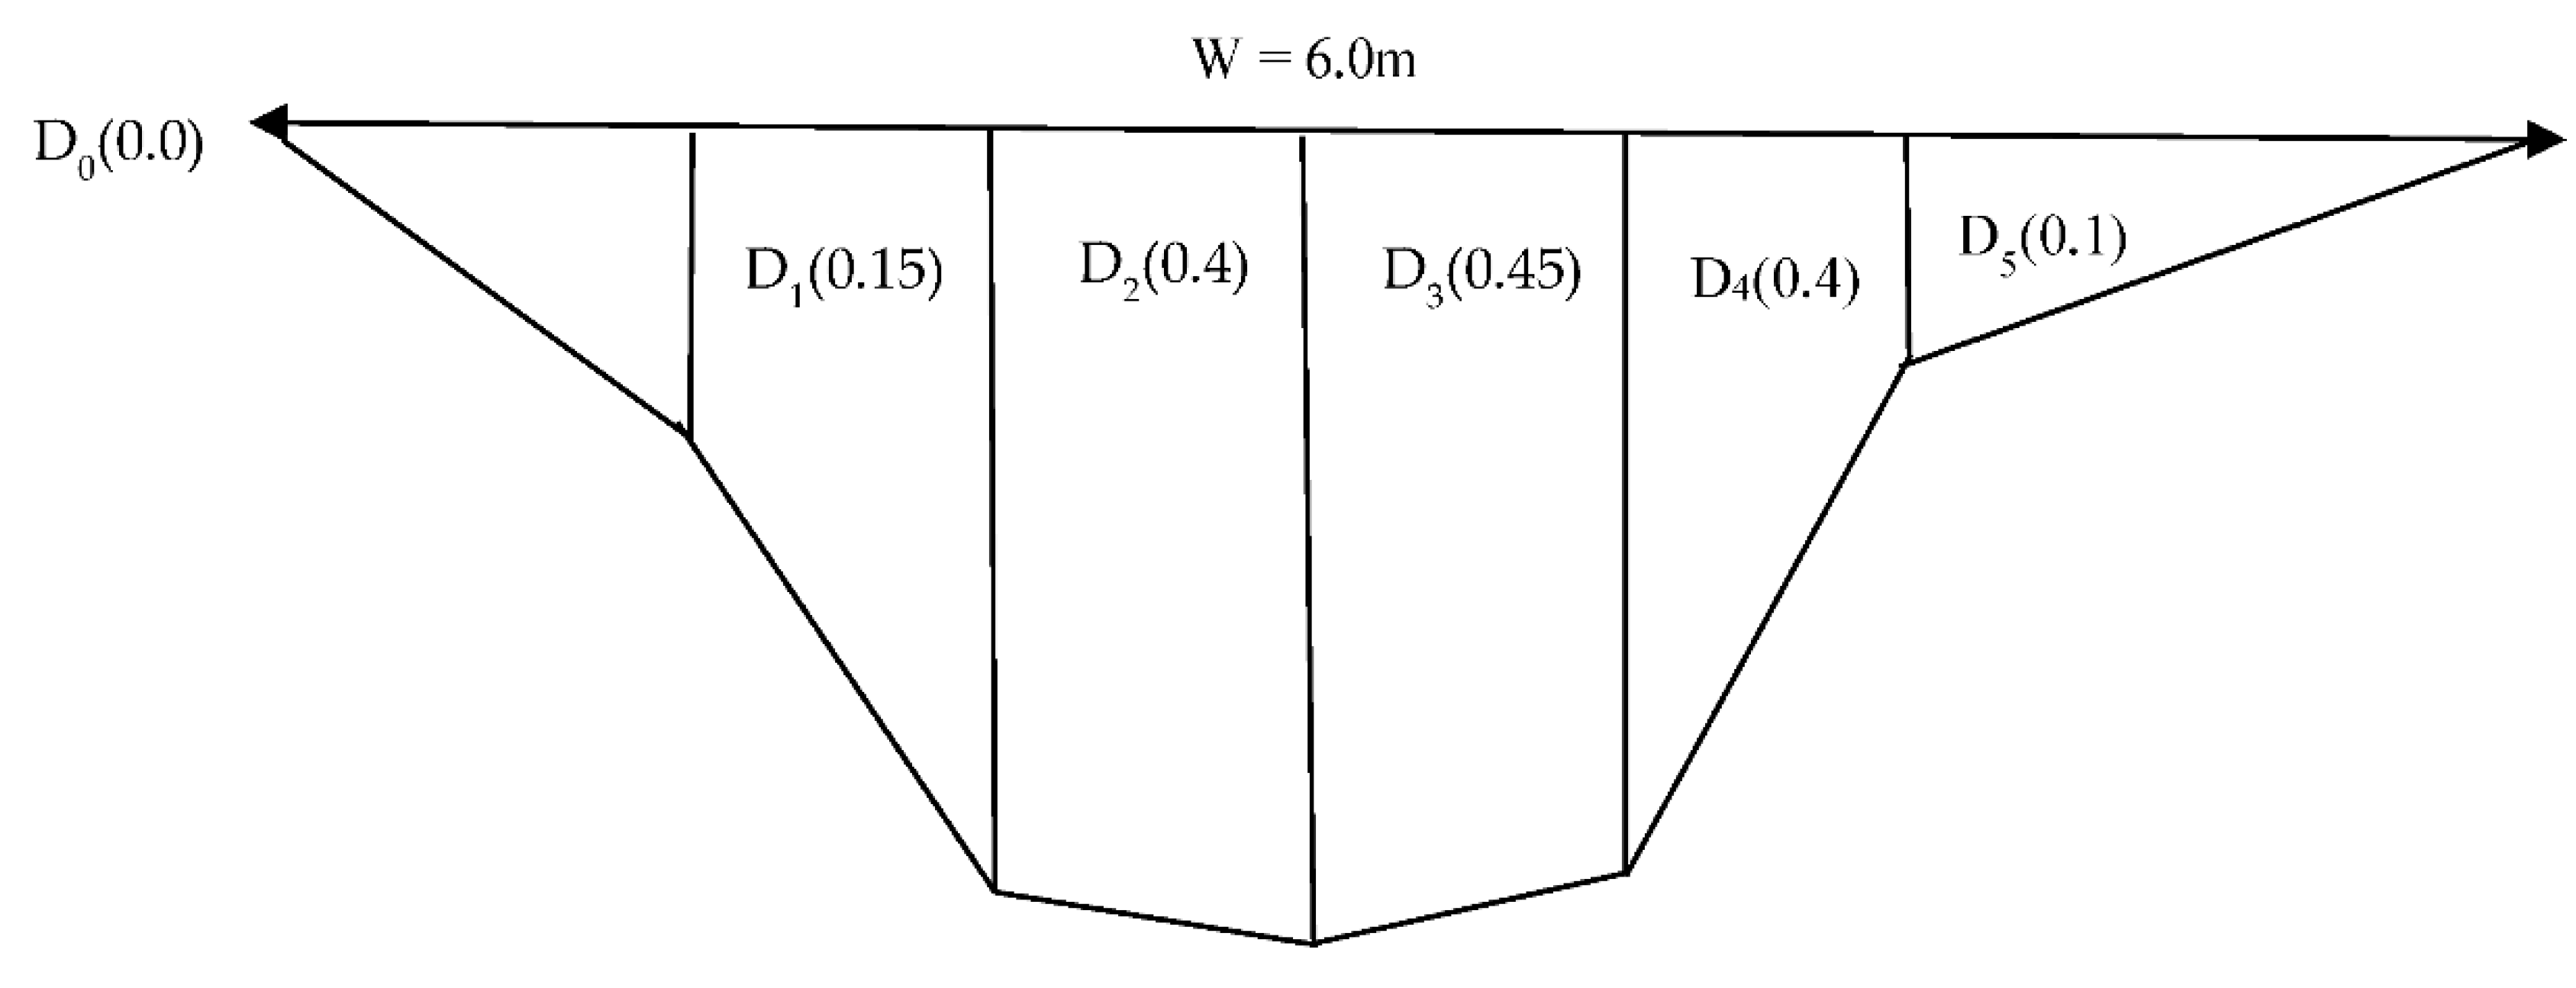
6.00 |
1.20 |
0.03 |
0.04 |
0.03 |
Figure 16.
Details of the river at the single-line weir site NW5.
Figure 16.
Details of the river at the single-line weir site NW5.
3.5. River Flow Potentially Diverted for Irrigation by Single-Line Weir
The findings of this study were collected from different rivers and sites. About 80% of single-line weirs diverted more than 70% of the discharge of their respective river flows based on flow data collected between 2022 November to 2023 January. Further investigations revealed that Luapula had 80% of the number of single-line weirs diverting between 80%-70% of the river flow while North-western had 60% of the number of single-line weirs diverting between 80%-70%.
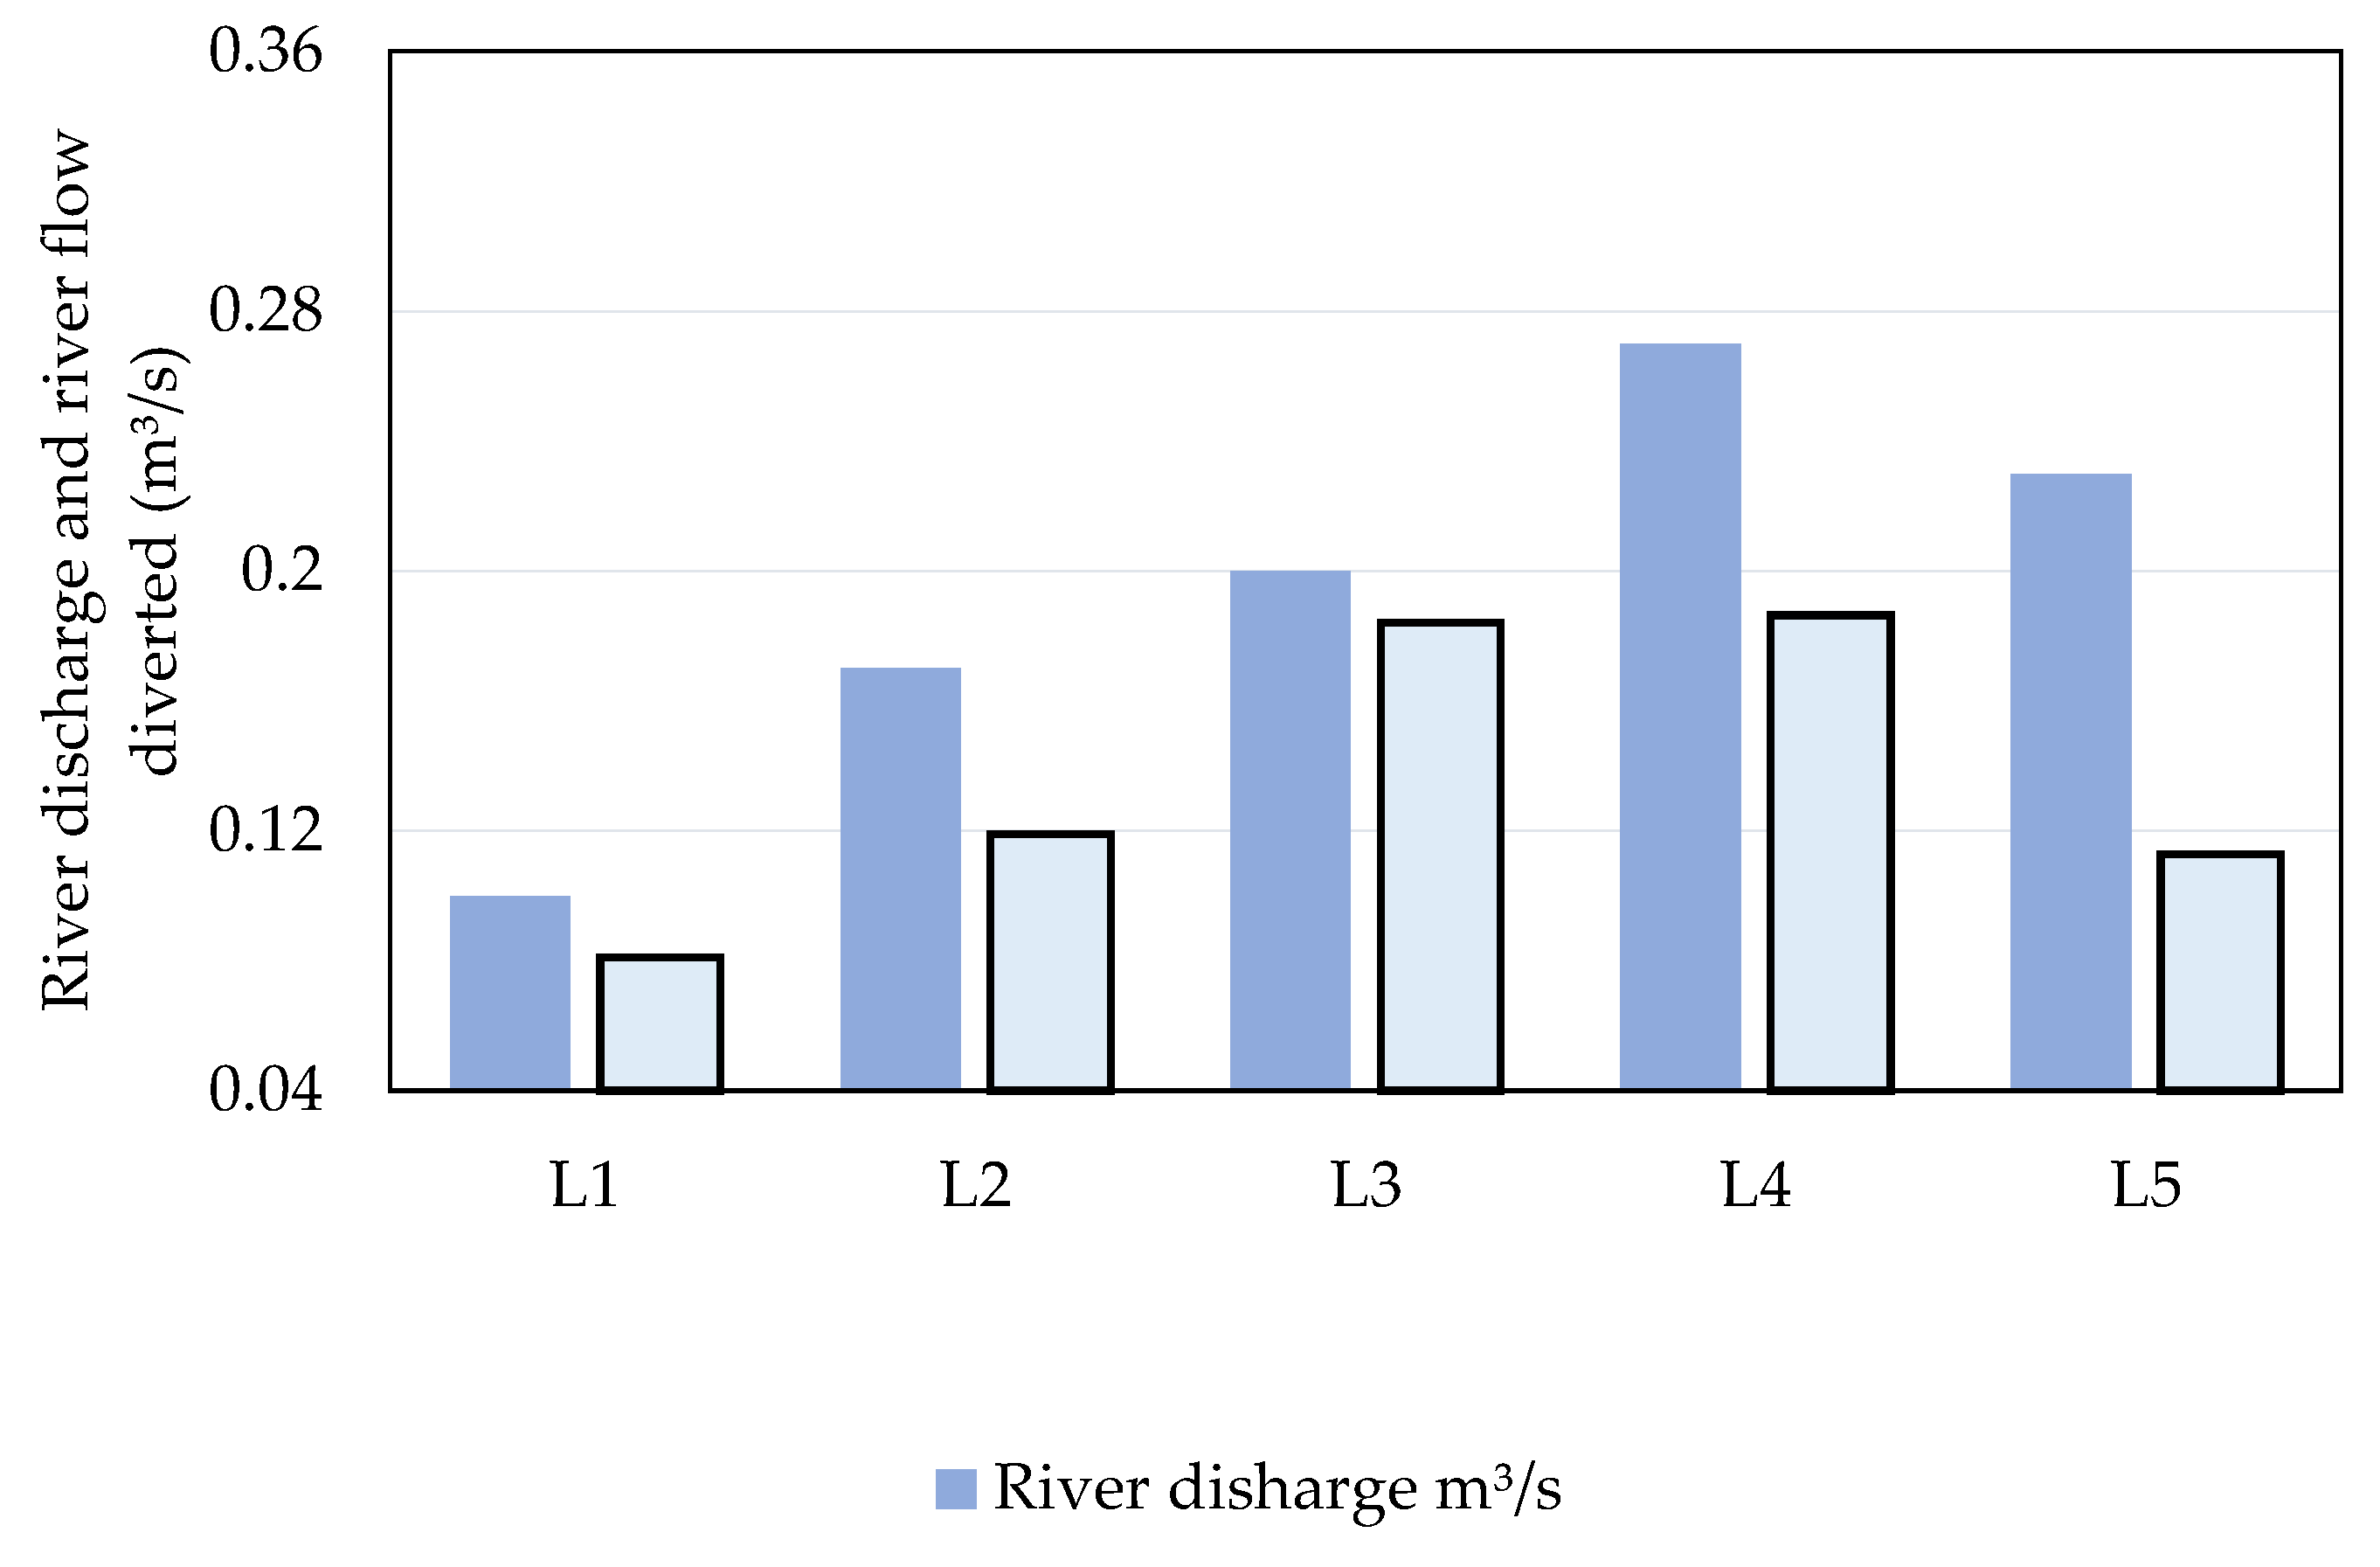
Figure 17 shows weir sites in Luapula province that were included and observed in the study, the flow rate discharged in the river, and the quantity of water diverted by each single-line weir. Single-line weir sites denoted by L3 and L4 diverted a similar quantity of flow rate followed by sites L5 and L1.
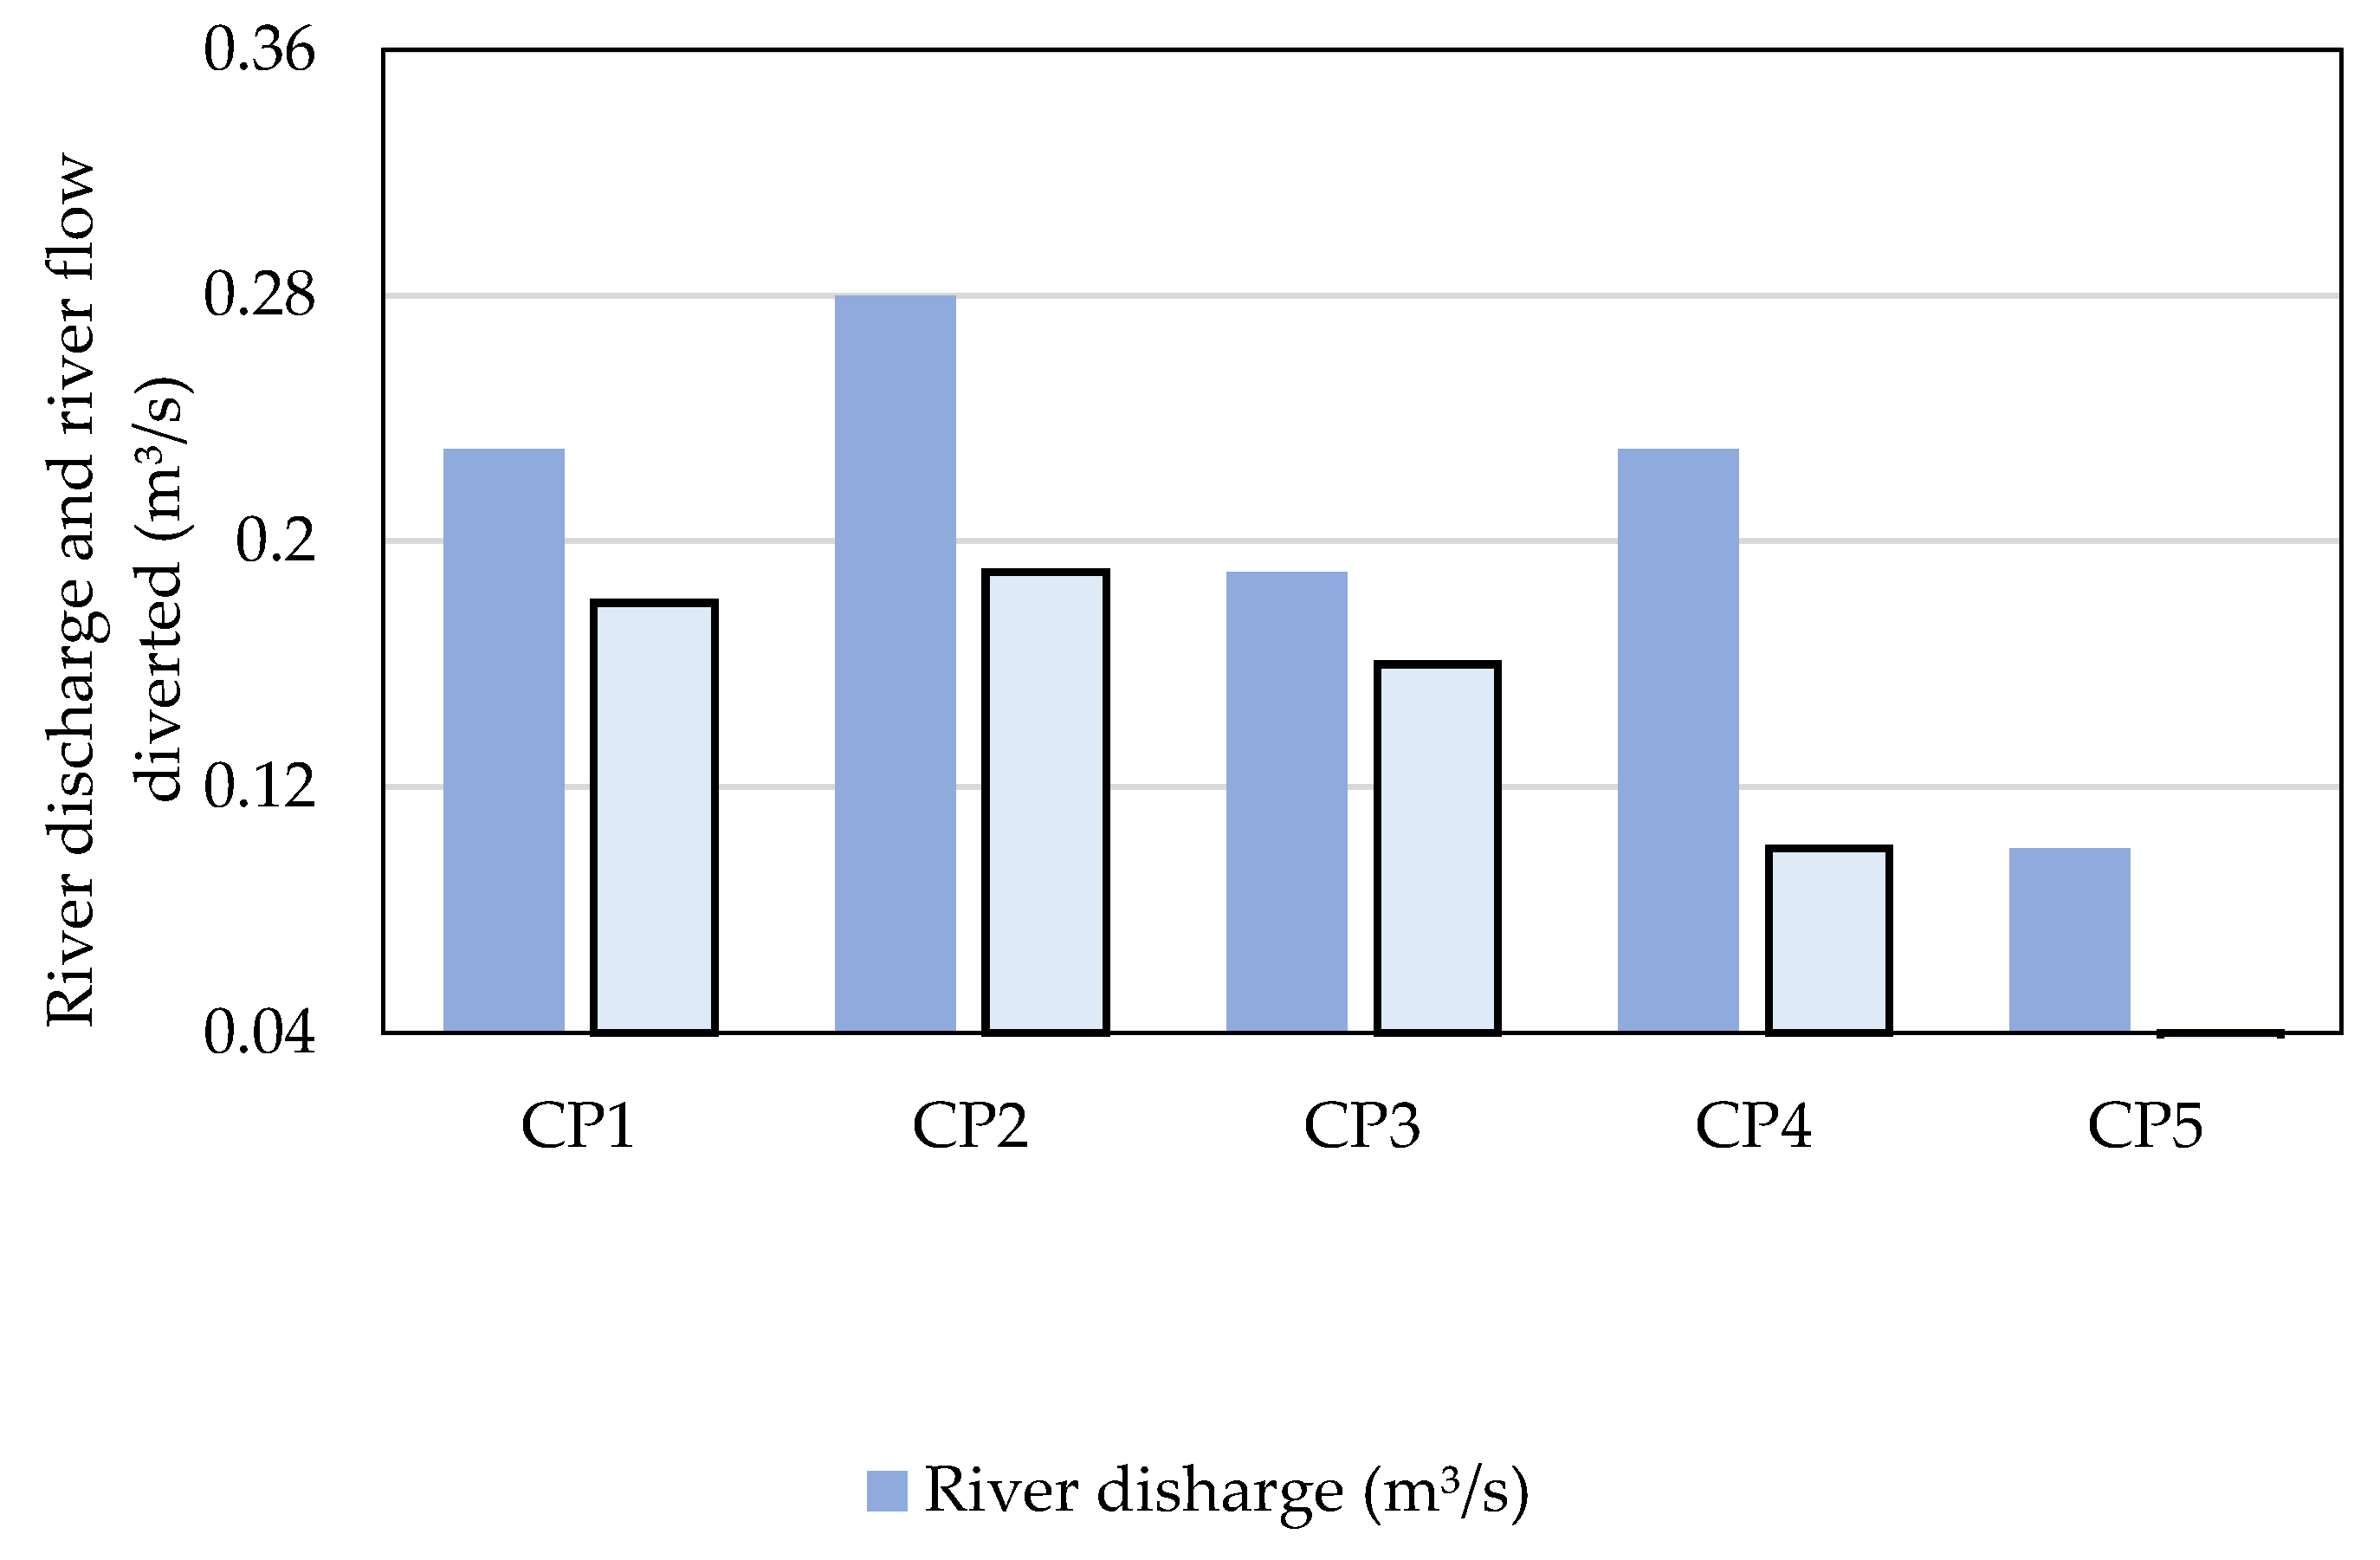
Figure 18 shows that single-line weir sites at CP1 and CP2 diverted similar quantities of flow rate followed by sites CP3 and CP4. However, site CP5 had the weir washed away at the time data was collected. Copperbelt 40% of the single-line weirs. It was found that well-maintained simple weirs diverted by gravity between 80 - 92% of the river flow while poorly managed simple weirs were observed diverting below 43% of the river flow.
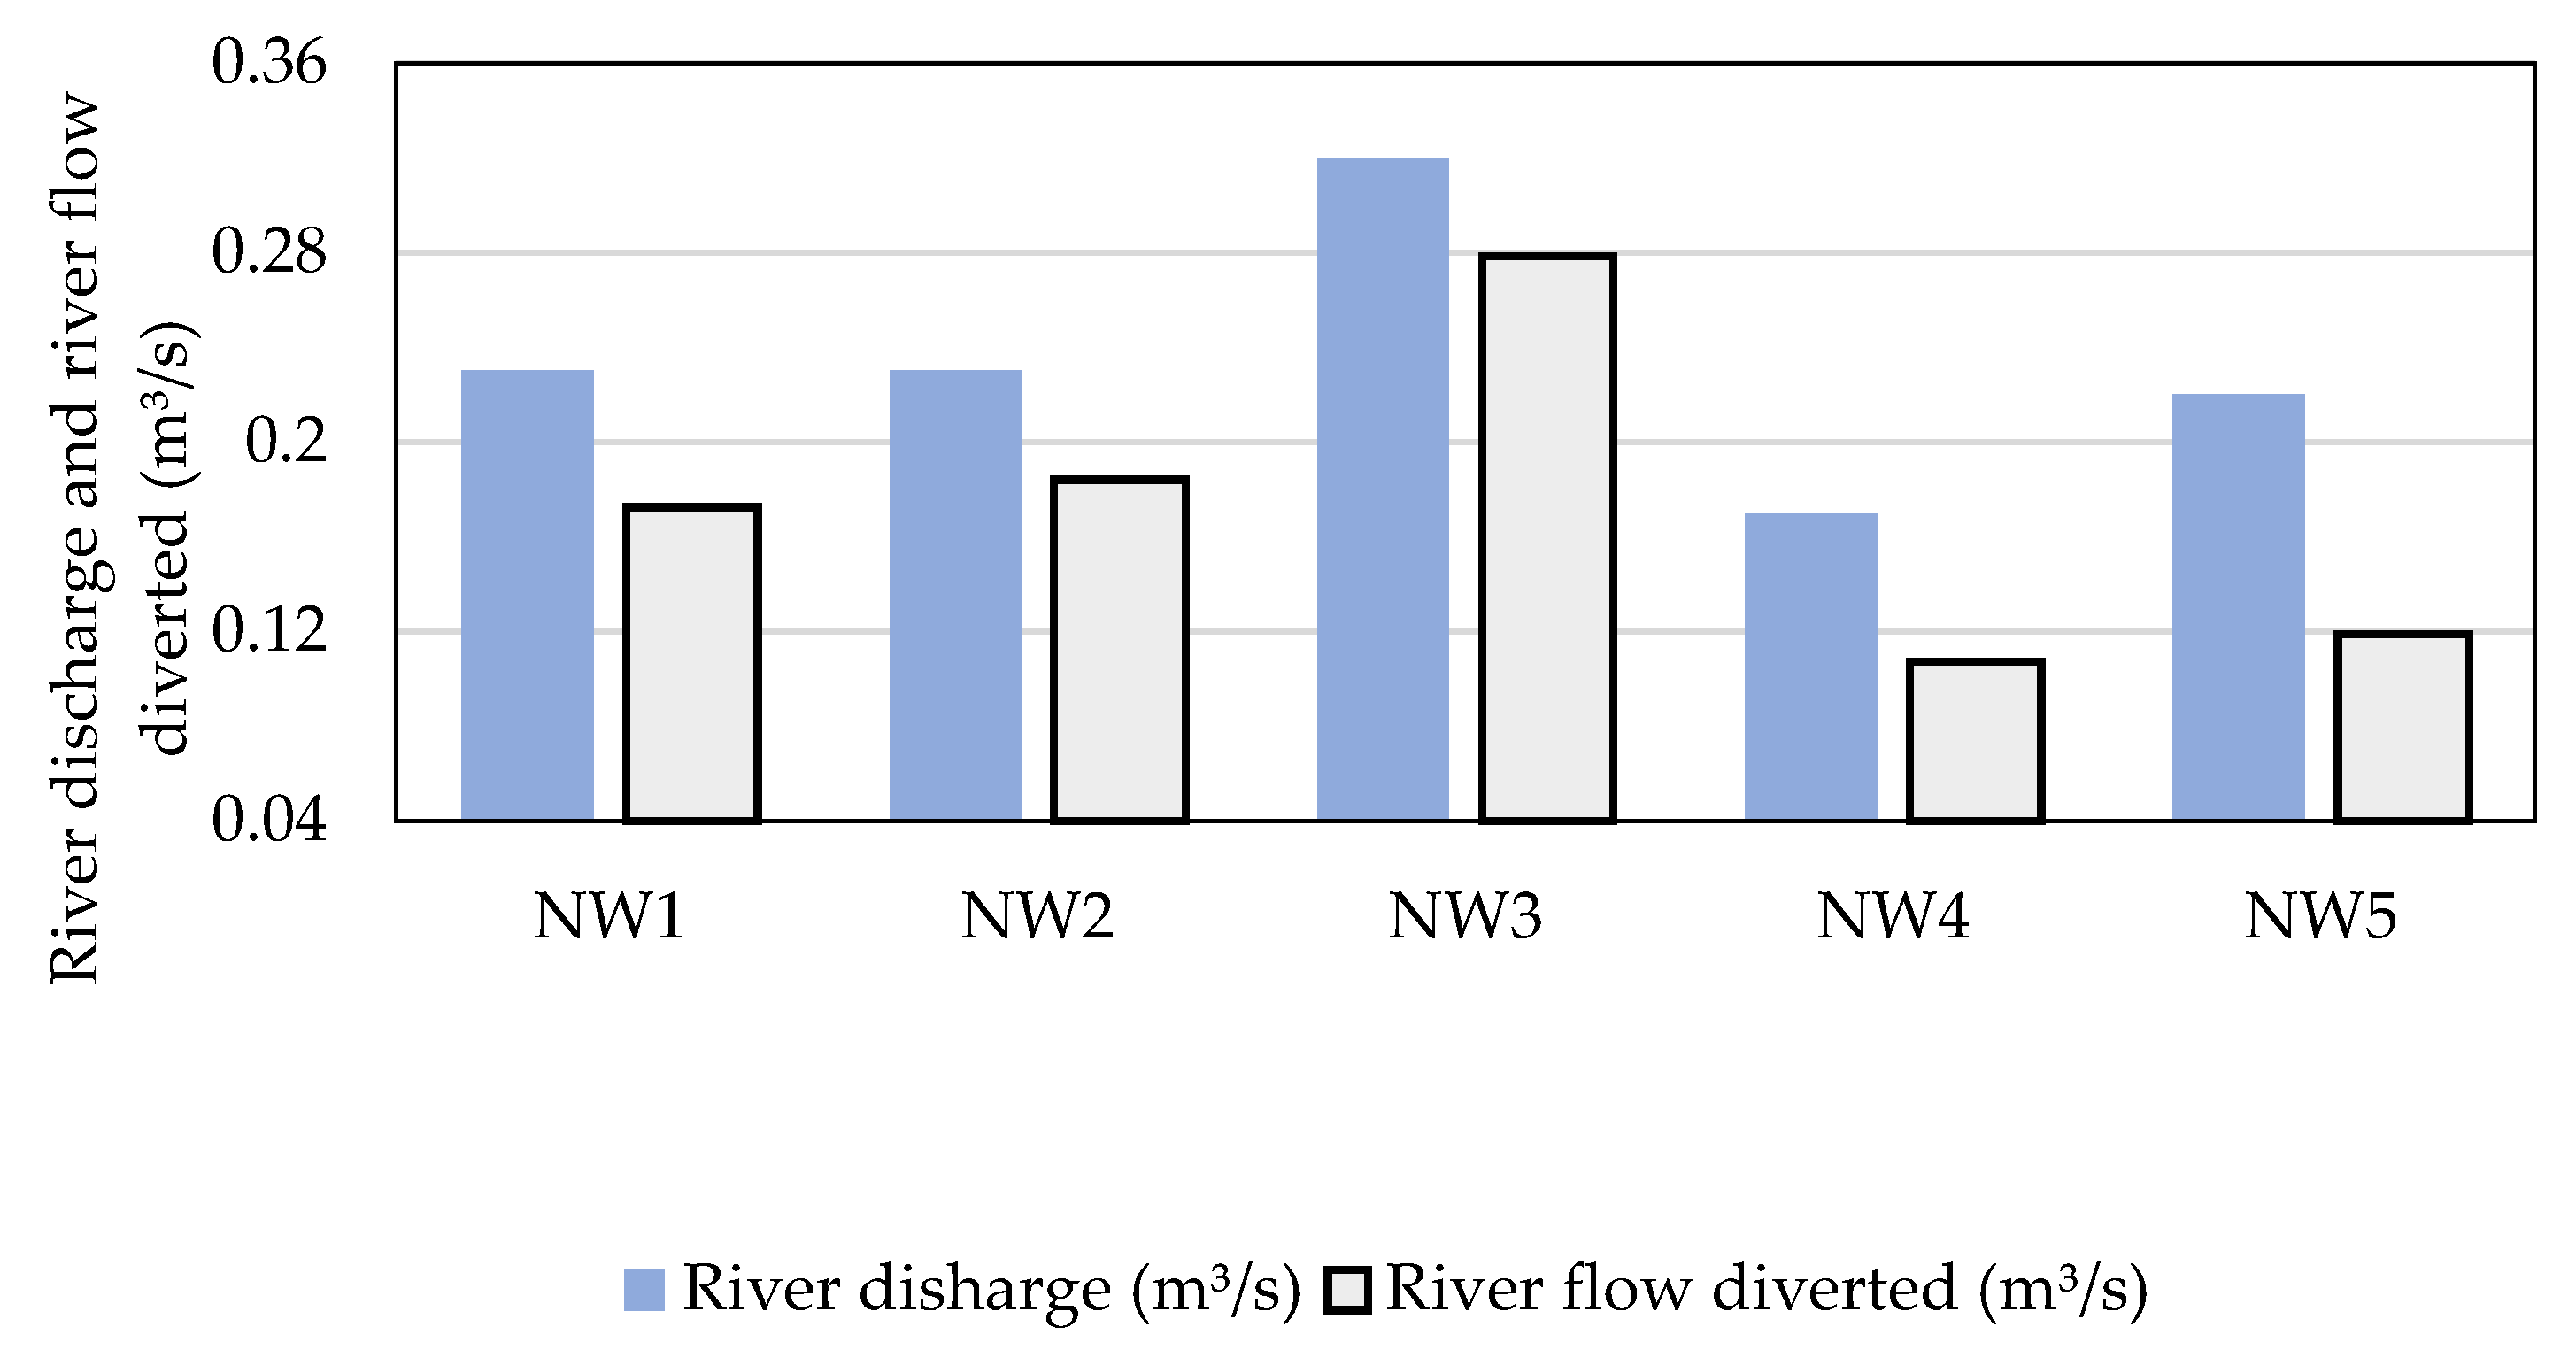
Figure 19 shows that simple weirs installed on 3 sites diverted a similar quantity of flow while site NW3 diverted relatively more flow. The results of this study also show that 90% of the simple weirs did not completely block water flowing down the main river to benefit downstream uses including environmental flow. From the findings, it is possible to divert river water for irrigation using single-line weirs constructed with locally sourced material poles, thatch grass, and tying strips. However, there were some differences in the quantity of water diverted by single-line weir sites at different locations because of fluctuations in the river flow rates and leakages. Despite the single-line weir diverting high flow, 40% of the weirs recorded the lowest water diversion rate as reported in other studies of temporary weirs' performance [
21].
Figure 17,
Figure 18 and
Figure 19 show the inflow rate in the main rivers and the flow rates diverted. The first fraction of the river
flow was discharged downstream through weir leakages and the second fraction of the river flow was diverted into the canal conveying water for irrigation
The observations in
Figure 17,
Figure 18 and
Figure 19 can be used to select existing potential sites to be considered for the upgrade from simple weirs to permanent weir types. The differences in the quantity of water discharged in the river and the water diverted by the simple weir are a result of (i) leakages of the individual weir and (ii) technical circumstances such as Canal intake conditions such as the velocity, intake width and slope [
22]. Generally, loss of water through leakages is one of the biggest challenges with single-line simple weirs thus affecting the diversion coefficient to be low.
Figure 17.
Simple weirs installed on different rivers in Luapula province.
Figure 17.
Simple weirs installed on different rivers in Luapula province.
The level of water upstream is critical for single-line weirs. The level of water in the river changes from season to season because of the changes in the river flows, the obstruction of water flow by the weir helps stabilize the water level in the river upstream. It was observed that most of the single-line weirs relatively raised water with an average height ranging between 0.1m and 0.5m above the historic flood level when river flows were lowest and improved the flow diverted into the canal constructed closer to the diversion point upstream.
Figure 18.
Simple weirs installed on different rivers in Copperbelt province.
Figure 18.
Simple weirs installed on different rivers in Copperbelt province.
Figure 19.
Simple weirs installed on different rivers in North-western province.
Figure 19.
Simple weirs installed on different rivers in North-western province.
4. Conclusions
Zambia envisages developing small-scale irrigation infrastructure in all forms of strategies required to establish and expand the sector. For the past decades, small-scale irrigation technologies have been based on rudimentary methods such as buckets, watering cans, and plastic containers to collect water from sources such as rivers, streams, and springs. In Luapula, Copperbelt, and North-Western provinces in Zambia, it is still a challenge for most small-scale farmers to afford to pay for the cost of constructing permanent hydraulic structures such as masonry or concrete facilities. This is one of the reasons that prompt small-scale farmers in the rural communities of the northern region province to resort to the construction of simple weirs using local materials. Simple weirs construction costs are relatively less and the time required to construct is relatively much less. In Zambia, Small-scale irrigation promoted with simple weirs is one of the interventions introduced in recent years targeting small-scale farmers in the rural areas of the country to engage themselves in irrigated food production throughout the dry season.
This study involved an on-site assessment of single-line simple weirs constructed by farmers for their small-scale irrigation in the Northern Regional provinces of Zambia. This study described and discussed the simple weir irrigation development in Luapula, Copperbelt, and North-western provinces of Zambia. The focus was on single-line weirs used by emerging small-scale farmers to participate in dry-season irrigation activities. The single-line weir is one of the technologies through which farmers access the water for irrigation by re-directing the river flow to crop fields.
Simple weirs are envisioned to play a crucial role in the promotion of irrigation activities in Luapula, Copperbelt, and North-Western provinces in Zambia. Simple weirs have played an important role in developing small-scale irrigation in rural areas in the Northern region of the country. However, one dry season's utilization impedes the utilization of simple weirs throughout the dry season of irrigation.
This study proposes an improvement in the construction of the simple weirs to enhance immediate to short-term use. This study suggests that in the future construction of single-line weirs, there is a need to use treated construction materials rather than fresh and untreated wood poles and thatch grass. The study also recommends using bamboo poles to construct single-line weirs because they are relatively resistant to water decay.
Author contributions: conceptualization: A.L.K. and M.H.; data collection: A.L.K., research methodology: A.L.K., M.H. and M.I.; data analysis: A.L.K, M.H., M.I., Y.A. and Y.S.; writing the first research draft: A.L.K., M.H., H.O., M.I., Y.S. and Y.A. review and editing of the draft: M.H. and M.I.; progress monitoring: M.H., H.O. and M.I. All authors have read and consented to the published version of the manuscript.
Acknowledgments
We acknowledge and appreciate the Japan International Cooperation Agency and Sanyu International for allowing us to collect field data on simple weirs in the Northern region provinces of Zambia. We are also thankful to the Ministry of Agriculture in Zambia agricultural extension officers for their assistance during site visits to some simple weirs in Luapula, Copperbelt, and North-Western province.
Conflicts of interest: The authors wish to declare no conflict in the research design, field data collection, study location, data analysis, and findings of this research.
References
- Jayne, T.S.; Muyanga, M.; Wineman, A.; Ghebru, H.; Stevens, C.; Stickler, M.; Chapoto, A.; Anseeuw, W.; Westhuizen, D.; Nyange, D. Are Medium-scale Farms Driving Agricultural Transformation in sub-Saharan Africa? Agricultural Economics 2019, 50, 75–95. [Google Scholar] [CrossRef]
- You, L.; Ringler, C.; Wood-Sichra, U.; Robertson, R.; Wood, S.; Zhu, T.; Nelson, G.; Guo, Z.; Sun, Y. What Is the Irrigation Potential for Africa? A Combined Biophysical and Socioeconomic Approach. Food Policy 2011, 36, 770–782. [Google Scholar] [CrossRef]
- Mhembwe, S.; Chiunya, N.; Dube, E. The Contribution of Small-Scale Rural Irrigation Schemes towards Food Security of Smallholder Farmers in Zimbabwe. Jamba-J. Disaster Risk Stud. 2019, 11, 1–11. [Google Scholar] [CrossRef] [PubMed]
- Mwendera, E.; Chilonda, P. Conceptual Framework for Revitalisation of Small-Scale Irrigation Schemes in Southern Africa. Irrig. and Drain 2020, 5, 208–220. [Google Scholar] [CrossRef]
- Xie, H.; You, L.; Wielgosz, B.; Ringler, C. Estimating the Potential for Expanding Small-Holding Irrigation in Sub-Saharan Africa. Agricultural Water Management 2013, 133. [Google Scholar] [CrossRef]
- Sinyolo, S.; Mudhara, M.; Wale, E. The Impact of Smallholder Irrigation on Household Welfare: The Case of Tugela Ferry Irrigation Scheme in KwaZulu-Natal, South Africa. WSA 2014, 40, 145. [Google Scholar] [CrossRef]
- de Fraiture, C.; Giordano, M. Small Private Irrigation: A Thriving but Overlooked Sector. Agricultural Water Management 2014, 131, 167–174. [Google Scholar] [CrossRef]
- Bjornlund, H.; Zuo, A.; Wheeler, S.A.; Parry, K.; Pittock, J.; Mdemu, M.; Moyo, M. The Dynamics of the Relationship between Household Decision-Making and Farm Household Income in Small-Scale Irrigation Schemes in Southern Africa. Agricultural Water Management 2019, 213, 135–145. [Google Scholar] [CrossRef]
- Ngoma, H.; Hamududu, B.H. Ngoma, H.; Hamududu, B.H. Impacts of Climate Change on Water Availability in Zambia. 2019, 7, 2–47.
- Burney, J.; Naylor, R. Smallholder Irrigation as a Poverty Alleviation Tool in Sub-Saharan Africa. World Development 2017, 46, 110–123. [Google Scholar] [CrossRef]
- Sakaki, M.; Koga, K. An Effective Approach to Sustainable Small-Scale Irrigation Developments in Sub-Saharan Africa. Paddy Water Environ 2013, 11, 1–14. [Google Scholar] [CrossRef]
- Colenbrander, W.; Kabwe, A.; van Koppen, B. Agricultural Water Management Technology Adoption in Zambia: Findings of a Household Survey. Agricultural Water Solution Project 2012, 1–55. [Google Scholar]
- Ngoma, H.; Hamududu, B.; Hangoma, P.; Samboko, P.; Kabaghe, C. Irrigation Development for Climate Resilience in Zambia: The Known Knowns and Known Unknowns. Indaba Agricultural Research Institute 2017, 130, 1–48. [Google Scholar]
- Kamwamba-Mtethiwa, J.; Weatherhead, K.; Knox, J. Assessing Performance of Small-Scale Pumped Irrigation Systems in Sub-Saharan Africa: Evidence from a Systematic Review: Performance of Small Pumped Irrigation Systems in Sub Saharan Africa. Irrig. and Drain. 2016, 65, 308–318. [Google Scholar] [CrossRef]
- Shariq, A.; Hussain, A.; Ansari, M.A. Lateral Flow through the Sharp Crested Side Rectangular Weirs in Open Channels. Flow Measurement and Instrumentation 2018, 59, 8–17. [Google Scholar] [CrossRef]
- Leask, H.J.; Wilson, L.; Mitchell, K.L. Formation of Mangala Valles Outflow Channel, Mars: Morphological Development and Water Discharge and Duration Estimates. J. Geophys. Res. 2007, 112, 2006JE002851. [Google Scholar] [CrossRef]
- Bagheri, S.; Kabiri-Samani, A. Simulation of Free Surface Flow over the Streamlined Weirs. Flow Measurement and Instrumentation 2020, 71, 101680. [Google Scholar] [CrossRef]
- Japan International Cooperation Agency (JICA) Technical Cooperation Project on Community-Based Smallholder Irrigation in, Republic of Zambia; Tokyo, Japan., 2017.
- Smith, M.; Munoz, G.; Alvarez, J.S. Irrigation Techniques for Small-Scale Farmers: Key Practices for DRR Implementers. 2014, 2–52.
- Sagawa, Y.; Noda, K.; Hirota, I.; Azechi, I.; Senge, M. Study on the Actual Management of Irrigation on Small-Scale Irrigation Development Site in Northern Area in the Republic of Zambia. Journal of Rainwater Catchment Systems 2021, 26, 43–50. [Google Scholar] [CrossRef] [PubMed]
- Dakpalah, S.S.; Anornu, G.K.; Ofosu, E.A. Small Scale Irrigation Development in Upper West Region, Ghana; Challenges, Potentials and Solutions. Civil and Environmental Research 2018, 10, 85–97. [Google Scholar]
- Huang, X.; Zhou, X.; You, J.; Yang, Q.; Wang, Y.; Ma, K. Wisdom, Predicaments, and Challenges of a Millennium Ancient Weir—Dujiangyan Project. J. Mt. Sci. 2021, 18, 2971–2981. [Google Scholar] [CrossRef]
|
Disclaimer/Publisher’s Note: The statements, opinions and data contained in all publications are solely those of the individual author(s) and contributor(s) and not of MDPI and/or the editor(s). MDPI and/or the editor(s) disclaim responsibility for any injury to people or property resulting from any ideas, methods, instructions or products referred to in the content. |
© 2023 by the authors. Licensee MDPI, Basel, Switzerland. This article is an open access article distributed under the terms and conditions of the Creative Commons Attribution (CC BY) license (http://creativecommons.org/licenses/by/4.0/).


