1. Introduction
With the large-scale commercialization of 5G technology, emerging businesses and industries such as the Internet of Things, smart manufacturing, big data, and cloud computing are developing at a rapid pace [
1,
2]. The number of users and the volume of transmitted information have increased significantly, which has resulted in the continued development of WDM optical networks towards high capacity, high spectrum efficiency, and long distances [
3,
4]. Accordingly, the WDM network topology becomes more complex and variable. The reconfigurable optical multiplexers (ROADM) and/or wavelength selective switches (WSS) are widely arranged and applied in optical network nodes, making the wavelength connection of WDM system more dynamic and random [
5]. By allocating transmission bandwidth more flexibly and arranging transmission paths dynamically, transmission efficiency can be greatly improved and WDM optical networks can be driven toward intelligence and efficiency [
6,
7,
8]. However, as a series of ROADMs-based optical filtering devices are applied in WDM networks, the monitoring of soft failure such as devices filtering shift and filter tightening in optical network becomes issues that must not be overlooked. When the filter failure occurs, the service signal will produce corresponding filtering penalty. The quality of signal drops significantly with the bit error rate (BER) rising, which greatly affects the normal operation of the optical network system [
9,
10,
11]. Therefore, it is necessary to monitor these soft failures to maintain normal and efficient operation of the optical network.
The problems of soft failure location and identification in optical network have been explored in recent years, and most of exiting schemes are based on advanced machine learning and training algorithms [
12]. In [
13], the optical spectrum analysis (OSA) is used to acquire the optical spectrum features of service signals. Combining the classifying and training algorithms, the situations of two most common filter-related soft-failures: filter shift and tight filtering can be obtained. In [
14], a generative adversarial network (GAN) based soft failure detection and few-shot soft failure identification algorithm is verified. The scheme uses number of failure samples from coherent receiver for training to achieve soft failure identification. Besides, in [
15], a novel two-stage soft failure identification scheme based on a convolutional neural network (CNN) and receiver digital signal processing (DSP) is proposed and demonstrated. The features from the power spectrum density (PSD) of received signals are used to identify different soft failure such as filter tightening, SNR degradation caused by amplified spontaneous emission (ASE) noise , and filter shift. Above all, most of the existing frequency shift monitoring schemes obtain the relevant information of the service signal through OSAs or coherent receivers, and then combine them with machine learning algorithms for pre-learning and training to realize failure identification and monitoring. However, the problems of high cost, difficult to miniaturize and integrate are still existed, and only end-to-end status monitoring can be completed. They cannot fulfil the requirement of low-cost, online, and simultaneous monitoring of multi-channel at the transmission node, which makes them difficult to deploy in future dynamic and complex optical networks.
In recent years, another optical network monitoring scheme based on optical labels has attracted wide attention [
16,
17]. The low-frequency digital signal carrying the transmitted service information (baud rate, modulation format, transmission path, add/drop nodes, etc.) is attached to the corresponding service signal as optical labels, loading by using DSP units at the transmitter side. After optical IQ modulation, each label signal follows the corresponding service wavelength along the road, experiencing the same channel fading and impairment as the service signal. At any monitoring nodes, the label information on all wavelengths can be obtained simultaneously by using only one low-bandwidth photoelectric detector (PD) and low-rate analog-to-digital converters (ADC), as well as the performance parameters can be obtained with DSP technology. There have been several reports of optical labels being used to monitor optical power, OSNR and other performance parameters [
18,
19]. Since it can obtain information from all wavelength channels at the same time, the operation status of WDM network can be reliably monitored online , so that the control platform can better optimize the allocation and scheduling of wavelength resources in whole optical network. Meanwhile, the label-based monitoring scheme has characters of high processing efficiency and low capacity cost compared with the traditional scheme [
19].Therefore, it is necessary to propose a frequency shift monitoring algorithm based on optical labels to adapt to the future optical networks with characteristics of complex, variable and dynamic.
In this paper, a scheme for frequency shift monitoring of optical filter device based on multi-band optical labels is proposed and demonstrated. The DSP algorithm is used at the transmitter side to divide the service spectrum into many sub-bands after Fast-Fourier-transform (FFT) for each service signal. For a single service wavelength signal, the symmetric service spectrum of each sub-band is modulated by different optical labels with different frequencies. The frequency shift of filter devices could be obtained by calculating the power ratio of negative and positive outermost sub-band spectrum during labels detection and procession at a monitoring node. To verify our proposed scheme, we have carried out transmission simulation from 1-10 spans (100km per span) fiber transmission and experience tests of 250km fiber transmission. Both of results show that the error of frequency shift estimation can be kept below 0.5 GHz. With this scheme, network failure identification and localization can be detected quickly for timely handling afterwards. Compared with the traditional frequency shift monitoring scheme, this scheme has the characteristics of low cost, high reliability and high efficiency, and has a wide range of application prospects.
2. Principle
The optical label is known as a top modulation or a small amount of amplitude modulation, also called low-frequency perturbation or pilot tones in some studies [
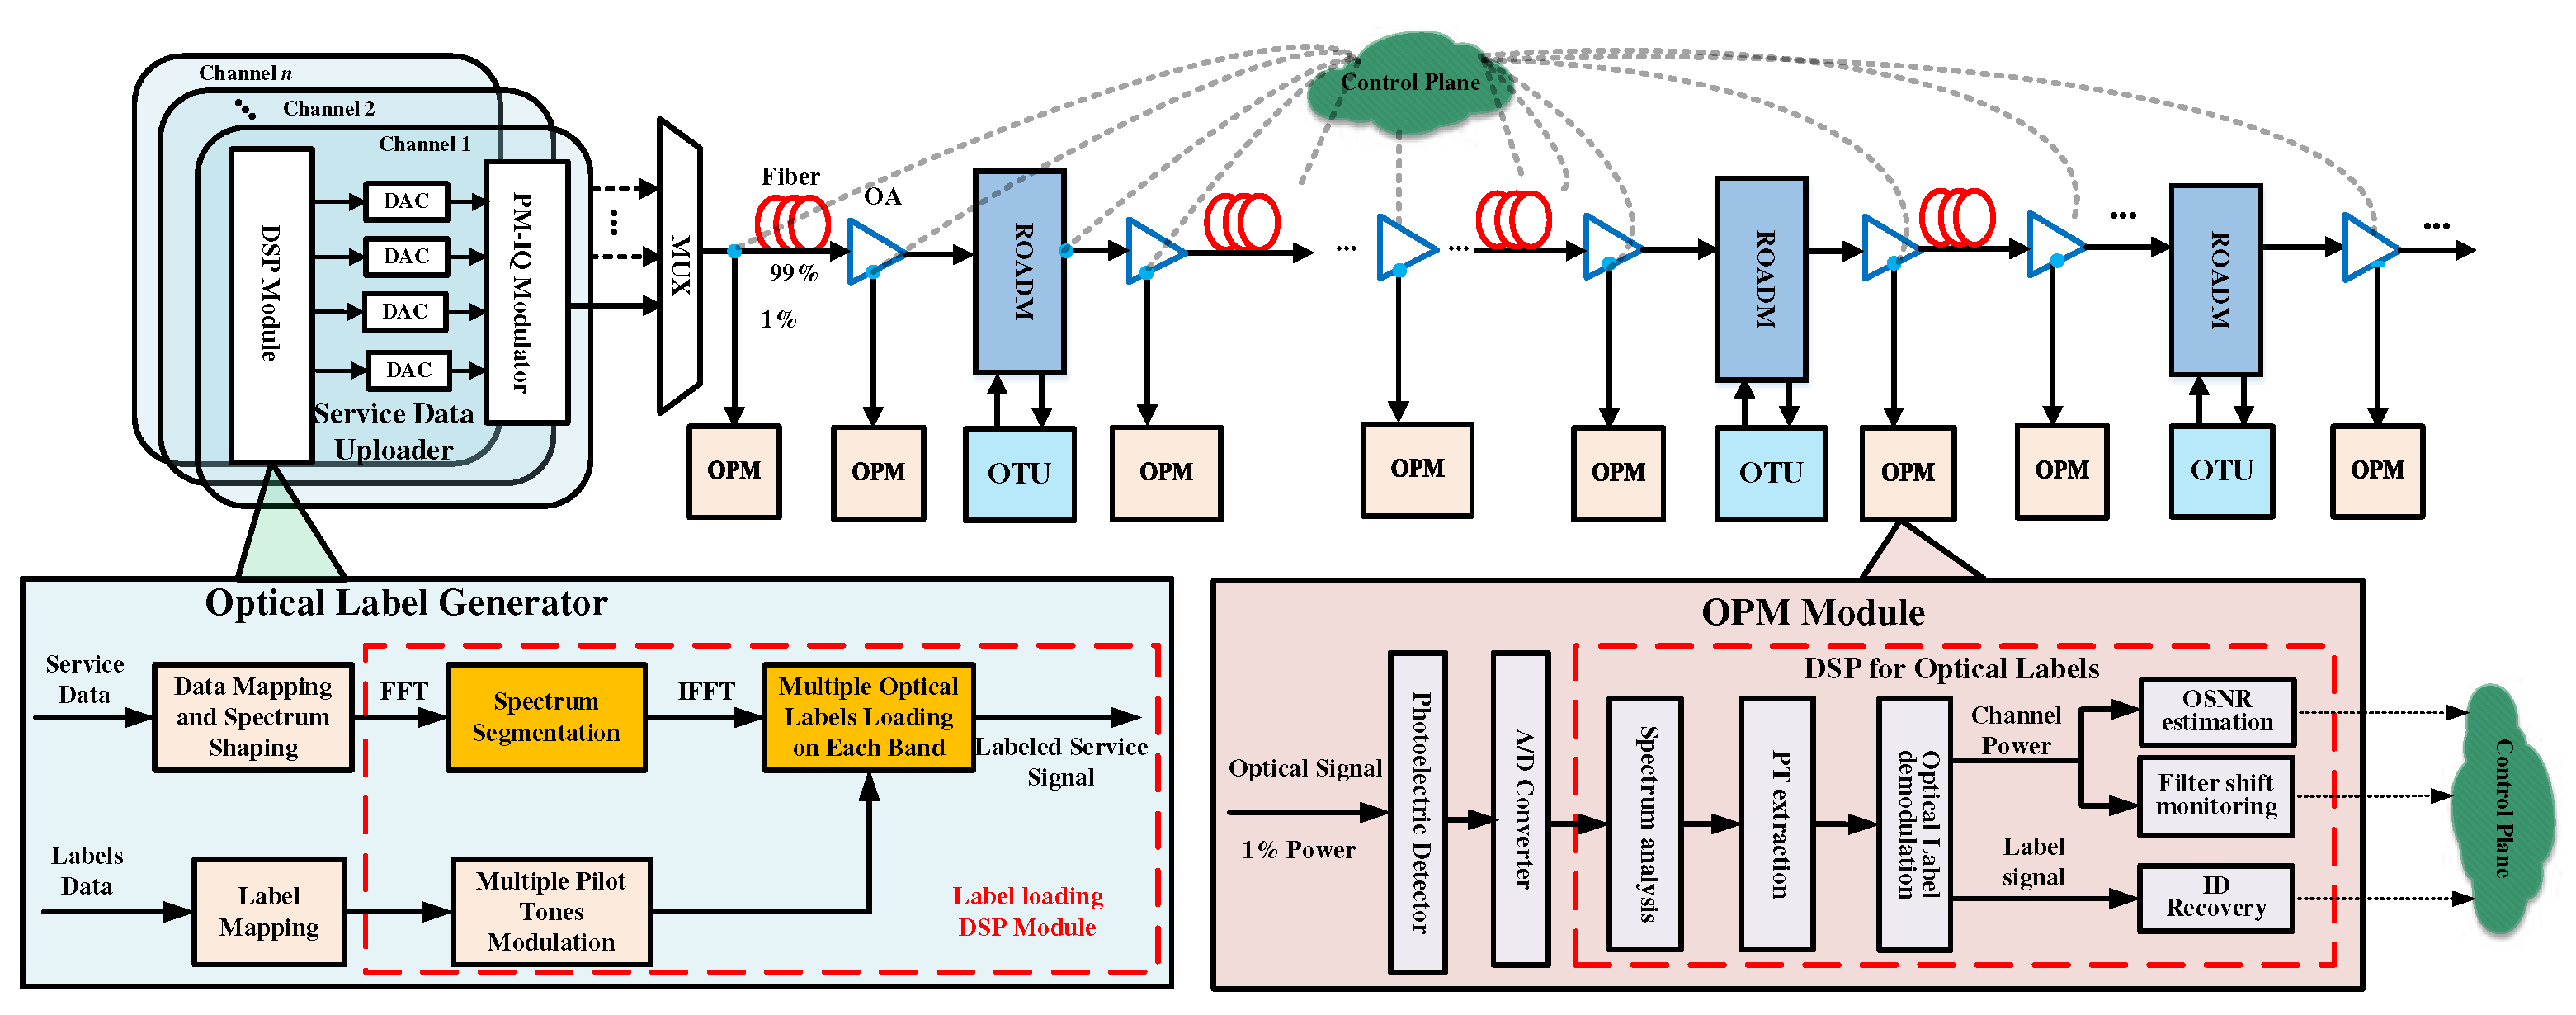
20]. The schematic diagram of the overall principle proposed in this scheme is shown in
Figure 1. The service signal baseband information is generated at the transmitter side and mapped in the digital domain according to the preset modulation format and symbol rate. In the optical label generator module, the label bit information is determined based on the related parameter information of service signal. This information is mapped and pilot tones (PT) modulated to generate optical labels. Then, the optical labels of different frequencies are top modulated in the digital domain to load on the different sub-bands of the service signal according to the preset modulation depth. The service digital signal carrying the multi-frequency optical labels is generated. After the analog-to-digital conversion, the optical modulator is driven to convert the digital signal into the optical signal of the corresponding channel wavelength, which completes the optical labels loading of one channel. For other optical channels of different wavelengths, the same modulation process is performed. After multiplexing the optical signal into the optical fiber transmission, the optical label and the original signal will be “bonded” into the optical network for transmission. The monitoring of optical labels can be set at any ROADM nodes, optical power amplifier input and output sides, and other important locations in the optical network. When monitoring is required, the front end of optical performance monitoring (OPM) module extracts 1% of the power component of the transmitted optical signal in the fiber using an optical splitter. With the help of direct detection PD and analog-to-digital converter. The optical signal completes the process of receiving and sampling discretization. Optical labels transmitted in the measured fiber of all channels are obtained simultaneously. Combined with the subsequent DSP technology, the monitoring of relevant performance such as optical power, Optical Signal-to-Noise Ratio (OSNR), filtering costs, etc. are completed and the recovery of service-related identity information is achieved. At the same time, the above monitoring results are uploaded to the control plane to reasonably confirm the optical network operation status so that the control plane can make a decision of adjusting network status dynamically if necessary.
It is worth noting that since a single fiber in a WDM system often transmits service information for multiple wavelength channels, different optical labels are loaded at different frequencies for each wavelength channel. Here, unlike regular label loading scheme, we have chosen to load multiple labels on a single channel with multiple sub-bands. The attenuation of optical label power caused by chromatic dispersion(CD) effect can be mitigated effectively with the narrower spectrum band width of optical label loading. Meanwhile, to improve the transmission efficiency and the signal-to-noise ratio of the label signal, a PM-FTN service is used as well as the same frequency of the optical label is loaded at the same position in each polarization state. Next, a channel is used as an example to illustrate the specific process of muti-band labels loading DSP module.
2.1. Muti-Band Optical Labels Loding
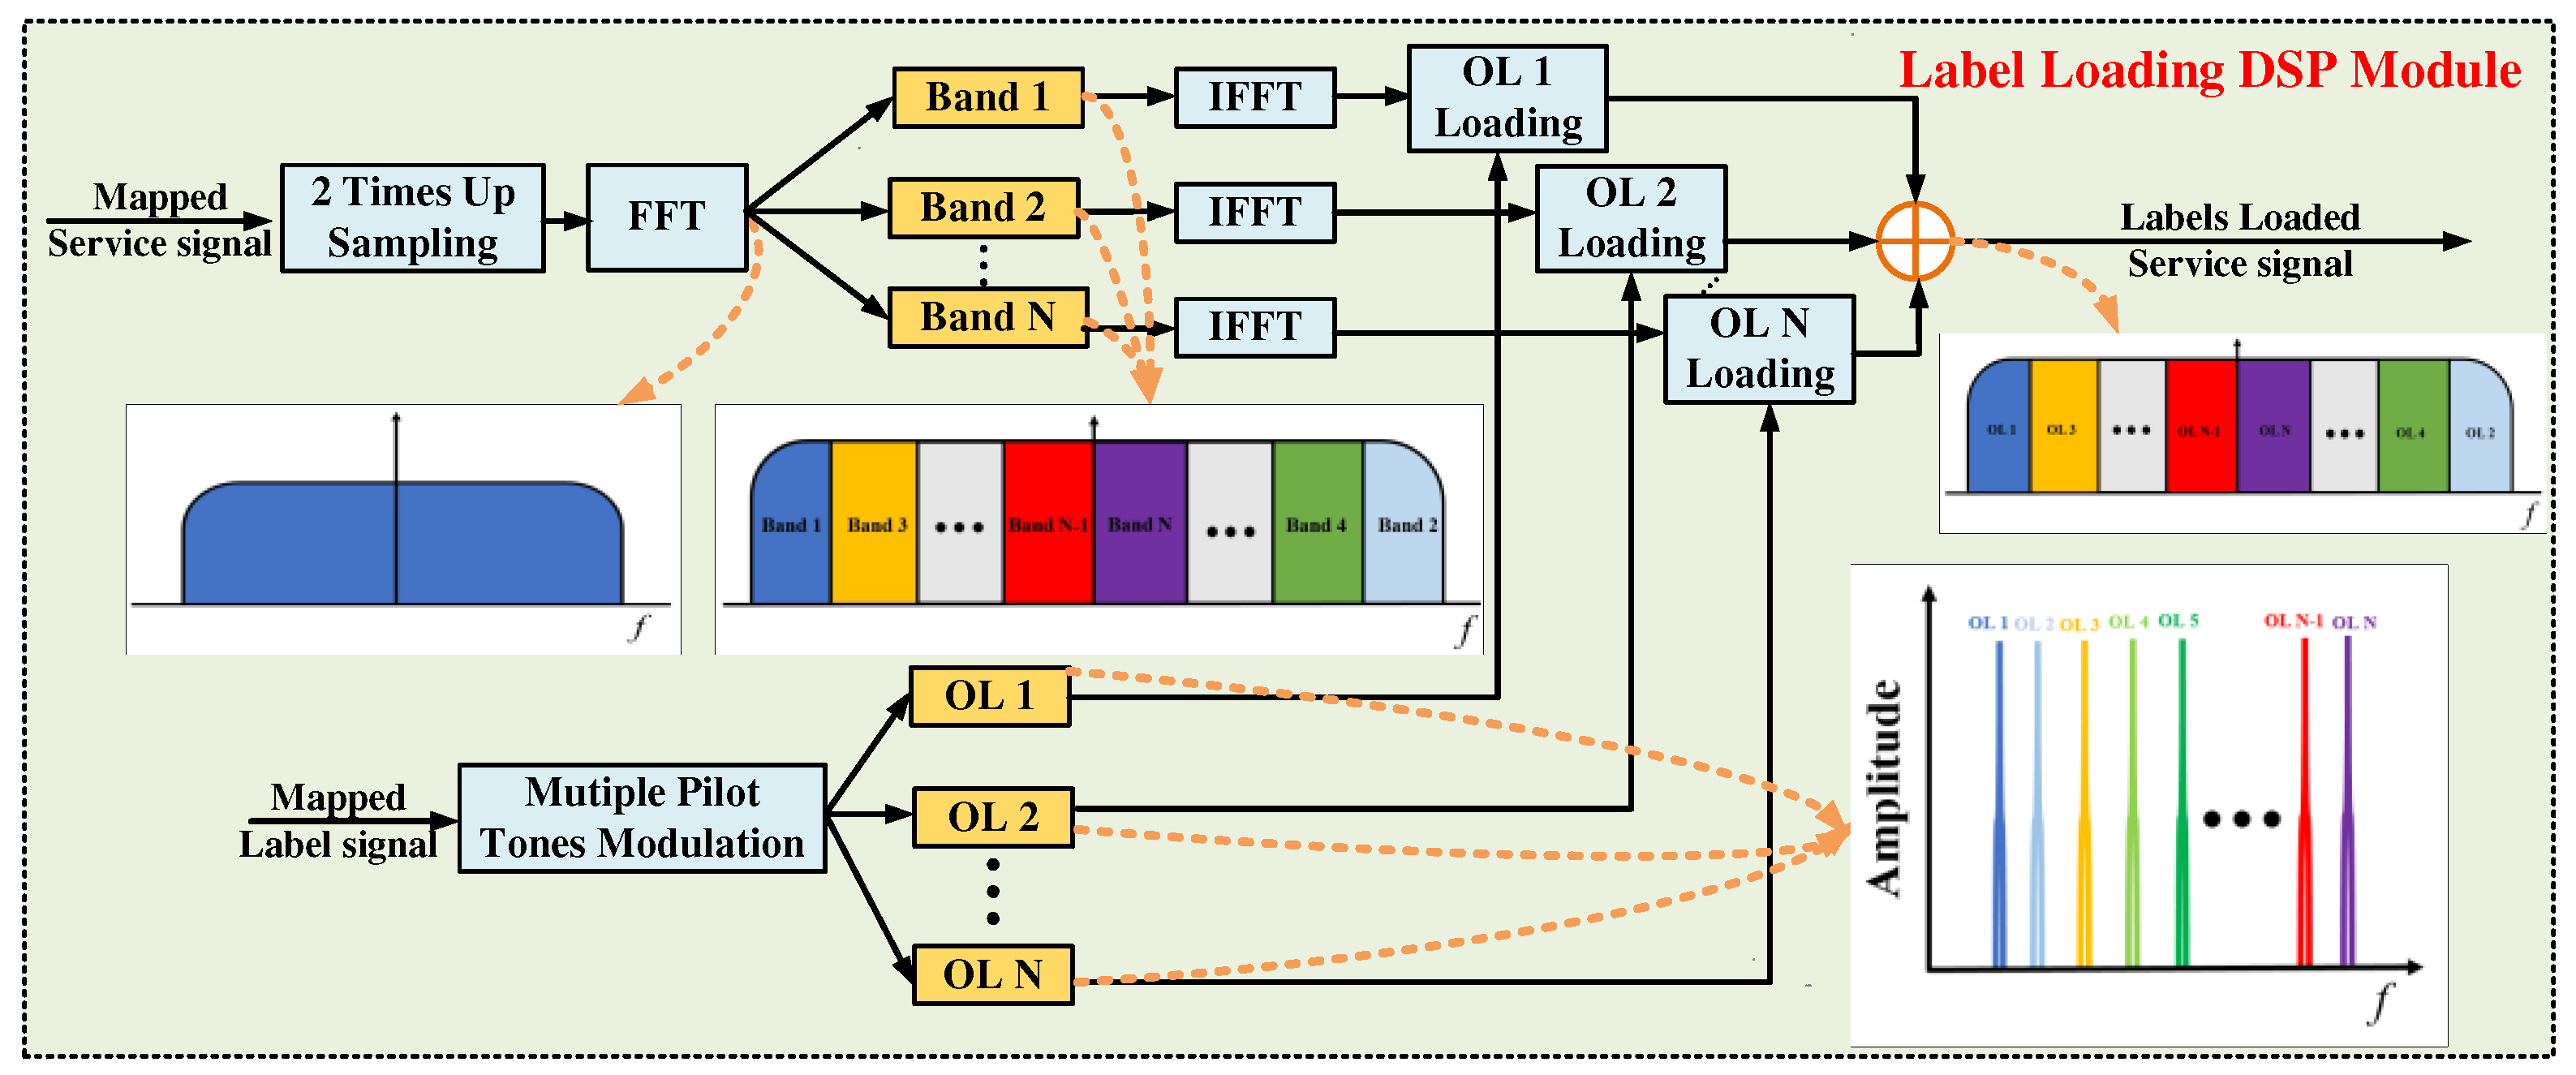
Figure 2 shows the specific DSP flow after the label as well as the service signal is generated for a single channel. After the mapping of the service signal as well as the label is completed, the mapped service signal is subjected to FFT processing. After that, the spectrum of the service signal is divided into multiple sub-bands. Meanwhile, the low-rate digital bit sequence (containing service signal identity information) label signals are multiplied with different pilot tone frequencies respectively after symbol mapping to obtain multiple optical labels. These optical labels are multiplied with the time domain parts corresponding to different sub-bands of the service signal after IFFT respectively to complete the top modulation, thus realizing the label loading of the service signal. After that, the service signal containing the optical labels will be sent to the digital-to-analog (DAC) to complete the digital-to-analog conversion, and the converted digital signal will be sent to the IQ modulator to complete the optical modulation. At this time for any service signals, a single wavelength is loaded with N optical labels information. The single wavelength service signal can be expressed as:
where
represents the X/Y polarization state of the service signal after label loading.
...
represents the magnitude of the time domain corresponding to the
sub-band in the frequency domain of the
channel after IFFT.
denotes the center wavelength of the
channel.
represents the X/Y phase size of the polarization state.
m is the modulation depth of the label signal, whose value is defined as the ratio of the optical label signal magnitude to the pure service signal magnitude. In practice, it generally does not exceed 15%.
....
denotes the frequency of the pilot tone multiplied by the 1st to
the optical label.
represents digital bits sequence which carries information of the service signal in each optical label.
At the monitoring node, 1% of the optical power is divided using a 1:99 optical coupler for the OPM module to monitor and process. The optical label information of all wavelength channels can be obtained by using low bandwidth PD to complete the optoelectronic conversion simultaneously. Since the PD direct detection uses the square law detector, the received signals can be expressed as:
where
I(t) represents the electrical signal after square-law detector,
R represents the number of received channels.
denotes the time domain amplitude of the
sub-band of the service signal in channel
i after IFFT. At this point, the received signal spectrum can be analyzed and processed by DSP algorithm. Since the labels loaded on each channel are not similar, the label information of a single channel can be filtered out using a digital band-pass filter. For the optical label with the frequency
of the
channel, after removing the direct current (DC), it can be expressed as:
where
,
denotes the magnitude of the time domain amplitude corresponding to the X and Y polarization states in the
channel, respectively.
2.2. Frequency Shift Monitoring Scheme
It is clear that the relationship between the service signal optical power and the optical label power exists, and the power magnitude of each sub-band can then be reflected using the signal power through the label [
21]. Thus, the label power information can be used to recover the general shape of the service signal. And the label power variation is used to reflect the service signal affected by the filtering damage. For the label power statistics, we can use the information of received label spectrum from the PD detection and FFT transformation to perform integral operation to obtain [
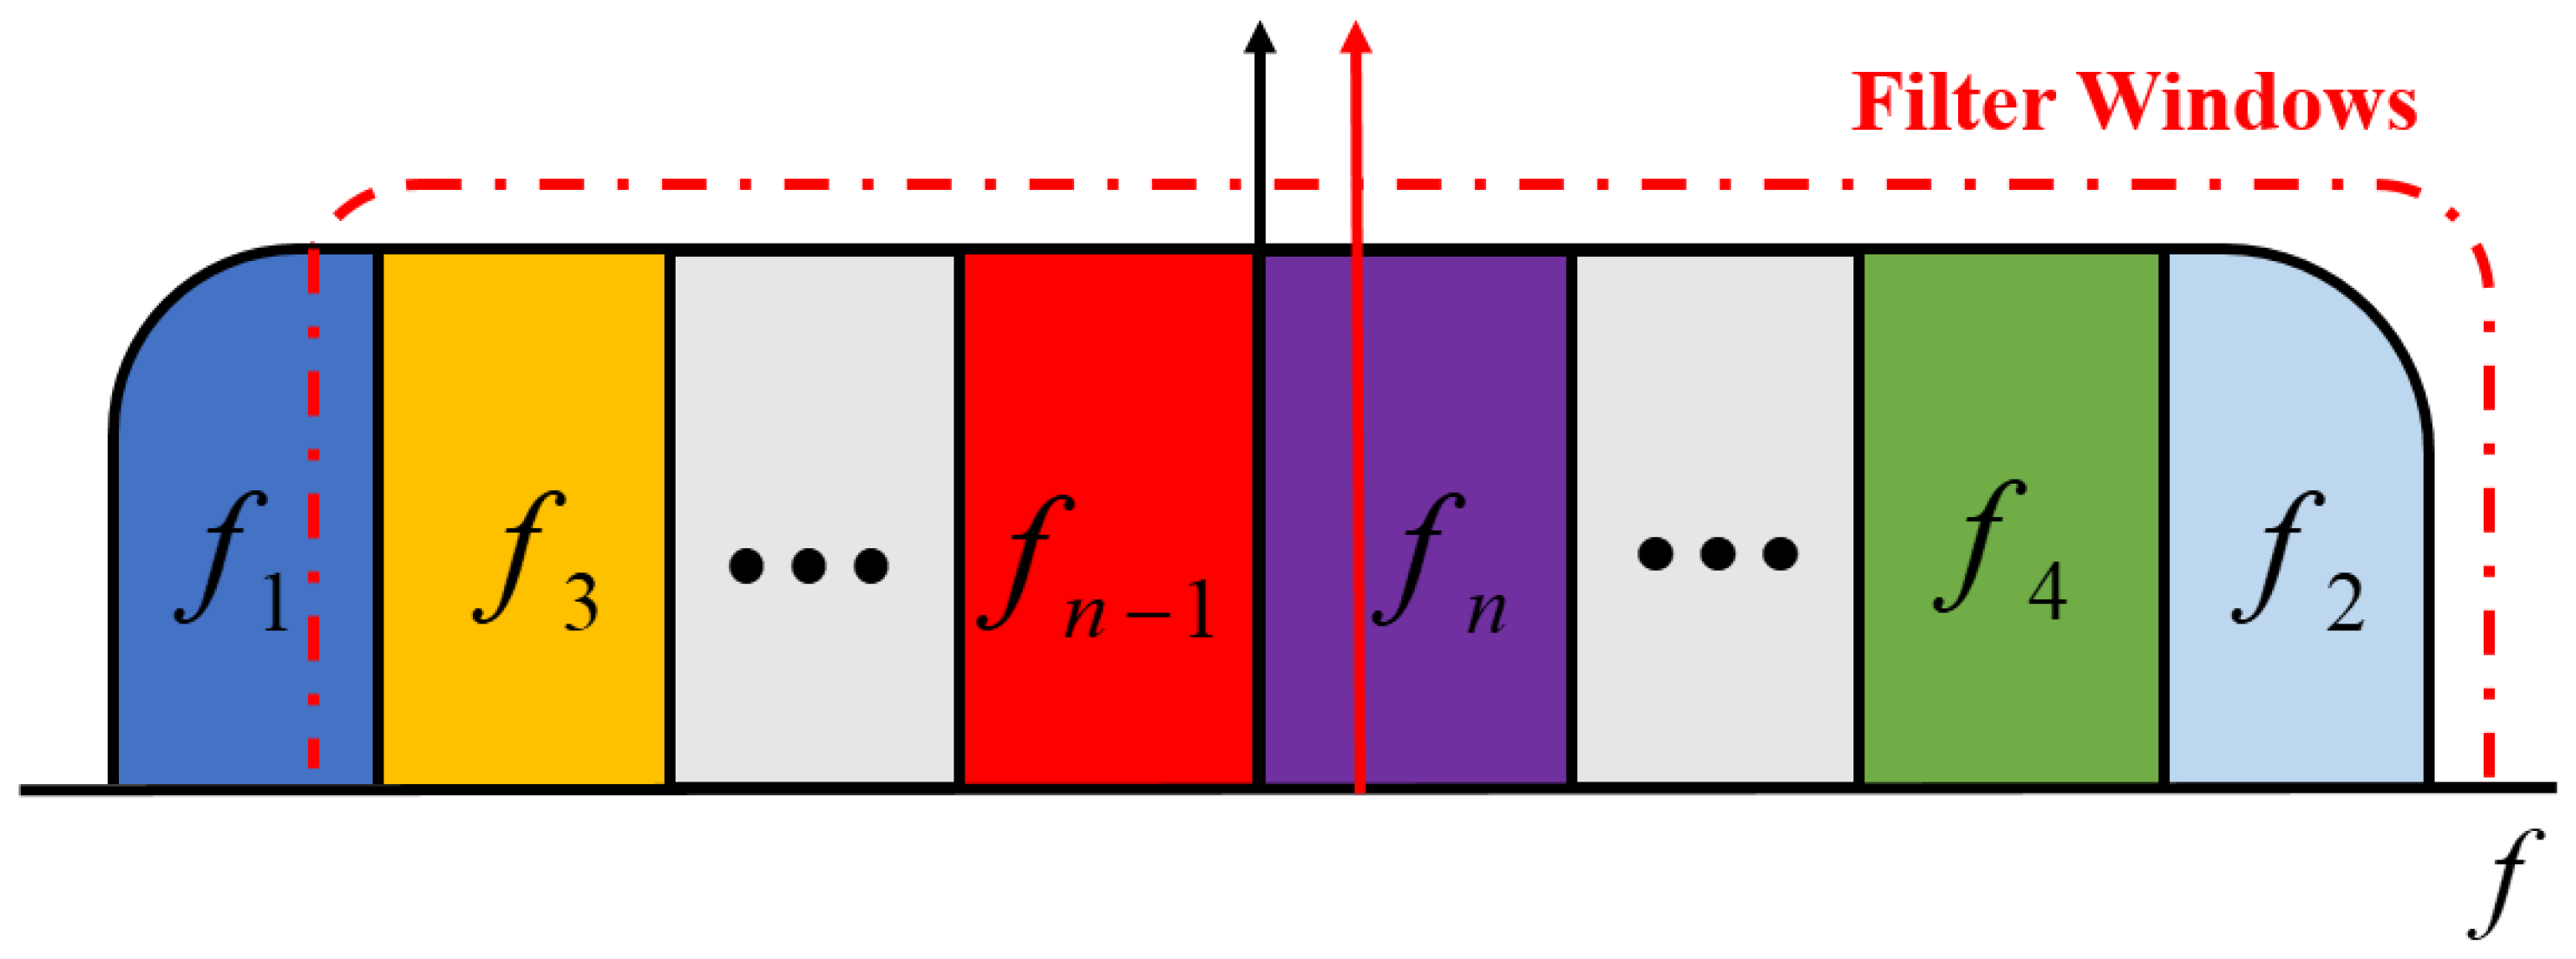
22]. Since different frequency optical labels are loaded on different sub-bands of the service signal in the originating label loading, the power of these optical labels can reflect the status of the optical power at each sub-band spectrum at this time. When the service signal through ROADMs, and MUXs/DEMUXs and other optical filter devices, if the filter window center frequency shift occurs, the optical power at the high frequency of the service signal will be significantly reduced due to the asymmetric filtering effect, corresponding to a significant drop in label power. But for the other side of the label power ,the impact is not significant. Therefore, the label power difference between negative and positive symmetric part of service spectrum occurred, and different frequency shift state resulting in different power difference value. This feature can be used to complete the monitoring of the filter center frequency shift. As shown in
Figure 3, the service signal has been modulated with multiple optical label signals with frequency shift of filter at this time.
Define the power ratio of the negative and positive symmetric positions of the service spectrum as
where
and
are the power of the corresponding label loaded in the negative and positive outermost frequency part of the service signal, that is, the power of the optical label
and optical label
in
Figure 3 above. If there is no frequency shift in the center of the optical filters, there should be almost no difference in the optical power of the negative and positive high-frequency part of the spectrum, and the power difference should be about 0 dB. However, if the center frequency of the optical filter is shifted relative to the service signal, then the asymmetric filtering effect will occur, which can be reflected in the change of
value. By measuring the power difference brought by the frequency shift of the optical filter relative to the center wavelength of the service in advance, the frequency shift-power difference reference curve is obtained, which can be used as a reference for monitoring the failure of filter devices at each monitoring node in the transmission link and network.
However, considering the uncertainty of the differential beat noise generated during PD detection, the received power of the optical labels in the actual multi-span transmission will fluctuate in a small range, resulting in uncertain fluctuations of the
value. To reduce the impact of the previous span transmission, the power difference value at this time can be subtracted from the power difference from previous span transmission, and then compared with the reference curve of this span to obtain more accurate monitoring results. As shown in equation (5):
where
represents the label power difference used for monitoring after the
nth span.
represents the label power difference after
n-span transmissions.
represents the label power difference without frequency shift of optical filter devices after the first
n-1 span transmissions.
3. Simulation and discussing
With the help of VPI TransmissionMaker 9.0 created by VPIphotonics (Berlin, Germany) and MATLAB R2020b created by MathWorks (Natick, MA, USA), we have constructed a simulation platform of WDM transmission system with OPM module based on DPSK modulated digital optical labels to investigate the performance of the proposed scheme for WSSs’ frequency shift monitoring. Here we build an 8-channel 10-span WDM transmission system. Meanwhile, for convenience, we choose a wavelength channel with a center frequency of 193.1 THz to study the frequency shift monitoring effect of the service signal after passing through different filter devices frequency shift states. The service signal here is set as 40GBaud PM-FTN-QPSK signal. And considering the prevalence in practical applications, the roll-off factor of filter shaping is set to 0.1 and the FTN acceleration factor is set to 0.9. For labels loading, we choose to load six labels with different frequency on the QPSK signal using 40 GBaud symbol rate, and each label symbol rate is set to 200 KBaud. The frequencies of the pilot tones for label modulation are set to 40 MHz/40.5 MHz, 45 MHz/45.5 MHz, and 50 MHz/50.5 MHz. The six labels are arranged from the high to low frequency part of the service spectrum and are symmetrically distributed with a central frequency of 193.1 THz. Meanwhile, the filter window shape of WSS uses a 4.5 order super Gaussian filter with a -3dB bandwidth of 37.5 GHz. A PD with a -3dB bandwidth of 200MHz and an ADC of 400MSa/s are used for label signal acquisition and processing at receiver or monitoring node.
Table 1 lists the important simulation parameters.
3.1. Performance of Frequency shift Monitoring
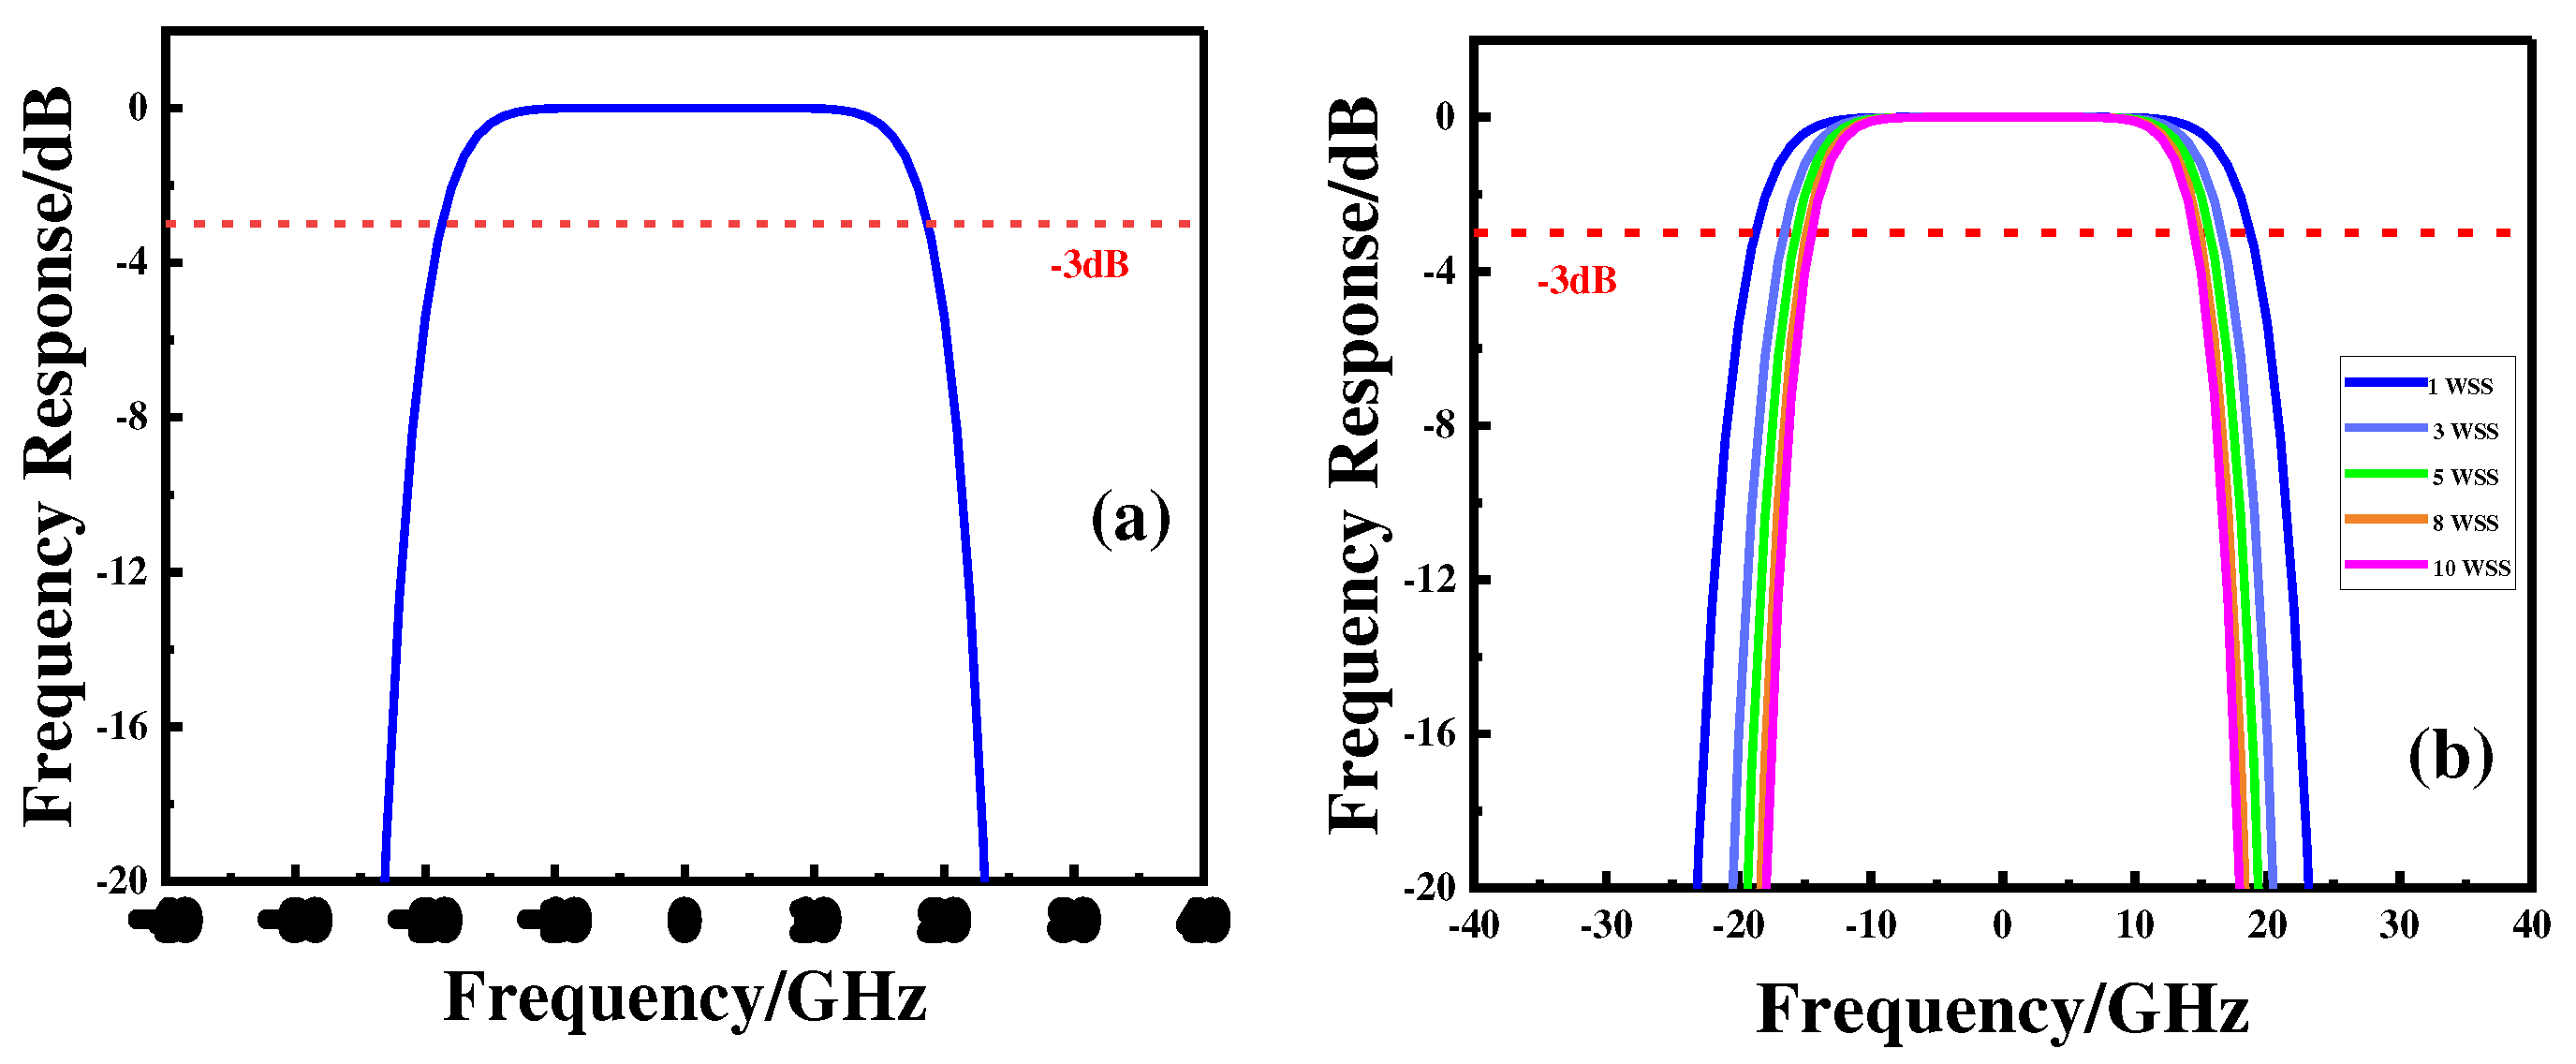
Considering the use of WSSs in actual commercial use, a filtering window with a -3dB bandwidth of 37.5 GHz is used in the simulation, and the frequency response is represented as shown in
Figure 4(a). However, due to the cascading effect of multiple WSSs in the long-distance transmission of the backbone network, the filtering window becomes narrower as shown in
Figure 4(b), which results in a serious filter tightening effect. Therefore, the power difference reference curves under different filtering window shapes should also be reset according to different filtering windows.
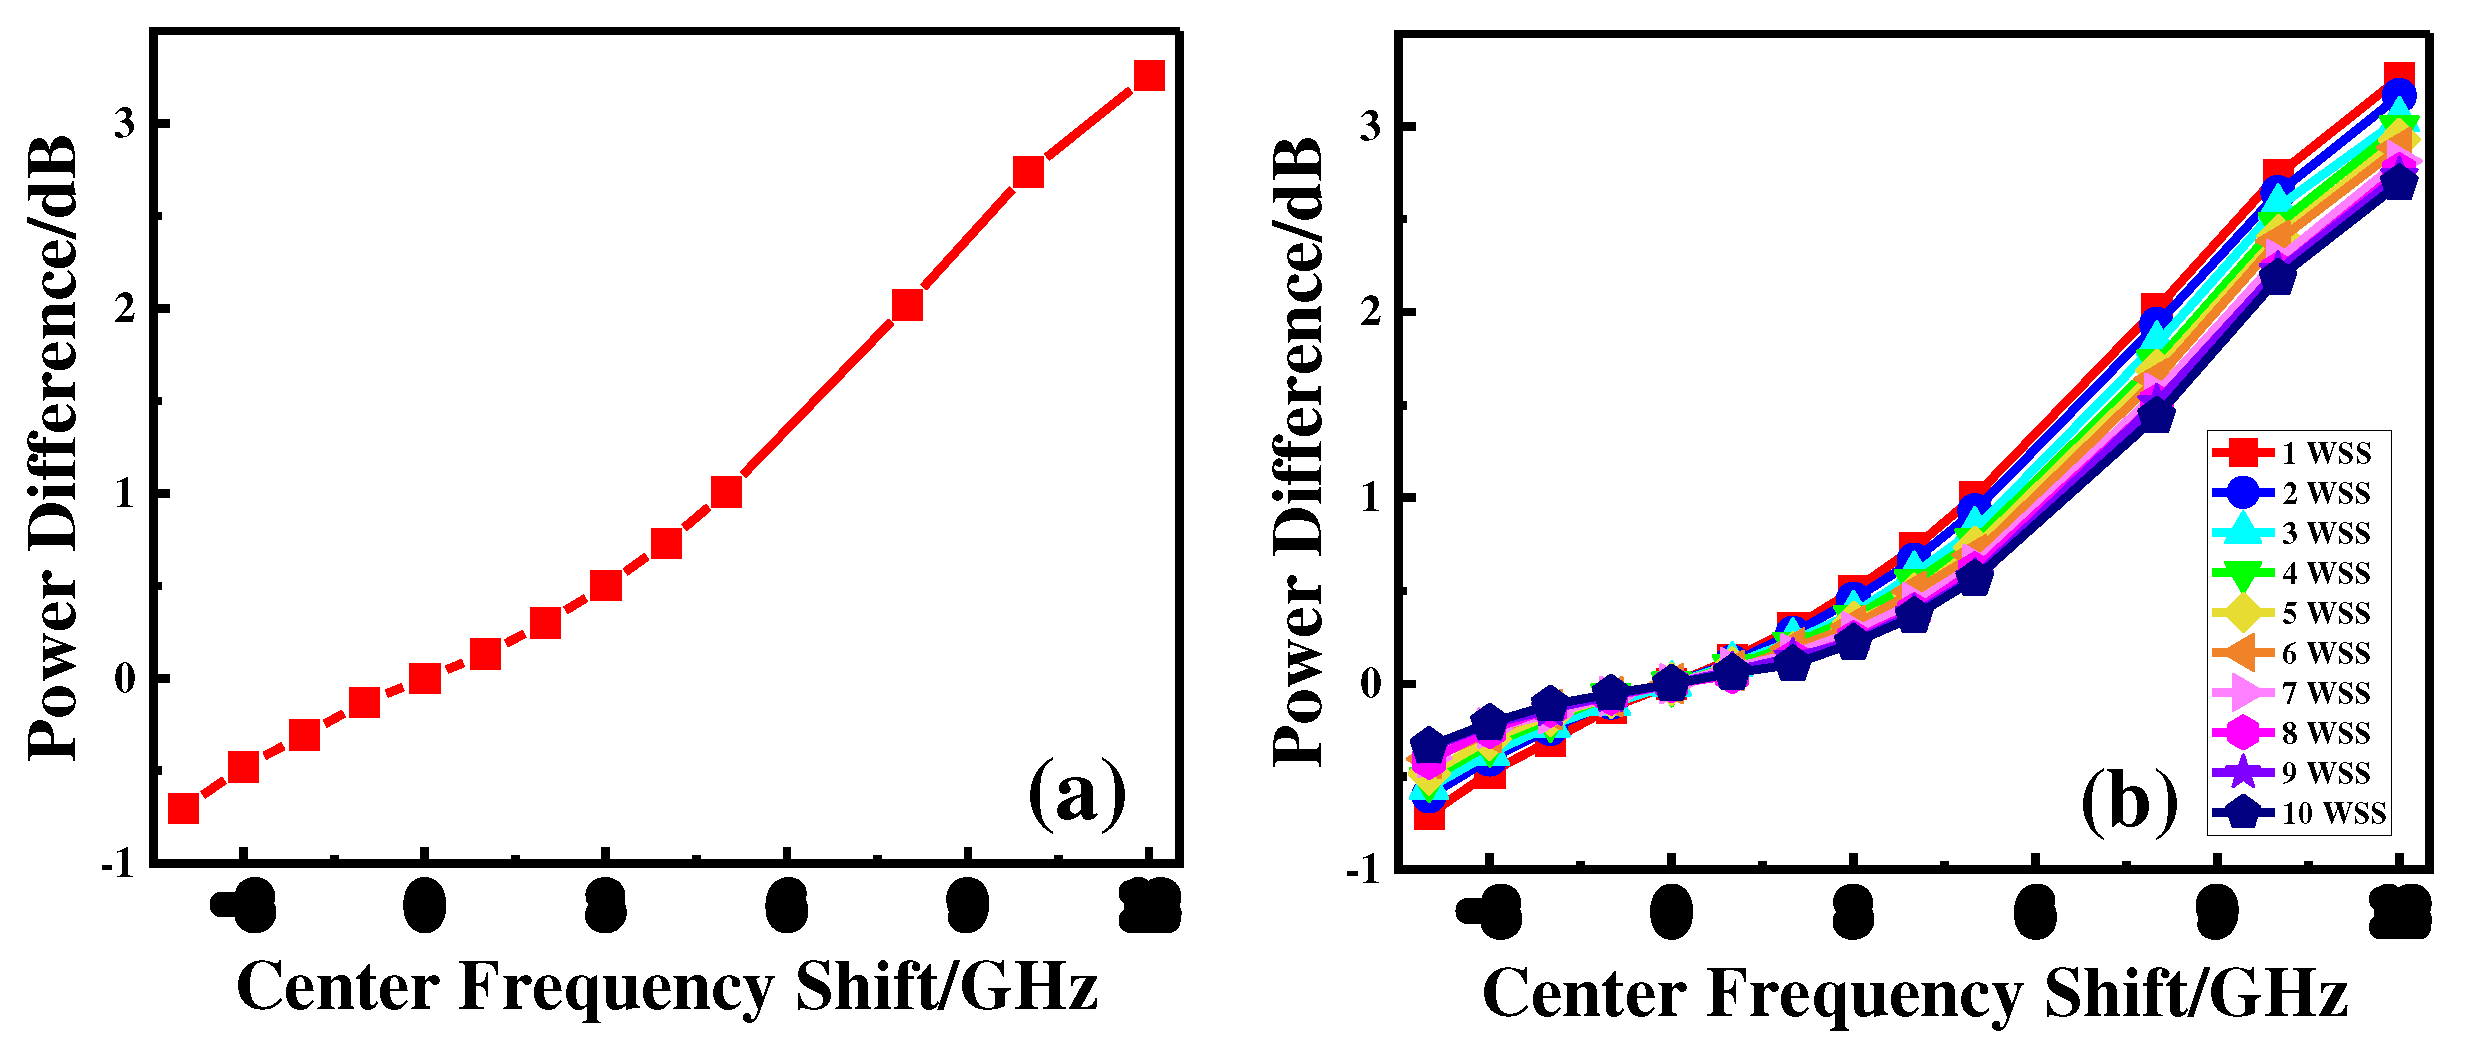
The simulation continuously changes the WSS center frequency under back-to-back transmission to produce a relative frequency shift. The reference value of power difference (dB) can be obtained based on equation (4). And to remove the small deviation in the label power calculation, the scheme is normalized to the outermost label power difference of the spectrum when there is no frequency shift in WSS. That is, the power difference is 0 dB when there is no relative frequency shift. Similarly, Because of the narrowband filtering effect generated by multiple WSSs cascades, the power difference reference curve will also change. By changing the number of passing WSSs, the reference curve after passing different number of WSSs can be obtained as shown in
Figure 5.
From the results of the power difference in
Figure 5, when the center frequency of the WSS is shifted, the power difference of the labels loaded to the negative and positive service spectrum changes as a consequence. As the frequency shift becomes larger and larger, the power difference changes more rapidly. When the number of passing WSS increases, the labels at the high frequency of the service suffer a larger portion of attenuation, which leads to a flatter ratio (subtracted dB) reference curve.
The service rate used in the simulation is 40GBaud. Since the FTN modulation is used, the roll-off factor of the forming filter and the FTN acceleration factor are set to 0.1 and 0.9, respectively, causing that the service signal bandwidth is close to 39.6GHz, which means that the bandwidth distribution is
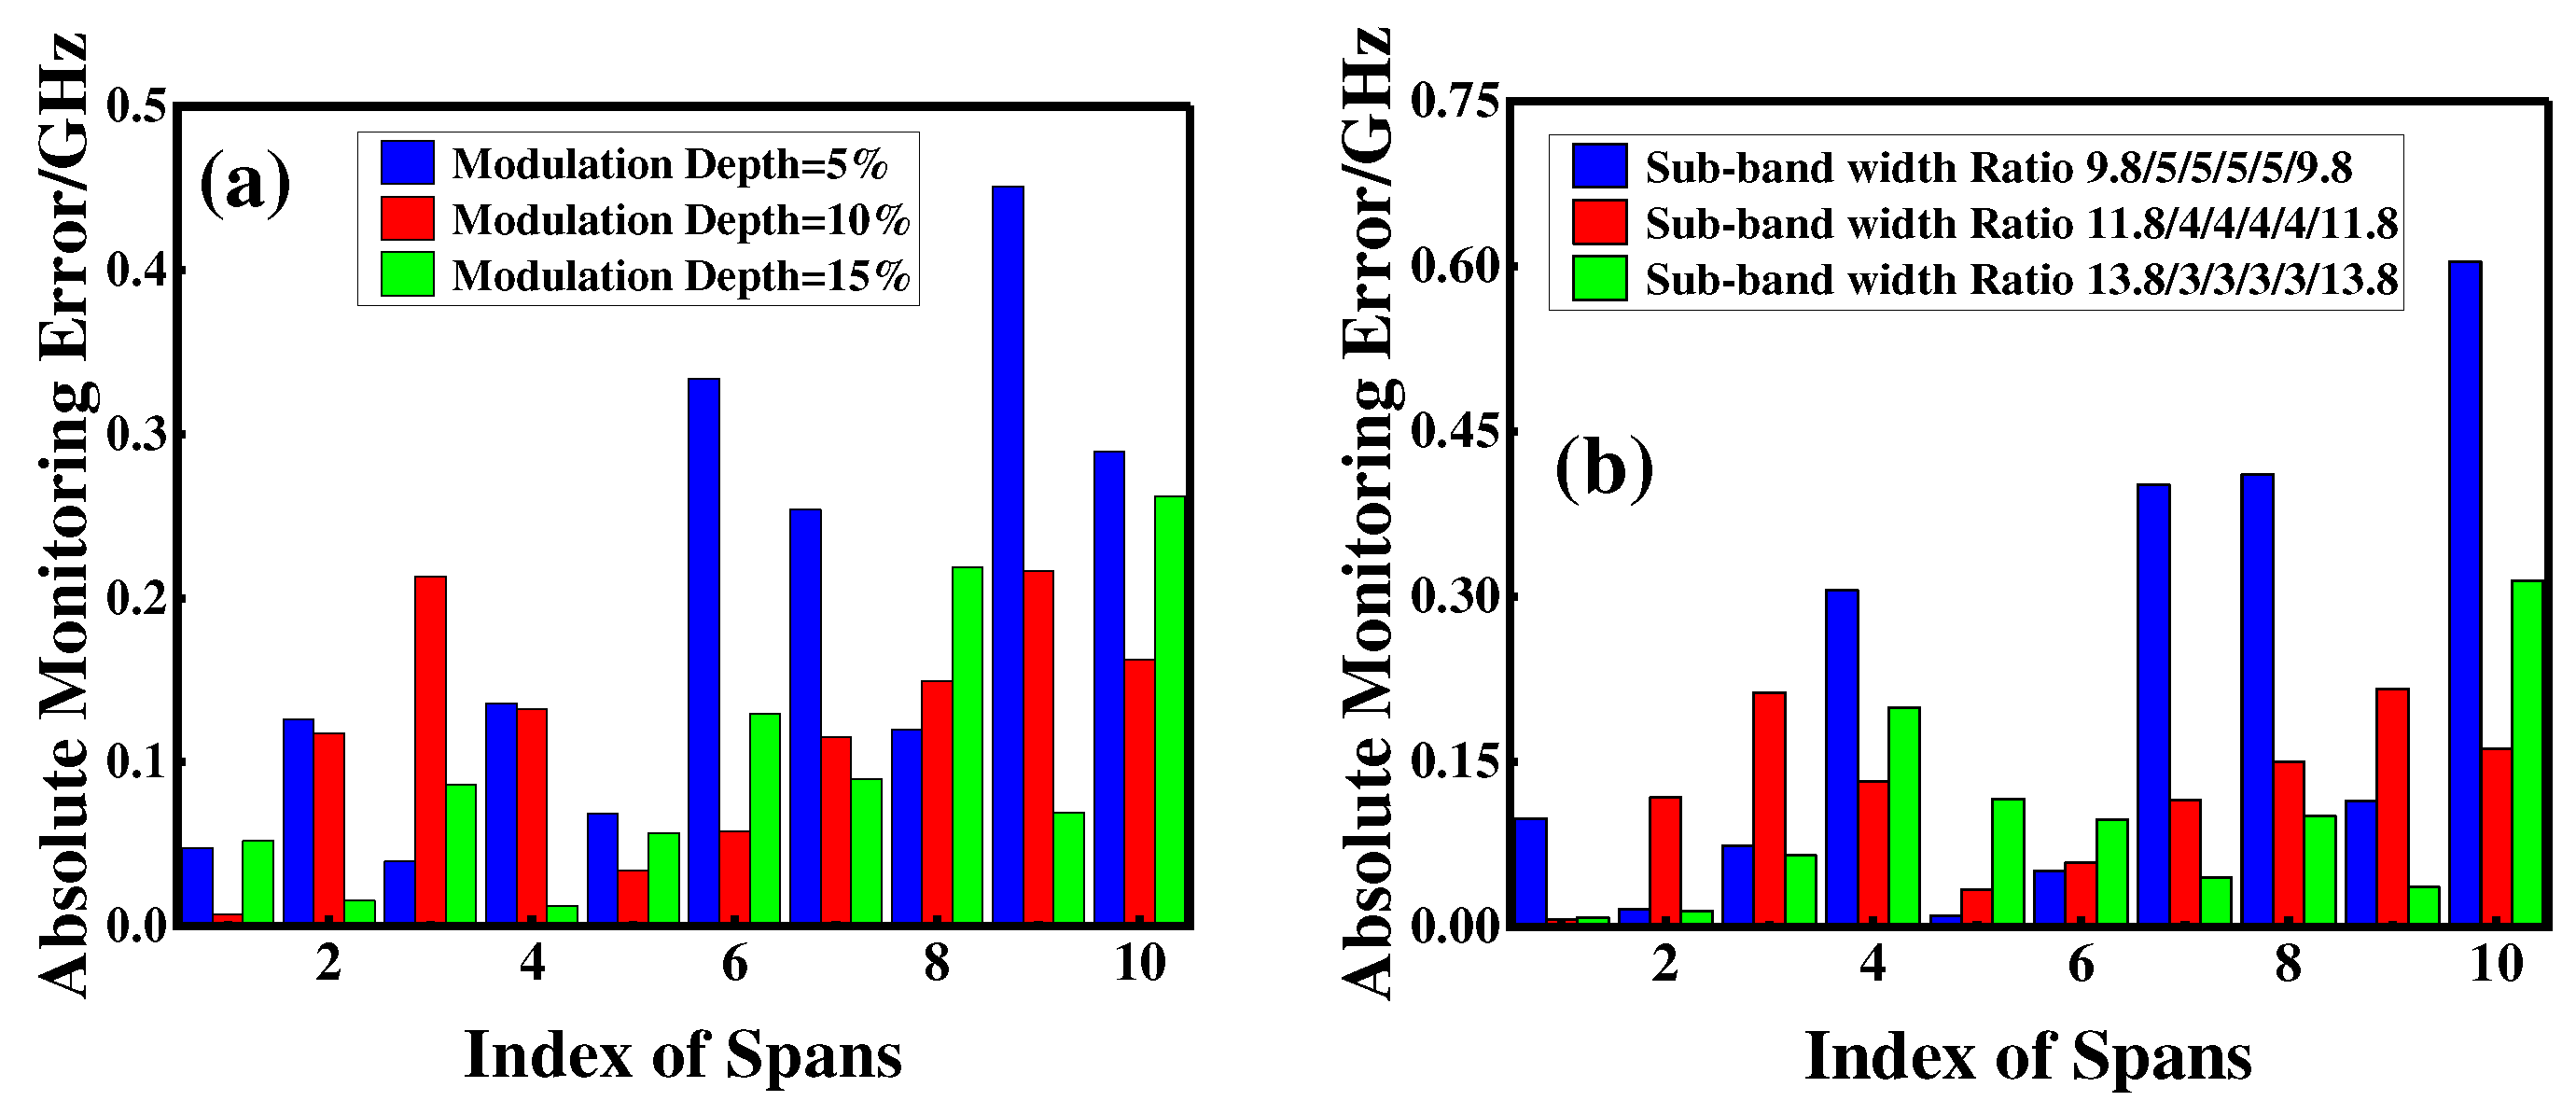
+19.8GHz with the optical carrier 193.1THz as the center. Therefore, three kinds of label loading width ratios of sub-bands are selected in the simulation, from the negative to the positive of the service spectrum are 9.8/5/5/5/5/5/9.8, 11.8/4/4/4/4/4/11.8, 13.8/3/3/3/3/13.8. Meanwhile, the label modulation depth is set to 5%, 10% and 15% respectively. At this time, the center frequency of the passed WSS is set to 2GHz frequency shift after transmitting 1, 2...10 spans, respectively, to simulate the sudden device frequency shift situation. The sub-band width ratio in
Figure 6(a) below is 11.8/4/4/4/4/4/11.8, and the fixed label modulation depth in
Figure 6(b) is 10%.
Figure 6 reflects the fluctuation of the monitoring error under the condition of a certain modulation bandwidth ratio. From the frequency shift monitoring results, the average monitoring errors at 5%, 10% and 15% modulation depths are 0.187GHz, 0.12GHz and 0.099GHz respectively, with variances of 0.0172, 0.00448 and 0.00615 respectively, and the maximum monitoring error does not exceed 0.5GHz. It is obvious that when the modulation depth reaches 10%, the monitoring error and fluctuation are in a smaller state. At this time, the label signal-to-noise ratio is already in a good state, so the modulation depth increasing from 10% to 15% does not have a significant monitoring performance improvement, and the maximum monitoring error does not exceed 0.35GHz in these conditions.
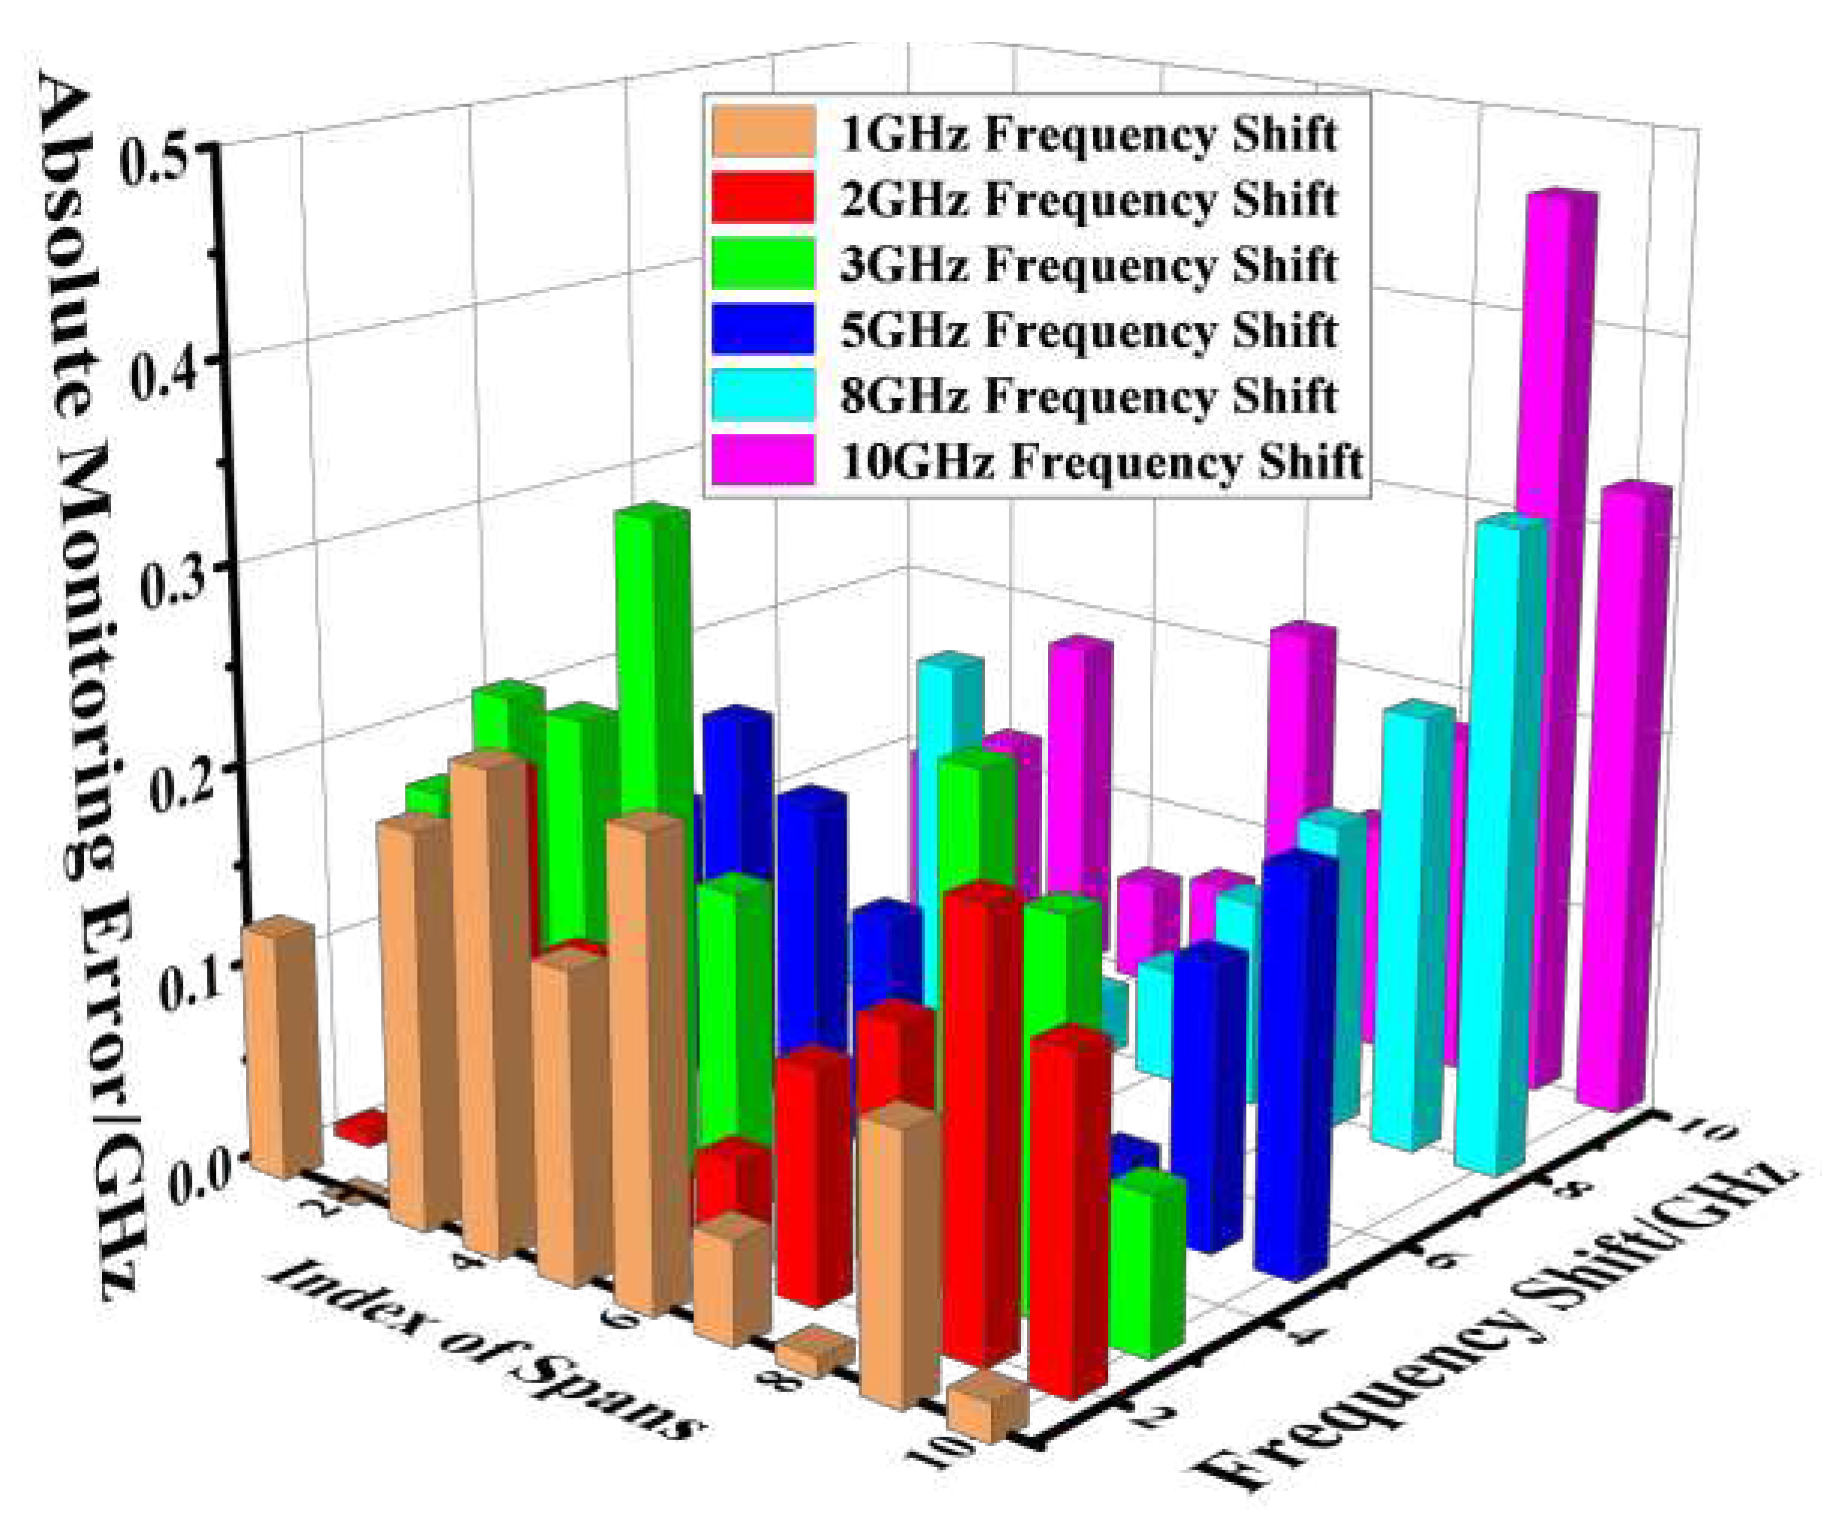
Figure 6(b) shows the monitoring effect under different label loading sub-band widths, to some extent, is also the impact of the label power. The average values of monitoring errors are 0.208 GHz, 0.12 GHz, 0.099 GHz and the maximum monitoring error does not exceed 0.6 GHz for label loading bandwidth ratios of 9.8/5/5/5/5/5/9.8, 11.8/4/4/4/4/4/11.8 and 13.8/3/3/3/3/13.8, respectively. When the power of the label used for frequency shift monitoring increases, the monitoring accuracy at this time will also improve. However, when the signal-to-noise ratio of the label is increased to a better level, the improvement for the monitoring performance also becomes minimal. By controlling the modulation bandwidth and modulation depth, the monitoring error can be kept below 0.5 GHz or even lower. To verify the frequency shift monitoring range of this scheme, the simulation is performed at 10% modulation depth. The frequency shifts cases of 1GHz, 2GHz, 3GHz, 5GHz, 8GHz and 10GHz are set to occur after 1, 2...10 spans transmission, respectively. The obtained results are shown in
Figure 7.
The results in
Figure 7 show that the maximum error generated by the monitoring of this scheme is not more than 0.5 GHz when the maximum frequency shift of the service signal 10-span transmission is 10 GHz, and the average monitoring error is not more than 0.2 GHz. When the frequency shift of the filter pieces is more serious, there may be a relatively large monitoring error. This is due to the impact of asymmetric filtering caused by frequency shift. It produces great attenuation for the label power used for monitoring, which makes the signal-to-noise ratio of label reception decrease, and the beat frequency noise generated by PD direct detection brings greater interference for monitoring.
4. Experience and discussion
To verify the monitoring effect of this scheme in actual transmission, we built a single-channel 240km transmission system. Its main scheme is shown in
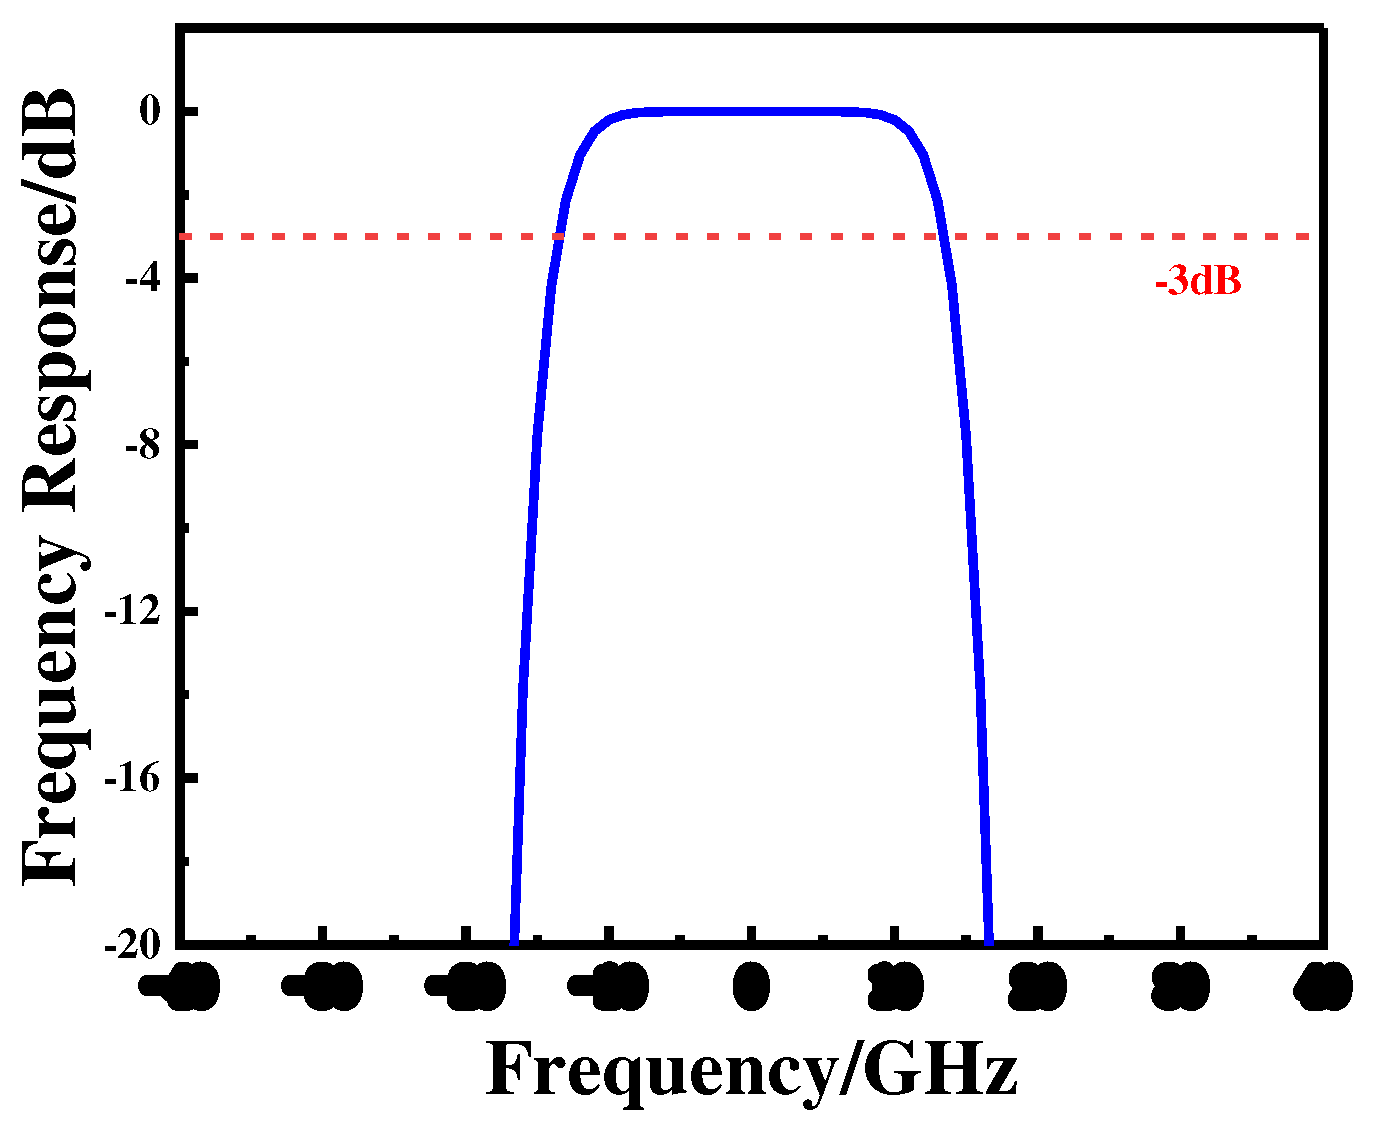
Figure 8. We set the service signal to 30GBaud PM-FTN-QPSK with a roll-off factor of 0.1 and an FTN acceleration factor of 0.9. The number of service sub-bands is set to 4 in the experience, which are distributed in the negative and positive symmetric positions of the service spectrum. And the frequency of loaded optical labels are 40/44MHz and 60/64MHz respectively. The modulation depths of the optical labels are both 15%. The ratio of the optical label modulation width is similar to that in the simulation as 11.8/8/8/11.8. The number of label information data bits is 8bit, with internal bit sequence [1 1 1 0 1 1 1 0 1]. And the digital information rate of the label here is set to 2MBit/s, which means that the transmission time of a bit is 0.5us. All of 4 labels are loaded onto the corresponding sub-bands of the spectrum by offline DSP processing at the transmitter side. After IQ modulation and standard single-mode fiber transmission, the service signal is compensated using an amplifier and passed through the filter window. A 4.5-order super-Gaussian filter with a -3dB bandwidth of 25GHz is used in the experiment, which is shown in
Figure 9. Here an attenuator is used to simulate situation of the spectrum splitting of 1:99. Then the signal required for processing and monitoring is obtained through 200 MHz bandwidth PD after direct detection. This analog signal is sampled and quantized by a 500 MSa/s oscilloscope. It is worth noting that we choose a sampling time of 9us, which is more than two cycles of digital label sequence, to ensure that a complete digital label signal is obtained after sampling.
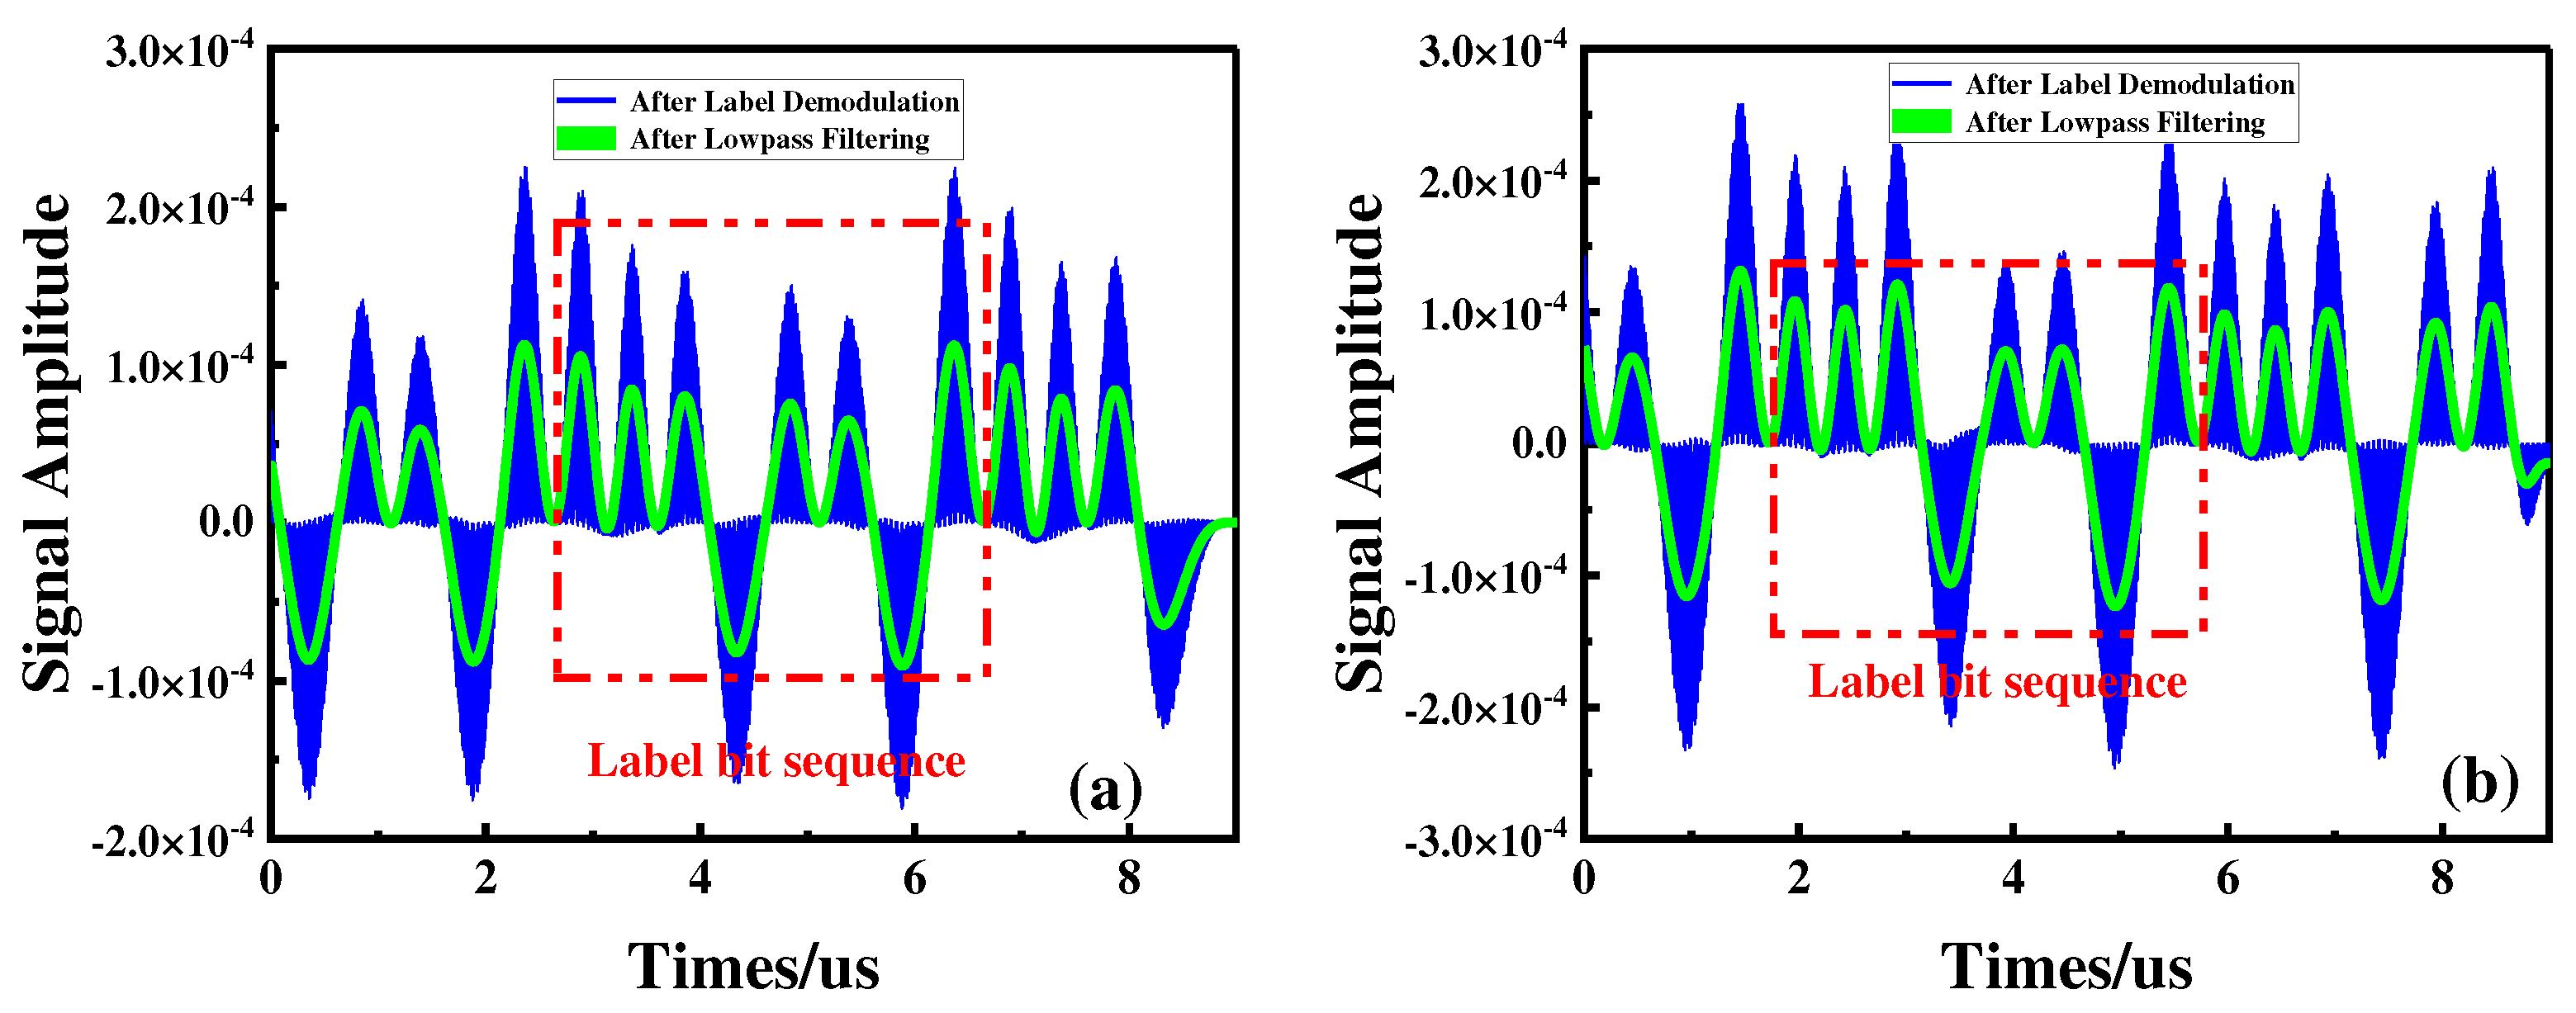
In our experiments, we conducted the optical label reception tests when the WSS had a 10GHz relative shift after 80km, 160km, and 250km fiber transmissions, respectively. The results in
Figure 10 show that even though the center frequency of the WSS filter window is shifted by 10 GHz, it only affects the signal on one side of the service spectrum. There is no significant effect on the demodulation of labels on the opposite side of the frequency shift. Even a large frequency shift occurs after 250km of transmission as shown in
Figure 10(b), the label information can still be demodulated correctly. The label sequence [1 1 1 0 1 1 1 0 1] can be easily identified and acquired, which is the good news for WDM network system monitoring.
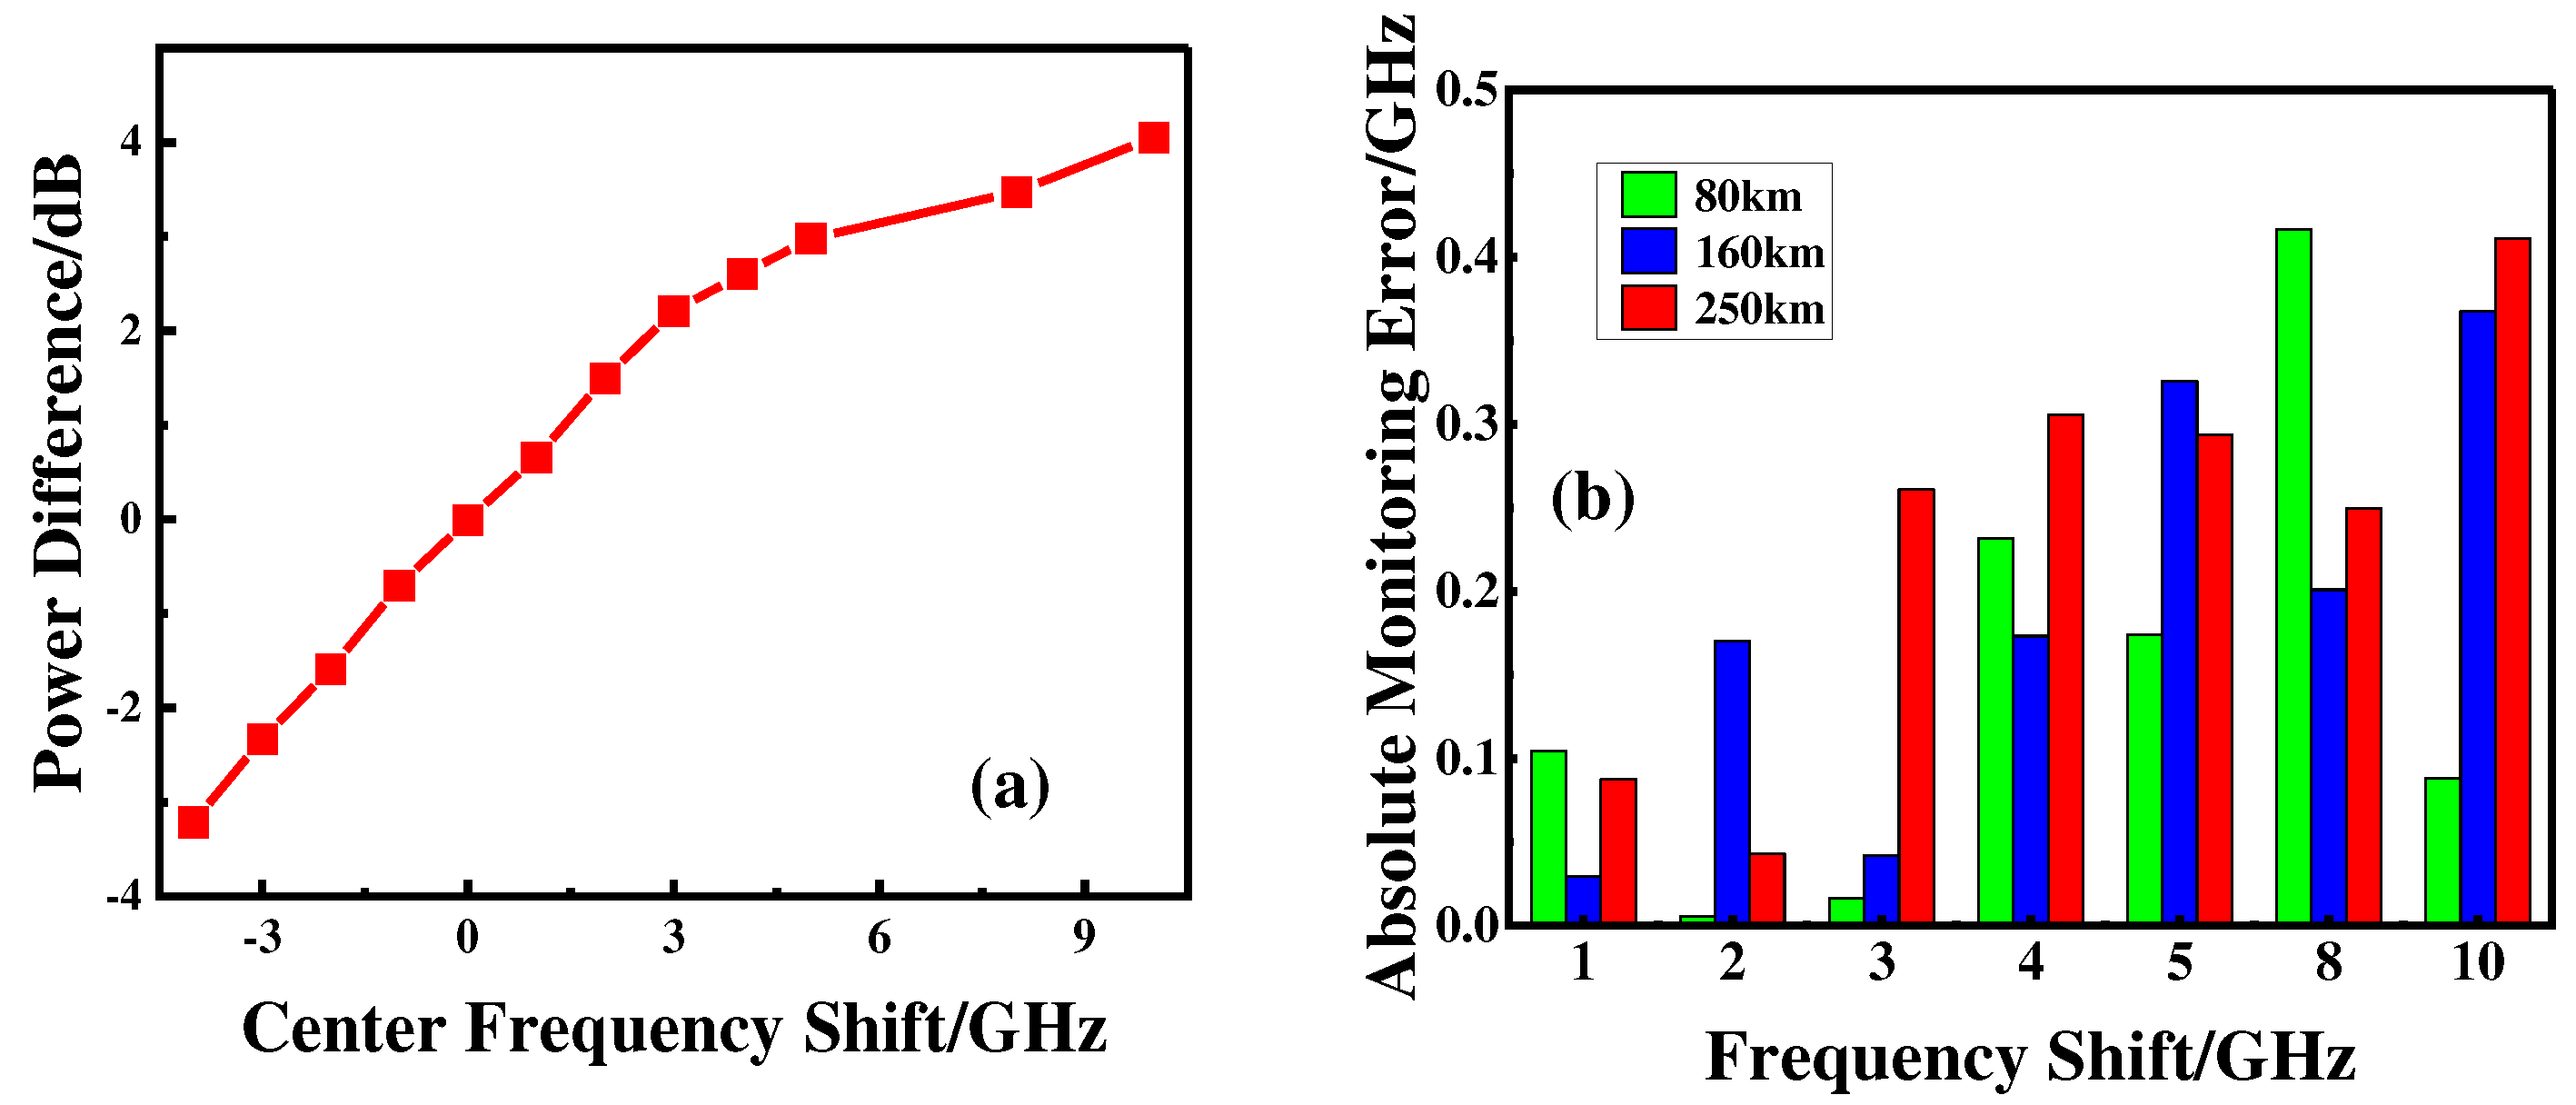
The results of frequency shift reference curve and monitoring in the experiments are shown in
Figure 11. The reference curve here is slightly different from the simulation, mainly because the filtering conditions at this time are stricter than the simulation. When the frequency offset exceeds 9GHz, most of the outside label used for monitoring is filtered out, so the reference curve becomes smooth increasingly. From the results after 80km to 250km transmission, the filtering shift generated by the WSS filters can be effectively monitored, and the maximum monitoring error of the experiment is not more than 0.5GHz.The monitoring error in the experience fluctuates within a small range, which is mainly caused by various types of damage such as chromatic dispersion, polarization dependent impairments and nonlinear effects in the fiber transmission.
Meanwhile, compared with the previous scheme mentioned in [
13,
14,
15,
16], the proposed scheme is not only able to effectively monitor and identify the frequency shift failure caused by optical filters or other filtering devices, but also improves the monitoring accuracy and reliability effectively. And the capability of the multi-channel online monitoring completes can be also achieved.
5. Conclusions
In this paper, a highly efficient and reliable monitoring scheme for the center frequency shift of filter devices inside optical networks was proposed and demonstrated. In this scheme, the service spectrum is divided into different sub-bands, making full use of the characteristics of the filter frequency shift that has a serious impact on the power attenuation of the high-frequency service band. By calculating the power difference between the labels loaded on the positive and negative outermost band of the service spectrum, the filter frequency shift condition can be effectively monitored. Moreover, the reference curve of frequency shift is reasonably optimized according to the number of different filters in the transmission, which brings more accurate monitoring results and less error. The simulation results show that the monitoring error proposed in this scheme can be kept below 0.5GHz if the filter center frequency shift occurs in the span after 10-span WDM transmission. In addition, the experimental results of fiber transmission from 80km to 250km also show that the monitoring error of frequency shift can be kept below 0.5GHz, and the bit information contained in the optical label can be correctly demodulated even a 10GHz relative frequency shift is generated. Meanwhile, the scheme only uses low bandwidth PD and low rate ADC combined with DSP algorithm to complete optical labels detection and processing, leading to low cost, high efficiency and reliable for monitoring, which makes it easier and more practical for future optical network implementations and applications.
Author Contributions
Conceptualization, K.L., Y.T. and X.C; methodology, K.L., T.Y. and X.W.; formal analysis, K.L. and T.Y.; investigation, K.L., T.Y. and S.S.; data curation, K.L., X.W. and L.W.; writing—original draft preparation, K.L. and T.Y.; writing—review and editing, K.L., T.Y.,L.W., and X.C.; visualization, K.L. and T.Y.; supervision, K.L., T.Y., X.W., S.S., L.W. and X.C.; project administration, T.Y and X.C.; All authors have read and agreed to the published version of the manuscript.
Funding
This research was funded by National Natural Science Foundation of China (No. 62001045); Fundamental Research Funds for the Central Universities(No. 2022RC09); State Key Laboratory of Information Photonics and Optical Communications (No. IPOC2021ZT17).
Institutional Review Board Statement
Not applicable
Informed Consent Statement
Not applicable.
Data Availability Statement
The data presented in this study are available on request from the corresponding author. The data are not publicly available due to the data also forms part of an ongoing study.
Acknowledgments
The authors express their appreciation to reviewers for their valuable suggestions.
Conflicts of Interest
The authors declare no conflict of interest.
References
- Torsoli, G.; Win, M. Z.; Conti, A. Blockage Intelligence in Complex Environments for Beyond 5G Localization. IEEE J. Sel. Areas. Commun. 2023, 41, 1688–1701. [Google Scholar] [CrossRef]
- Kodama, T.; Goto, T.; Nakagawa, T.; Matsumoto, R. Bypass/backup-link switchable coherent point-to-multipoint configured WDM-PON system with shared protection. Opt. Express 2022, 30, 10502–10512. [Google Scholar] [CrossRef] [PubMed]
- Lord, A.; Savory, S. J.; Tornatore, M.; Mitra, A. Flexible Technologies to Increase Optical Network Capacity. Proc. IEEE 2022, 110, 1714–1724. [Google Scholar] [CrossRef]
- Ji, Y.; Zhang, J.; Xiao, Y.; Liu, Z. 5G flexible optical transport networks with large-capacity, low-latency and high-efficiency. China Commun. 2019, 16, 19–32. [Google Scholar] [CrossRef]
- Sarmiento, S.; Altabas, J. A.; Izquierdo, D.; Garces, I.; Spadaro, S.; Lazaro, J. A. Cost-Effective DWDM ROADM Design for Flexible Sustainable Optical Metro–Access Networks. J. Opt. Commun. Netw. 2017, 9, 1116–1124. [Google Scholar] [CrossRef]
- Rai, S.; Garg, A. K. Applications of machine learning techniques in next-generation optical WDM networks. J Opt. 2022, 51, 772–781. [Google Scholar] [CrossRef]
- Dong, Z.; Khan, F. N.; Sui, Q.; Zhong, K.; Lu, C.; Lau, A. P. T. Optical performance monitoring: A review of current and future technologies. J. Lightwave Technol. 2016, 34, 525–543. [Google Scholar] [CrossRef]
- Wang, D.; Jiang, H.; Liang, G.; Zhan, Q.; Mo, Y.; Sui, Q.; Li, Z. Optical performance monitoring of multiple parameters in future optical networks. J. Lightwave Technol. 2020, 39, 3792–3800. [Google Scholar] [CrossRef]
- Pan, J.; Tibuleac, S. Real-time ROADM filtering penalty characterization and generalized precompensation for flexible grid networks. IEEE Photonics J. 2017, 9, 1–10. [Google Scholar] [CrossRef]
- Gu, R.; Yang, Z.; Ji, Y. Machine learning for intelligent optical networks: A comprehensive survey. J. Netw. Comput. Appl. 2020, 157, 102576. [Google Scholar] [CrossRef]
- Vela, A. P.; Ruiz, M.; Fresi, F.; Sambo, N.; Cugini, F.; Meloni, G.; Luca, P.; Velasco, L.; Castoldi, P. BER degradation detection and failure identification in elastic optical networks. J. Lightwave Technol. 2017, 35, 4595–4604. [Google Scholar] [CrossRef]
- Furdek, M.; Natalino, C.; Lipp, F.; Hock, D.; Di Giglio, A.; Schiano, M. ; Machine learning for optical network security monitoring: A practical perspective. J. Lightwave Technol. 2020, 38, 2860–2871. [Google Scholar] [CrossRef]
- Shariati, B.; Ruiz, M.; Comellas, J.; Velasco, L. Learning from the optical spectrum: failure detection and identification. J. Lightwave Technol. 2019, 37, 433–440. [Google Scholar] [CrossRef]
- Lun, H.; Liu, X.; Cai, M.; Wu, Y.; Fu, M.; Yi, L.; Hu, W.; Zhuge, Q. GAN based soft failure detection and identification for long-haul coherent transmission systems. In Proceedings of the 2021 Optical Fiber Communications Conference and Exhibition (OFC), San Francisco, CA, USA, 6–11 June 2021; pp. 1–3. [Google Scholar]
- Lun, H.; Fu, M.; Liu, X.; Wu, Y.; Yi, L.; Hu, W.; Zhuge, Q. Soft failure identification for long-haul optical communication systems based on one-dimensional convolutional neural network. J. Lightwave Technol. 2020, 38, 2992–2999. [Google Scholar] [CrossRef]
- Jiang, Z.; Gao, G.; Tang, X.; Jin, D.; Si, M.; Zhu, D. Demonstration of real-time filter fault identification and localization using dual-band pilot tone detection enabled by an ASIC chip. In Proceedings of the 45th European Conference on Optical Communication (ECOC 2019), Dublin, Ireland, 22–26 September 2019; pp. 1–3. [Google Scholar]
- Yang, C.; Li, X.; Luo, M.; He, Z.; Li, H.; Li, C.; Yu, S. Optical Labelling and Performance Monitoring in Coherent Optical Wavelength Division Multiplexing Networks. In Proceedings of the 2020 Optical Fiber Communications Conference and Exhibition (OFC), San Diego, CA, USA, 8–12 March 2020; pp. 1–3. [Google Scholar]
- Du, J.; Yang, T.; Shi, S.; Chen, X.; Wang, J. Optical Label-enabled Low-cost DWDM Optical Network Performance Monitoring Using Novel DSP Processing. In Proceedings of the Asia Communications and Photonics Conference (ACP2020), Beijing, China, 24–27 October 2020; pp. 1–3. [Google Scholar]
- Yang, T.; Li, K.; Liu, Z.; Wang, X.; Shi, S.; Wang, L.; Chen, X. Optical Labels Enabled Optical Performance Monitoring in WDM Systems. Photonics 2022, 9, 647. [Google Scholar] [CrossRef]
- Jiang, Z.; Tang, X.; Wang, S.; Gao, G.; Jin, D.; Wang, J.; Si, M. Progresses of pilot tone based optical performance monitoring in coherent systems. J. Lightwave Technol. 2022, 40, 3128–3136. [Google Scholar] [CrossRef]
- Wang, J.; Yang, T. ; Shi, S; Du, J. In ; Liu, Z. Low-cost WDM Wavelength Channel Optical Power Monitoring based on PAM4 Optical Labels. In Proceedings of the Asia Communications and Photonics Conference (ACP2021), Shanghai, China, 24–27 October 2021; pp. 1–3. [Google Scholar]
- Liu, Z.; Yang, T.; Shi, S.; Du, J.; Wang, J. A Highly Reliable Timing Error Tolerated Optical Label Demodulation Algorithm for WDM Optical Network Monitoring. In Proceedings of the Asia Communications and Photonics Conference (ACP2021), Shanghai, China, 24–27 October 2021; pp. 1–3. [Google Scholar]
|
Disclaimer/Publisher’s Note: The statements, opinions and data contained in all publications are solely those of the individual author(s) and contributor(s) and not of MDPI and/or the editor(s). MDPI and/or the editor(s) disclaim responsibility for any injury to people or property resulting from any ideas, methods, instructions or products referred to in the content. |
© 2023 by the authors. Licensee MDPI, Basel, Switzerland. This article is an open access article distributed under the terms and conditions of the Creative Commons Attribution (CC BY) license (http://creativecommons.org/licenses/by/4.0/).
