
Submitted:
28 September 2023
Posted:
28 September 2023
You are already at the latest version
Abstract
In recent years, in order to serve as effective solutions to outdoor human thermal environments under the influence of urban heat islands, adaptation measures such as awnings, louvers, directional reflective materials, mist sprays, and evaporative materials have been developed. In this study, a simplified evaluation framework for adaptation measures to urban heat islands is examined. Adaptation measures to urban heat islands are classified into the following three categories; measures to reduce solar radiation incident on the human body, measures to control and cool ground and wall surface temperature, and measures to control and cool air temperature and human body. Case studies are conducted to evaluate the effects of the implementation of cool water circulation sunshade and to examine the adverse effects of cool pavements on the human thermal environment, in addition to the effects of mist sprays on the human body. The effect of the sunshade, watering road, and mist spray, which are typical adaptation measures to urban heat islands, on the human thermal environment was estimated using Wet Bulb Globe Temperature (WBGT) as an indicator for heat stroke prevention and Standard New Effective Temperature (SET*) as an indicator for thermal comfort assessment.
Keywords:
adaptation measure
; urban heat island
; outdoor human thermal environment
; mist spray
; sunshade
; watering road
1. Introduction
In recent years, in order to serve as effective solutions to outdoor human thermal environments under the influence of urban heat islands, adaptation measures such as awnings, louvers, directional reflective materials, mist sprays, and evaporative materials have been developed. For example, Rossi et al. proposed an optimized awning with aluminized polyester film and evaluated it using the modified Physiological Equivalent Temperature [1,2]. Sakai et al. proposed a fractal-shaped sunshade consisting of many Sierpinski tetrahedron units and tested in in some full-scale experiments, then they showed that fractal-shaped sunshades provide a comfortable environment and significantly reduce heat stress in urban areas [3]. Ulpiani reviewed studies on the effects of mist spraying and organized the cooling effect of air temperature by mist spraying [4]. The Japanese Ministry of the Environment developed the ‘Heat countermeasure guideline in the city’ [5]. In the guideline, adaptation measures are classified into the following categories: solar radiation shielding (top), ground surface heat control/cooling (bottom), wall surface heat control/cooling (side), and air/body cooling (middle). The effects of each measure on the reduction of heat index (WBGT, Wet Bulb Globe Temperature) and sensible temperature (SET*, Standard New Effective Temperature) are summarized. The author has conducted measurement and simulation studies of the effects of sunshades, mist spraying, water sprinkling, and water surfaces etc. in cooperation with Kobe City, one Japanese local government [6,7]. Then, Kobe City has begun to actively adopt them in redevelopment projects in front of its main station [8-11]. Since the advanced efforts by Kobe City are of interest at least domestically, it is necessary to develop a simple evaluation method for the effects of the implementation of these measures in order to expand their use to other regions. The author studied a simple evaluation method for solar radiation shielding and ground, wall surface cover improvement measures that are expected to be effective against heat [12]. These measures correspond to the "top”, "bottom" and “side” in the above-mentioned guideline classification. In this study, it was extended to “middle” and a simple method to evaluate the effect of mist spraying was examined. In addition, case studies were conducted to examine the adverse effects of cool pavements on the human thermal environment and to evaluate the effects of the implementation of cool water circulation sunshade.
2. Evaluation framework of adaptation measures for urban heat island
2.1. Measures to reduce solar radiation incident on the human body (tree shade, shading, awning, retroreflective facade, etc.)
The Mean Radiation Temperature MRT [K] is calculated from equation (1), taking into account solar radiation J [W/m2] and infrared radiation εσTi4 [W/m2] to the human body. The surface temperature Ts [°C] of the solar radiation shield is calculated by the heat budget equation in equation (2) and is reflected in equation (1). Direct, diffused, and reflected solar radiation Jdir, Jdif, Jref [W/m2] are included in the solar radiation incident on the human body J [W/m2]. Transmittance τ [-] of the solar radiation shield is taken into account for direct solar radiation Jdir [W/m2].
where ah is solar absorptance of the human body [-], ε is emissivity [-], σ is Stefan-Boltzmann constant 5.67×10⁻⁸ [W/(m2K4)], Φi is view factor between human body and objective surface [-], Ti is surface temperature [K], a is absorptance of solar radiation shield [-], q is atmospheric radiation [W/m2], l is latent heat of water evaporation [J/g], E is evaporation flux [g/(m2s)], α is convection heat transfer coefficient between solar radiation shield and air [W/(m2K)] and Ta is air temperature [°C]. The main parameters are as follows (Figure 1):
MRT = (ahJ/εσ + ΣΦiTi4)1/4,
Ts = (aJ + εq - lE)/ α + Ta,
J = Jdir + Jdif + Jref,
- -
- Absorptance and transmittance of the solar radiation shield a, τ [-]
- -
- Evaporation flux E [g/(m2s)] or Evaporation efficiency β [-]
- -
- Convection heat transfer coefficient α [W/(m2K)]
- -
- View factor between human body and objective surface Φ [-]
The implementation of these measures reduces the direct solar radiation Jdir [W/m2] incident on the human body, thereby providing an effect of measures to prevent overheating. However, deterioration of the human thermal environment due to increased infrared radiation εσT4 [W/m2] from the solar radiation shield to the human body must be considered. The surface temperature Ts [°C] of the solar radiation shield does not increase when the solar radiation absorptance a [-] is small, i.e., when the solar radiation reflectance ρ [-] or transmittance τ [-] is large. In other cases, it is reduced by a large convective heat transfer coefficient α [W/(m2K)] as in the case of a fractal-shaped sunshade [3], or by a large evaporative latent heat flux lE [W/m2] by supplying water. The study results of changing these parameters (a, τ, E, α, Φ) were reported in a previous study by the author [12].
2.2. Measures to control and cool ground and wall surface temperature (water retention surface, reflection surface, greening, evaporative cooling louver, etc.)
It is mainly evaluated based on the radiation and heat budget on the objective surface. The surface heat budget equation is as follows.
where S is solar radiation [W/m2], R is infrared radiation [W/m2], V is sensible heat flux [W/m2], A is conduction heat flux [W/m2], and lE is latent heat flux [W/m2]. ρ is solar reflectance [-]. J [W/m2] is incident solar radiation. R↓[W/m2] is calculated by Brunt’s formula (equation (10)) using air temperature and relative humidity. ε is emissivity [-]. σ is Stefan–Boltzmann constant (=5.67 × 10⁻⁸ [W/(m2K4)]). Ts and Ta are surface and air temperature [K]. P is water vapor pressure of air [kPa]. αc is convection heat transfer coefficient [W/(m2K)] which is calculated by Jürges formula (equation (11)) using wind velocity u [m/s]. θs and θa are surface and air temperature [°C]. λ is heat conductivity of surface material [W/(mK)]. θ [°C] is temperature in surface material, which is calculated by solving an unsteady one-dimensional heat conduction equation, to take thermal mass into account. l is latent heat of water (=2500 [kJ/kg]). β is evaporative efficiency [-]. αw is convection moisture transfer coefficient [kg/(m2s(kg/kg’))], which is calculated by the Lewis relation formula using αc and specific heat of air. Xs and Xa are air absolute humidity and surface absolute humidity [kg/kg’]. The main parameters are as follows (Figure 2):
S + R = V + A + lE,
S = (1 - ρ) J,
R = R↓-εσTs4,
V = αc (θs - θa),
A = -λ∂θ/∂z,
lE = lβαw (Xs - Xa),
R↓= σTa4 (0.526 + 0.208√P),
αc = 5.3 + 3.6u (u≤5.0) or 6.47u0.78 (u≥5.0),
- -
- Solar reflectance ρ [-]
- -
- Evaporation flux E [g/(m2s)] or Evaporation efficiency β [-]
- -
- View factor between human body and objective surface Φ [-]
The implementation of these measures reduces the infrared radiation εσTs4 [W/m2] from the objective surface to the human body, thereby providing an effect of measures to prevent overheating. However, deterioration of the human thermal environment due to increased reflected solar radiation ρJ [W/m2] must be considered. In the case of louvers placed next to the human body, a solar radiation shielding effect can be expected, but measures on the ground or wall surface do not reduce the amount of solar radiation incident on the human body, so the countermeasure effect against heat is not significant.
2.3. Measures to control and cool air temperature and human body (fine mist spray, airflow fan, outdoor cooling, cooling bench, etc.)
Air temperature decrease Δθa [°C] and air humidity increase ΔXa [g/kg’] due to mist spraying with spray rate Q [g/s] are calculated from Equations (12) and (13).
where l is latent heat of water evaporation [J/g], cp is the specific heat of air [J/(gK)], γ is the density of air [g/m3], n is air change rate [1/s] and V is the volume [m3] of air in which mist evaporates. The main parameters are as follows (Figure 3):
Δθa = lQ/cpγnV,
ΔXa = cpΔθa/l,
- -
- Spray rate Q [g/s]
- -
- Air change rate n [1/s]
- -
- Volume of air V [m3]
The implementation of mist spray decreases air temperature θa [°C] and increases air humidity Xa [g/kg’] at constant enthalpy. The effect on the human thermal environment depends on the distance from the mist spray point to the human body and on the airflow conditions. In the case of airflow fans and outdoor cooling devices, the outlet temperature, humidity, and air speed from these devices are also defined, and their effects depend on the distance to the human body and the airflow conditions.
3. Case studies
3.1. Cool water circulation sunshade
The effect of circulating water that is cooler than the air temperature in summer, such as in rivers and oceans, to reduce the temperature rise of solar radiation shields was studied. In particular, a cooler sunshade was proposed by circulating cold water on the sunshade panel surface before returning it to the aquifer of a cooling system that uses aquifer heat storage [13,14]. Figure 4 shows the hourly air and dew point temperatures observed at the Osaka meteorological observatory from April to October 2020. The black plots are measurements taken between 9:00 and 17:00. Since condensation occurs at temperatures below 25 °C during the summer daytime, the circulating water temperature for sunshade panels is assumed to be 25 °C in practical operation.
Since the surface temperature of the sunshade without cold water circulation is calculated by equation (2), the equivalent outside temperature Te [°C] of the sunshade with cold water circulation is expressed by equation (14), and the cold water outlet temperature Tout [°C] relative to the cold water inlet temperature Tin [°C] and the heat loss from the sunshade panels Q [W/m2] are calculated by equations (15) and (16).
where K is the heat loss coefficient of the sunshade [W/(m2K)], As is the area of the sunshade [m2], C is the specific heat of water [J/(kgK)], and G is the circulating water flow rate [kg/s]. The meteorological data were obtained from the Osaka meteorological observatory from April to October 2020.
Te = (aJ + εq - lE)/ α + Ta,
Tout = Te - (Te - Tin)e(-KAs/CG),
Q = CG(Tout - Tin) ⁄ As,
Figure 5 shows the calculation result of outlet temperature Tout , when the cold water inlet temperature Tin = 25 °C, the area of the sunshade As = 100 m2, the circulating water flow rate G = 1 kg/s (= 60 l/min), the solar radiation absorptance of the sunshade a = 0.3, emissivity of the sunshade ε = 0.9, the heat loss coefficient of the sunshade K = 3 W/(m2K). The outlet temperature Tout increased to 26.5 °C, +1.5 °C compared to the inlet temperature Tin = 25 °C during the daytime (red plots) due to absorption of solar radiation and dissipation of heat to the surrounding air (the heat loss from the sunshade panels Q = 60 W/m2 at maximum), while it decreased to 23.5 °C (Tin - 1.5 °C) during the nighttime (blue plots) due to radiative cooling and dissipation of heat to the surrounding air. If a sufficient amount of water is supplied, the sun shade surface temperature is almost the same as the water supply temperature.
Figure 6 shows the calculation results of outlet temperature Tout when the sunshade area As, the circulating water flow rate G, the solar radiation absorptance of the sunshade a and the heat loss coefficient of the sunshade K are changed, in the case air temperature is 15, 20, 25, 30, 35 °C. The heat dissipation per unit area did not change when the sunshade area As was varied in the range shown in the horizontal axis of Figure 6, and was about -32.2, 3.7, and 39.7 W/m2 at 15, 25, and 35 °C of outdoor air temperatures, respectively. The sunshade area As has a linear effect on the increase in outlet temperature Tout. The change in outlet temperature Tout is smaller as the circulating water flow rate G increases in the range shown in the horizontal axis of Figure 6. A stable cooling effect can be obtained if the circulating water flow rate G is kept above 1.0 kg/s, which is the reference value. The outlet temperature Tout increases as the solar radiation absorptance a increases in the range shown in the horizontal axis of Figure 6. At an outside air temperature of 35 °C, Tout = 26.0 °C for the reference condition a = 0.3, while Tout = 25.7 °C for white a = 0.1 and Tout = 26.6 °C for black a = 0.9. The outlet temperature Tout increases as the heat loss coefficient of the sunshade K increases in the range shown in the horizontal axis of Figure 6. At an outside air temperature of 35 °C, Tout = 26.0 °C for the reference condition K = 3 W/(m2K), while Tout = 25.3 °C for K = 1 W/(m2K) and Tout = 26.6 °C for K = 5 W/(m2K). In conclusion, it can be considered that if adequate circulating water flow rate G is provided within the expected sunshade area As, the effect of the cool water circulation sunshade can be achieved, although it is slightly affected by solar radiation absorptance a, emissivity ε, and heat loss coefficient K.
Based on the above conditions, the MRT is calculated using equation (1) and is shown in Figure 7. The MRTs in the case of no cool water circulation are organized in relation to the solar transmittance τ and absorptance a of the sunshade, in the case that evaporation on sunshade E = 0, view factor between sunshade and human body Φ = 0.3. Plots are shown for sunshades with 18 °C to 38 °C cool water circulating over them. A sunshade with cool water circulating at 25 °C is slightly more effective than a white sunshade. Cool water circulation sunshade may have potential as an adaptation to the heat if the supply of cool water as a renewable energy source is readily available [15].
3.2. Adverse effects of reflective pavements on the human thermal environment
Figure 8 shows the infrared radiation εσTs4 [W/m2] from the ground surface calculated by ground surface heat budget equation (equation (4)) by changing the solar reflectance ρ on the ground surface. Emissivity ε, thermal conductivity λ, and heat capacity cpgγg were assumed to be 0.95, 0.74 W/(mK), and 2,056 kJ/(m3K), respectively, assuming asphalt. Observed data at the Osaka meteorological observatory from July 1 to September 30, 2020, were given for the meteorological conditions. During the summer daytime, the ground surface temperature on the black surface exceeds 60 °C, so the infrared radiation may exceed 700 W/m2. Calculations were conducted for evaporative efficiency β = 0.15 and solar reflectance ρ = 0.2, assuming a watering on the road. In this case, infrared radiation from the ground surface is comparable to that from the light-colored surface.
Figure 9 shows MRTs for various human body’s solar absorptance ah by changing solar reflectance ρ on ground surface, from July 1 to September 30, 2020 at Osaka meteorological observatory. Since the human body is strongly affected by reflected solar radiation from the ground surface when human body’s solar absorptance ah is large, MRT is high on the ground surface where solar reflectance ρ is high. In other words, highly reflective cool pavement is not recommended when people are not wearing bright clothing. When the human body’s solar absorptance ah is below 0.25, this means that the adverse effects of reflected solar radiation from the ground surface are not confirmed when people wear white clothing. However, in this case, the increase in reflected solar radiation associated with the increase in ground surface solar reflectance and the decrease in infrared radiation associated with the decrease in surface temperature are almost offset. Therefore, although the adverse effects of reflected solar radiation can be avoided if people wear white clothing, changing to a highly reflective cool pavement cannot improve the thermal environment of human body. However, as shown in Figure 9 (d), when the reflected solar radiation from the ground surface is zero, the highly reflective cool pavement is effective even if people wear dark-colored clothing. If highly reflective pavement surfaces that reflect only in specific directions, even when subject to abrasion by vehicles and people, can be easily introduced, there is potential for highly reflective cool pavement not only as a heat island mitigation measure, but also as an adaptation measure. However, in the present conditions, when high reflectance paint is applied to asphalt pavement surfaces, which are composed of aggregates with various shapes, the reflected solar radiation is reflected in various directions. Compared to the directional reflection ground surface case, the MRT reduction effect is greater when the person is under a sunshade such as a parasol, as shown in Figure 9 (e). It is essential to promote public knowledge of the importance of more personal clothing and sun-shading umbrella. Note that the view factors are 0.5 for the upper sky and the ground surface, and changing to 0.3 for the sunshade (0.2 for the upper sky).
3.3. Mist splay effects on the human body
Assuming that all the sprayed water evaporates in V = 0.5 x 0.5 x 0.5 [m3] and the air is exchanged at horizontal wind velocity of 1.0 [m/s], then Δθa = 2,500 Q/(1.0 x 1,200 x 1.0 x 0.5 x 0.5) = 8 Q [K] from equation (12). If the spray rate Q = 1.0 [g/s] (= 60 [ml/min]), Δθa = -8 [K], ΔXa = +3.2 [g/kg’] around the spray outlet. The air cooled and humidified by the mist spray is advected and diffused into the surrounding area. Those conditions are generally governed by the airflow field, except for the buoyancy effect due to temperature differences. Therefore, when the airflow field (u, v, w: wind velocity components [m/s], K: turbulent diffusion coefficient [m2/s] in equation (17)) obtained by CFD is given, the following advection-diffusion equation (equation (17)) are used to calculate the air temperature and humidity distributions (φ=θa, Xa).
,
The effect on the human thermal environment depends on the distance from the mist spray point to the human body and on the airflow conditions. Similar to mist spraying, in the case of airflow fans and outdoor cooling devices, the outlet temperature, humidity, and wind velocity from these devices are also defined, and their effects depend on the distance to the human body and the airflow conditions. Figure 10 shows the calculation results of air temperature and humidity vertical cross section distribution when mist is sprayed under the above assumptions for three typical public spaces (station plaza, park and bus stop) where people stay. It is calculated by the so-called box model with mesh sizes of 0.5 m, 0.5 m, and 0.5 m. The airflow distribution is provided by calculation results that take into account the building geometry using CFD [6]. The mist spraying effect can be evaluated under various conditions by changing the positional relationship between the mist spraying point and the human body, as well as the mist spraying rate. At station plaza and a bus stop where mist is sprayed from 3 and 4 meters above the ground, the cooling effect does not reach the human body on the ground due to the advection of the incoming wind, whereas at a park where mist is sprayed from 0.65 m above the ground, the cooling effect reaches the human body on the ground.
4. Discussion
In the ‘Heat countermeasure guideline in the city’ by the Japanese Ministry of the Environment [5], it was stated that the heat index (WBGT, Wet Bulb Globe Temperature [°C]) is a suitable indicator for heat stroke prevention and the sensitive temperature (SET*, Standard New Effective Temperature [°C]) is a suitable indicator for thermal comfort assessment. The author performed a sensitivity analysis of SET* and reported the relationships between air temperature Ta [°C], humidity RH [%], wind speed v [m/s], mean radiant temperature MRT [°C] and SET* as following equations.
ΔSET* / ΔTa = 0.63,
ΔSET* / ΔRH = 0.13,
ΔSET* / Δv = 1.4,
ΔSET* / ΔMRT = 0.21,
WBGT [°C] is calculated by equation (22), where Tw is wet bulb temperature [°C] and Tg is black bulb temperature [°C]. The relationship between MRT and Tg is expressed in equation (23) using wind speed v and air temperature Ta. Therefore, the change in black bulb temperature ΔTg with changes in mean radiant temperature ΔMRT and air temperature ΔTa is expressed by equations (24) and (25).
WBGT = 0.7Tw + 0.2Tg + 0.1Ta,
MRT = Tg + 2.37v0.5(Tg - Ta),
ΔTg = 1/(1 + 2.37v0.5)ΔMRT = (0.3~0.5)ΔMRT,
ΔTg = 2.37v0.5/(1 + 2.37v0.5)ΔTa = (0.5~0.7)ΔTa,
For example, in the case of sunshade, the amount of solar radiation absorbed by the human body is reduced by about 100 W/m2, MRT is reduced by about 13 °C [12], SET* by about 0.21 × 13 = 2.7 °C (equation (21)), and WBGT by about 0.2 × 0.4 × 13 = 1.0 °C (equations (22), (24)). In the case of watering the road surface, the road surface temperature decreased by about 10 °C, MRT on the adjacent sidewalks decreased by about 2.4 °C [8,11], SET* by about 0.21 × 2.4 = 0.5 °C (equation (21)), and WBGT by about 0.2 × 0.4 × 2.4 = 0.2 °C (equations (22), (24)). In the case of mist spray, air temperature Ta decreases by about 2.0 °C, air humidity Xa increases by about 0.8 g/kg’, and the relative humidity RH increases by about 2.4 % [8,9], SET* by about 0.63 × 2.0 – 0.13 × 2.4 = 0.9 °C (equations (18), (19)), and WBGT by about 0.2 × 0.6 × 2.0 + 0.1 × 2.0 = 0.4 °C (equations (22), (25)). In this case, the wet bulb temperature Tw does not change because of the constant enthalpy change. Examples of these typical adaptation effects are summarized in Table 1.
5. Conclusions
In this study, a simplified evaluation framework for adaptation measures to urban heat islands is examined. Adaptation measures to urban heat islands are classified into the following three categories.
- -
- Measures to reduce solar radiation incident on the human body
- -
- Measures to control and cool ground and wall surface temperature
- -
- Measures to control and cool air temperature and human body
Case studies are conducted to evaluate the effects of the implementation of cool water circulation sunshade and to examine the adverse effects of cool pavements on the human thermal environment, in addition to the effects of mist sprays on the human body.
The effect of the sunshade, watering road, and mist spray, which are typical adaptation measures to urban heat islands, on the human thermal environment was estimated using WBGT as an indicator for heat stroke prevention and SET* as an indicator for thermal comfort assessment.
For example, in the case of sunshade, MRT varies with the view factor of the human body and the shielding, and in the case of watering road, MRT varies with the view factor of the human body and the watering surface, and WBGT, SET* vary as well. In the case of mist spray, air temperature and humidity vary with the distance from mist spray outlet to the human body, and WBGT, SET* vary as well. The main parameters for each category of adaptation measures are organized as follows, and it is possible to check the impact of each on the thermal environment indicators.
- -
- Measures to reduce solar radiation incident on the human body: absorptance and transmittance of the solar radiation shield a, τ [-], evaporation flux E [g/(m2s)] or evaporation efficiency β [-], convection heat transfer coefficient α [W/(m2K)], view factor between human body and objective surface Φ [-]
- -
- Measures to control and cool ground and wall surface temperature: solar reflectance ρ [-], evaporation flux E [g/(m2s)] or evaporation efficiency β [-], view factor between human body and objective surface Φ [-]
- -
- Measures to control and cool air temperature and human body: spray rate Q [g/s], air change rate n [1/s], volume of air V [m3]
The effects of sunshade and watering road are limited to the relationship between each measure and the location of the human body, but mist spraying requires more consideration of spatial distribution of air temperature and humidity, so a so-called box model was presented to simply evaluate advection-diffusion by giving the wind velocity distribution as a boundary condition.
Funding
This work was supported by JSPS KAKENHI Grant Number JP22H01651.
Acknowledgments
The authors thank Mr. Ushio Tozawa and Ms. Saeko Osaki of Kobe City, and Prof. Masaki Nakao of Osaka Metropolitan University for their cooperation.
Conflicts of Interest
The author declares no conflict of interest.
References
- Rossi, F.; Cardinali, M.; Gambelli, A. M.; Filipponi, M.; Castellani, B.; Nicolini, A. Outdoor thermal comfort improvements due to innovative solar awning solutions: An experimental campaign. Energy and Buildings 2020, 225, 110341. [Google Scholar] [CrossRef]
- Rossi, F.; Cardinali, M.; Giuseppe, A. D.; Castellani, B.; Nicolini, A. Outdoor thermal comfort improvement with advanced solar awnings: Subjective and objective survey. Building and Environment 2022, 215, 108967. [Google Scholar] [CrossRef]
- Sakai, S.; Nakamura, M.; Furuya, K.; Amemura, N.; Onishi, M.; Iizawa, I.; Nakata, J.; Yamaji, K.; Asano, R.; Tamotsu, K. Sierpinski’s forest: New technology of cool roof with fractal shapes. Energy and Buildings 2012, 55, pp–28. [Google Scholar] [CrossRef]
- Ulpiani, G. Water mist spray for outdoor cooling: A systematic review of technologies, methods and impacts. Applied Energy 2019, 254, 113647. [Google Scholar] [CrossRef]
- Ministry of the Environment Government of Japan, Heat Countermeasure Guideline in the City. Available online: https://www.wbgt.env.go.jp/pdf/city_gline/city_guideline_full.pdf (accessed on 26 September 2023).
- Takebayashi, H.; Okubo, M.; Danno, H. Thermal Environment Map in Street Canyon for Implementing Extreme High Temperature Measures. Atmosphere 2020, 11, 550–562. [Google Scholar] [CrossRef]
- Takebayashi, H.; Danno, H.; Tozawa, U. Study on appropriate heat mitigation technologies for urban block redevelopment based on demonstration experiments in Kobe city. Energy & Buildings 2021, 250. [Google Scholar]
- Takebayashi, H.; Danno, H.; Tozawa, U. Study on Strategies to Implement Adaptation Measures for Extreme High Temperatures into the Street Canyon. Atmosphere 2022, 13, 946. [Google Scholar] [CrossRef]
- Kyogoku, S.; Takebayashi, H. Experimental Verification of Mist Cooling Effect in Front of Air-Conditioning Condenser Unit, Open Space, and Bus Stop. Atmosphere 2023, 14, 177. [Google Scholar] [CrossRef]
- Kyogoku, S.; Takebayashi, H. Effects of Upward Reflective Film Applied to Window Glass on Indoor and Outdoor Thermal Environments in a Mid-Latitude City. Sustainability 2023, 15, 3848. [Google Scholar] [CrossRef]
- Takebayashi, H.; Mori, H.; Tozawa, U. Study on An Effective Roadway Watering Scheme for Mitigating Pedestrian Thermal Comfort According to the Street Configuration. Atmosphere 2023, 14, 1014. [Google Scholar] [CrossRef]
- Takebayashi, H. A simple method to evaluate adaptation measures for urban heat island. Environments 2018, 5, 70. [Google Scholar] [CrossRef]
- Yamamoto, S.; Nishioka, M.; Nabeshima, M.; Nakao, M.; Nakaso, Y.; Sakai, M.; Nakamura, K. Thermal energy storage air conditioning system utilizing aquifer, Performance study on air conditioning system combining direct use and heat source use with seasonal thermal energy storage. Journal of the Society of Heating, Air-Conditioning and Sanitary Engineers of Japan 2017, 248, pp–1. [Google Scholar]
- Nakao, M. Trends and practical scale demonstrations of aquifer thermal storage technology. District Heating and Cooling 2018, 120, pp–18. [Google Scholar]
- Nakao, M.; Nakai, M.; Nishioka, M.; Nabeshima, M.; Mori, N.; Yamochi, S. Use of thermal energy of bottom layer water in harbor during summer, Characteristics of vertical ocean water temperature distribution (part 1). Proceedings of the Annual Conference of the Society of Heating, Air-Conditioning and Sanitary Engineers of Japan 2007, 1733–1736. [Google Scholar]
Figure 1.
Main parameters of sunshade measure.
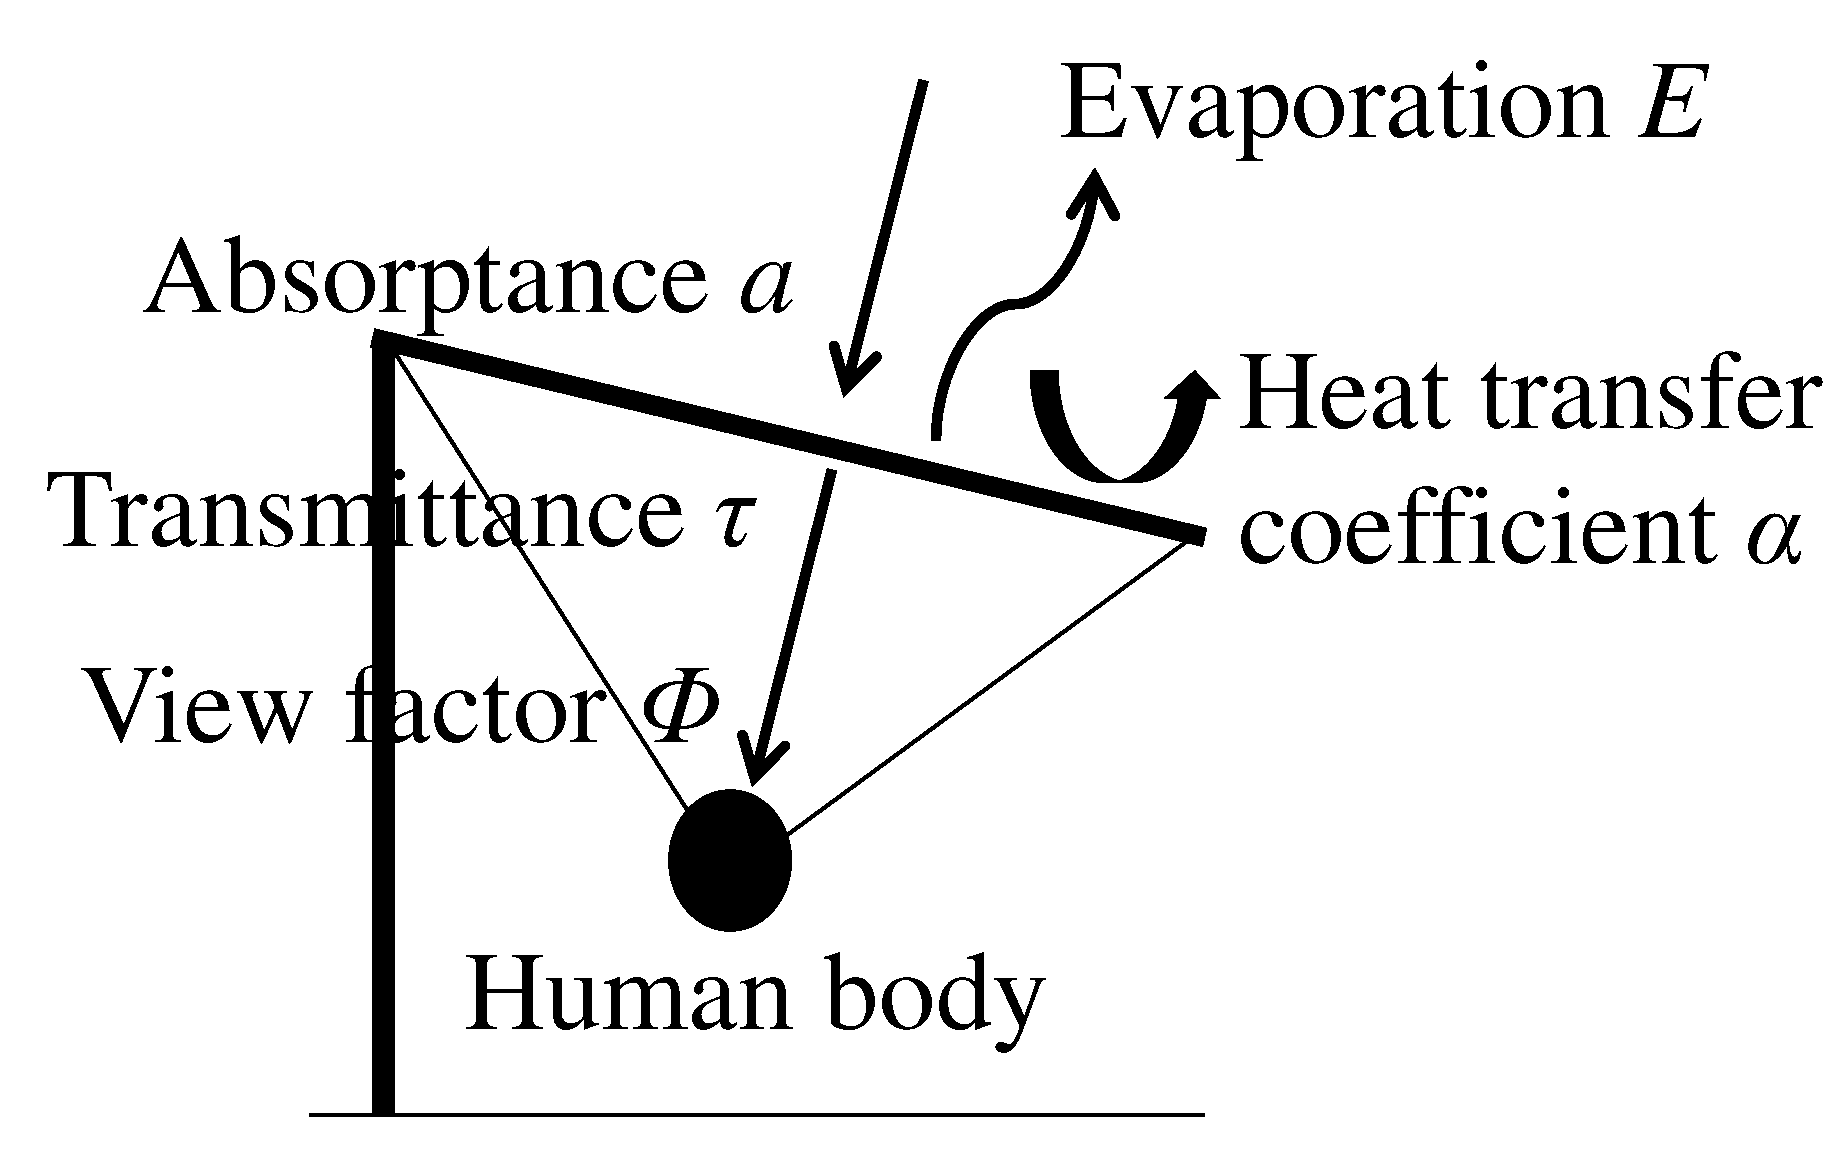
Figure 2.
Main parameters of surface cooling measure.
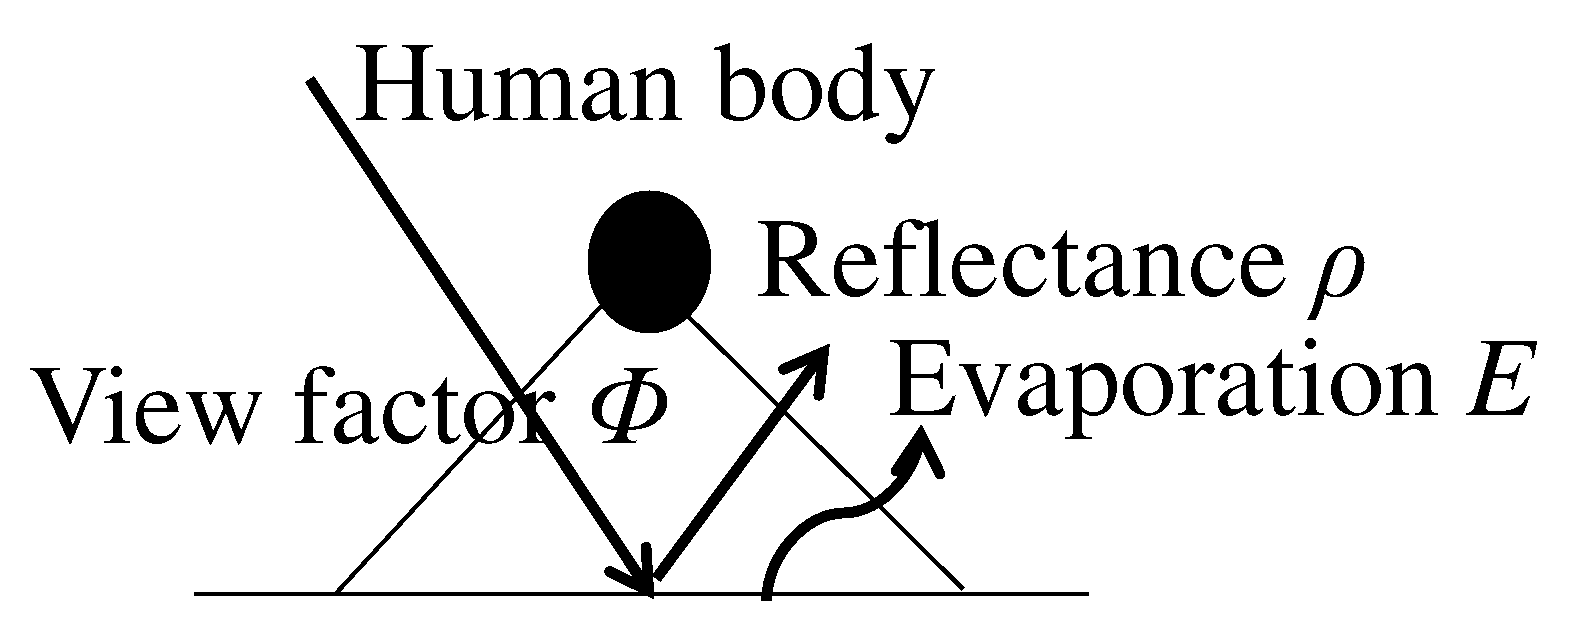
Figure 3.
Main parameters of air cooling measure.
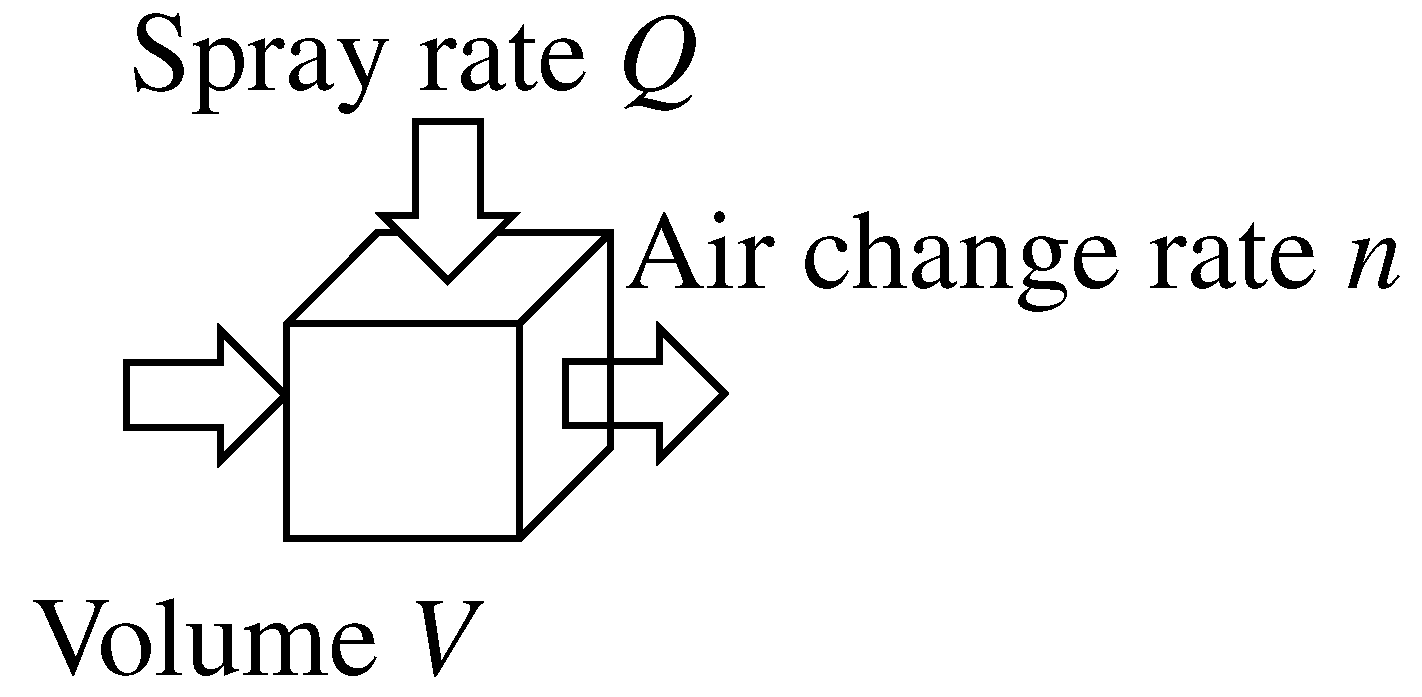
Figure 4.
Hourly air and dew point temperatures observed at the Osaka meteorological observatory from April to October 2020.
Figure 4.
Hourly air and dew point temperatures observed at the Osaka meteorological observatory from April to October 2020.
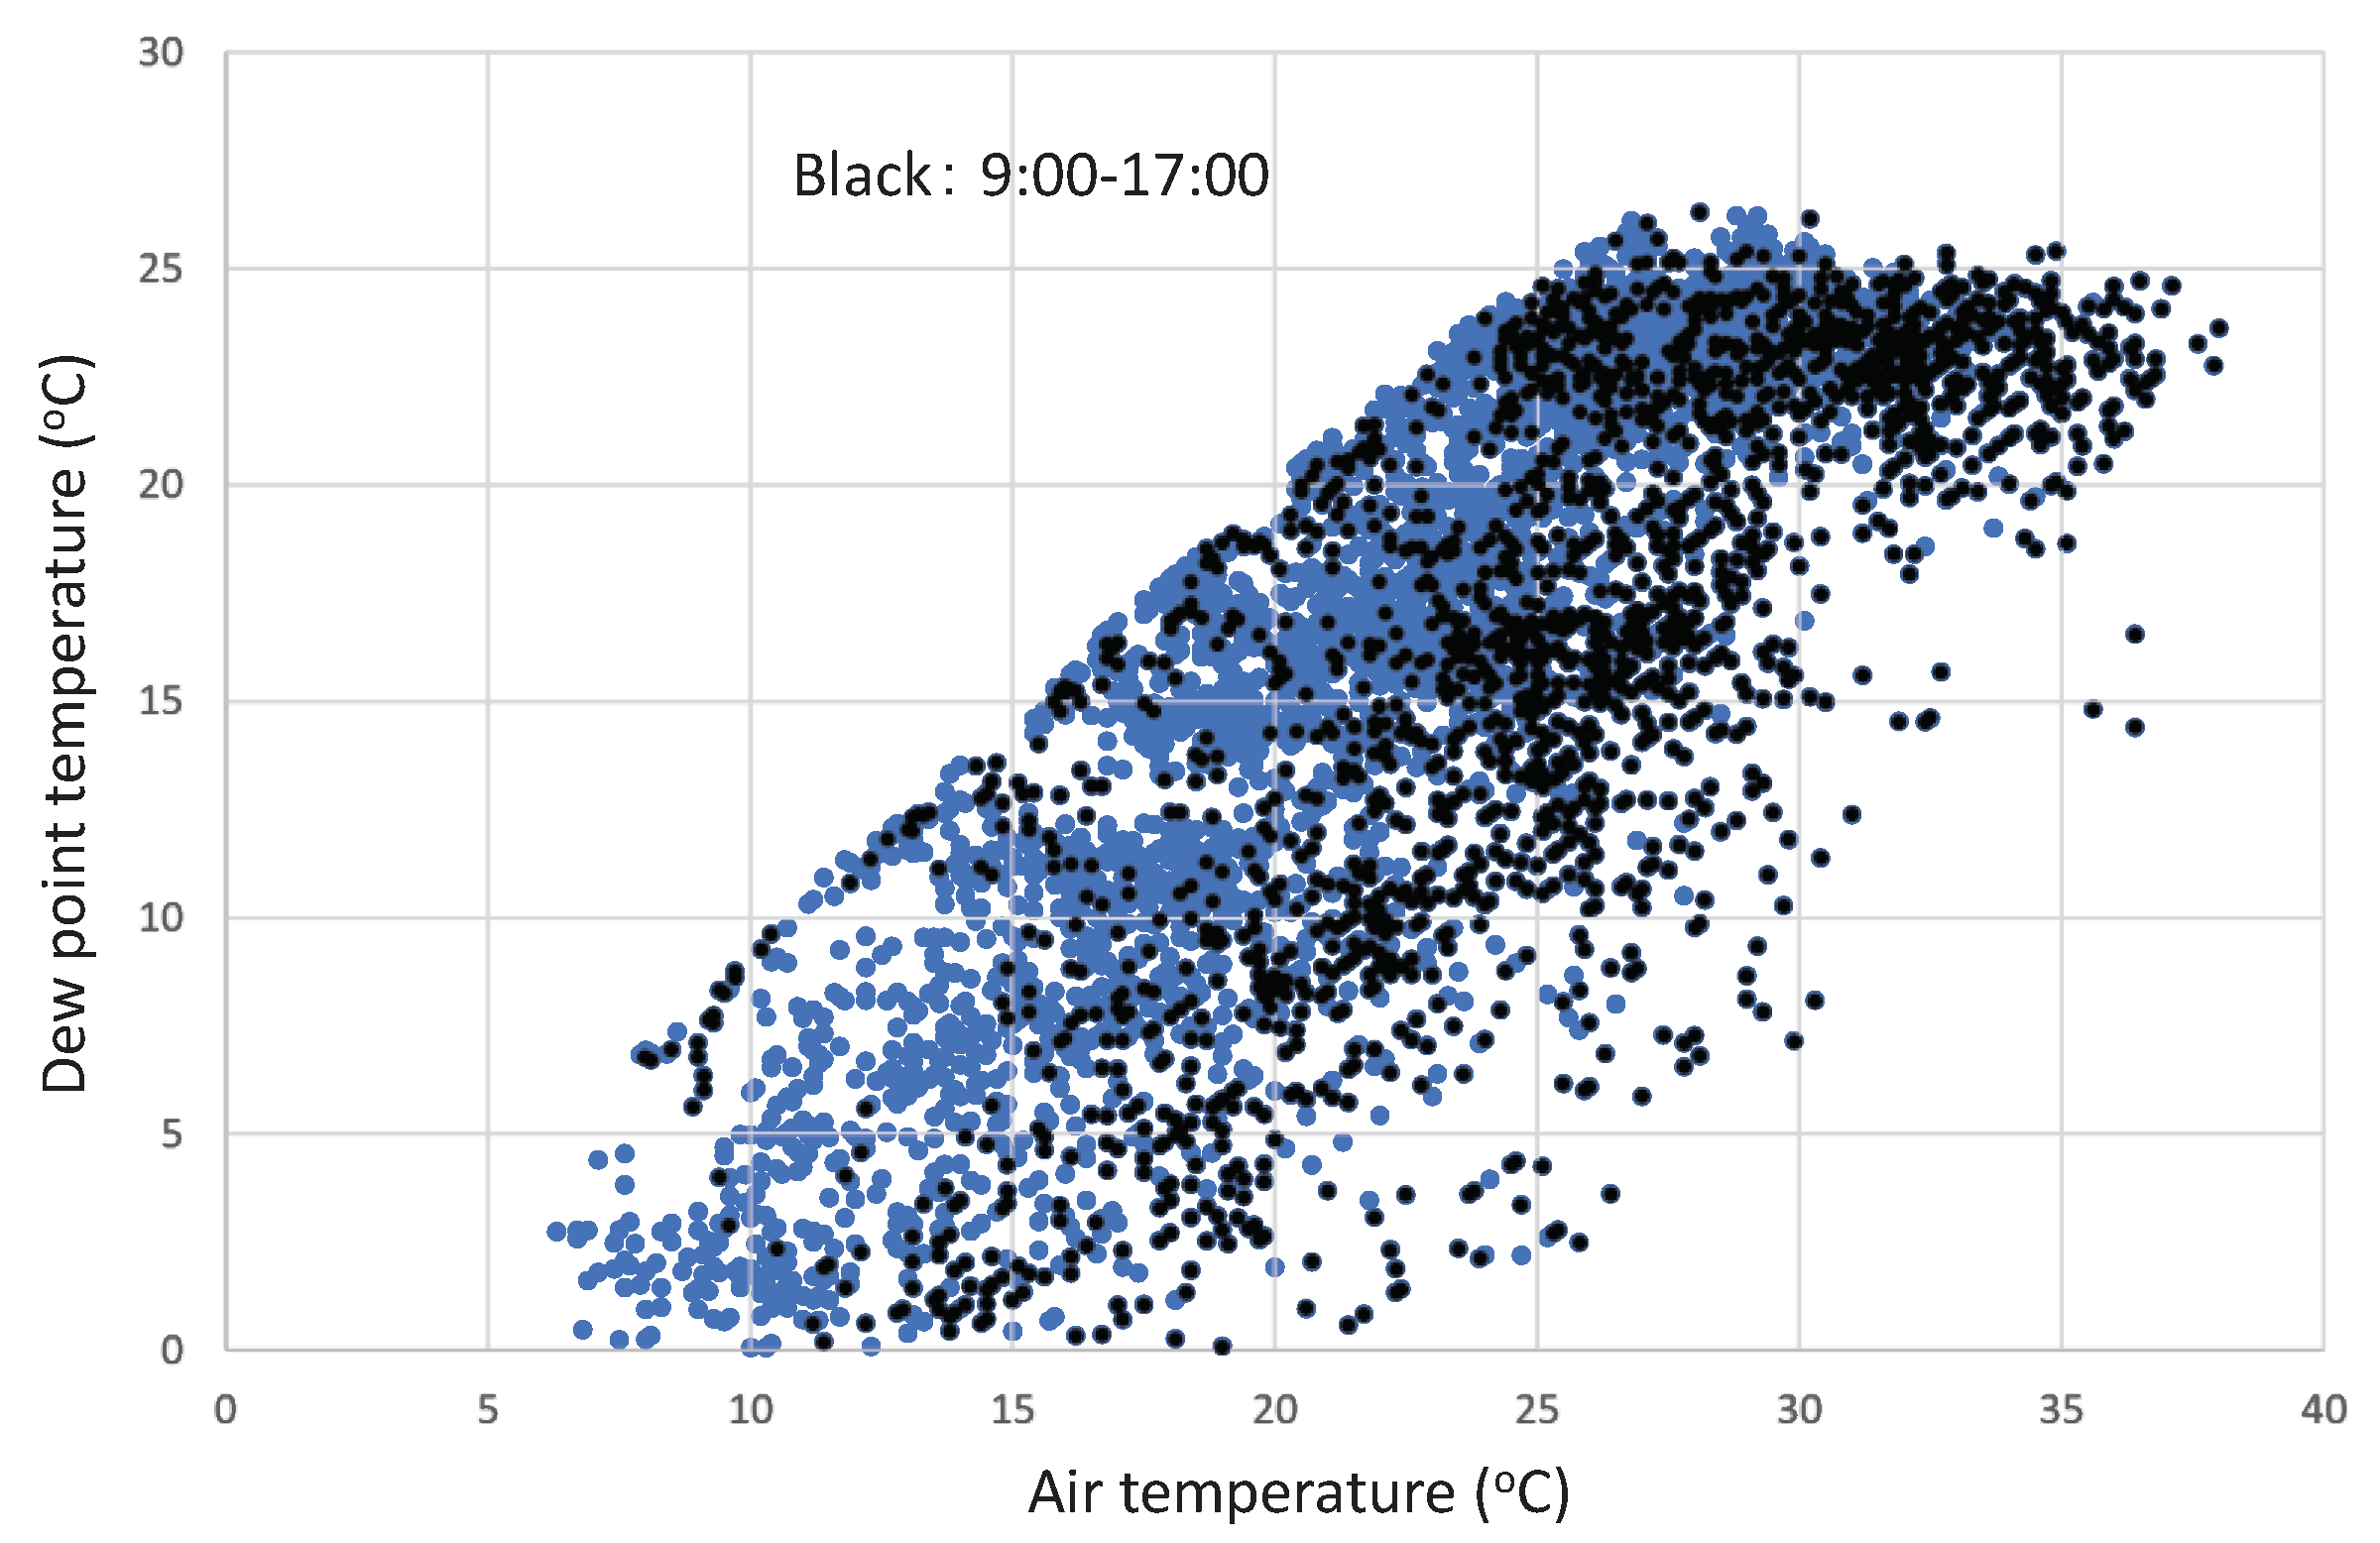
Figure 5.
Calculation result of outlet temperature Tout when Tin = 25 °C, As = 100 m2, G = 1 kg/s (= 60 l/min), a = 0.3, ε = 0.9, K = 3 W/(m2K).
Figure 5.
Calculation result of outlet temperature Tout when Tin = 25 °C, As = 100 m2, G = 1 kg/s (= 60 l/min), a = 0.3, ε = 0.9, K = 3 W/(m2K).
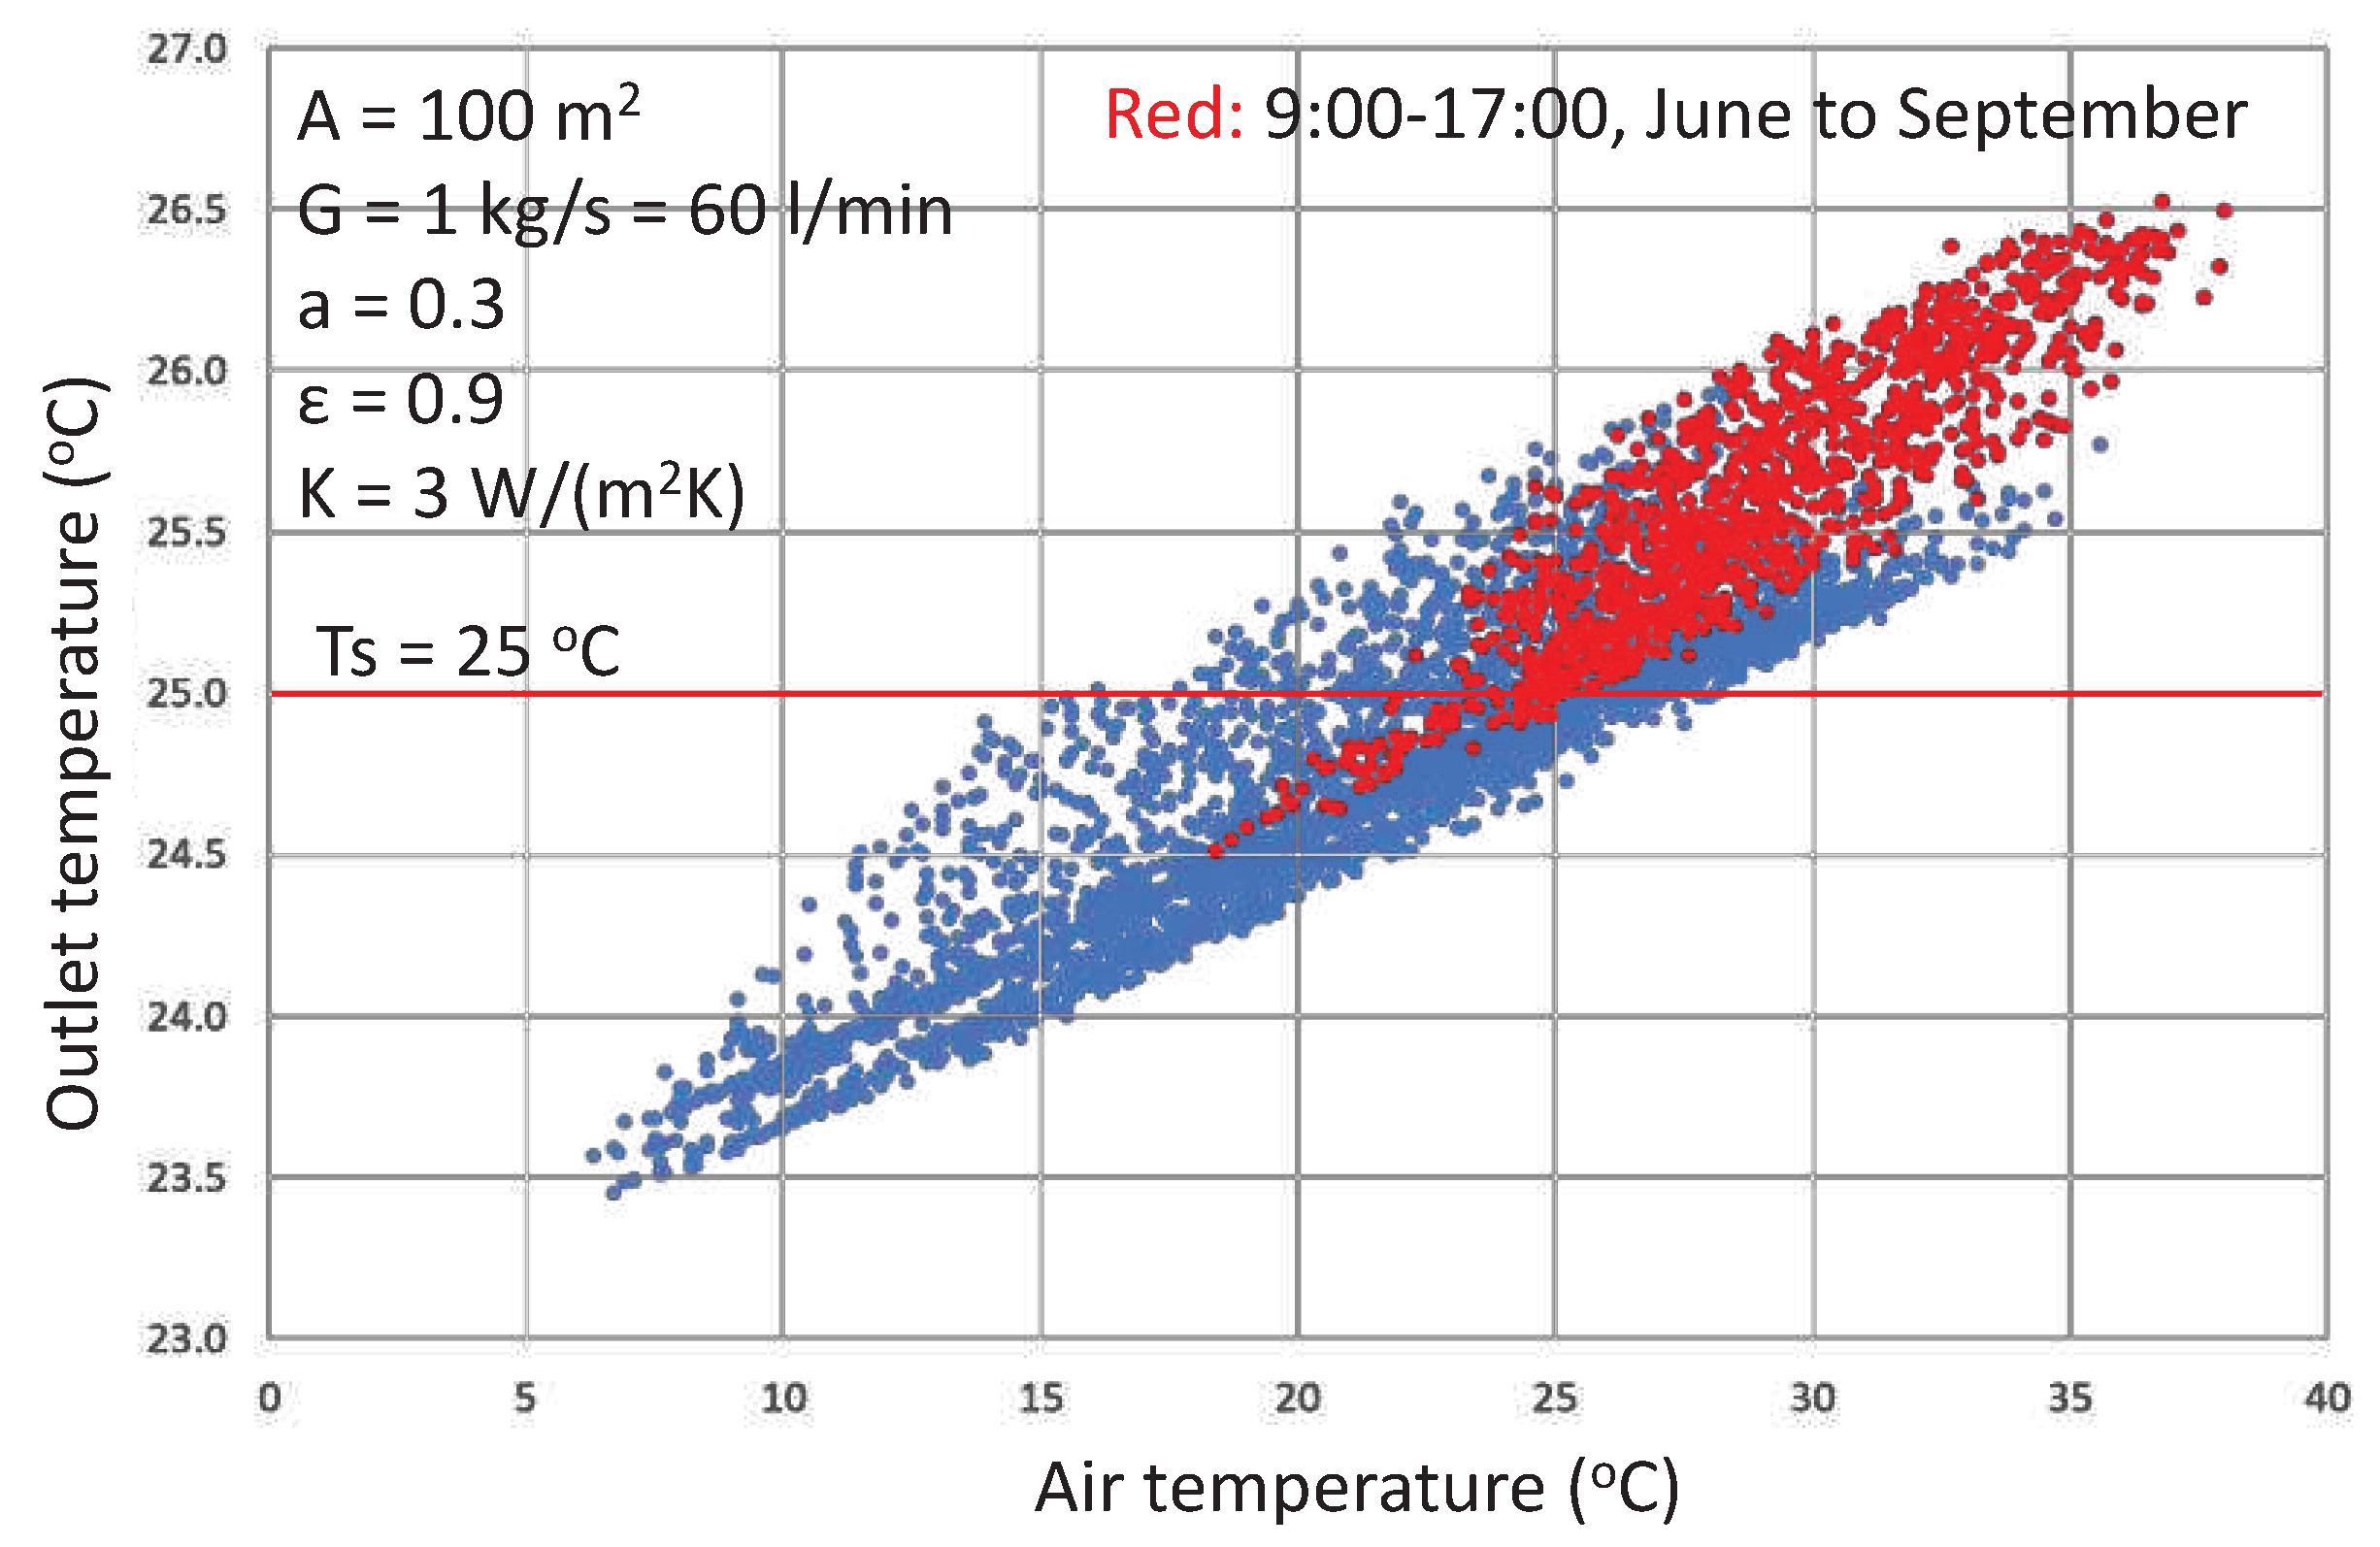
Figure 6.
Calculation result of outlet temperature Tout when the sunshade area As, the circulating water flow rate G, the solar radiation absorptance of the sunshade a and the heat loss coefficient of the sunshade K are changed, in the case air temperature is 15, 20, 25, 30, 35 °C.
Figure 6.
Calculation result of outlet temperature Tout when the sunshade area As, the circulating water flow rate G, the solar radiation absorptance of the sunshade a and the heat loss coefficient of the sunshade K are changed, in the case air temperature is 15, 20, 25, 30, 35 °C.
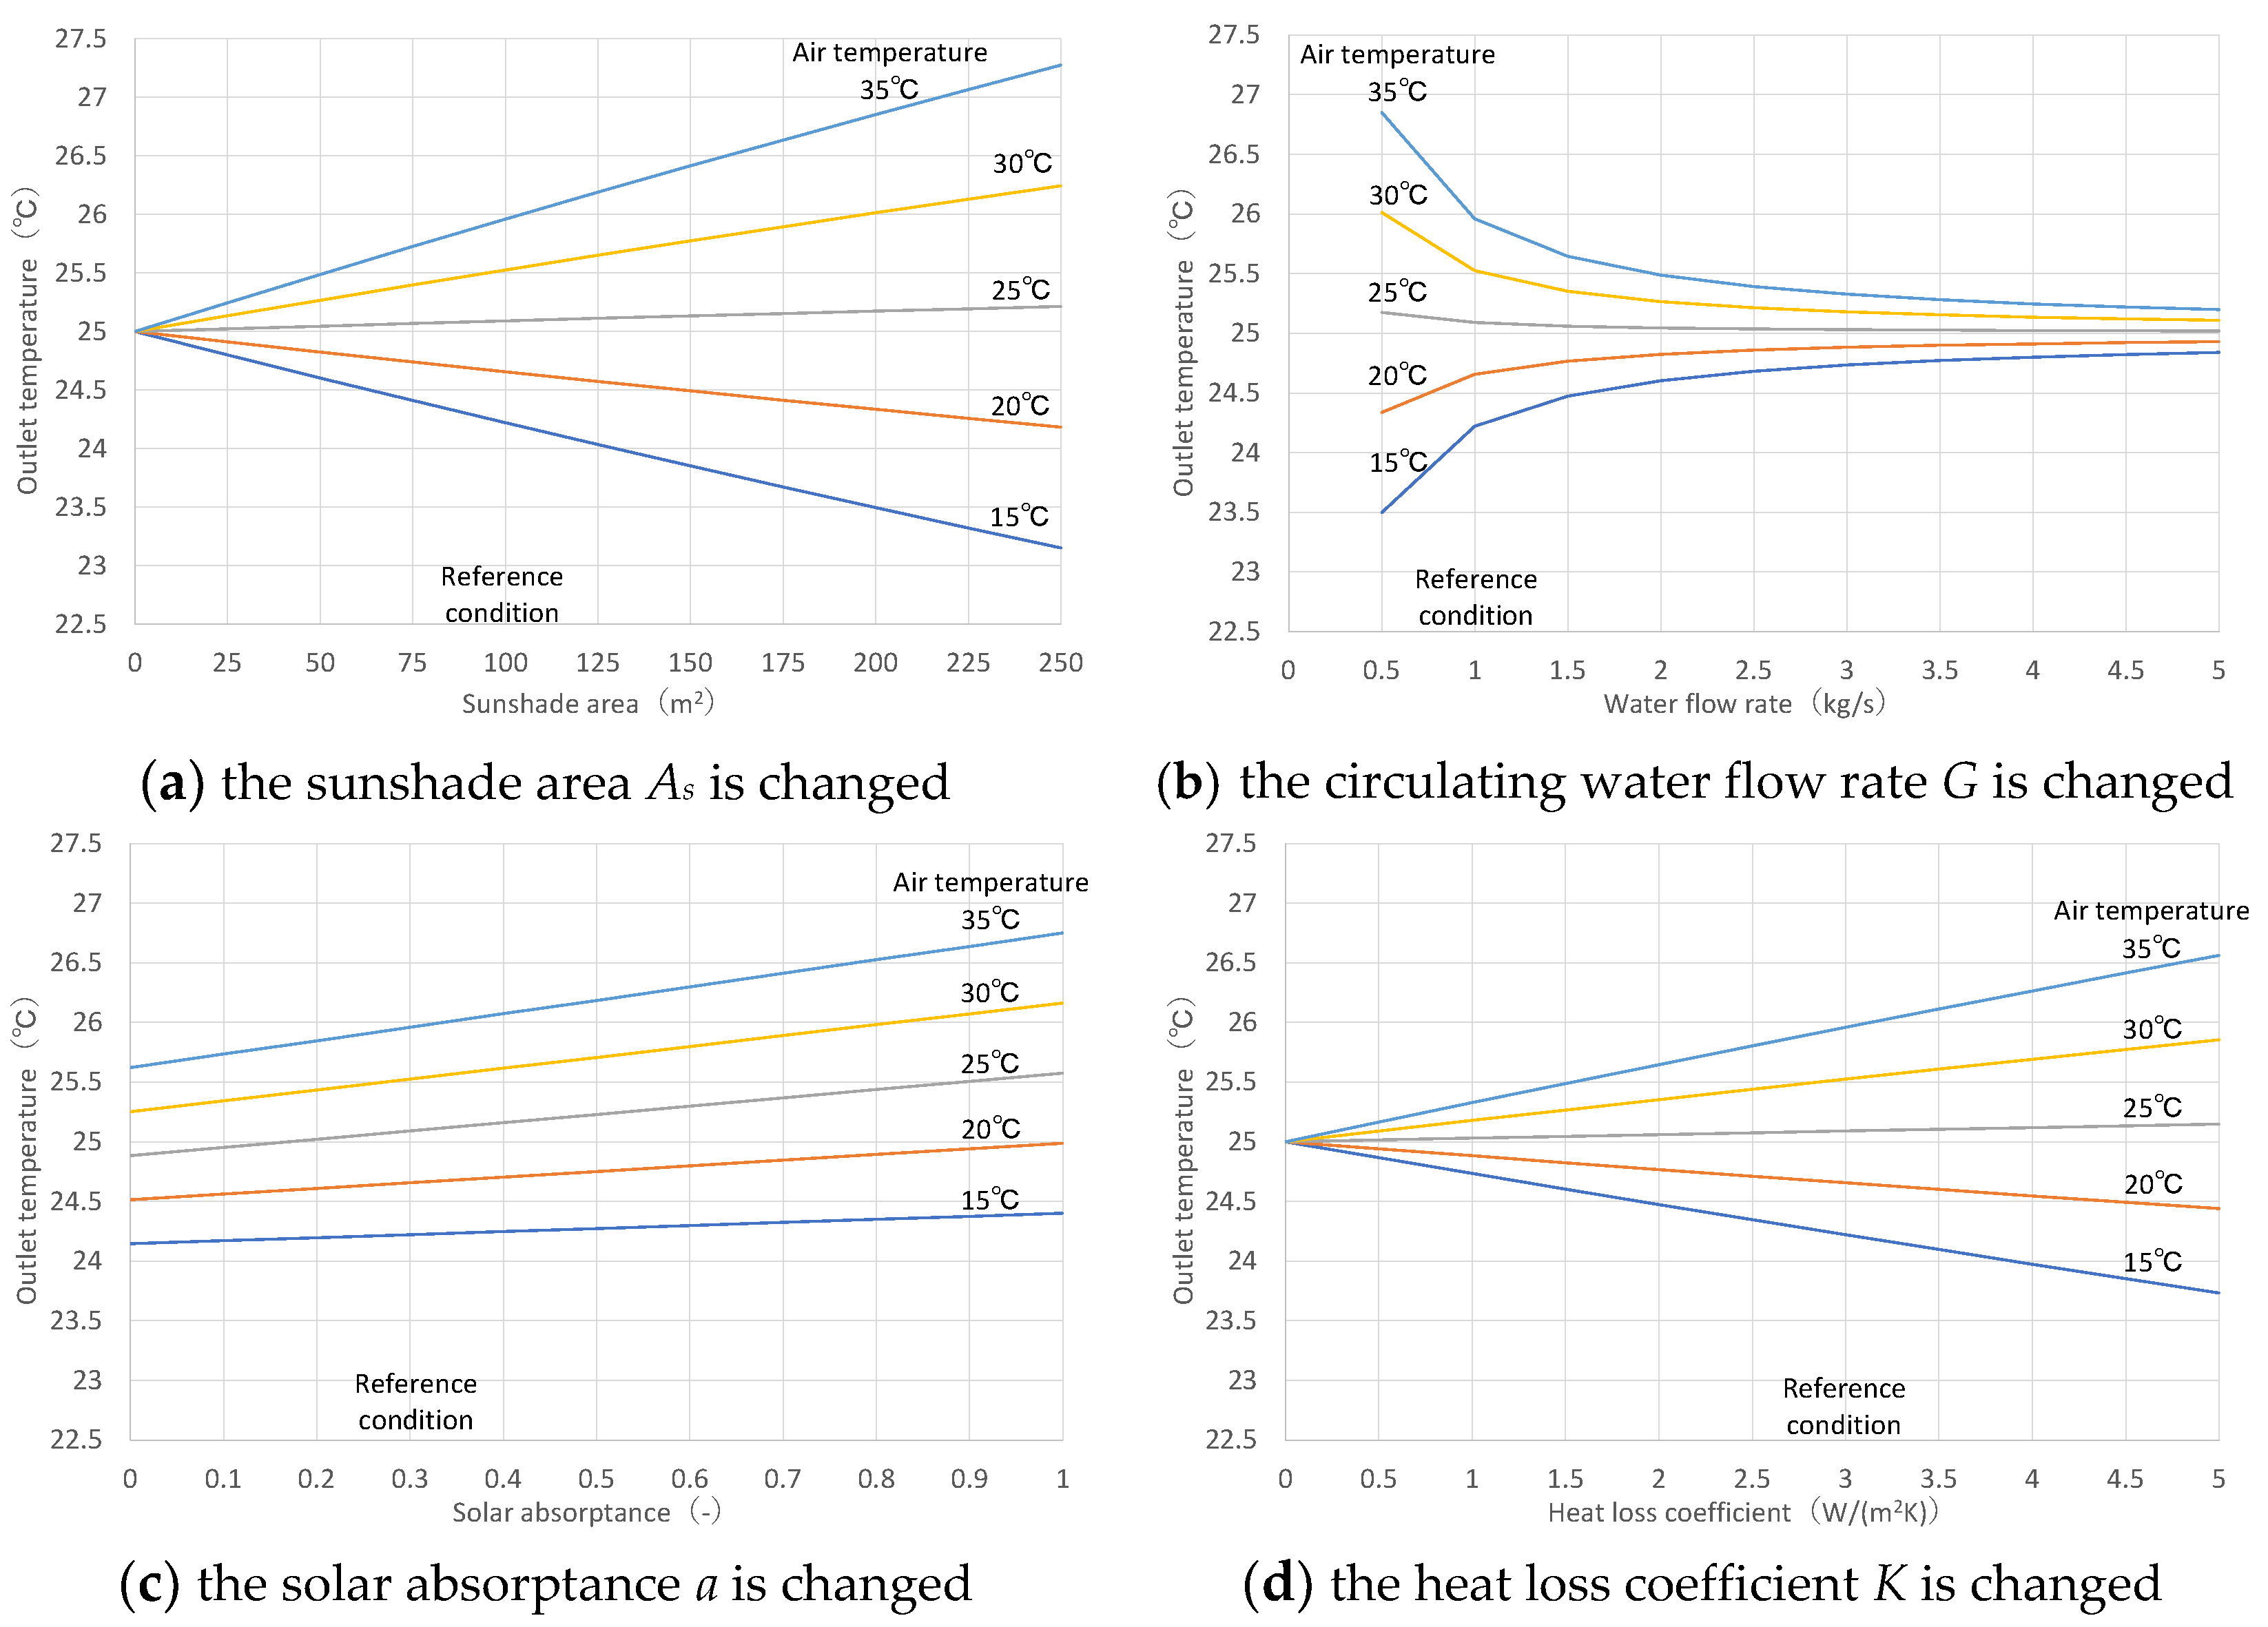
Figure 7.
Solar transmittance τ, absorptance a of the sunshade and MRT reduction (evaporation on sunshade E = 0, view factor between sunshade and human body Φ = 0.3).
Figure 7.
Solar transmittance τ, absorptance a of the sunshade and MRT reduction (evaporation on sunshade E = 0, view factor between sunshade and human body Φ = 0.3).
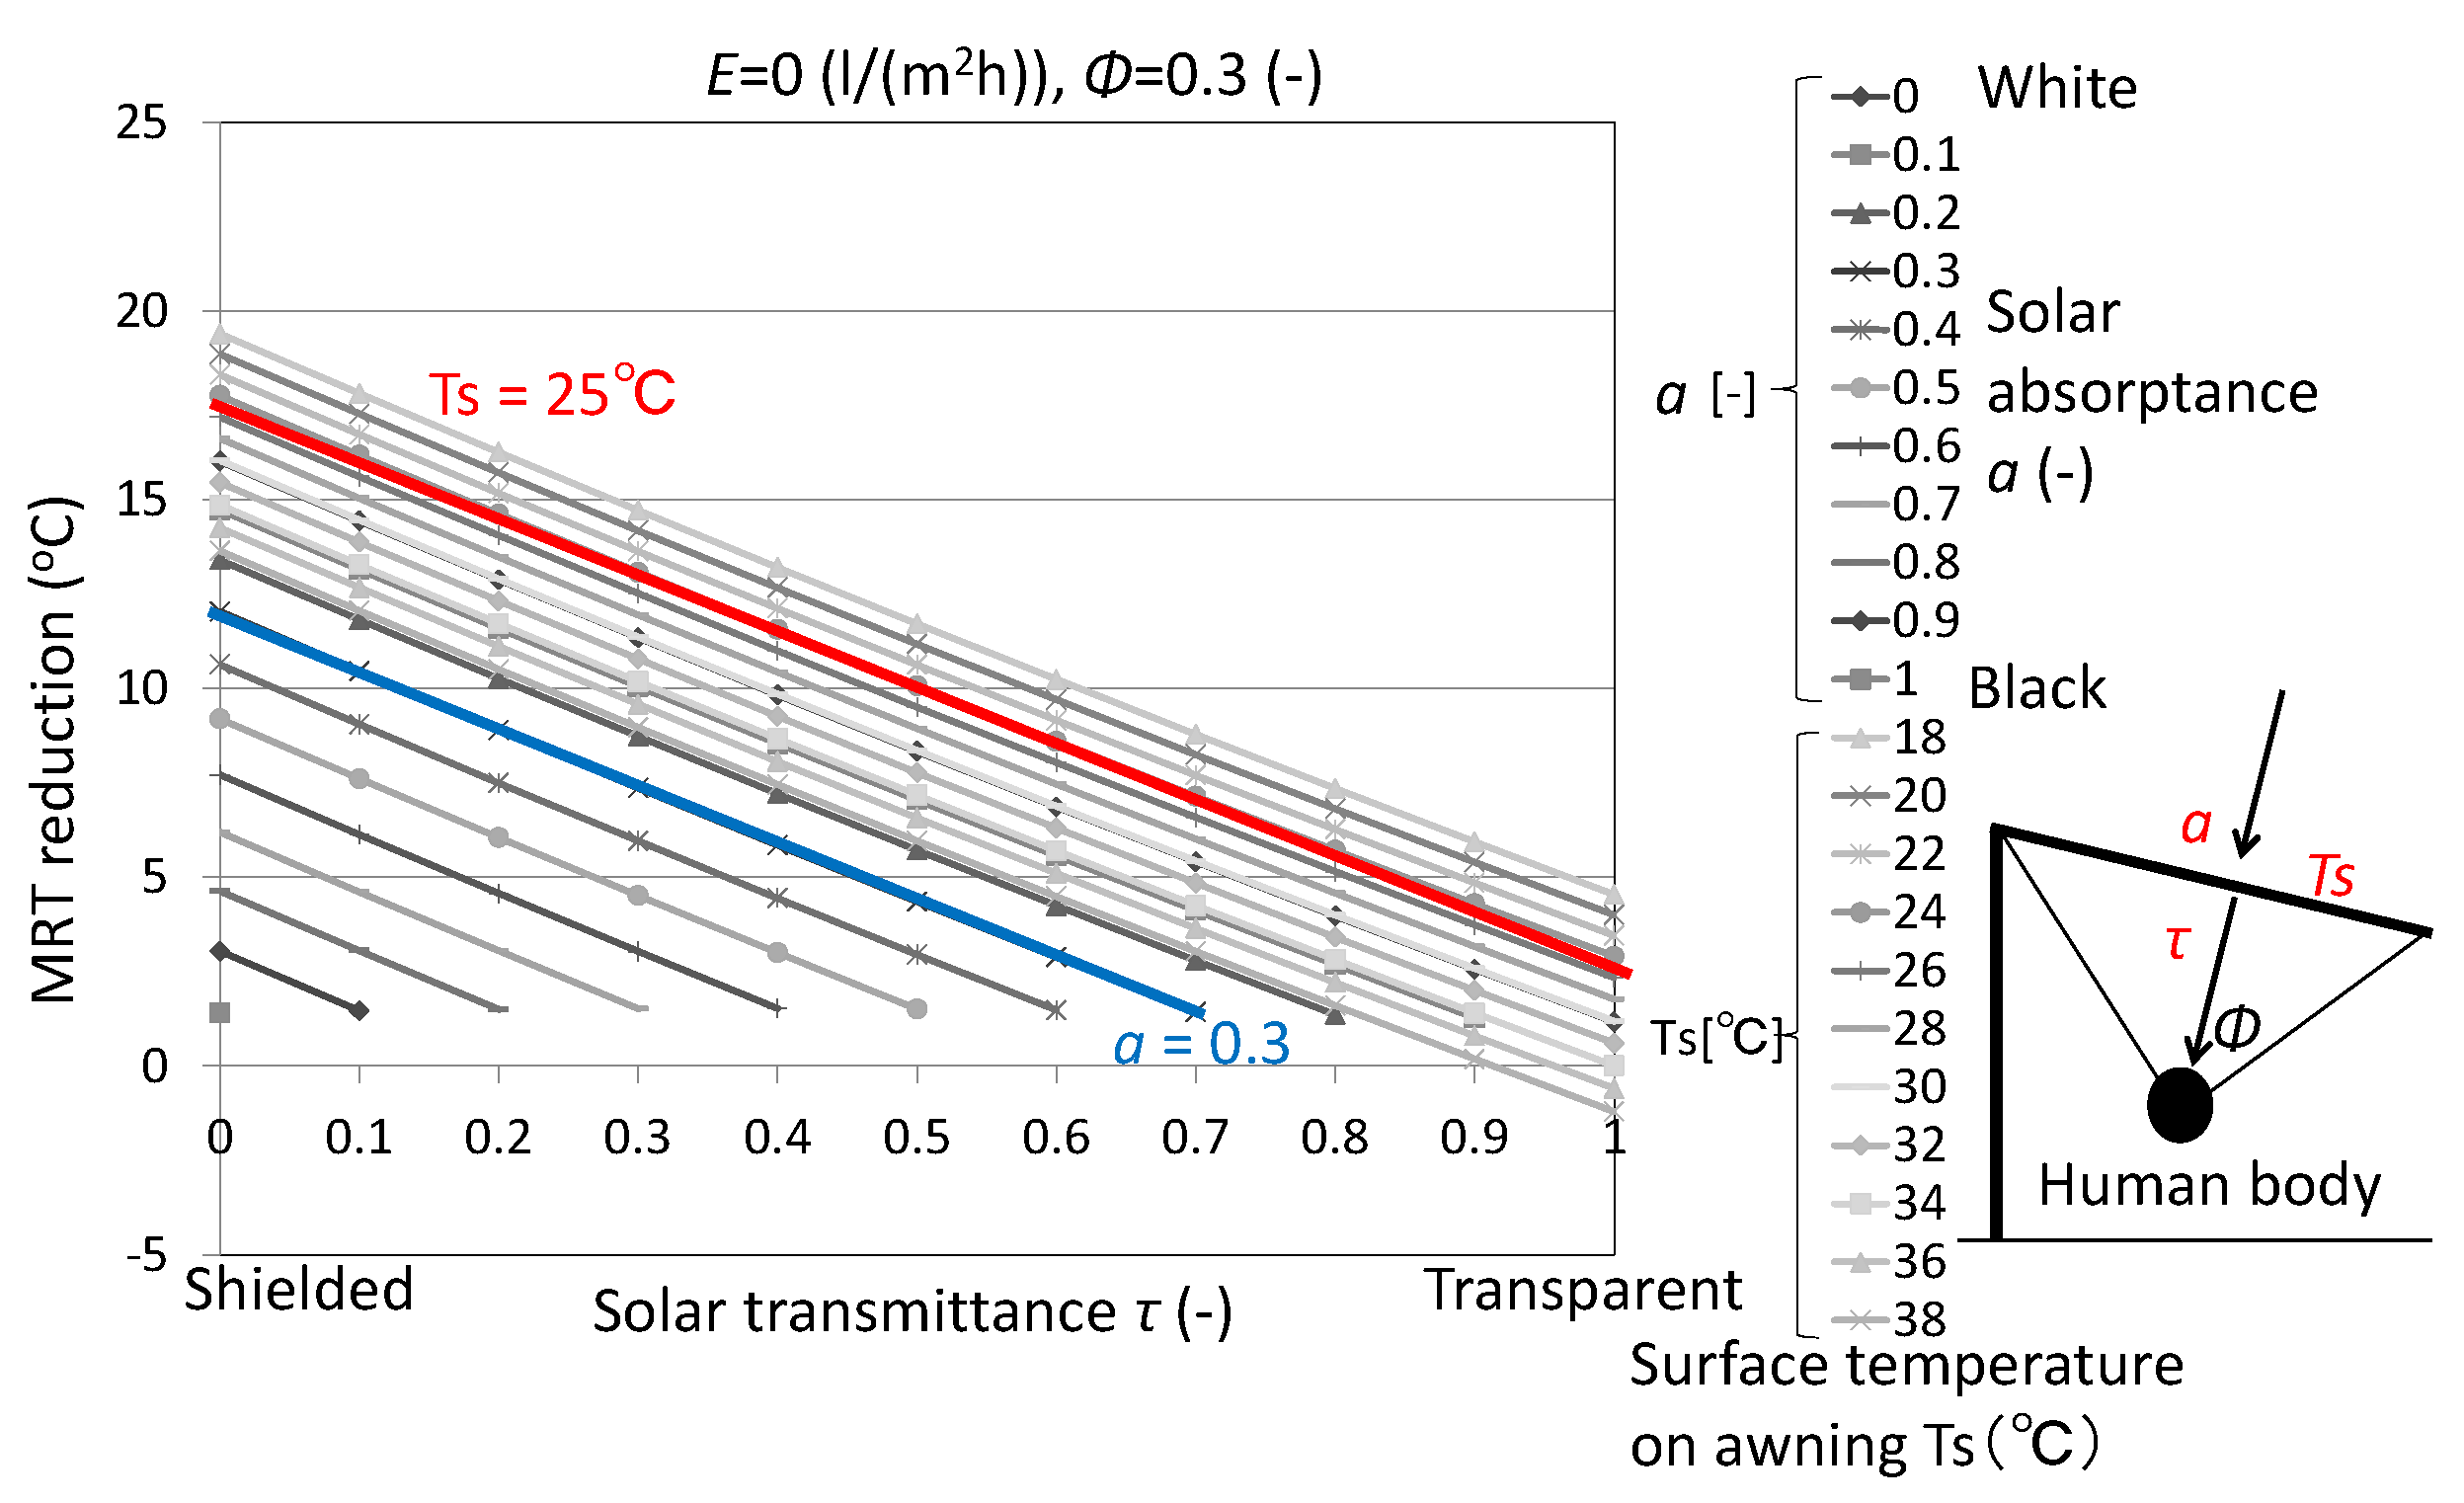
Figure 8.
Infrared radiation εσTs4 from ground surface by changing solar reflectance ρ on ground surface, from July to September 2020 at Osaka meteorological observatory.
Figure 8.
Infrared radiation εσTs4 from ground surface by changing solar reflectance ρ on ground surface, from July to September 2020 at Osaka meteorological observatory.
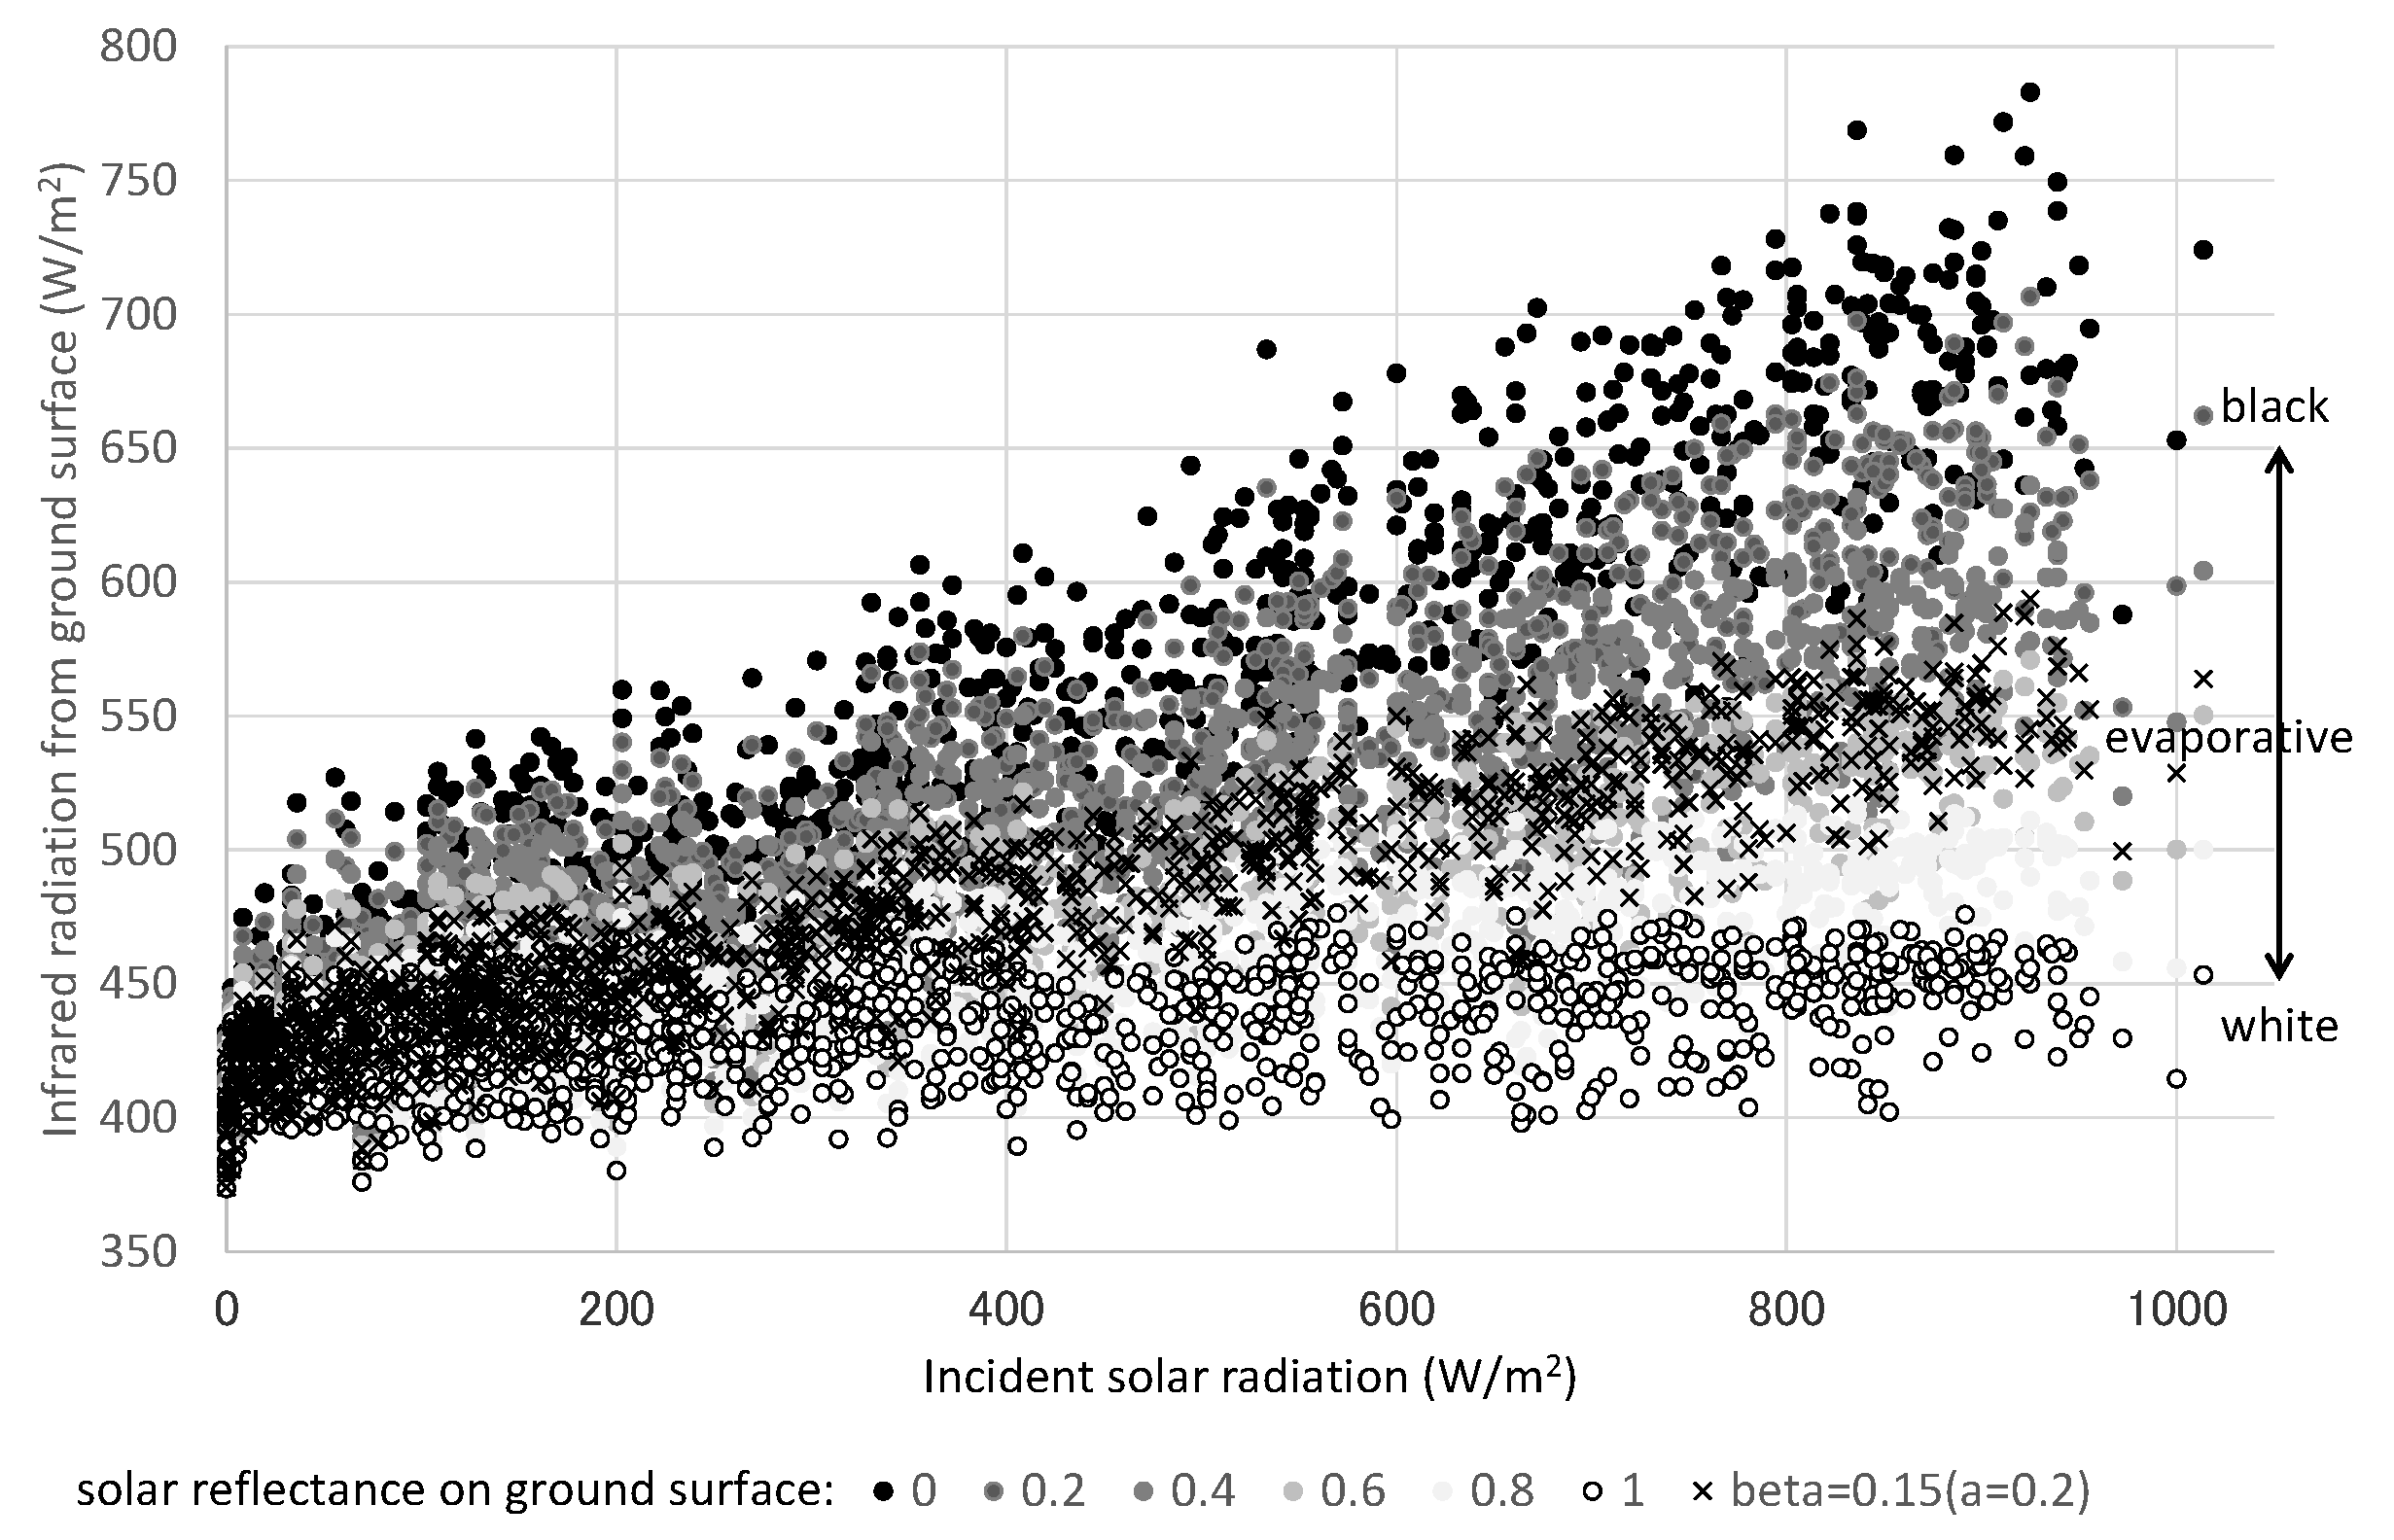
Figure 9.
MRTs for various human body’s solar absorptance ah by changing solar reflectance ρ on ground surface, from July to September 2020 at Osaka meteorological observatory.
Figure 9.
MRTs for various human body’s solar absorptance ah by changing solar reflectance ρ on ground surface, from July to September 2020 at Osaka meteorological observatory.
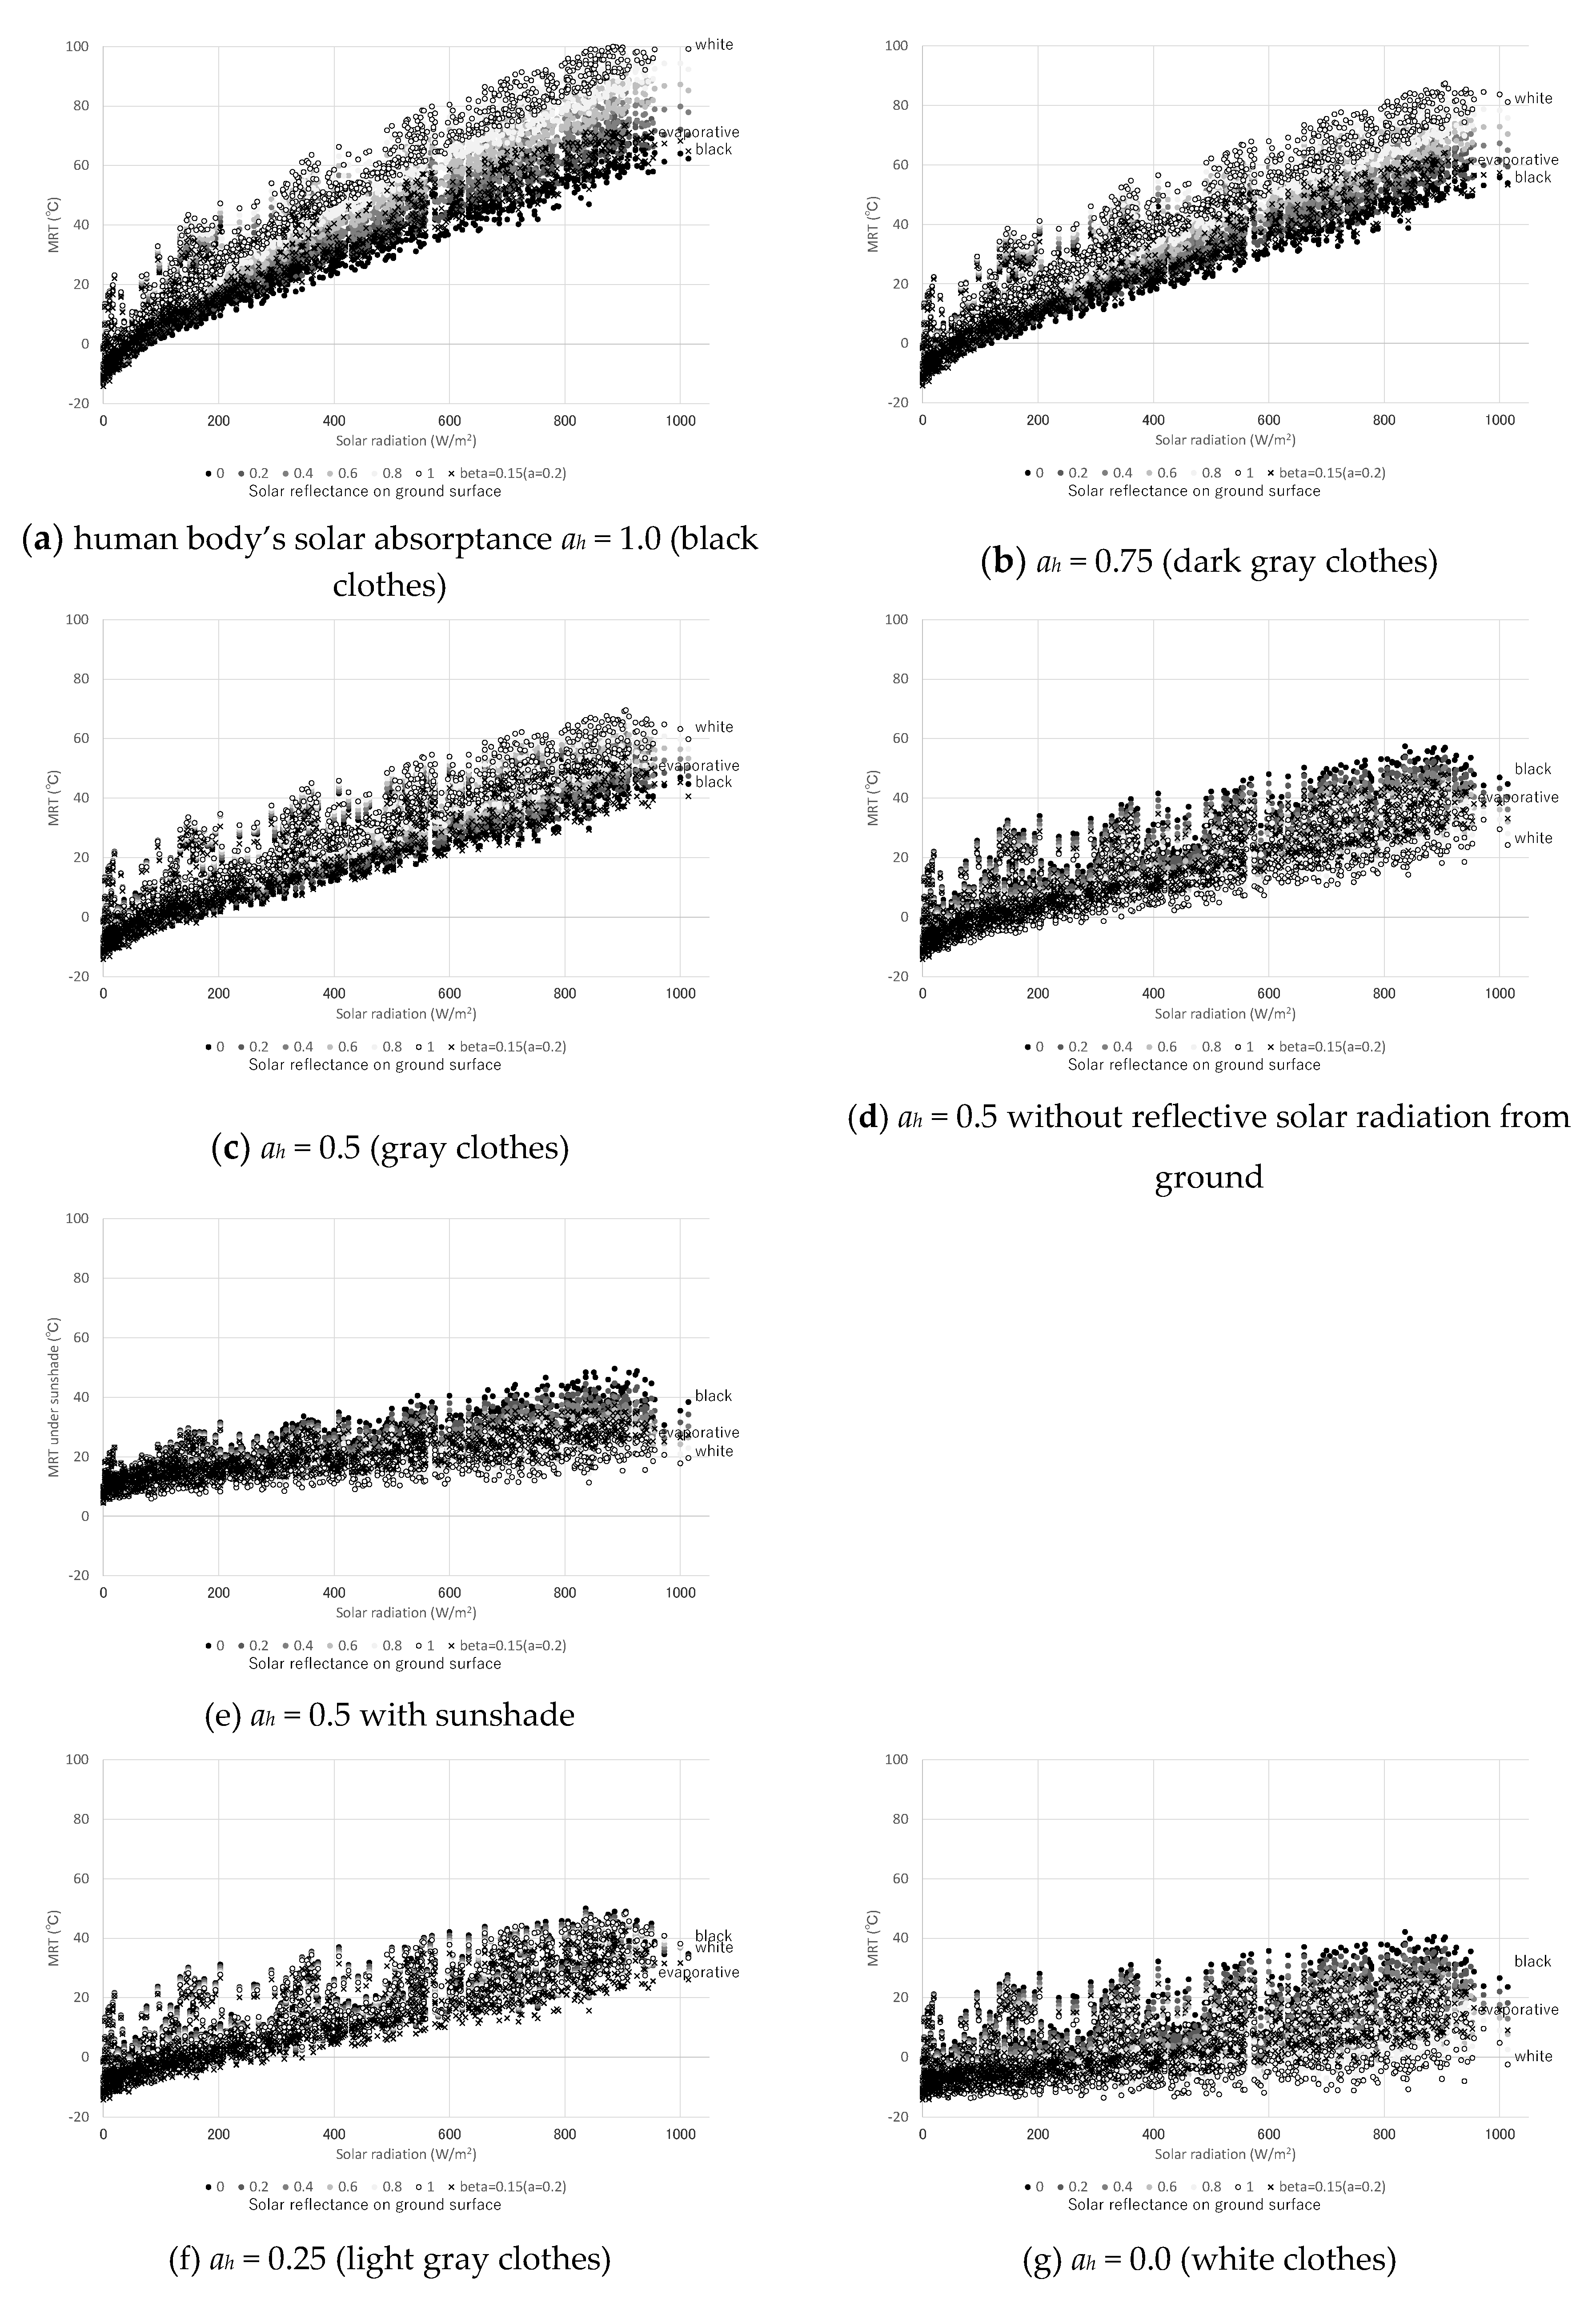
Figure 10.
Calculation results of air temperature (left) and humidity (right) vertical cross section distribution influenced by mist spraying (spray rate: 1.0 g/s, wind velocity: 1.0 m/s, mesh size: 0.5 m, 0.5 m, 0.5 m).
Figure 10.
Calculation results of air temperature (left) and humidity (right) vertical cross section distribution influenced by mist spraying (spray rate: 1.0 g/s, wind velocity: 1.0 m/s, mesh size: 0.5 m, 0.5 m, 0.5 m).
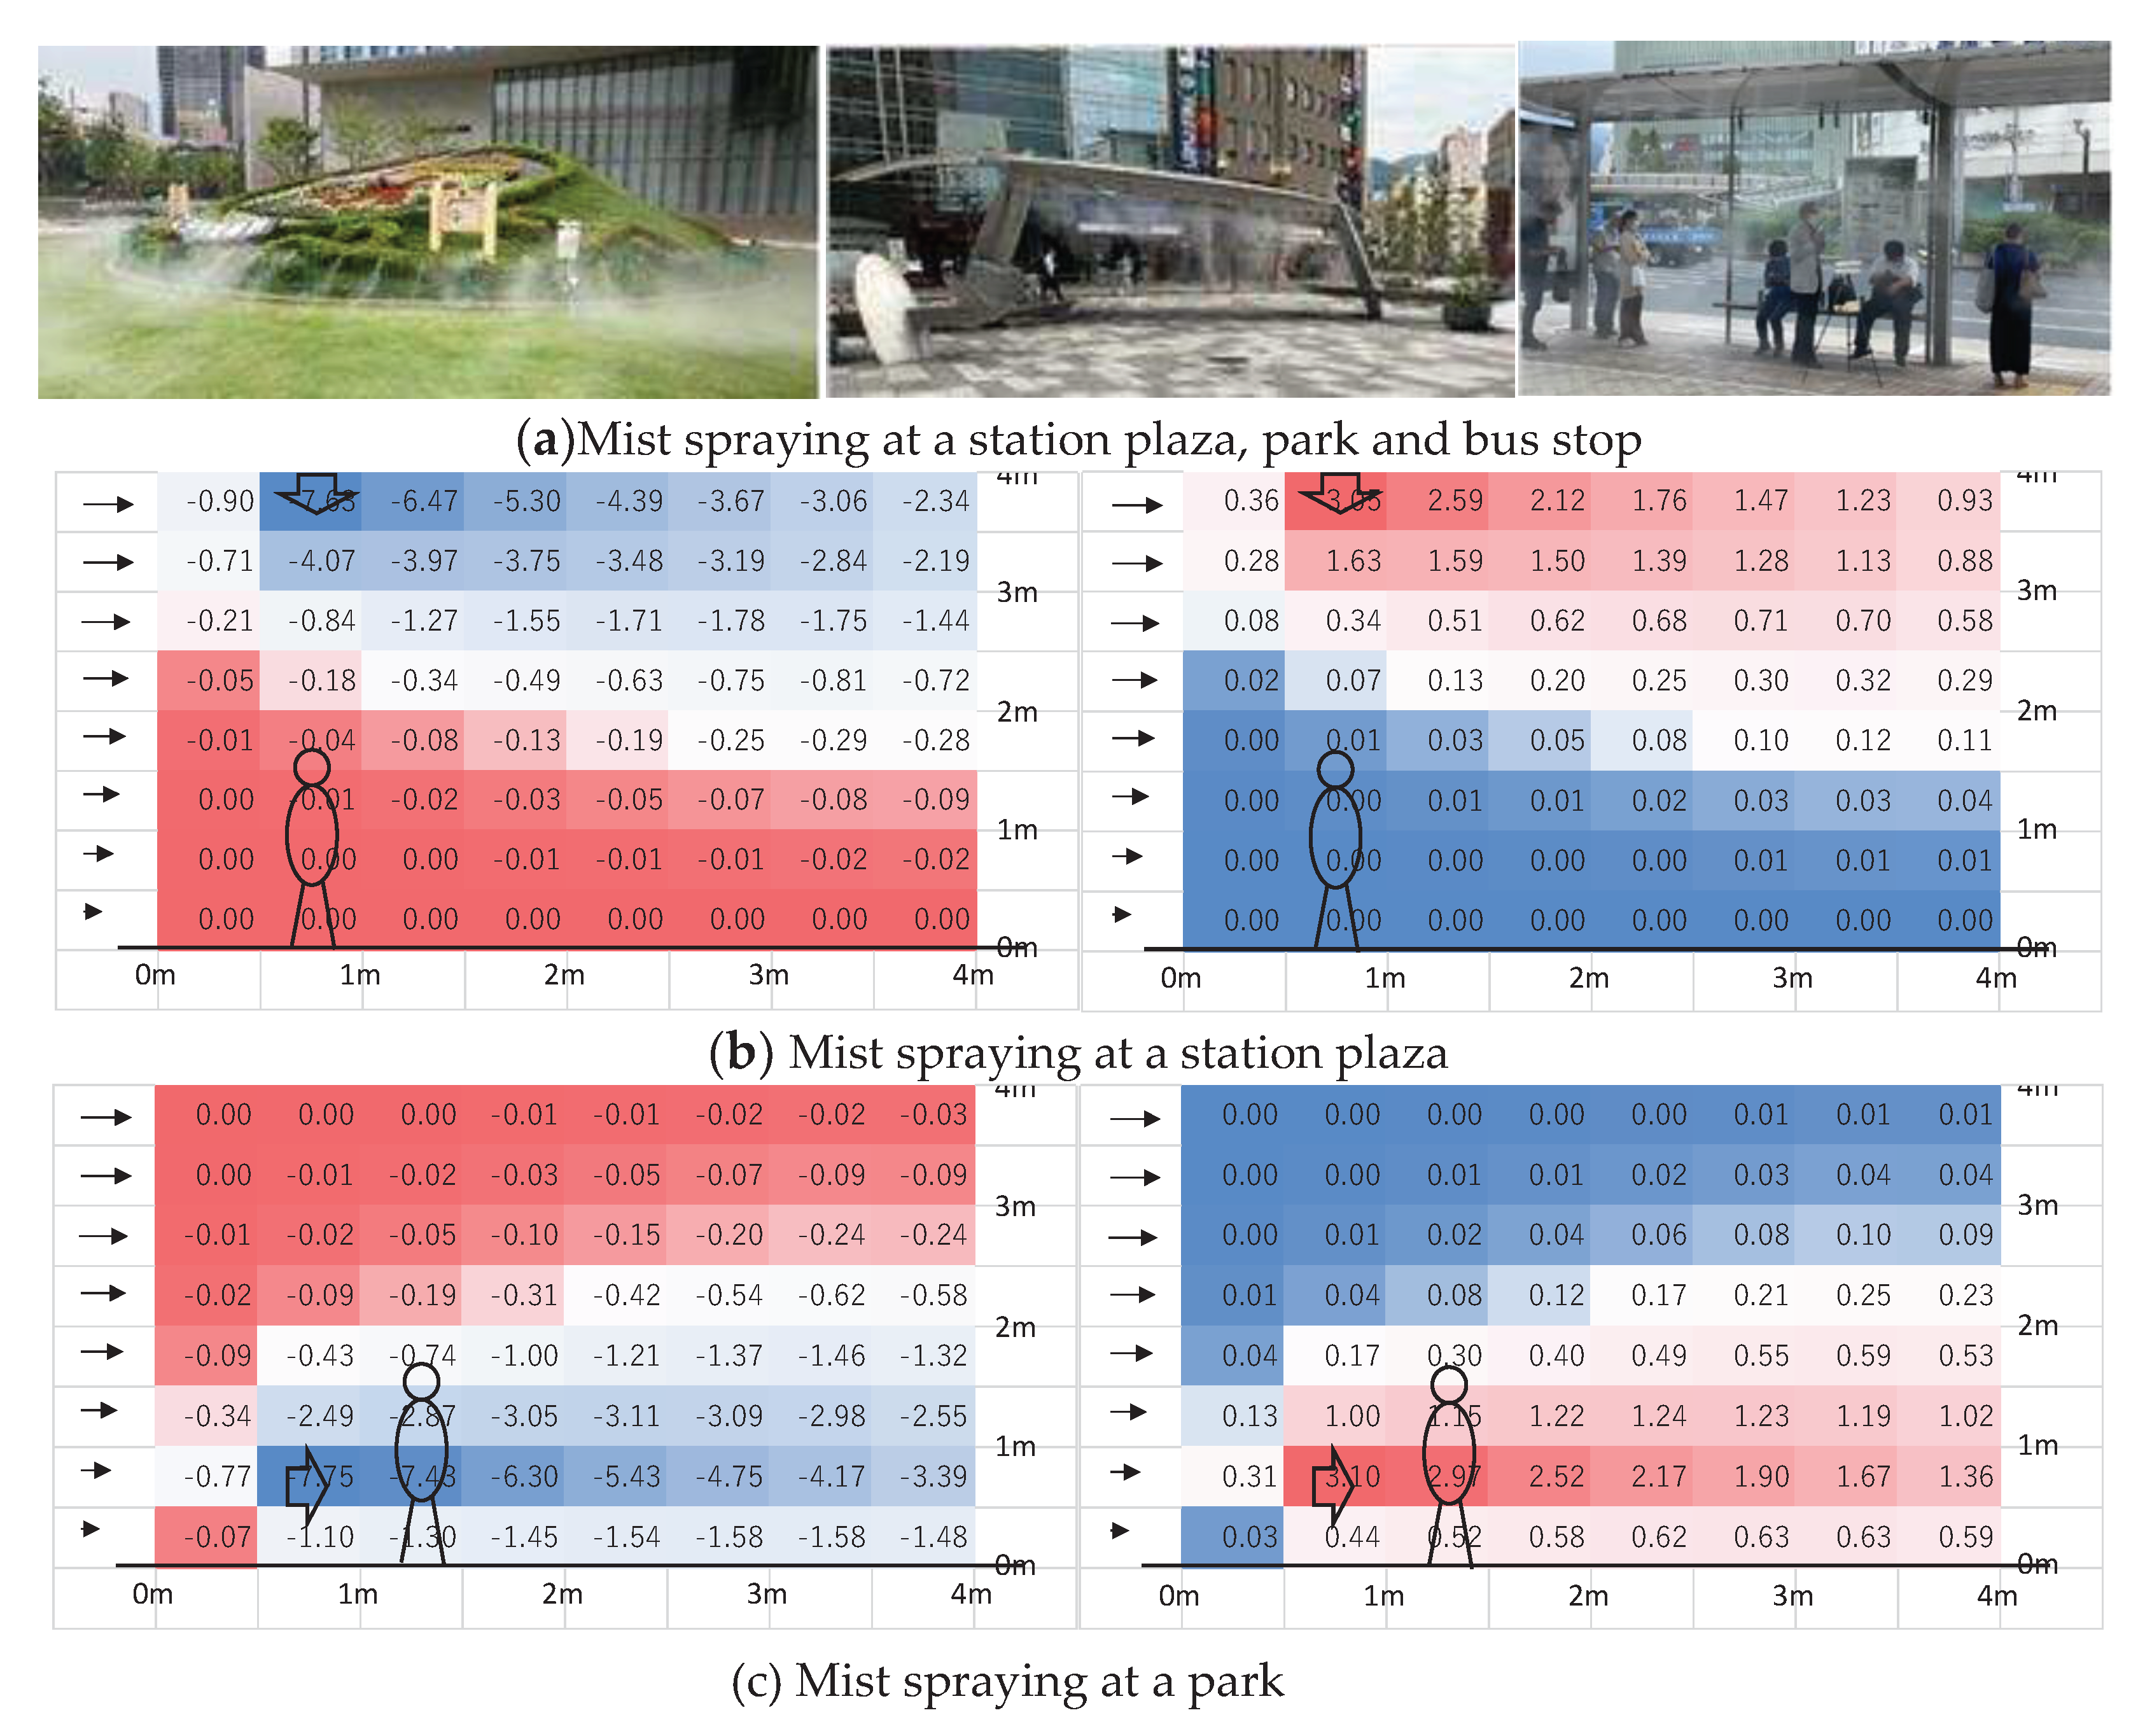
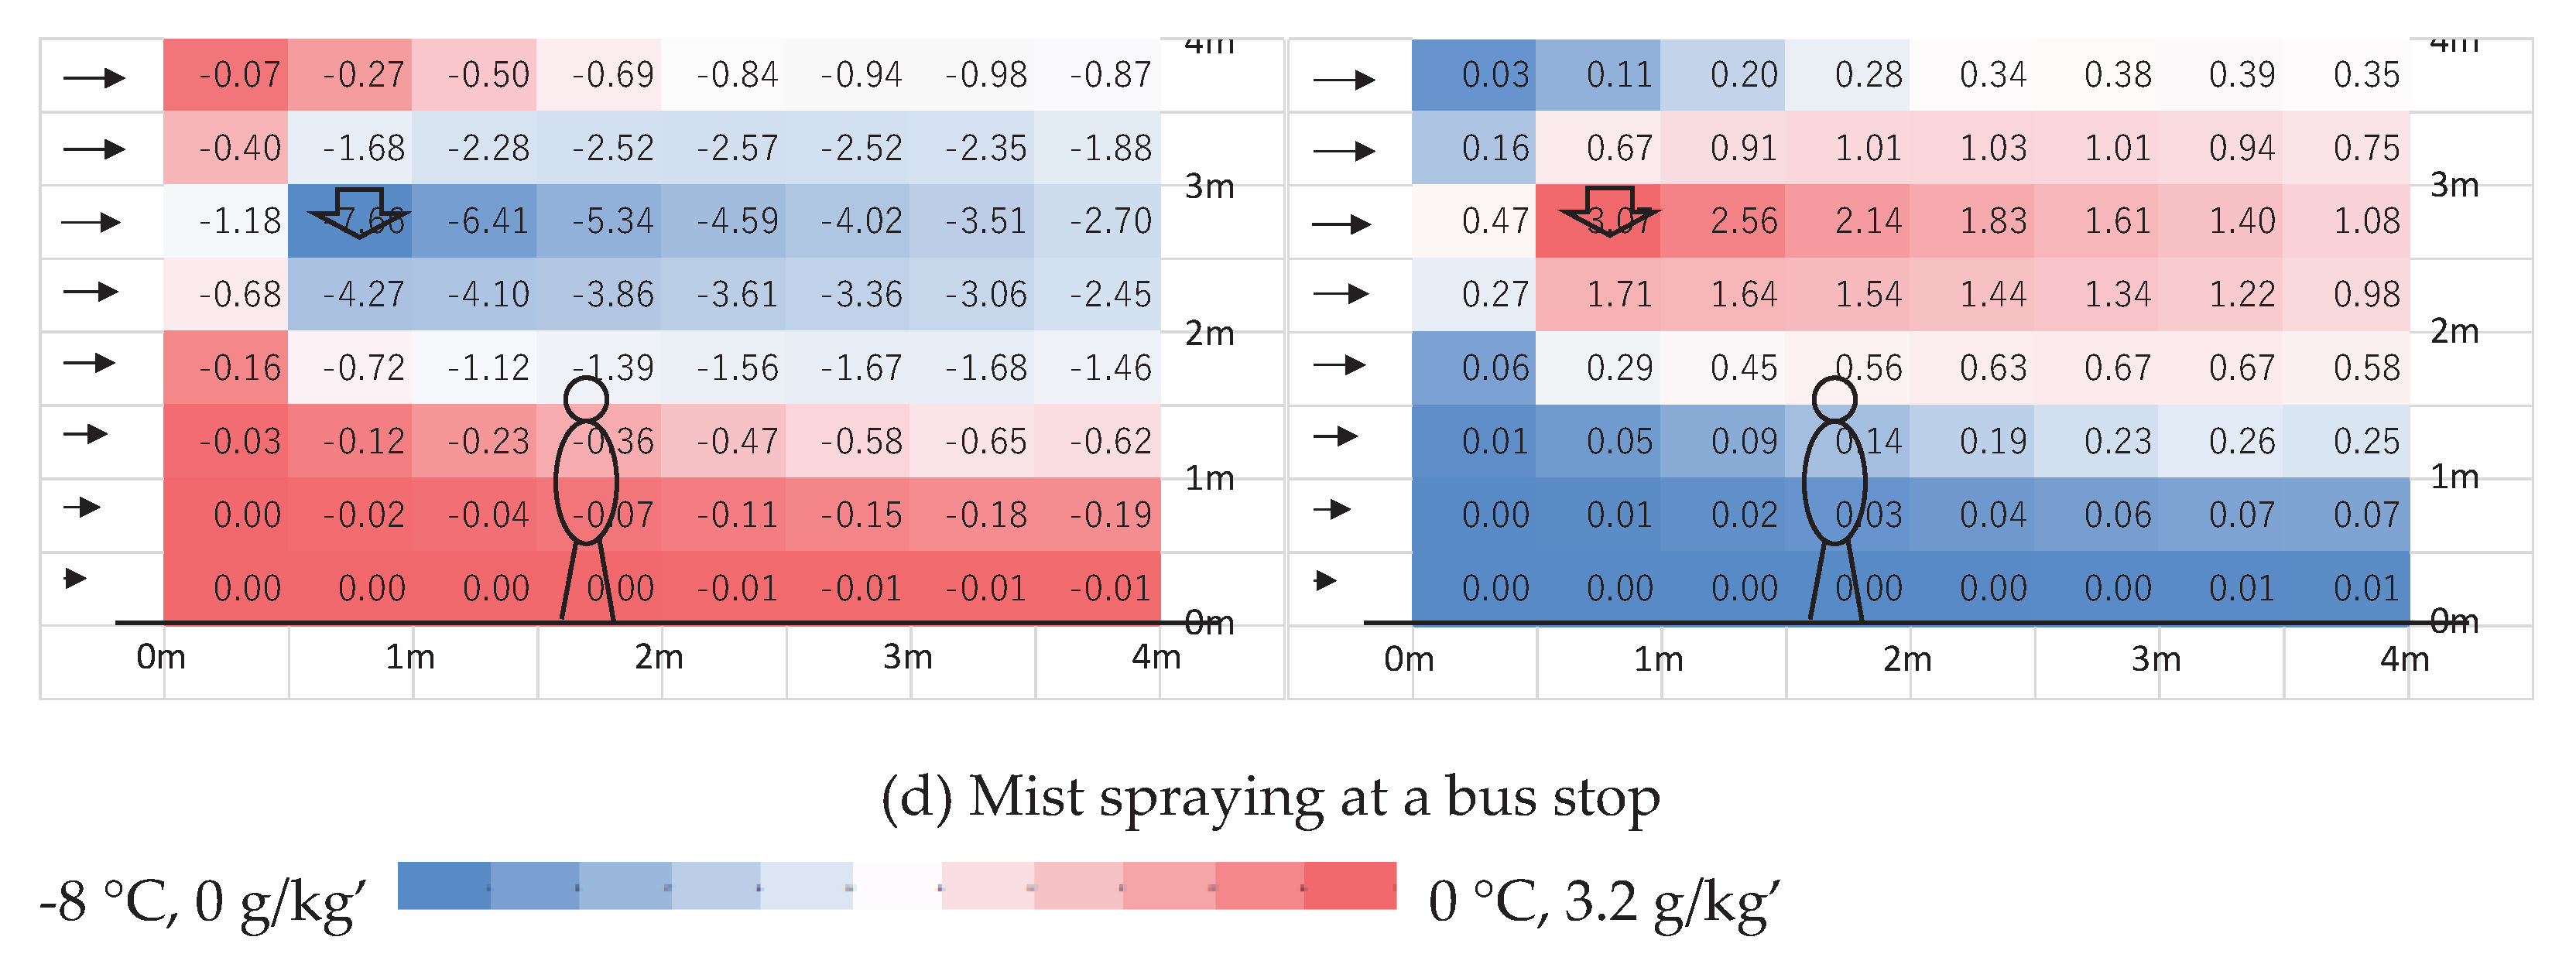

Table 1.
Example of typical adaptation measures effects.
| Change of MRT, Ta, Xa | SET* reduction | WBGT reduction | |
|---|---|---|---|
| Sunshade | MRT -13°C | 2.7 °C | 1.0 °C |
| Watering road | MRT -2.4°C | 0.5 °C | 0.2 °C |
| Mist spray | Ta -2 °C, Xa +0.8 g/kg’ | 0.9 °C | 0.4 °C |
Disclaimer/Publisher’s Note: The statements, opinions and data contained in all publications are solely those of the individual author(s) and contributor(s) and not of MDPI and/or the editor(s). MDPI and/or the editor(s) disclaim responsibility for any injury to people or property resulting from any ideas, methods, instructions or products referred to in the content. |
© 2023 by the author. Licensee MDPI, Basel, Switzerland. This article is an open access article distributed under the terms and conditions of the Creative Commons Attribution (CC BY) license (https://creativecommons.org/licenses/by/4.0/).
Copyright: This open access article is published under a Creative Commons CC BY 4.0 license, which permit the free download, distribution, and reuse, provided that the author and preprint are cited in any reuse.


