Submitted:
26 September 2023
Posted:
28 September 2023
You are already at the latest version
Abstract
Keywords:
1. Introduction
2. Results
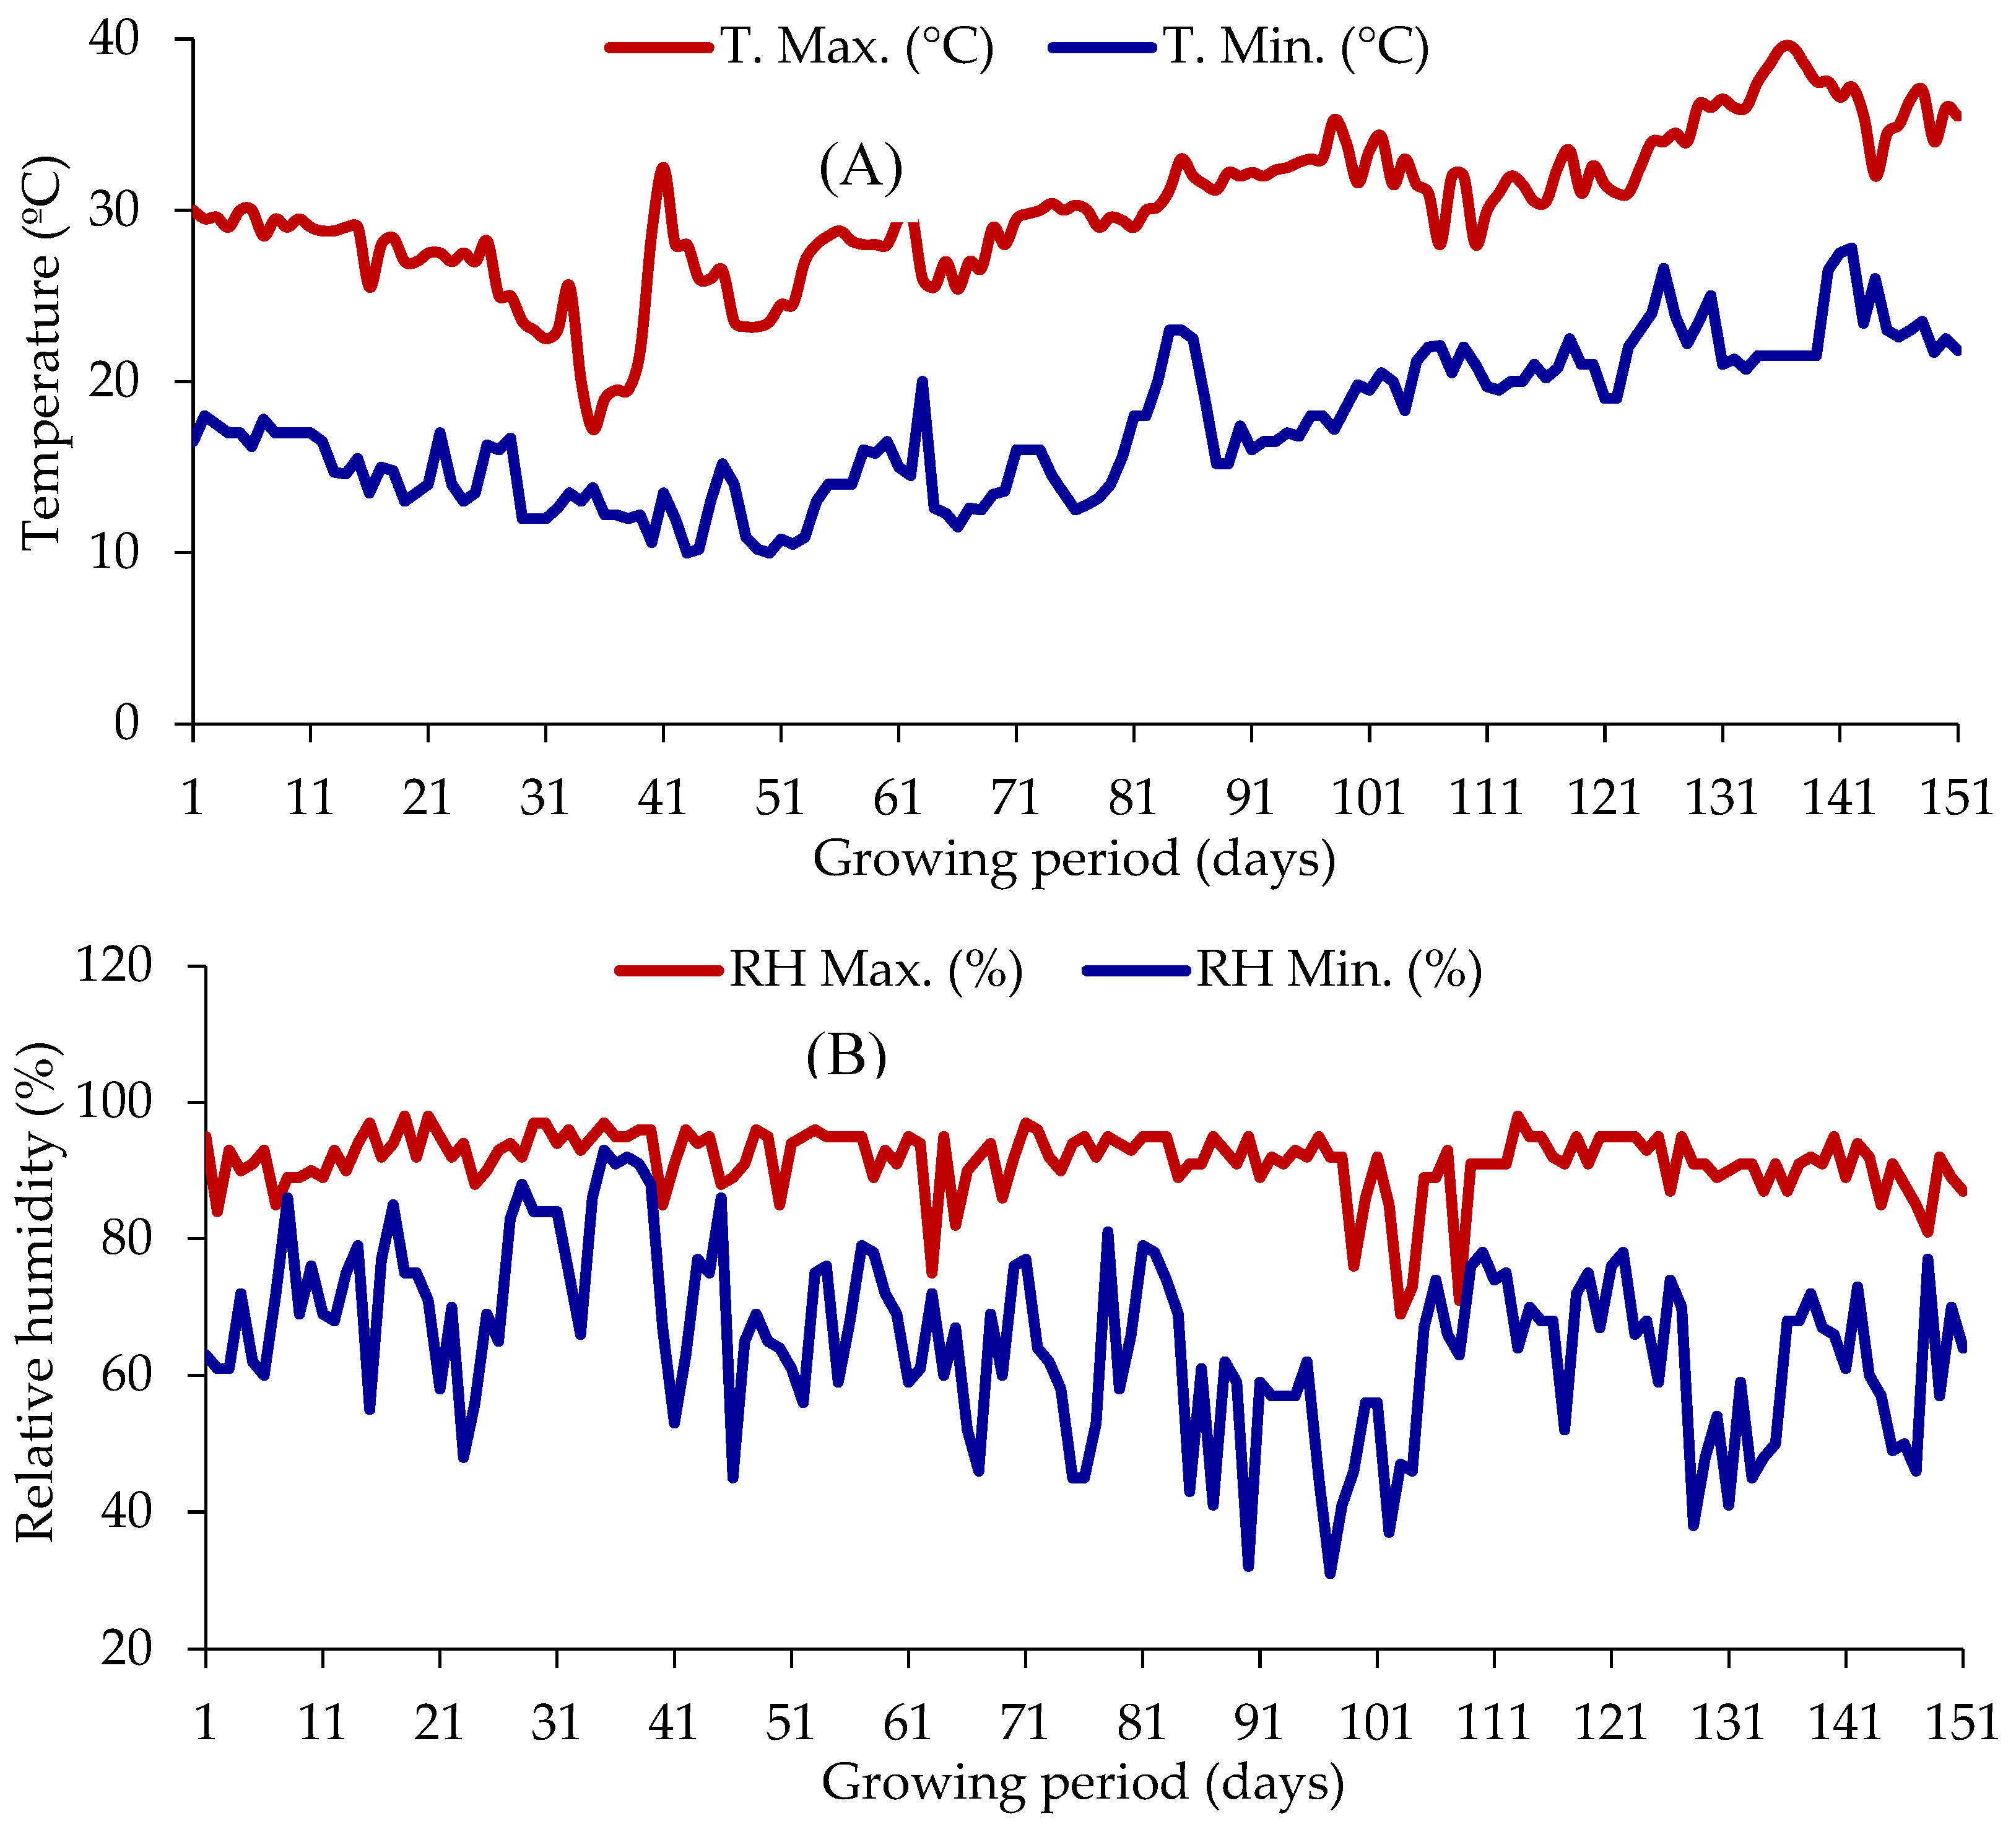
Weather Condition in Late Winter
Plant Height
Base diameter
Number of Branches
Number of Leaves
Canopy Spread
Internode Length
Number of Leaflets
Leaf Area
Leaf SPAD value
Shoot Weight
Root Weight
Days Required to Flowering
Number of Flower Clusters
Number of Flowers and Fruits Cluster-1
Single Fruit Weight
Fruit Yield
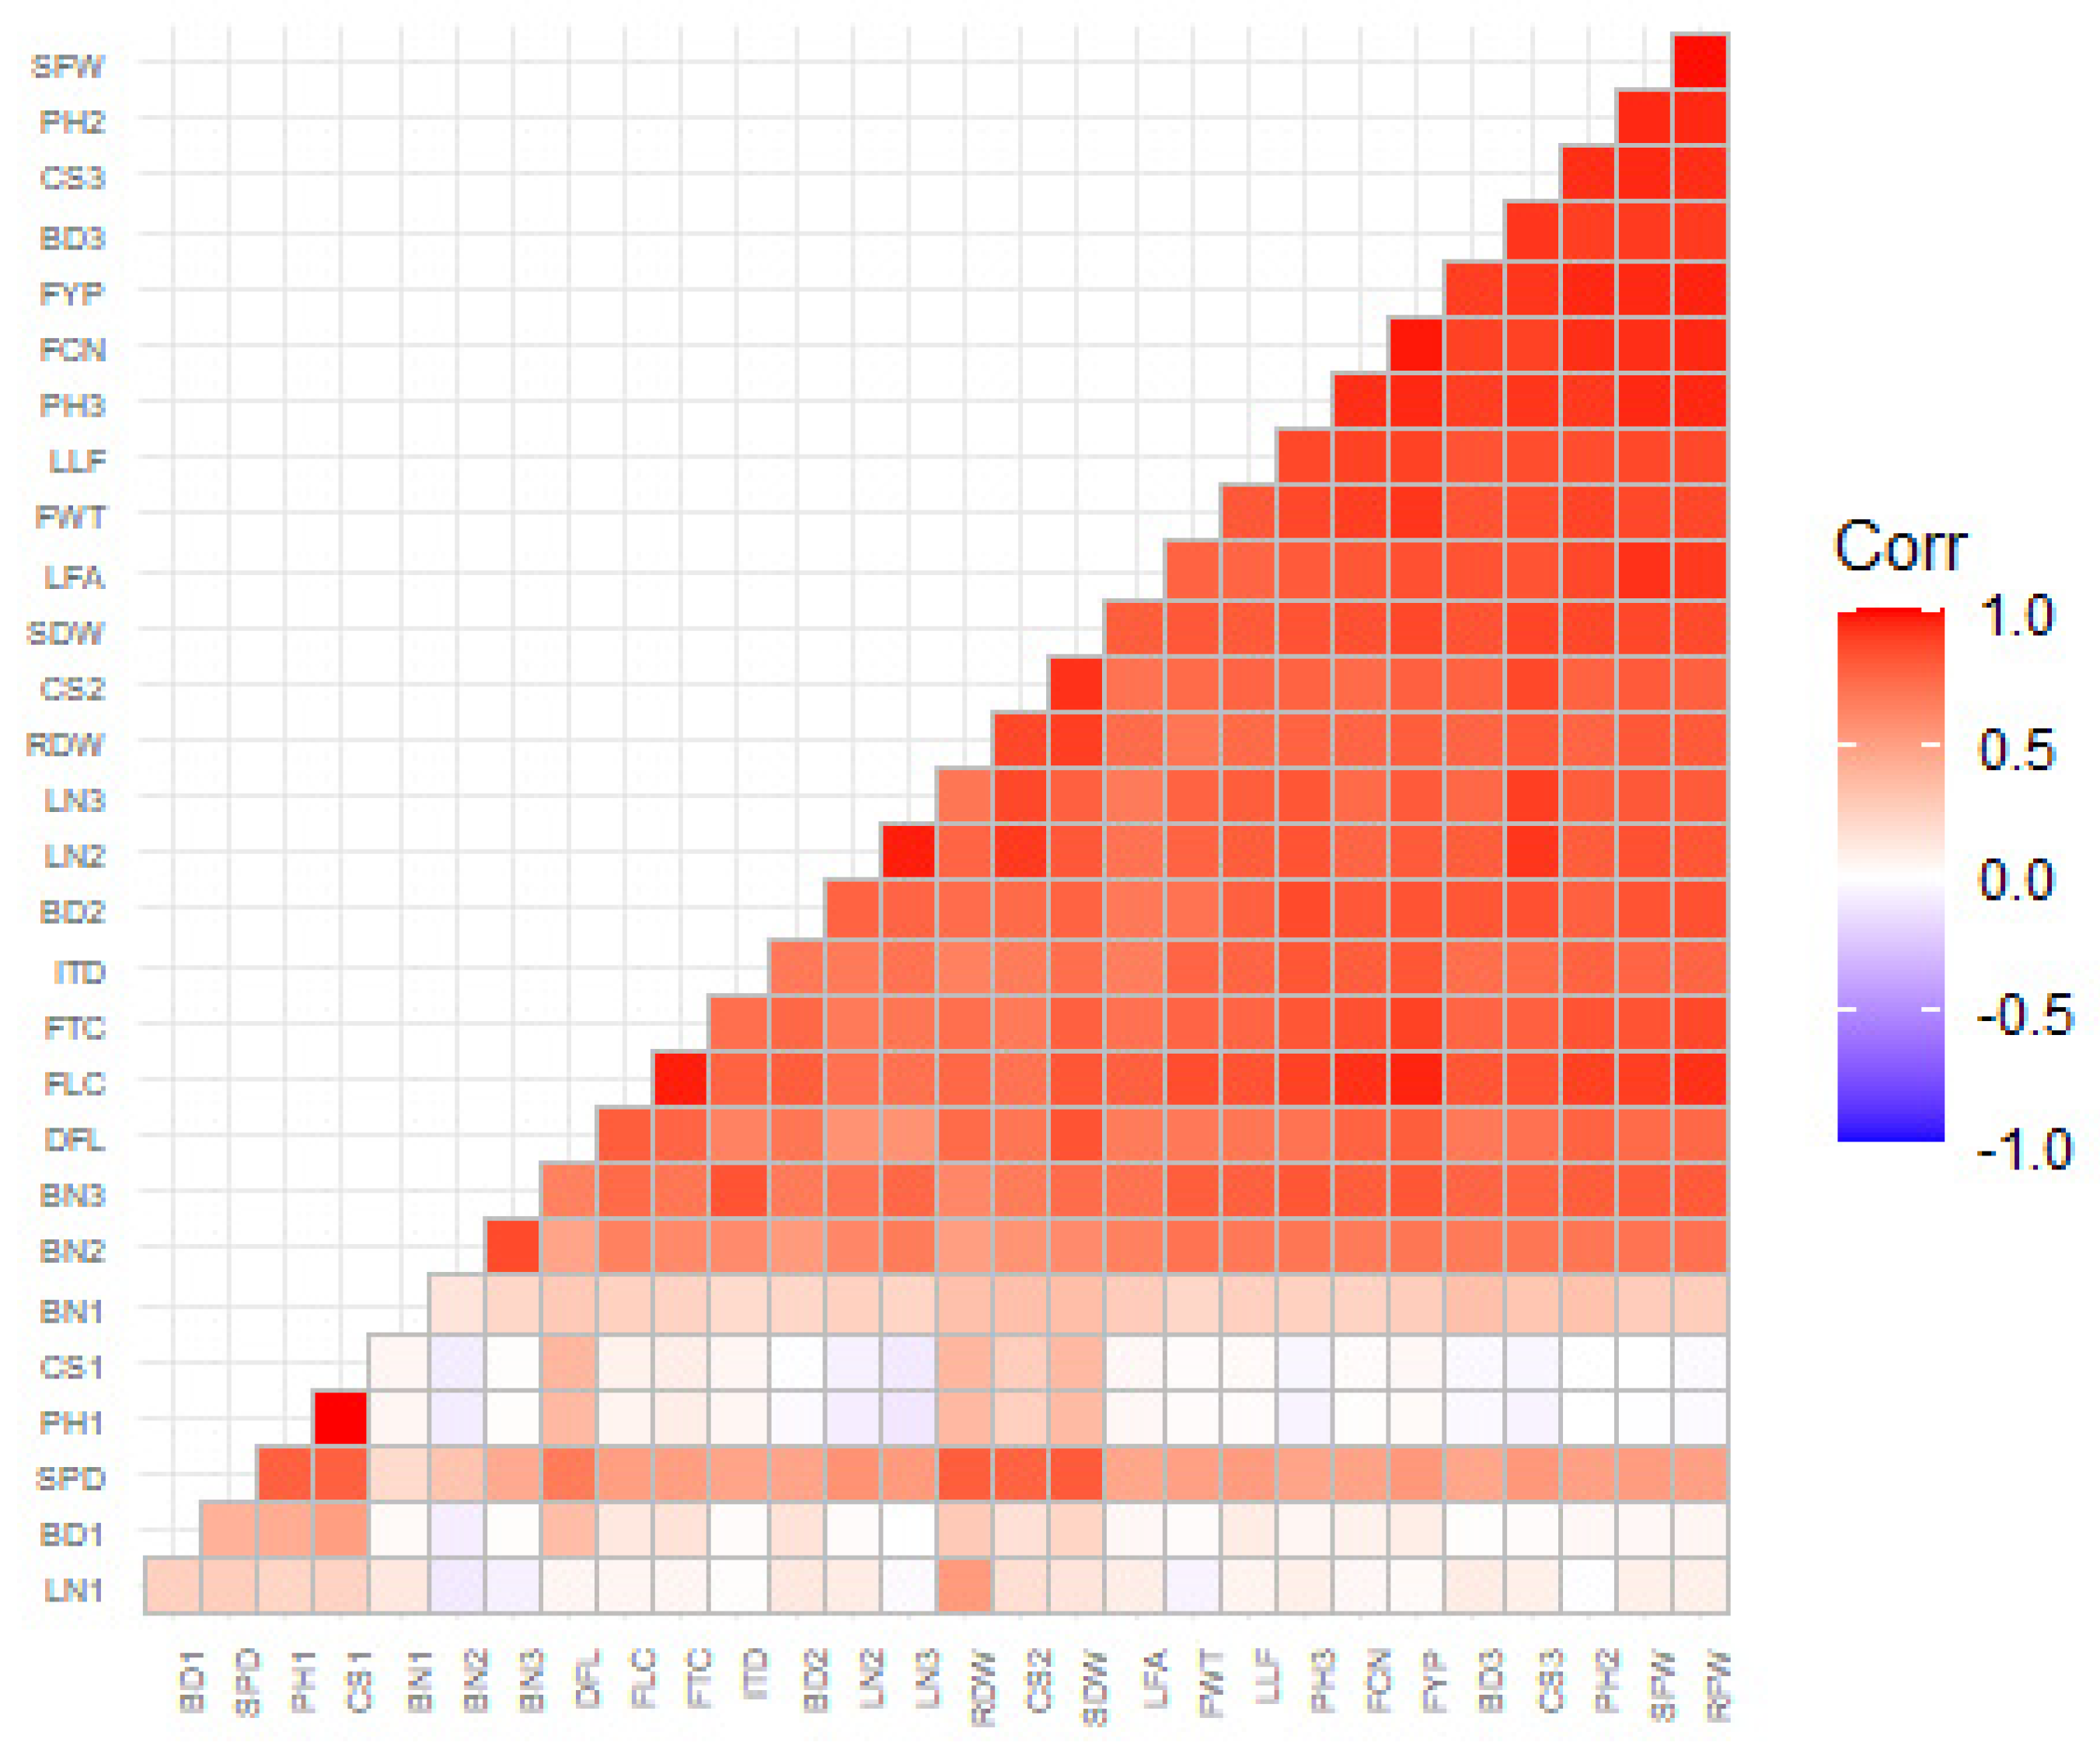
Correlation Coefficient Analysis
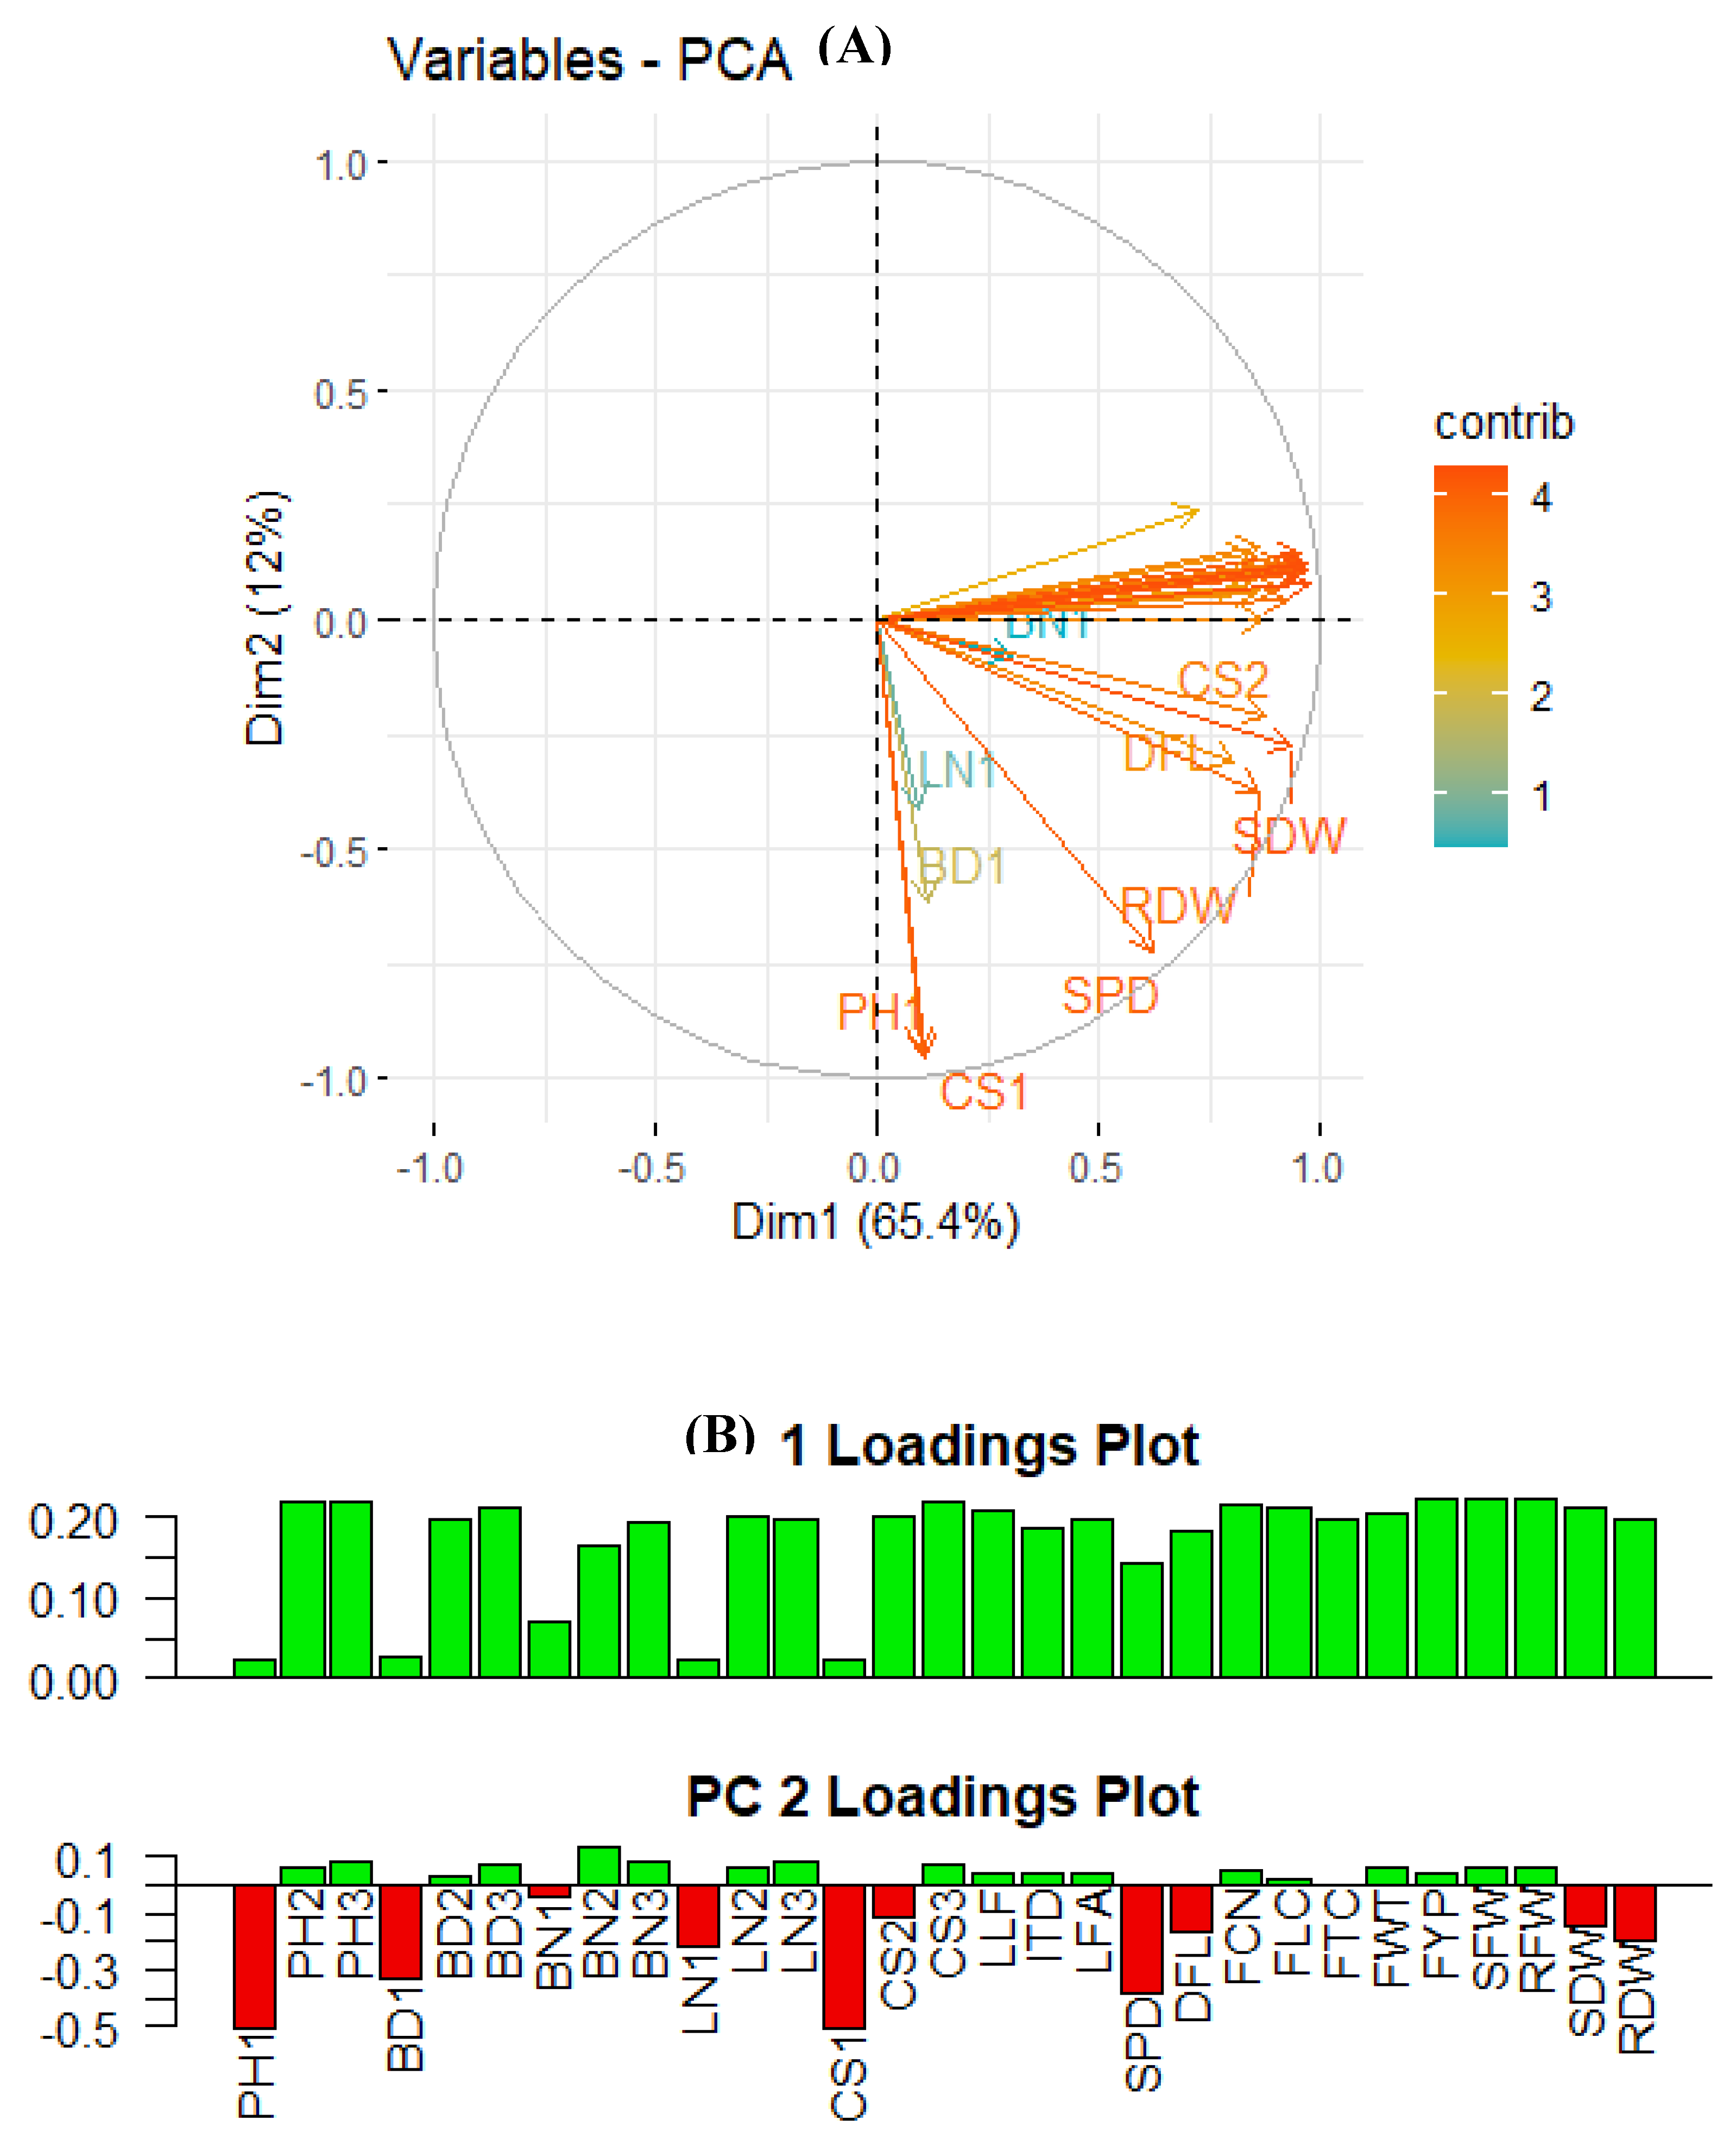
Principal Component Analysis
3. Discussion
4. Materials and Methods
Study Area and Planting material
Crop Management
Experiment Design and Layout
Treatment Preparation and Application
Measurement of Growth Characteristics
Assessment of Reproductive Traits and Fruit Yield
Statistical Analysis
Ethical statement
5. Conclusions
Author Contributions
Funding
Data Availability Statement
Acknowledgments
Conflicts of Interest
References
- Li, Y.; Wang, H.; Zhang, Y.; Martin, C. Can the world’s favorite fruit, tomato, provide an effective biosynthetic chassis for high-value metabolites? Plant Cell Rep. 2008, 37, 1443–1450. [Google Scholar] [CrossRef] [PubMed]
- Braga, P.C.; Scalzo, R.L.; Dal Sasso, M.; Lattuada, N.; Greco, V.; Fibiani, M. Characterization and antioxidant activity of semi-purified extracts and pure delphinidin-glycosides from eggplant peel (Solanum melongena L.). J. Funct. Foods 2016, 20, 411–421. [Google Scholar] [CrossRef]
- Viuda-Martos, M.; Sanchez-Zapata, E.; Sayas-Barberá, E.; Sendra, E.; Pérez-Álvarez, J.A.; Fernández-López, J. Tomato and tomato byproducts. Human health benefits of lycopene and its application to meat products: a review. Crit. Rev. Food Sci. Nutr. 2014, 54, 1032–1049. [Google Scholar] [CrossRef] [PubMed]
- Khan, U.M.; Sevindik, M.; Zarrabi, A.; Nami, M.; Ozdemir, B.; Kaplan, D.N.; .... Sharifi-Rad, J. Lycopene: Food sources, biological activities, and human health benefits. Oxid. Med. Cell. Longev. 2021, 2021, 2713511. [CrossRef]
- Meena, R.K.; Vashisth, A.; Singh, R.; Singh, B.; Manjaih, K.M. Study on change in microenvironment under different colour shade nets and its impact on yield of spinach (Spinacia oleracea L.). J. Agrometeorol. 2014, 16, 104–111. [Google Scholar] [CrossRef]
- Khan, M.H.R.; Rahman, A.; Luo, C.; Kumar, S.; Islam, G.M.A.; Hossain, M.A. Detection of changes and trends in climatic variables in Bangladesh during 1988–2017. Heliyon 2019, 5, e01268. [Google Scholar] [CrossRef]
- Shamshiri, R.R.; Jones, J.W.; Thorp, K.R.; Ahmad, D.; Man, H.C.; Taheri, S. Review of optimum temperature, humidity, and vapour pressure deficit for microclimate evaluation and control in greenhouse cultivation of tomato: a review. Int Agrophys. 2018, 32, 287–302. [Google Scholar] [CrossRef]
- Firon, N.; Pressman, E.; Meir, S.; Khoury, R.; Altahan, L. Ethylene is involved in maintaining tomato (Solanum lycopersicum) pollen quality under heat-stress conditions. AoB Plants 2012, 2012, pls024. [Google Scholar] [CrossRef] [PubMed]
- Singh, U.; Patel, P.K.; Singh, A. K.; Tiwari, V.; Kumar, R.; Rai, N.; .... Singh, B. Screening of tomato genotypes underhigh temperature stress for reproductive traits. Veg. Sci. 2015, 42, 52–55. [Google Scholar]
- Lin, W.A.N.G.; Zai-qiang, Y.A.N.G.; Ming-tian, W.A.N.G.; Shi-qiong, Y.A.N.G.; Xia, C.A.I.; Jie, Z.H.A.N.G. Effect of air humidity on nutrient content and dry matter distribution of tomato seedlings under high temperature. Chin. J. Agrometeorol. 2018, 39, 304. [Google Scholar]
- Mulholland, B.J.; Edmondson, R.N.; Fussell, M.; Basham, J.; Ho, L.C. Effects of high temperature on tomato summer fruit quality. J. Hortic. Sci. Biotechnol. 2003, 78, 365–374. [Google Scholar] [CrossRef]
- FAOSTAT. FAOSTAT Production Database-2022. Available online at: https://www.fao.org/faostat/en/#home. (Accessed on 20th June 2022).
- BBS. Yearbook of Agricultural Statistics-2021, Bangladesh Bureau of Statistics (BBS), Statistics and Informatics Division (SID), Ministry of Planning, Government of the People’s Republic of Bangladesh. Available at: https://www.bbs.gov.bd.
- Ahmed, S.; Jahiruddin, M.; Razia, S.; Begum, R.A.; Biswas, J.C.; Rahman, A.S.M.M.; Ali, M.M.; Islam, K.M.S.; Hossain, M.M.; Gani, M.N.; Hossain, G.M.A.; Satter, M.A. Fertilizer Recommendation Guide-2018. Bangladesh Agricultural Research Council (BARC), Farmgate, Dhaka-1215. 223p.
- Kakar, K.; Xuan, T.D.; Noori, Z.; Aryan, S.; Gulab, G. Effects of organic and inorganic fertilizer application on growth, yield, and grain quality of rice. Agriculture 2020, 10, 544. [Google Scholar] [CrossRef]
- Mozumder, P.; Berrens, R.P. Inorganic fertilizer use and biodiversity risk: An empirical investigation. Ecol. Econ. 2007, 62, 538–543. [Google Scholar] [CrossRef]
- Abebe, T.G.; Tamtam, M.R.; Abebe, A.A.; Abtemariam, K.A.; Shigut, T.G.; Dejen, Y.A.; Haile, E.G. Growing use and impacts of chemical fertilizers and assessing alternative organic fertilizer sources in Ethiopia. Appl. Environ. Soil Sci. 2022, 2022, 1–14. [Google Scholar] [CrossRef]
- Lolamo, T.; Senbeta, A.F.; Keneni, Y.G.; Sime, G. Effects of Bio-Slurry and Chemical Fertilizer Application on Soil Properties and Food Safety of Tomato (Solanum lycopersicum Mill.). Appl. Environ. Soil Sci. 2023, 2023, 1–16. [Google Scholar] [CrossRef]
- Yadav, S.; Sharma, K.D. Molecular and morphophysiological analysis of drought stress in plants. Plant Growth 2016, 10, 65246. [Google Scholar]
- Siddiqui, M.A.; Shah, Z.H.; Tunio, S.; Chacchar, Q. Effect of different nitrogen (N) phosphorus (P) fertilizer and plant growth regulators gibberellic acid (GA3) and indole-3-acetic acid (IAA) on qualitative traits of Canola (Brassica napus L.) genotypes. Ind. J. Pure App. Biosci. 2016, 4, 238–244. [Google Scholar] [CrossRef]
- Meshram, J.H.; Singh, S.B.; Raghavendra, K.P.; Waghmare, V.N. Drought stress tolerance in cotton: Progress and perspectives. Climate Change and Crop Stress 2022, 135–169. [Google Scholar]
- Zhang, H.; Sun, X.; Dai, M. Improving crop drought resistance with plant growth regulators and rhizobacteria: Mechanisms, applications, and perspectives. Plant Commun. 2022, 3, 1–15. [Google Scholar] [CrossRef]
- Hassan, J.; Miyajima, I. Induction of parthenocarpy in pointed gourd (Trichosanthes dioica Roxb.) by application of plant growth regulators. J. Hortic. Plant Res. 2019, 8, 13. [Google Scholar] [CrossRef]
- Chiang, C.; Bånkestad, D.; Hoch, G. Reaching natural growth: The significance of light and temperature fluctuations in plant performance in indoor growth facilities. Plants 2020, 9, 1312. [Google Scholar] [CrossRef] [PubMed]
- Mondaca, P.; Valenzuela, P.; Quiroz, W.; Valdenegro, M.; Abades, S.; Celis-Diez, J.L. Environmental conditions and plant physiology modulate Cu phytotoxicity in field-contaminated soils. Ecotoxicol. Environ. Saf. 2022, 246, 114179. [Google Scholar] [CrossRef] [PubMed]
- Driesen, E.; Van den Ende, W.; De Proft, M.; Saeys, W. Influence of environmental factors light, CO2, temperature, and relative humidity on stomatal opening and development: A review. Agronomy 2020, 10, 1975. [Google Scholar] [CrossRef]
- Qaderi, M.M.; Martel, A.B.; Dixon, S.L. Environmental factors influence plant vascular system and water regulation. Plants 2019, 8, 65. [Google Scholar] [CrossRef] [PubMed]
- Pant, P.; Pandey, S.; Dall'Acqua, S. The influence of environmental conditions on secondary metabolites in medicinal plants: A literature review. Chem. Biodivers. 2021, 18, e2100345. [Google Scholar] [CrossRef]
- Chia, S.Y.; Lim, M.W. A critical review on the influence of humidity for plant growth forecasting. IOP Conference Series: Materials Science and Engineering 2022, 1257, 012001. [Google Scholar] [CrossRef]
- Dinu, M.D.; Mazilu, I.E.; Cosmulescu, S. Influence of Climatic Factors on the Phenology of Chokeberry Cultivars Planted in the Pedoclimatic Conditions of Southern Romania. Sustainability 2022, 14, 4991. [Google Scholar] [CrossRef]
- Upadhyay, H.; Juneja, A.; Turabieh, H.; Malik, S.; Gupta, A.; Bitsue, Z.K.; Upadhyay, C. Exploration of crucial factors involved in plants development using the fuzzy AHP Method. Math. Probl. Eng. 2022, 2022. [Google Scholar] [CrossRef]
- Triantafyllidis, V.; Zotos, A.; Kosma, C.; Kokkotos, E. Effect of land-use types on edaphic properties and plant species diversity in Mediterranean agroecosystem. Saudi J. Biol. Sci. 2020, 27, 3676–3690. [Google Scholar] [CrossRef]
- Gao, J.; Wang, J.; Li, Y. Effects of Soil Nutrients on Plant Nutrient Traits in Natural Pinus tabuliformis Forests. Plants 2023, 12, 735. [Google Scholar] [CrossRef]
- Smith, M.R.; Reis Hodecker, B.E.; Fuentes, D.; Merchant, A. Investigating nutrient supply effects on plant growth and seed nutrient content in common bean. Plants 2022, 11, 737. [Google Scholar] [CrossRef] [PubMed]
- Cannavo, P.; Recous, S.; Valé, M.; Bresch, S.; Paillat, L.; Benbrahim, M.; Guénon, R. Organic fertilization of growing media: response of N mineralization to temperature and moisture. Horticulturae 2022, 8, 152. [Google Scholar] [CrossRef]
- Guo, T.; Gull, S.; Ali, M.M.; Yousef, A.F.; Ercisli, S.; Kalaji, H.M.; .... Ghareeb, R.Y. Heat stress mitigation in tomato (Solanum lycopersicum L.) through foliar application of gibberellic acid. Sci. Rep. 2022, 12, 11324. [Google Scholar] [CrossRef] [PubMed]
- Gupta, A.; Yadav, D.S.; Agrawal, S.B.; Agrawal, M. Individual effects of high temperature and tropospheric ozone on tomato: a review. J. Plant Growth Regul. 2023, 42, 1421–1443. [Google Scholar] [CrossRef]
- Azad, A.K.; Miaruddin, M.; Wohab, M.A.; Sheikh, M.H.R.; Nag, B.L.; Rahman, M.H.H. (Eds.) (2020). KRISHI PROJUKTI HATBOI (Handbook on Agro-Technology). Bangladesh Agricultural Research Institute, Gazipur-1701, Bangladesh. p 562.
- Gao, F.; Li, H.; Mu, X.; Gao, H.; Zhang, Y.; Li, R.; .... Ye, L. Effects of Organic Fertilizer Application on Tomato Yield and Quality: A Meta-Analysis. Appl. Sci. 2023, 13, 2184. [Google Scholar]
- Traoré, A.; Bandaogo, A.A.; Savadogo, O.M.; Saba, F.; Ouédraogo, A.L.; Sako, Y.; .... Ouédraogo, S. Optimizing Tomato (Solanum lycopersicum L.) Growth with Different Combinations of Organo-Mineral Fertilizers. Front. Sustain. Food Syst. 2022, 5, 694628. [Google Scholar] [CrossRef]
- Kim, Y.X.; Son, S.Y.; Lee, S.; Lee, Y.; Sung, J.; Lee, C.H. Effects of limited water supply on metabolite composition in tomato fruits (Solanum lycopersicum L.) in two soils with different nutrient conditions. Front. Plant Sci. 2022, 13, 983725. [Google Scholar] [CrossRef]
- Loudari, A.; Mayane, A.; Zeroual, Y.; Colinet, G.; Oukarroum, A. Photosynthetic performance and nutrient uptake under salt stress: Differential responses of wheat plants to contrasting phosphorus forms and rates. Front. Plant Sci. 2022, 13, 1038672. [Google Scholar] [CrossRef]
- Zheng, Y.; Yang, Z.; Xu, C.; Wang, L.; Huang, H.; Yang, S. The interactive effects of daytime high temperature and humidity on growth and endogenous hormone concentration of tomato seedlings. HortScience 2020, 55, 1575–1583. [Google Scholar] [CrossRef]
- Cline, J.A.; Bijl, M. Diurnal spray timing does not affect the thinning of apples with carbaryl, benzyladenine, and napthaleneacetic acid. Can. J. Plant Sci. 2002, 82, 437–441. [Google Scholar] [CrossRef]
- Bagautdinova, Z.Z.; Omelyanchuk, N.; Tyapkin, A.V.; Kovrizhnykh, V.V.; Lavrekha, V.V.; Zemlyanskaya, E.V. Salicylic acid in root growth and development. Int. J. Mol. Sci. 2022, 23, 2228. [Google Scholar] [CrossRef] [PubMed]
- Kaya, C.; Ugurlar, F.; Ashraf, M.; Ahmad, P. Salicylic acid interacts with other plant growth regulators and signal molecules in response to stressful environments in plants. Plant Physiol. Biochem. 2023, 196, 431–443. [Google Scholar] [CrossRef] [PubMed]
- Shah, S.H.; Islam, S.; Alamri, S.; Parrey, Z.A.; Mohammad, F.; Kalaji, H.M. Plant growth regulators mediated changes in the growth, photosynthesis, nutrient acquisition and productivity of mustard. Agriculture 2023, 13, 570. [Google Scholar] [CrossRef]
- Ogugua, U.V.; Kanu, S.A.; Ntushelo, K. Gibberellic acid improves growth and reduces heavy metal accumulation: A case study in tomato (Solanum lycopersicum L.) seedlings exposed to acid mine water. Heliyon 2022, 8. [Google Scholar] [CrossRef]
- Singh, J.; Dwivedi, A.K.; Devi, P.; Bajeli, J.; Tripathi, A.; Maurya, S.K. Effect of plant growth regulators on growth and yield attributes of tomato (Solanum lycopersicom Mill.). Int. J. Curr. Microbiol. Appl. Sci. 2019, 8, 1635–1641. [Google Scholar] [CrossRef]
- Ali, M.R.; Quddus, M.A.; Trina, T.N.; Salim, M.M.R.; Asaduzzaman, M. Influence of plant growth regulators on growth, yield, and quality of tomato grown under high temperature in the tropics in the summer. Int. J. Veg. Sci. 2022, 28, 59–75. [Google Scholar] [CrossRef]
- Gelmesa, D.; Abebie, B.; Desalegn, L. Regulation of tomato (Lycopersicon esculentum Mill.) fruit setting and earliness by gibberellic acid and 2, 4-dichlorophenoxy acetic acid application. Afr. J. Biotechnol. 2012, 11, 11200–11206. [Google Scholar]
- Chen, S.; Zhao, C.B.; Ren, R.M.; Jiang, J.H. Salicylic acid had the potential to enhance tolerance in horticultural crops against abiotic stress. Front. Plant Sci. 2023, 14, 1141918. [Google Scholar] [CrossRef]
- Jha, R.K.; Thapa, R.; Shrestha, A.K. Effect of GA3 and NAA on tomato production under protected cultivation in Kaski, Nepal. J. Agric. Food Res. 2022, 10, 100450. [Google Scholar] [CrossRef]
- Maboko, M.M.; Du Plooy, C.P. Effect of plant growth regulators on growth, yield, and quality of sweet pepper plants grown hydroponically. HortScience 2015, 50, 383–386. [Google Scholar] [CrossRef]
- Sultana, N.; Mannan, M.A.; Khan, S.A.K.U.; Gomasta, J.; Roy, T. Effect of Different Manures on Growth, Yield and Profitability of Small Scale Brinjal (Egg-Plant) Cultivation in Gunny Bag. Asian J. Agric. Hort. Res. 2022, 9, 52–60. [Google Scholar] [CrossRef]
- Lin, W.; Lin, M.; Zhou, H.; Wu, H.; Li, Z.; Lin, W. The effects of chemical and organic fertilizer usage on rhizosphere soil in tea orchards. PloS one 2019, 14, e0217018. [Google Scholar] [CrossRef] [PubMed]
- Apu, S.C.; Biswas, M.S.; Bhuiyan, M.A.B.; Gomasta, J.; Easmin, S.; Kayesh, E. Effect of Organic Amendments and Arbuscular Mycorrhizal Fungi on Plant Growth, Yield and Quality of Strawberry. Ann. Bangladesh Agric. 2022, 26, 71–82. [Google Scholar] [CrossRef]
- Emamverdian, A.; Ding, Y.; Mokhberdoran, F. The role of salicylic acid and gibberellin signaling in plant responses to abiotic stress with an emphasis on heavy metals. Plant Signal. Behav. 2020, 15, 1777372. [Google Scholar] [CrossRef]
- Katel, S.; Mandal, H.R.; Kattel, S.; Yadav, S.P.S.; Lamshal, B.S. Impacts of plant growth regulators in strawberry plant: A review. Heliyon 2022, 8, e11959. [Google Scholar] [CrossRef] [PubMed]
- Khan, M.N.E.A.; Hassan, J.; Biswas, M.S.; Khan, H.I.; Sultana, H.; Suborna, M.N.; .... Anik, A.A.M. Morphological and anatomical characterization of colchicine-induced polyploids in watermelon. Hortic. Environ. Biotechnol. 2023, 2023, 1–14.
- Aurdal, S.M.; Foereid, B.; Sogn, T.; Børresen, T.; Hvoslef-Eide, T.; Fagertun Remberg, S. Growth, yield and fruit quality of tomato Solanum lycopersicum L grown in sewage-based compost in a semi-hydroponic cultivation system. Acta Agric. Scand. - B Soil Plant Sci. 2022, 72, 902–912. [Google Scholar] [CrossRef]
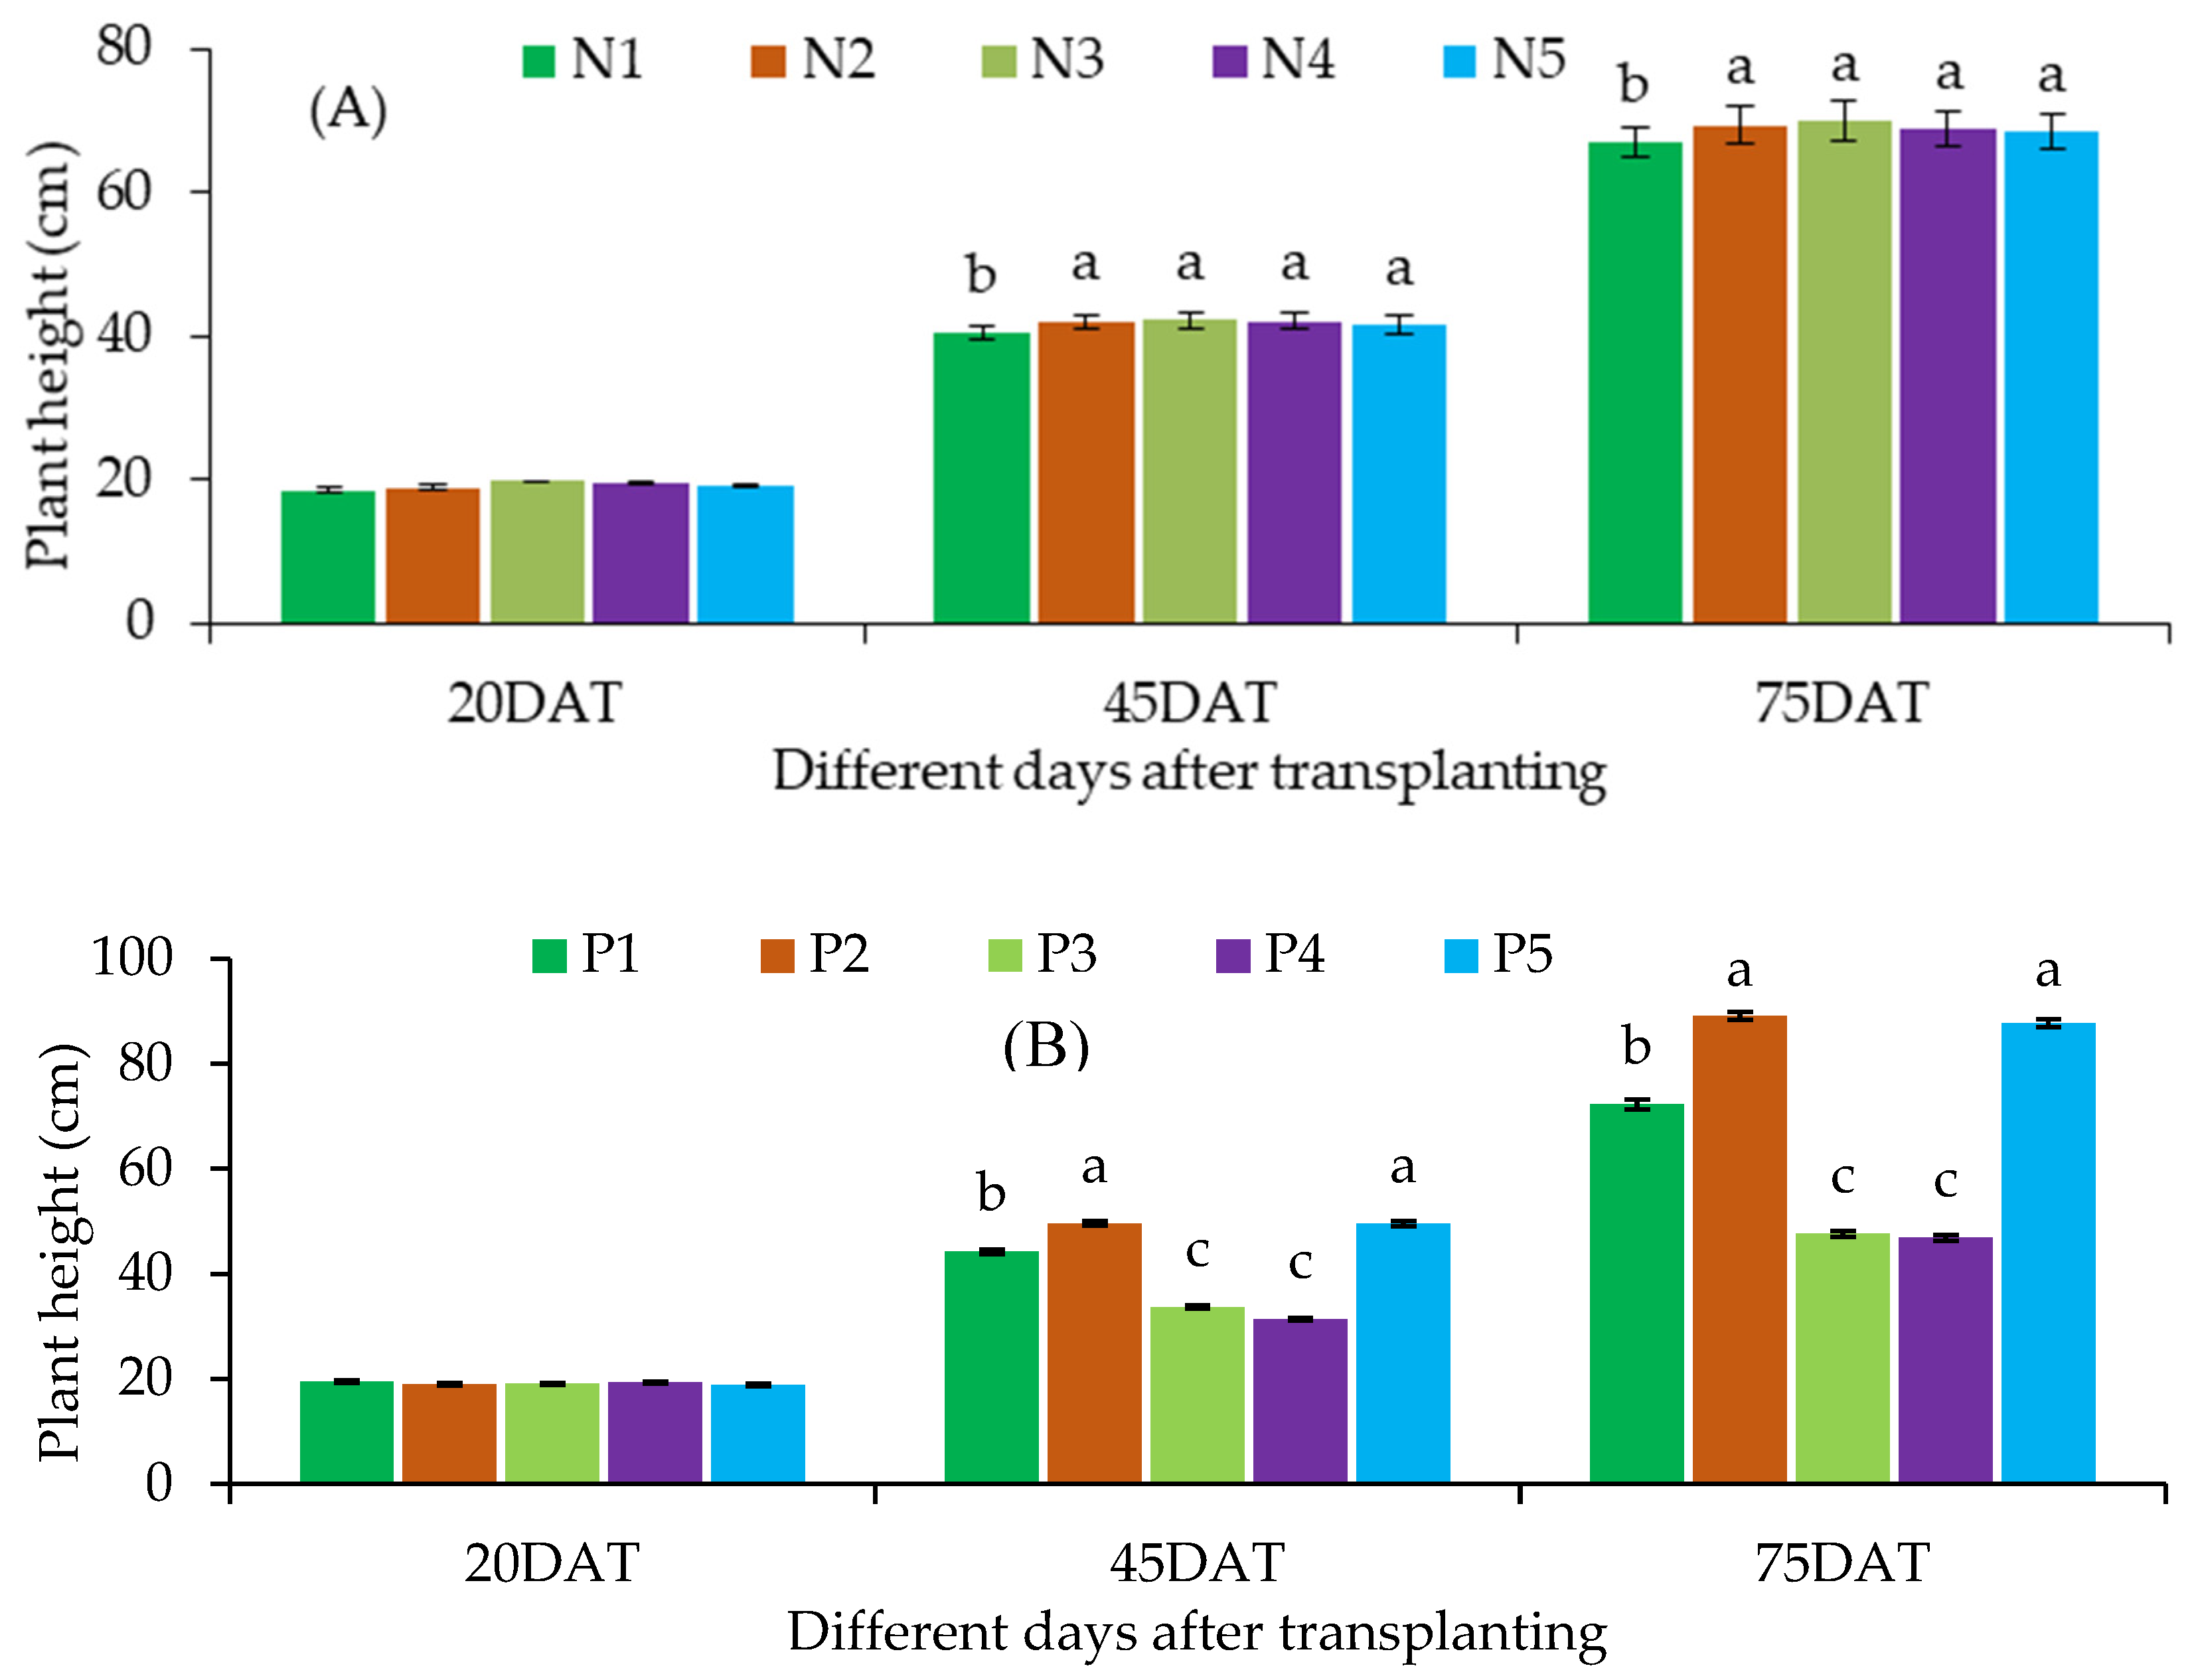
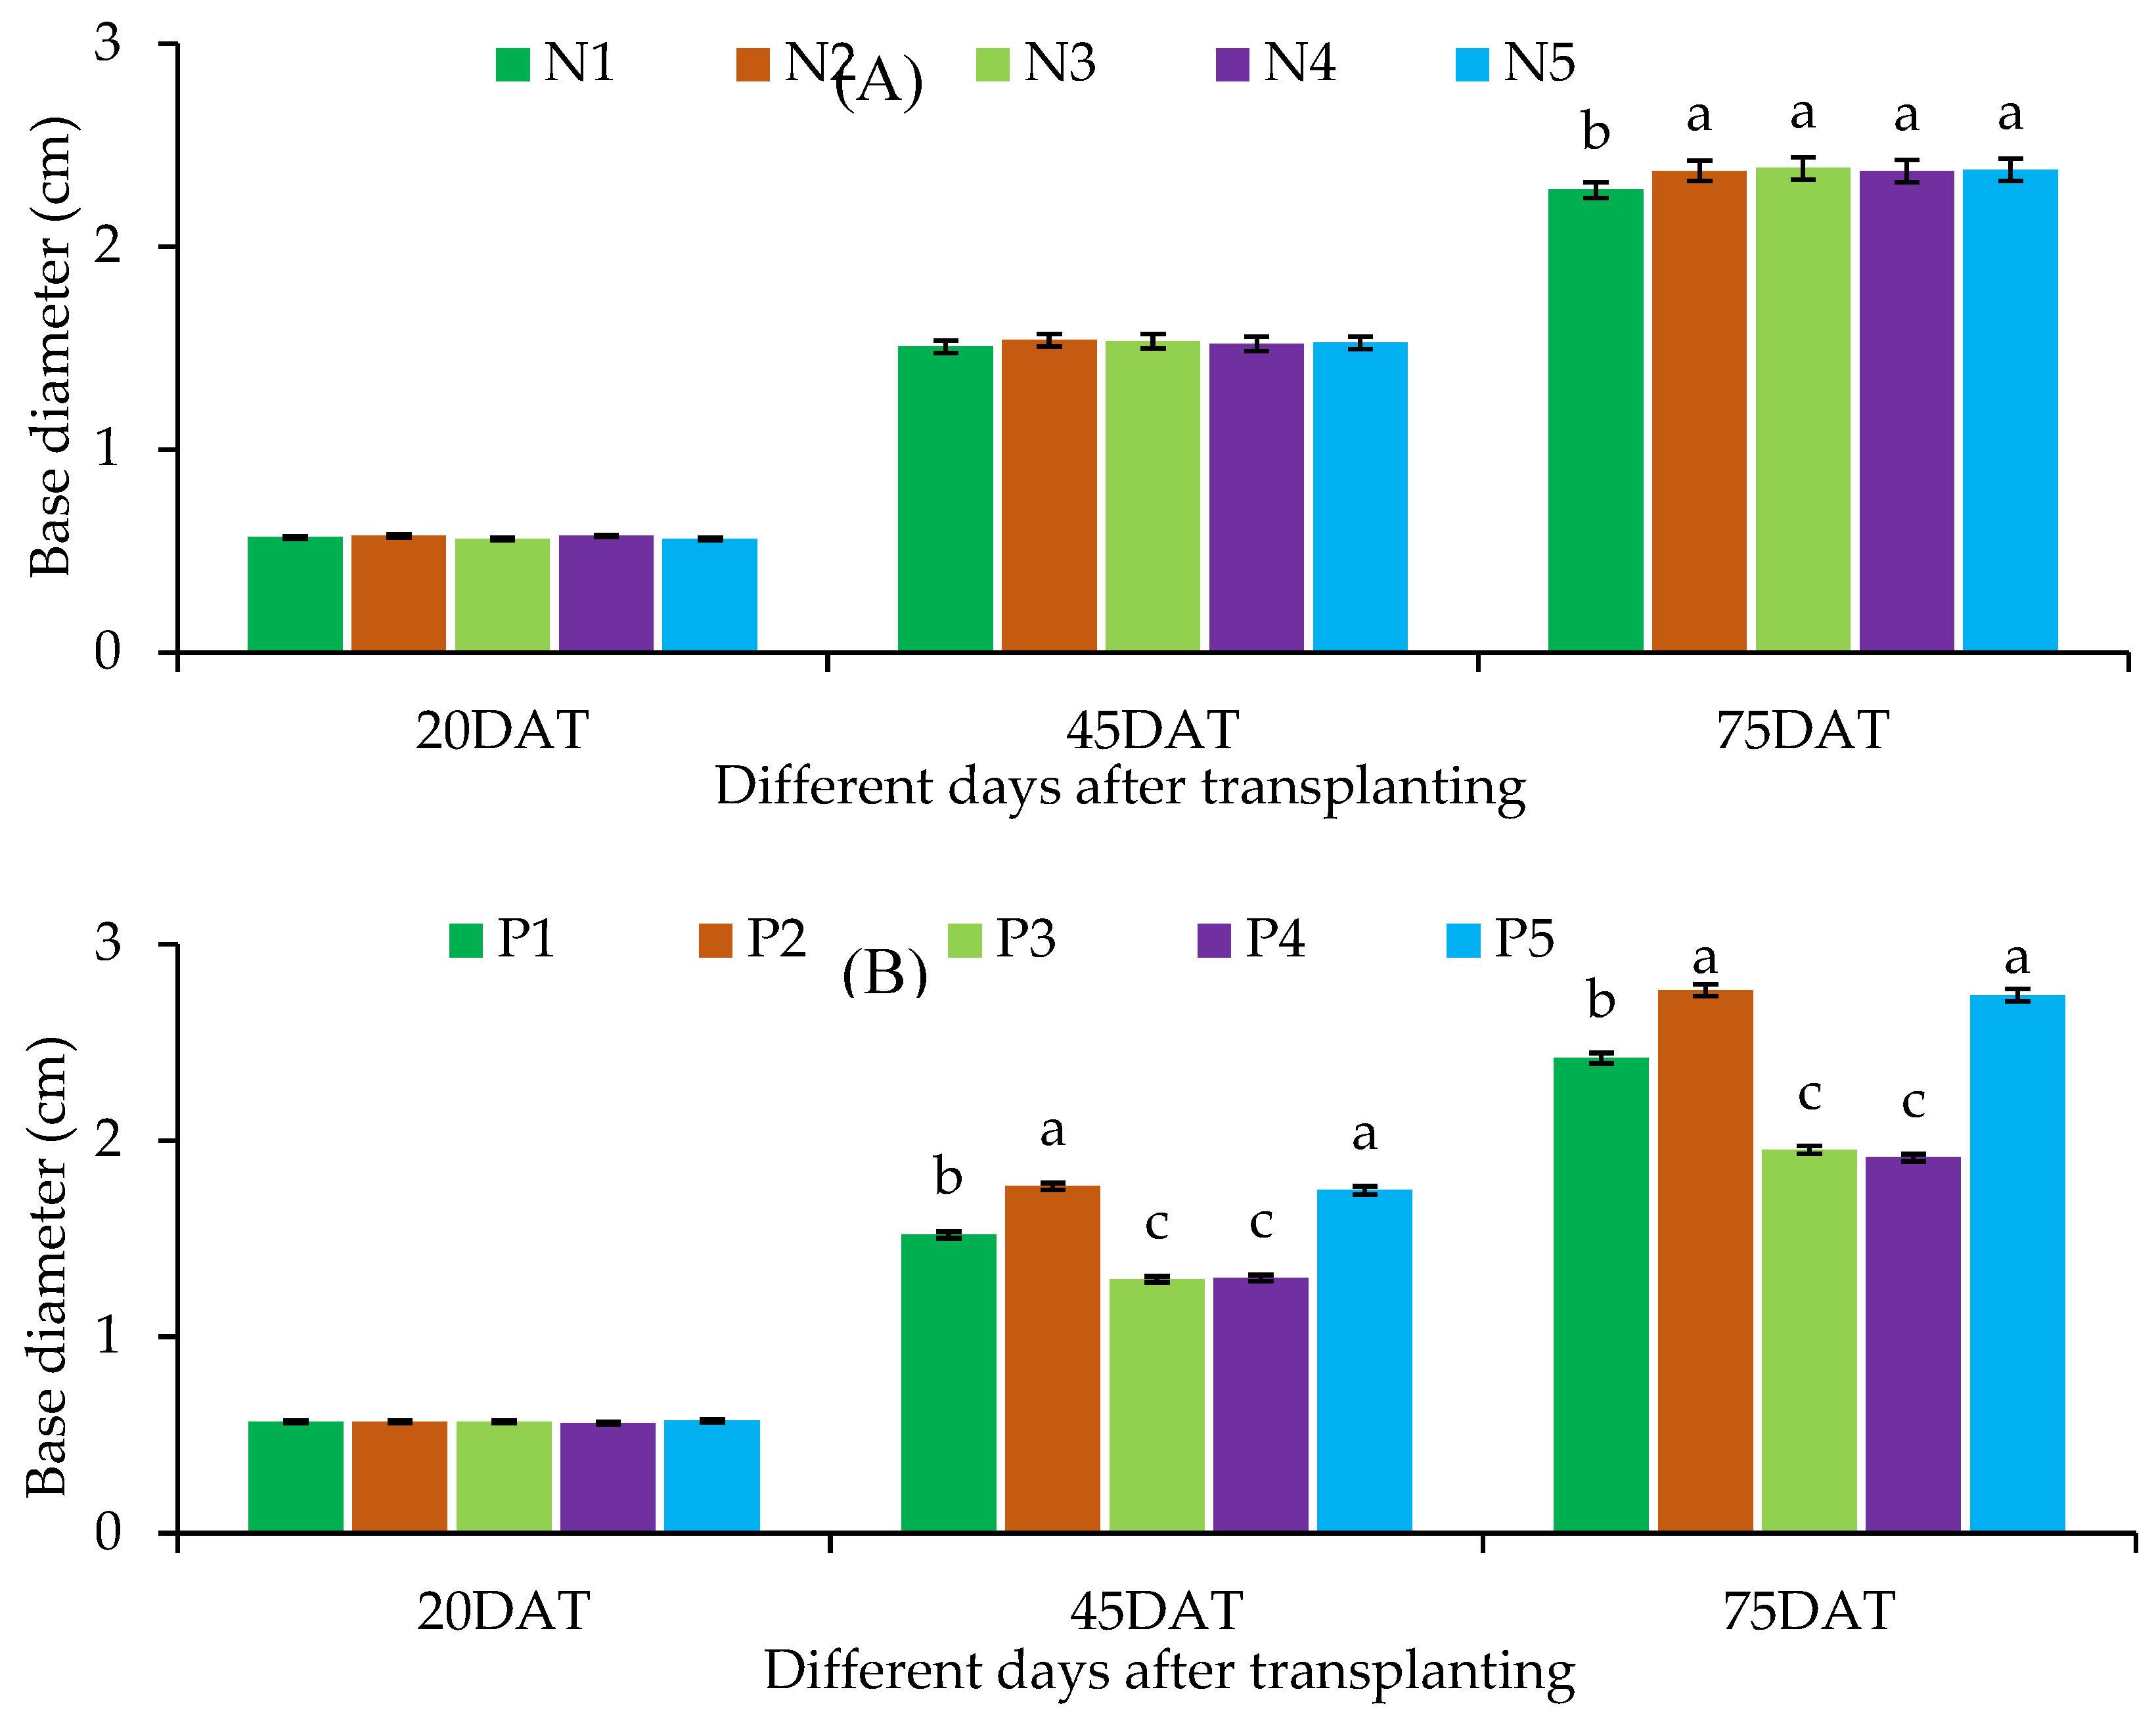
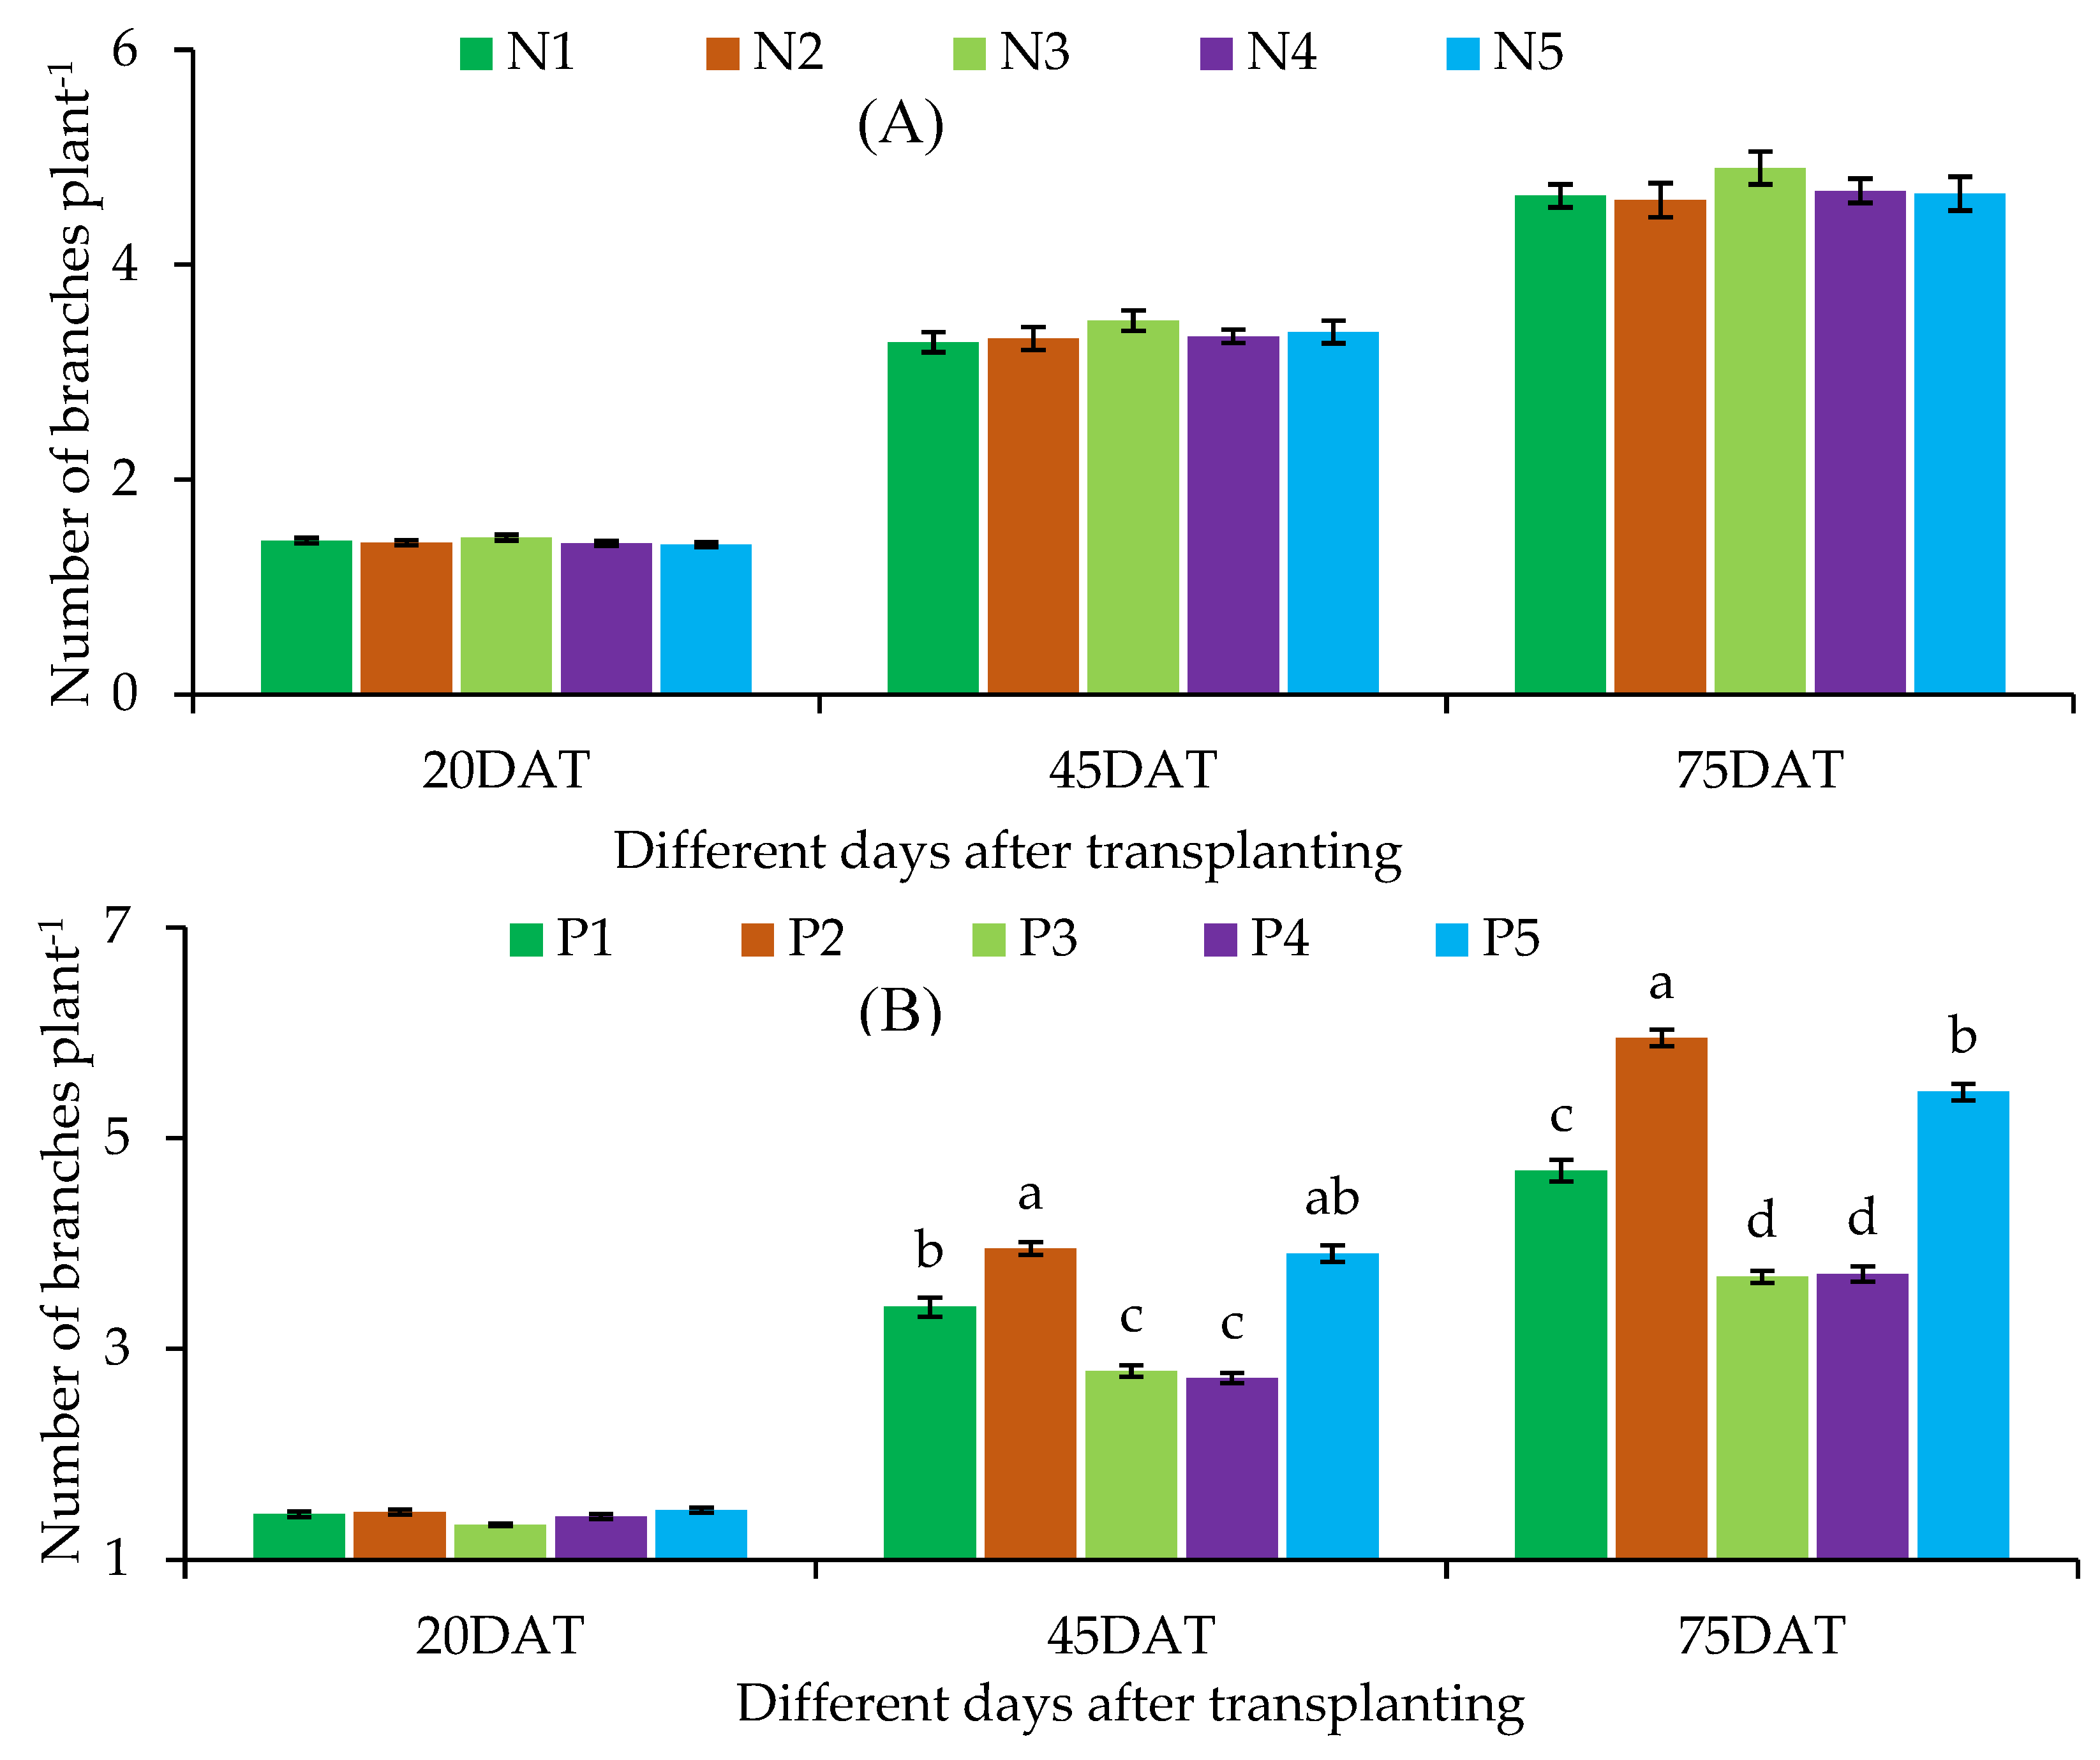
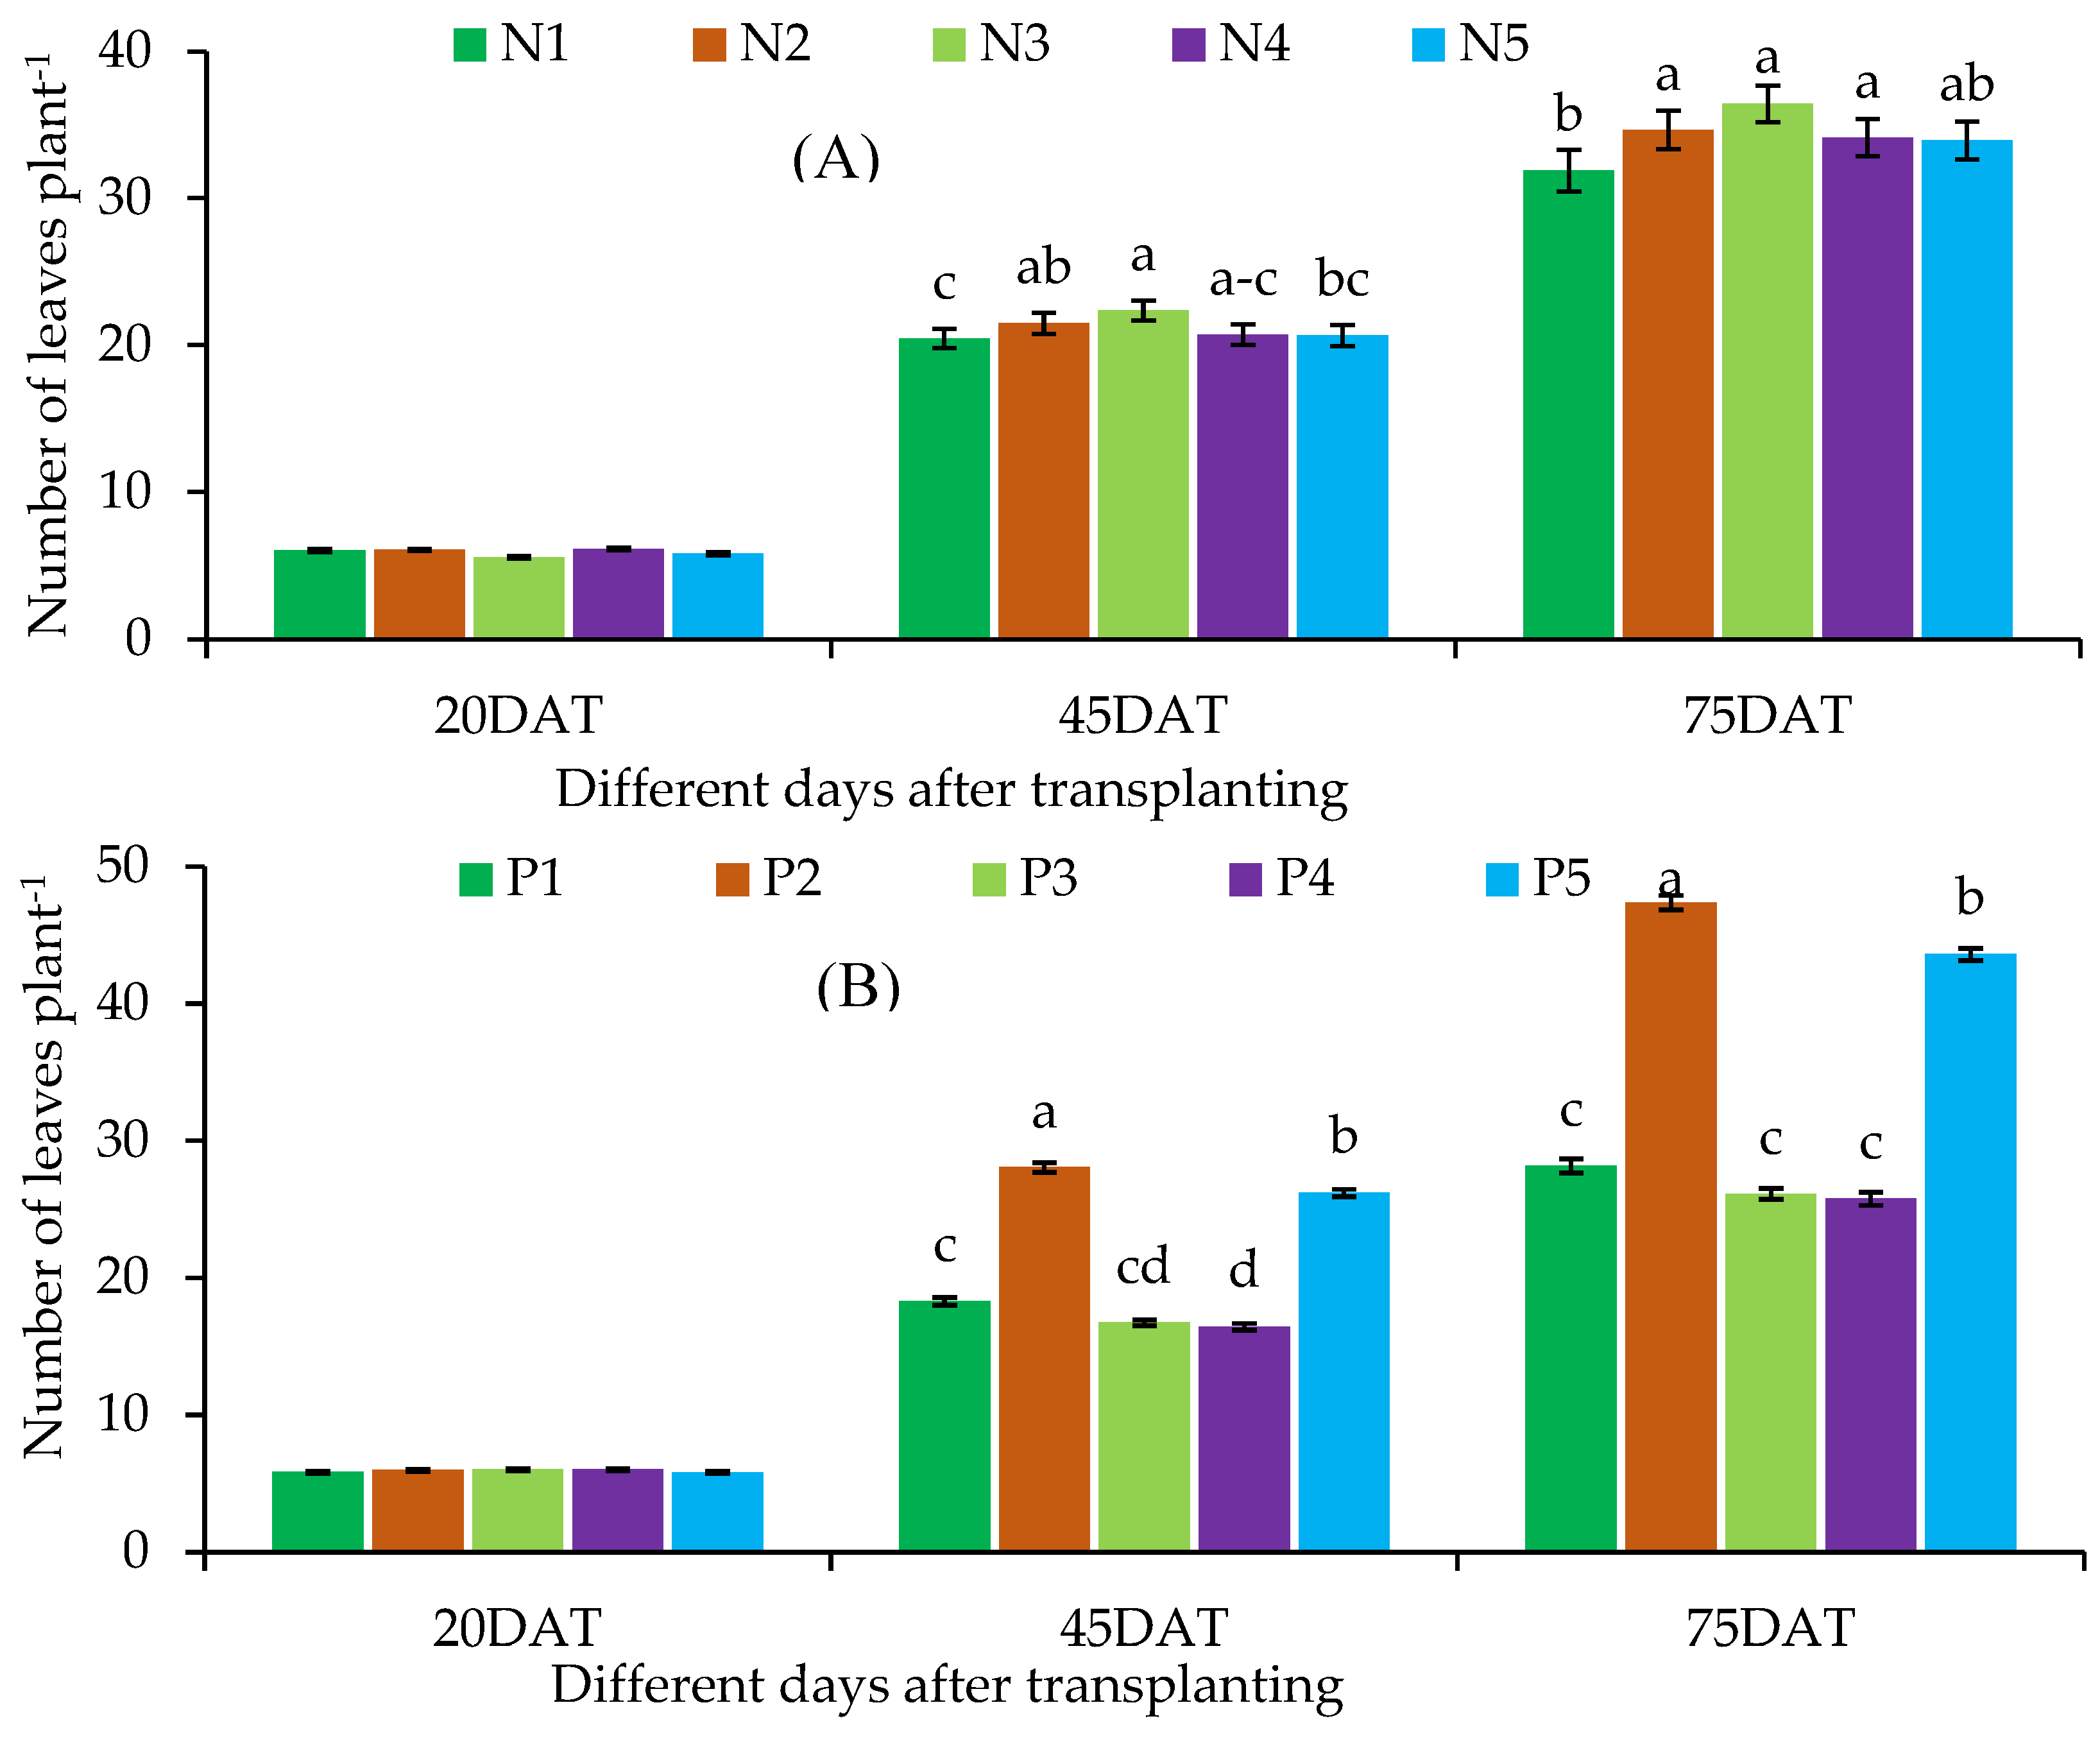
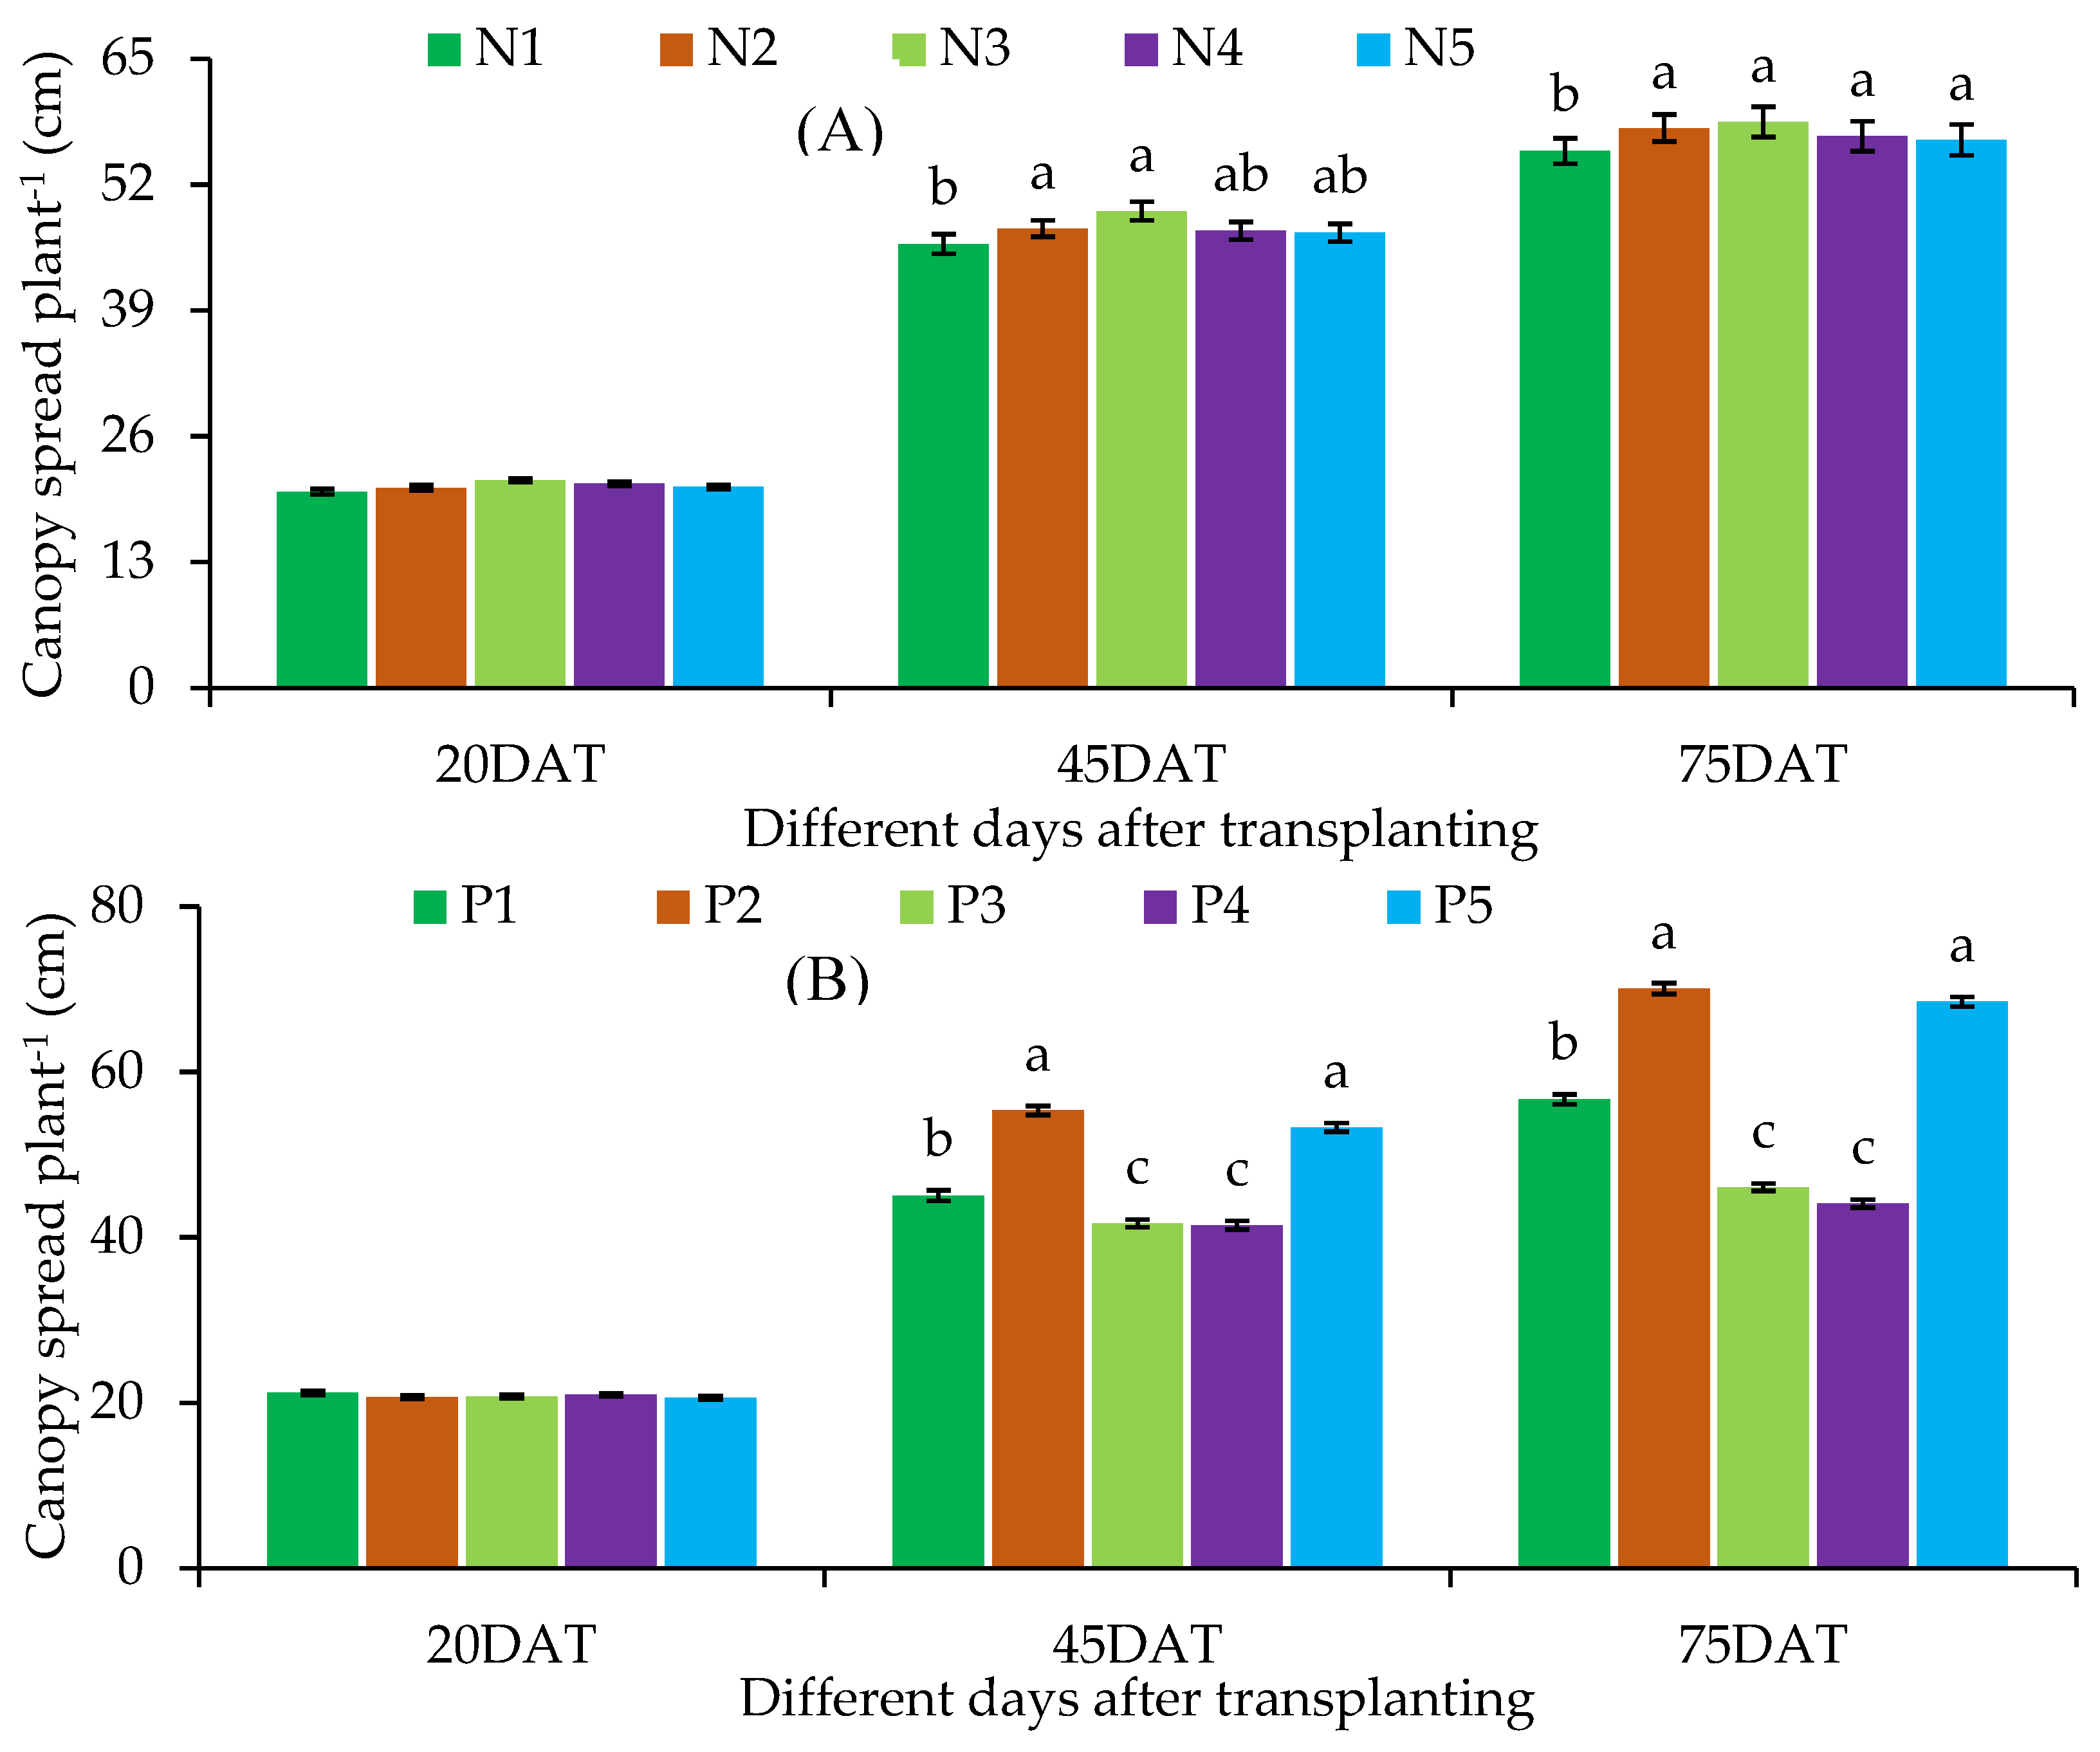
| Treatment combination | Plant height at different DAT | Base diameter at different DAT | Branch number at different DAT | |||||||
|---|---|---|---|---|---|---|---|---|---|---|
| 20 | 45 | 75 | 20 | 45 | 75 | 20 | 45 | 75 | ||
| N1 | P1 | 19.60 ± 1.39 | 39.10 ± 1.55de | 61.97 ± 2.48e | 0.57 ± 0.03 | 1.47 ± 0.12d-f | 2.13 ± 0.05fg | 1.30 ± 0.00 | 3.00 ± 0.17c-g | 4.00 ± 0.17ef |
| P2 | 18.53 ± 1.36 | 45.73 ± 1.86bc | 80.97 ± 3.06b-d | 0.57 ± 0.03 | 1.73 ± 0.09a-c | 2.43 ± 0.01d-f | 1.43 ± 0.13 | 3.87 ± 0.30a-c | 5.23 ± 0.29a-d | |
| P3 | 18.07 ± 1.45 | 31.57 ± 1.07fg | 47.90 ± 3.85f | 0.57 ± 0.03 | 1.33 ± 0.09ef | 1.90 ± 0.06g | 1.30 ± 0.00 | 2.57 ± 0.30g | 3.67 ± 0.20ef | |
| P4 | 18.23 ± 0.93 | 29.97 ± 0.95g | 46.57 ± 3.45f | 0.57 ± 0.03 | 1.30 ± 0.06ef | 1.83 ± 0.09g | 1.57 ± 0.13 | 2.33 ± 0.20g | 3.67 ± 0.38ef | |
| P5 | 18.40 ± 1.47 | 45.87 ± 1.87a-c | 79.67 ± 2.95cd | 0.57 ± 0.03 | 1.70 ± 0.12a-d | 2.37 ± 0.15ef | 1.57 ± 0.13 | 3.53 ± 0.39a-f | 5.13 ± 0.30a-d | |
| N2 | P1 | 18.47 ± 1.84 | 43.80 ± 1.94cd | 72.00 ± 3.53d | 0.57 ± 0.03 | 1.53 ± 0.09b-e | 2.43 ± 0.09d-f | 1.43 ± 0.13 | 3.57 ± 0.70a-f | 4.57 ± 0.47c-e |
| P2 | 18.40 ± 1.24 | 50.13 ± 1.64ab | 89.93 ± 3.58ab | 0.57 ± 0.03 | 1.77 ± 0.09ab | 2.77 ± 0.02a-c | 1.43 ± 0.13 | 3.67 ± 0.20a-e | 5.87 ± 0.30ab | |
| P3 | 19.47 ± 0.65 | 35.17 ± 1.23ef | 48.43 ± 2.69f | 0.57 ± 0.03 | 1.30 ± 0.06ef | 2.00 ± 0.12g | 1.33 ± 0.03 | 2.57 ± 0.30g | 3.47 ± 0.39f | |
| P4 | 19.53 ± 0.71 | 33.03 ± 1.26fg | 47.33 ± 3.44f | 0.57 ± 0.03 | 1.33 ± 0.09ef | 1.97 ± 0.09g | 1.30 ± 0.00 | 2.77 ± 0.23e-g | 3.43 ± 0.43f | |
| P5 | 18.97 ± 1.74 | 48.17 ± 2.73a-c | 89.20 ± 3.52ab | 0.60 ± 0.06 | 1.77 ± 0.09ab | 2.70 ± 0.12a-d | 1.57 ± 0.13 | 4.00 ± 0.40ab | 5.67 ± 0.49ab | |
| N3 | P1 | 20.67 ± 0.73 | 45.83 ± 2.00bc | 76.83 ± 3.09d | 0.57 ± 0.03 | 1.60 ± 0.06a-d | 2.50 ± 0.01b-e | 1.57 ± 0.01 | 4.00 ± 0.17ab | 5.67 ± 0.20ab |
| P2 | 20.10 ± 0.87 | 50.33 ± 2.07ab | 90.63 ± 2.95a | 0.57 ± 0.03 | 1.77 ± 0.09ab | 2.80 ± 0.12ab | 1.57 ± 0.13 | 4.00 ± 0.40ab | 6.13 ± 0.43a | |
| P3 | 19.30 ± 1.10 | 34.10 ± 1.49fg | 47.63 ± 3.06f | 0.53 ± 0.03 | 1.27 ± 0.09f | 1.97 ± 0.09g | 1.30 ± 0.00 | 2.87 ± 0.30d-g | 3.67 ± 0.33ef | |
| P4 | 19.10 ± 0.60 | 31.00 ± 1.59fg | 46.13 ± 3.23f | 0.57 ± 0.03 | 1.27 ± 0.09f | 1.90 ± 0.06g | 1.43 ± 0.13 | 2.67 ± 0.20fg | 3.57 ± 0.13ef | |
| P5 | 19.60 ± 0.78 | 49.97 ± 2.08ab | 88.77 ± 2.87a-c | 0.57 ± 0.03 | 1.77 ± 0.12ab | 2.77 ± 0.15a-c | 1.43 ± 0.13 | 3.87 ± 0.30a-c | 5.47 ± 0.23a-c | |
| N4 | P1 | 19.10 ± 0.59 | 45.73 ± 1.41bc | 73.23 ± 4.04d | 0.57 ± 0.03 | 1.50 ± 0.06c-f | 2.47 ± 0.09c-e | 1.43 ± 0.13 | 3.23 ± 0.23b-g | 4.57 ± 0.30c-e |
| P2 | 20.37 ± 0.96 | 49.67 ± 2.41ab | 89.20 ± 3.44ab | 0.57 ± 0.03 | 1.80 ± 0.12a | 2.77 ± 0.15a-c | 1.40 ± 0.10 | 3.77 ± 0.23a-d | 5.90 ± 0.20ab | |
| P3 | 19.53 ± 0.61 | 32.83 ± 1.60fg | 47.30 ± 2.70f | 0.60 ± 0.00 | 1.27 ± 0.09f | 1.93 ± 0.15g | 1.43 ± 0.13 | 3.00 ± 0.17c-g | 3.87 ± 0.30ef | |
| P4 | 20.07 ± 1.11 | 31.93 ± 1.31fg | 47.60 ± 2.80f | 0.57 ± 0.03 | 1.27 ± 0.09f | 1.93 ± 0.12g | 1.33 ± 0.03 | 3.00 ± 0.17c-g | 4.00 ± 0.40ef | |
| P5 | 17.90 ± 0.92 | 50.33 ± 2.59ab | 86.83 ± 3.56a-c | 0.57 ± 0.03 | 1.77 ± 0.09ab | 2.77 ± 0.09a-c | 1.43 ± 0.13 | 3.67 ± 0.33a-e | 5.10 ± 0.10b-d | |
| N5 | P1 | 19.63 ± 0.75 | 44.17 ± 1.33c | 71.97 ± 3.85d | 0.57 ± 0.03 | 1.50 ± 0.06c-f | 2.43 ± 0.09d-f | 1.43 ± 0.13 | 3.20 ± 0.49b-g | 4.43 ± 0.59d-f |
| P2 | 17.53 ± 0.58 | 49.53 ± 1.85ab | 88.77 ± 3.12a-c | 0.57 ± 0.03 | 1.77 ± 0.09ab | 2.83 ± 0.09a | 1.43 ± 0.13 | 4.23 ± 0.23a | 6.10 ± 0.49ab | |
| P3 | 19.07 ± 0.83 | 32.70 ± 1.39fg | 47.10 ± 2.51f | 0.57 ± 0.03 | 1.30 ± 0.06ef | 1.93 ± 0.09g | 1.30 ± 0.00 | 2.77 ± 0.23e-g | 3.67 ± 0.20ef | |
| P4 | 19.60 ± 1.25 | 30.80 ± 0.76fg | 46.27 ± 2.95f | 0.53 ± 0.03 | 1.33 ± 0.09ef | 1.93 ± 0.09g | 1.43 ± 0.13 | 2.77 ± 0.23e-g | 3.67 ± 0.33ef | |
| P5 | 19.60 ± 0.78 | 50.70 ± 1.77a | 88.57 ± 3.08a-c | 0.57 ± 0.03 | 1.73 ± 0.12a-c | 2.77 ± 0.12a-c | 1.37 ± 0.07 | 3.90 ± 0.49a-c | 5.43 ± 0.59a-d | |
| LS | ns | * | * | ns | * | * | ns | * | * | |
| Treatment combination |
Number of leaves plant-1 at different DAT | Canopy spread plant-1 at different DAT | |||||
|---|---|---|---|---|---|---|---|
| 20 | 45 | 75 | 20 | 45 | 75 | ||
| N1 | P1 | 6.20 ± 0.49 | 17.57 ± 0.87cd | 25.20 ± 1.65de | 21.30 ± 1.47 | 41.77 ± 2.72d-f | 52.60 ± 2.63ef |
| P2 | 6.00 ± 0.40 | 25.47 ± 1.18ab | 45.00 ± 1.65ab | 20.23 ± 1.44 | 52.20 ± 2.86ab | 64.40 ± 3.41a-c | |
| P3 | 6.43 ± 0.57 | 16.00 ± 0.68d | 23.33 ± 1.82de | 19.77 ± 1.52 | 38.33 ± 2.69ef | 45.90 ± 2.72fg | |
| P4 | 5.57 ± 0.30 | 14.67 ± 0.52d | 21.00 ± 2.48e | 19.93 ± 1.03 | 36.42 ± 2.317f | 41.43 ± 2.66g | |
| P5 | 6.00 ± 0.17 | 25.20 ± 1.16b | 42.67 ± 2.03b | 20.10 ± 1.56 | 51.67 ± 2.78a-c | 62.63 ± 2.02b-d | |
| N2 | P1 | 5.90 ± 0.20 | 17.67 ± 1.36cd | 27.67 ± 2.20cd | 20.17 ± 1.91 | 43.43 ± 3.19d-f | 56.03 ± 2.74de |
| P2 | 6.10 ± 0.42 | 29.00 ± 1.82a | 49.00 ± 3.06a | 20.10 ± 1.16 | 55.03 ± 2.24ab | 71.27 ± 3.12a | |
| P3 | 6.33 ± 0.20 | 17.33 ± 1.05cd | 26.00 ± 1.91de | 21.17 ± 0.68 | 42.80 ± 2.15d-f | 47.77 ± 2.06fg | |
| P4 | 5.80 ± 0.10 | 17.87 ± 1.44cd | 28.33 ± 2.05cd | 21.23 ± 0.69 | 43.30 ± 1.68d-f | 47.17 ± 1.97fg | |
| P5 | 6.33 ± 0.52 | 25.67 ± 1.93ab | 42.33 ± 2.73b | 20.77 ± 1.91 | 52.73 ± 3.00ab | 67.00 ± 2.69ab | |
| N3 | P1 | 5.67 ± 0.52 | 20.53 ± 1.18c | 33.00 ± 2.40c | 22.37 ± 0.77 | 48.70 ± 2.92b-d | 59.97 ± 2.96cd |
| P2 | 6.00 ± 0.40 | 28.63 ± 2.03ab | 47.67 ± 2.51ab | 21.80 ± 0.79 | 57.13 ± 3.08a | 71.10 ± 3.10a | |
| P3 | 5.67 ± 0.20 | 18.00 ± 1.25cd | 28.33 ± 2.33cd | 20.90 ± 1.17 | 43.20 ± 2.16d-f | 47.30 ± 1.80fg | |
| P4 | 5.10 ± 0.10 | 17.33 ± 1.25cd | 27.20 ± 1.73cd | 20.80 ± 0.66 | 42.13 ± 2.38d-f | 44.33 ± 2.41g | |
| P5 | 5.43 ± 0.30 | 27.30 ± 1.15ab | 46.00 ± 2.40ab | 21.30 ± 0.87 | 55.20 ± 2.76ab | 69.77 ± 2.80a | |
| N4 | P1 | 6.00 ± 0.40 | 17.63 ± 1.45cd | 27.67 ± 2.19cd | 20.80 ± 0.50 | 44.13 ± 3.09de | 57.17 ± 2.60de |
| P2 | 6.33 ± 0.52 | 27.67 ± 1.53ab | 46.33 ± 3.18ab | 22.07 ± 0.97 | 56.33 ± 2.38a | 69.97 ± 2.84a | |
| P3 | 6.33 ± 0.20 | 16.33 ± 0.88d | 26.67 ± 0.67de | 21.33 ± 0.61 | 41.67 ± 2.01d-f | 44.97 ± 1.86g | |
| P4 | 6.00 ± 0.40 | 16.33 ± 0.69d | 26.33 ± 1.20de | 21.77 ± 1.19 | 42.20 ± 2.27d-f | 44.20 ± 2.49g | |
| P5 | 6.10 ± 0.61 | 25.67 ± 1.05ab | 43.67 ± 1.93ab | 19.60 ± 1.01 | 51.87 ± 2.40ab | 68.73 ± 2.34ab | |
| N5 | P1 | 5.43 ± 0.30 | 17.67 ± 1.05cd | 27.00 ± 1.15c-e | 21.33 ± 0.84 | 44.60 ± 2.34c-e | 56.17 ± 2.73de |
| P2 | 5.47 ± 0.39 | 27.67 ± 1.63ab | 47.67 ± 2.33ab | 19.23 ± 0.50 | 54.37 ± 2.66ab | 69.70 ± 2.44a | |
| P3 | 5.33 ± 0.33 | 15.67 ± 0.69d | 26.33 ± 1.45de | 20.77 ± 0.90 | 40.60 ± 2.02ef | 44.43 ± 2.14g | |
| P4 | 6.63 ± 0.69 | 16.00 ± 1.15d | 26.00 ± 1.53de | 21.20 ± 1.35 | 41.40 ± 2.09ef | 43.30 ± 1.78g | |
| P5 | 6.23 ± 0.39 | 26.33 ± 1.33ab | 42.67 ± 1.45b | 21.30 ± 0.87 | 54.23 ± 1.85ab | 69.43 ± 2.27ab | |
| Level of significance | ns | * | * | ns | * | * | |
| Treatment | No. of leaflets leaf-1 | Internode length (cm) | Leaf area (cm2) | Leaf SPAD value | Shoot weight (g) | Root weight (g) | |||
|---|---|---|---|---|---|---|---|---|---|
| Fresh | Dry | Fresh | Dry | ||||||
| Fertilizer dose | |||||||||
| N1 | 7.94 ± 0.37b | 4.92 ± 0.22 | 286.33 ± 8.10b | 48.59 ± 1.21 | 265.61 ± 11.6b | 62.34 ± 2.20b | 33.84 ± 1.64b | 18.87 ± 0.50 | |
| N2 | 8.05 ± 0.40b | 5.08 ± 0.28 | 305.54 ± 7.07a | 50.44 ± 1.14 | 282.37 ± 10.9a | 66.17 ± 1.78a | 35.61 ± 1.46a | 19.33 ± 0.42 | |
| N3 | 8.31 ± 0.46ab | 5.13 ± 0.22 | 306.13 ± 13.9a | 51.34 ± 1.09 | 283.94 ± 13.8a | 67.91 ± 2.23a | 35.81 ± 1.74a | 19.16 ± 0.54 | |
| N4 | 8.47 ± 0.37a | 5.08 ± 0.22 | 300.33 ± 12a | 49.94 ± 0.95 | 278.38 ± 13.9a | 66.54 ± 1.91a | 35.30 ± 1.76a | 19.46 ± 0.40 | |
| N5 | 8.58 ± 0.46a | 5.06 ± 0.22 | 300.16 ± 12.5a | 50.21 ± 0.96 | 277.60 ± 14.5a | 65.92 ± 1.98a | 35.25 ± 1.77a | 19.00 ± 0.48 | |
| LS | * | ns | * | ns | ** | * | * | ns | |
| Plant growth regulator | |||||||||
| P1 | 8.51 ± 0.15c | 5.06 ± 0.10c | 314.41 ± 5.99b | 49.42 ± 1.02bc | 289.98 ± 4.78b | 66.59 ± 1.34b | 37.19 ± 0.57b | 19.21 ± 0.36b | |
| P2 | 10.19 ± 0.13a | 6.17 ± 0.14a | 337.66 ± 5.24a | 53.08 ± 1.00a | 328.13 ± 4.46a | 73.20 ± 1.28a | 41.47 ± 0.48a | 20.77 ± 0.26a | |
| P3 | 6.38 ± 0.20e | 4.32 ± 0.13d | 270.77 ± 7.18c | 47.87 ± 0.83c | 229.52 ± 4.61c | 58.74 ± 0.92c | 28.65 ± 0.50c | 17.79 ± 0.29c | |
| P4 | 6.91 ± 0.15d | 4.20 ± 0.13d | 247.89 ± 6.47d | 48.15 ± 0.83c | 216.82 ± 3.55d | 57.86 ± 0.95c | 27.39 ± 0.42c | 17.43 ± 0.28c | |
| P5 | 9.36 ± 0.16b | 5.53 ± 0.12b | 327.75 ± 6.64ab | 52.01 ± 1.03ab | 323.45 ± 3.82a | 72.49 ± 1.15a | 41.10 ± 0.52a | 20.61 ± 0.29a | |
| LS | ** | ** | ** | ** | ** | ** | ** | ** | |
| CV (%) | 6.79 | 10.72 | 6.22 | 7.49 | 4.88 | 6.44 | 5.01 | 6.11 | |
| Treatment combination |
No. of leaflets leaf-1 | Internode length (cm) | Leaf area (cm2) | SPAD value | Shoot weight (g) | Root weight (g) | |||
|---|---|---|---|---|---|---|---|---|---|
| Fresh | Dry | Fresh | Dry | ||||||
| N1 | P1 | 8.50 ± 0.17fg | 4.87 ± 0.42f-j | 286.40 ± 11.58g-j | 49.50 ± 2.68 | 273.89 ± 14.32g | 64.27 ± 4.29e-g | 35.66 ± 1.59f | 19.32 ± 1.06b-g |
| P2 | 9.67 ± 0.07b-d | 6.00 ± 0.38a-d | 321.11 ± 9.84c-f | 51.77 ± 2.67 | 305.34 ± 7.29d-f | 68.70 ± 3.61b-e | 39.69 ± 1.17b-e | 20.49 ± 0.60a-c | |
| P3 | 5.93 ± 0.29k | 4.40 ± 0.26h-j | 264.40 ± 10.66jk | 45.63 ± 2.83 | 220.10 ± 5.61i-k | 56.04 ± 3.04hi | 27.45 ± 1.44h-j | 17.75 ± 1.06g-j | |
| P4 | 6.93 ± 0.37ij | 4.03 ± 0.09j | 248.43 ± 5.18kl | 45.17 ± 2.18 | 214.52 ± 4.67jk | 53.47 ± 2.75i | 26.49 ± 0.85ij | 16.46 ± 0.10j | |
| P5 | 8.67 ± 0.24e-g | 5.30 ± 0.4c-g | 311.31 ± 6.89d-h | 50.90 ± 2.40 | 314.22 ± 6.42b-e | 69.24 ± 3.92a-e | 39.90 ± 1.56b-d | 20.32 ± 0.29a-d | |
| N2 | P1 | 8.47 ± 0.29fg | 5.13 ± 0.13d-h | 310.94 ± 10.6d-h | 47.50 ± 3.95 | 285.94 ± 4.94fg | 64.67 ± 3.90d-g | 36.46 ± 0.76f | 18.83 ± 0.98c-h |
| P2 | 9.80 ± 0.31a-c | 6.53 ± 0.41a | 326.65 ± 6.67b-f | 53.03 ± 2.13 | 327.29 ± 8.89a-d | 73.43 ± 1.89a-c | 41.36 ± 0.98a-c | 20.79 ± 0.27ab | |
| P3 | 6.13j ± 0.84k | 4.23 ± 0.38ij | 282.99 ± 11.2h-j | 49.33 ± 1.20 | 239.70 ± 5.50hi | 60.43 ± 2.05f-h | 29.64 ± 0.38gh | 18.42 ± 0.57d-i | |
| P4 | 6.93 ± 0.18ij | 4.03 ± 0.52j | 274.43 ± 6.23i-k | 49.73 ± 1.14 | 233.68 ± 3.07h-j | 59.93 ± 0.41f-i | 29.14 ± 0.54g-i | 17.79 ± 0.06g-j | |
| P5 | 8.93 ± 0.18c-f | 5.47 ± 0.29b-f | 332.68 ± 9.24a-e | 52.60 ± 3.38 | 325.24 ± 1.99a-d | 72.37 ± 2.19a-c | 41.46 ± 0.30a-c | 20.81 ± 0.91ab | |
| N3 | P1 | 8.87 ± 0.47d-f | 5.30 ± 0.26c-g | 342.52 ± 9.79a-c | 52.33 ± 1.74 | 310.56 ± 7.28c-e | 70.67 ± 2.99a-e | 39.52 ± 1.12c-e | 19.80 ± 1.11a-f |
| P2 | 10.40 ± 0.23ab | 6.07 ± 0.35a-c | 357.33 ± 13.97a | 54.93 ± 2.58 | 343.20 ± 8.21a | 76.17 ± 3.08a | 42.82 ± 0.81a | 21.23 ± 0.86ab | |
| P3 | 6.47 ± 0.29jk | 4.30 ± 0.26h-j | 306.13 ± 15.85e-h | 48.37 ± 2.80 | 249.97 ± 12.71h | 60.00 ± 1.99f-i | 30.76 ± 1.05g | 17.67 ± 0.46g-j | |
| P4 | 6.27 ± 0.29jk | 4.27 ± 0.19h-j | 225.03 ± 27.33l | 47.77 ± 0.73 | 204.88 ± 11.86k | 58.00 ± 0.96g-i | 26.12 ± 1.36j | 16.70 ± 0.27ij | |
| P5 | 9.53 ± 0.35b-e | 5.73 ± 0.23a-f | 299.61 ± 12.05f-i | 53.30 ± 2.00 | 311.11 ± 10.24c-e | 74.70 ± 3.02ab | 39.84 ± 1.31b-d | 20.37 ± 0.87a-c | |
| N4 | P1 | 7.87 ± 0.24gh | 5.03 ± 0.18e-i | 318.56 ± 4.79c-f | 47.93 ± 1.21 | 292.15 ± 8.49e-g | 66.60 ± 1.30c-f | 37.38 ± 1.07d-f | 19.32 ± 0.57b-g |
| P2 | 10.40 ± 0.12ab | 6.23 ± 0.23ab | 344.00 ± 12.25a-c | 55.03 ± 2.41 | 333.93 ± 7.8ab | 75.80 ± 3.12a | 41.93 ± 1.01a-c | 21.49 ± 0.19a | |
| P3 | 6.93 ± 0.12ij | 4.43 ± 0.43g-j | 251.63 ± 8.48kl | 48.30 ± 0.81 | 220.02 ± 7.85i-k | 59.20 ± 1.31g-i | 27.84 ± 0.80h-j | 18.17 ± 0.38e-j | |
| P4 | 7.47 ± 0.29hi | 4.40 ± 0.47h-j | 245.97 ± 5.47kl | 49.27 ± 1.97 | 216.72 ± 5.31jk | 59.50 ± 2.42g-i | 27.51 ± 0.69h-j | 17.90 ± 0.59f-j | |
| P5 | 9.67 ± 0.29b-d | 5.30 ± 0.3c-g | 341.50 ± 12.24a-d | 49.17 ± 1.66 | 329.08 ± 7.23a-c | 71.60 ± 0.81a-d | 41.84 ± 1.04a-c | 20.42 ± 0.46a-c | |
| N5 | P1 | 8.87 ± 0.18d-f | 4.97 ± 0.15e-i | 313.64 ± 9.31c-g | 49.83 ± 1.43 | 287.39 ± 9.56fg | 66.77 ± 2.33c-f | 36.94 ± 1.12ef | 18.79 ± 0.75c-h |
| P2 | 10.67 ± 0.18a | 6.00 ± 0.29a-d | 339.22 ± 7.97a-d | 50.63 ± 1.89 | 330.91 ± 6.53a-c | 71.90 ± 1.56a-c | 41.56 ± 0.82a-c | 19.85 ± 0.59a-e | |
| P3 | 6.43 ± 0.52jk | 4.23 ± 0.26ij | 248.70 ± 9.74kl | 47.70 ± 1.57 | 217.82 ± 6.47i-k | 58.00 ± 2.11g-i | 27.58 ± 0.76h-j | 16.93 ± 0.63h-j | |
| P4 | 6.93 ± 0.35ij | 4.27 ± 0.19h-j | 245.58 ± 1.62kl | 48.80 ± 2.71 | 214.29 ± 4.74jk | 58.40 ± 1.94g-i | 27.70 ± 0.27h-j | 18.31 ± 1.04e-j | |
| P5 | 10.00 ± 0.12ab | 5.83 ± 0.15a-e | 353.63 ± 12.04ab | 54.10 ± 2.23 | 337.58 ± 8.55a | 74.53 ± 2.31ab | 42.46 ± 1.23ab | 21.14 ± 0.87ab | |
| LS | ** | * | ** | ns | * | * | * | * | |
| Treatment | Days required to flowering | No. of flower clusters plant-1 | No. of flowers cluster-1 | No. of fruits cluster-1 | Single fruit weight (g) | Fruit yield plant-1 | |
|---|---|---|---|---|---|---|---|
| Fertilizer dose | |||||||
| N1 | 48.44 ± 1.12 | 10.93 ± 1.18b | 7.08 ± 0.29 | 4.61 ± 0.34 | 56.50 ± 2.04b | 3.32 ± 0.57b | |
| N2 | 48.07 ± 1.10 | 12.27 ± 1.36a | 7.37 ± 0.30 | 4.85 ± 0.26 | 61.23 ± 1.84a | 4.13 ± 0.66a | |
| N3 | 47.33 ± 1.24 | 12.55 ± 1.44a | 7.47 ± 0.34 | 4.91 ± 0.25 | 61.89 ± 2.02a | 4.33 ± 0.67a | |
| N4 | 48.28 ± 1.12 | 12.49 ± 1.40a | 7.46 ± 0.28 | 4.97 ± 0.22 | 60.04 ± 2.22a | 4.21 ± 0.67a | |
| N5 | 48.25 ± 1.09 | 12.35 ± 1.43a | 7.47 ± 0.27 | 5.04 ± 0.18 | 60.03 ± 2.18a | 4.13 ± 0.64a | |
| LS | ns | ** | ns | ns | * | ** | |
| Plant growth regulator | |||||||
| P1 | 50.05 ± 0.78a | 15.24 ± 0.28b | 8.19 ± 0.29b | 5.19 ± 0.12b | 61.34 ± 1.03b | 4.85 ± 0.17c | |
| P2 | 50.68 ± 0.85a | 16.85 ± 0.30a | 8.80 ± 0.33a | 5.79 ± 0.12a | 67.83 ± 0.84a | 6.61 ± 0.17a | |
| P3 | 44.27 ± 0.63b | 5.98 ± c0.14 | 5.58 ± 0.23c | 3.89 ± 0.15c | 51.38 ± 0.81c | 1.20 ± 0.06d | |
| P4 | 44.02 ± 0.67b | 5.93 ± 0.14c | 5.71 ± 0.37c | 3.92 ± 0.17c | 51.63 ± 0.78c | 1.21 ± 0.08d | |
| P5 | 51.35 ± 0.78a | 16.58 ± 0.31a | 8.57 ± 0.25a | 5.59 ± 0.10a | 67.51 ± 0.93a | 6.25 ± 0.18b | |
| LS | ** | ** | ** | ** | ** | ** | |
| CV (%) | 6.21 | 5.08 | 6.67 | 9.56 | 7.21 | 10.66 | |
| Treatment combination | Days required to flowering | No. of flower clusters plant-1 | No. of flowers cluster-1 | No. of fruits cluster-1 | Single fruit weight (g) | Fruit yield (kg plant-1) |
|
|---|---|---|---|---|---|---|---|
| N1 | P1 | 49.00 ± 2.82a-c | 13.57 ± 0.59f | 8.27 ± 0.18ab | 5.27 ± 0.18a-c | 57.37 ± 2.35ef | 4.08 ± 0.14d |
| P2 | 49.67 ± 2.53ab | 14.90 ± 0.67e | 8.77 ± 0.41a | 5.87 ± 0.33ab | 64.73 ± 1.97a-d | 5.63 ± 0.11b | |
| P3 | 43.00 ± 1.73d | 5.67 ± 0.20g | 4.83 ± 0.18e | 3.13 ± 0.18h | 48.33 ± 2.28g | 0.87 ± 0.11e | |
| P4 | 43.67 ± 1.86d | 5.67 ± 0.20g | 5.03 ± 0.52de | 3.27 ± 0.48gh | 48.90 ± 1.76g | 0.89 ± 0.09e | |
| P5 | 51.33 ± 2.23a | 14.87 ± 0.81e | 8.50 ± 0.17ab | 5.50 ± 0.17a-c | 63.17 ± 2.43a-e | 5.15 ± 0.29bc | |
| N2 | P1 | 50.00 ± 2.08ab | 15.33 ± 0.20de | 7.87 ± 0.35b | 4.90 ± 0.38c-e | 61.50 ± 2.65c-e | 4.64 ± 0.47cd |
| P2 | 50.67 ± 1.56a | 17.20 ± 0.49ab | 8.93 ± 0.26a | 5.93 ± 0.26a | 68.90 ± 3.69ab | 7.01 ± 0.38a | |
| P3 | 44.67 ± 1.59cd | 6.13 ± 0.30g | 5.67 ± 0.22cd | 3.77 ± 0.20f-h | 53.53 ± 0.92fg | 1.23 ± 0.06e | |
| P4 | 43.67 ± 1.59d | 6.10 ± 0.42g | 5.77 ± 0.47cd | 3.97 ± 0.39fg | 53.77 ± 1.55fg | 1.33 ± 0.24e | |
| P5 | 51.33 ± 2.03a | 16.57 ± 0.59a-c | 8.63 ± 0.19ab | 5.67 ± 0.18ab | 68.47 ± 2.77a-d | 6.43 ± 0.42a | |
| N3 | P1 | 50.67 ± 1.76a | 16.10 ± 0.49b-d | 8.47 ± 0.41ab | 5.40 ± 0.35a-c | 64.30 ± 3.34a-e | 5.55 ± 0.19b |
| P2 | 51.43 ± 2.5a | 17.50 ± 0.25a | 8.93 ± 0.35a | 5.80 ± 0.29ab | 68.47 ± 3.76a-d | 6.94 ± 0.47a | |
| P3 | 44.57 ± 1.6cd | 6.10 ± 0.49g | 5.77 ± 0.24cd | 3.97 ± 0.24fg | 53.87 ± 2.08fg | 1.29 ± 0.02e | |
| P4 | 44.43 ± 1.74cd | 5.90 ± 0.42g | 5.63 ± 0.35cd | 3.83 ± 0.35f-h | 53.13 ± 2.05fg | 1.23 ± 0.23e | |
| P5 | 51.10 ± 1.72a | 17.13 ± 0.30ab | 8.53 ± 0.35ab | 5.57 ± 0.33a-c | 69.70 ± 2.54a | 6.62 ± 0.27a | |
| N4 | P1 | 50.10 ± 1.33ab | 15.67 ± 0.20c-e | 8.17 ± 0.24ab | 5.17 ± 0.24b-d | 61.40 ± 1.34de | 4.96 ± 0.11bc |
| P2 | 51.30 ± 2.65a | 17.33 ± 0.20a | 8.90 ± 0.38a | 5.87 ± 0.35ab | 68.87 ± 2.35ab | 7.02 ± 0.61a | |
| P3 | 43.77 ± 1.13d | 6.23 ± 0.29g | 5.83 ± 0.24c | 4.17 ± 0.27ef | 50.53 ± 0.93fg | 1.32 ± 0.16e | |
| P4 | 44.57 ± 1.79cd | 6.00 ± 0.40g | 5.83 ± 0.26c | 4.13 ± 0.26ef | 50.83 ± 2.06fg | 1.26 ± 0.12e | |
| P5 | 51.67 ± 1.37a | 17.20 ± 0.49ab | 8.57 ± 0.26ab | 5.53 ± 0.23a-c | 68.57 ± 3.30a-c | 6.51 ± 0.27a | |
| N5 | P1 | 50.47 ± 1.75a | 15.53 ± 0.39c-e | 8.20 ± 0.29ab | 5.20 ± 0.29a-c | 62.13 ± 2.94b-e | 5.00 ± 0.19bc |
| P2 | 50.33 ± 1.37a | 17.33 ± 0.20a | 8.47 ± 0.26ab | 5.47 ± 0.26a-c | 68.17 ± 2.70a-d | 6.45 ± 0.28a | |
| P3 | 45.33 ± 1.7b-d | 5.77 ± 0.29g | 5.80 ± 0.23cd | 4.43 ± 0.23d-f | 50.63 ± 1.81fg | 1.29 ± 0.05e | |
| P4 | 43.77 ± 1.78d | 6.00 ± 0.17g | 6.27 ± 0.31c | 4.40 ± 0.31ef | 51.53 ± 1.88fg | 1.35 ± 0.06e | |
| P5 | 51.33 ± 2.68a | 17.13 ± 0.30ab | 8.60 ± 0.38ab | 5.70 ± 0.38ab | 67.67 ± 4.13a-d | 6.56 ± 0.14a | |
| Level of significance | * | ** | * | * | * | ** | |
Disclaimer/Publisher’s Note: The statements, opinions and data contained in all publications are solely those of the individual author(s) and contributor(s) and not of MDPI and/or the editor(s). MDPI and/or the editor(s) disclaim responsibility for any injury to people or property resulting from any ideas, methods, instructions or products referred to in the content. |
© 2023 by the authors. Licensee MDPI, Basel, Switzerland. This article is an open access article distributed under the terms and conditions of the Creative Commons Attribution (CC BY) license (http://creativecommons.org/licenses/by/4.0/).


