Submitted:
26 September 2023
Posted:
27 September 2023
You are already at the latest version
Abstract
While studies that examined risk perceptions in various environments have been previously conducted, the relationship between risk perceptions measured in such environments had not been examined. Such a relationship, if found, may indicate that when one learns to identify risks in one environment, they may identify risks more easily and quickly in another.This study examined the relationship between measures of risk perception in several separate environments. The findings suggest that when learning to identify and assess risks in a particular environment, one may better identify and assess risks in a similar environment – for example, learning to identify and assess risks while driving makes it easier to identify and assess risks when crossing a road. Conversely, the findings also indicate that learning to identify and assess risks in one environment does not make it possible to better identify and assess risks in a disparate environment – for example, learning to identify and assess risks while driving does not make it easier to identify and assess risks in a workplace environment. This may also suggest that while disparate environments such as the road environment and the workplace environment are perceived as two separate environments, the road environment is experienced as one single environment by both drivers and pedestrians.
Keywords:
Risk Perceptions
; Driving
; Economic Risks
; Road Environment
Introduction
In order to avoid possible accidents, both
construction workers and drivers assess and identify risks while working or
driving in the work environment or the road environment, respectively. There
are, of course, other risks inherent to different environments, beyond the
workplace or the road – for example, the risk one may take when buying stocks
in the stock exchange – a risk of losing money rather than physical injury.
Browsing the Internet may also entail some risks. Here, too, the risk is not a
physical one – it may occasionally be economic, and may occasionally be a risk
of a different kind – such as infringement of one’s privacy.
Many studies have examined the risk perceptions of
drivers and pedestrians in the road environment. In one study, for example,
drivers were asked to assess and rate the level of risk when driving above the
speed limit. Several variables were found to be associated with the drivers’
perceived degree of risk – age and salary levels, for example (Dionne et al.,
2007). Additionally, a negative relationship was found between risk estimates
and the tendency to drive at high speeds (Brown & Cotton, 2003). Further
studies that examined the risk perceptions of drivers found that most drivers evaluated
their own chances of receiving a speeding ticket, or of being involved in an
accident as a result of high-speed driving, as lower than those of other
drivers (Delhomme et al., 2009). Another study found that among young drivers
who participated in a program that included – among other things – a visit to
an emergency room in order to see the results of road accidents, risk
perceptions – and those associated with driving at high speeds in particular –
were higher following the participation in the program. (Lanning et al., 2018).
Studies of risk perceptions among pilots are rarer,
but it had been reported that when pilots were asked to rate the degree of risk
involved in certain situations while driving and while flying – such as flying
short distances when the weather is fine – more experienced pilots rated the
situations as less dangerous in comparison to less-experienced pilots. Some
relationships have also been found between the perception of risks while
driving and the perception of risks while flying (Hunter, 2006).
Studies that have examined reports of risks at work
and the perception of risks at work around the world are less rare. For
example, in a study conducted in Brazil, employees of a gas drilling company
reported chemical risks, physical risks, physiological risks, and biological
risks. Self-reported risks were associated with the number of hours worked per
week (duration on the job), where the higher the number of hours worked per
week, the fewer risks that were reported (Cezar-Vaz
et al., 2012). Another study conducted at a steel plant in India found
that age and experience have no relationship with job-risk perception, and also
found that workers who worked in different places in the factory perceived the job
risks differently (Basha & Maiti, 2013). In a different type of study where
an experiment was conducted, it was found that learning in a virtual reality work
environment affected risk perception, resulting in higher risk judgments. This
effect was found only on the judgment of probabilities for an accident, but not
on the judgment of the severity of injuries as a result of an accident, in the
event that an accident occurred. (Leder et al.. 2019).
Studies that examined health behavior have found
that an increase in the judgment of the likelihood of illness (threat
vulnerability) and the severity of illness (threat severity) increases the
likelihood of adaptive intentions or of behaviors (Floyd et al., 2000). Further
studies have also found a relationship between risk perception and behavior
(Brewer et al., 2004) and it was found that people who reported a high
perceived likelihood of getting sick were more likely to get vaccinated against
a disease. People who reported high perceived severity of a disease were more
likely to get vaccinated against the disease (Brewer et al., 2007).
Various studies were conducted in various, separate
environments – but the relationship between risk perceptions in these different
environments had not been examined. Such a relationship, if found, may indicate
that when one learns to identify risks in one environment, they may identify
risks more easily and quickly in another. Thus, a more experienced driver who
has been driving for many years may identify risks more easily when crossing a
road on foot, thanks to the experience they had gained as a driver. Additionally,
two seemingly separate environments may also be experienced as a single
environment rather than two separate ones. For example, it is possible that the
environment when driving a vehicle or crossing a road is experienced as a
single “road environment” rather than as two separate environments – i.e., a “driving”
environment when driving a vehicle and a “pedestrian” environment when crossing
the road. Even in this manner of situation, there should be a relationship between
the perception of risks while driving and the perception of risks when crossing
the road. Evidence that the road environment and the flight environment, for
example, are experienced as one environment – or that risks can be better
identified in one environment if we have learned to identify risks in another
environment – has been demonstrated in a study that found several associations
between risk perception while driving and risk perception while flying (Hunter,
2006).
It had been demonstrated that an activity learned
in one environment (or domain) may be performed more easily and quickly in a
new environment (Barnett & Ceci, 2002) – for example, learning to identify
and assess risks while driving may allow one to better identify and assess
risks when crossing a road. Similar new findings have also been demonstrated in
a recent study (Ratzon et al., 2021) – however, these findings may suggest
instead that drivers and pedestrians perceive the road as a single environment
and conduct themselves on the road accordingly, as other findings in the same
study indicated that – as recently argued – an activity learned in one
environment may not be quicker and more efficient to perform in a new
environment merely because it had been learned in that previous environment
alone. For example, identifying risks while driving is a skill learned in the
context of the activities of driving, and one should re-learn to identify risks
when approaching a new situation, such as while performing construction work.
This study examined the relationship between risk
perceptions in several environments. Such a relationship may indicate that learning
to identify risks in one environment may make it possible to identify risks
more easily and quickly in a new environment. A negative relationship would
indicate interference when moving between the two environments. Study
participants were asked to assess and rate the risks involved in several
situations. They were asked to assess and rate the risks involved in buying stocks
in the stock exchange, the risks involved in different situations when crossing
a road, while driving and during a pandemic.
Method
Participants
Five groups participated in the study. The first
group consisted of 23 participants, 9 of whom were women. The participants’
ages ranged from 24 to 40 (mean = 31.08, standard deviation = 4.28). The
second group consisted of 23 participants, 8 of whom were women. The participants’
ages ranged from 26 to 66 (mean = 35.30, standard deviation = 11.15). The third
group consisted of 41 participants, 9 of whom were women. The participants’
ages ranged from 20 to 53 (mean = 34.36, standard deviation = 7.11). The fourth
group consisted of 46 participants , 17 of whom were women. The participants’
ages ranged from 18 to 84 (mean = 35.03, standard deviation = 15.87). The fifth
group consisted of 32 participants, all of whom were men. The participants’
ages ranged from 18 to 45 (mean = 31, standard deviation = 7.35).
Instruments
Several questionnaires were used. A demographic
questionnaire included questions about age, gender, whether the participant has
a driver’s license and the number of years the participant has had a driver’s
license. The second questionnaire is the Risk Perception Questionnaire. In this
questionnaire, a variety of situations from different fields were presented and
the participant was asked to indicate each situation’s degree of risk on a 7-point
Likert scale (see Appendix). The questions were based on existing
questionnaires. The risk perception questionnaire for drivers is based on the
Driving Behavior Questionnaire (DBQ) (Reason et al., 1990). The questionnaire
on risk perception when crossing a road is based on a Pedestrian Behavior Scale
(PBS) (Granié et al., 2013). Additional questions were written based on a risk
perception questionnaire for construction workers (Perlman et al., 2014).
Procedure
The participants in the study were undergraduate
and graduate students at universities and colleges in Israel who volunteered to
fill out the questionnaire. Non-students who volunteered to fill out the
questionnaire had also participated. The e-questionnaire was sent to
participants by e-mail.
Results
First, the relationships between measures (the averages
of all questions in the questionnaires for each participant) in the first group
were examined. The relationships examined were those between the measures in the
questionnaire regarding risk perception while driving, the measures in the
questionnaire regarding risk perception when crossing a road, the measures in
the questionnaire regarding risk perception while buying stocks in the stock
exchange, and the parameters of age and driving seniority (number of years for
which a driver has had a driver's license). These relationships are presented
in Table 1. The reliability (Cronbach's
Alpha) for the measure of risk perception while driving was 0.943, the reliability
for the measure of risk perception while crossing a road was .9480 and the reliability
of the measure of risk perception when buying stocks was .7840.

Table 1.
The Relationships Between the Variables.
| Variables | 1 | 2 | 3 | 4 |
|---|---|---|---|---|
| 1. Risk perception when crossing a road | ||||
| 2. Risk perception while driving | .873** | |||
| 3. Risk perception when buying stocks | .661** | .588** | ||
| 4. Age | 111.- | 024. | 032.- | |
| **. Correlation is significant at the 0.01 level (2-tailed). | ||||
| *. Correlation is significant at the 0.05 level (2-tailed). | ||||
A regression analysis was conducted to examine the relationships between the measures. The regression model is significant and explains 76.8% of the variance (adjusted R-squared=.768), F (4, 22) =19.224, p<.001. Table 2 presents the values of the regression analysis.
The findings indicate that there is a relationship between the measure of risk perception when crossing a road, the measure of risk perception while driving, and the number of years for which a driver had been driving. No relationship has been found between the measure of risk perception when crossing a road and the measure of risk perception when buying stocks. These findings indicate that there is a relationship between the perception of risks while driving and the perception of risks when crossing a road, while the relationship between risk perception when crossing a road and risk perception when buying stocks is small and not significant. This relationship between risk perception when driving and risk perception when crossing a road may indicate that knowledge learned in one environment can be used when in a new environment. It is also possible that the road environment is perceived as one environment and not as two distinct environments.
Table 2.
The Relationship Between the Average Risk Perception when Crossing a Road (Dependent Variable), the Average Risk Perception while Driving (Score in the Risk Perception while Driving Questionnaire), the Average Risk Perception when Buying Stocks (Score in the Risk Perception when Buying Stocks Questionnaire), Age and Sex (N=23).
| Variables | B | Std. Error | Beta | T | Sig. |
|---|---|---|---|---|---|
| Risk perception while driving | .784 | .153 | .752 | 5.118 | .000 |
| Risks perception when buying stocks | .351 | .216 | .215 | 1.627 | .121 |
| Age | -.039 | .034 | -.124 | -1.123 | .276 |
| Sex | -.015 | .334 | -.006 | -.046 | .964 |
Next, the relationships between the measures in the second group were examined. The relationships examined were those between the measures in the questionnaire regarding risk perception while driving, the measures in the questionnaire regarding risk perception when crossing a road, the measures in the questionnaire regarding risk perception when buying stocks in the stock exchange, age and driving seniority. These relationships are presented in Table 3. Cronbach's Alpha for the measure of risk perception while driving was 0.887, Cronbach's Alpha for the measure of risk perception when crossing a road was 0.916, and Cronbach's Alpha for the measure of risk perception when buying stocks was 0.914.
Table 3.
The Relationships Between the Variables.
| Variables | 1 | 2 | 3 | 4 | 5 |
|---|---|---|---|---|---|
| 1. Risk perception when crossing a road | |||||
| 2. Risk perception while driving | .873** | ||||
| 3. Risk perception when buying stocks | .503* | .490* | |||
| 4. Driving seniority | .187 | .223 | .115 | ||
| 5. Age | 277. | .294 | .207 | .955** | |
| **. Correlation is significant at the 0.01 level (2-tailed). | |||||
| *. Correlation is significant at the 0.05 level (2-tailed). | |||||
A regression analysis was conducted to examine the relationships between the measures. The regression model is significant and explains 75.7% of the variance (adjusted R-squared=.757), F (5, 22) =14.683, p<.001. Table 4 presents the values of the regression analysis.
Here, too, the findings indicate that there is a relationship between the measure of risk perception when crossing a road, the measure of risk perception while driving and the number of years for which a driver had been driving – and no relationship was found between the measure of risk perception while crossing a road and the measure of risk perception index when buying stocks. As said, these findings indicate that there is a relationship between the perception of risks while driving and the perception of risks when crossing a road, while the relationship between risk perception when crossing a road and risk perceptions when buying stocks is small and not significant. This relationship between risk perception while driving and risk perception while crossing a road may indicate that knowledge learned in one environment can be used when in a new environment. It is also possible that the road environment is perceived as one environment and not as two distinct environments.
Table 4.
The Relationship Between the Average Risk Perception when Crossing a Road (Dependent Variable), the Average Risk Perception while Driving (Score in the Risk Perception while Driving Questionnaire), the Average Risk Perception when Buying Stocks (Score in the Risk Perception when Buying Stocks Questionnaire), the Number of Years with a Driver’s License (Driving Seniority), Age and Sex (N=23).
| Variables | B | Std. Error | Beta | T | Sig. |
|---|---|---|---|---|---|
| Risk perception while driving | .915 | .144 | .791 | 6.335 | .000 |
| Risk perception when buying stocks | -.001 | .139 | -.001 | -.008 | .994 |
| Driving seniority | -.003 | .034 | -.034 | -.086 | .932 |
| Age | .007 | .036 | .081 | .206 | .839 |
| Sex | -.476 | .263 | -.230 | -1.812 | .088 |
Next, the relationships between the measures in the third group were examined. Here, too, the relationships examined were those between the measures in the questionnaire regarding risk perception while driving, the measures in the questionnaire regarding risk perception when crossing a road, the measures in the questionnaire regarding risk perception when buying stocks in the stock exchange, age and driving seniority. These relationships are presented in Table 5. Cronbach’s Alpha for the measure of risk perception while driving was 0.827, Cronbach’s Alpha for the measure of risk perception while crossing a road was 0.904, and Cronbach’s Alpha for the measure of risk perception when buying stocks was 0.609.
Table 5.
The Relationships Between the Variables.
| Variables | 1 | 2 | 3 | 4 | 5 |
|---|---|---|---|---|---|
| 1. Risk perception when crossing a road | |||||
| 2. Risk perception while driving | .762** | ||||
| 3. Risk perception when buying stocks | .057 | .204 | |||
| 4. Driving seniority | .249 | .170 | .198 | ||
| 5. Age | 271. | .357* | .268 | .768** | |
| **. Correlation is significant at the 0.01 level (2-tailed). | |||||
| *. Correlation is significant at the 0.05 level (2-tailed). | |||||
A regression analysis was conducted to examine the relationships between the measures. The regression model is significant and explains 75.7% of the variance (adjusted R-squared=.757), F (5, 22) =14.683, p<.001. Table 6 presents the values of the regression analysis.
Once again, the findings indicate a relationship between the measure of risk perception when crossing a road, the measure of risk perception while driving and the number of years for which a driver had been driving, and no relationship was found between the measure of risk perception when crossing a road and the measure of risk perception when buying stocks.
Table 6.
The Relationship between the Average Risk Perception when Crossing a Road (Dependent Variable), the Average Risk Perception while Driving (Score in the Risk Perception while Driving Questionnaire), the Average Risk Perception when Buying Stocks (Score in the Risk Perception when Buying Stocks Questionnaire), the Number of Years with a Driver’s License (Driving Seniority), Age and Sex (N=41).
| Variables | B | Std. Error | Beta | T | Sig. |
|---|---|---|---|---|---|
| Risk perception as a driver | .913 | .133 | .804 | 6.846 | .000 |
| Risk perception when buying stocks | -.220 | .195 | -.124 | -1.126 | .268 |
| Driving seniority | .028 | .016 | .292 | 1.772 | .085 |
| Age | -.027 | .021 | -.221 | -1.264 | .215 |
| Sex | -.104 | .226 | .804 | -.462 | .647 |
Next, the relationships between the measures in the fourth group were examined. The relationships examined were those between the measures in the questionnaire regarding risk perception while driving, the measures in the questionnaire regarding risk perception when crossing a road, and the measures in the questionnaire regarding risk perceptions during the COVID-19 pandemic, age and driving seniority. These relationships are shown in Table 7. Reliability (Cronbach's Alpha) for the measure of risk perception while driving was 0.885, Cronbach's Alpha for the measure of risk perception when crossing a road was 0.921, and Cronbach's Alpha for the measure of risk perceptions during the COVID-19 pandemic was 0.955.
Table 7.
The Relationships Between the Variables.
| Variables | 1 | 2 | 3 | 4 | 5 |
|---|---|---|---|---|---|
| 1. Risk perception when crossing a road | |||||
| 2. Risk perception while driving | .639** | ||||
| 3. Risk perception during a pandemic | .402* | .512** | |||
| 4. Driving seniority | .202 | -.1 83 | .109 | ||
| 5. Age | .466* | .128 | .231 | .548** | |
| **. Correlation is significant at the 0.01 level (2-tailed). | |||||
| *. Correlation is significant at the 0.05 level (2-tailed). | |||||
A regression analysis was conducted to examine the relationships between the measures. The regression model is significant and explains 46.7% of the variance (adjusted R-squared=.467), F (5, 25) =5.383, p<.01. Table 8 presents the values of the regression analysis.
As before, the findings indicate that that there is a relationship between the measure of risk perception while crossing a road, the measure of risk perception while driving and the number of years for which a driver had been driving – and no relationship was found between the measure of risk perception while crossing a road and the measure of risk perception during a pandemic.
Table 8.
The Relationship Between the Average Risk Perception when Crossing a Road (Dependent Variable), the Average Risk Perception while Driving (Score in the Risk Perception while Driving Questionnaire), the Average Risk Perception During a Pandemic (Score in the Risk Perception During a Pandemic Questionnaire), the Number of Years with a Driver’s License (Driving Seniority), Age and Sex (N=25).
| Variables | B | Std. Error | Beta | T | Sig. |
|---|---|---|---|---|---|
| Risk perception while driving | .786 | .230 | .626 | 3.415 | .003 |
| Risk perception during a pandemic | -.014 | .148 | -.018 | -.096 | .924 |
| Driving seniority | .014 | .016 | .163 | .832 | .415 |
| Age | .020 | .012 | .305 | 1.676 | .109 |
| Sex | -.072 | .379 | -.033 | -.189 | .852 |
Finally, the relationships between the measures in the fifth group were examined. The relationships examined were those between the measures in the questionnaire regarding risk perception questionnaire while driving, the measures in the questionnaire regarding risk perception while riding a motorcycle, the measures in the questionnaire regarding risk perception during other activities, age and driving seniority for both automobiles and motorcycles. These relationships are presented in Table 9. Reliability (Cronbach’s Alpha) for the measure of risk perception while driving was 0.857, Cronbach's Alpha for the measure of risk perception while riding a motorcycle was 0.942, and Cronbach's Alpha for the measure of risk perception during general activities was 0.892.
Table 9.
The Relationships Between the Variables.
| Variables | 1 | 2 | 3 | 4 | 5 | 6 |
|---|---|---|---|---|---|---|
| 1. Risk perception while riding a motorcycle | ||||||
| 2. Risk perception while driving | .844** | |||||
| 3. General risk perception | .517** | .548** | ||||
| 4. Driving seniority | -.306 | -.179 | -.141 | |||
| 5. Driving seniority as a motorcyclist | -.424* | -.244 | -.090 | .793** | ||
| 6. Age | -.289 | -.209 | -.078 | .788** | .740** | |
| **. Correlation is significant at the 0.01 level (2-tailed). | ||||||
| *. Correlation is significant at the 0.05 level (2-tailed). | ||||||
A regression analysis was conducted to examine the relationships between the measures. The regression model is significant and explains 73.1% of the variance (adjusted R-squared=.731), F (5, 31) =17.849, p<.001. Table 10 presents the values of the regression analysis.
The findings indicate that there is a relationship between the measure of risk perception while driving an automobile, the measure of risk perception while riding a motorcycle and the number of years driving and riding motorcycles – and no relationship was found between the measure of risk perception while riding a motorcycle and the measure of risk perception for general activities.
Table 10.
The Relationship Between Average Risk Perception when Riding a Motorcycle (Dependent Variable), the Average Risk Perception while Driving an Automobile (Score in the Risk Perception while Driving Questionnaire), the Average Risk Perception in General Activities (Score in the Risk Perception in General Activities Questionnaire), the Number of Years with a Driver’s License (Driving Seniority) for both Automobiles and Motorcycles, and Age (N=25).
| Variables | B | Std. Error | Beta | T | Sig. |
|---|---|---|---|---|---|
| Risk perception while driving | .852 | .134 | .738 | 6.374 | .000 |
| General risk perception | .088 | .107 | .093 | .824 | .418 |
| Driving seniority (automobile) | .002 | .022 | .018 | .102 | .919 |
| Driving seniority (motorcycle) | -.040 | .020 | -.322 | -1.969 | .060 |
| Age | .013 | .021 | .097 | .604 | .551 |
Discussion
This study found a relationship between risk perception while driving an automobile and risk perception when crossing a road, suggesting that the ability to identify and assess risks when crossing a road is related to the ability to identify and assess risks while driving. In addition, a relationship was found between the risk perception while driving an automobile and risk perception while riding a motorcycle. Suggesting that the ability to identify and assess risks when driving a motorcycle is related to the ability to identify and assess risks when driving an automobile. These findings may indicate that training to perform a particular task in a particular environment may lead to improved performance of the same task in a different environment – for example, if one learns to identify and assess risks while driving, it will be easier for them to identify and assess risks when crossing a road, or riding a motorcycle.
However, no relationships had been found between the perception of risks while crossing a road and the perception of risks when buying stocks, or the perception of risks during a pandemic. Additionally, no relationship had been found between the perception of risks when riding a motorcycle and the perception of risks in general activities. These findings indicate that one’s ability to identify and assess risks when crossing a road does not improve if one had learned to better identify and assess risks when buying stocks, or during a pandemic, and one’s ability to identify and assess risks while riding a motorcycle does not improve if one had learned to better identify and assess risks in general activities. In contrast to the findings pertaining to risk perception when crossing a road and while driving, or while driving an automobile and riding a motorcycle, these findings suggest that when learning to assess and identify risks in one environment, risks cannot be better identified and assessed in a separate environment as a result of that training. It therefore may be that the relationships found between risk perceptions when driving, crossing roads, and riding a motorcycle indicate that the road environment is experienced and perceived as one single environment for all road users rather than several separate environments for pedestrians, drivers and motorcyclists. According to this approach, the relationships between the risk perceptions when driving an automobile, crossing a road and riding a motorcycle are not a result of training to perform one activity in one environment leading to an improvement in performing the same activity in a separate environment – but rather, because the activity was learned in a particular environment (i.e. the road environment) and then carried out in a similar situation within the same environment.
It had been previously suggested that a sequence of actions is learned as a set of discrete actions, in a similar manner to the way information is transmitted online as discrete packets along separate routes, allowing for greater flexibility when transferring information from sender to receiver – and thus, an individual learning a sequence of actions in one particular environment should be capable of performing individual actions that are a part of the sequence more quickly and efficiently in a different environment, compared to actions that had never been learned before. There is, however, an opposite approach which suggests that when learning a sequence of actions, it is treated as a single unit and any action in the sequence is locked into the context that it had been learned in – and thus, learning to perform a particular action in a particular context shall not make it possible to perform the same action more efficiently under a different context (Perlman et al., 2010).
As noted, this study found relationships between risk perceptions in the road environment, but not between risk perceptions between the road environment and environments that may be perceived as distinct and separate from it, such as a workplace environment (where an employee must identify risks while working), the economic environment (where an investor must identify risks while buying stocks on the stock exchange), or the digital environment, where a user may be exposed to financial and other risks. Thus, for example, no relationship had been found between risk perception while crossing a road and risk perception during a pandemic, or risk perception in the workplace environment. This suggests that, as had been recently argued (Ratzon et al., 2021), the sequence of actions performed while crossing a road is performed as a single unit – and thus, when learning to identify risks while crossing a road, this activity is performed in the context of crossing a road, as part of the road-crossing activity – and one should therefore re-learn this activity in a new context when learning to identify risks as part of a new activity, such as when identifying risks during a pandemic, or in a workplace environment.
And one last word about the network environment. The importance of this environment is demonstrated for example when the digital environment is even used as a metaphor to explain reality (see for example Fields et al., 2018). According to such an approach, one can think of a data structure or software that creates a virtual reality, for example a game with figures (Avatars) of people and animals. But unlike the software running inside the physical computer, this data structure is not in physical space, and space and time are only the experience of the figures. This is a relatively new environment where one is exposed to various risks is the Internet and the digital environment – in this environment one may be exposed, for example, to various economic risks, harassment or cyberbullying.
Data availability
The datasets generated during and/or analysed during the current study are available from the corresponding author on reasonable request.
No funds, grants, or other support was received
The authors have no relevant financial or non-financial interests to disclose
The authors have no competing interests to declare that are relevant to the content of this article.
There is an approval from a research ethics committee of Hadassah Academic College.
Appendix
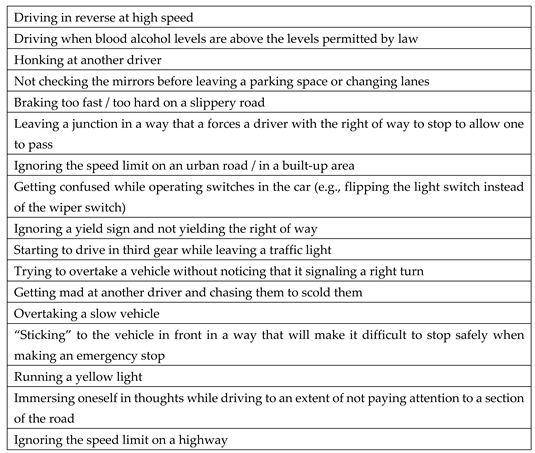
Questionnaire regarding risk perception while driving: In your opinion, what is the level of risk for/of the situations below? (Rate from 1-7)
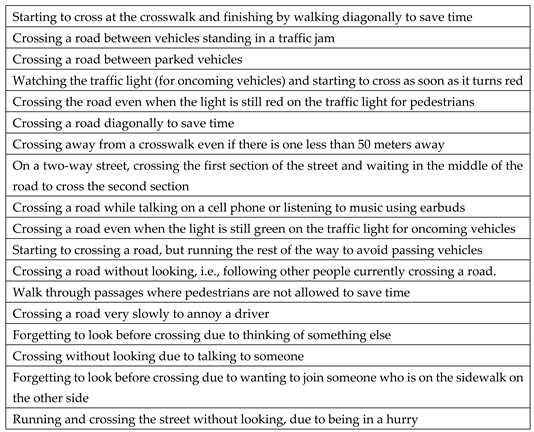
Questionnaire of risk perception while walking on the street, what do you think is the level of risk of the situations below? (1-7)
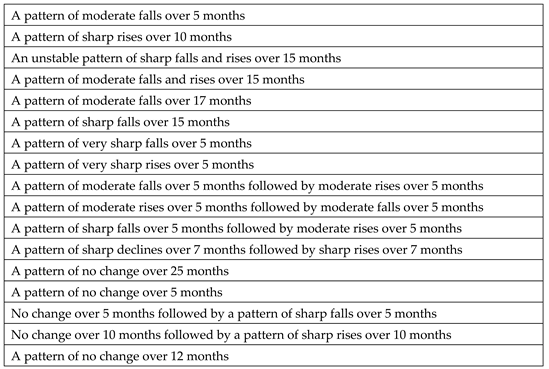
Here are some stocks and their rise and fall patterns according to the Tel Aviv 35 Index. (The stocks will not be referred to by their original names, so as not to make contexts).
For example: When the pattern of changes to the stock in recent months is a 13% rise in the first month, a 13% fall in the second, a 17% in the third, a 12% fall in the fourth, a 10% rise in the fifth and a 21% fall in the last, this constitutes a pattern of sharp falls and rises. However, when the pattern of changes to the stock in recent months is a 1% rise in the first month, a 3% rise in the second, a 1% rise in the third, a 4% rise in the fourth, a 1% rise in the fifth and a 3% percent rise in the last, this is a stable and moderate pattern of rises.
What is the risk level for a sharp fall in the coming month for the following stocks? (1 – No risk of fall or possible rise, 7 – High risk of fall )
Pattern of changes in half a year (more or less):
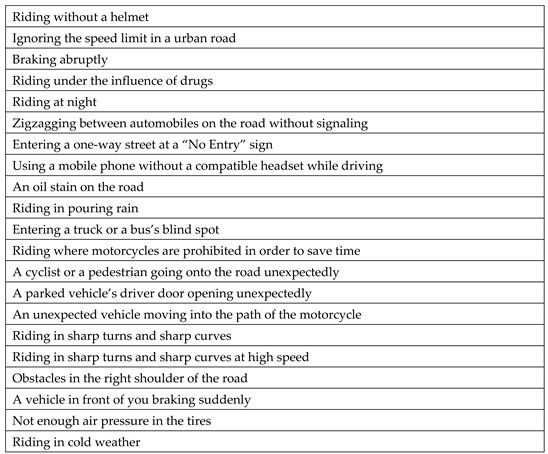
Questionnaire regarding risk perception while riding a motorcycle
In your opinion, what is the level of risk for/of the situations below? Do not linger too long on each sentence, but answer in accordance with how you are feeling while filling out this questionnaire (Rate from 1-7)
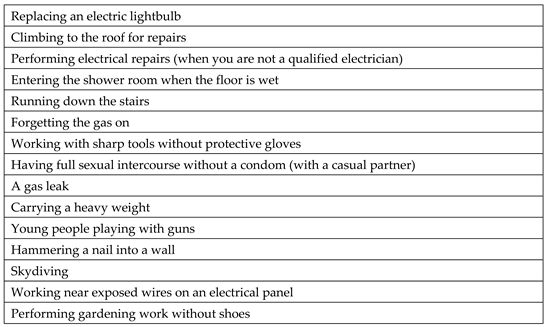
General Risk Perception Questionnaire
In your opinion, what is the level of risk for/of the situations below? Do not linger too long on each sentence, but answer in accordance with how you are feeling while filling out this questionnaire (Rate from 1-7)
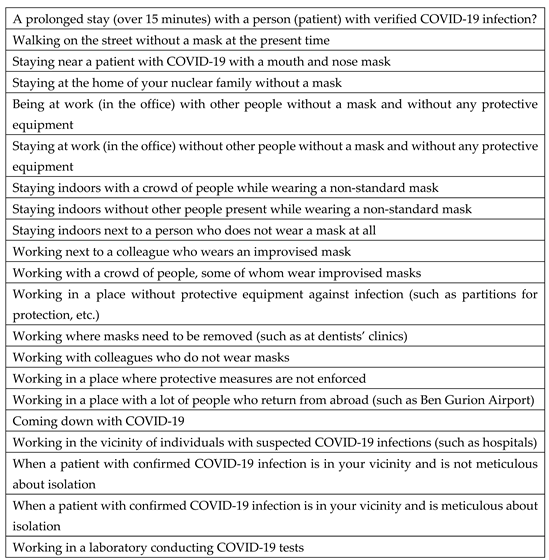
In your opinion, what is the level of risk for/of the situations below during the COVID-19 pandemic? (Rate from 1-7)
References
- Barnett, S. M., & Ceci, S. J. (2002). When and where do we apply what we learn?: A taxonomy for far transfer. Psychological Bulletin, 128(4), 612–637. [CrossRef]
- Basha, S. A., & Maiti, J. (2013). Relationships of demographic factors, job risk perception and work injury in a steel plant in India. Safety Science, 51(1), 374–381. [CrossRef]
- Brewer, N. T., Chapman, G. B., Gibbons, F. X., Gerrard, M., McCaul, K. D., & Weinstein, N. D. (2007). Meta-analysis of the relationship between risk perception and health behavior: The example of vaccination. Health Psychology, 26(2), 136–145. [CrossRef]
- Brewer, N. T., Weinstein, N. D., Cuite, C. L., & Herrington, J. E. (2004). Risk perceptions and their relation to risk behavior. Annals of Behavioral Medicine, 27(2), 125–130. [CrossRef]
- Brown, S. L., & Cotton, A. (2003). Risk-mitigating beliefs, risk estimates, and self-reported speeding in a sample of Australian drivers. Journal of Safety Research, 34(2), 183–188. [CrossRef]
- Cezar-Vaz, M. R., Rocha, L. P., Bonow, C. A., da Silva, M. R. S., Vaz, J. C., & Cardoso, L. S. (2012). Risk Perception and Occupational Accidents: A Study of Gas Station Workers in Southern Brazil. International Journal of Environmental Research and Public Health, 9(7), 2362–2377. [CrossRef]
- Delhomme, P., Verlhiac, J. F., & Martha, C. (2009). Are drivers' comparative risk judgments about speeding realistic?. Journal of Safety Research, 40(5), 333-339. . [CrossRef]
- Dionne, G., Fluet, C., & Desjardins, D. (2007). Predicted risk perception and risk-taking behavior: The case of impaired driving. Journal of Risk and Uncertainty, 35(3), 237–264. [CrossRef]
- Floyd, D. L., Prentice-Dunn, S., & Rogers, R. W. (2000). A meta-analysis of research on protection motivation theory. Journal of Applied Social Psychology, 30(2), 407–429. [CrossRef]
- Granié, M.A., Pannetier, M., & Guého, L. (2013). Developing a self-reporting method to measure pedestrian behaviors at all ages. Accident Analysis & Prevention, 50, 830–839. [CrossRef]
- Hunter, D. R. (2006). Risk perception among general aviation pilots. The International Journal of Aviation Psychology, 16(2), 135–144. [CrossRef]
- Lanning, B. A., Melton, K., & Abel, N. (2018). The impact of a supplemental drivers’ education program on teenage risk perception and driving behaviors. Transportation Research Part F: Traffic Psychology and Behaviour, 58, 442–451. [CrossRef]
- Leder, J., Horlitz, T., Puschmann, P., Wittstock, V., & Schütz, A. (2019). Comparing immersive virtual reality and powerpoint as methods for delivering safety training: Impacts on risk perception, learning, and decision making. Safety Science, 111, 271–286. [CrossRef]
- Perlman, A., Pothos, E. M., Edwards, D. J., & Tzelgov, J. (2010). Task-relevant chunking in sequence learning. Journal of Experimental Psychology: Human Perception and Performance, 36(3), 649–661. [CrossRef]
- Perlman, A., Sacks, R., & Barak, R. (2014). Hazard recognition and risk perception in construction. Safety Science, 64, 22–31. [CrossRef]
- Ratzon, N. Z., Perlman, A., & Rosenbloom, T. (2021). Safe driving and road-crossing tasks: A particular case of successful transfer of learning. Transportation Research Part F: Traffic Psychology and Behaviour, 82, 43–53. [CrossRef]
- Reason, J., Manstead, A., Stradling, S., Baxter, J., & Campbell, K. (1990). Errors and violations on the roads: a real distinction? Ergonomics, 33(10–11), 1315–1332. [CrossRef]
Disclaimer/Publisher’s Note: The statements, opinions and data contained in all publications are solely those of the individual author(s) and contributor(s) and not of MDPI and/or the editor(s). MDPI and/or the editor(s) disclaim responsibility for any injury to people or property resulting from any ideas, methods, instructions or products referred to in the content. |
© 2023 by the authors. Licensee MDPI, Basel, Switzerland. This article is an open access article distributed under the terms and conditions of the Creative Commons Attribution (CC BY) license (http://creativecommons.org/licenses/by/4.0/).
Copyright: This open access article is published under a Creative Commons CC BY 4.0 license, which permit the free download, distribution, and reuse, provided that the author and preprint are cited in any reuse.


