1. Introduction
One of the most important problems of geotechnical engineering is the construction of structures on soils that have problems in terms of bearing capacity and settlement. In case the weak soil layers are not located too deep and the building load is low, solutions can be produced in such problematic soils by using soil improvement methods. However, if the weak soil layers are too deep and the building load is high, the application of pile foundation systems becomes mandatory. There are many methods in the literature regarding the design of piles under static loads, and the design principles are discussed in detail in many international standards. However, although the piles have sufficient strength under static loads, they can be damaged due to dynamic loads. In this respect, it is important to accurately reflect the behavior of piles under dynamic loads in the design.
Determining the behavior of structures constructed on pile foundations, especially under earthquake loads, becomes a more complex design problem. During earthquakes, piles are exposed to kinematic conditions due to lateral shaking of the surrounding soil and to inertial interaction due to superstructure vibrations. Since these effects occur simultaneously during the earthquake, it is difficult to consider them separately. Studies have observed that piles at shallow depths cannot transfer inertia forces and kinematic conditions are more effective at these depths (Mizuno, 1985; Gazetas et al., 1993). There are many numerical and experimental studies on kinematic interaction analyses of piles in the literature (Kaynia, 1982; Fan et al., 1991; Kavvadas and Gazedas, 1993; Haigh, 2002; Brandanberg et al., 2005; Castelli et al., 2008; Madabhushi et al., 2010; Haskell, 2013, Luo et al., 2016; Mallick et al., 2022; Garala et al., 2022).
Kaynia (1982) investigated the dynamic behavior of group piles in a semi-infinite soil condition. The study examined the effects of soil elasticity and the hardness-flexibility matrices of the pile on the deformations occurring at the pile-soil interface. The results show that group piles' behavior is frequency-based, and the interaction factors obtained in the study are valid in homogeneous soil condition, and their validity decreases in non-homogeneous soil condition.
Fan et al. (1991) numerically investigated the kinematic conditions in group piles under harmonic S waves. Within the scope of the study, pile-pile and pile-soil interactions were examined. The kinematic conditions were investigated parametrically by changing the pile configurations in the soil condition idealized as a homogeneous two-layers. In the study, it was seen that the natural soil profile was effective at all frequencies, and the pile group configuration, number of piles, and distance between piles did not affect the lateral displacements but were effective in the rotation of the pile cap.
Kavvadas and Gazetas (1993) examined the behavior of free cap piles under kinematic conditions. The study was carried out on two-layer soil with a large difference in sliding velocities. The results obtained from the study showed that the differences in shear wave velocities affected the bending moment, significantly. In pile design, the moments that will occur in the transition layers directly affect the design.
Castelli et al. (2008) investigated the kinematic behavior of single piles under seismic loads with a finite element program. In the study, free field soil (without piles) and piles were modeled to evaluate the kinematic conditions. The results obtained showed that in the transition region to soft soil, the moments increased significantly, and hinges formed within the pile.
Luo et al. (2016) investigated the soil-pile-structure interaction with an improved equivalent linear model and a modified Drucker Prager soil model with the help of a three-dimensional finite element program. In the analyses, it was seen that the nonlinearity of the soil directly affected the behavior, and lower acceleration responses were obtained if the equivalent model was used. As a result of the study, it was seen that non-linear soil models must be used in interaction analyses and that they affected the results.
Garala and Madabhushi (2018) investigated the behavior of pile foundations in soft clays under dynamic loads with centrifuge experiments. The experiments were carried out in a group of single piles and 1x3 row piles with different spacing. As a result of the study, the importance of nonlinear analysis in characterizing the earthquake behavior of soft clays is emphasized. It has been shown that the response of clay depends on both the earthquake intensity and the shear strength and stiffness of the clay layer. This situation affects the response of individual piles and pile groups and has been observed to cause greater amplification in small earthquakes.
Mallick et al. (2022) examined the dynamic effects of the pile-soil system under axial loading in liquefiable soil layers using the 3D finite element method. In the study, an advanced soil strength law based on a multi-surface plasticity model was used for soil-fluid interaction and pore water pressure development. It was observed that as the axial load applied to the pile increased, the liquefaction depth decreased. It was also observed that the bending moment of the pile under axial loading may be higher than in the non-liquefiable case.
Garala et al. (2022) examined the effect of pile spacing on the dynamic behavior of pile groups by performing specially designed dynamic centrifuge experiments on pile foundations embedded in a two-layer soil profile. According to the experimental results, it has been observed that pile-group effects decrease with the increase in pile spacing, which leads to larger kinematic pile bending moments in a pile group due to reduced pile-soil-pile interaction. However, reduced pile group effects were observed in the widely spaced pile group, resulting in larger bending moments compared to the closely spaced pile group. It was also concluded that a single pile always had larger bending moments than the pile groups tested.
The results obtained from studies in the literature show that damage caused by kinematic interaction occurs at the pile head in soft soils and in the intermediate ground layers where strength differences occur. Studies on kinematic interaction analyses in the literature that take parametric effects into consideration are limited. In this study, an experimental study in the literature was verified with a finite element program, and then the effects of soil stratification, groundwater level, pile stiffness, and earthquake acceleration parameters were investigated.
2. Description of Problem
In this study, the behavior of piles under the influence of dynamic loads was investigated under kinematic conditions. For this purpose, a finite element program modeled an experimental study from the literature. After the experimental results were verified numerically by means of the finite element program, the effects of different parameters on the behavior were investigated. The experimental study modeled in the study was carried out by Garala et al. (2022).
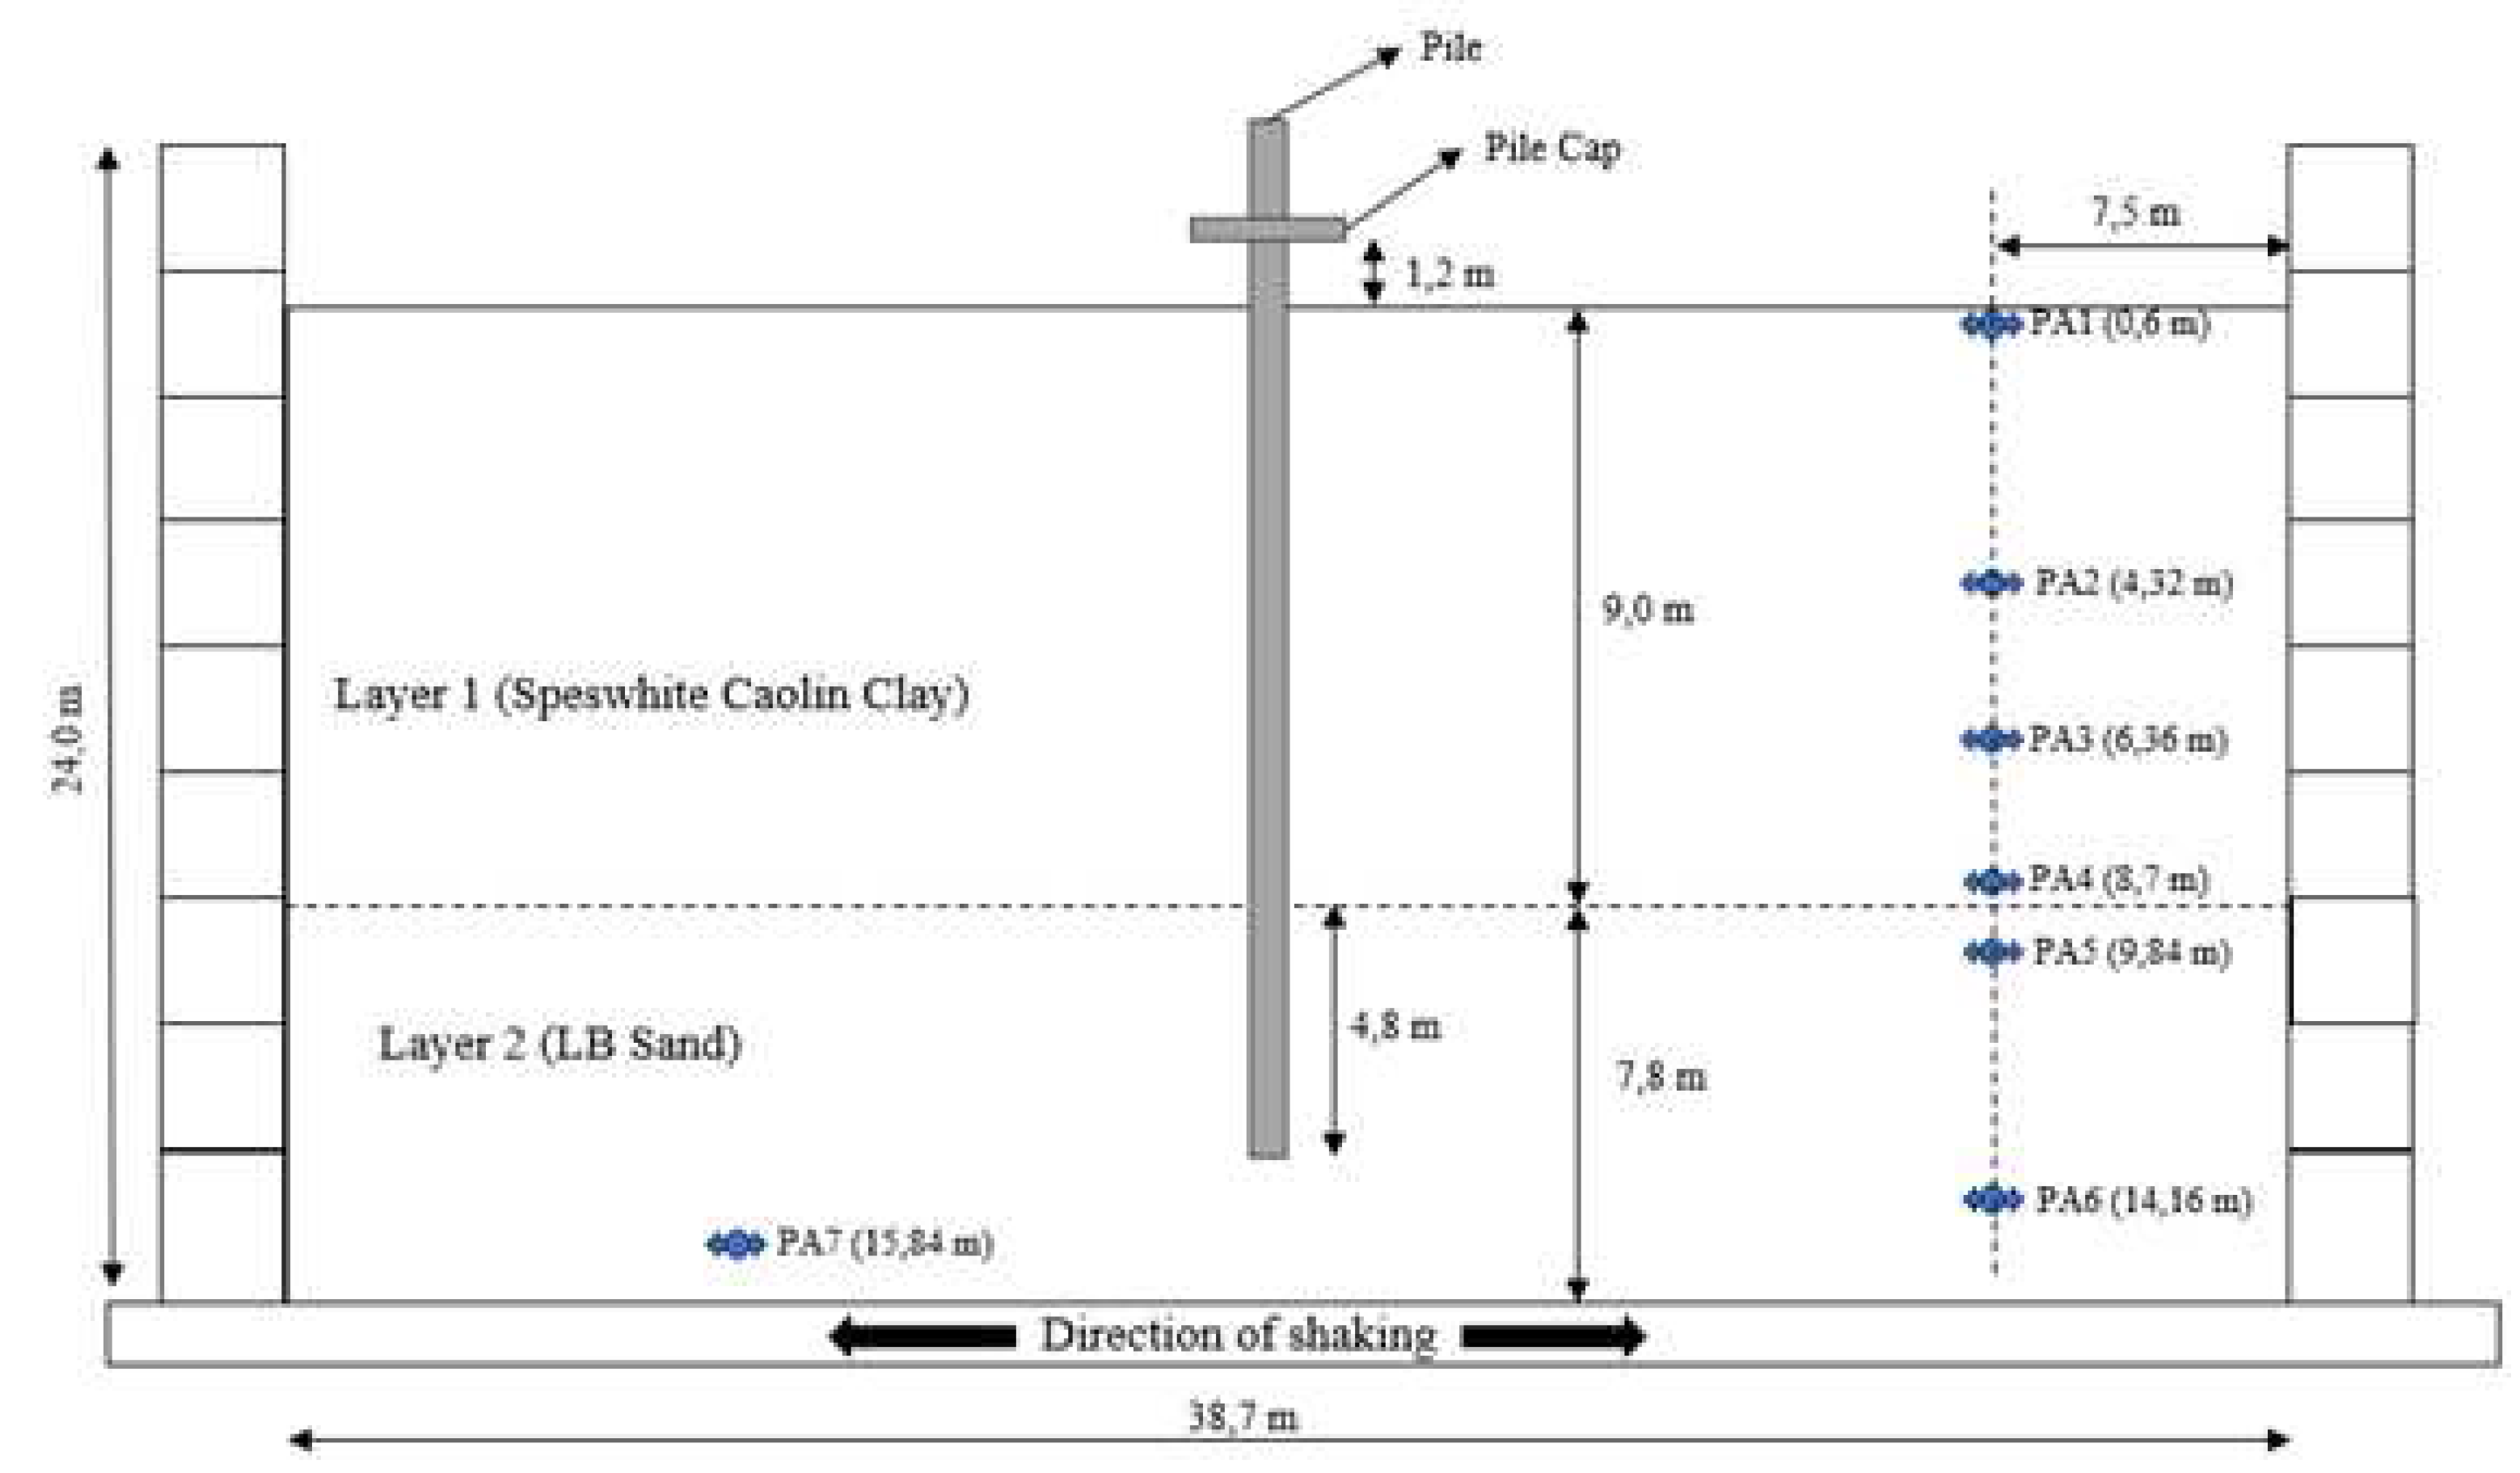
The experimental studies considered within the scope of this study were carried out in a centrifuge setup. In the experimental study, the behavior of single piles and 3x1 row group piles was examined. Only the behavior of single piles was investigated in numerical modeling. The schematic representation of the setup of the experiments is shown in
Figure 1 (Garala et al., 2022). The experiments were carried out in a layered soil condition consisting of soft clay and dense sand. Poorly graded Fraction-B Leighton Buzzard (LB) sand was used as the sand layer, and the sand properties are presented in
Table 1. The properties of Kaolin clay used in the experiments (Lau, 2015) are given in
Table 2. The bending moments were measured by means of strain gauges on the aluminum piles used in the experiments. In addition, accelerations in the soil were measured using piezometric accelerometers (named as PA) along the depth of the soil (
Figure 1). The results obtained from the numerical analyses carried out within the scope of this study were verified by comparing the bending moments obtained from the experiments with the accelerations occurring in the soil.
3. Finite Element Analysis
The two-dimensional Plaxis 2022 2D finite element program was used in the numerical modeling of the study by Garala et al. (2022). Plaxis program is a finite element program that uses advanced soil models to solve deformation and stability problems and allows the simulation of static and dynamic loading conditions. The most important advantage of the program is that it allows the most realistic modeling of soil and loading conditions and is user-friendly. In this section, numerical modeling and verification of experimental results are presented under subheadings.
3.1. Numerical Modelling
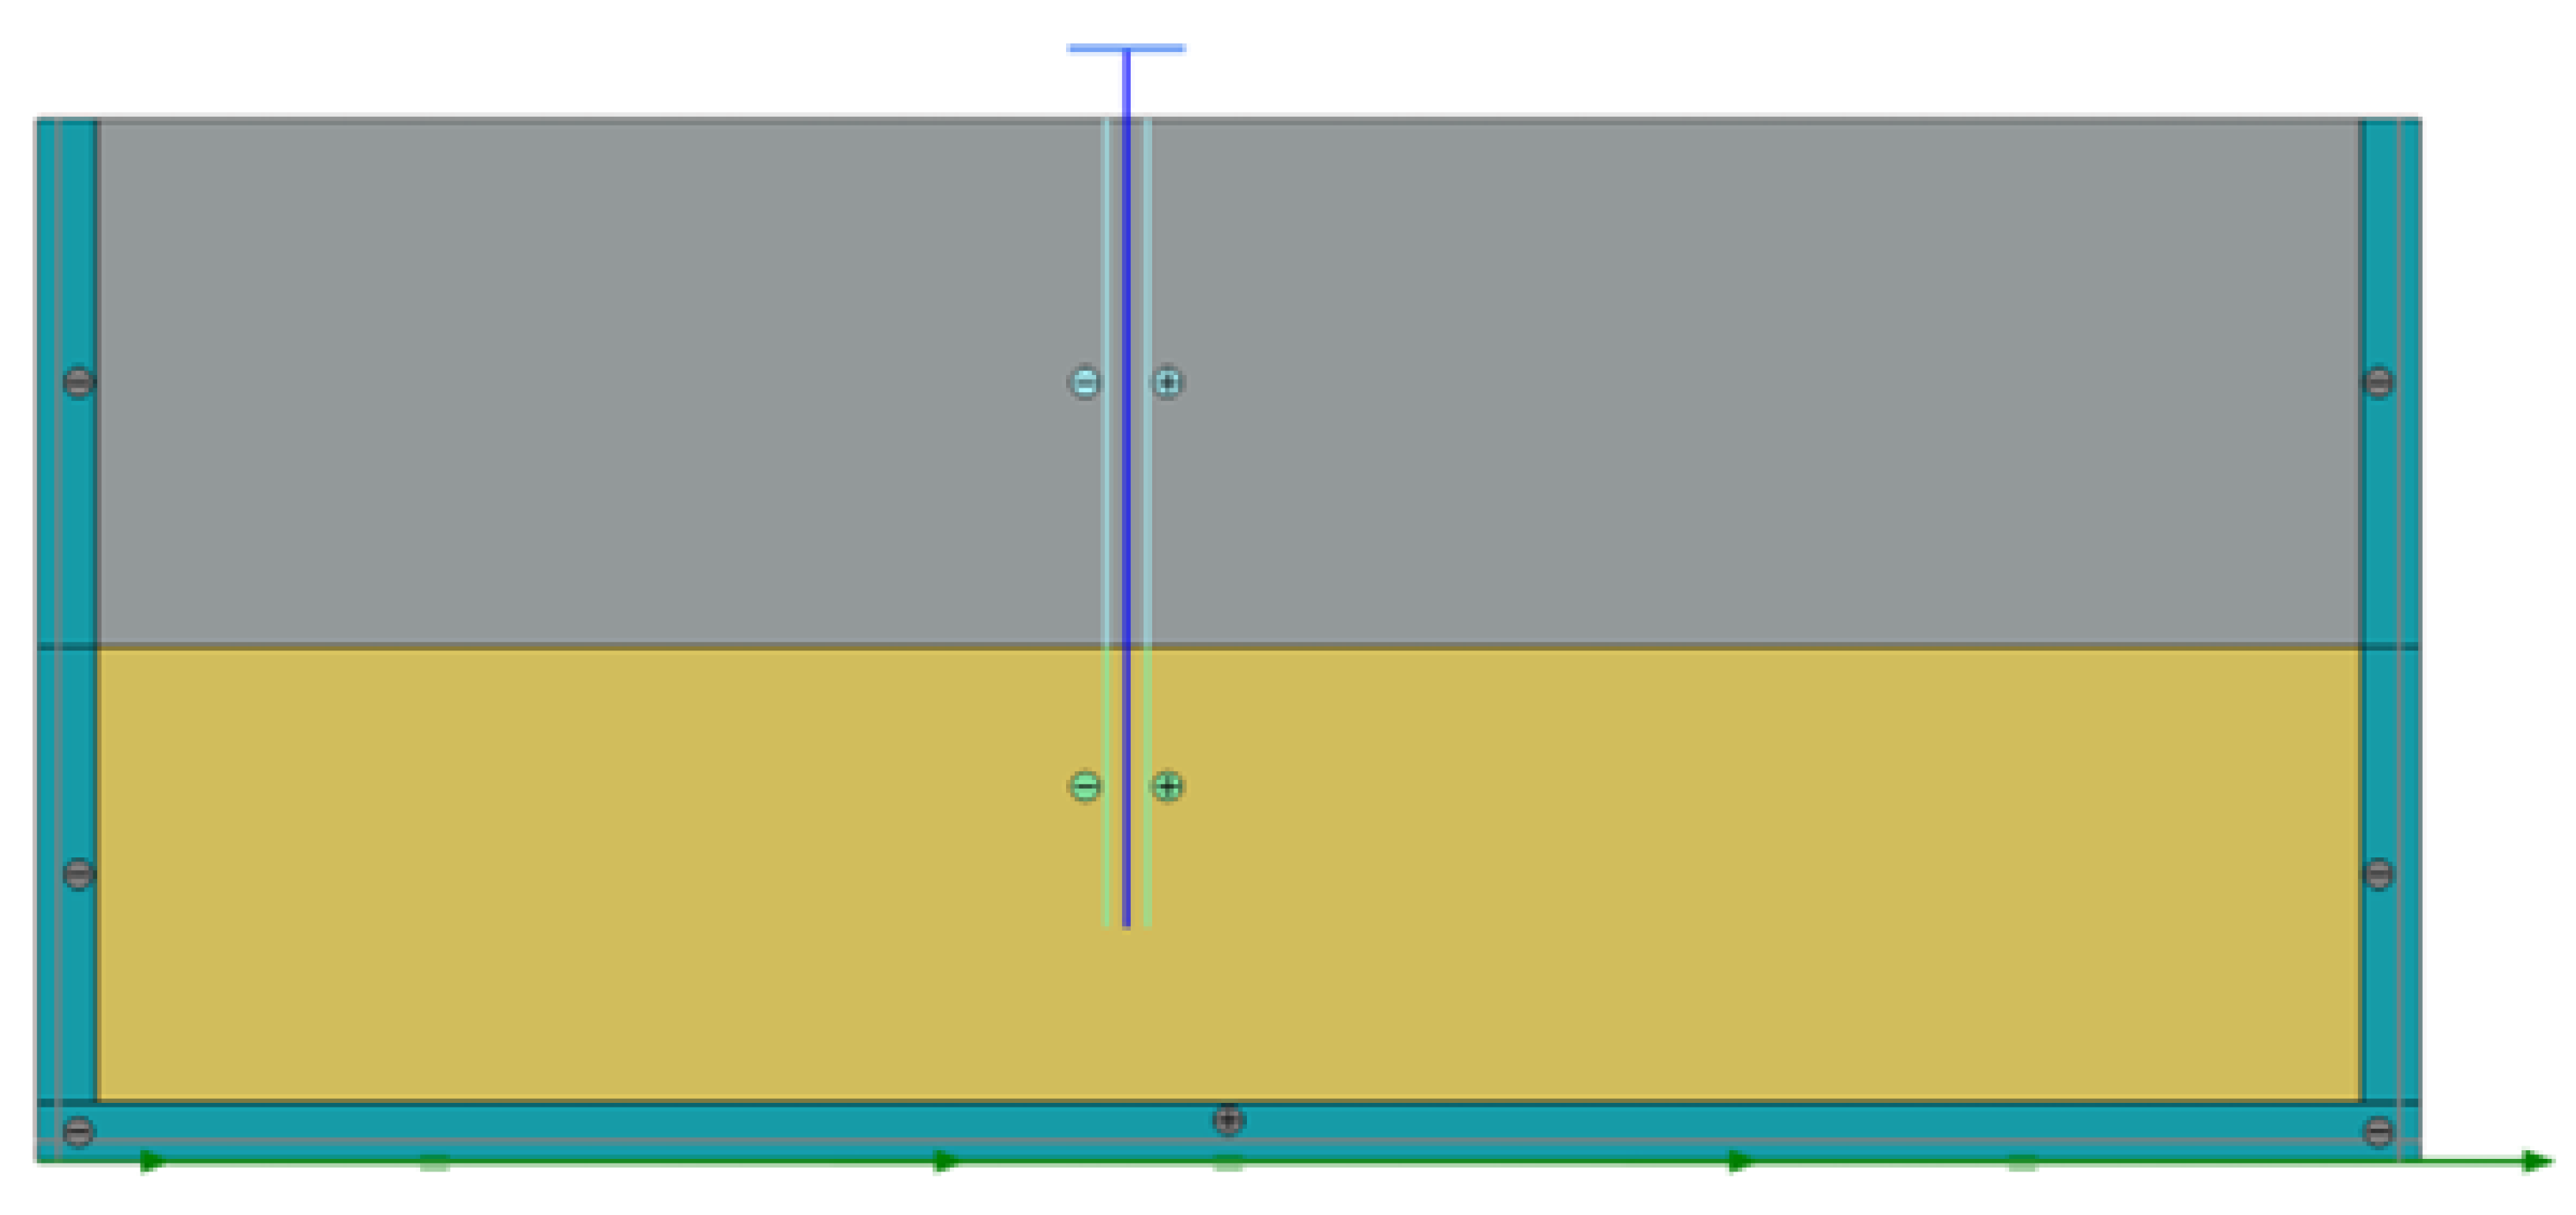
Centrifuge experiments carried out by Garala et al. (2022) were modeled on a real scale in two dimensions using the Plaxis program. The numerical model is presented in
Figure 2. In the numerical model, a geometric model was created so that all parameters such as pile length, soil layer thickness, and groundwater condition reflect the experimental conditions. Boundary conditions were defined to the model by considering the effects of dynamic loading conditions.
3.2. Soil Parameters
The stress-strain behavior of natural soils under dynamic loads is largely nonlinear, and the shear modulus generally decreases with an increase in shear strain (Hardin and Drnevich, 1972). Deterioration in shear modulus significantly affects the performance of the foundation system (Snyder, 2004). For this reason, it is important to use a soil model suitable for nonlinear soil behavior in soil dynamics problems. Especially during dynamic loading, inertial forces and strain rate effects inherent in the loading come to the fore rather than the shear strain magnitude. In this study, the Hardening Soil Small model, which is also included in the Plaxis program, was used to best reflect the dynamic soil behavior. The soil parameters used in the analysis are presented in
Table 4. In the analysis, the pile element was selected as a plate element as recommended in the literature. The properties of piles and pile caps used in numerical analyses are summarized in
Table 3.
3.3. Input Earthquakes
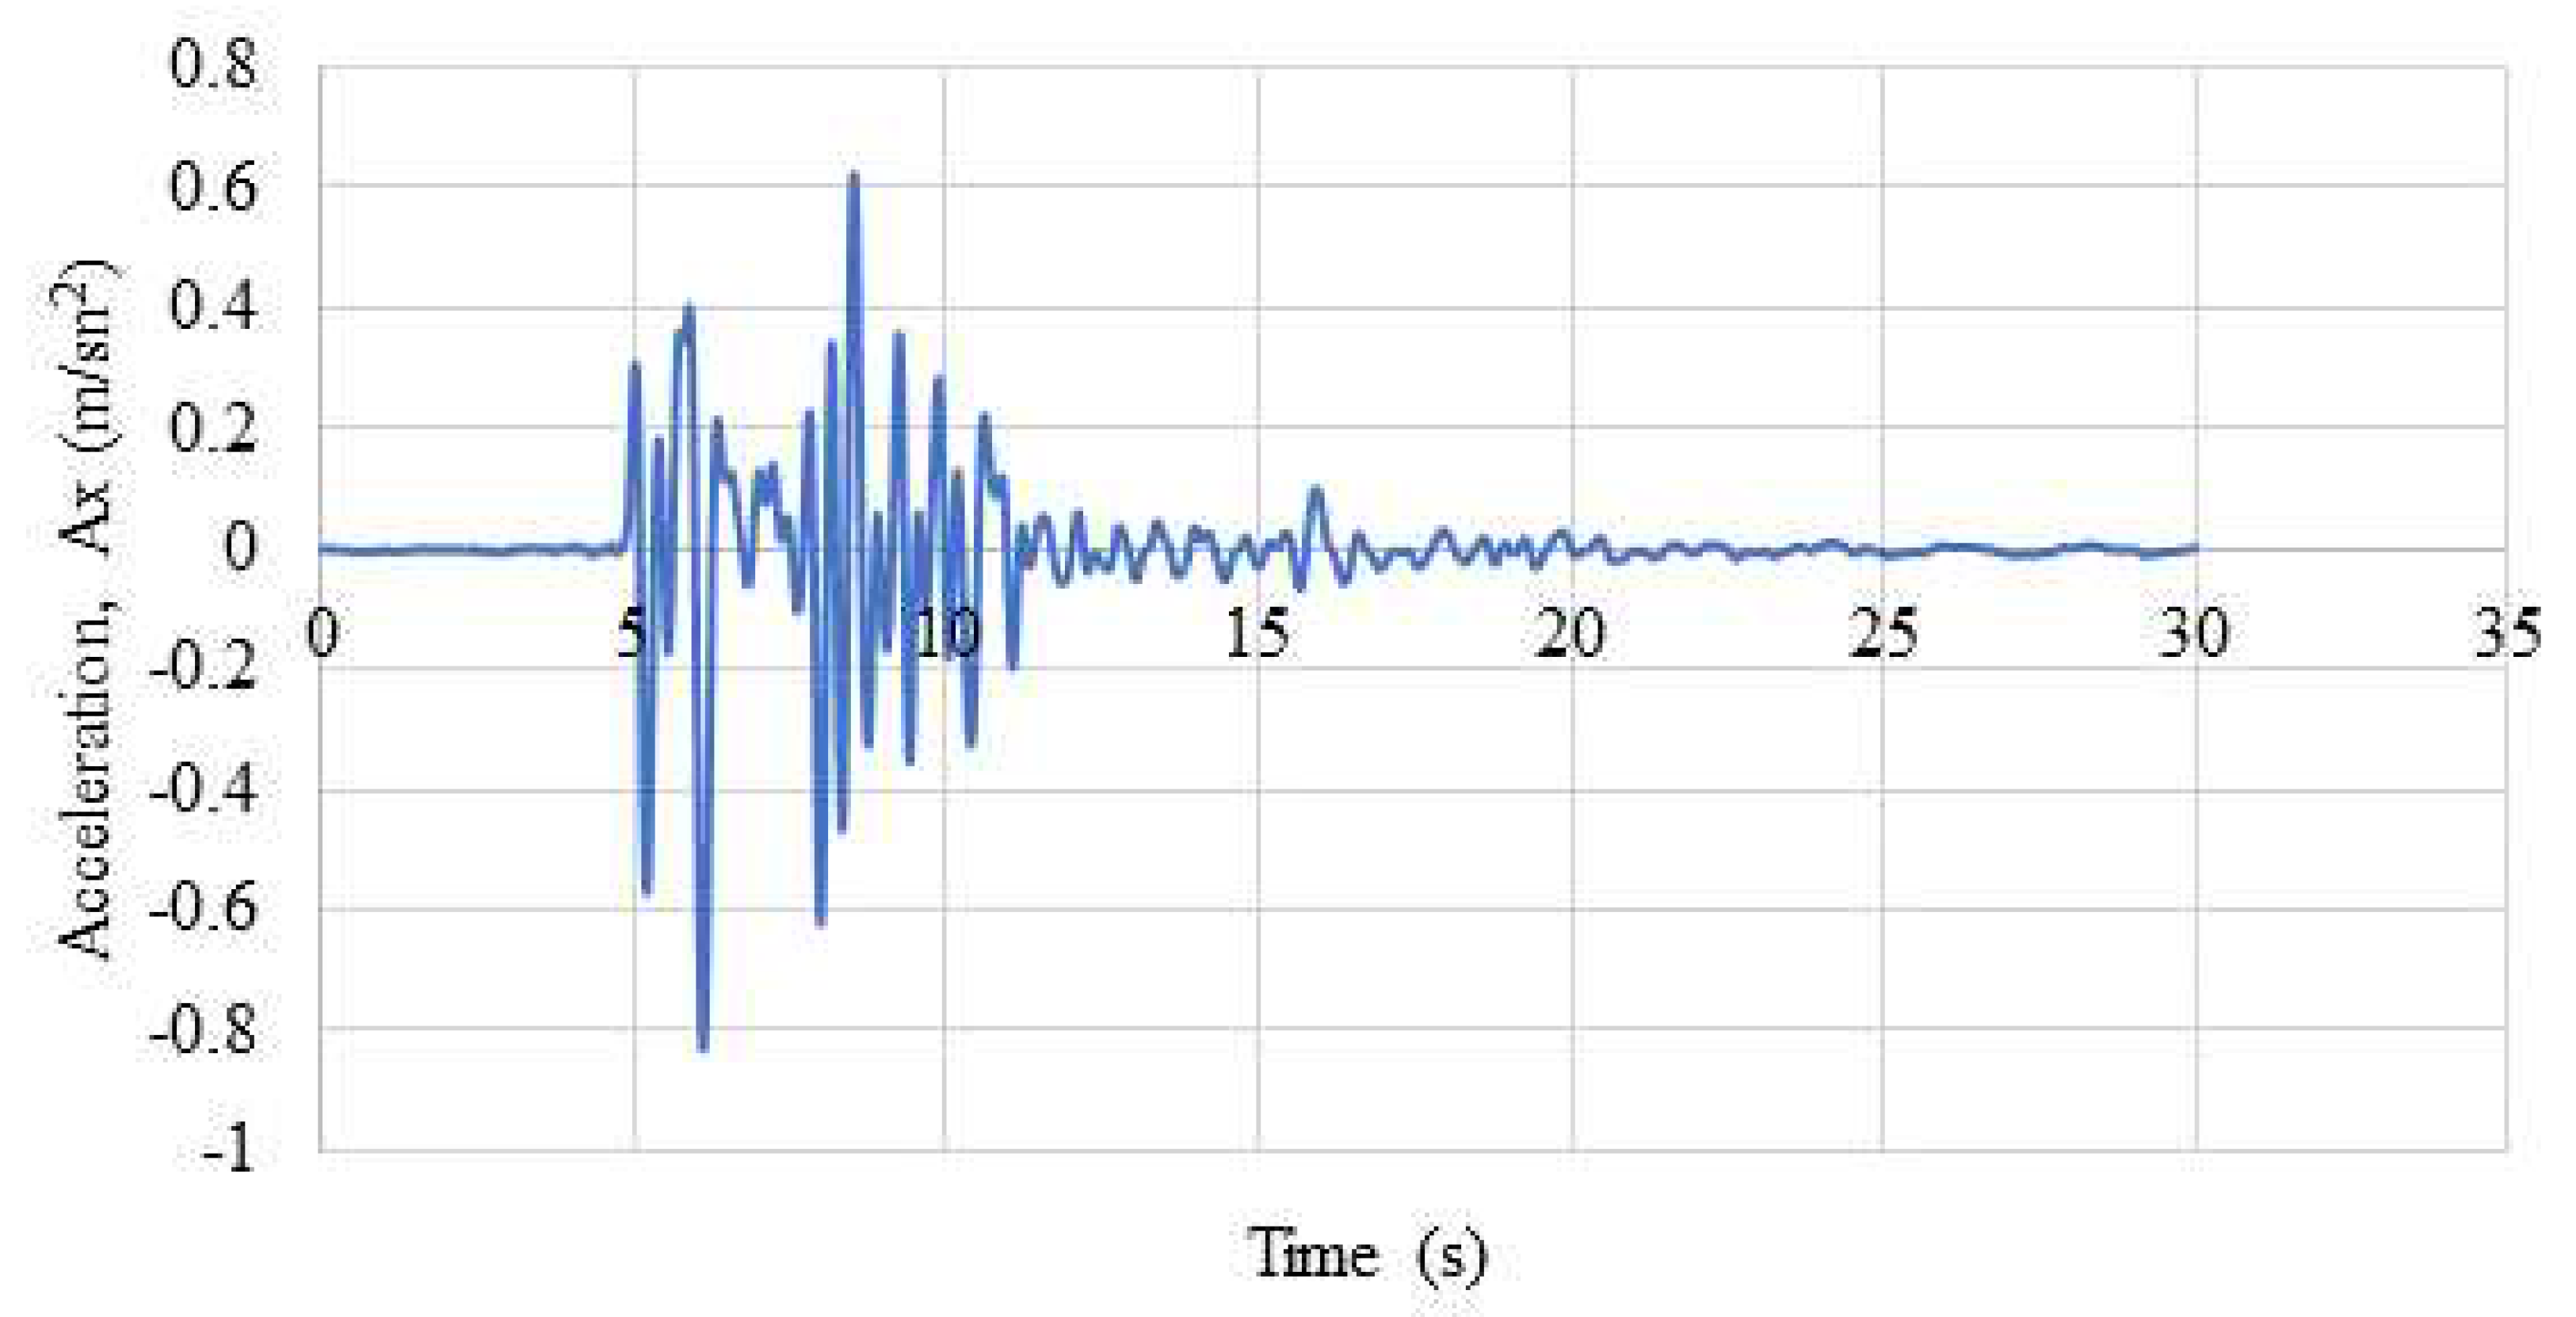
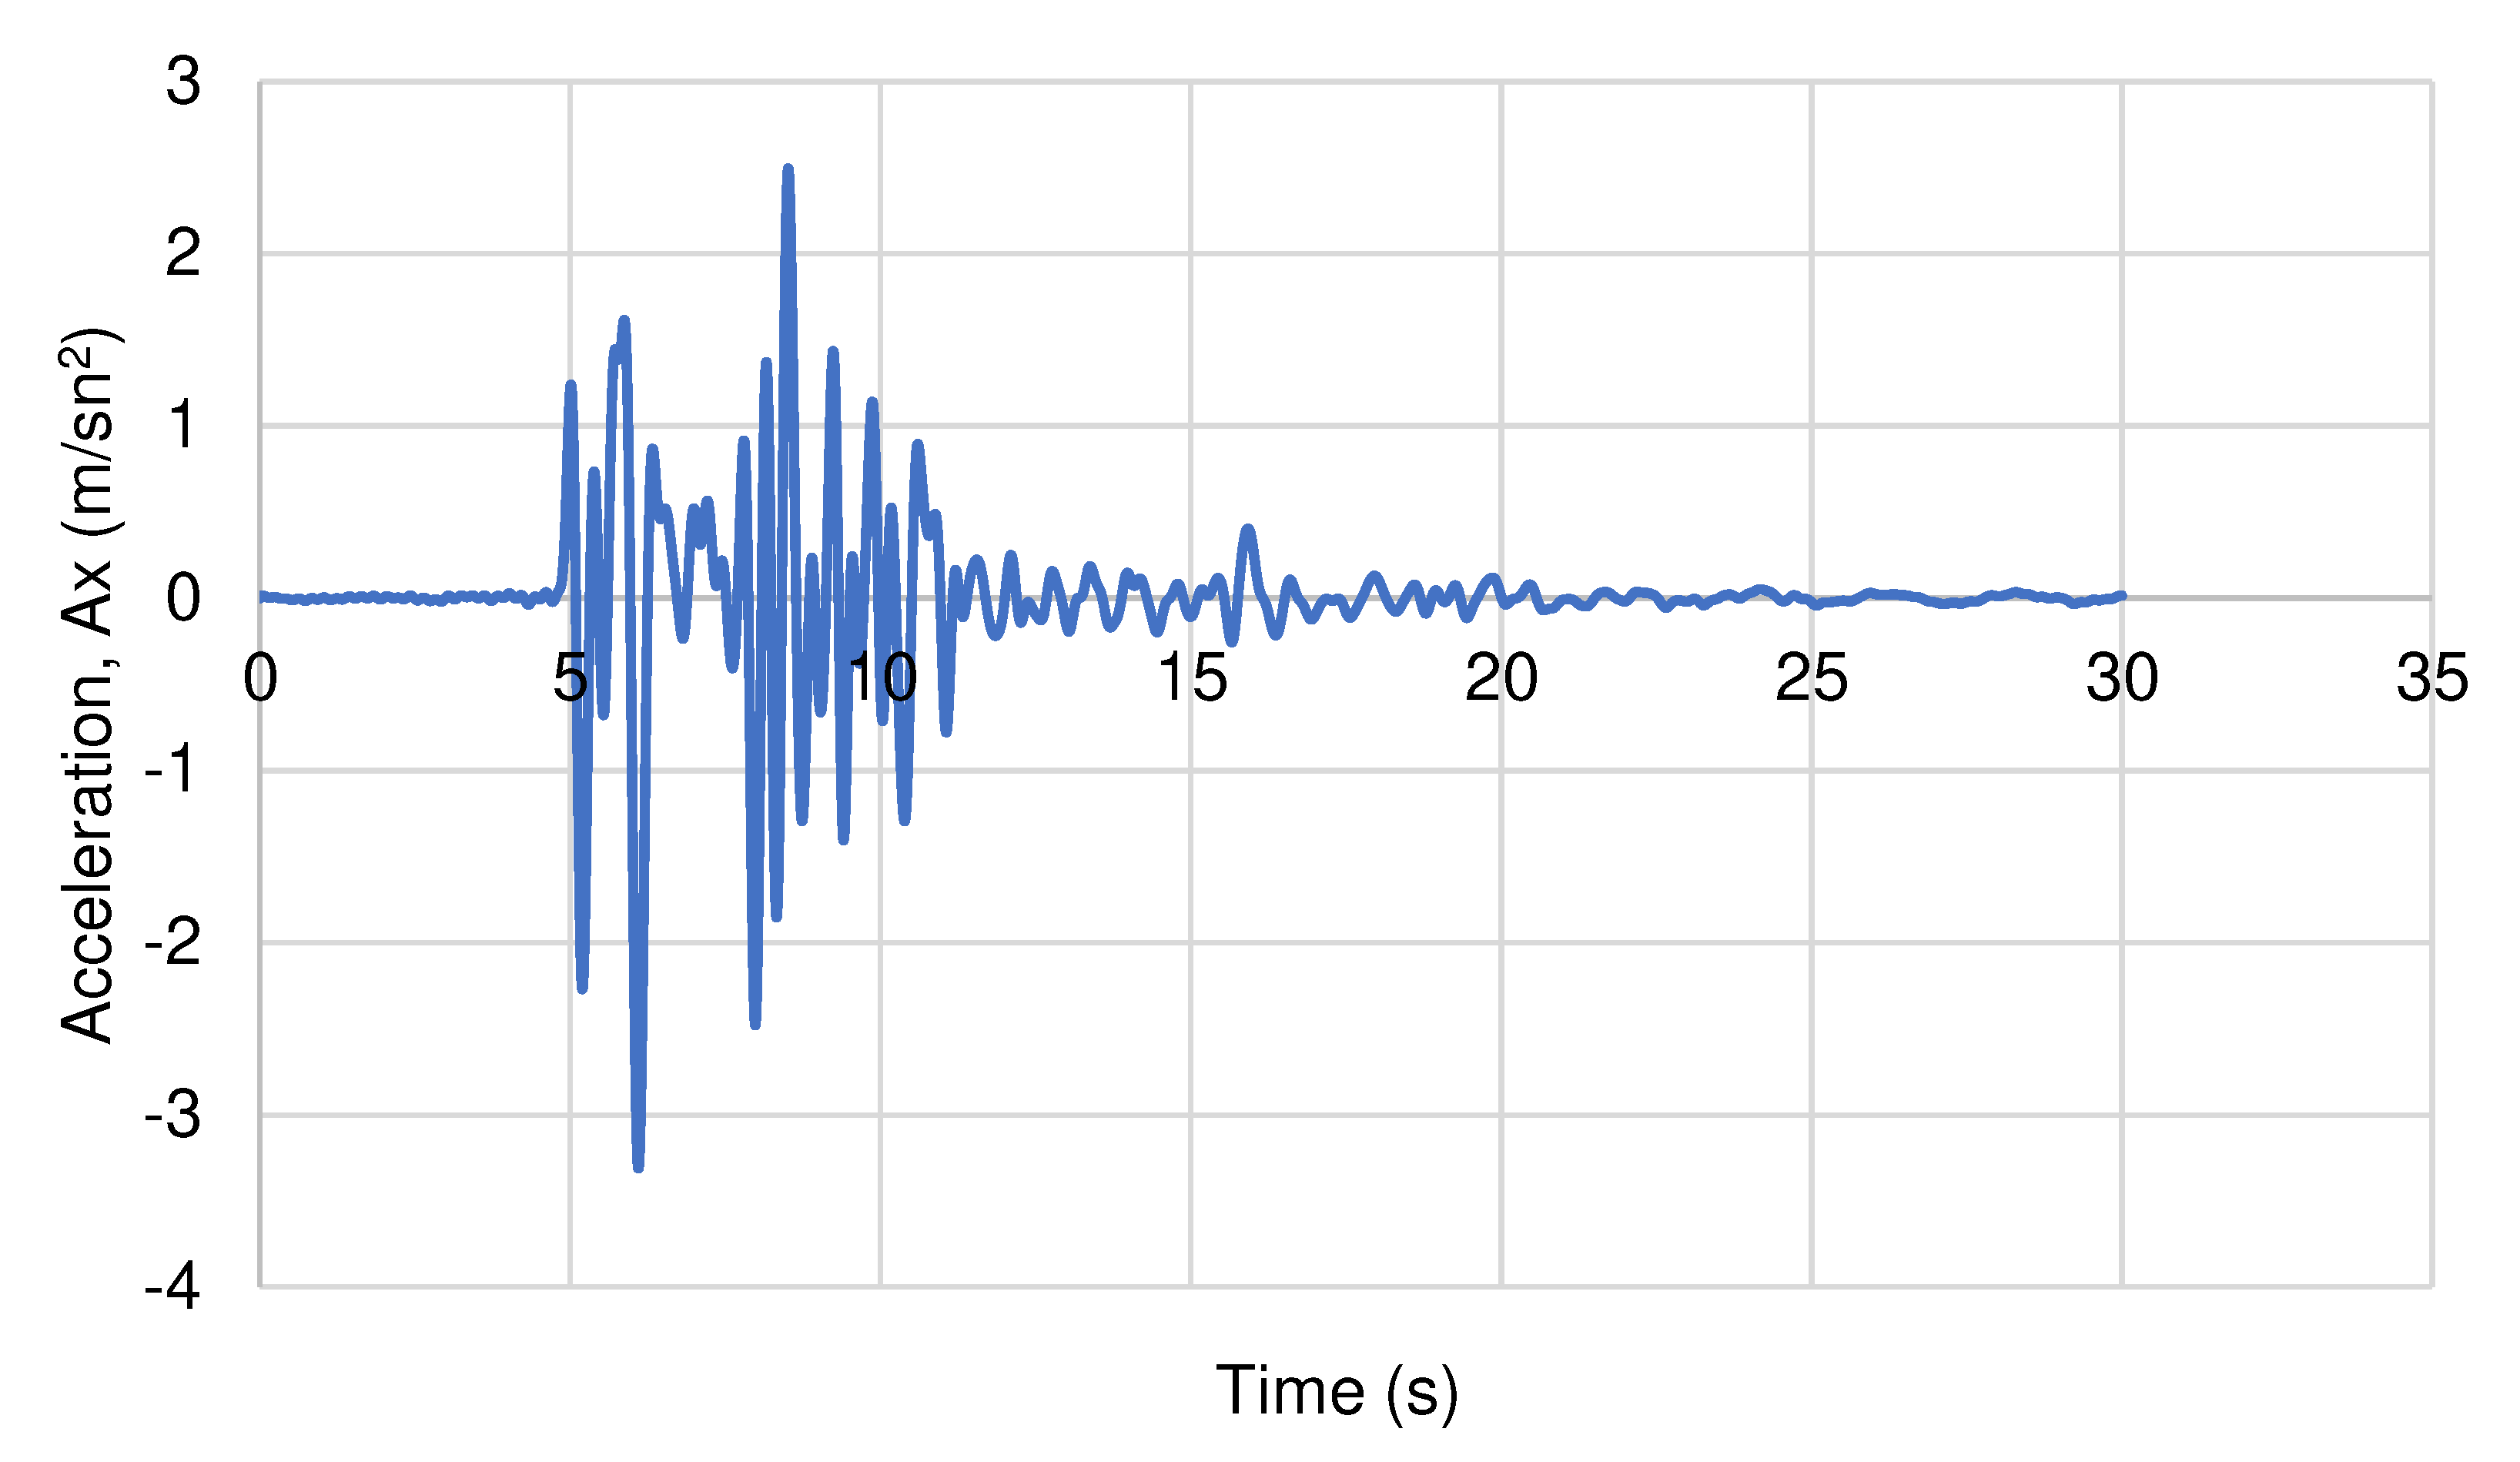
The earthquake records used in the analyses were selected from the scaled Kobe earthquake, and the same earthquake records used in the experiments were used in the numerical model. Earthquake data is presented in
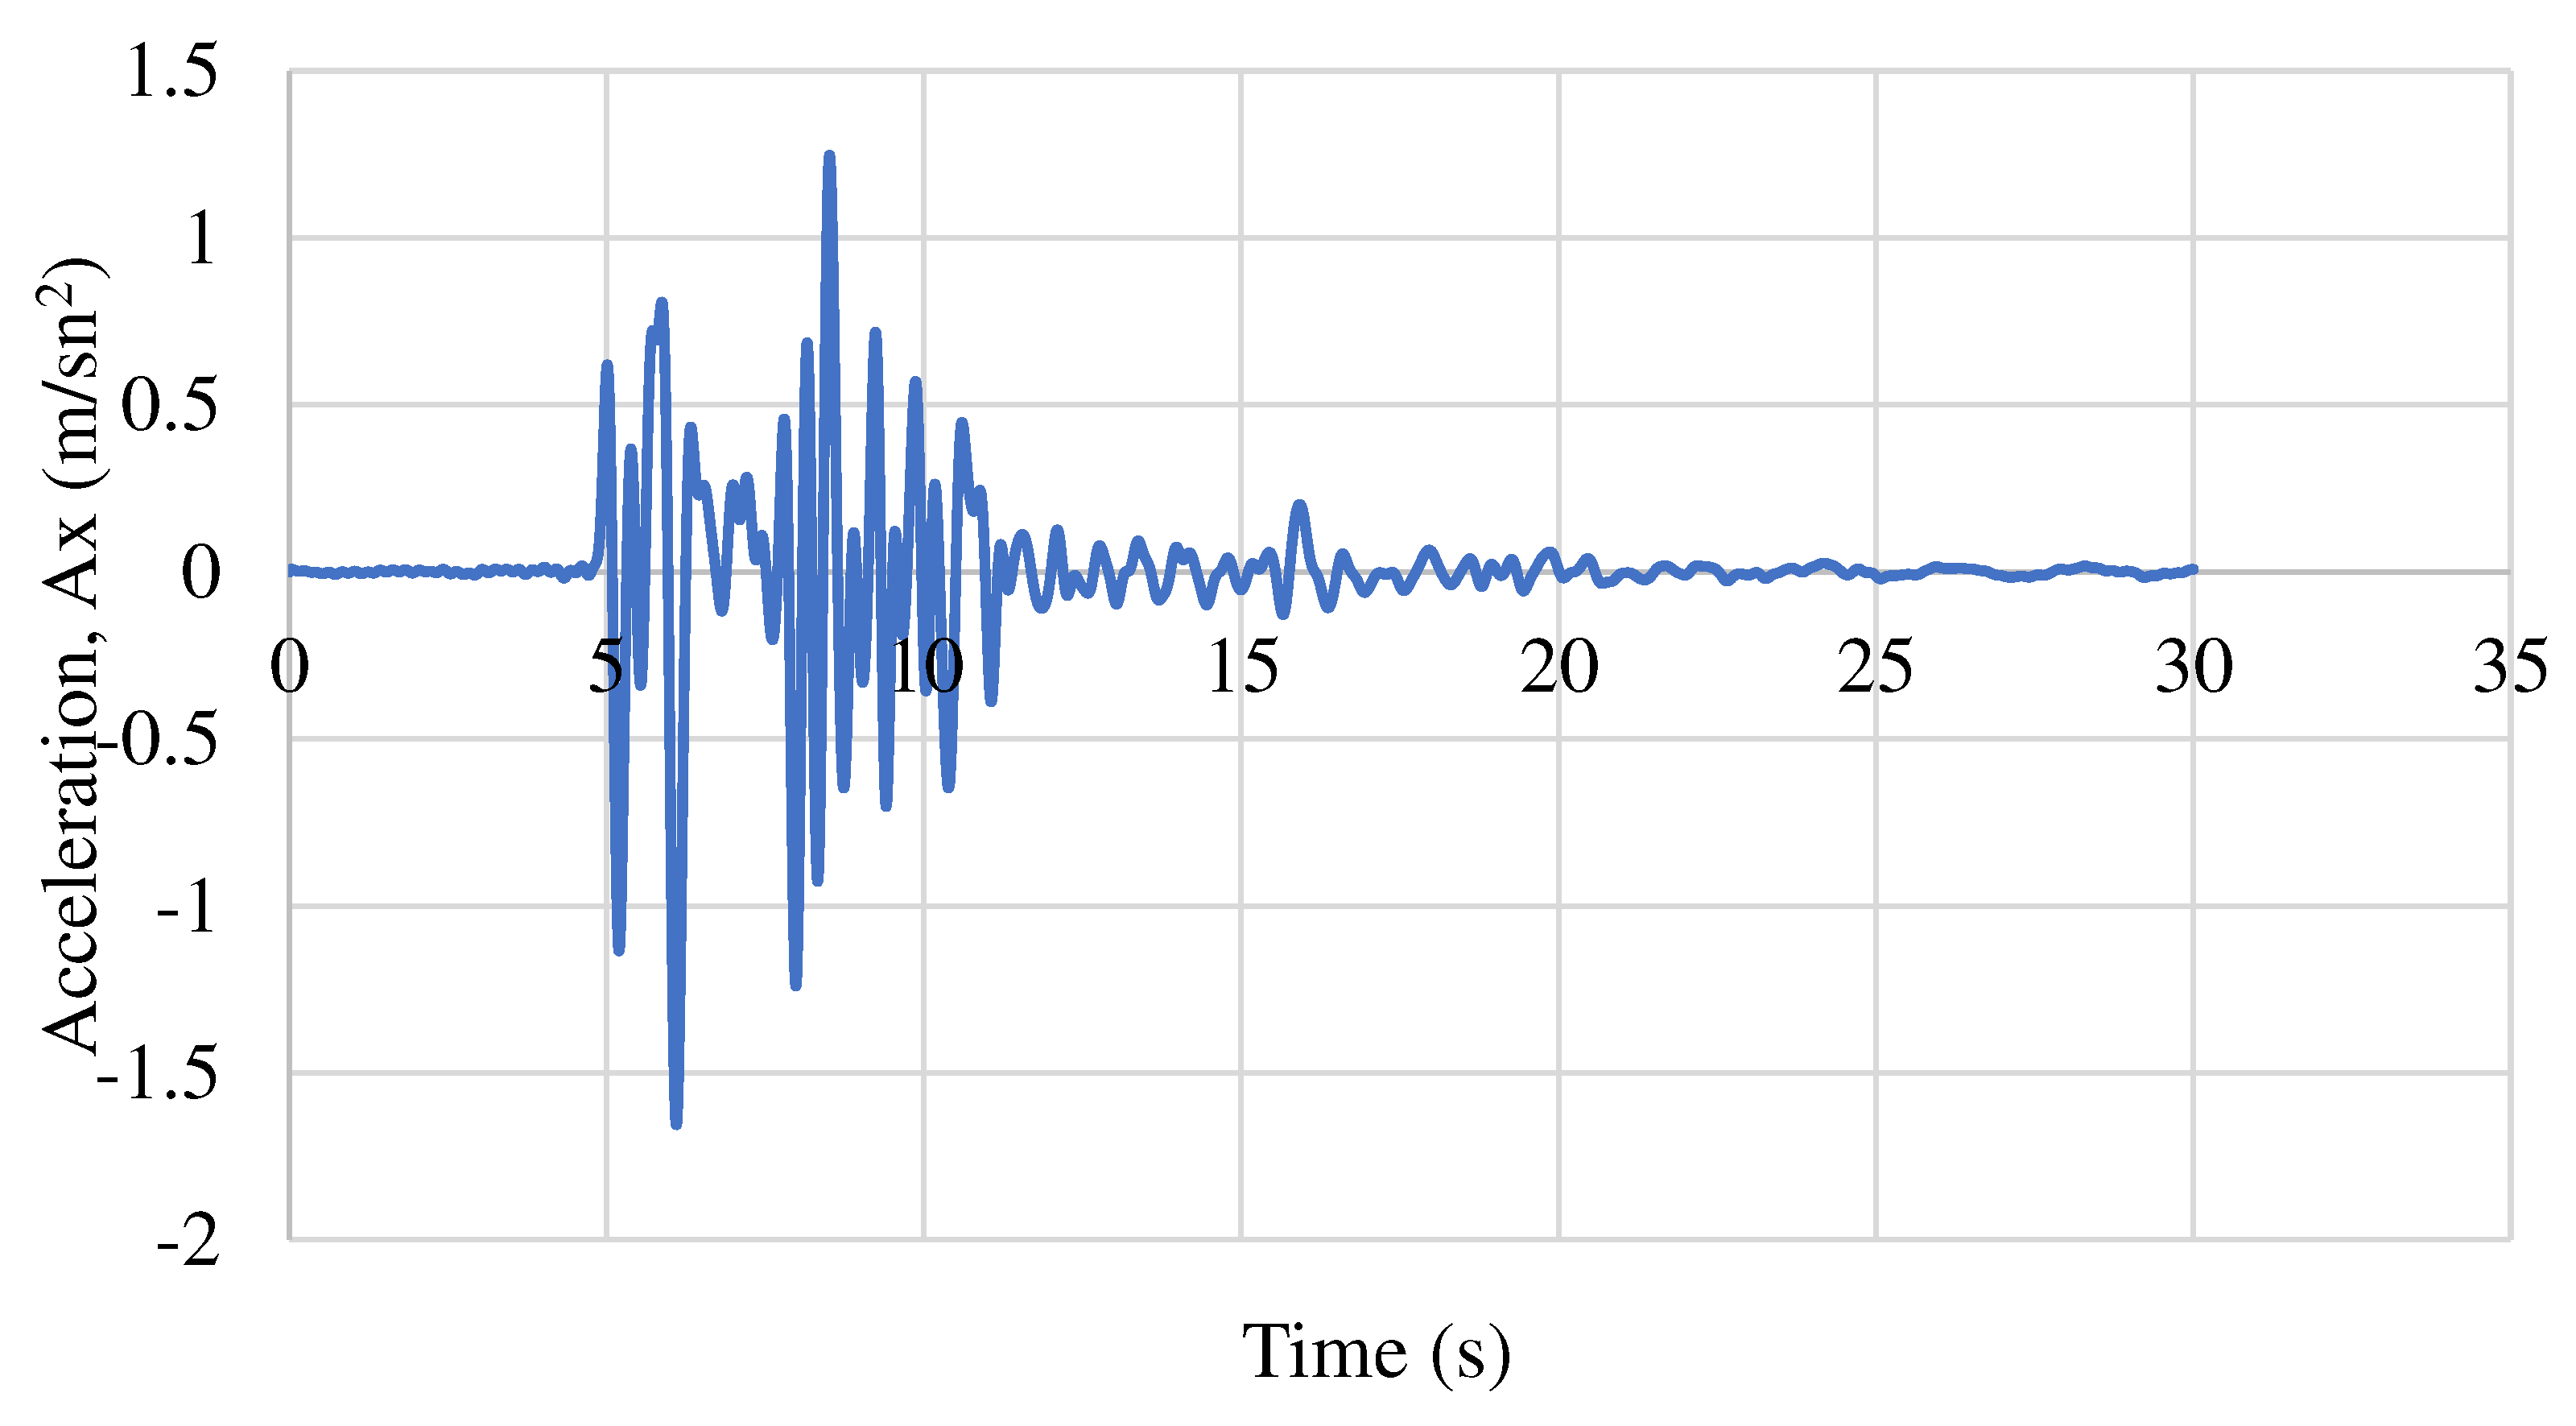
Figure 3. In addition, within the scope of the study, the effect of earthquake magnitude was investigated by using earthquake records magnified at different rates. For this purpose, earthquakes were magnified by means of the Plaxis program. Scaled earthquake records are presented in
Figure 4 and
Figure 5.
3.4. Mesh analysis
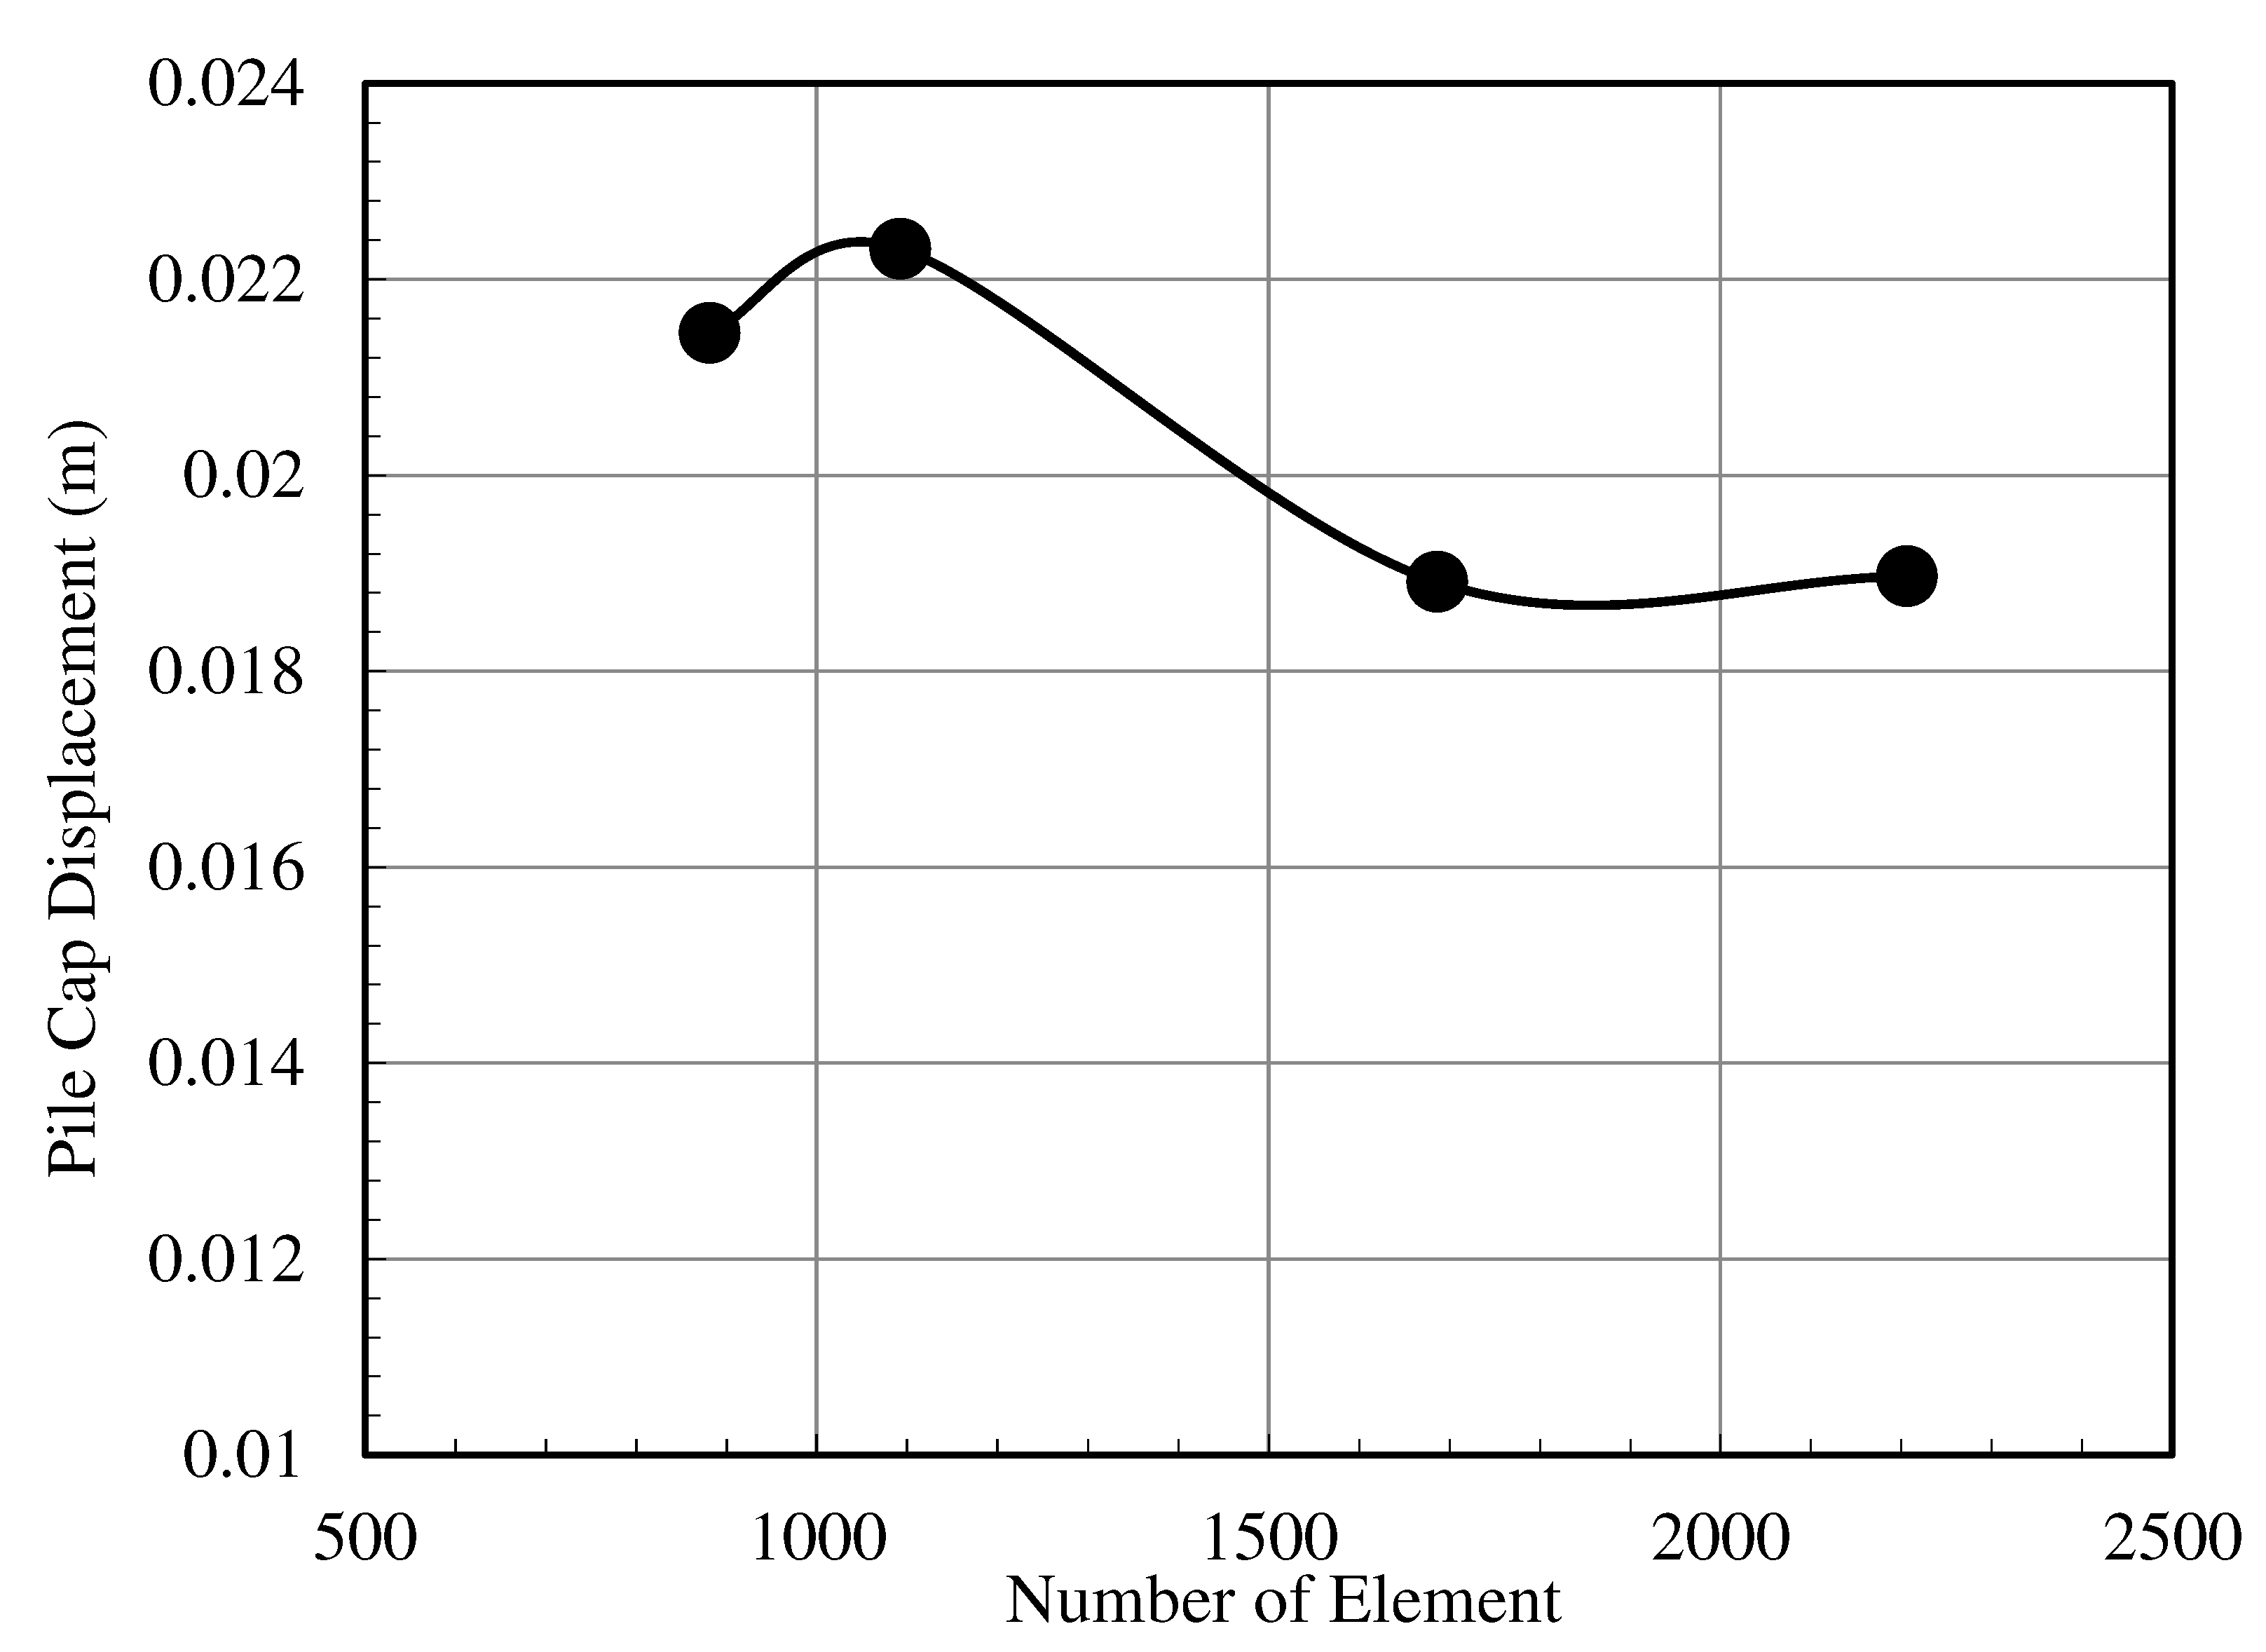
In order to investigate the effect of the mesh density selected in the finite element program on the results, 4 different mesh types were analyzed in a pilot analysis. It is seen that as the mesh range increases, the total deformation decreases and approaches the experimental results, and it will be sufficient to perform analyzes in the very fine mesh range. The values of the number of elements and the total displacement in the pile cap are presented in
Table 5. Additionally, the displacement change according to the number of elements is presented in
Figure 6.
3.5. Numerical Verification of the Experiment
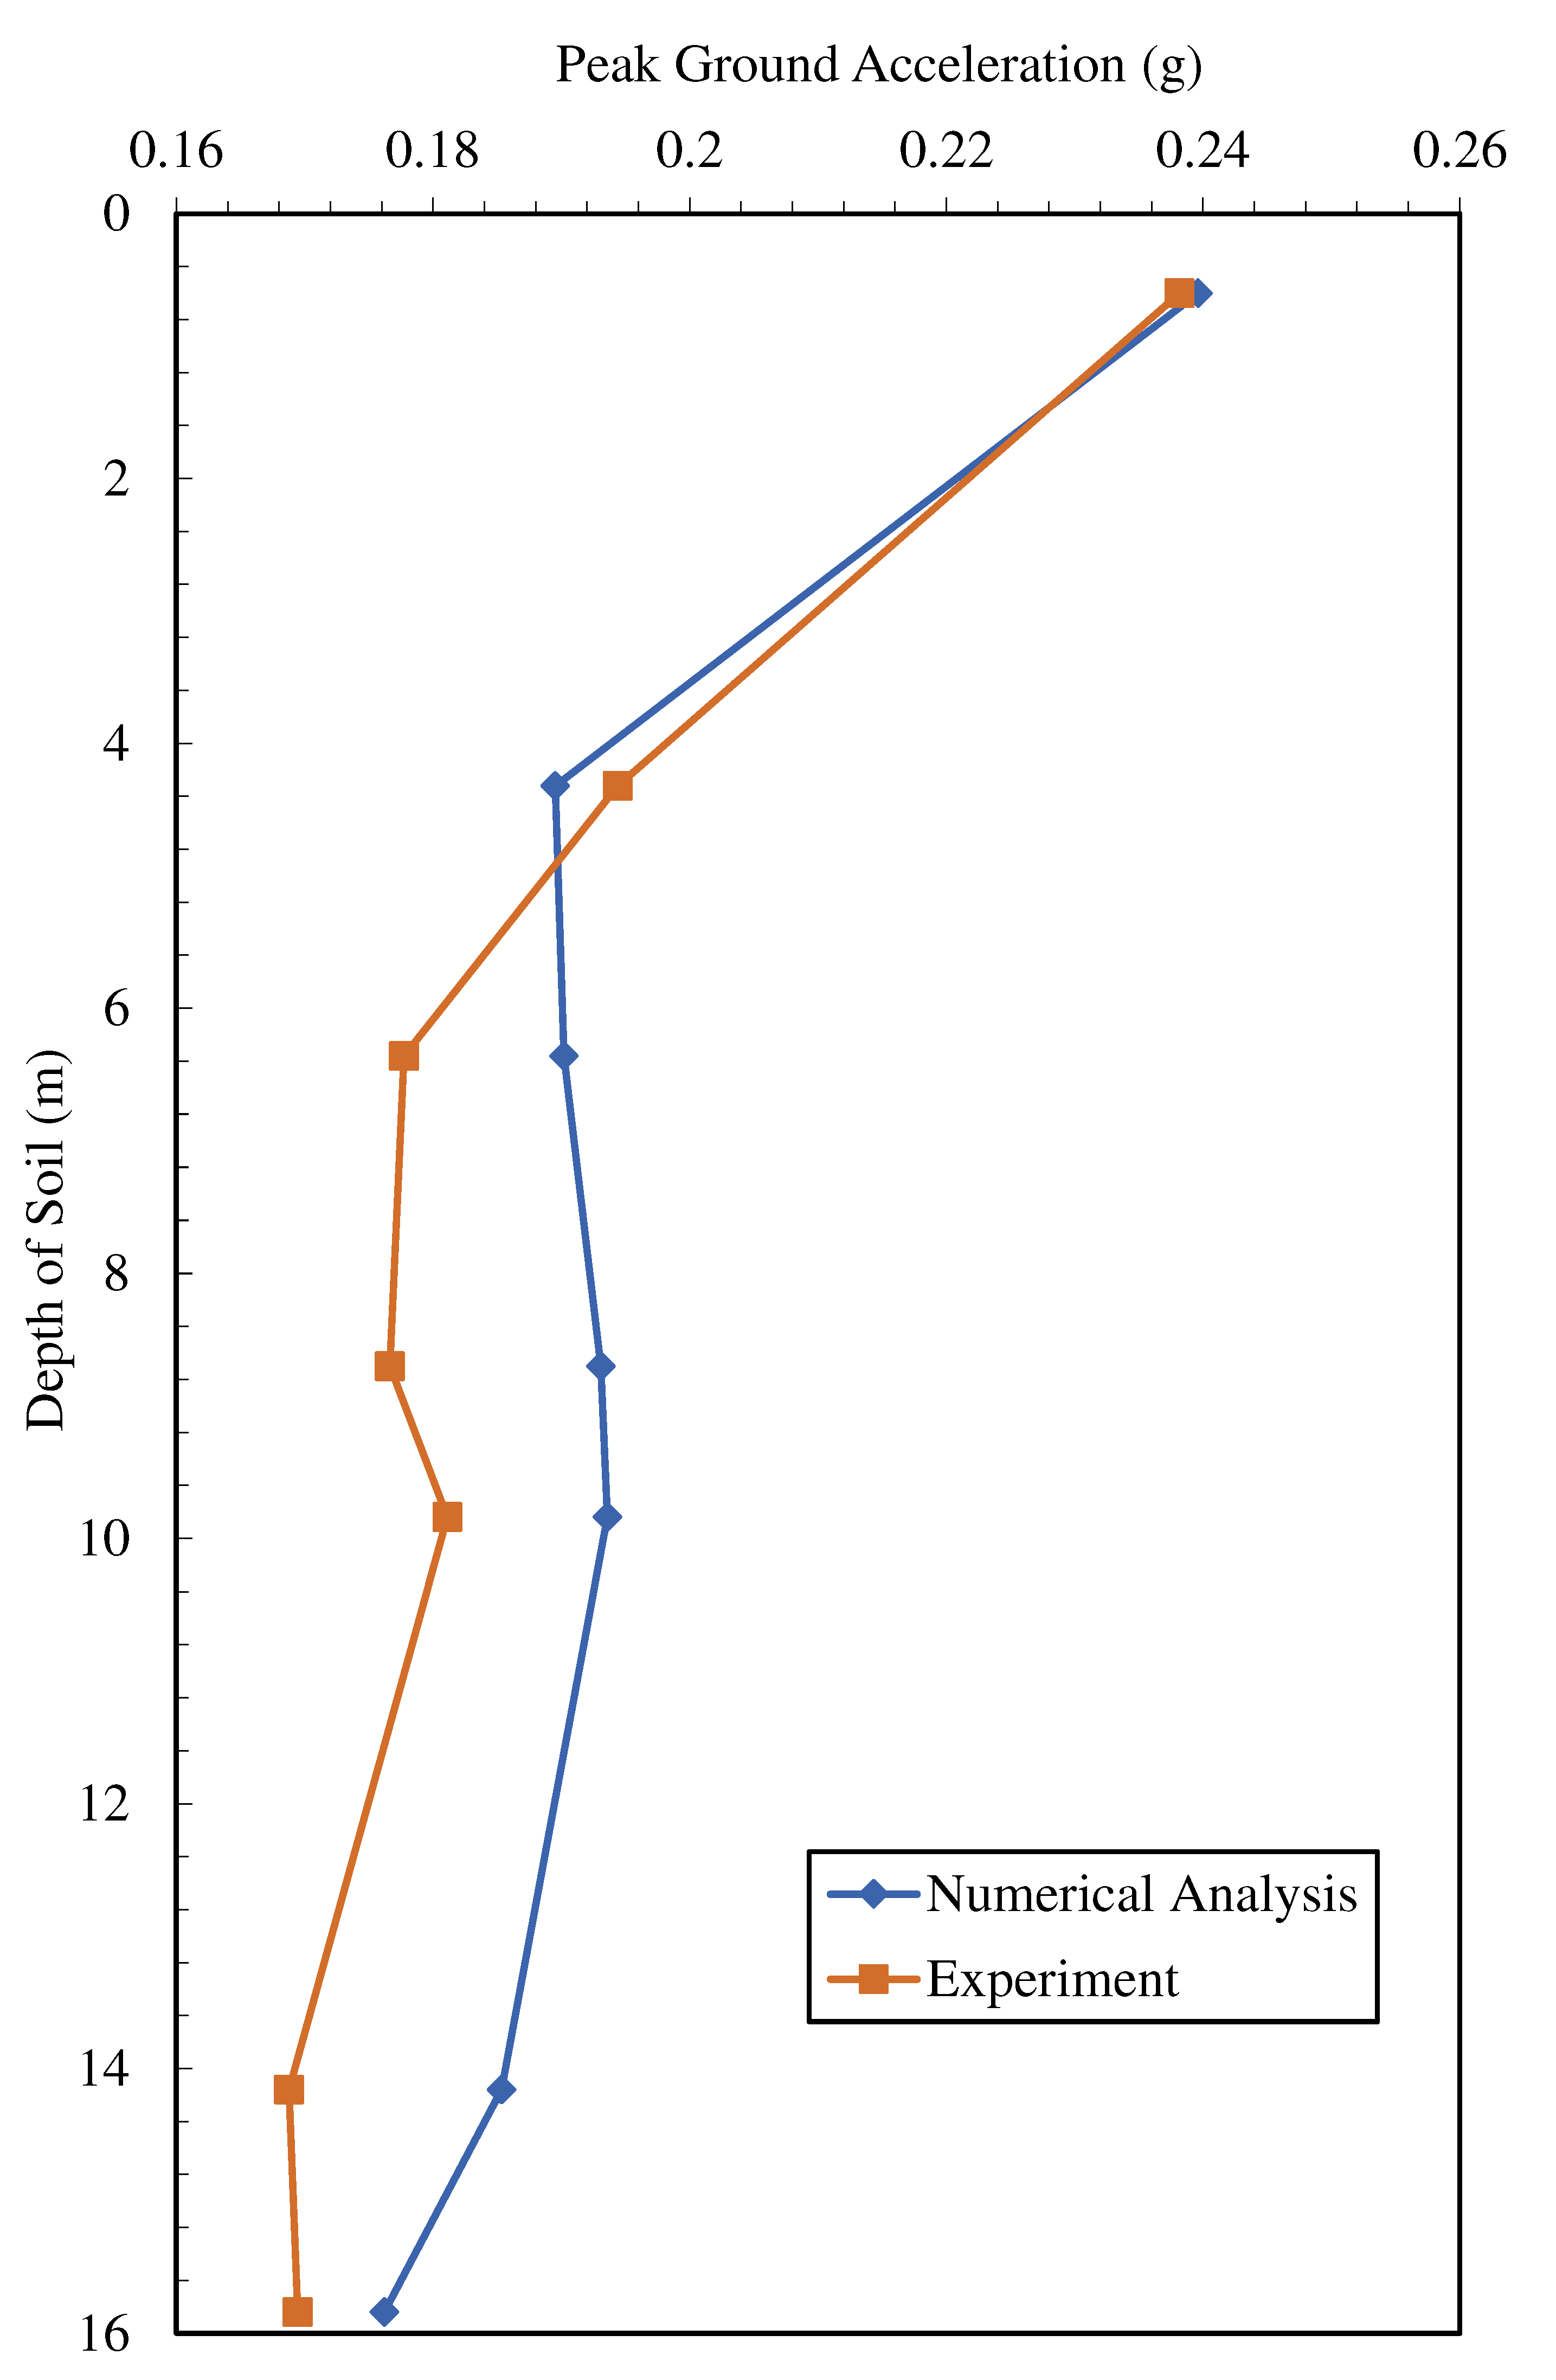
A single pile was numerically modeled to verify the experiments performed by Garala et al. (2022). In order to compare the results obtained from numerical modeling, the acceleration values measured along the soil depth in the experiments in the case of single piles were compared with the acceleration values obtained from numerical analyses. A numerical and experimental comparison of peak ground acceleration is presented in
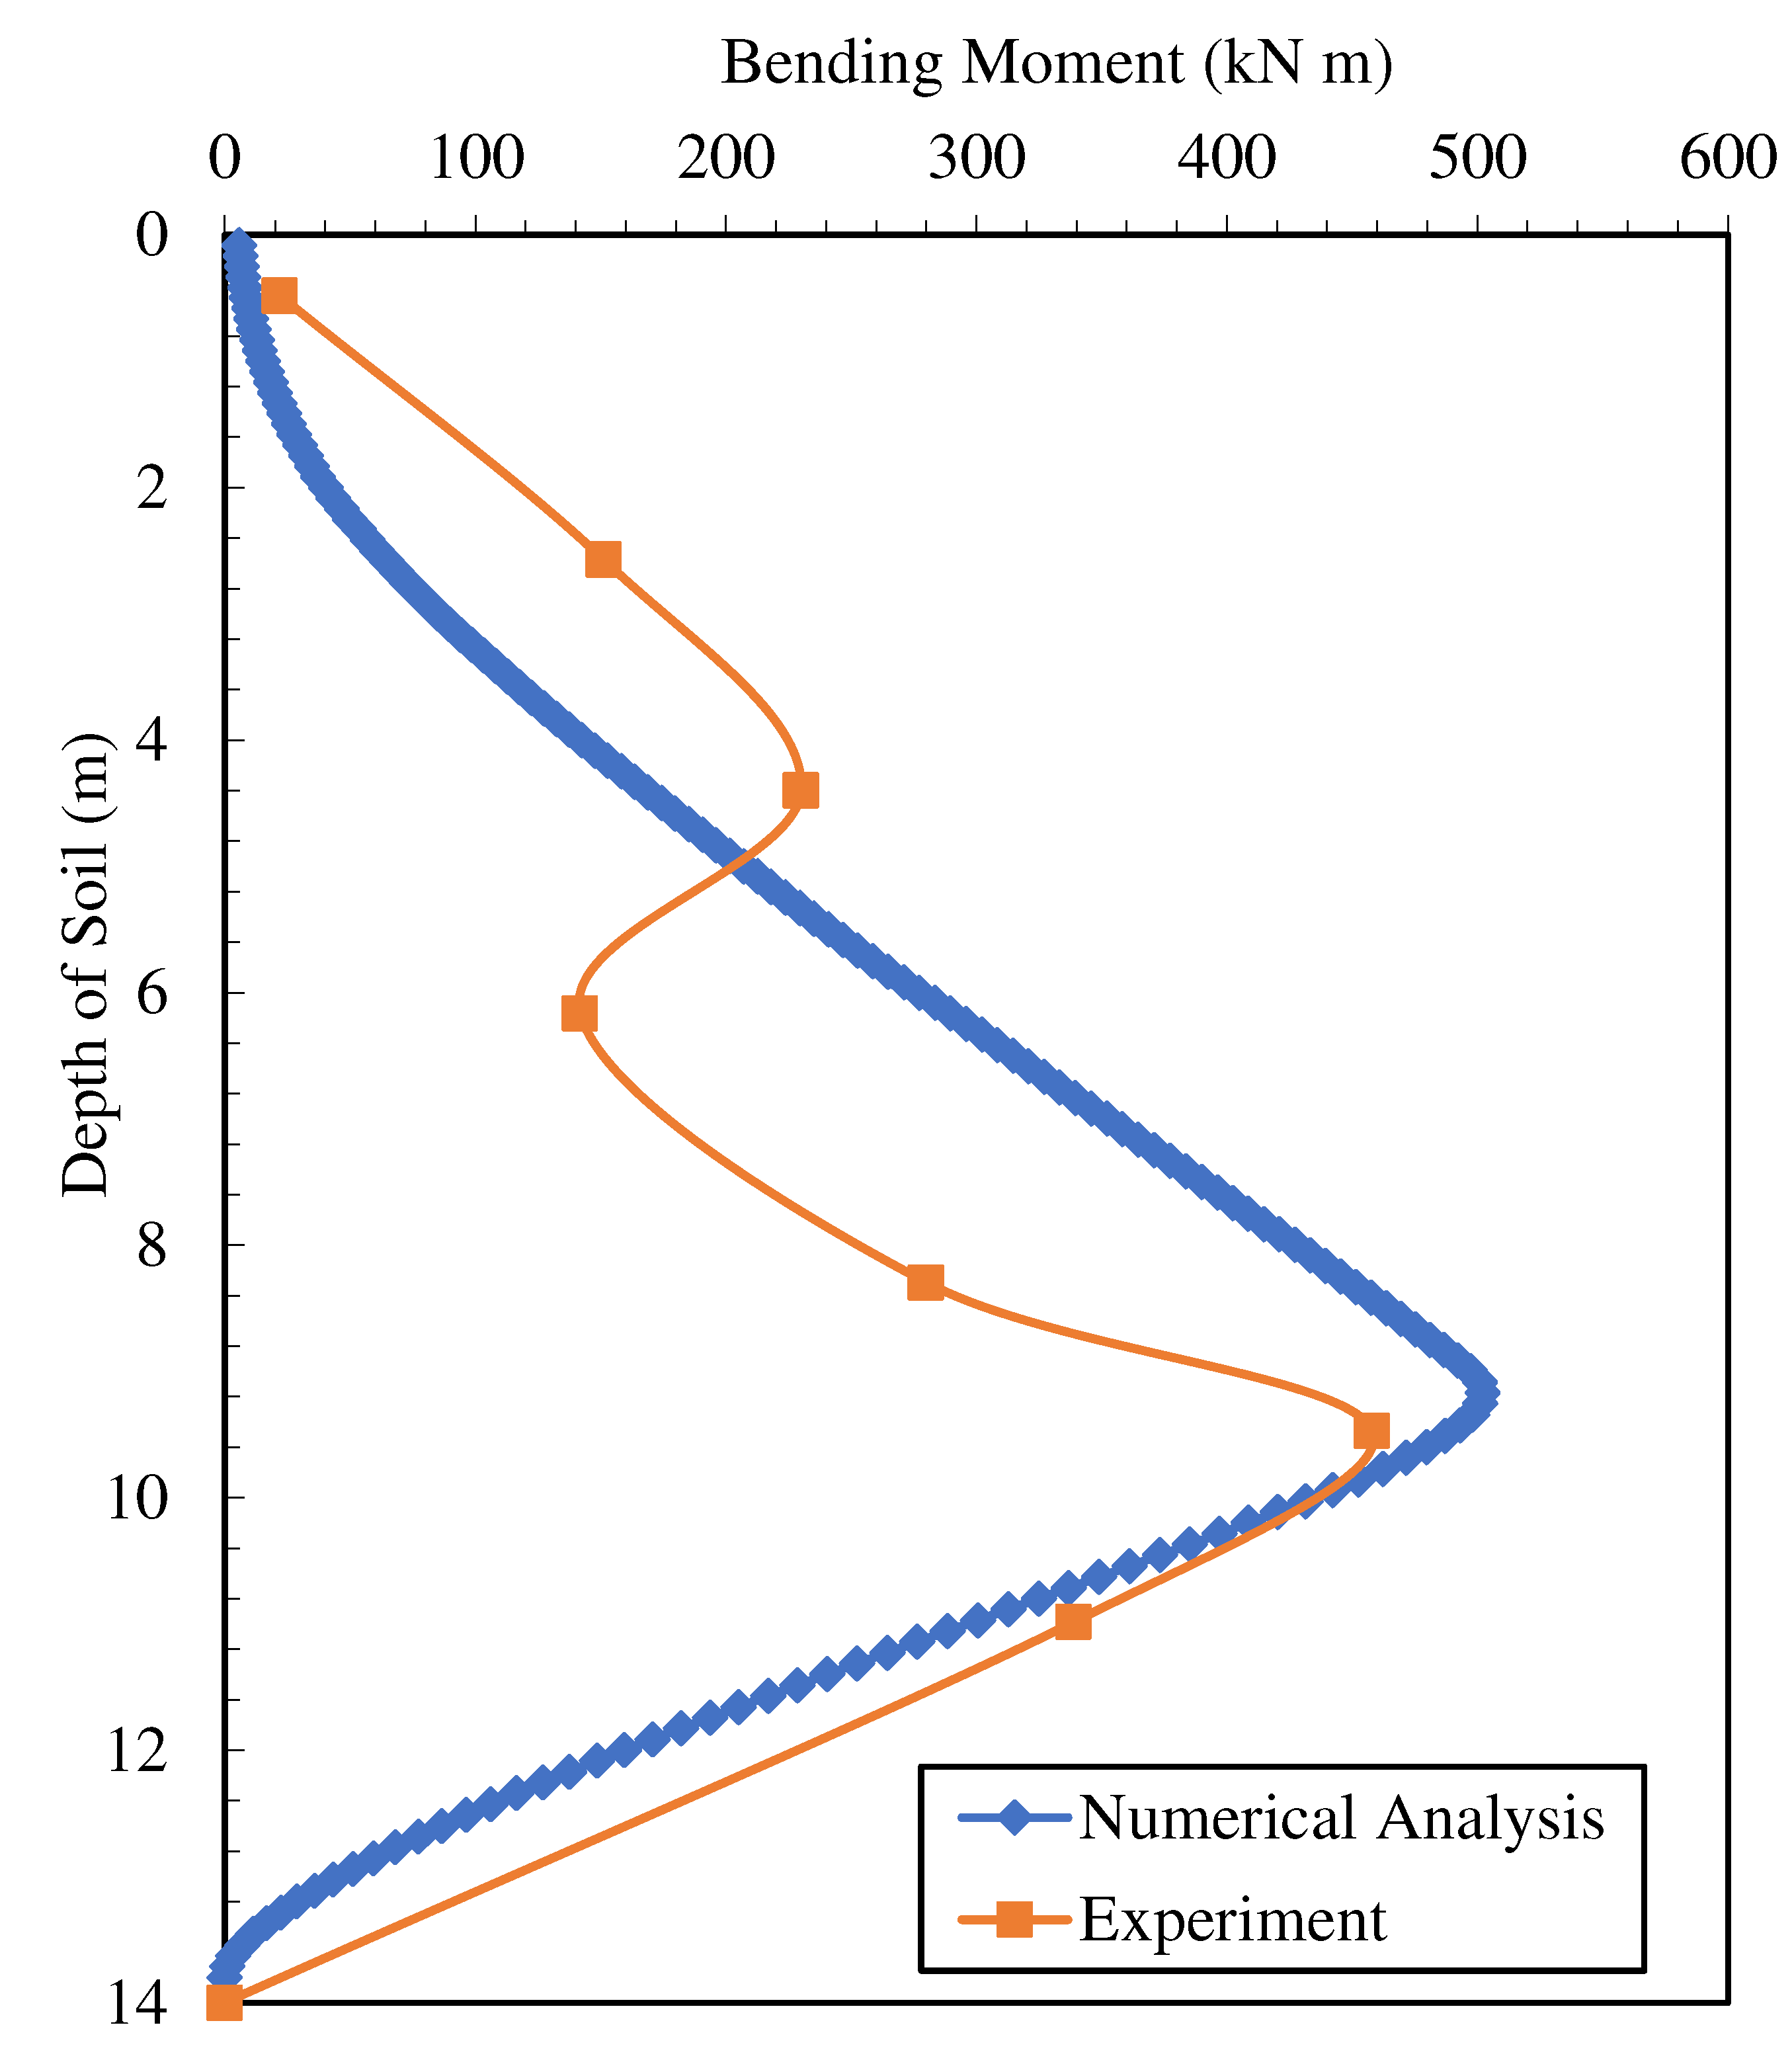
Figure 7. The results show that the acceleration change shows the same behavior and is largely coherent. Additionally, maximum moment values are compared and presented in
Figure 8. It has been observed that the results obtained from the numerical analyses performed to compare the maximum moment values are compatible with the experimental results. As expected, the maximum moment value was obtained in the clay-sand transition layer transition region, and the compliance at this point was observed to be 94%.
4. Parametric Studies
Within the scope of the study, after the experimental data were verified, the effects of different parameters were investigated numerically. In this context, the effects of parameters such as clay layer thickness, groundwater level, pile stiffness, and earthquake magnitude were analyzed. The results obtained from the analyses were evaluated by considering the pile cap displacement and the maximum moment values occurring in the pile.
4.1. Effect of Clay Liner Thickness
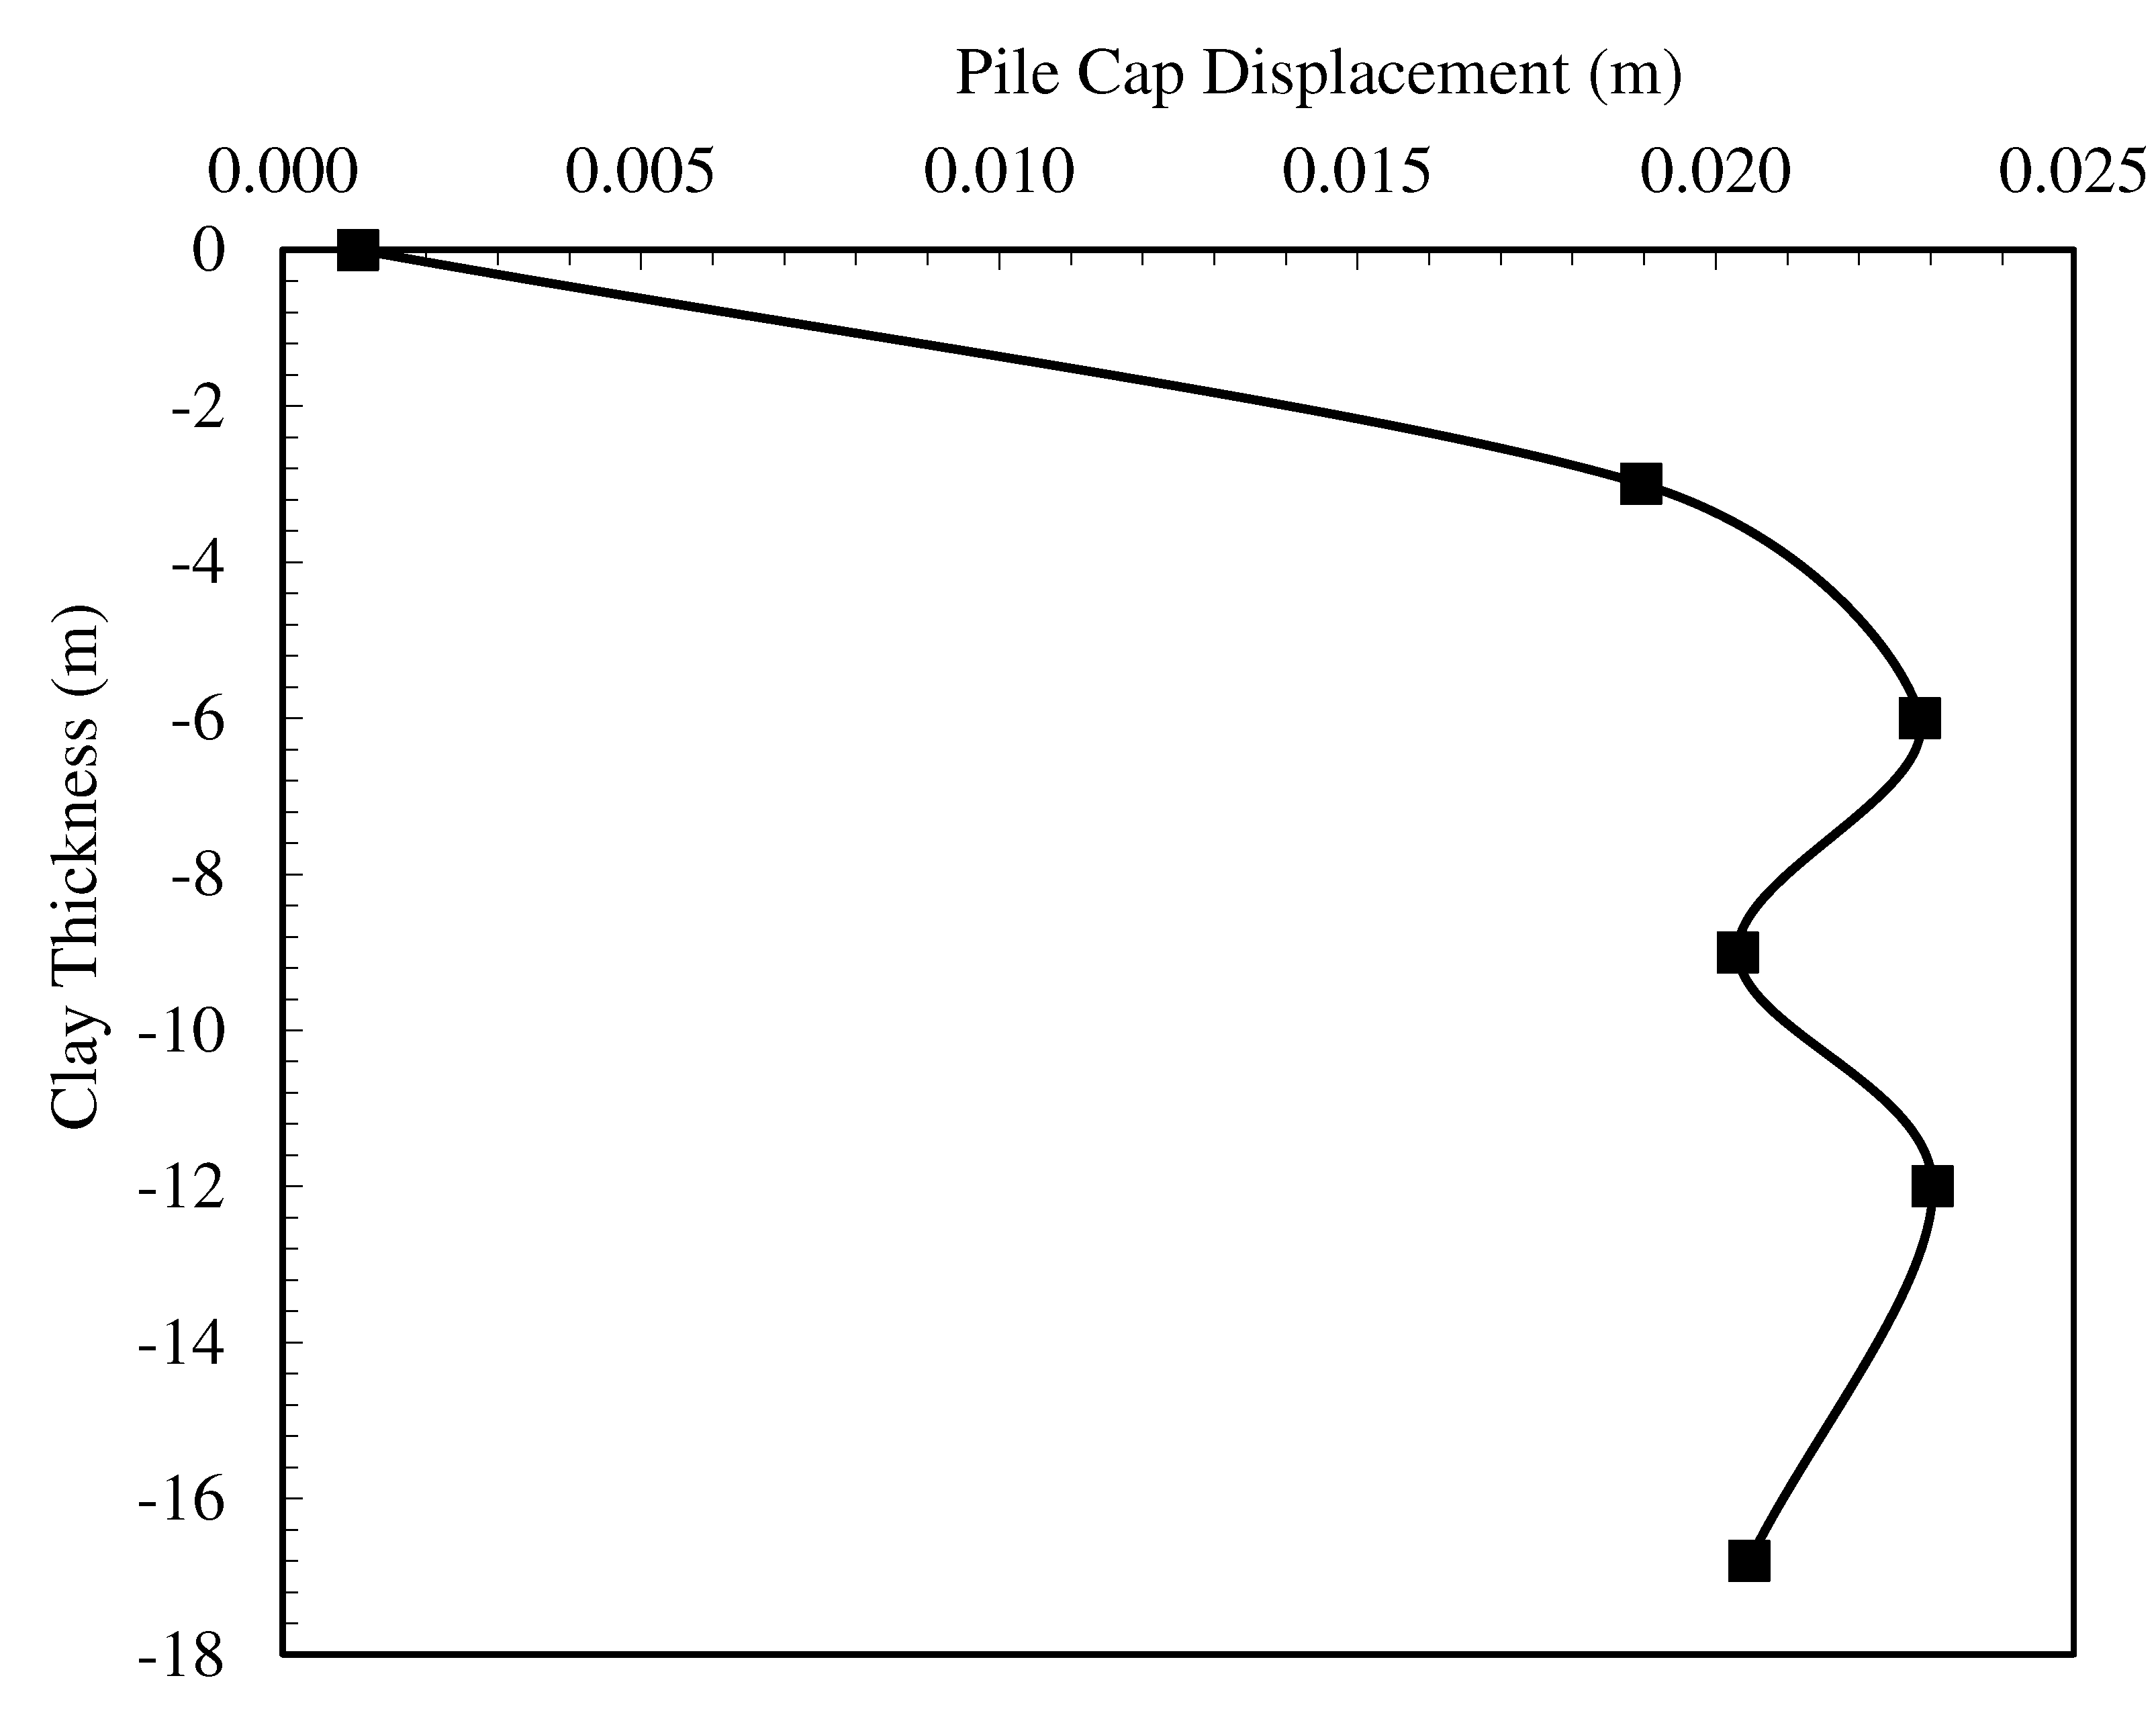
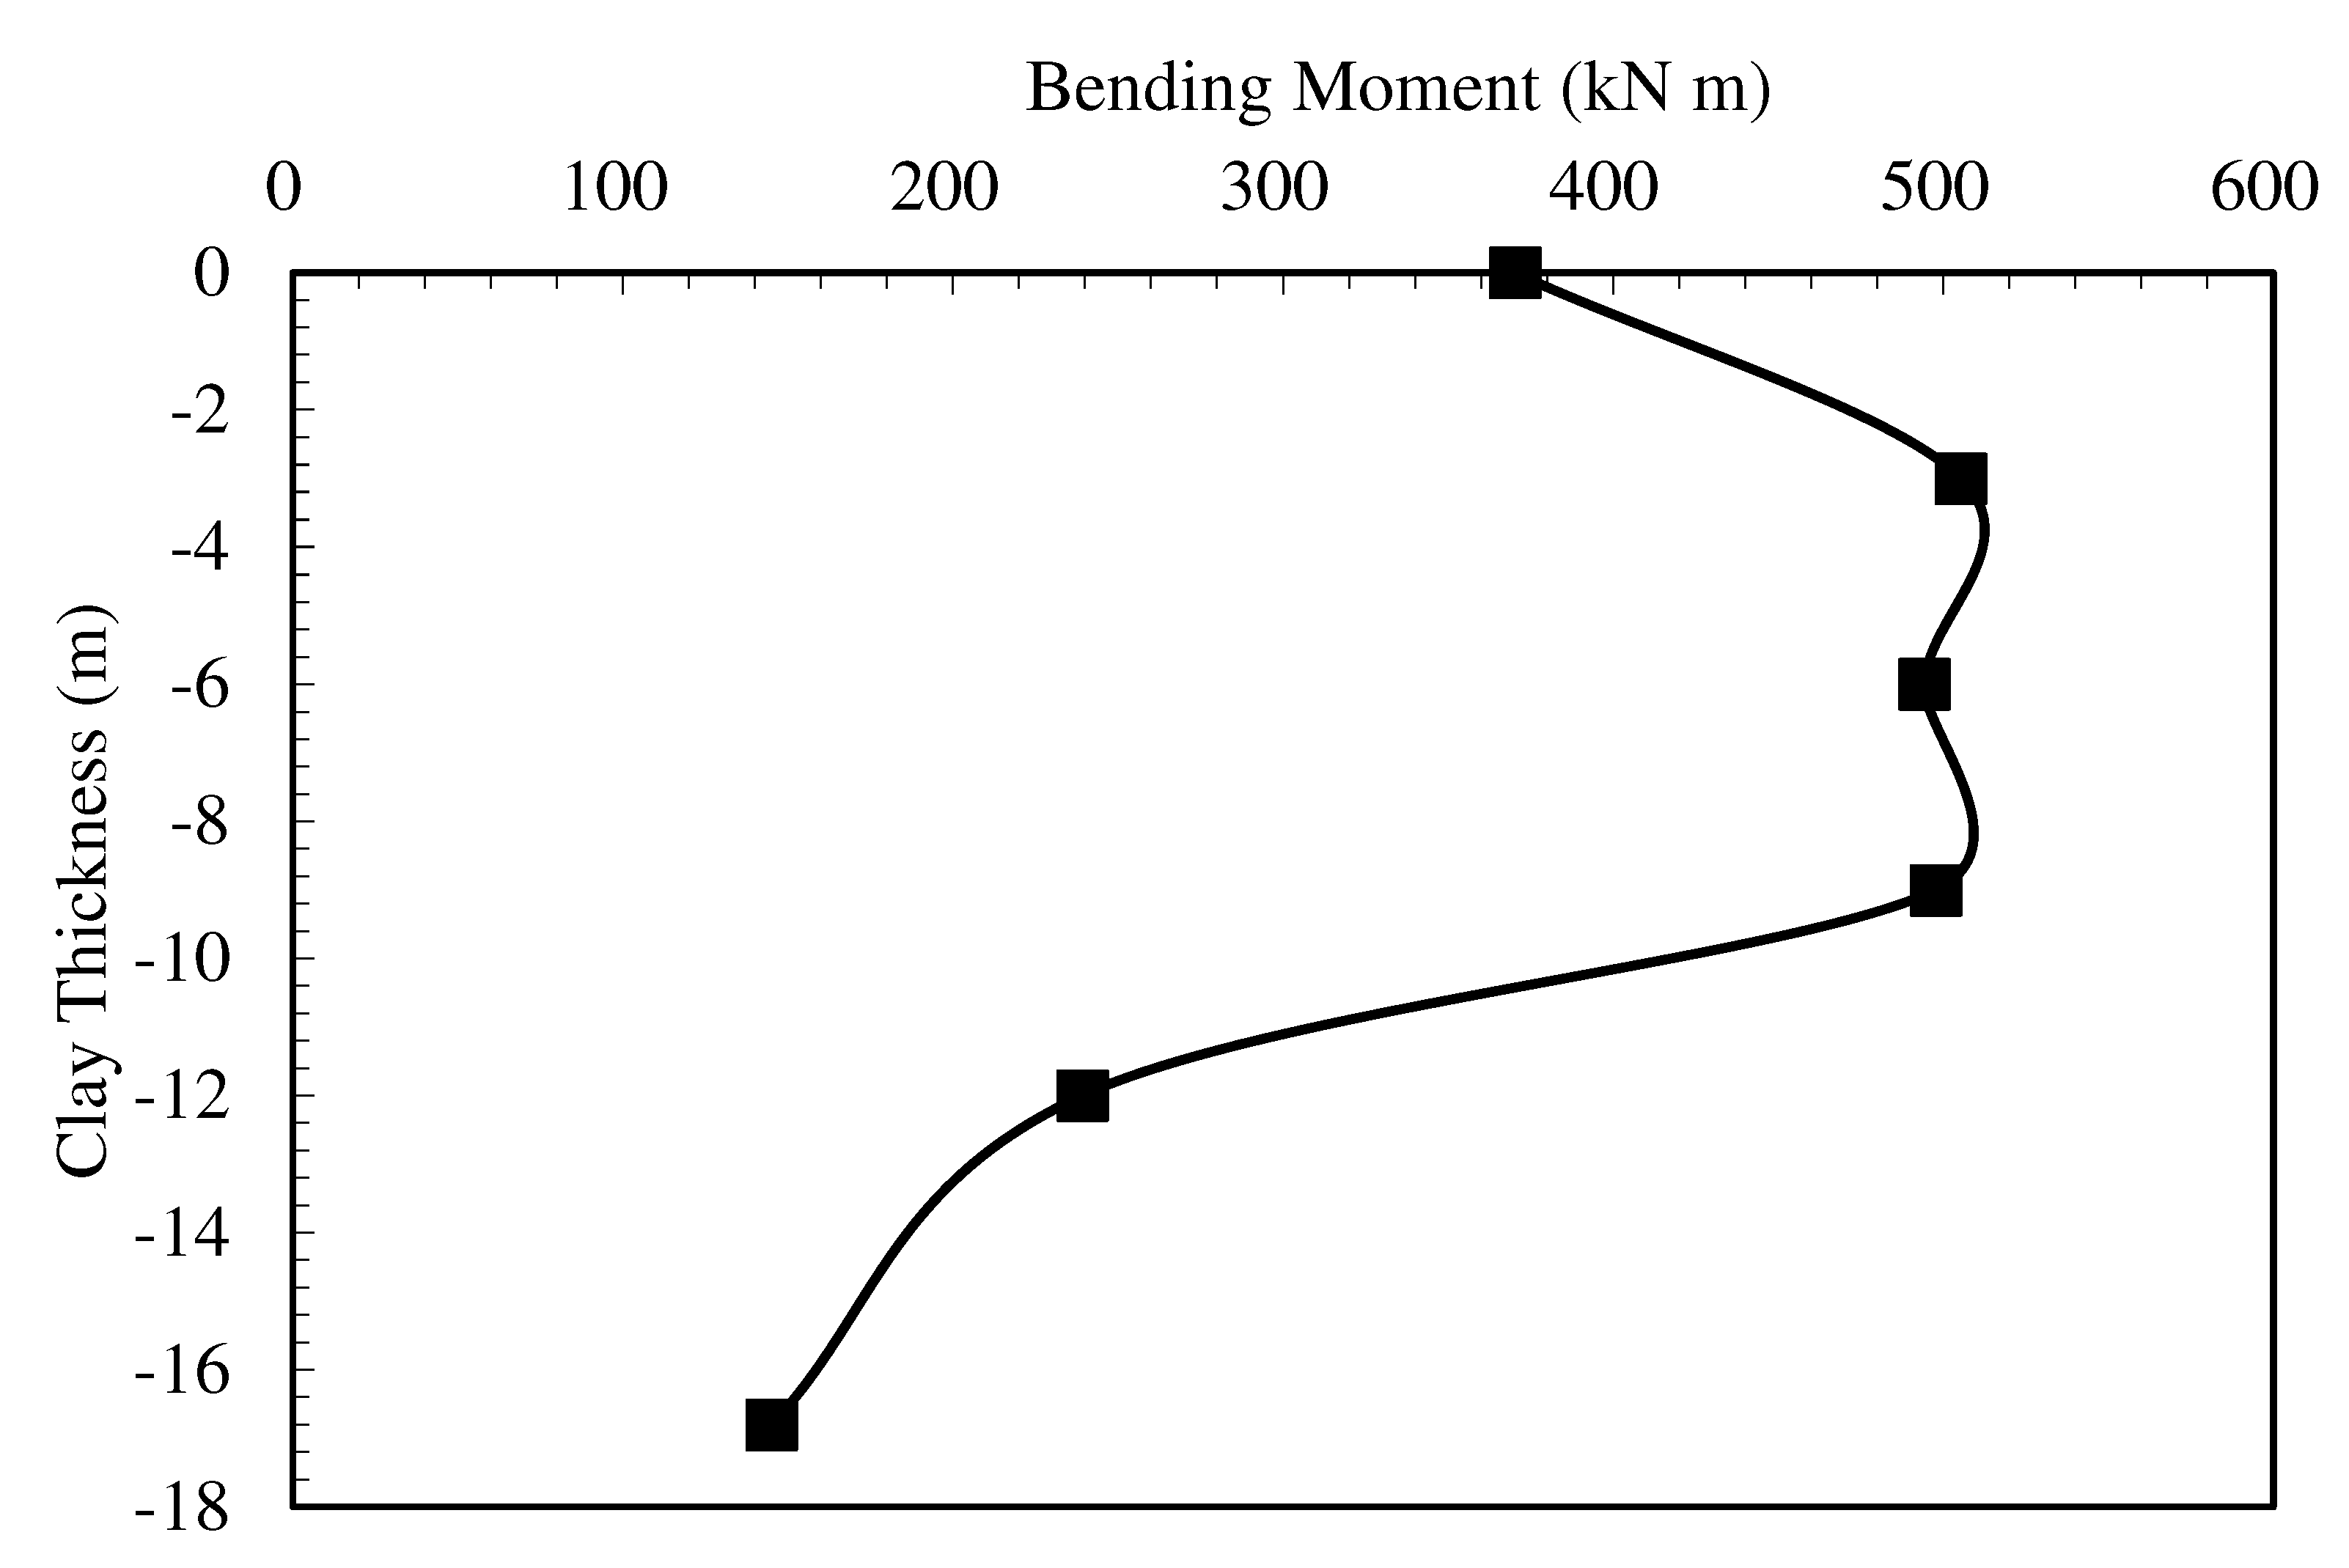
In the experimental study, the length of the piles in the clay was 9 meters, and the pile length in the sand was 4.8 meters. The effect of changing clay soil layer thickness was investigated. For this purpose, the situation in which the pile was completely located in clay and the clay layer thicknesses of 3, 6, 9, and 12 meters were analyzed. In these analyses, groundwater was not considered in the numerical analyses as in the reference experiment. The pile cap displacement change obtained from the analysis is presented in
Figure 9, and the maximum moment change curve is presented in
Figure 10. Considering the pile cap displacement values, although there was no significant increase in the displacement values at first with the increase in the clay layer thickness, significant increases were observed in the pile cap displacement at the depth where the clay layer thickness reached approximately 75% of the total pile length. No significant increase in displacements was observed as the clay layer thickness reached larger values. This is due to the fact that the pile behaves more flexible under kinematic conditions, as the amount of sockets to the dense sand decreases. When evaluated in terms of bending moments, it is seen that the maximum moment occurs when the clay layer thickness is equal to 75% of the total pile length. It is understood that kinematic conditions increase as the socket length on dense sand reaches a certain level. The reason for the decrease in pile displacement and maximum moment in case of socket length less than this value is that the pile changes to a single-layer behavior and the relative displacements along the pile are minimized.
4.2. Effect of Groundwater Level
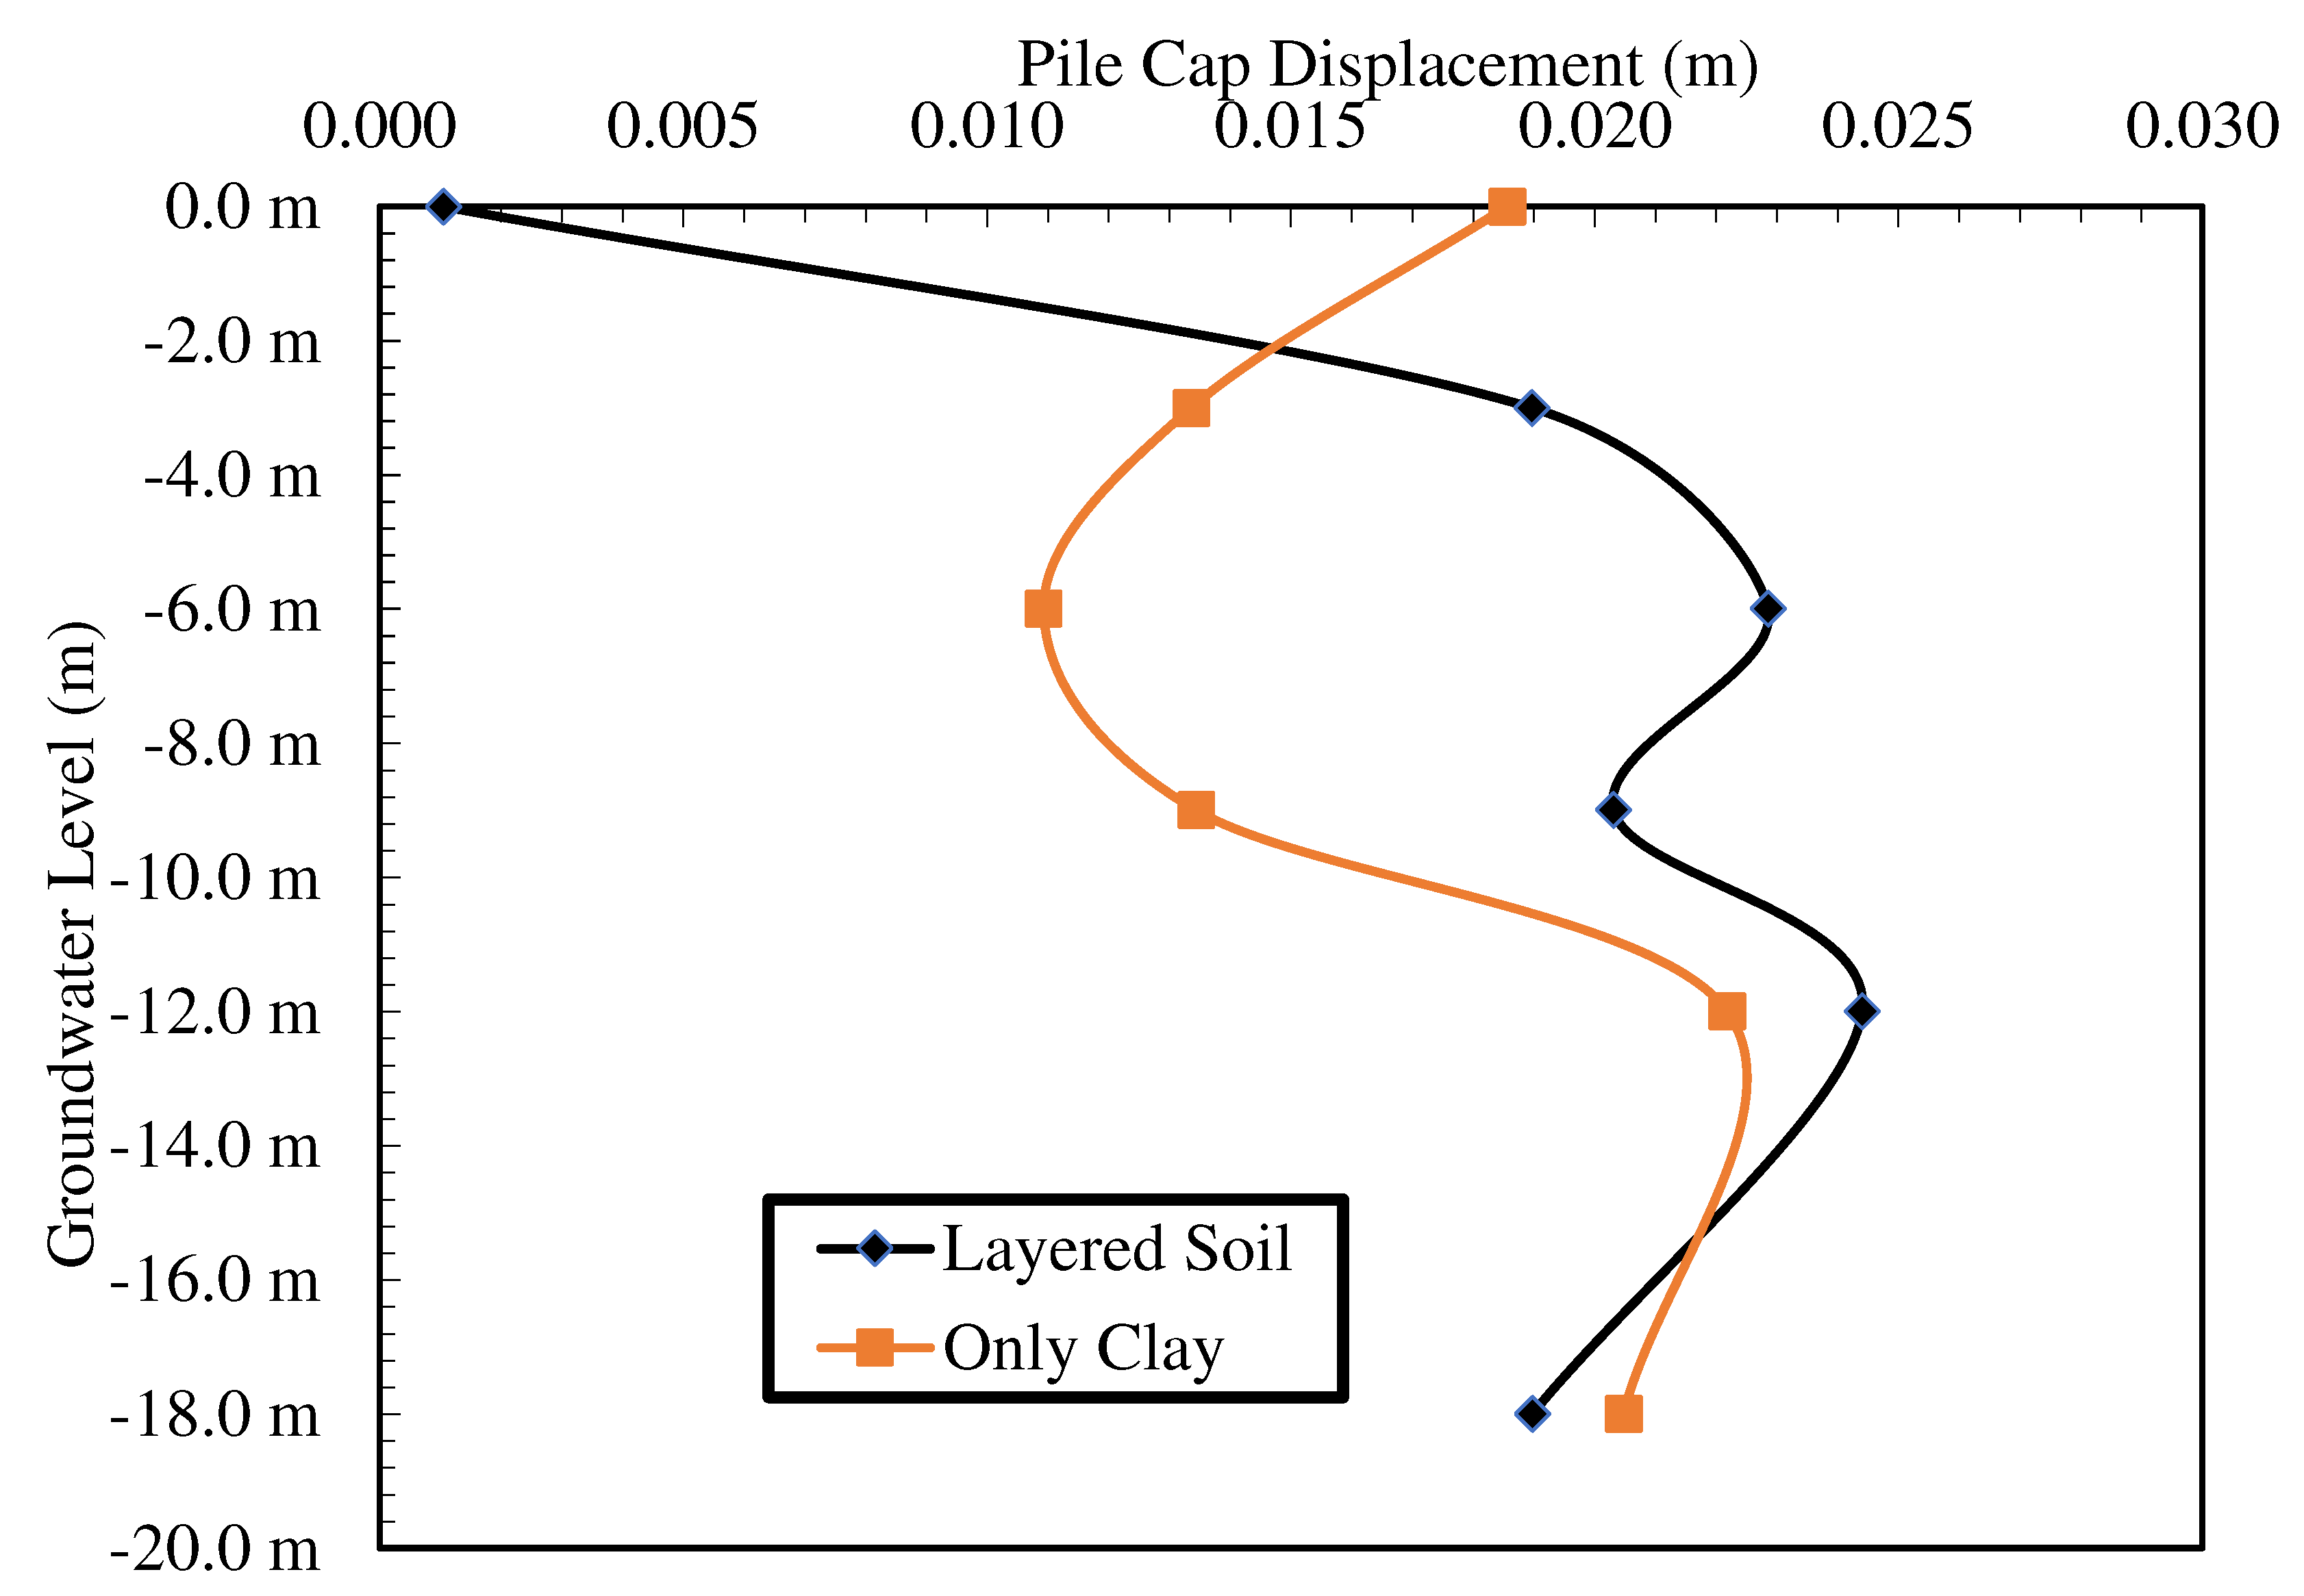
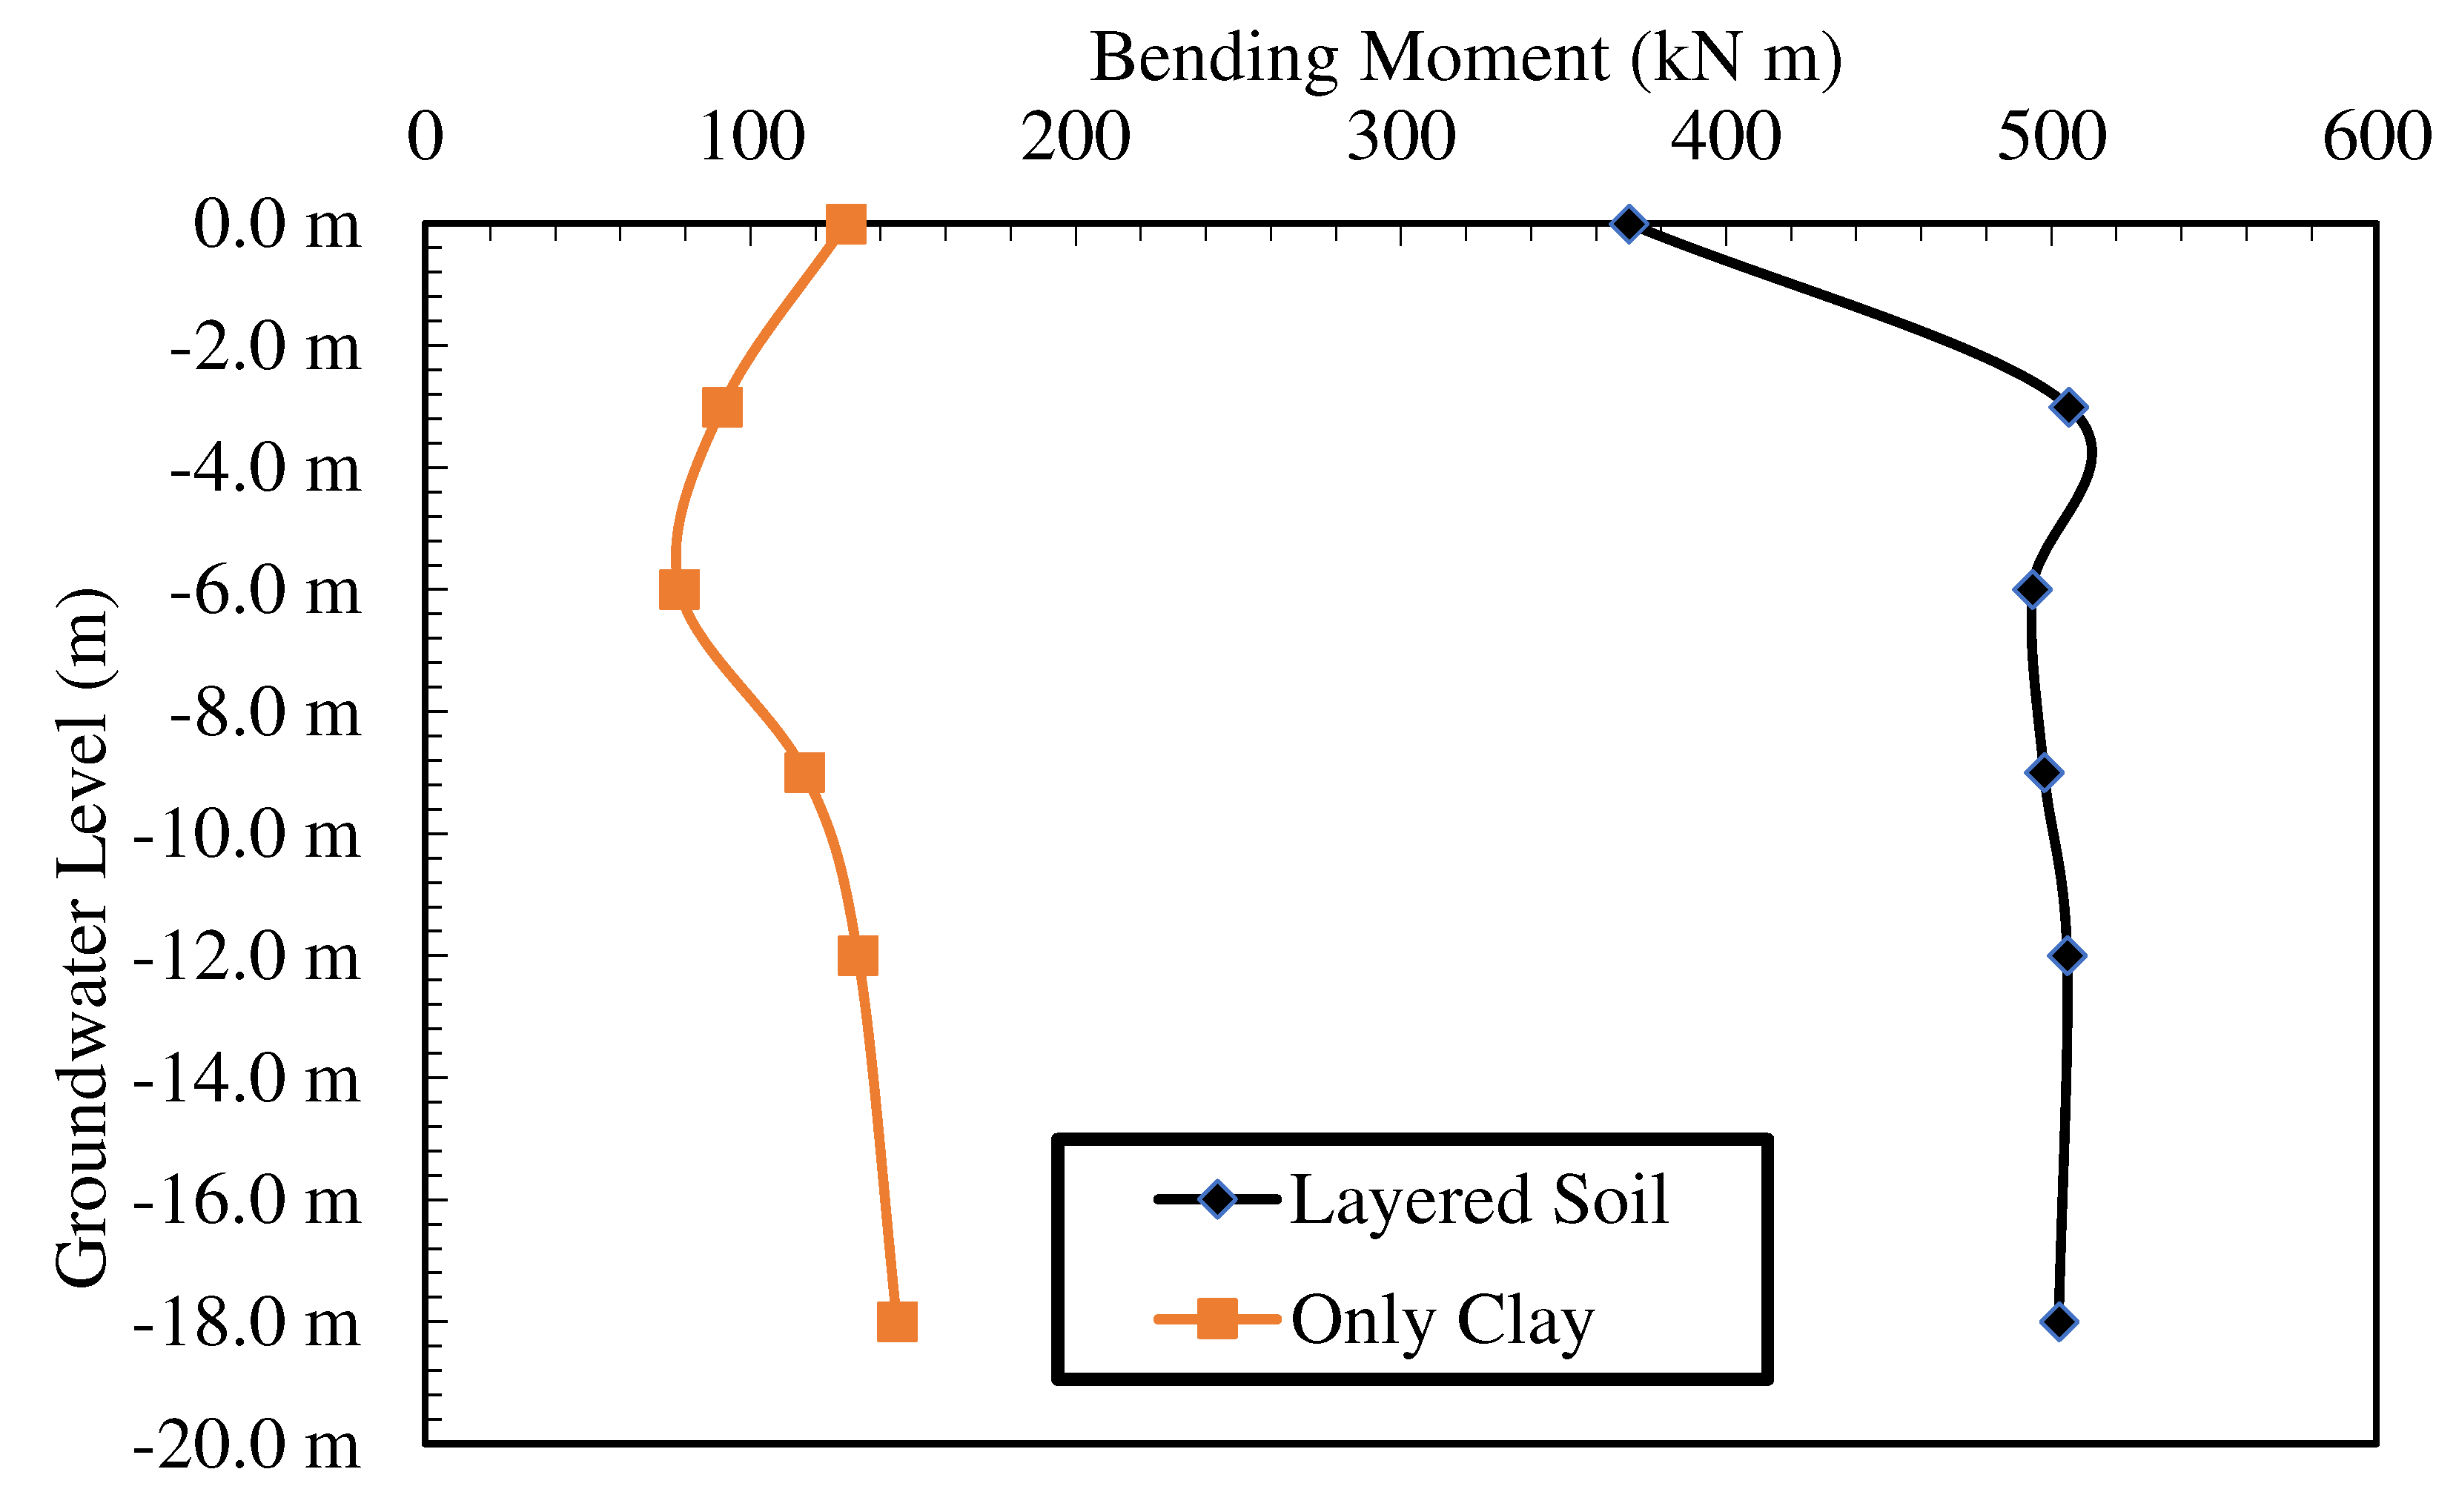
In order to investigate the effect of the groundwater level, the condition of the soil being completely clay was investigated numerically. Clay and sand layer thicknesses were not changed in the experimental analysis. For both cases, the groundwater levels at the surface, -3 m, -6 m and -9 m were examined. For both cases, the groundwater level-displacement graph is presented in
Figure 11, and the groundwater level-maximum moment graph is presented in
Figure 12. Considering the layered soil situation, it is seen that the displacement increases with the increase in the depth of the groundwater level, and there is no significant change in the displacement after the groundwater level reaches -6 m. This situation is caused by the groundwater level approaching the underlying sand layer, and the effect of the groundwater level remaining in the sand on deformation decreases. In the case of only clay, it was observed that the deformation first decreased and then increased as the groundwater level increased. The decrease in the groundwater level causes the upper layer to behave more rigidly and the deformation to decrease up to a certain level. As the water level decreases below the bottom elevation of the pile, the pile behaves flexible, and its deformation increases. In terms of the maximum moment, in the experiment analysis, if the groundwater is on the surface, the moment takes the lowest value and then shows a very significant change. In the clay case, groundwater does not have a significant effect.
4.3. Effect of Pile Stiffness
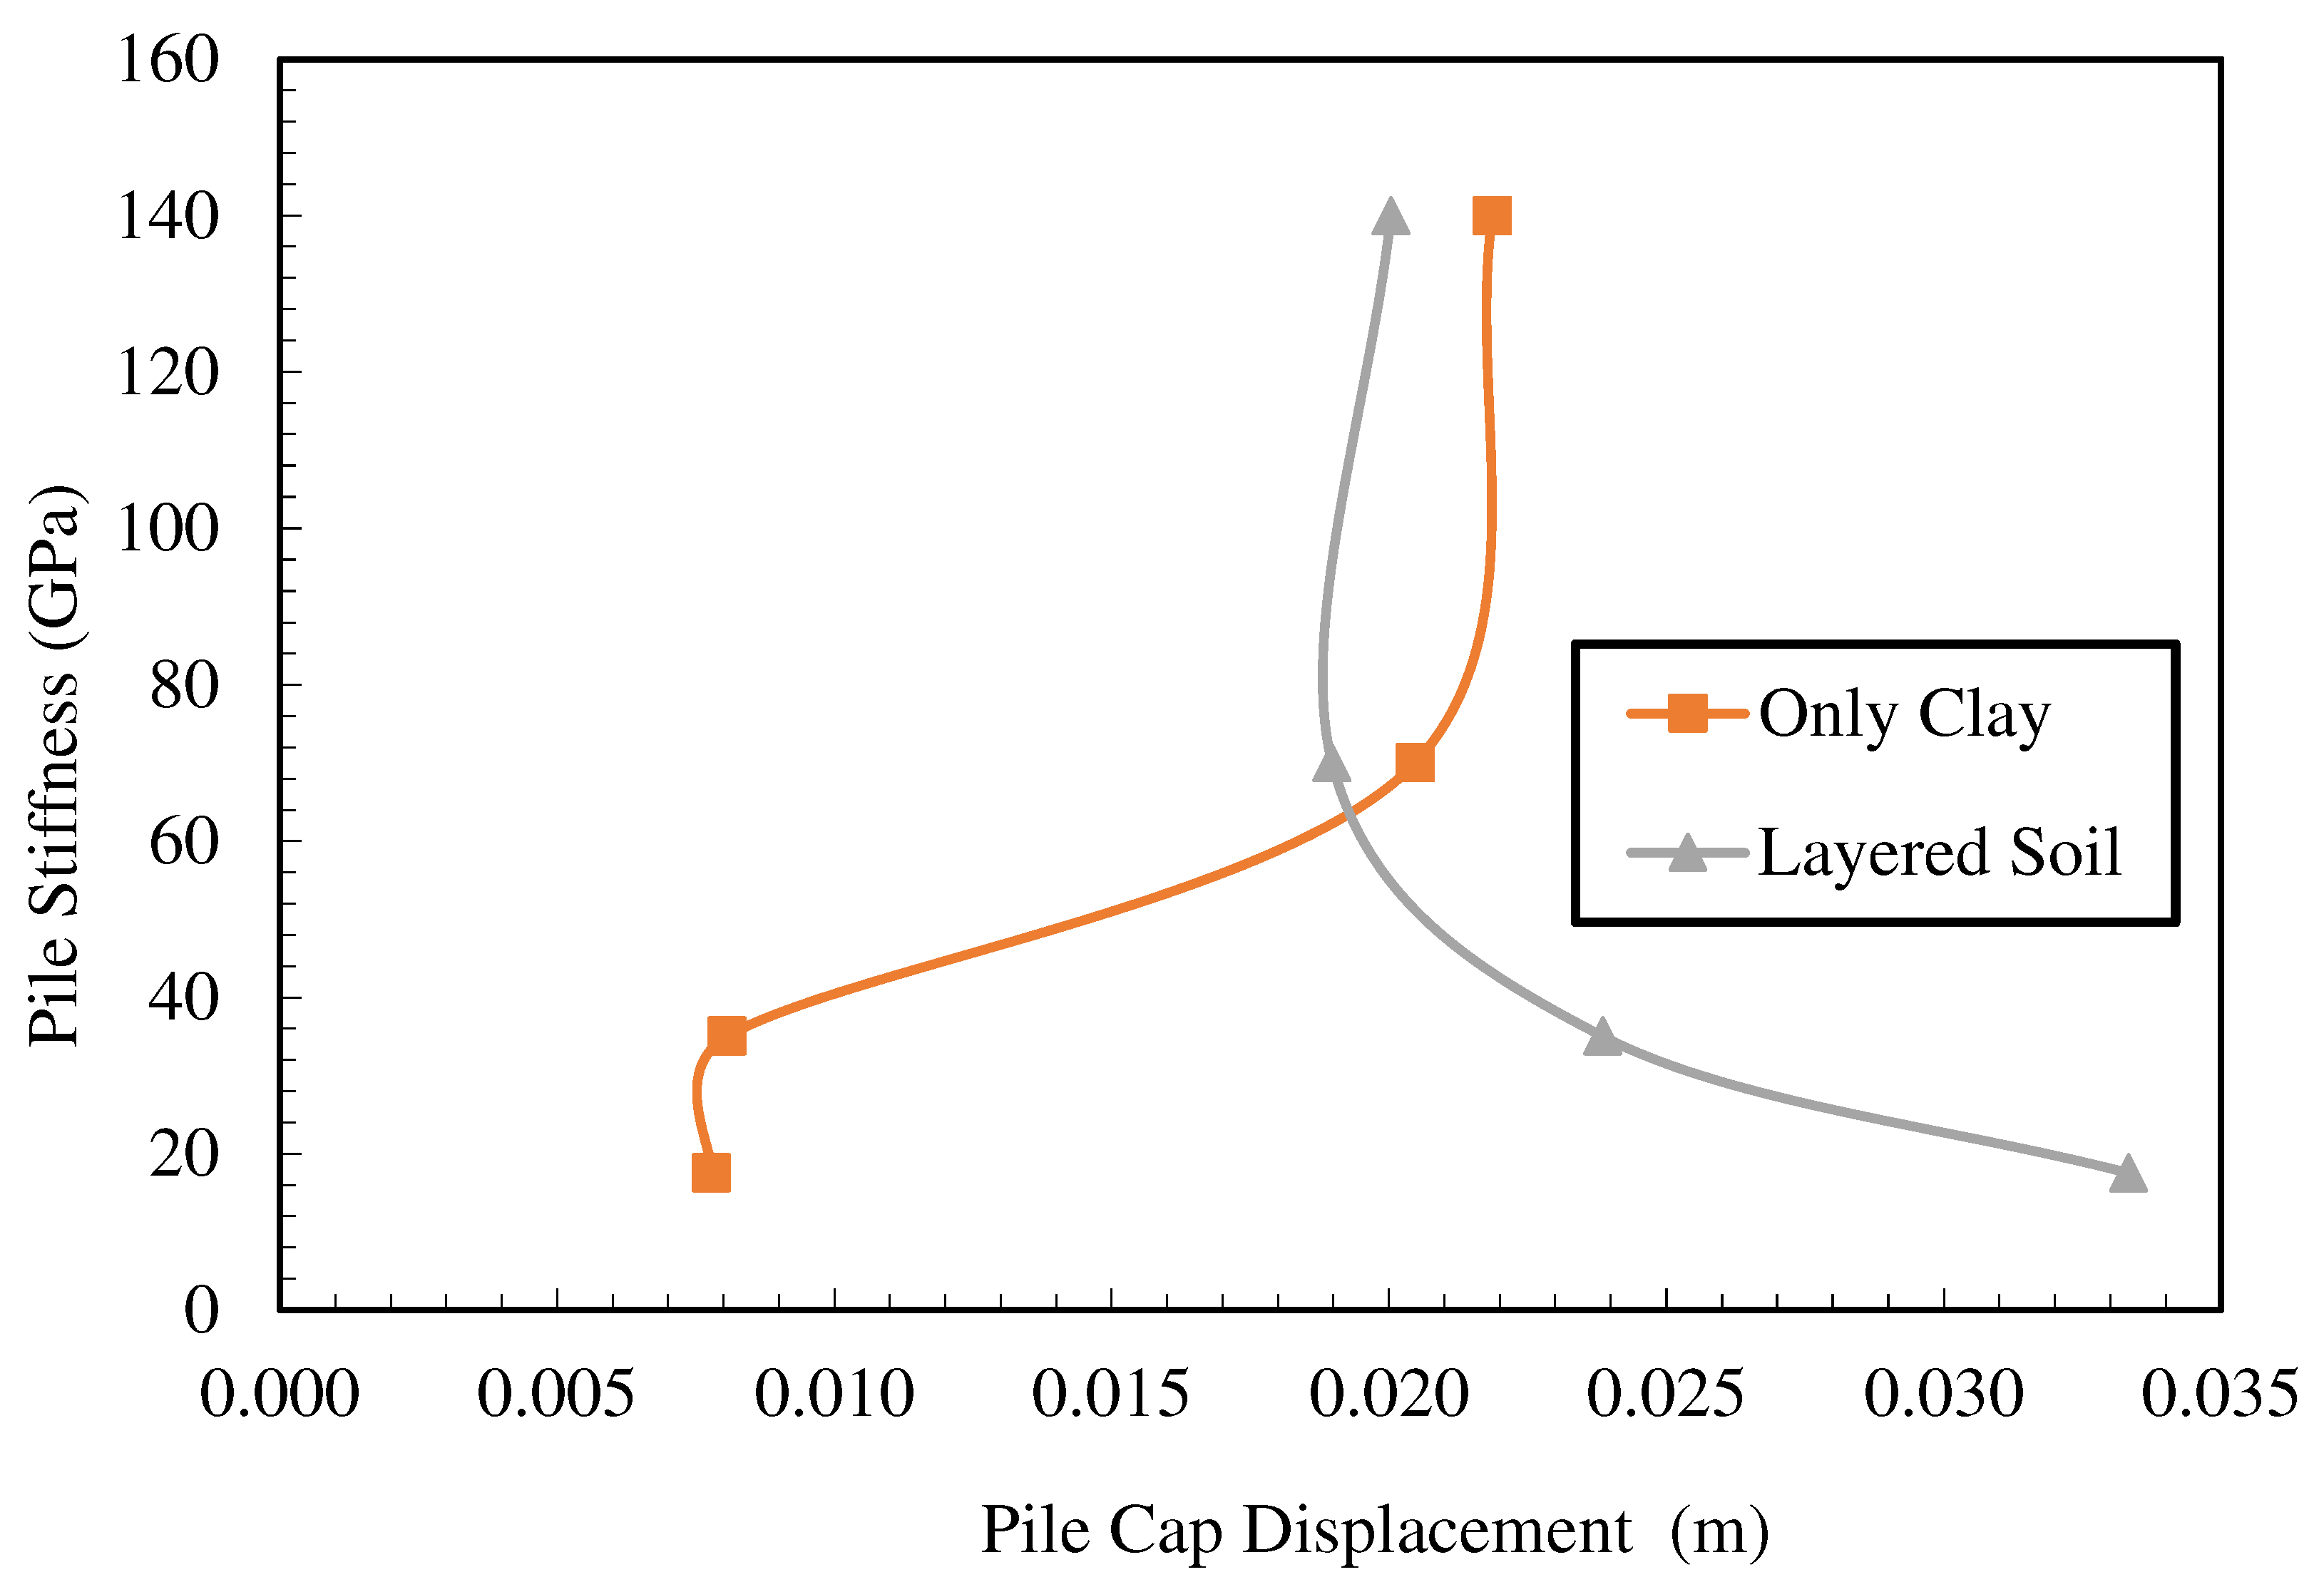
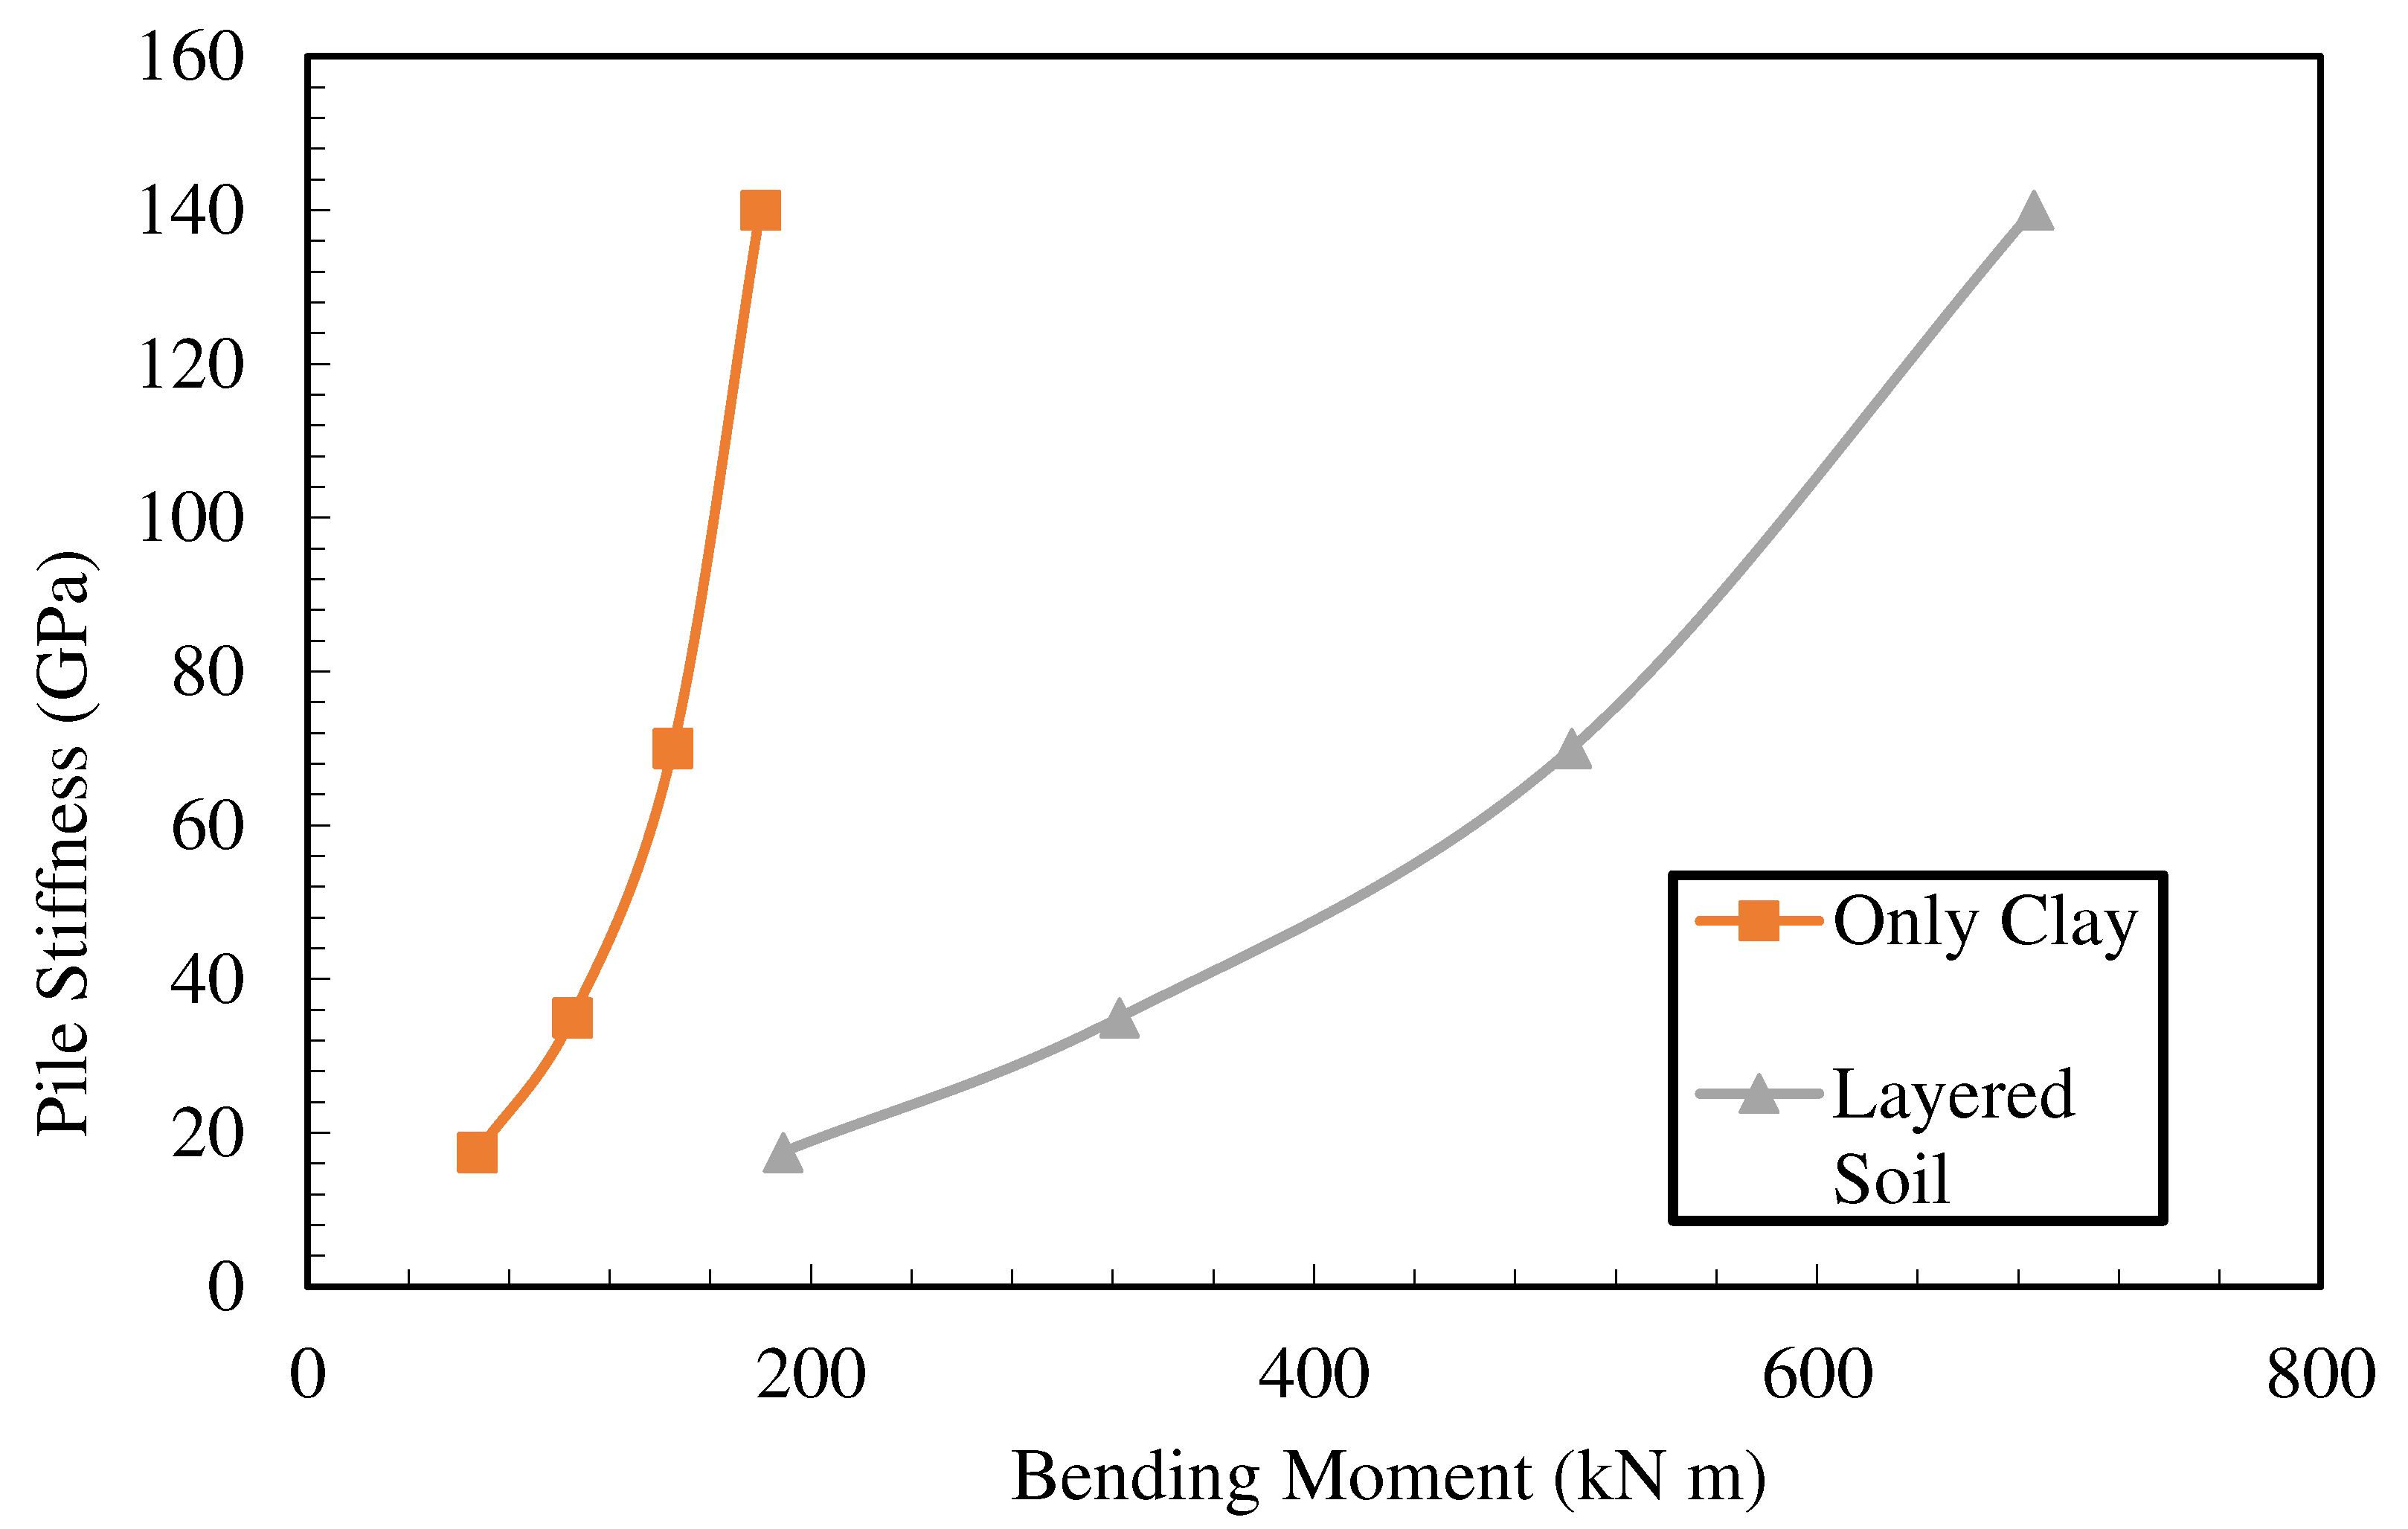
In order to investigate the effect of pile stiffness in the analyses, different elasticity modules were analyzed. For this purpose, the values of pile elasticity modulus were selected as 17.50, 35, 70, and 140 GPa. Analyzes were carried out in layered soil and only clay soil conditions. The pile displacement-pile stiffness curve obtained from the analysis is presented in
Figure 13, and the maximum moment-pile stiffness curve is presented in
Figure 14. When the results obtained were examined, it was seen that the deformation decreased with the increase of the elasticity modulus in the layered case and there was no change in deformation after the elasticity modulus reached the 70 GPa value used in the experiments. If the soil is only clay, it is seen that the deformation increases with the increase of the elasticity modulus and there is no change in deformation after reaching the value of 70 GPa. In this case, it is understood that the elasticity modulus is effective as it approaches the soil elasticity modulus, and the effect decreases after a certain stiffness. For both cases, moment values increase with the elasticity modulus and approach the asymptote.
4.4. Effect of Earthquake Magnitude
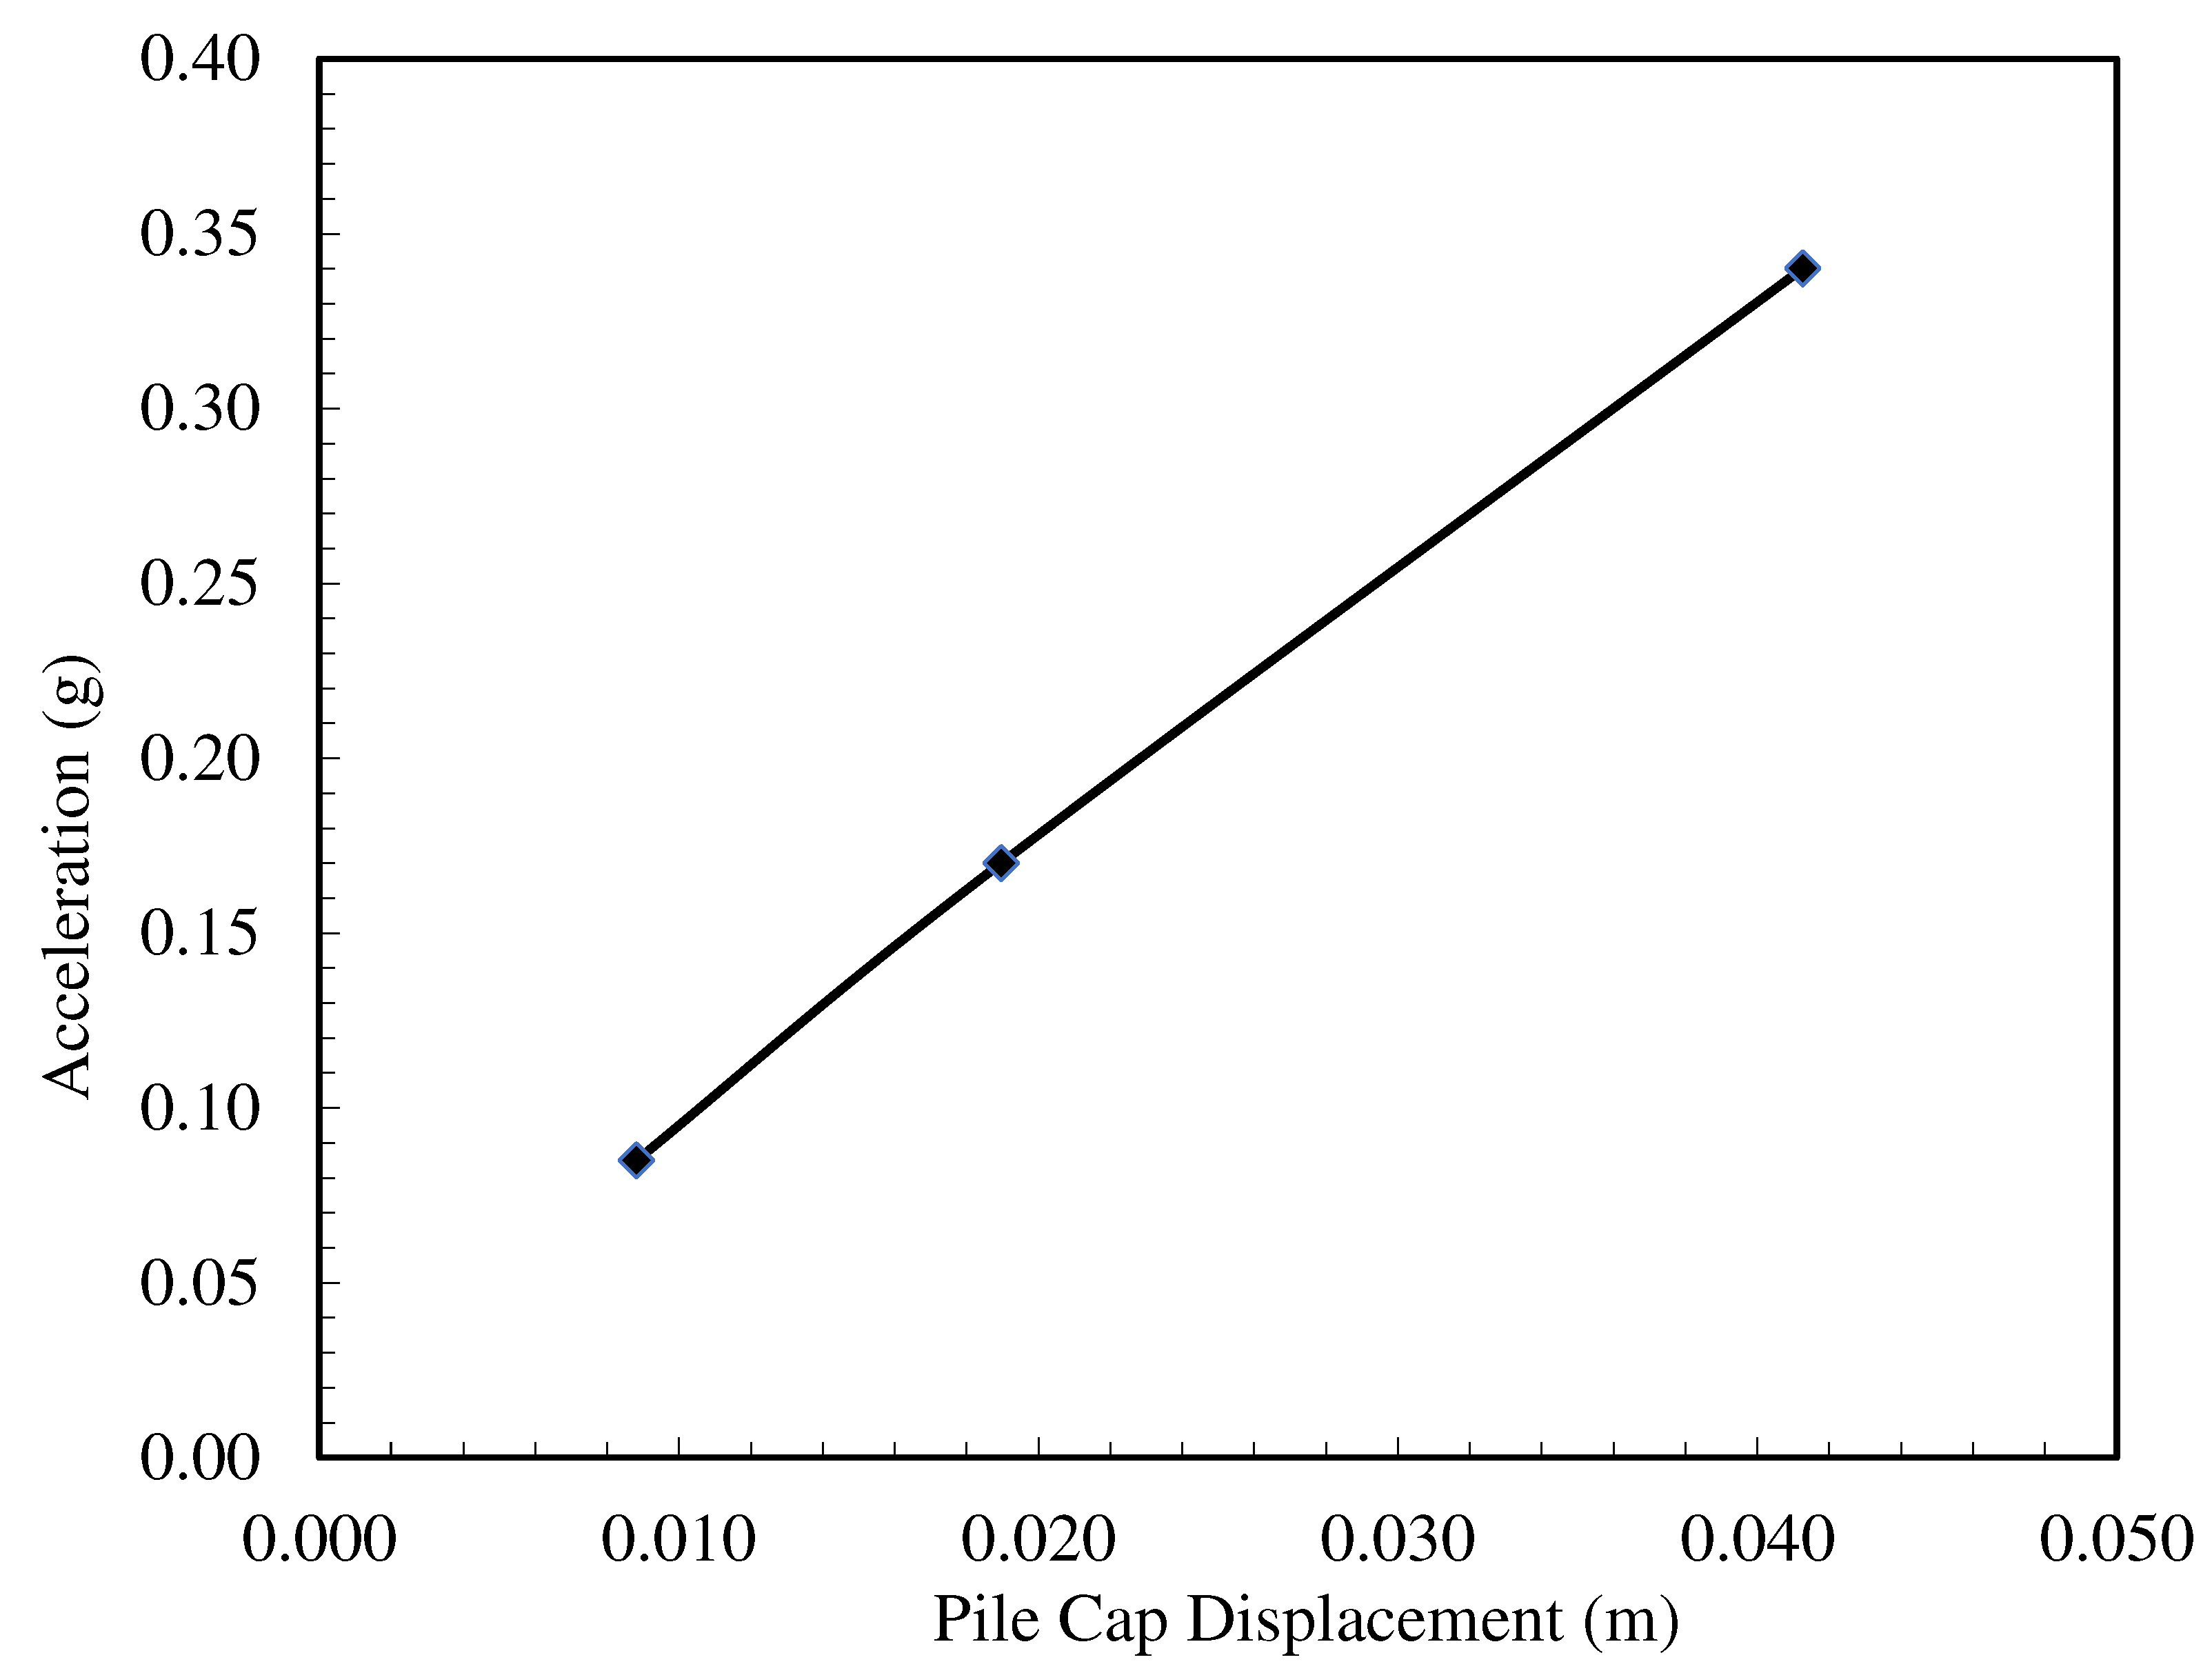
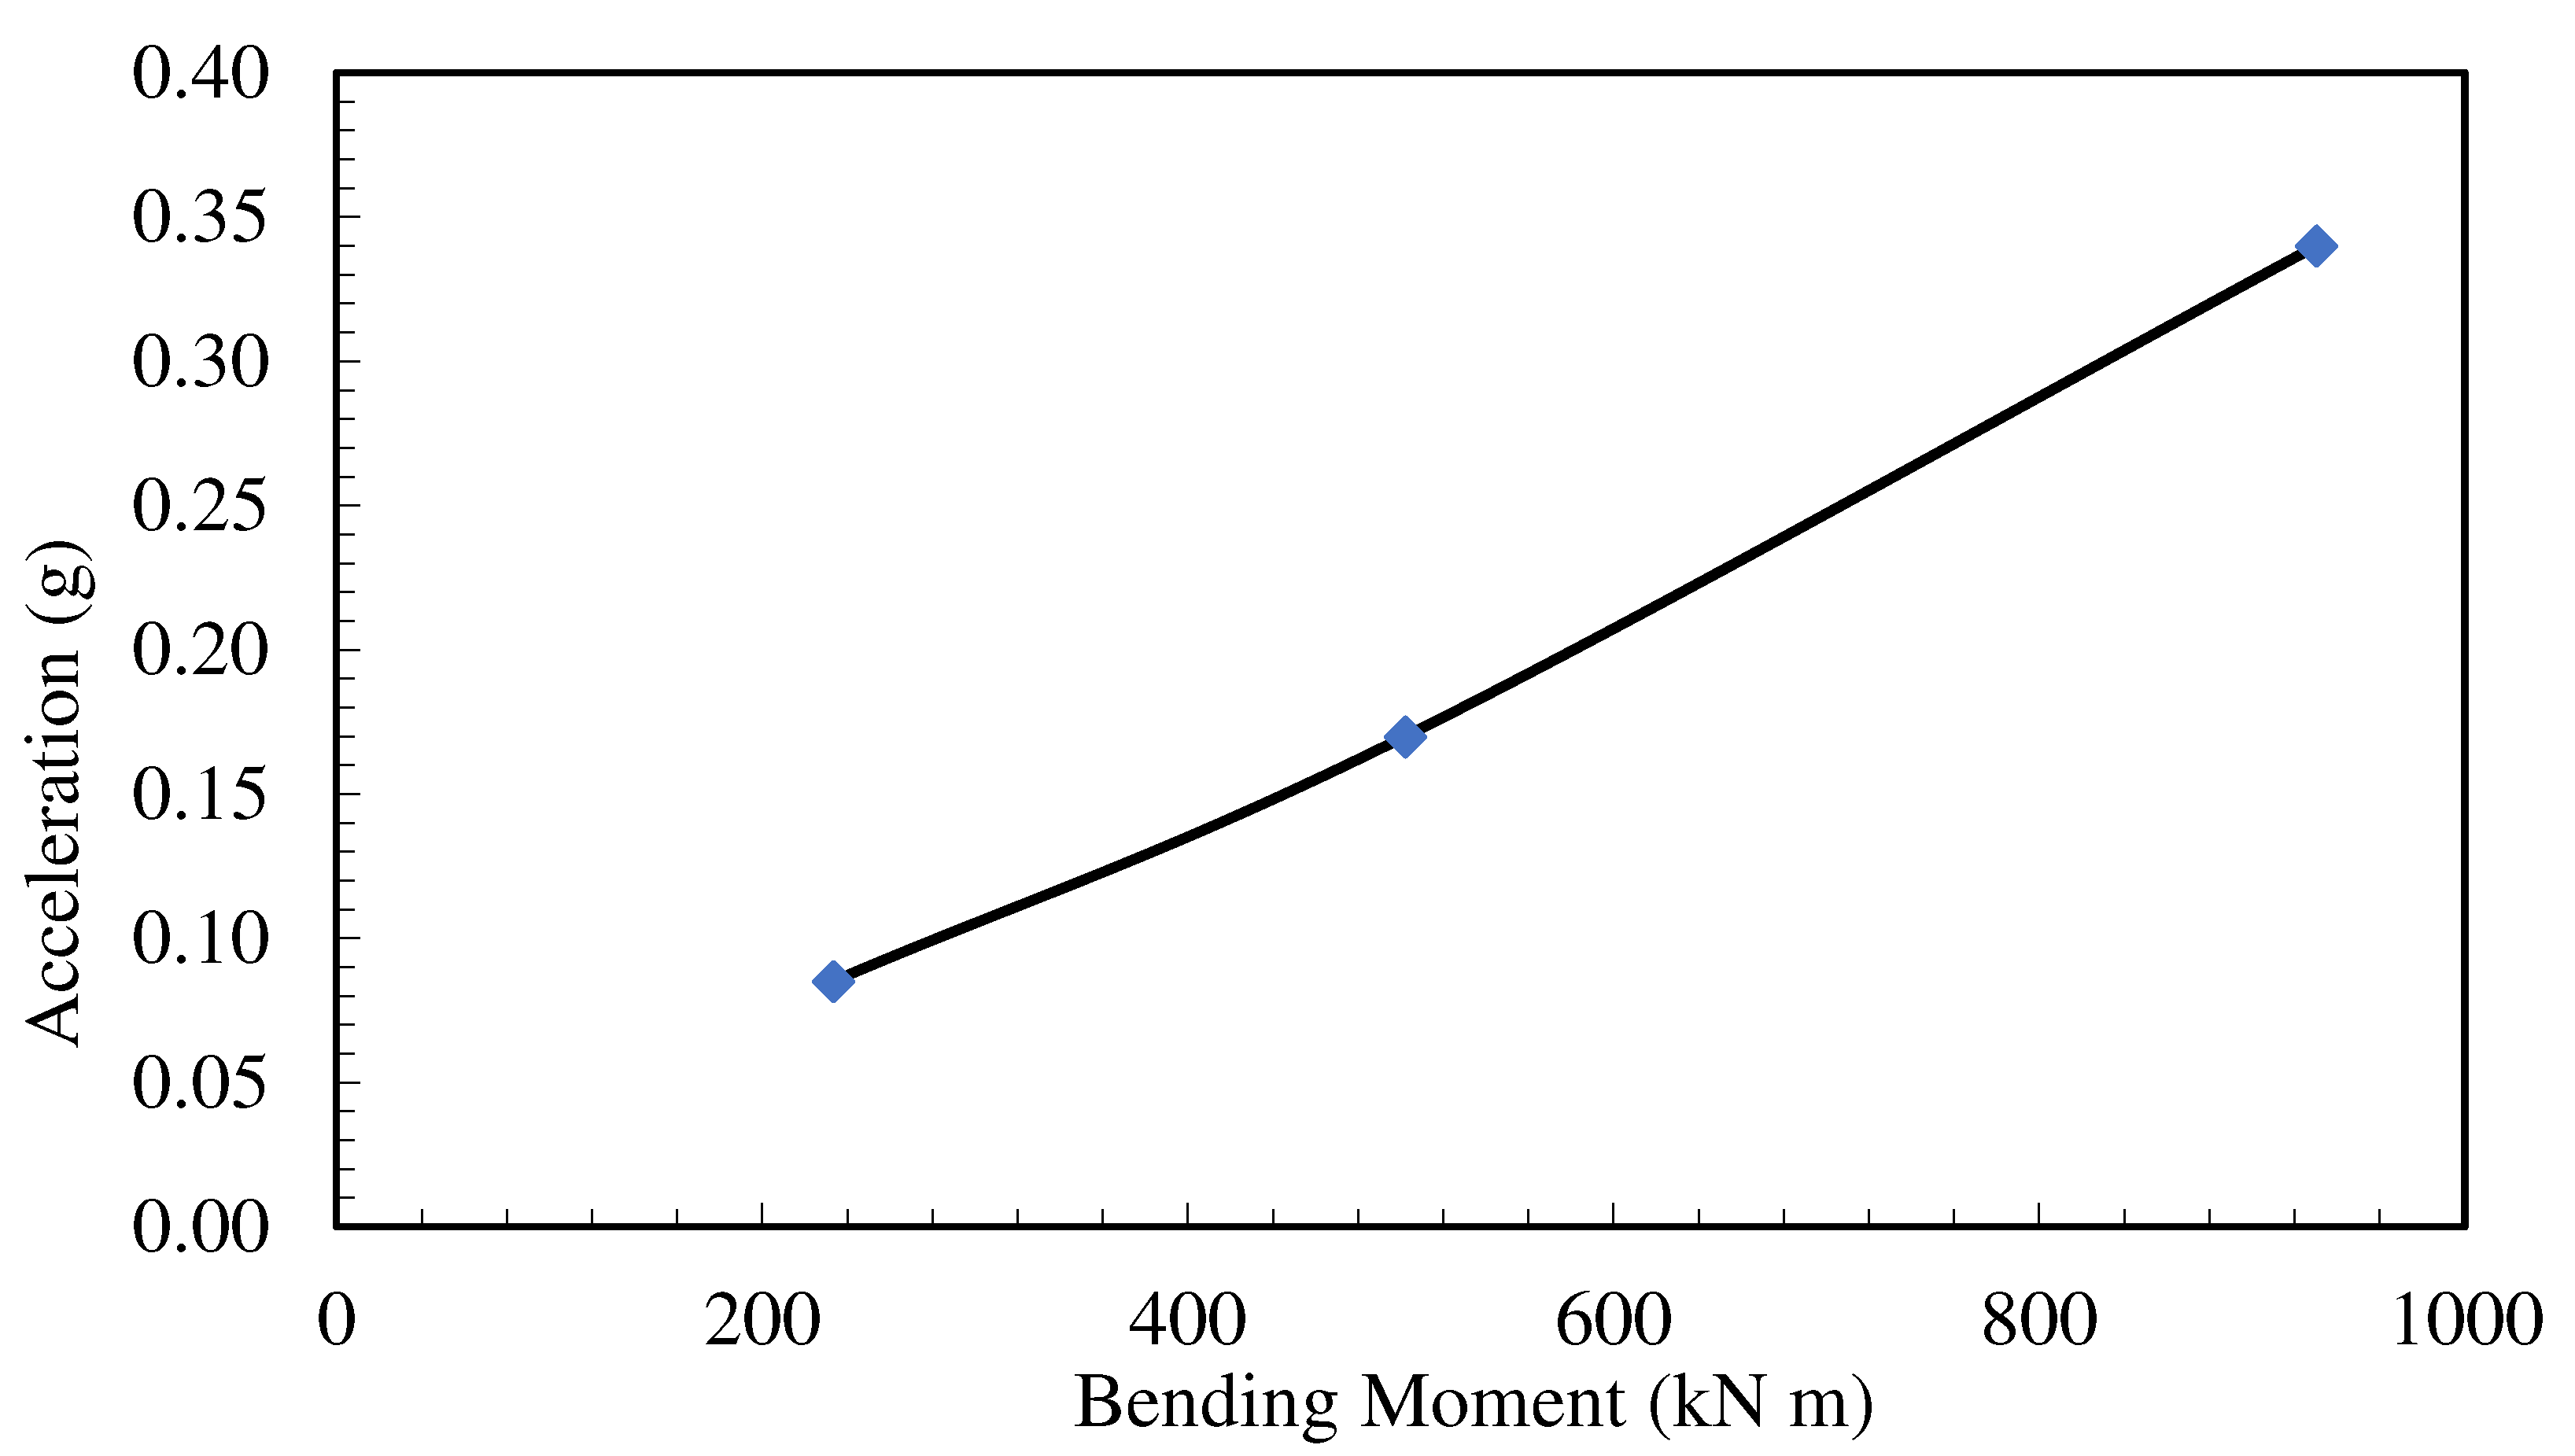
In order to investigate the effect of earthquake magnitude in the study, the earthquake record used in the experiments was enlarged by means of the Plaxis program, and analyses were carried out at earthquake magnitudes of 0.17g, 0.34g, and 0.51g. The analyses were carried out on the experimental model under stratified soil conditions. The pile cap displacement-acceleration and maximum moment-acceleration graphs obtained from the analysis are presented in
Figure 15 and
Figure 16, respectively. It is seen that displacement and moments increase linearly with increasing earthquake acceleration. The results obtained show that the earthquake magnitude is the most important parameter affecting the results.
5. Conclusions
In this study, the behavior of piles under dynamic loads was investigated under kinematic conditions. For this purpose, the results of an experimental study in the literature were verified with a finite element program, and the effects of parameters such as soil conditions, groundwater level, pile stiffness, and earthquake magnitude were investigated. The results obtained are summarized below.
The results obtained from the centrifuge experiment by Garala et al. (2022) were confirmed with numerical analysis results obtained using the finite element program in this study.
In the kinematic interaction analyses, with the increase in the weak soil layer thickness in layered soil conditions, although there was no significant increase in the displacement values at first, significant increases were observed in the pile cap displacement at the depth where the clay layer thickness reached approximately 75% of the total pile length. No significant increase in displacements was observed as the clay layer thickness reached larger values. This is due to the fact that the pile behaves more flexible under kinematic conditions, as the amount of sockets to the dense sand decreases.
In the analyses where the effect of the groundwater level is investigated, considering the stratified situation, it is seen that the displacement increases with the increase in the depth of the groundwater level, and there is no significant change in displacement after the water level reaches -6 m. This situation is caused by the groundwater level approaching the underlying sand layer, and the effect of the groundwater level remaining in the sand on deformation decreases.
In the only clay soil, it has been observed that as the groundwater level increases, the deformation first decreases, and then the deformation increases. The decrease in the groundwater level causes the upper layer to behave more rigidly and the deformation to decrease up to a certain level. As the water level decreases below the bottom elevation of the pile, the pile behaves flexible, and its deformation increases.
In the analyses examining the effect of pile stiffness, it was observed that deformation decreased as the elasticity modulus increased in the layered case, and there was no change in deformation after the elasticity modulus reached the 70 GPa value used in the experiments. If the soil is only clay, it is seen that the deformation increases with the increase of the elasticity modulus and there is no change in deformation after reaching the value of 70 GPa. In this case, it is understood that the elasticity modulus is effective as it approaches the soil elasticity modulus, and the effect decreases after a certain stiffness.
In the analysis examining the earthquake magnitude effect, it is seen that displacement and moments increase linearly with the increase of earthquake acceleration. The results obtained show that the earthquake magnitude is the most important parameter affecting the results.
Author Contributions
Conceptualization, project administration, supervision, writing—review & editing, and writing—original draft: S.B.; methodology, data curation, software, validation, and formal analysis: H.T. All authors have read and agreed to the published version of the manuscript.
Funding
This research received no external funding.
Institutional Review Board Statement
Not applicable.
Informed Consent Statement
Not applicable.
Data Availability Statement
Not applicable.
Acknowledgments
The authors would like to thank Thejesh Kumar Garala, Gopal S.P. Madabhushi, and Raffaele Di Laora for the experimental data supporting the article.
Conflicts of Interest
The author declare no conflict of interest.
References
- Mizuno, H. Pile damage during earthquakes in Japan. Dynamic response of pile foundations 1987, 53–78. [Google Scholar]
- Gazetas, G. , Tazoh, T., Shimizu, K., Fan, K. Seismic response of the pile foundation of Ohba-Ohashi bridge. 1993. [Google Scholar]
- Kaynia, A.M. Dynamic stiffness and seismic response of pile groups. Doctoral dissertation, Massachusetts Institute of technology, 1982. [Google Scholar]
- Fan, K.; Gazetas, G.; Kaynia, A.; Kausel, E.; Ahmad, S. Kinematic seismic response of single piles and pile groups. Journal of Geotechnical Engineering 1991, 117, 1860–1879. [Google Scholar] [CrossRef]
- Kavvads, M.; Gazetas, G. Kinematic seismic response and bending of free-head piles in layered soil. Geotechnique 1993, 43, 207–222. [Google Scholar] [CrossRef]
- Haigh, S.K. Effects of earthquake-induced liquefaction on pile foundations in sloping ground. Doctoral dissertation, University of Cambridge, 2002. [Google Scholar]
- Brandenberg, S.J.; Boulanger, R.W.; Kutter, B.L.; Chang, D. Behavior of pile foundations in laterally spreading ground during centrifuge tests. Journal of Geotechnical and Geoenvironmental Engineering 2005, 131, 1378–1391. [Google Scholar] [CrossRef]
- Castelli, F.; Maugeri, M.; Mylonakis, G. Numerical analysis of kinematic soil—pile interaction. In AIP Conference Proceedings. AIP Conference Proceedings; American Institute of Physics, 2008; 1020, pp. 618–625. [Google Scholar]
- Madabhushi, G.; Haigh, S.; Knappett, J. Design of pile foundations in liquefiable soils. 2009, World Scientific.
- Haskell, J.J.M. Guidance for the design of pile groups in laterally spreading soil. Doctoral dissertation, University of Cambridge, 2014. [Google Scholar]
- Luo, X.; Li, S.; Xu, H. Results of real-time kinematic positioning based on real GPS L5 data. IEEE Geoscience and Remote Sensing Letters 2016, 13, 1193–1197. [Google Scholar] [CrossRef]
- Mallick, M.; Mandal, K.K.; Sahu, R.B. Effects of axial loading on dynamic response of laterally loaded single piles in liquefiable layered soil of Kolkata city considering nonlinearity of soil. SN Applied Sciences 2022, 4, 297. [Google Scholar] [CrossRef]
- Garala, T.K.; Madabhushi, G.S.; Di Laora, R. Experimental investigation of kinematic pile bending in layered soils using dynamic centrifuge modelling. Géotechnique 2022, 72, 146–161. [Google Scholar] [CrossRef]
- Lau, B.H. Cyclic behaviour of monopile foundations for offshore wind turbines in clay 2015. Doctoral dissertation, University of Cambridge.
-
ASTM D854; Standard test methods for specific gravity of soil solids by water pycnometer. ASTM International: West Conshohocken, PA, 2014.
-
ASTM D4254; Standard test methods for minimum index density and unit weight of soils and calculation of relative density. ASTM International: West Conshohocken, PA, 2016.
-
ASTM D4253; Standard test methods for maximum index density and unit weight of soils using a vibratory table. ASTM International: West Conshohocken, PA, 2016.
-
ASTM D6913; Standard test methods for particle-size distribution (gradation) of soils using sieve analysis. ASTM International: ASTM International, 2017.
-
ASTM D7181; Standard method for consolidated drained triaxial compression test for soils. ASTM International: West Conshohocken, PA, 2011.
- Hardin, B.O.; Drnevich, V.P. Shear modulus and damping in soils: design equations and curves. Journal of the Soil mechanics and Foundations Division 1972, 98, 667–692. [Google Scholar] [CrossRef]
- Snyder, J.L. Full scale test lateral load tests of a 3x5 pile group in soft clays and silts. M.Sc. Thesis, 2004, Brigham Young University.
Figure 1.
Schematic view of experimental set-up (Garala et al., 2022).
Figure 1.
Schematic view of experimental set-up (Garala et al., 2022).
Figure 2.
Numerical model of the experiment of Garala et al (2022).
Figure 2.
Numerical model of the experiment of Garala et al (2022).
Figure 3.
Acceleration-Time curves for 0.085g.
Figure 3.
Acceleration-Time curves for 0.085g.
Figure 4.
Acceleration-Time curves for 0.17g.
Figure 4.
Acceleration-Time curves for 0.17g.
Figure 5.
Acceleration-Time curves for 0.51g.
Figure 5.
Acceleration-Time curves for 0.51g.
Figure 6.
Number of element Pil Cap-Displacement curves.
Figure 6.
Number of element Pil Cap-Displacement curves.
Figure 7.
Numerical and experimental comparison of peak accelerations.
Figure 7.
Numerical and experimental comparison of peak accelerations.
Figure 8.
Numerical and experimental comparison of maximum moments.
Figure 8.
Numerical and experimental comparison of maximum moments.
Figure 9.
Pile cap displacement-Clay layer thickness curves.
Figure 9.
Pile cap displacement-Clay layer thickness curves.
Figure 10.
Maximum moment-Clay layer thickness curves.
Figure 10.
Maximum moment-Clay layer thickness curves.
Figure 11.
Pile cap displacement-Groundwater level curves.
Figure 11.
Pile cap displacement-Groundwater level curves.
Figure 12.
Maximum moment-Groundwater level curves.
Figure 12.
Maximum moment-Groundwater level curves.
Figure 13.
Pile cap displacement-Pile stiffness curves.
Figure 13.
Pile cap displacement-Pile stiffness curves.
Figure 14.
Maximum moment-Pile stiffness curves.
Figure 14.
Maximum moment-Pile stiffness curves.
Figure 15.
Pile cap displacement- Acceleration curves.
Figure 15.
Pile cap displacement- Acceleration curves.
Figure 16.
Maximum moment-Acceleration curves.
Figure 16.
Maximum moment-Acceleration curves.
Table 1.
Parameters of sand soil used in the experiments (Garala et al., 2022).
Table 1.
Parameters of sand soil used in the experiments (Garala et al., 2022).
| Property |
Standard |
Value |
| Specific gravity, Gs |
ASTM D854 (2014) |
2.65 |
| Maximum void ratio, emax |
ASTM D4254 (2016) |
0.767 |
| Minimum void ratio, emin |
ASTM D4253 (2016) |
0.49 |
| Effective particle size, D10 (mm) |
ASTM D6913 (2017) |
0.68 |
| Average particle size, D50 (mm) |
ASTM D6913 (2017) |
0.80 |
| Coefficient of uniformity, Cu |
ASTM D6913 (2017) |
1.221 |
| Coefficient of curvature, Cc |
ASTM D6913 (2017) |
0.97 |
| Relative density, Dr (%) |
ASTM D4254 (2016) |
85 |
| Peak friction angle, ϕp (˚) |
ASTM D7181 (2011) |
37.2 |
Table 2.
Properties of speswhite kaolin clay (Lau, 2015).
Table 2.
Properties of speswhite kaolin clay (Lau, 2015).
| Property |
Value |
| Plastic limit, PL (%) |
30 |
| Liquid limit, LL (%) |
63 |
| Plasticity index, PI (%) |
33 |
| Specific gravity, Gs |
2.60 |
| Slope of critical state line (CSL) in q-pꞌ plane |
0.90 |
| Slope of an unload-reload line, (κ) |
0.039 |
| Intercept of CSL at pꞌ=1 kPa (Γ) |
3.31 |
| Slope of normal consolidation line (λ) |
0.22 |
Table 3.
The properties of pile and pile caps for numerical analysis.
Table 3.
The properties of pile and pile caps for numerical analysis.
| Parameter |
Unit |
Pile cap |
Pile |
| Material type |
- |
Elastic |
Elastic |
| EA1
|
kN/m |
9.90E+05 |
9.30E+06 |
| EA2
|
kN/m |
9.90E+05 |
9.930E+06 |
| EI |
kN/m2/m |
7425 |
3.439E+05 |
| d |
m |
0.3 |
0.6661 |
| w |
kN/m/m |
3.5 |
2.8 |
| ν |
- |
0.37 |
0.3 |
| Rayleigh α |
- |
0.2827 |
0.2827 |
| Rayleigh β |
- |
2.39E-03 |
2.39E-03 |
Table 4.
Hardening soil small parameters for numerical analysis.
Table 4.
Hardening soil small parameters for numerical analysis.
| Parameters |
Unit |
Speswhite Kaolin Clay |
Leighton Buzzard Sand |
LE |
| Material type |
- |
HS Small |
HS Small |
Linear Elastic |
| Drainage type |
- |
Undrained |
Drained |
Drained |
| γunsat, Unsaturated unit weight |
kN/m3
|
16.2 |
18.4 |
24.00 |
| γsat, Saturated unit weight |
kN/m3
|
16.4 |
20.36 |
24.00 |
| einit, initial void ratio |
- |
0.50 |
0.50 |
0.50 |
| Rayleigh α |
- |
0.09425 |
0.09425 |
0.00 |
| Rayleigh, β |
- |
7.958E-04 |
7.96E-04 |
0.00 |
| ν', Poisson’s ratio (lineer elastic) |
- |
- |
- |
0.20 |
| G’, Shear modulus |
kN/m2
|
- |
- |
1.04E+07 |
| E’, Elasticity modulus |
kN/m2
|
- |
- |
2.50E+07 |
| Vs, S wave velocity |
m/s |
- |
- |
2063.00 |
| Vp, P wave velocity |
m/s |
- |
- |
3370.00 |
| E50ref, Secant stiffness |
kN/m2
|
1500 |
5.10E+04 |
|
| Eoedref, Tangent stiffness |
kN/m2
|
750 |
5.10E+04 |
|
| Eurref, Unloading/reloading stiffness |
kN/m2
|
8000 |
1.5E+05 |
|
| m, Rate of stress-dependency |
- |
0.8 |
0.4344 |
|
| c', cohesion |
kN/m2
|
1 |
0.00 |
|
| Ø, Internal friction angle |
° |
21 |
37.20 |
|
| Ψ, dilatation angle |
° |
0 |
8.625 |
|
| γ0.7, Shear strain at 0.7G0
|
- |
2.00E-04 |
1.15E-04 |
|
| G0ref, small strain stiffness |
kN/m2
|
1.398E+04 |
1.178E+05 |
|
| ν'ur, Poisson’s ratio |
- |
0.20 |
0.20 |
|
| Pref, Reference stress |
kN/m2
|
100.00 |
100.00 |
|
| K0nc, Stress ratio |
- |
0.64 |
0.3954 |
|
| Rf, Failure ratio |
- |
0.90 |
0.90 |
|
| OCR, Overconsolidation ratio |
- |
1.00 |
1.00 |
|
| Rinter, interface factor |
- |
0.50 |
0.70 |
|
Table 5.
Number of element-pile cap displacement values.
Table 5.
Number of element-pile cap displacement values.
| Mesh Type |
Number of Element |
Pile Cap Displacement (m) |
| Coarse |
882 |
0.021 |
| Medium |
1093 |
0.022 |
| Fine |
1687 |
0.018 |
| Very Fine |
2207 |
0.018 |
|
Disclaimer/Publisher’s Note: The statements, opinions and data contained in all publications are solely those of the individual author(s) and contributor(s) and not of MDPI and/or the editor(s). MDPI and/or the editor(s) disclaim responsibility for any injury to people or property resulting from any ideas, methods, instructions or products referred to in the content. |
© 2023 by the authors. Licensee MDPI, Basel, Switzerland. This article is an open access article distributed under the terms and conditions of the Creative Commons Attribution (CC BY) license (http://creativecommons.org/licenses/by/4.0/).
