1. Introduction
Wetlands provide heterogeneous ecological niches for unique soil arthropods assemblages; being mesofauna morphotypes the most abundant and diverse (Batzer et al., 2020). Among them, Mites (Acari) and springtails (Collembola), are micro-arthropods that range in size from 0.1 to 2 mm. They are present in different substrates with most of their assemblages concentrated in hot spots zones or resource patches [
1] within the litter system [
2,
3] comprised of loose litter layer and upper 1-5 cm of soil. Mites and springtails have a significant impact on the decomposition processes and nutrient mobilization as they are plant litter transformers via a) fragmentation/comminution, b) ingestion of plant debris, and c) feces deposition for further mineralization by soil microflora (fungi and bacteria). They also foster the growth and dispersal of microbial populations and interact at different trophic levels through the litter decomposition process [
4,
5,
6,
7].
Soil mites mainly occur in three taxa: Oribatida (fungivores and detritivores), Mesostigmata (free-living soil predators) and Prostigmata (predators and fungal feeders). Springtails (fungivores and detritivores) are grouped in two: Arthropleona and Symphypleona [
8,
9]. The distribution patterns and interactions of these organisms occur at different spatiotemporal dynamics [
1,
4,
6,
7], regulated by the combined effects of scale-dependent variables: climate (temperature, precipitation), edaphic properties (porosity, structure, nutrients, humidity, pH, salinity), vegetation (resource quality and quantity), microtopography and species inter and intra specific interactions [
7]. Soil higher temperatures and lower humidity may lead to the reduction of Mesostigmata mites’ population densities [
10]. Prostigmata mites dominate in soils with low nutrient content and low humidity, while Oribatid mites and Springtails inhabit in nutrient rich humid environments [
4,
11,
12]. Direct and indirect plant effects determine soil food web structure and mesofauna assemblage, as is the case of the legume
Lotus corniculatus and the non-leguminous forb Plantago lanceolata [
13]. Springtails distribution is correlated with soil pore-size, relative humidity, and food availability [
14]. Trophic cascade effect is seen as microtopography affects the soil environment and the diversity and composition of soil fungal communities [
15], which in turn may influence the food resources and habitat quality for Springtails and Oribatids [
10].
In coastal wetlands, the spatiotemporal variations in the abundance of soil mesofauna are also influenced by drying/wetting cycles or hydro-patterns effects on soil bio- physicochemical conditions [
16]. Wetlands wetting cycles include waterlogging or flooding time, frequency, duration, rate of water rises, and depth [
17]. It is modified by different water sources that enter via in-situ precipitation, freshwater inputs, and seawater flows [
18]. The hydrological regime determines the degree of salinity in the wetland substrate and influences the spatiotemporal vegetation cover, litter quality and quantity, and mesofauna composition [
18,
19]. In The Netherlands floodplains groundwater levels influence collembolans distribution with a shift in community composition along elevation gradients from regularly inundated areas to dry, seldom flooded zones [
20,
21]. A laboratory study that investigated the effect of salinity on soil species of Acari (mites), and Collembola (springtails), found that their reproduction cycles were differentially affected by increases in salinity. Mites were the least sensitive maintaining its reproduction cycle, while springtails reproduction significantly decreased [
22]. In peatlands from Canada, China, Minnesota, and northern England, hydro patterns variations induced spatial and temporal bio-physicochemical factors fluctuations that influenced Acari and Collembola diversity and abundance [
23].
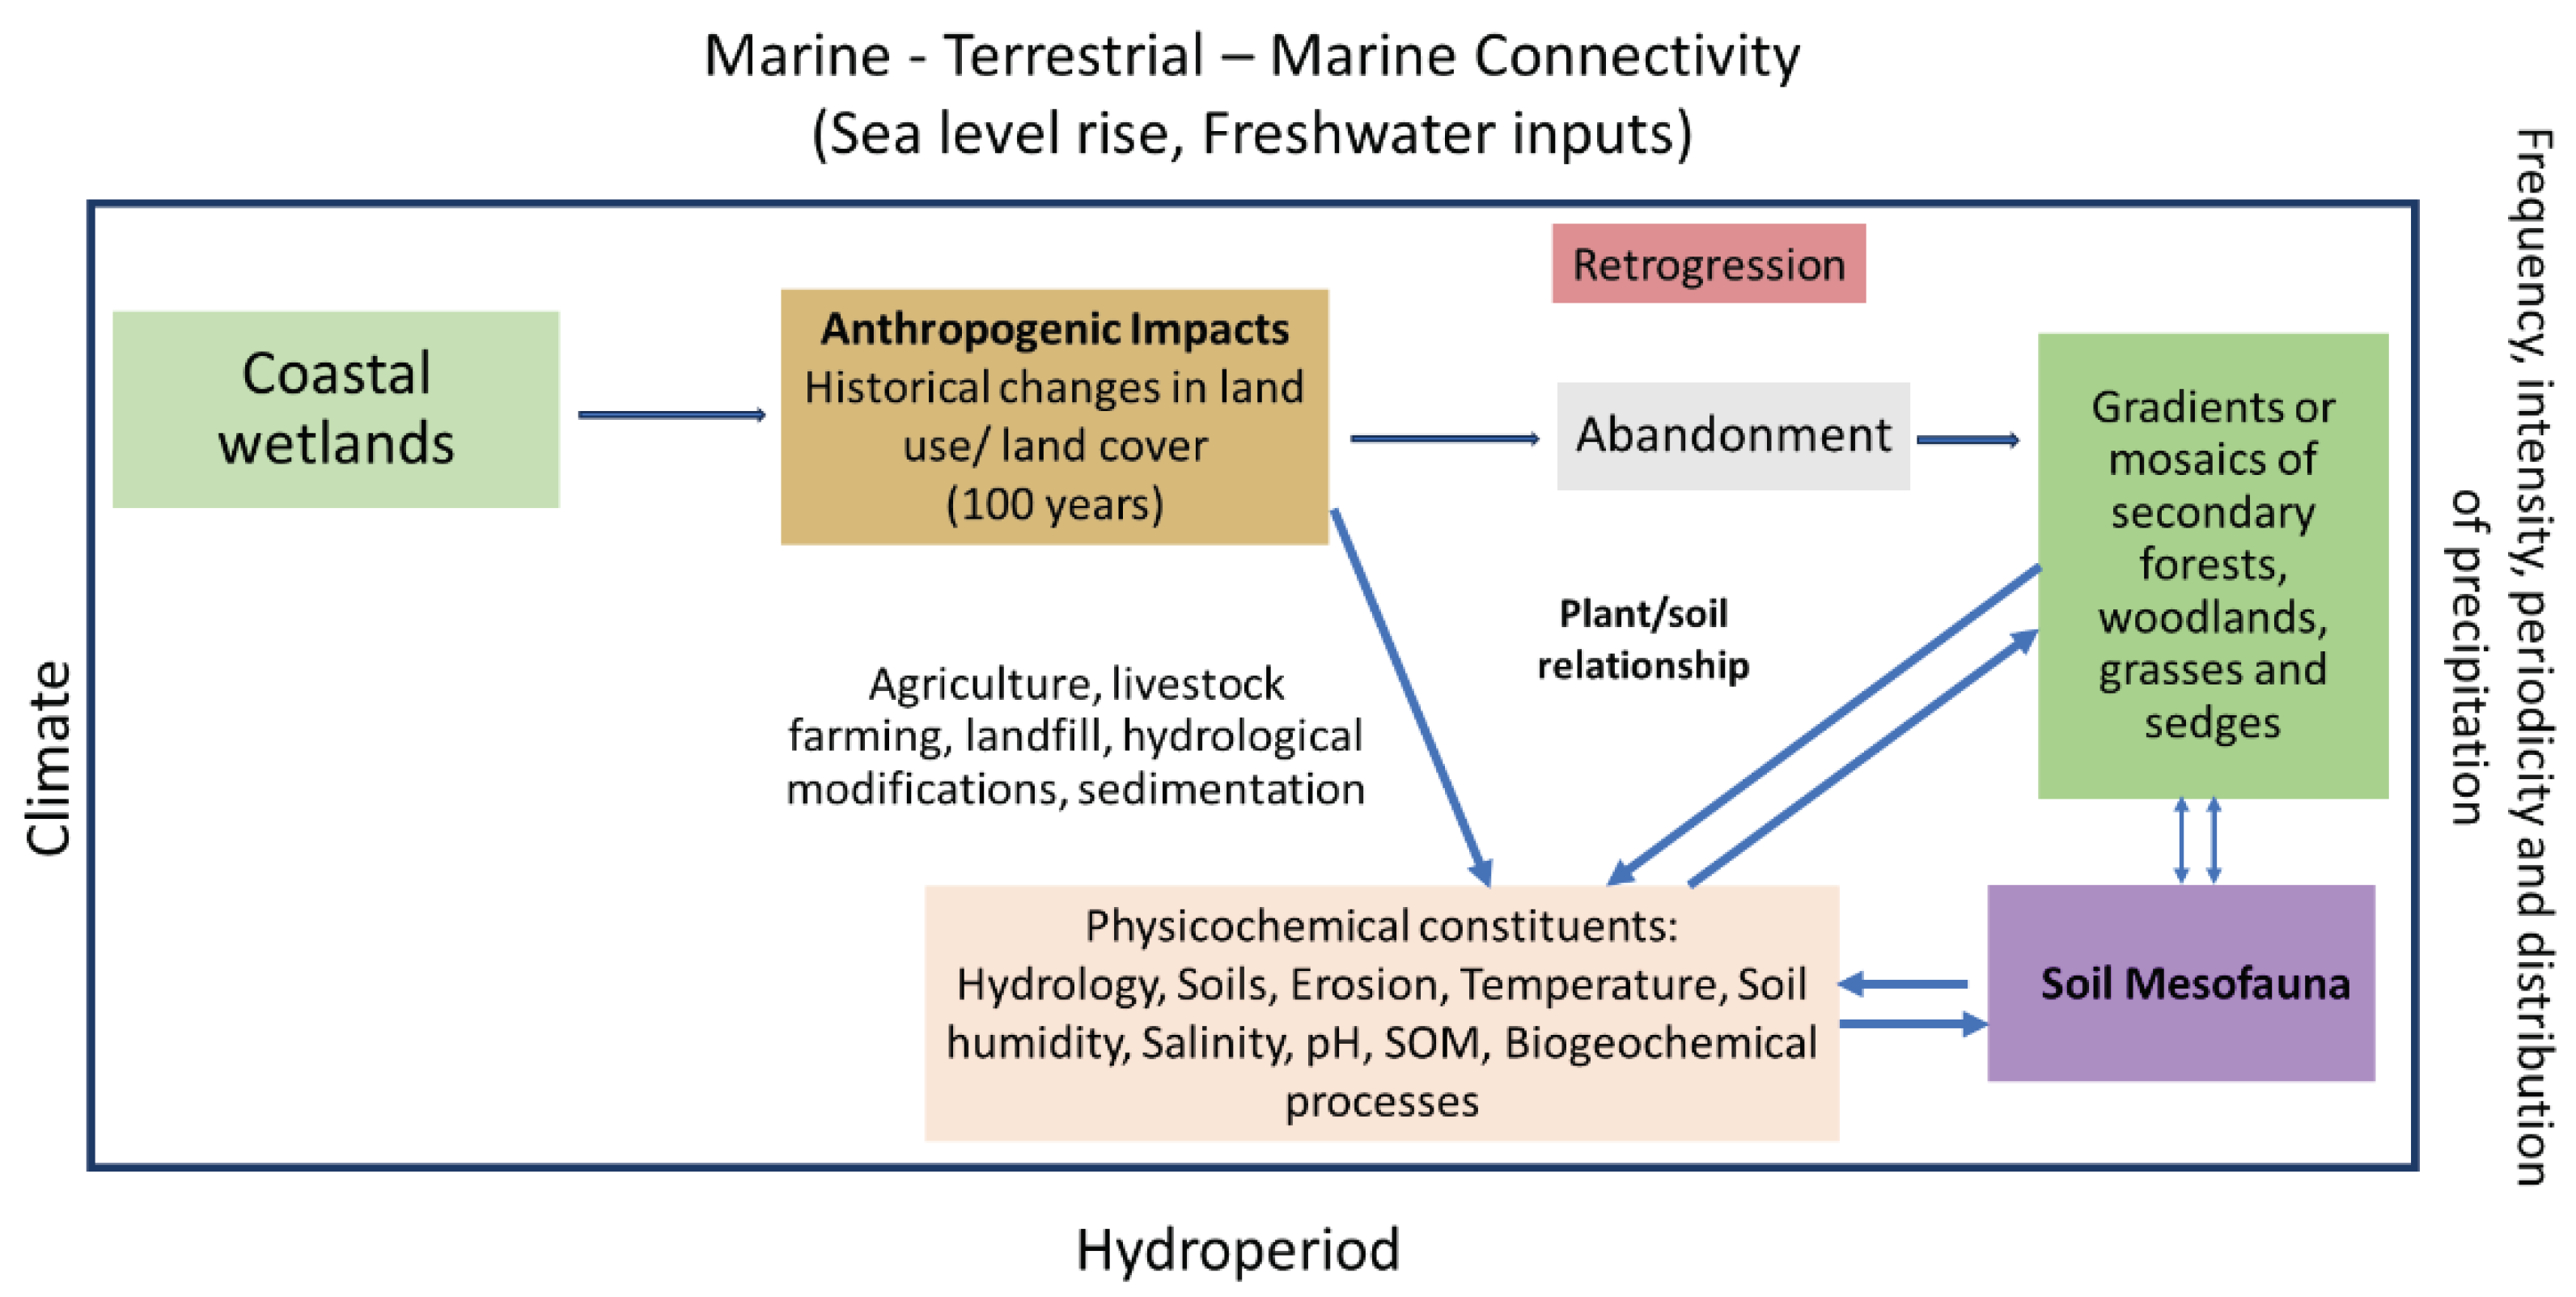
Although mesofauna communities play an essential role in wetlands biological processes, there is still a gap in knowledge about how wetlands spatio-temporal dynamics influence mesofauna diversity, especially in coastal wetlands. More research is needed, especially in the Caribbean, to understand wetland marine-terrestrial-marine connectivity, bio-physicochemical components, future climate change scenarios and their effects on mesofauna assemblages. Because Caribbean coastal wetlands were anthropogenically modified since colonial times, a mosaic of physicochemical conditions, habitats, and vegetation cover characterizes these ecosystems; with undergoing global and regional climate variability, sea-level rise, land use and land cover changes acting as additional stressors (
Figure 1).
The combined effect between these anthropogenic stressors and the predominant wetland mosaic environment influences the hydro-pattern regime, bio-physicochemical components, and soil mesofauna diversity, abundance, and functional relationships among taxa [
24,
25]. For example, sea level rise impacts coastal soil processes and modifies ecosystems' net primary production due to variations in salinity, which have direct and indirect effects on soil mesofauna diversity and function [
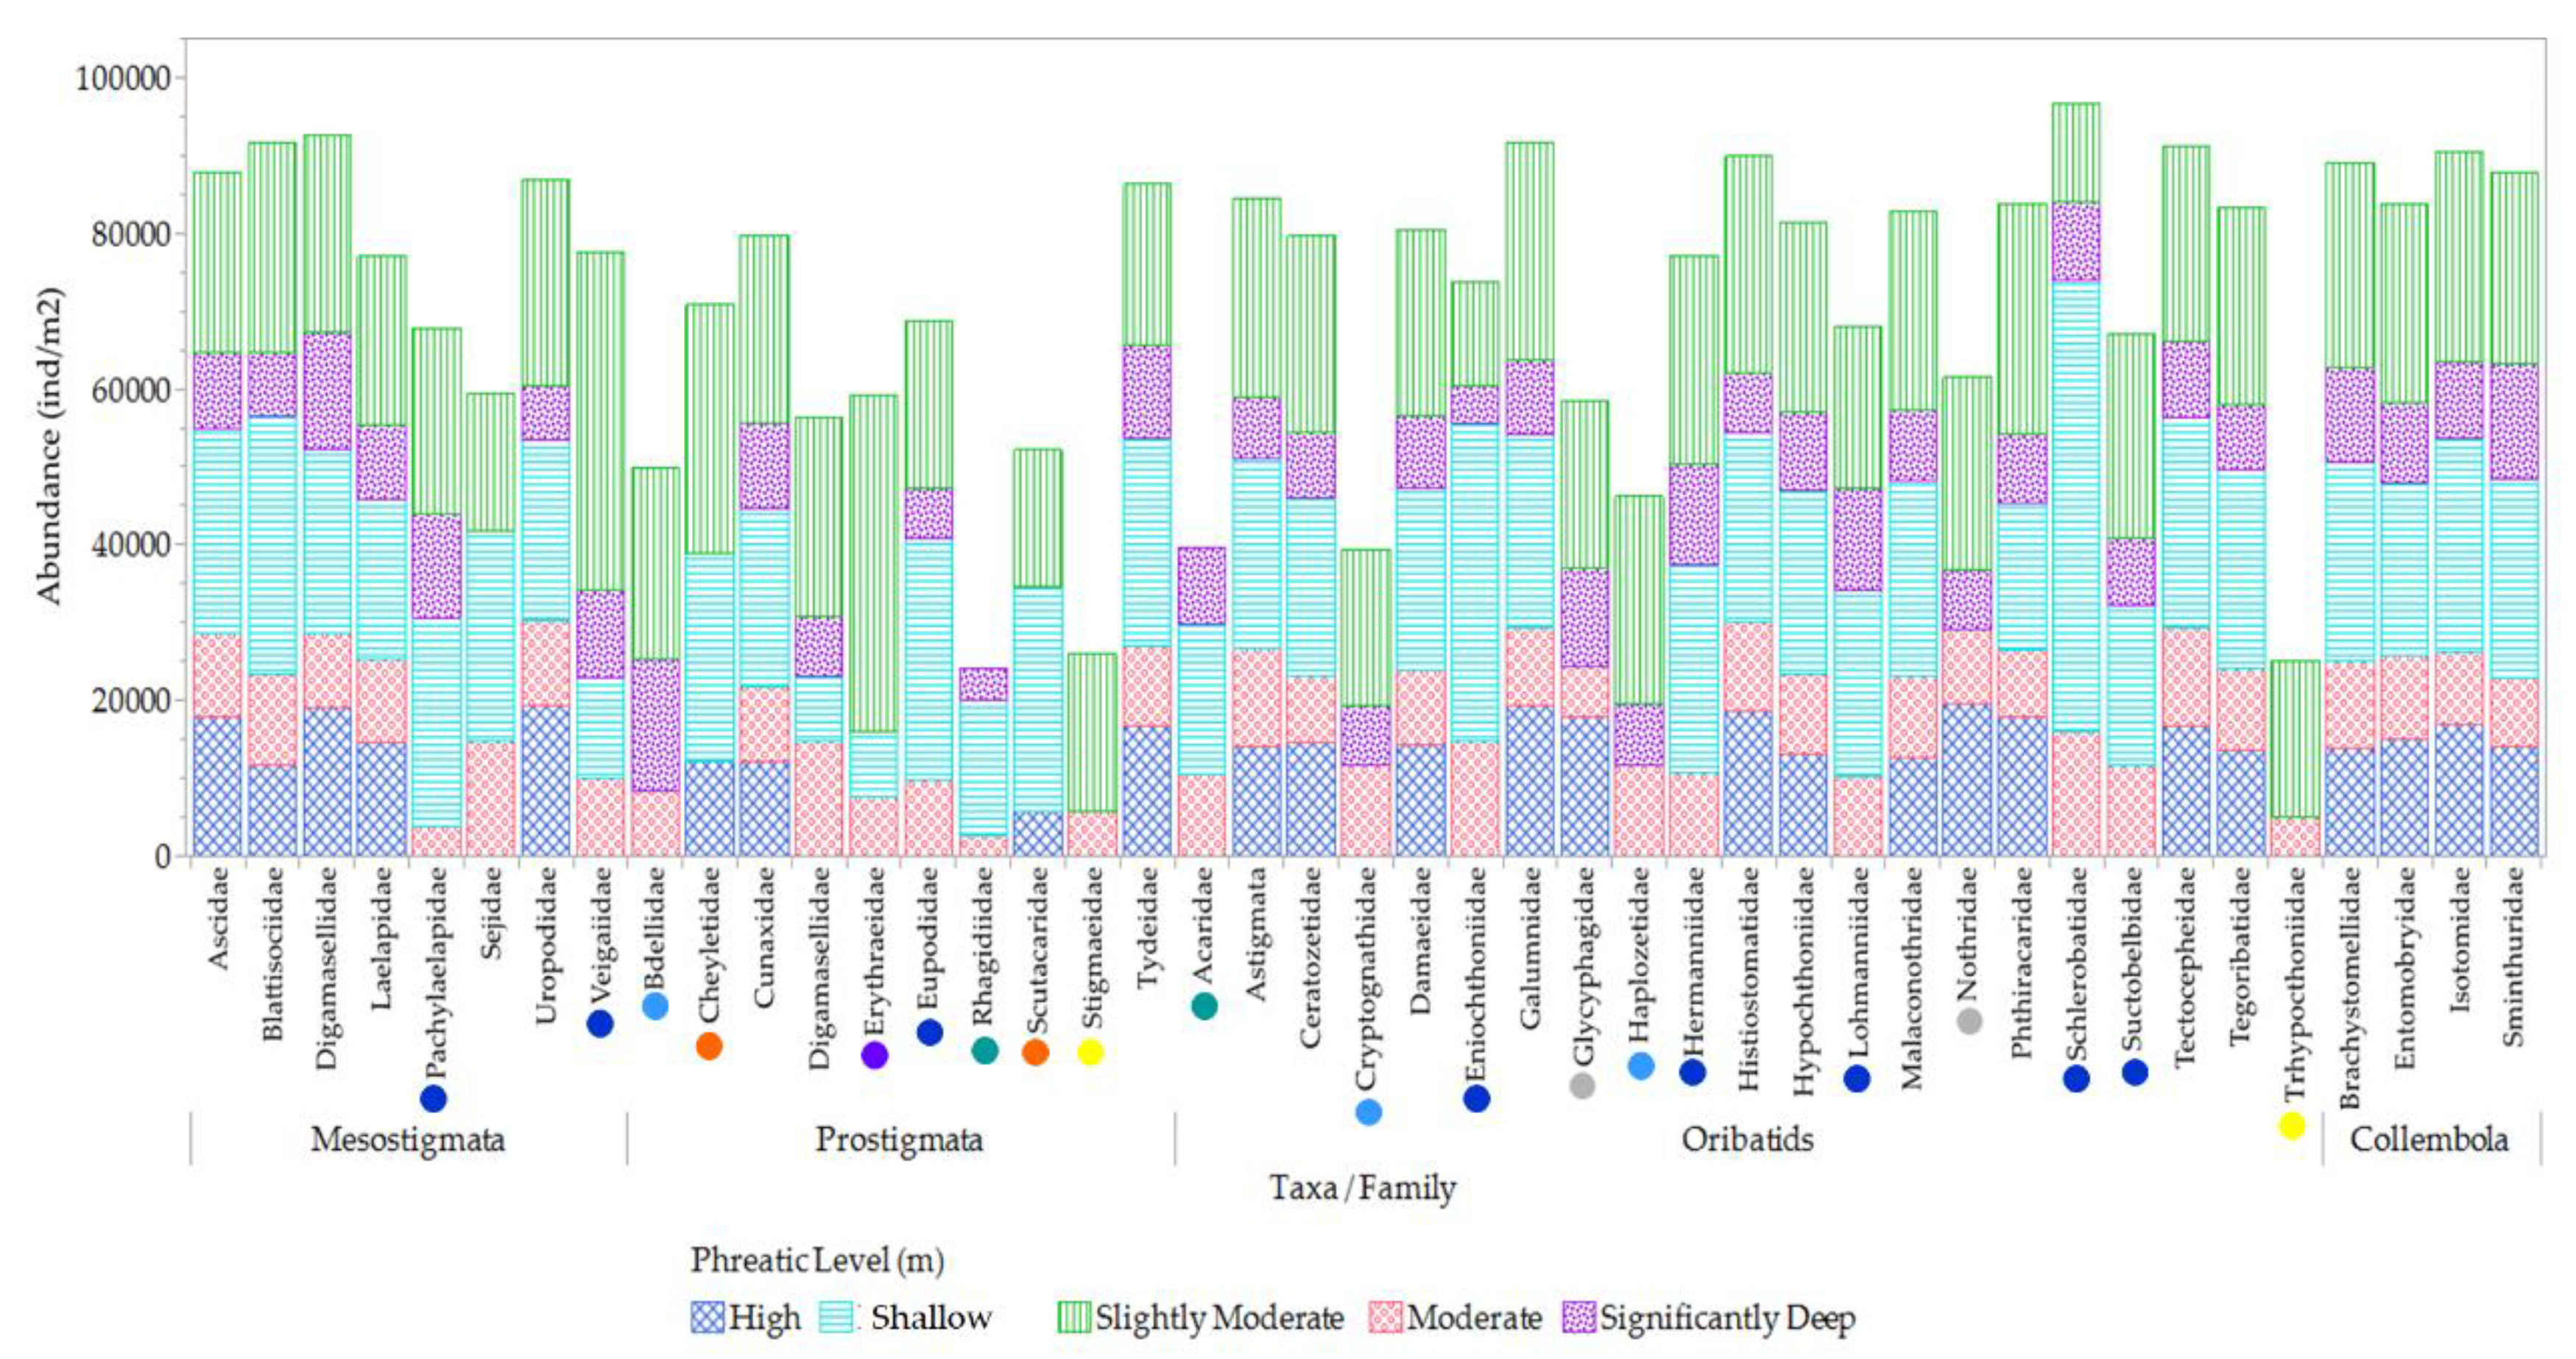
26]. In the Zhanjiang Plain wetland, a field experiment that emulated phreatic level changes from precipitation variations showed evidence that these communities were significantly influenced by substrate water level. Slight increases in total abundance were documented under natural water level dynamics, with significant reductions under constant water level conditions [
27].
Land use/land cover change, along with concomitant changes in hydrology, has a strong influence on altering vegetation patterns and soil salinity concentrations in Caribbean coastal urban wetlands, where a mosaic of different habitat type, instead of gradients, are the norm rather than the exception [
18]. Given that mesofauna play an essential role in wetland biological processes and have specific environmental requirements, determining how climate variability, and habitat bio-physicochemical constituents influence their composition, becomes an important tool in adaptive wetland management to global and regional climate change, sea level rise and increased anthropic use of the region. Our aim is to determine how spatiotemporal variations in phreatic level and salinity affect patterns and interactions of soil mesofauna communities in a tropical urban coastal wetland. We hypothesis that habitat differences significantly modulate mesofauna diversity and abundance in tropical urban coastal wetlands, with spatio-temporal variations in phreatic levels and salinity exerting critical influence on community structures and interactions of soil mesofauna.
4. Discussion
Ciénaga Las Cucharillas Natural Reserve has undergone hydrological modifications since colonial times, altering its marine-terrestrial-marine connectivity and bio-physicochemical components. Consequently, a mosaic of physicochemical conditions and habitat types characterizes these ecosystems. The observed variations in phreatic levels across different hydroperiods and habitats underscore the complex interplay between hydrological processes and habitat characteristics. The significant negative correlations between phreatic levels and salinity further elucidate the pivotal role these factors play in shaping the habitat conditions. It's important to recognize that these environmental factors are influenced by various water sources that enter the wetland, including in-situ precipitation, freshwater inputs, and seawater flows [
18].
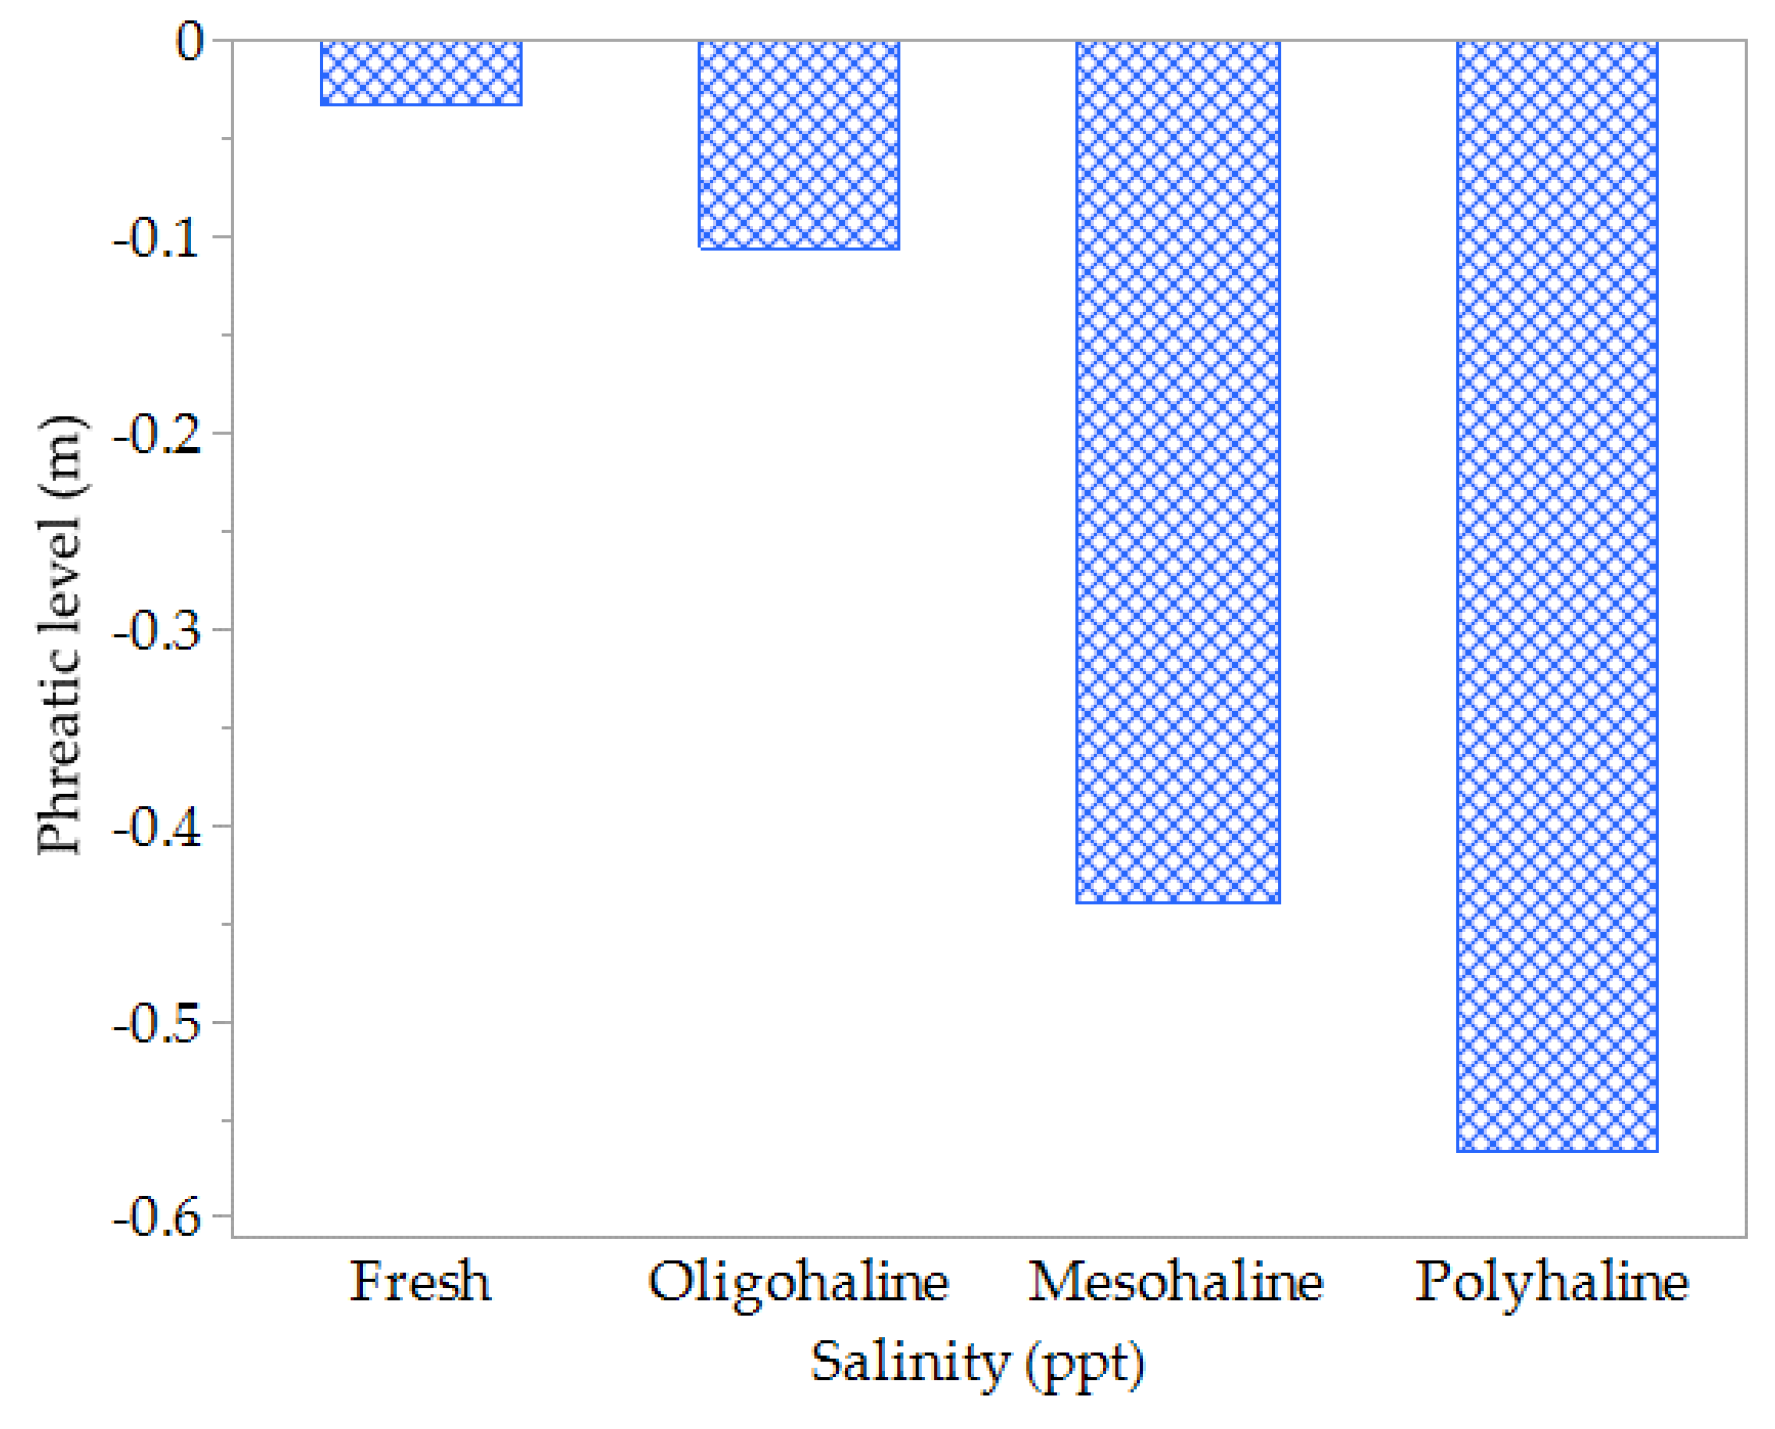
Mesohaline and polyhaline conditions are favored when the phreatic level is moderate and significantly deep, as observed during the moist and moderate dry periods. During these periods, a bimodal high tide reaches the study site in just 20 minutes. Conversely, freshwater and oligohaline conditions occur at higher and near surface phreatic levels, particularly during the flood and wet periods, when it takes up to 2 hours for the bimodal high tide to reach the study site [
36]. This tidal interaction in this wetland occurs via deep subsurface flow and causes notable fluctuations in substrate salinity concentrations within habitats. The moderated dry and moist periods are influenced by marine intrusion/tides and the flood and wet periods by freshwater input by precipitation and runoff. This periodic fluctuations in phreatic level and salinity exert a substantial influence on mesofauna dynamics and distribution patterns within and between habitats (
Figure 21), underscoring their sensitivity to changes of these environmental factors.
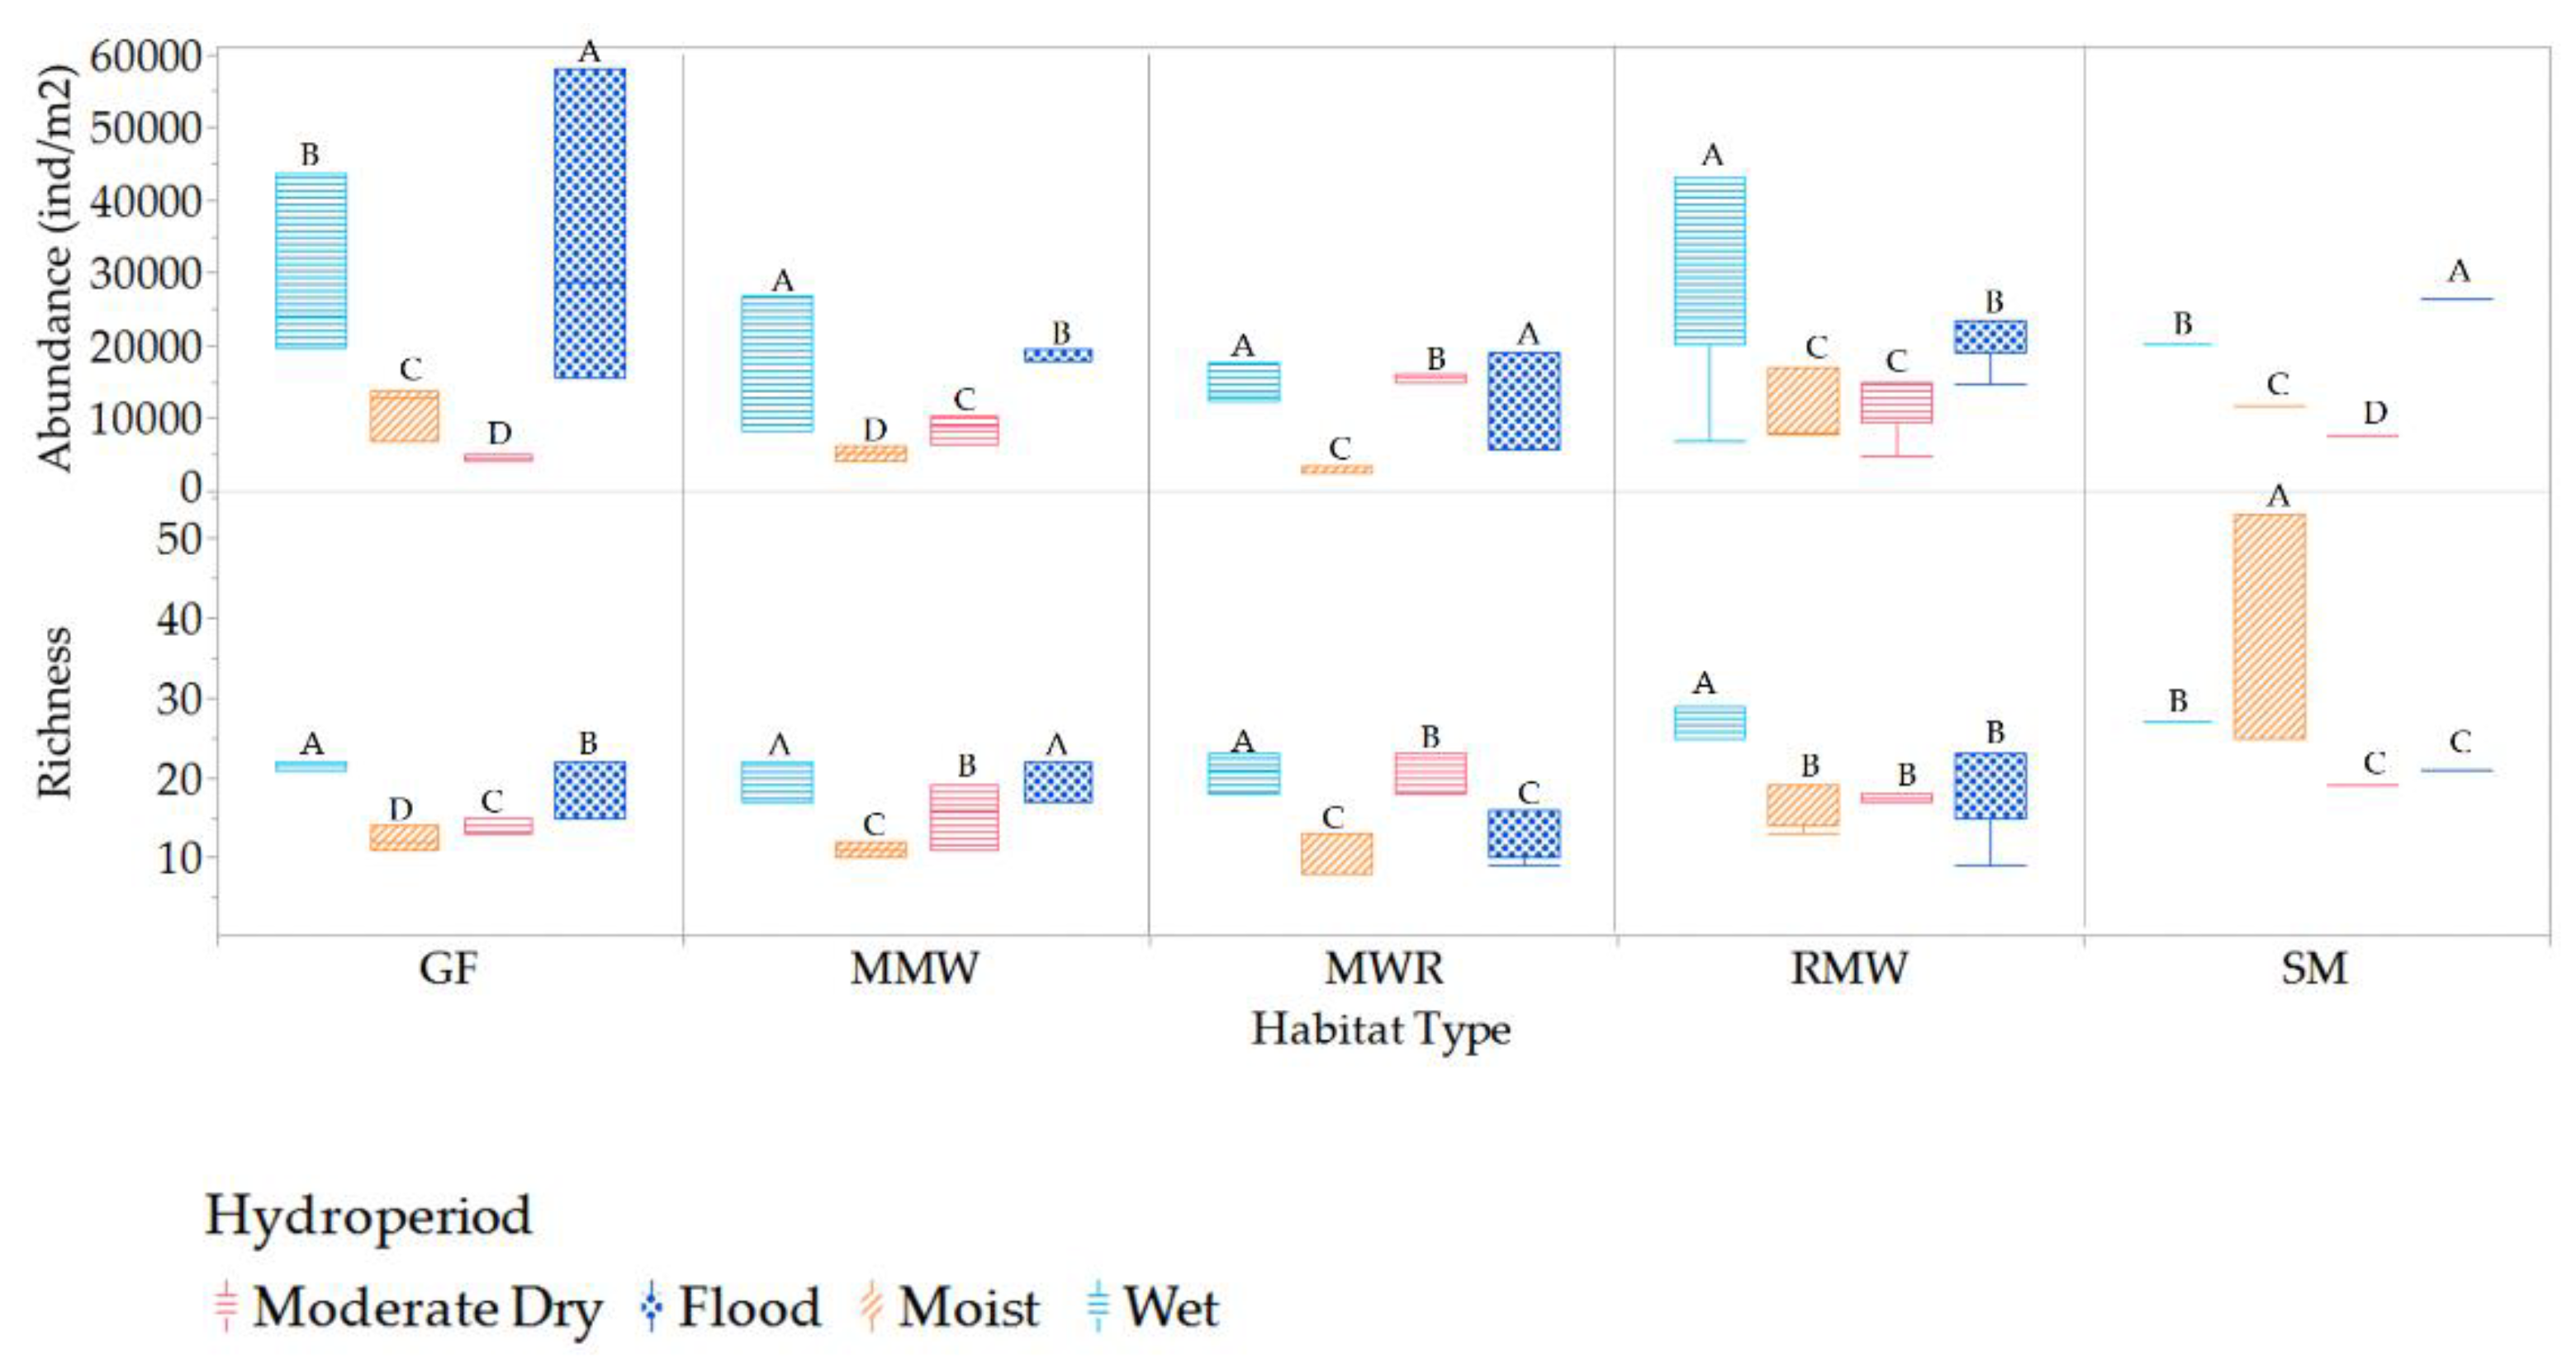
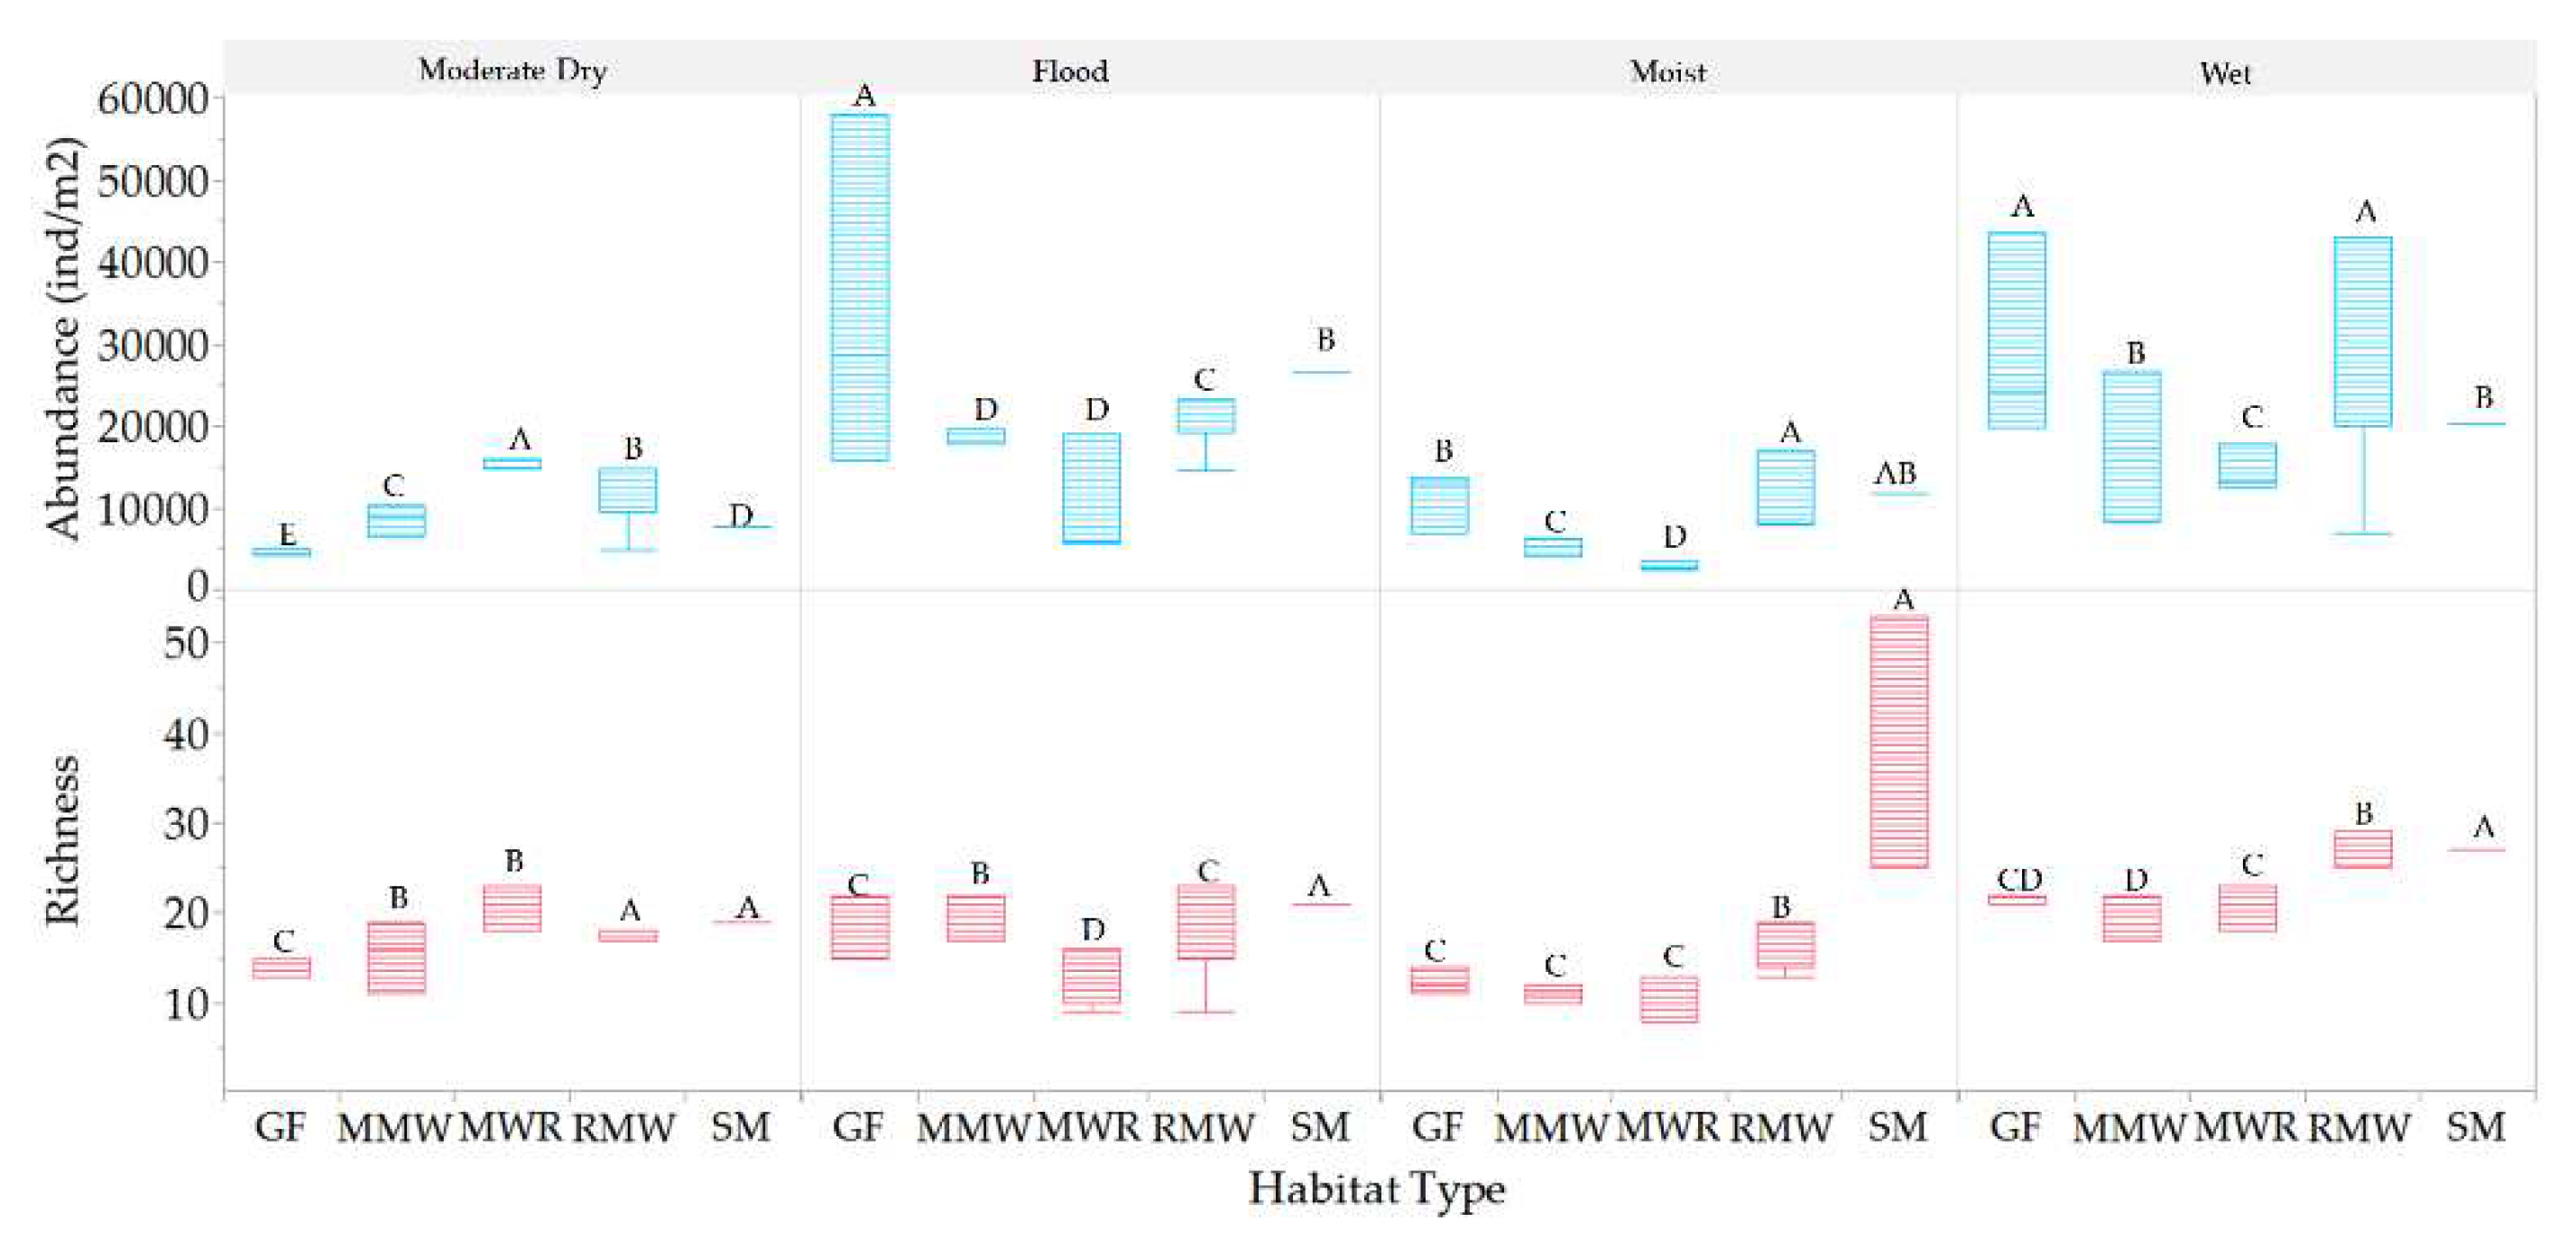
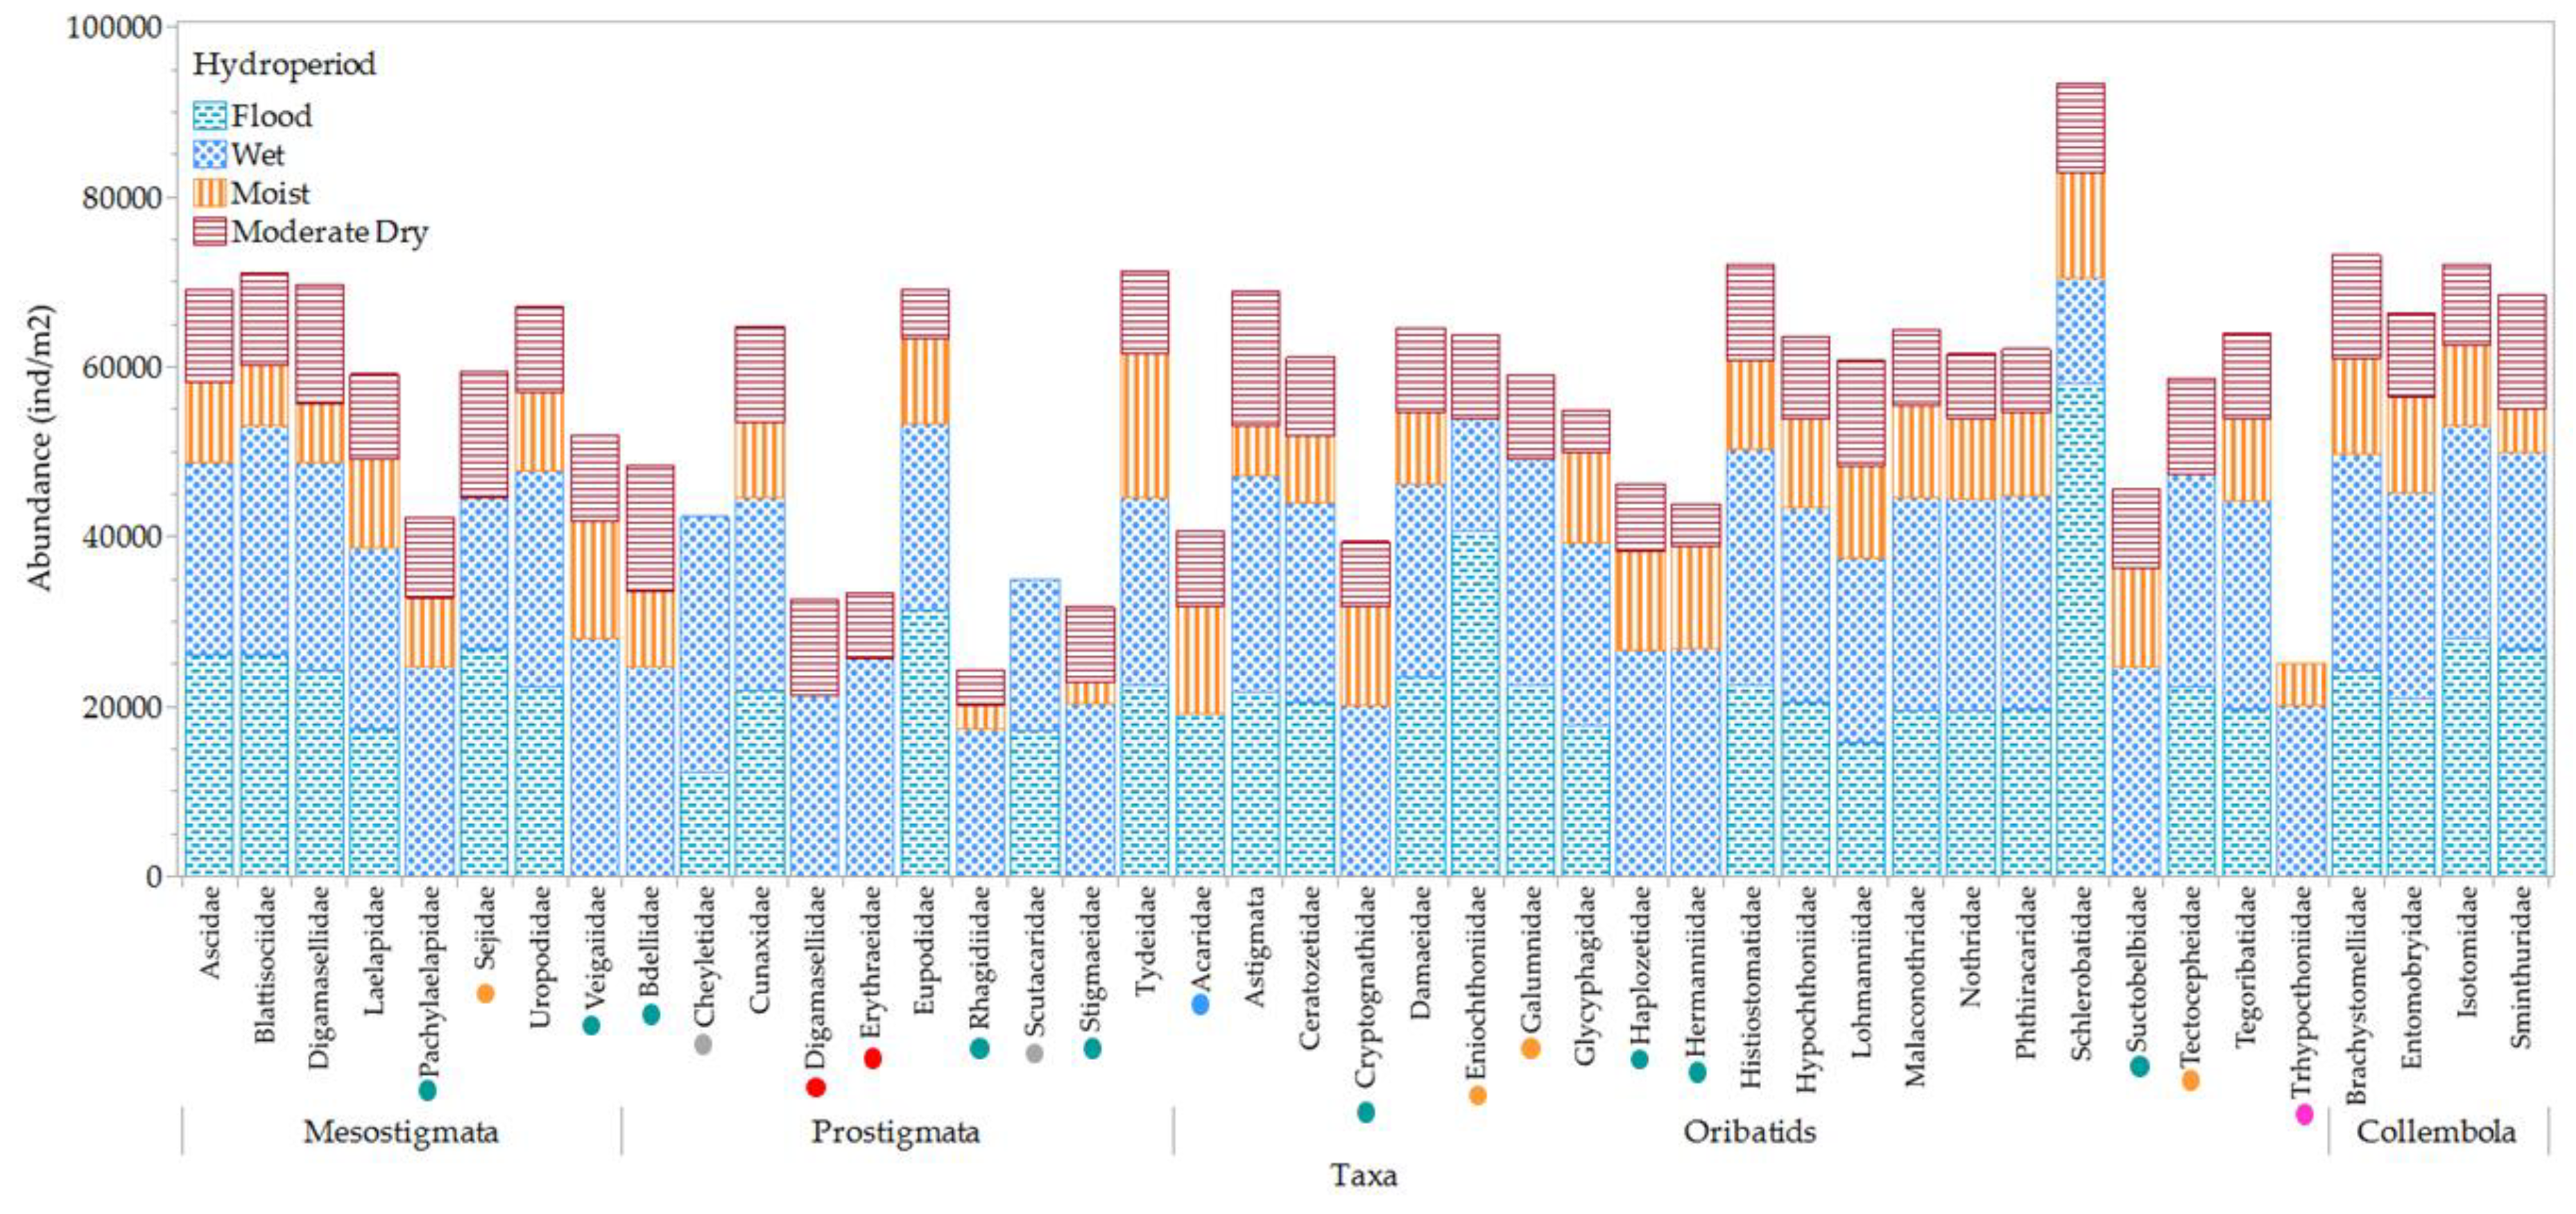
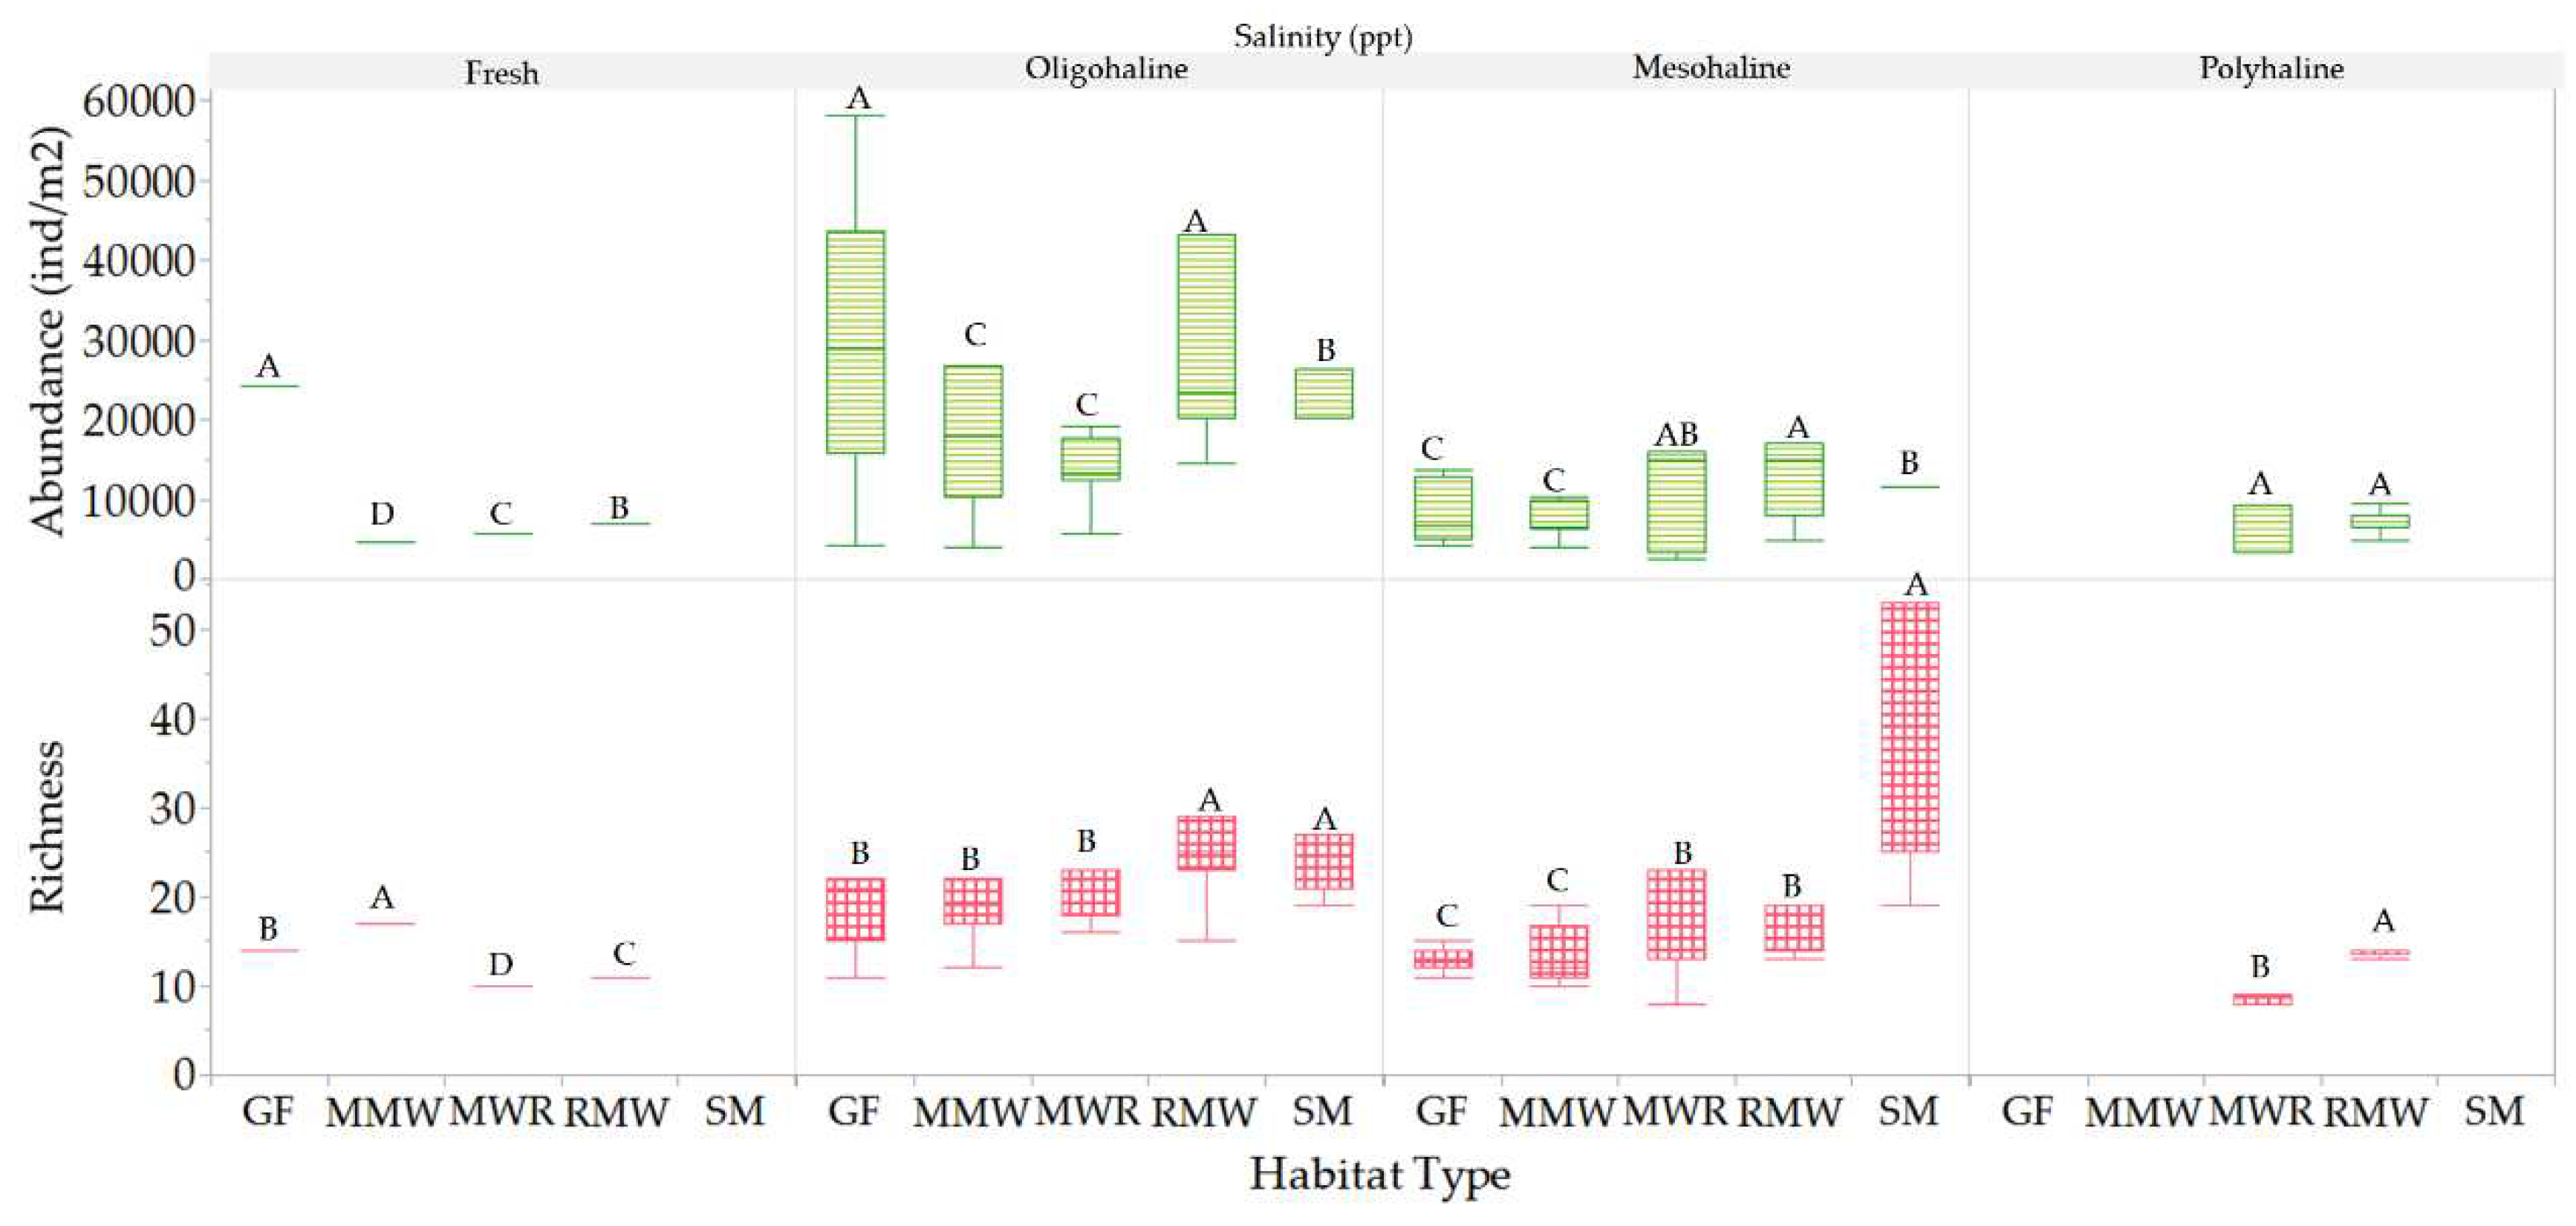
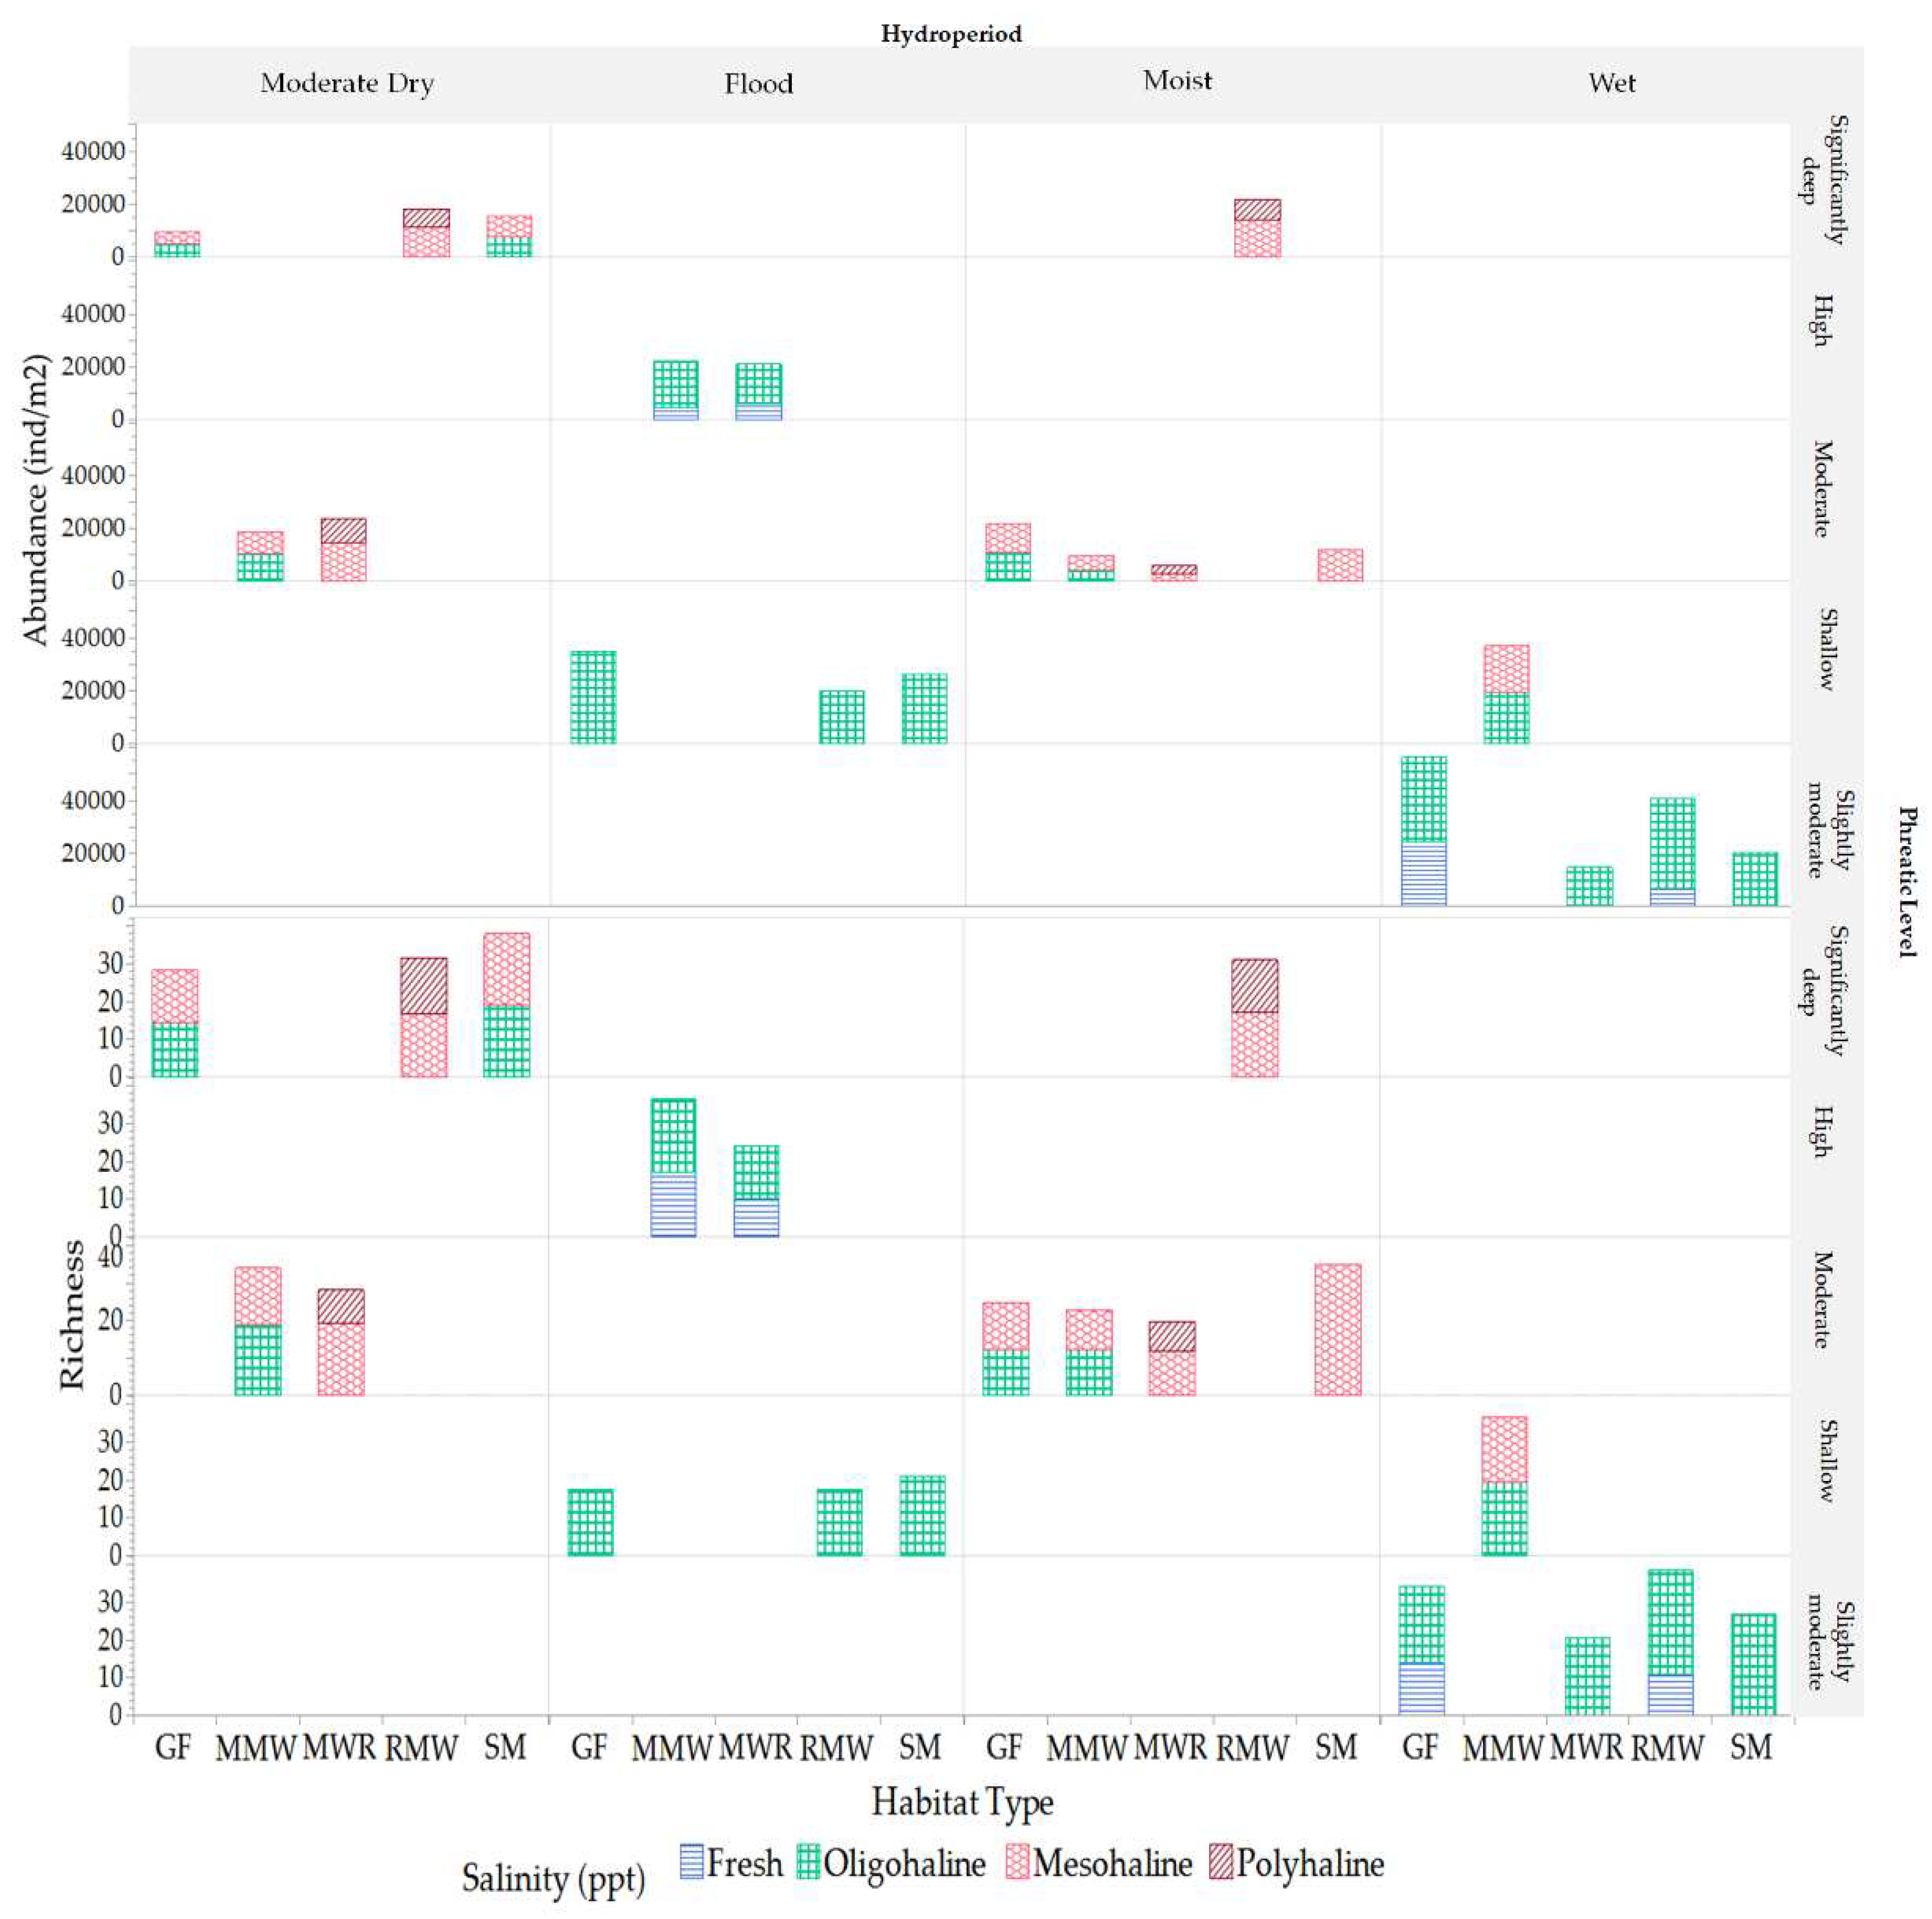
During both the wet and flood periods, we observed the peak of mesofauna richness and abundance, respectively, across various habitats (
Figure 22). Remarkably, a vast majority of mesofauna families flourished during these phases, accounting for 98% during the wet period and 74% during the flood period. This prevalence suggests that the habitat conditions of the wet period, characterized by a moderately low phreatic level (-0.12 ± 0.03 m) and oligohaline salinity (1.61 ± 1.07 ppt), foster an optimal microenvironment for a diverse array of mesofauna families. A plausible explanation for this trend is the series of environmental changes preceding the wet period. After enduring alternating flood and dry conditions for several months, factors such as substrate moisture, salinity, and food availability undergo significant shifts across habitats [
16,
48,
49]. In wetland ecosystems, terrestrial plant litter accumulates during dry spells and undergoes partial in-situ decomposition, enriching the humic material reservoir. The onset of flooding leads to the death of some terrestrial plants, while aquatic plants sprout, grow, and eventually decay, further augmenting the mixture and quantity of detrital accumulation. As floodwaters recede, transitioning into the wet period, the mixture and exposure of these organic materials creates zones ripe for recolonization, enhancing the activity of microflora [
50] and paving the way for a resurgence of mesofauna. This resurgence includes fungivorous entities such as oribatid mites and Collembola, as well as their predators, including Mesostigmata and Prostigmata mites [
10]. An exemplification of this recolonization is observed in the Oribatid Scheloribatidae family, which exhibited a doubling in their population during the flood sampling period, coinciding with the receding of floodwaters.
The lowest richness and abundance observed during the moderate dry hydroperiod indicate that the prevailing conditions, which include deeper phreatic levels ( -0.46 ± 0.06) and moderate mesohaline to polyhaline salinities (10.53 ± 2.97 ppt, 18.94 ± 0.48 ppt) across the different habitats, had a substantial impact on mesofauna distribution and dynamics.
Between habitat-specific variations in richness and abundance, the mature 50-year shrubland of
Dalbergia ecastaphyllum (L.) (SM) emerges as a distinctive environment, consistently showcasing the highest richness throughout all observed periods (
Figure 22). This heightened richness is likely fostered by the unique characteristics of the SM habitat, including a moderate phreatic level (mean value= -0.22 ± 0.16 m), the presence of oligohaline to low mesohaline salinities, canopy closure providing shade to the understory and soil, and enhanced litter inputs. These factors collectively cultivate a microenvironment conducive to a diverse mesofauna community, instigating shifts in the population dynamics [
50,
51]. During the moist period, which occurs between flood events, the SM habitat exhibited a richness that was twice that of other habitats. This period was characterized by a moderate phreatic level and a prevailing low mesohaline salinity of 8.32 ± 2.09 ppt. The elevated richness during this period can be attributed to the higher micro-elevation of the SM habitat, which acts as a buffer against the high phreatic levels typically experienced during flood disturbances, a protection not afforded to other habitats especially MMW and MWR that had similar microenvironemnts. This distinctive microenvironment fosters conditions favorable for the colonization by a variety of mesofauna taxa that are well-adapted to predominantly mesohaline salinities [
19,
23]. Furthermore, it is noteworthy that during this moist period, the SM habitat maintained a relatively stable mesofauna community, as evidenced by the lack of significant fluctuations in the richness and abundance of key groups such as Oribatids, Mesostigmata, and Collembolas. This stability suggests a resilient community structure, capable of withstanding the environmental changes occurring during this period and underscores the critical role of the SM habitat in harboring a rich and stable mesofauna community. This finding highlights the importance of understanding the unique characteristics and dynamics of different habitats in fostering biodiversity in tropical urban coastal wetlands.
Significant variability exists in how different mesofauna taxa respond to phreatic levels and salinity, suggesting distinct tolerances to these environmental factors. Both Spearman's Rho correlation analysis and the generalized regression model offer empirical evidence of the significant impact of phreatic level and salinity on mesofauna richness and abundance. These diverse responses among taxa can be attributed to various factors, including life cycle variants, physiological speciation, and behavioral adaptations.
Significantly, around thirty-six percent (36%) of the mesofauna families were absent during periods of marked shifts in phreatic levels, including the flood and subsequent post-flood (moist) phases. This absence underscores the sensitivity of a considerable portion of mesofauna families to such hydrological disturbances. A case in point is the oribatid family Trhypocthoniidae, which exhibited a pronounced sensitivity to extreme fluctuations in phreatic levels. This family was conspicuously absent not only during the moderate dry periods, characterized by deep phreatic levels, but also during the flood periods where high phreatic levels prevail. This pattern of absence across a spectrum of extreme phreatic conditions highlights the vulnerability of Oribatid Trhypocthoniidae to substantial variations in hydroperiods, pointing to a narrow ecological amplitude with regard to phreatic level tolerances.
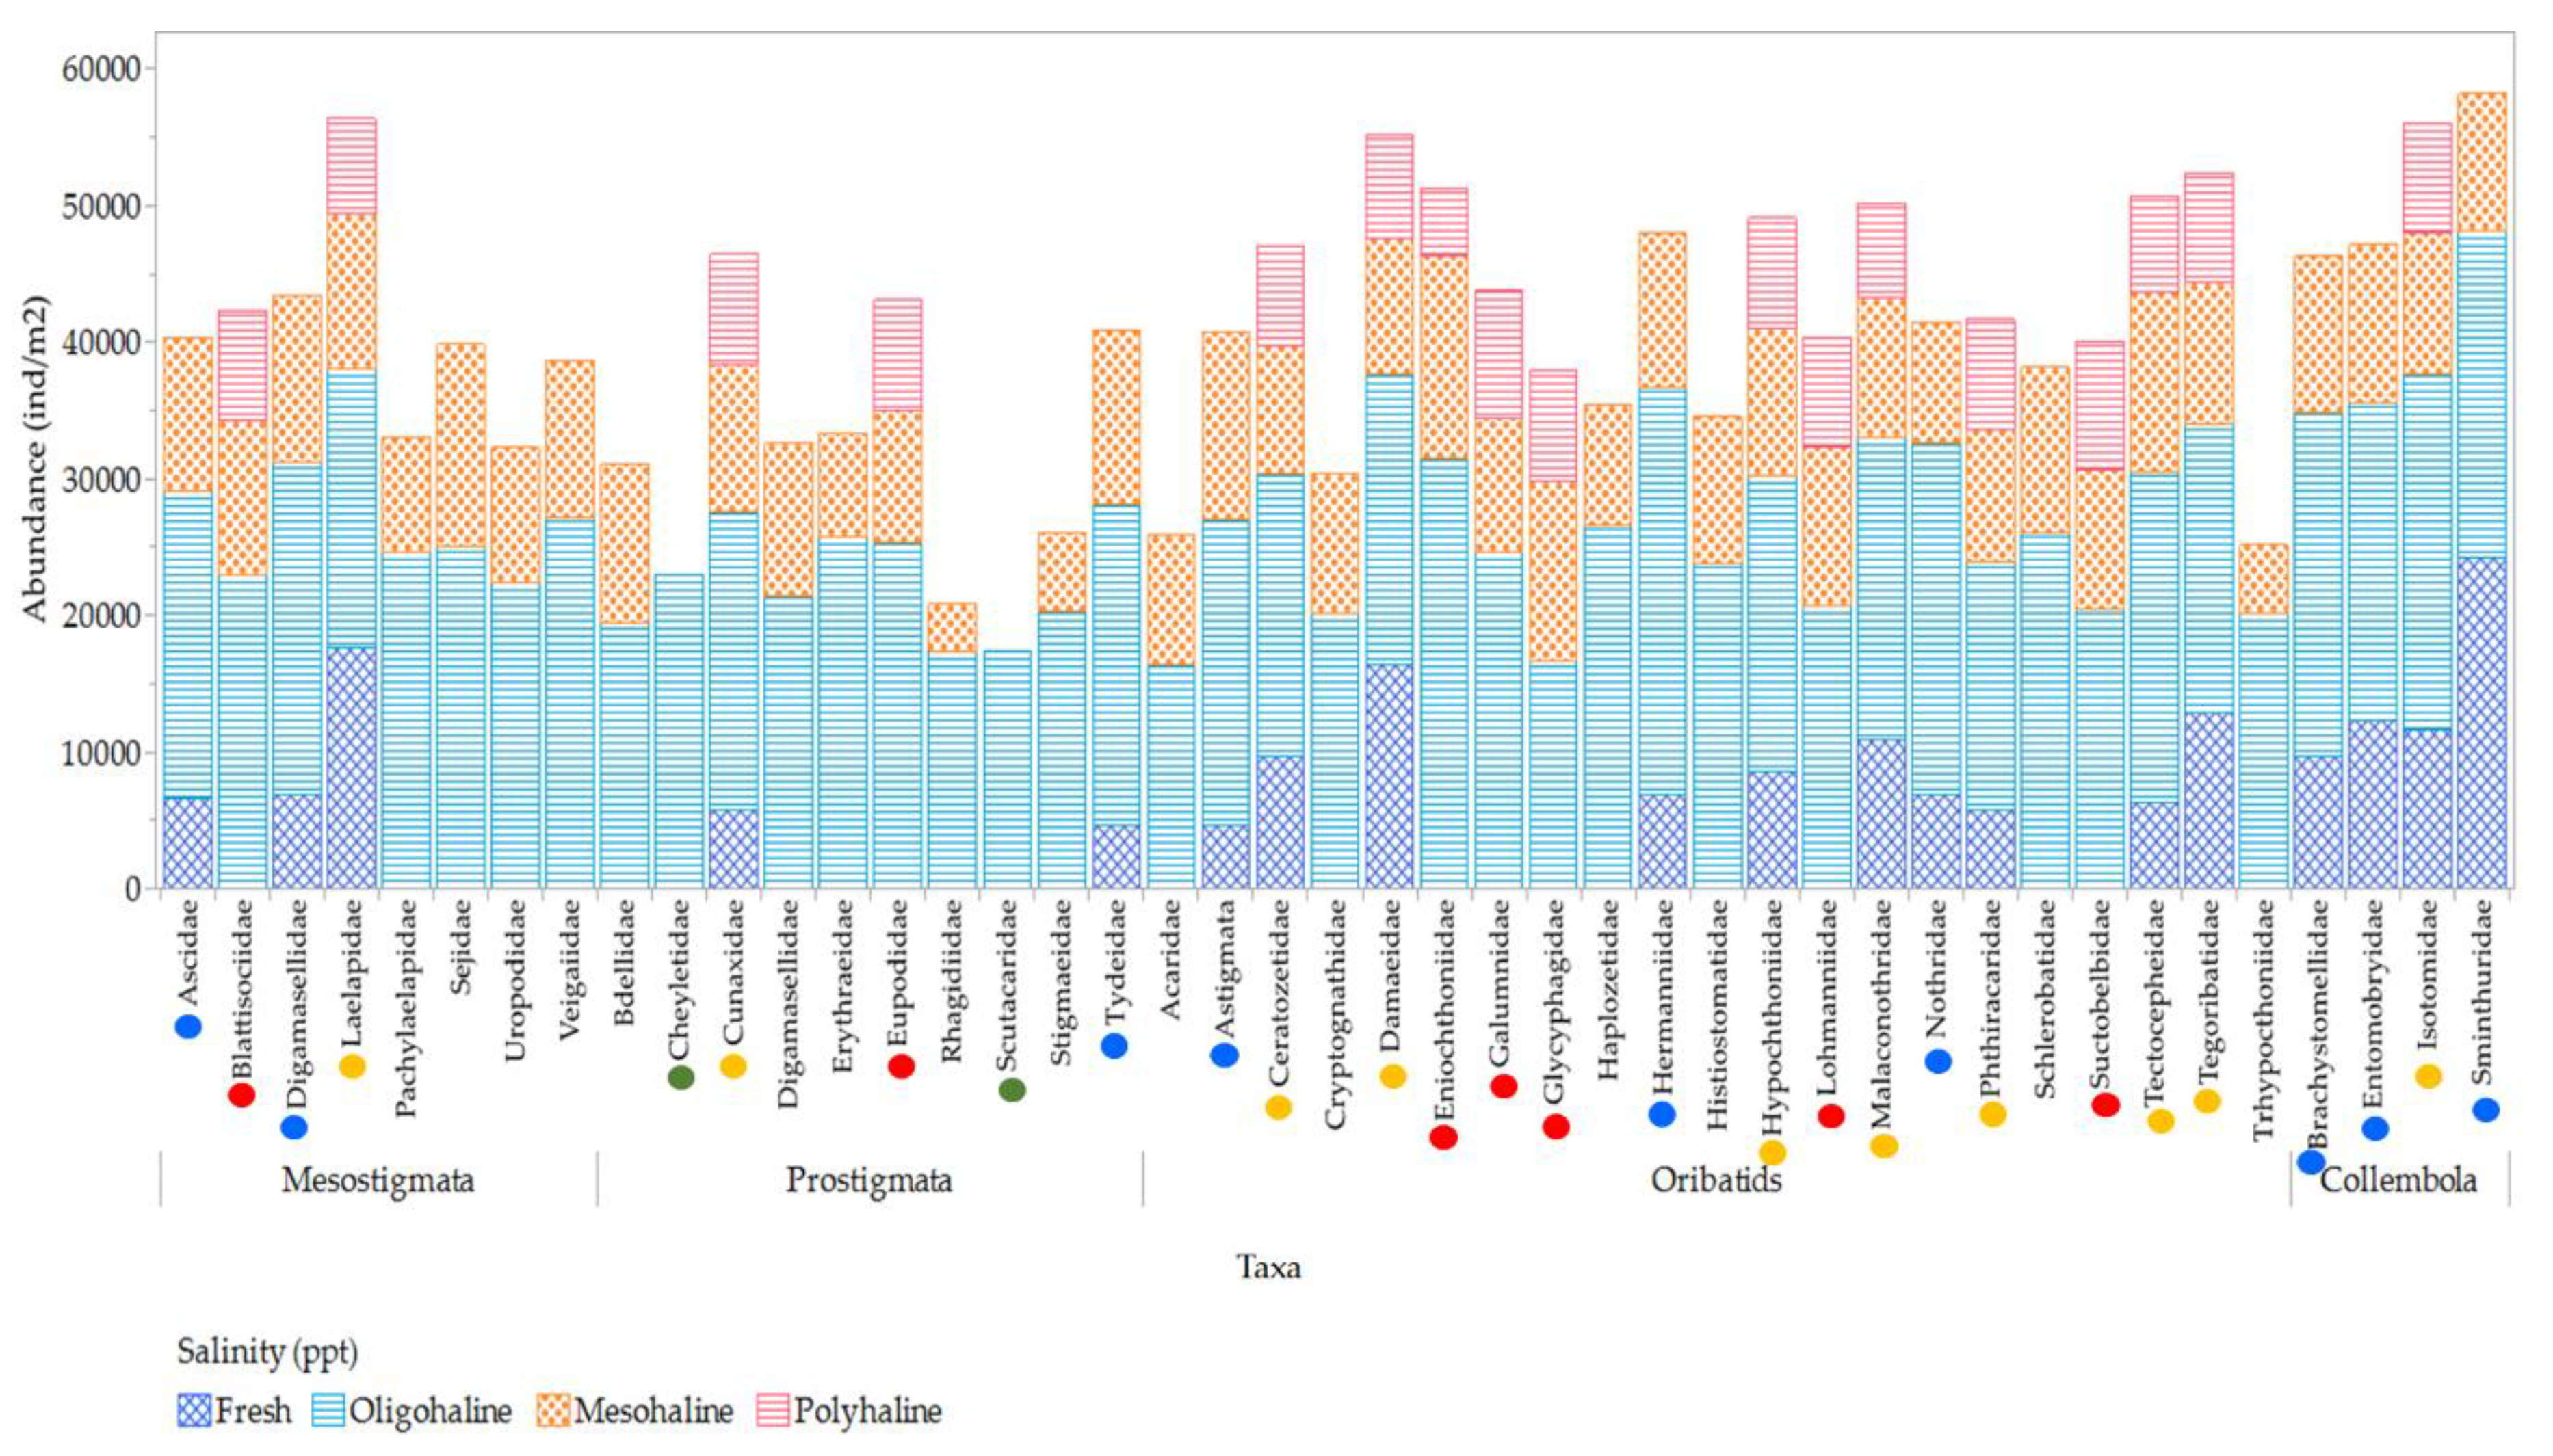
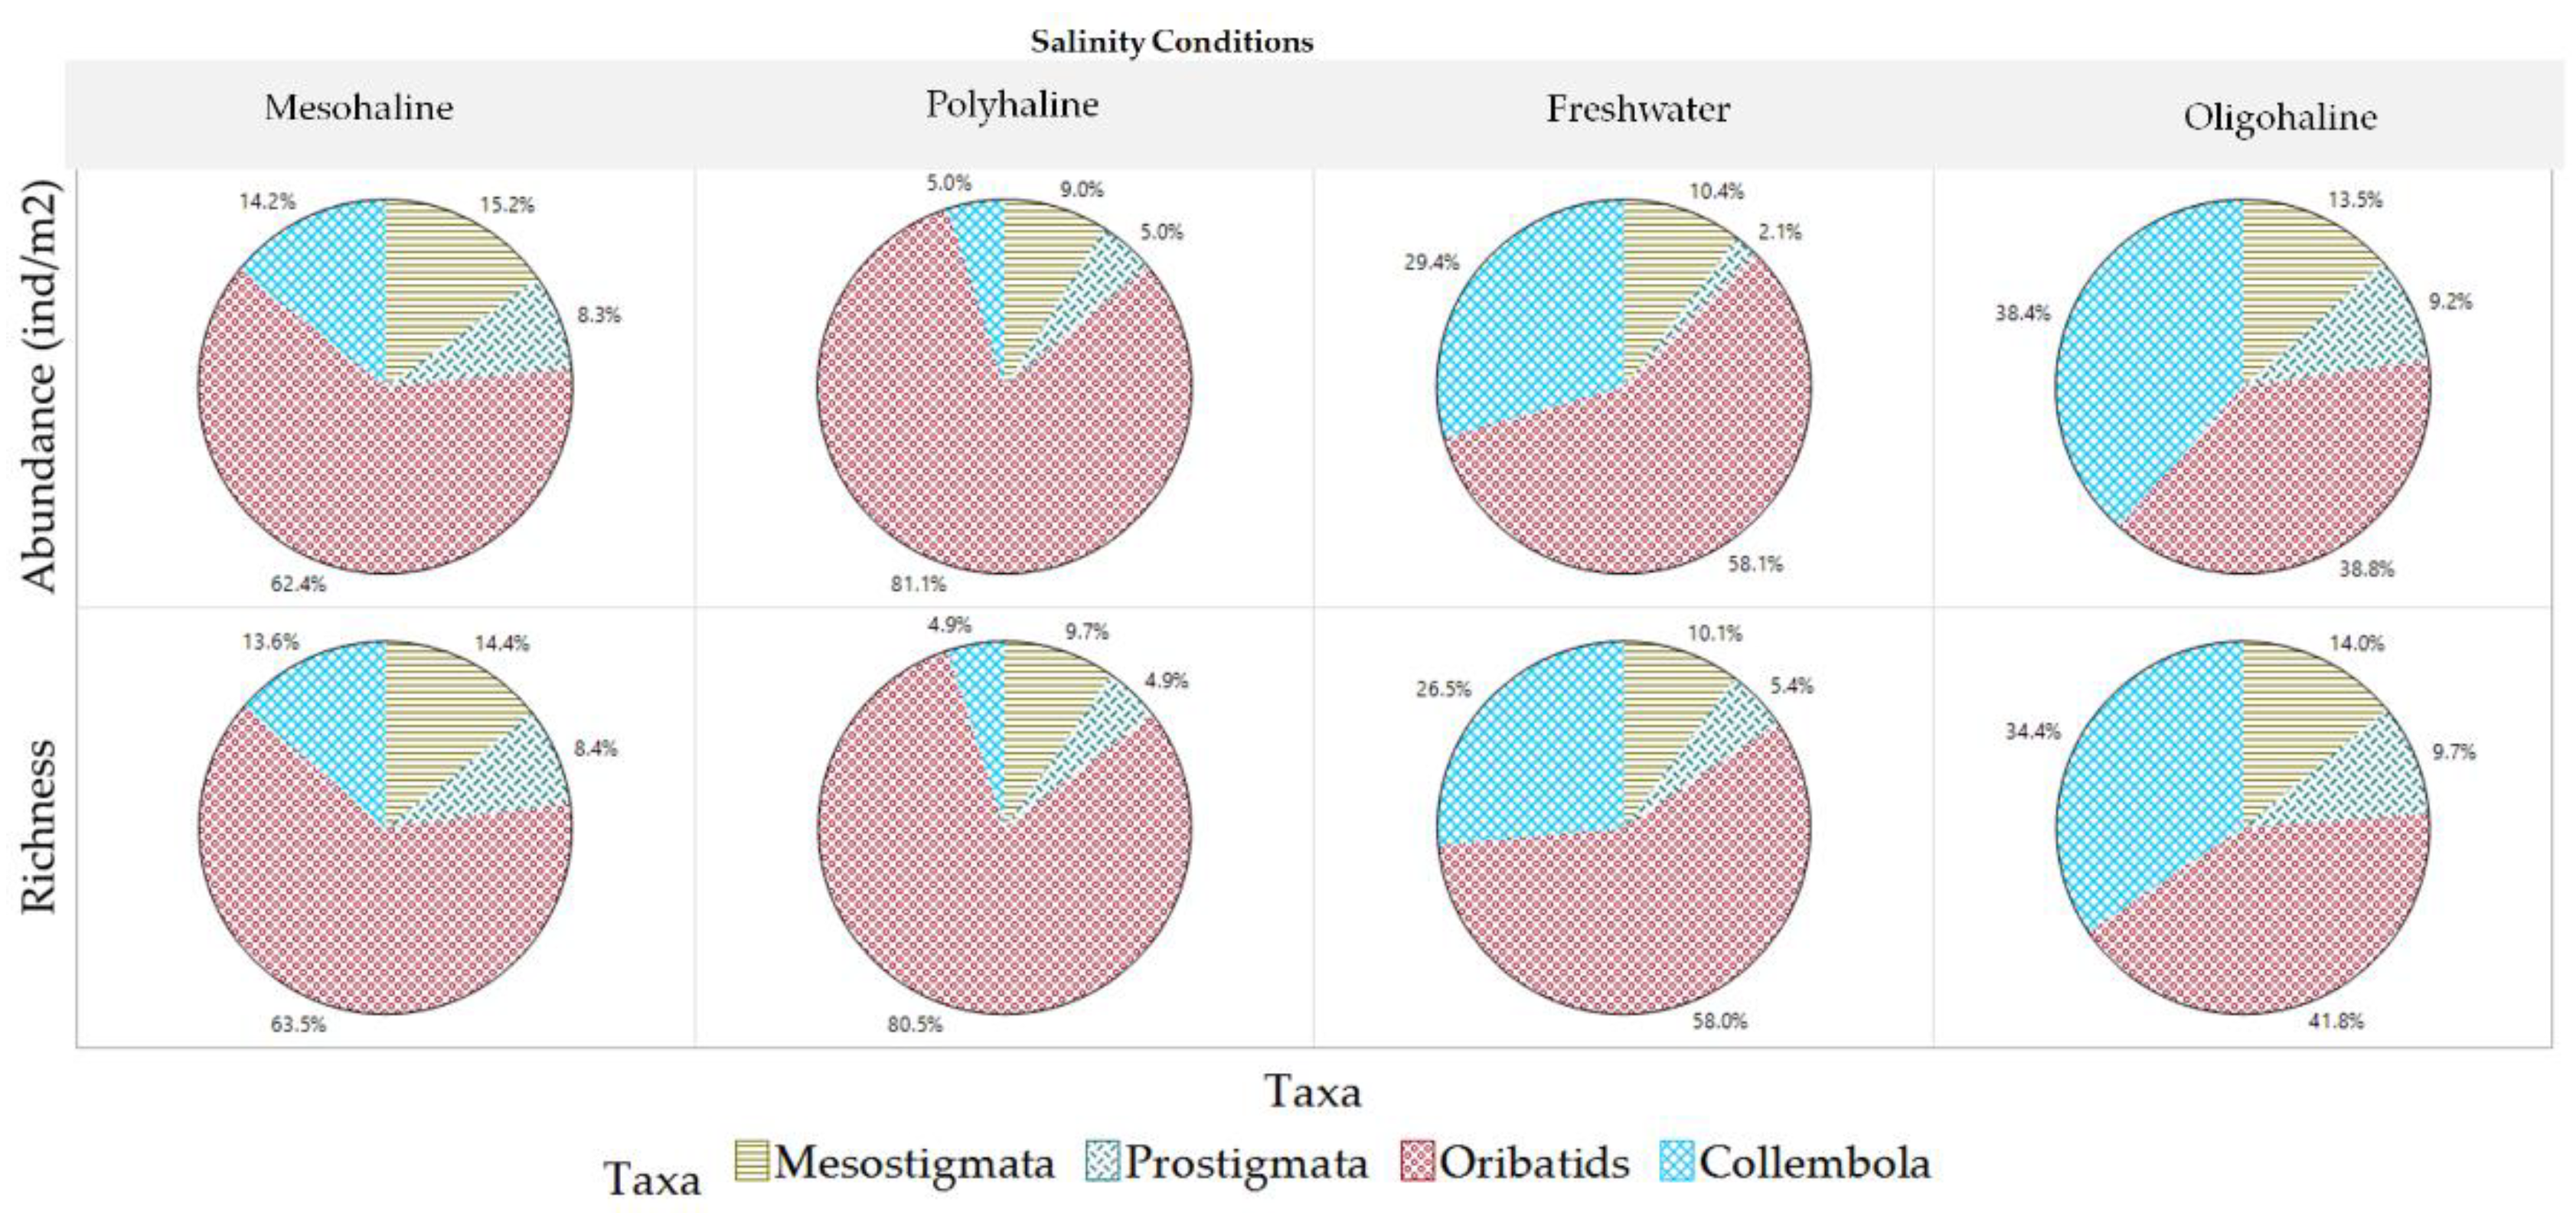
Regarding salinity preferences, Oribatids dominate across all salinity conditions (
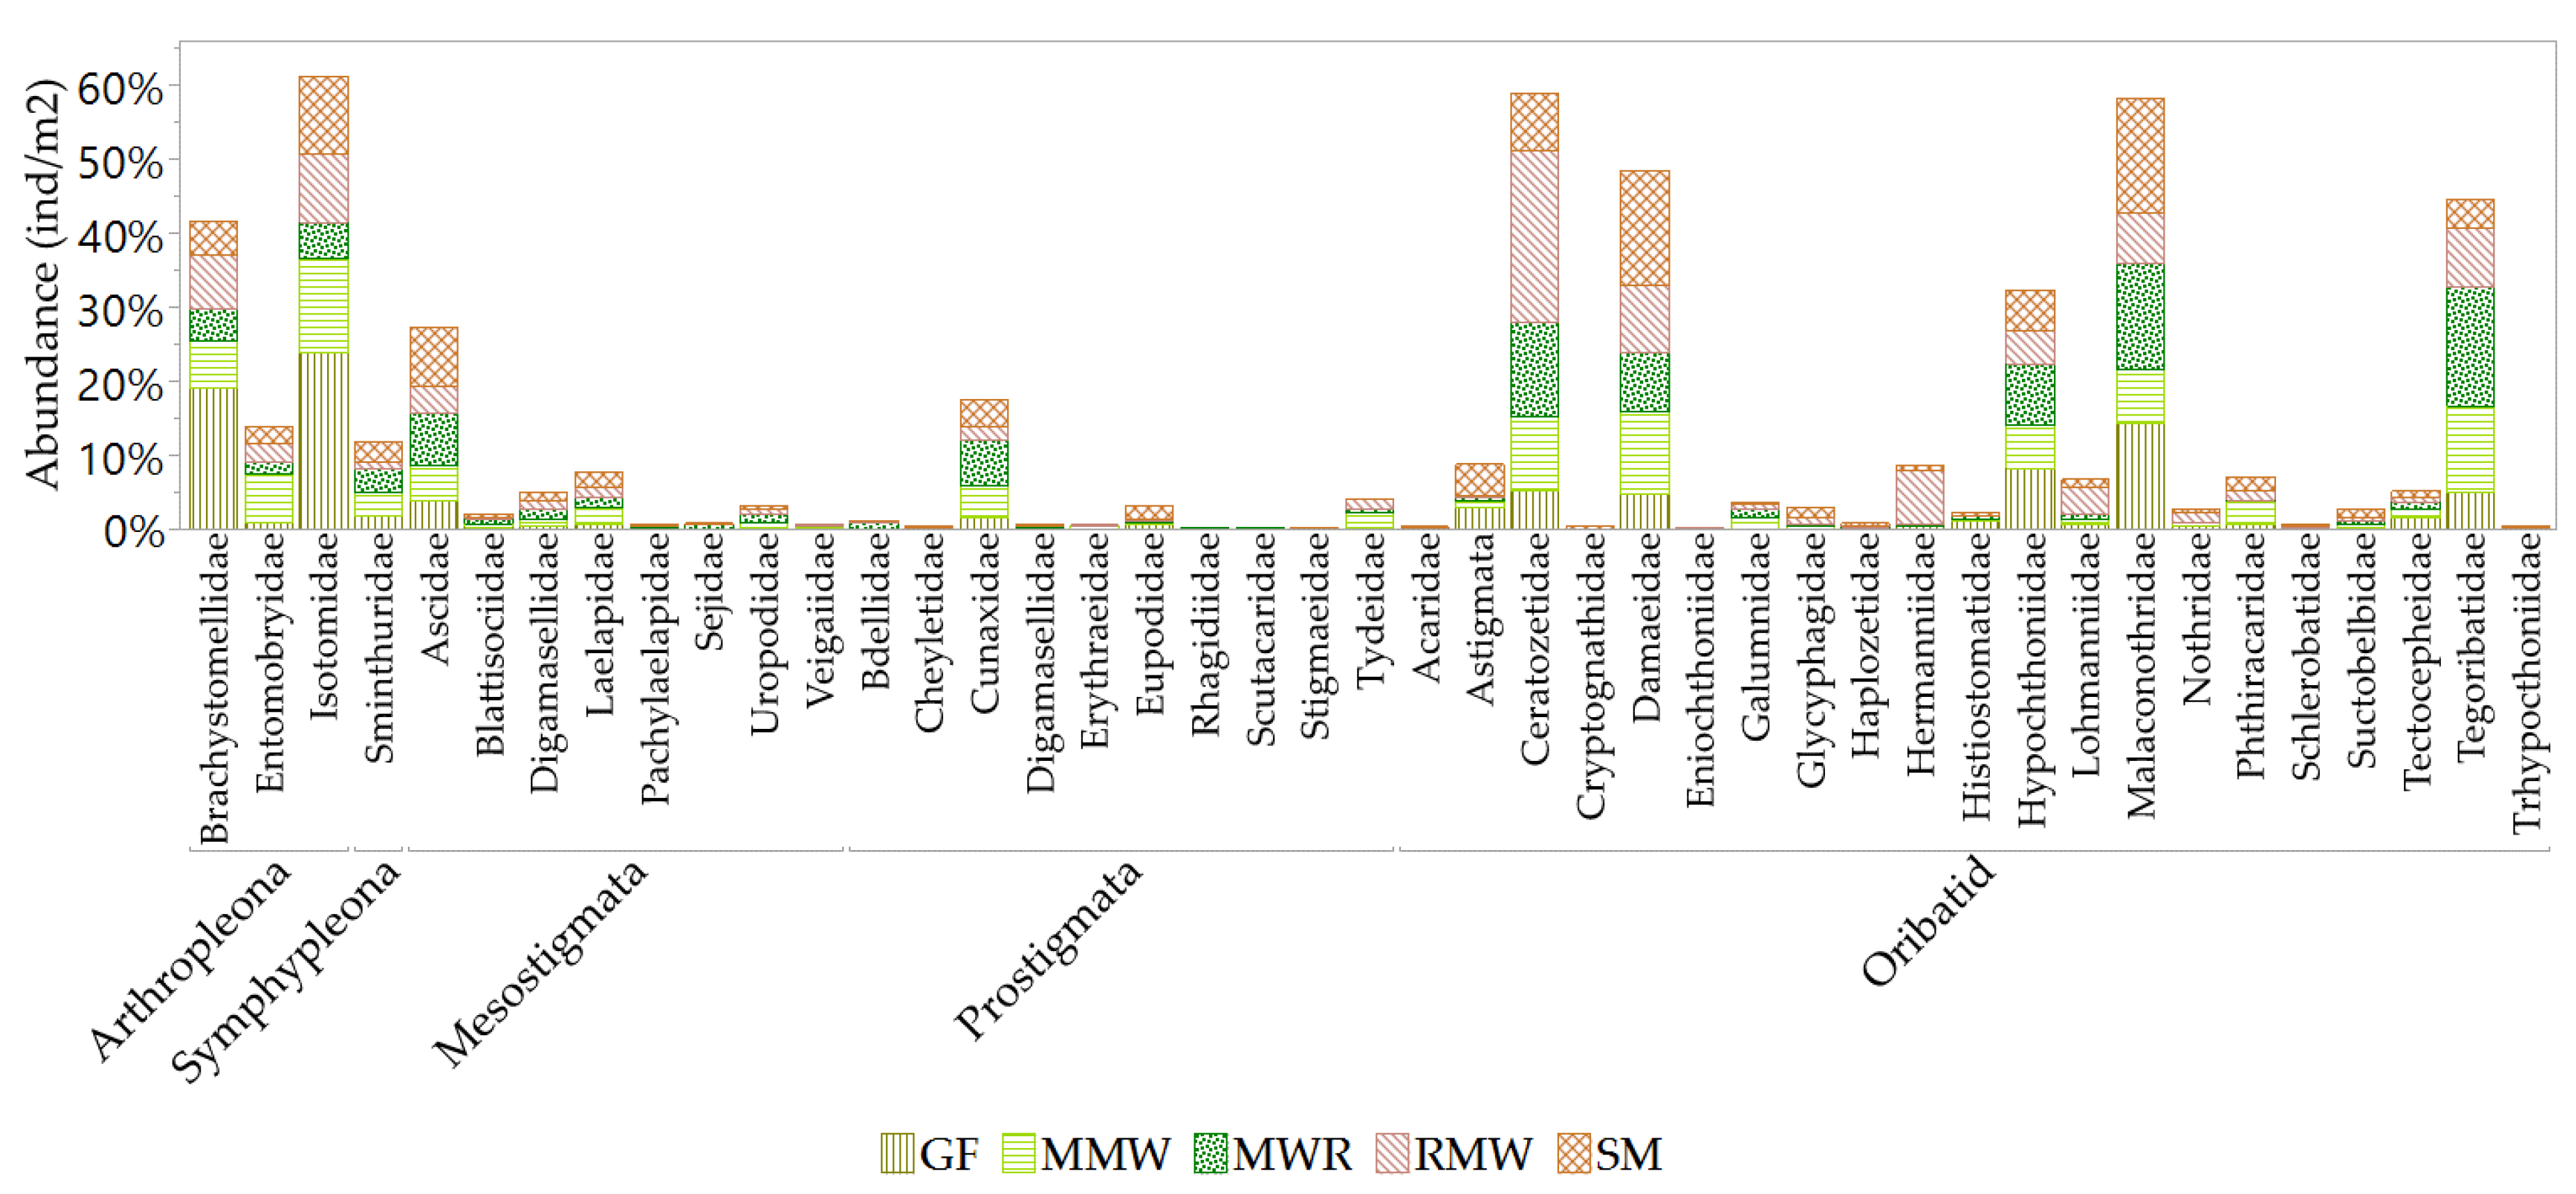
Figure 23). Collembola taxa show increased richness and abundance at oligohaline and freshwater salinities, while Mesostigmata and Prostigmata increase at oligohaline and mesohaline conditions. However, Prostigmata families such as Scutacaridae and Cheyletidae are exclusive to oligohaline salinities, indicating their specialization in this salinity range.The mesofauna community's prevalence and response to fluctuations in salinity conditions exhibit significant variations among different families. The majority of mesofauna families (ninety-five percent) thrive in oligohaline and mesohaline salinities. A portion of the taxa (twenty-four percent), which includes families like Oribatids Damaeidae, Mesostigmata Laelapidae, Prostigmata Cunaxidae, and Collembola Isotomidae, demonstrates adaptability to both freshwater and polyhaline salinities, showcasing their ability to acclimate to a broader salinity spectrum. Approximately twenty-five percent of mesofauna families were found in freshwater conditions (notably families such as Oribatids Ceratozetidae, Mesostigmata Digamasellidae, Prostigmata Cunaxidae, and Collembola Sminthuridae), and seventeen percent were observed in polyhaline salinity, with dominant families being Oribatids Galumnidae and Suctobelbidae, Mesostigmata Blattisociidae, Prostigmata Eupodidae, and Collembola Isotomidae.
The findings delineated above unveil a complex interplay of inter- and intra-specific responses to the fluctuating phreatic levels and salinity conditions prevalent during the hydroperiods of wetland habitats. This underscores the intricate adaptations and ecological strategies that various mesofauna families have evolved to acclimate to the periodic landscape dynamics inherent to tropical urban coastal wetlands. Consequently, this research offers profound insights into the community structures and operational dynamics of mesofauna in these ecosystems, elucidating their resilience and adaptability in the face of environmental variations.
Figure 1.
Historical changes in costal wetland land use cover since colonial times followed by abandonment, modified its hydrology and marine-terrestrial-marine connectivity.
Figure 1.
Historical changes in costal wetland land use cover since colonial times followed by abandonment, modified its hydrology and marine-terrestrial-marine connectivity.
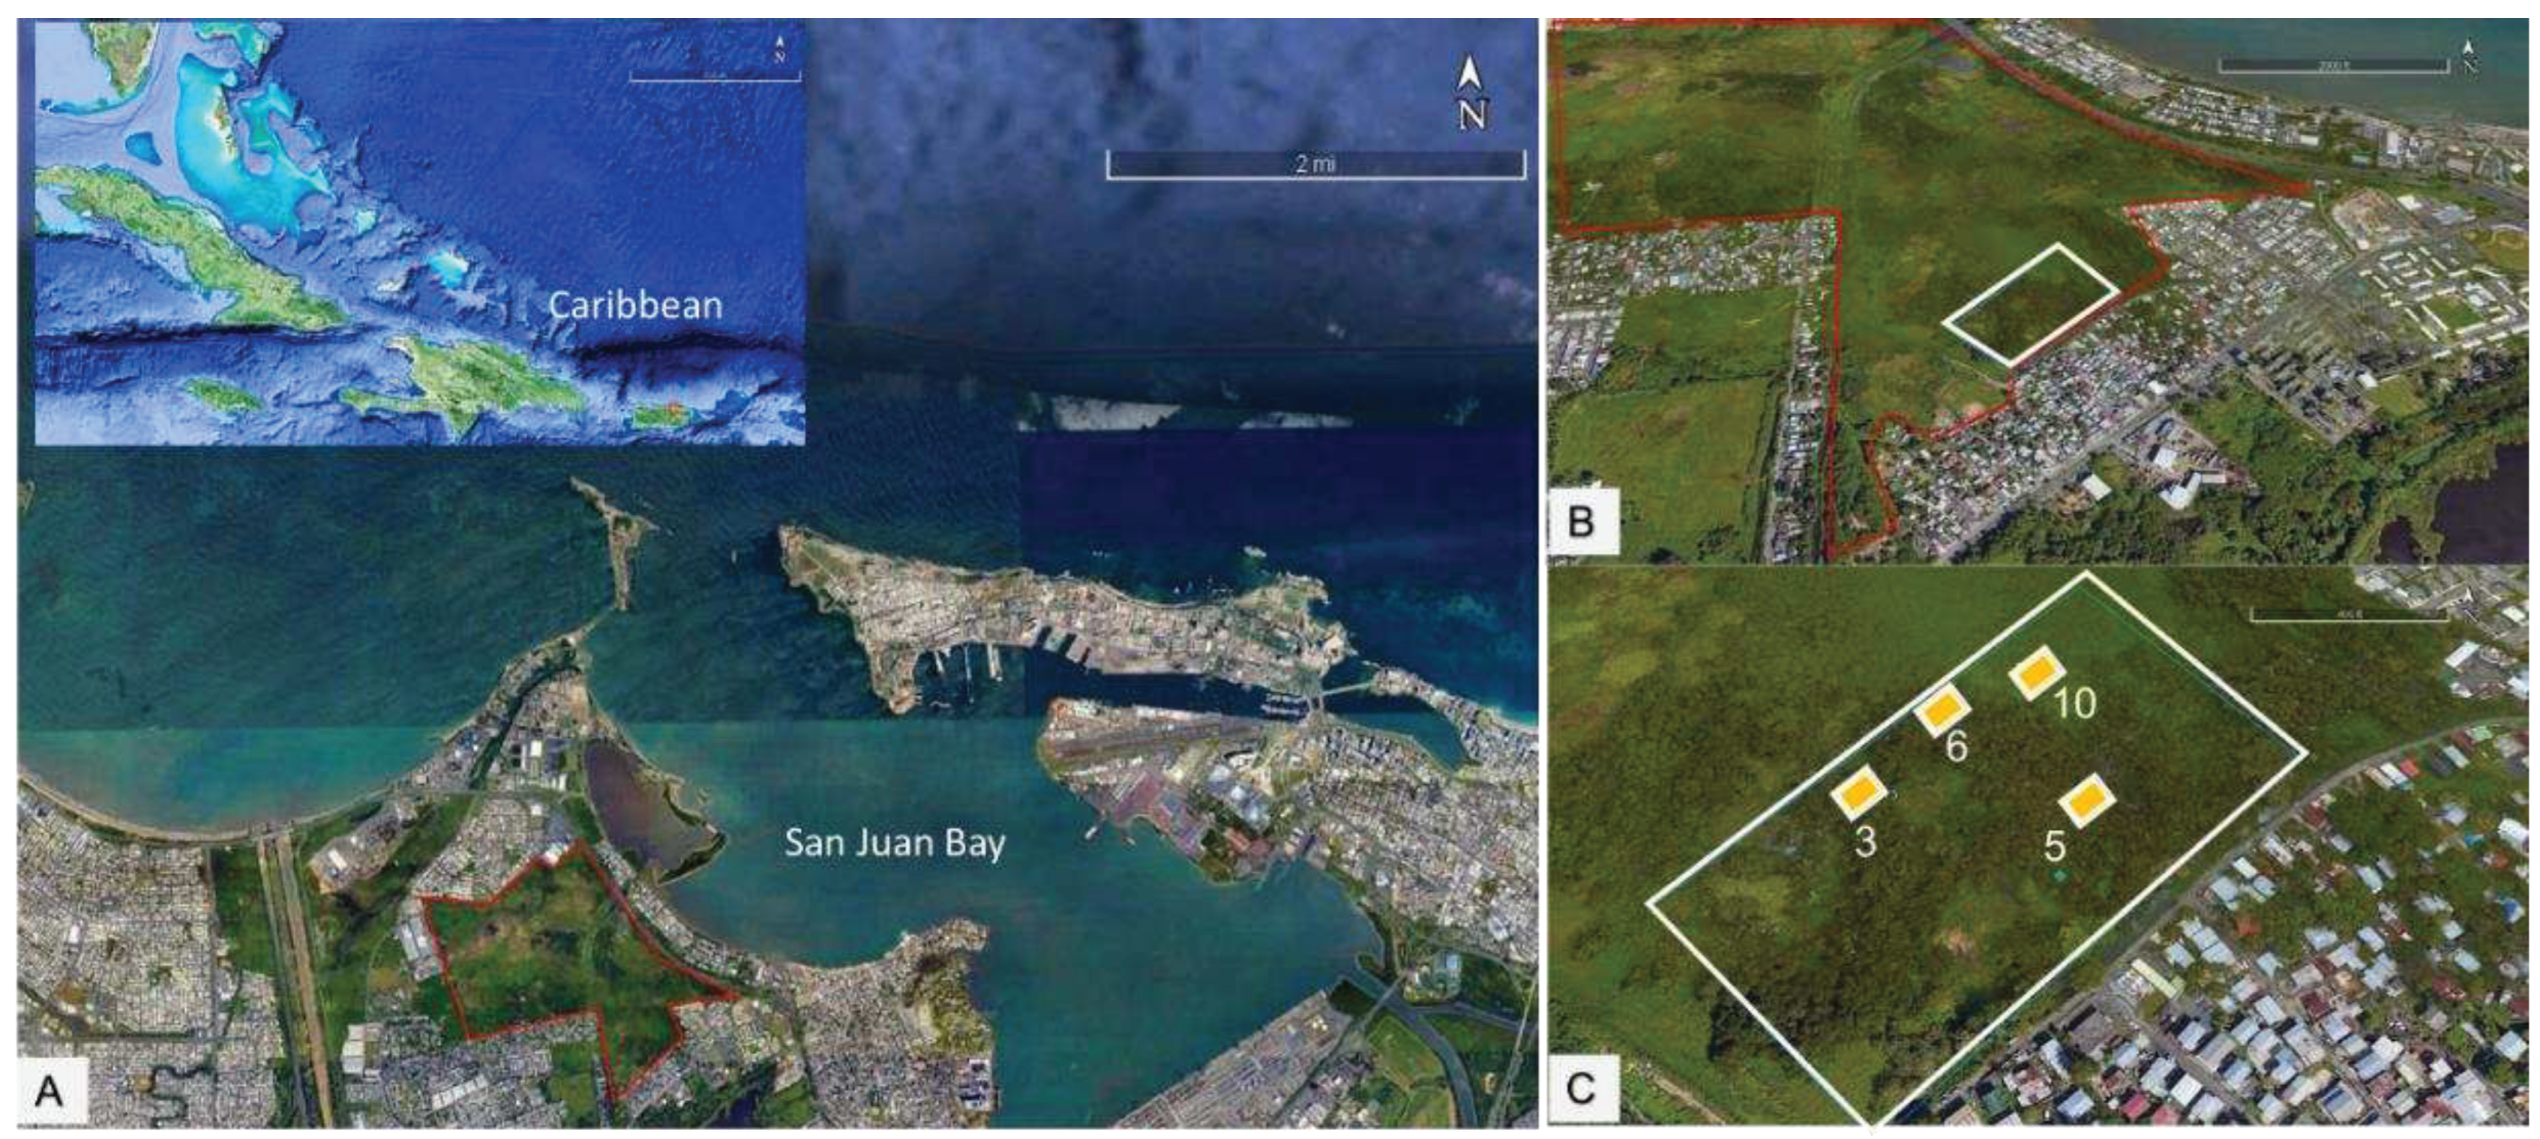
Figure 2.
A) Ciénaga las Cucharillas located in the northwestern side of the San Juan Bay, B) Study area (2.2ha), and C) Study Plots 3, 5, 10 and 6.
Figure 2.
A) Ciénaga las Cucharillas located in the northwestern side of the San Juan Bay, B) Study area (2.2ha), and C) Study Plots 3, 5, 10 and 6.
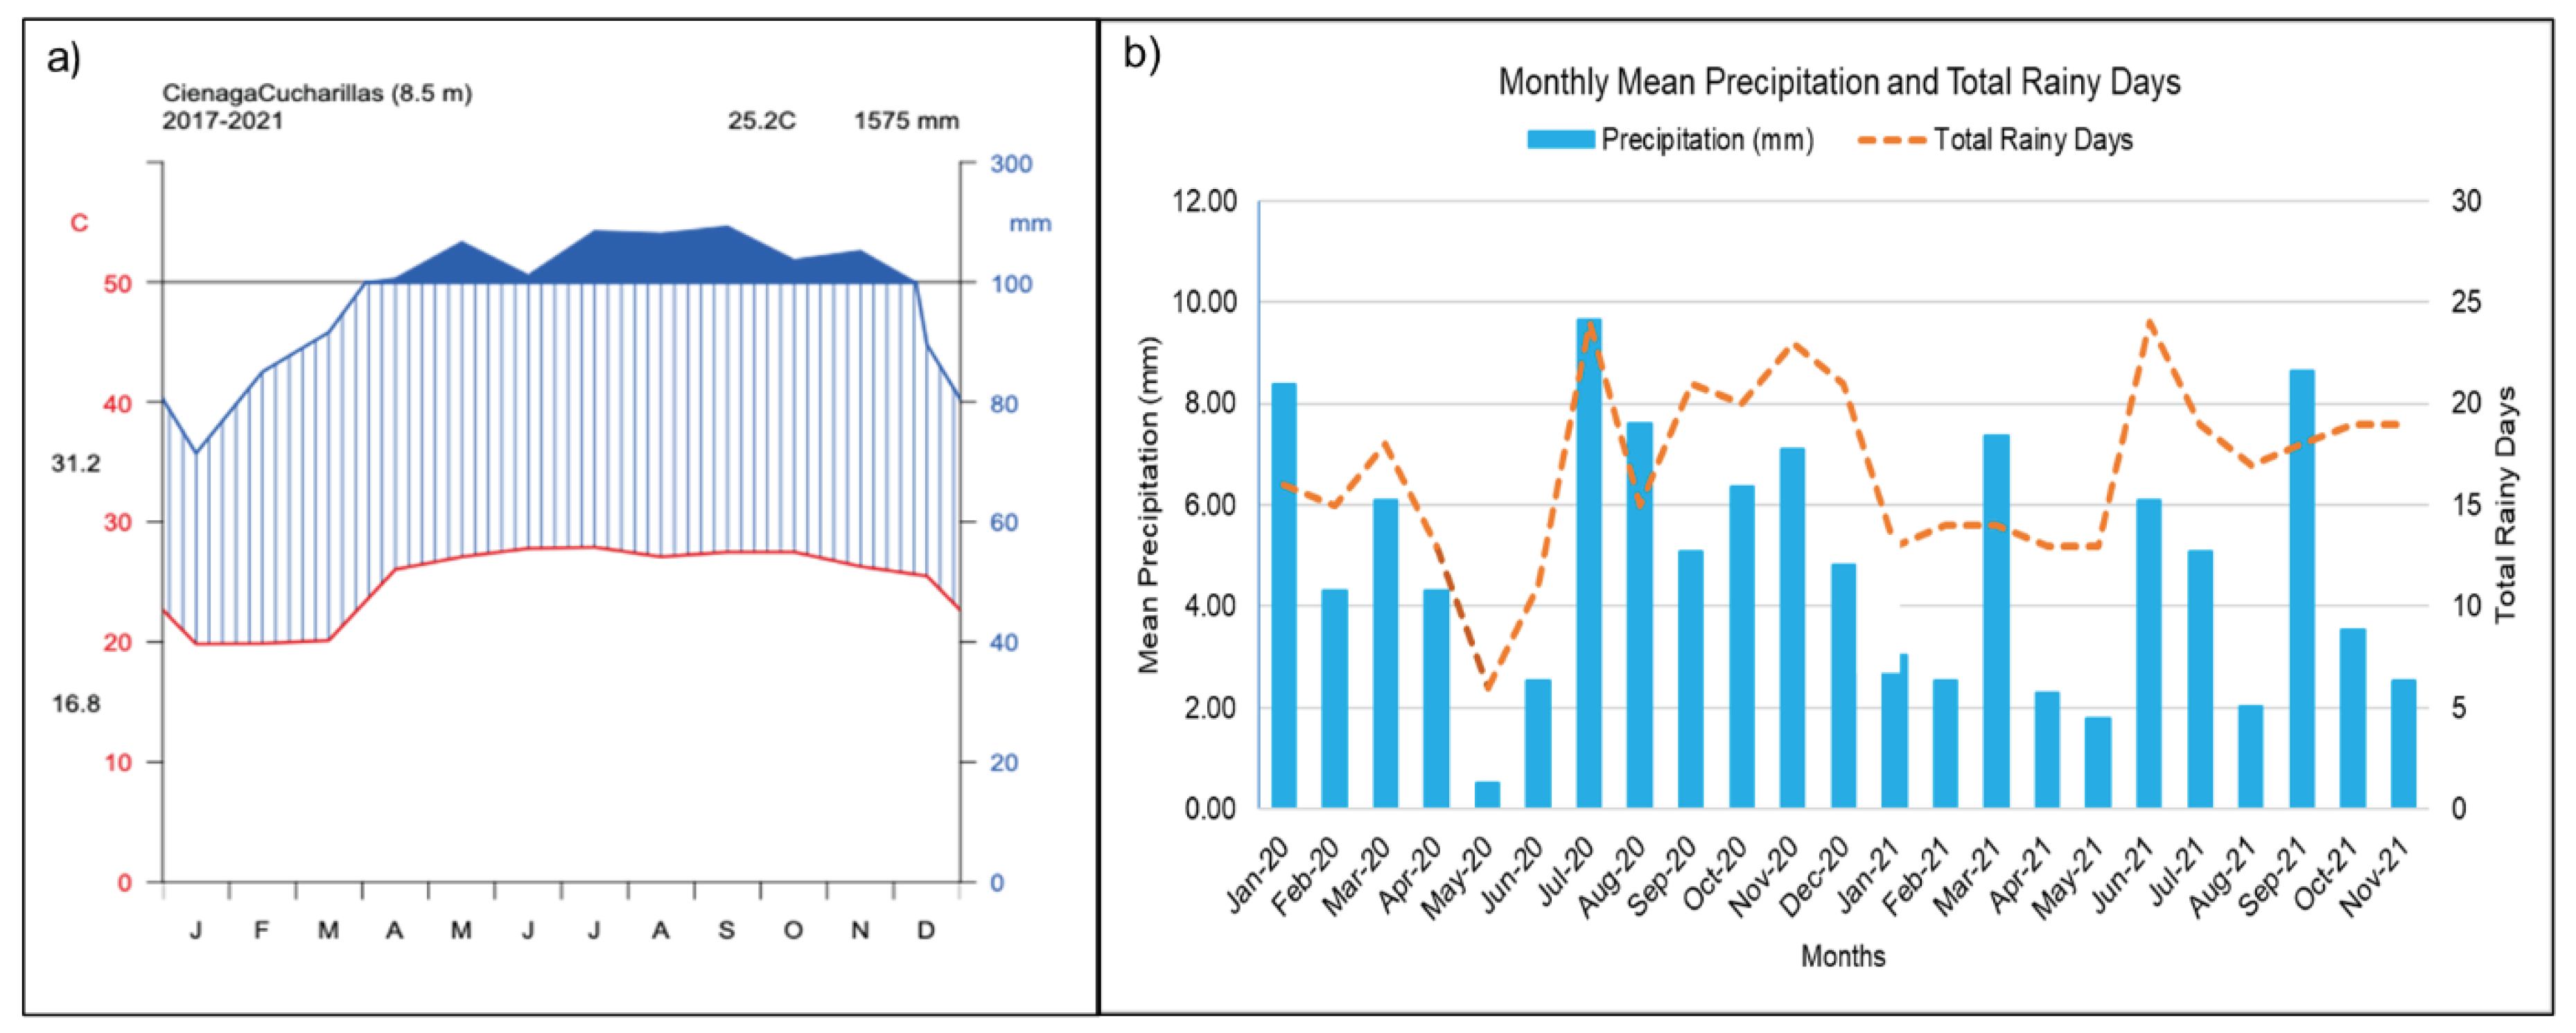
Figure 3.
a) Climate diagram of the study area; b) Mean monthly precipitation and total rainy days (January 2020 - November 2021) climatological data for Toa Baja Levittown, PR Meteorological Station (NOAA National Weather Service, 2021).
Figure 3.
a) Climate diagram of the study area; b) Mean monthly precipitation and total rainy days (January 2020 - November 2021) climatological data for Toa Baja Levittown, PR Meteorological Station (NOAA National Weather Service, 2021).
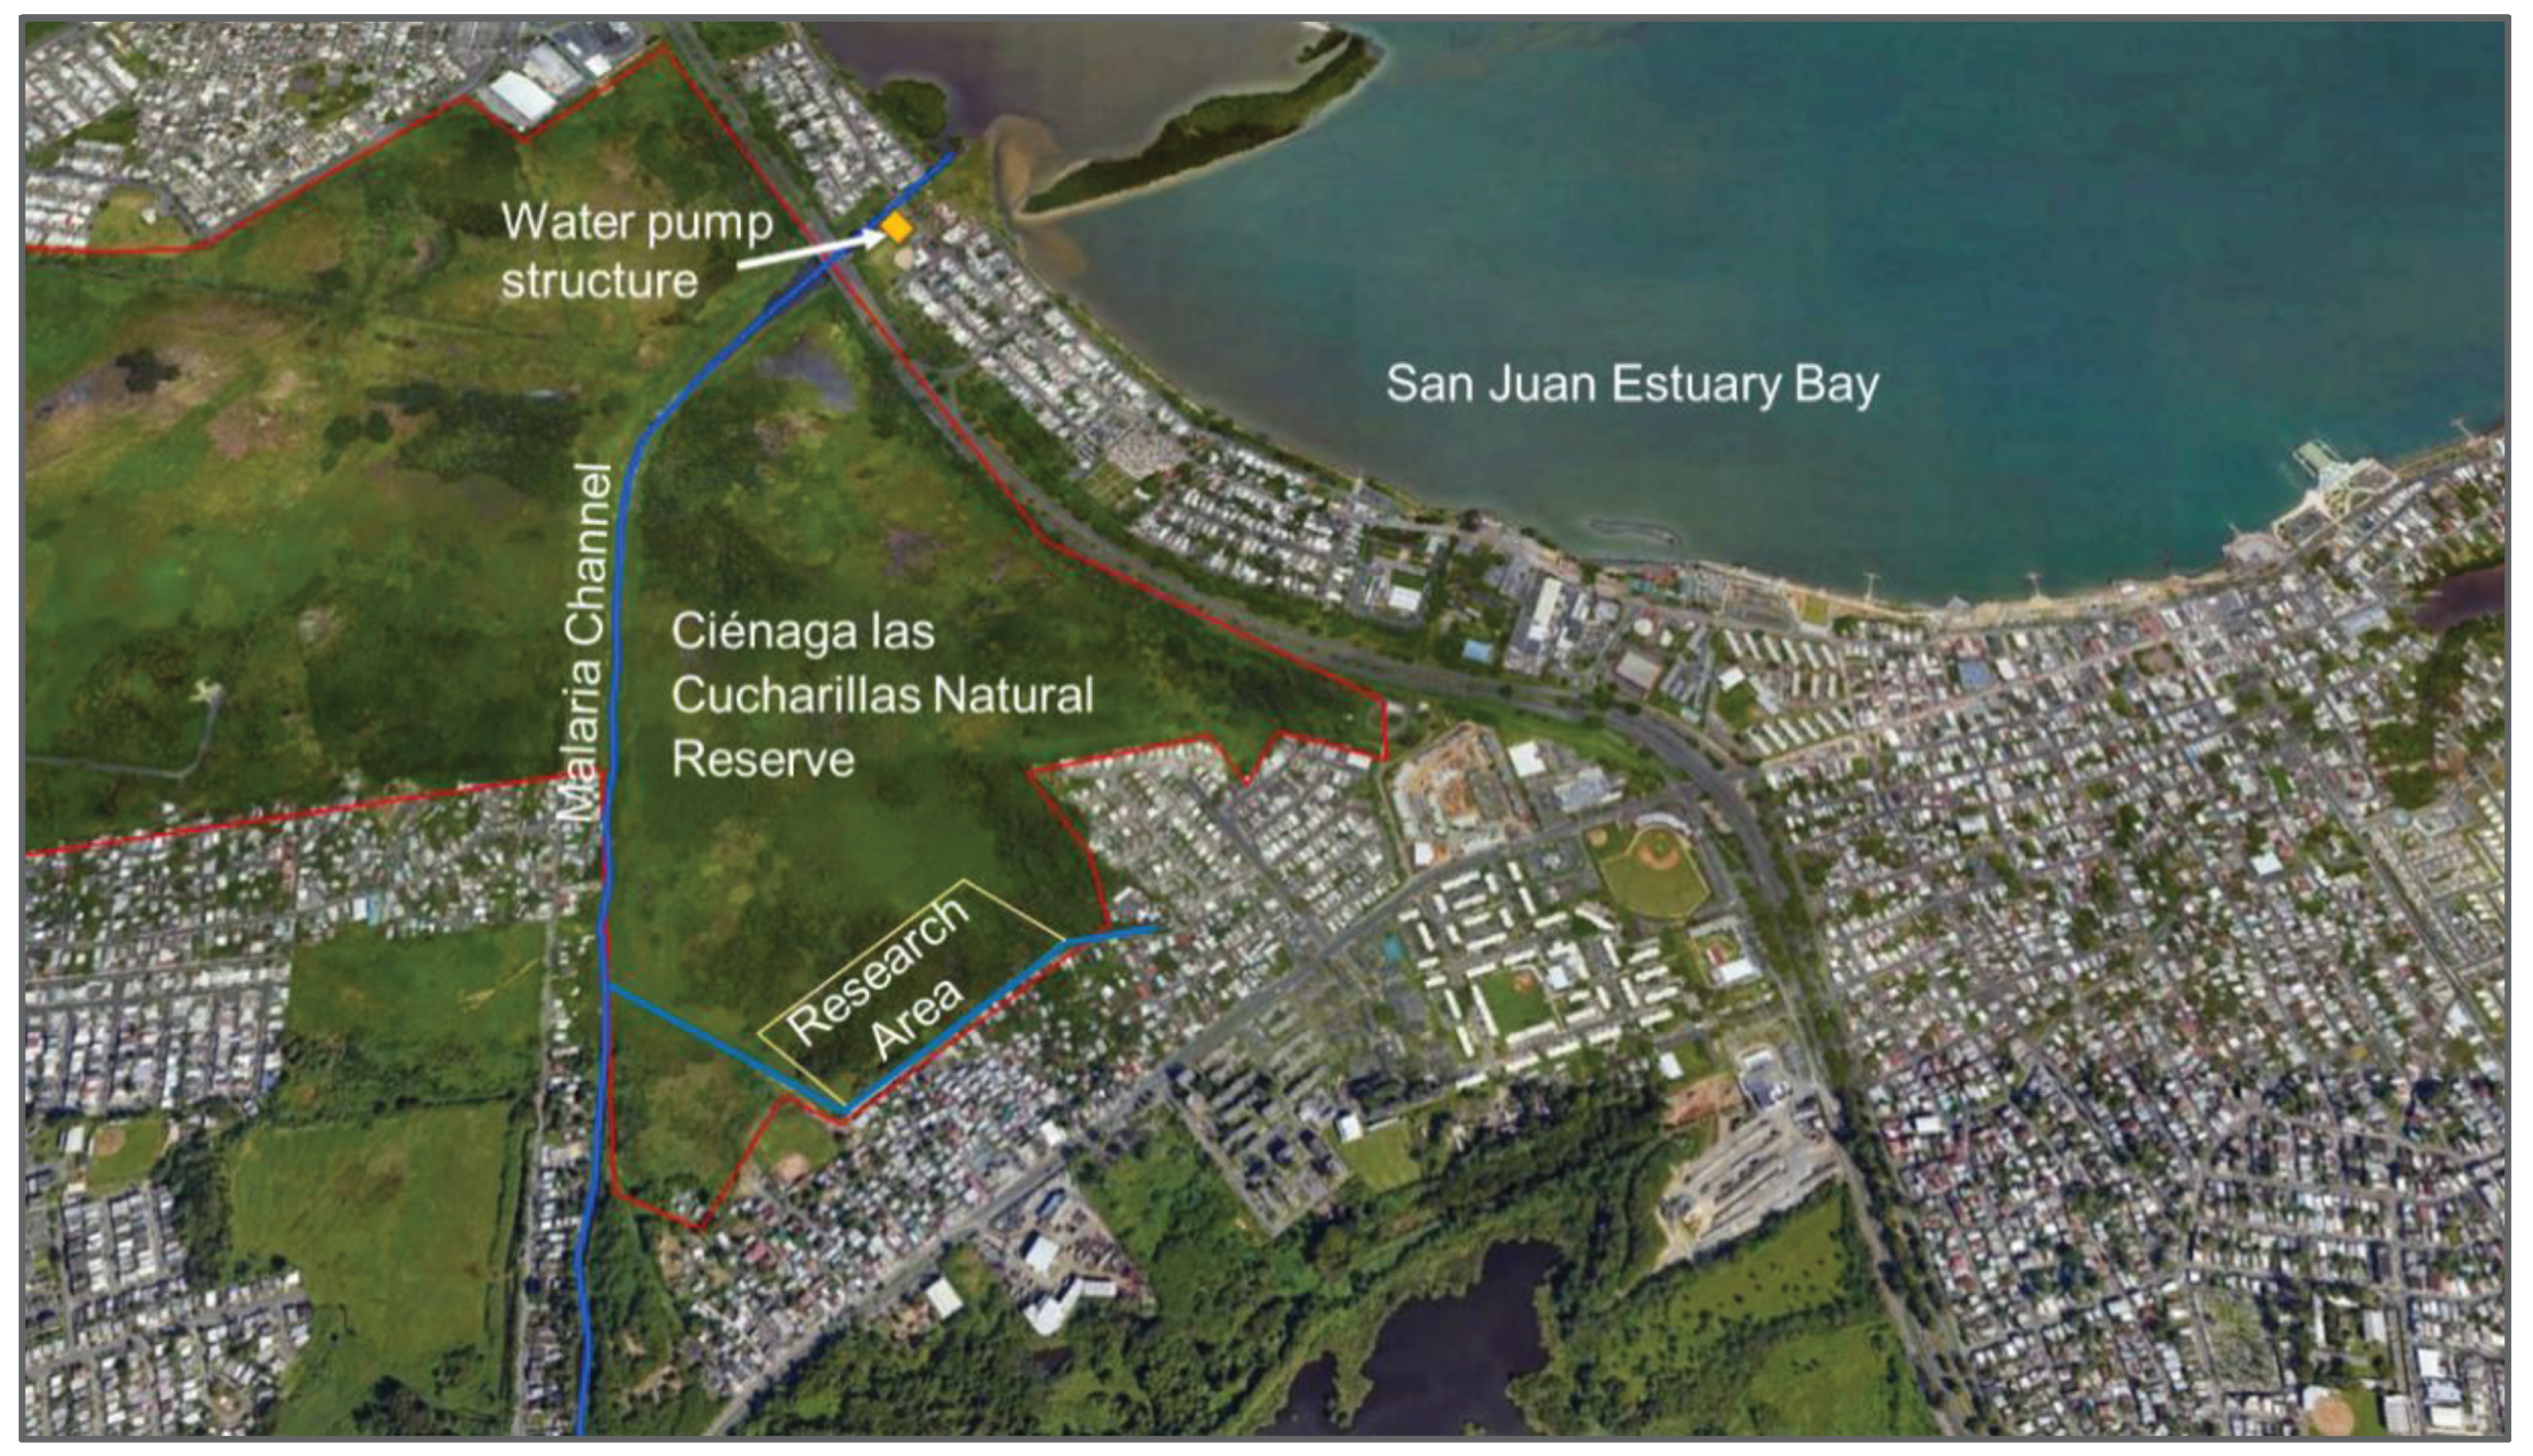
Figure 4.
La Malaria flood control channel, located northwest of the research area, and the outflow water pump structure at the mouth of the channel.
Figure 4.
La Malaria flood control channel, located northwest of the research area, and the outflow water pump structure at the mouth of the channel.
Figure 5.
Schematic diagram of hydroperiod condition on sampling date, total rainy days (cm) and mean phreatic level (m) 14 days before and at the sampling date. These variations strongly influenced litter system patterns at the sampling date.
Figure 5.
Schematic diagram of hydroperiod condition on sampling date, total rainy days (cm) and mean phreatic level (m) 14 days before and at the sampling date. These variations strongly influenced litter system patterns at the sampling date.
Figure 6.
Variations in salinity conditions correlated with hydroperiod phreatic level.
Figure 6.
Variations in salinity conditions correlated with hydroperiod phreatic level.
Figure 7.
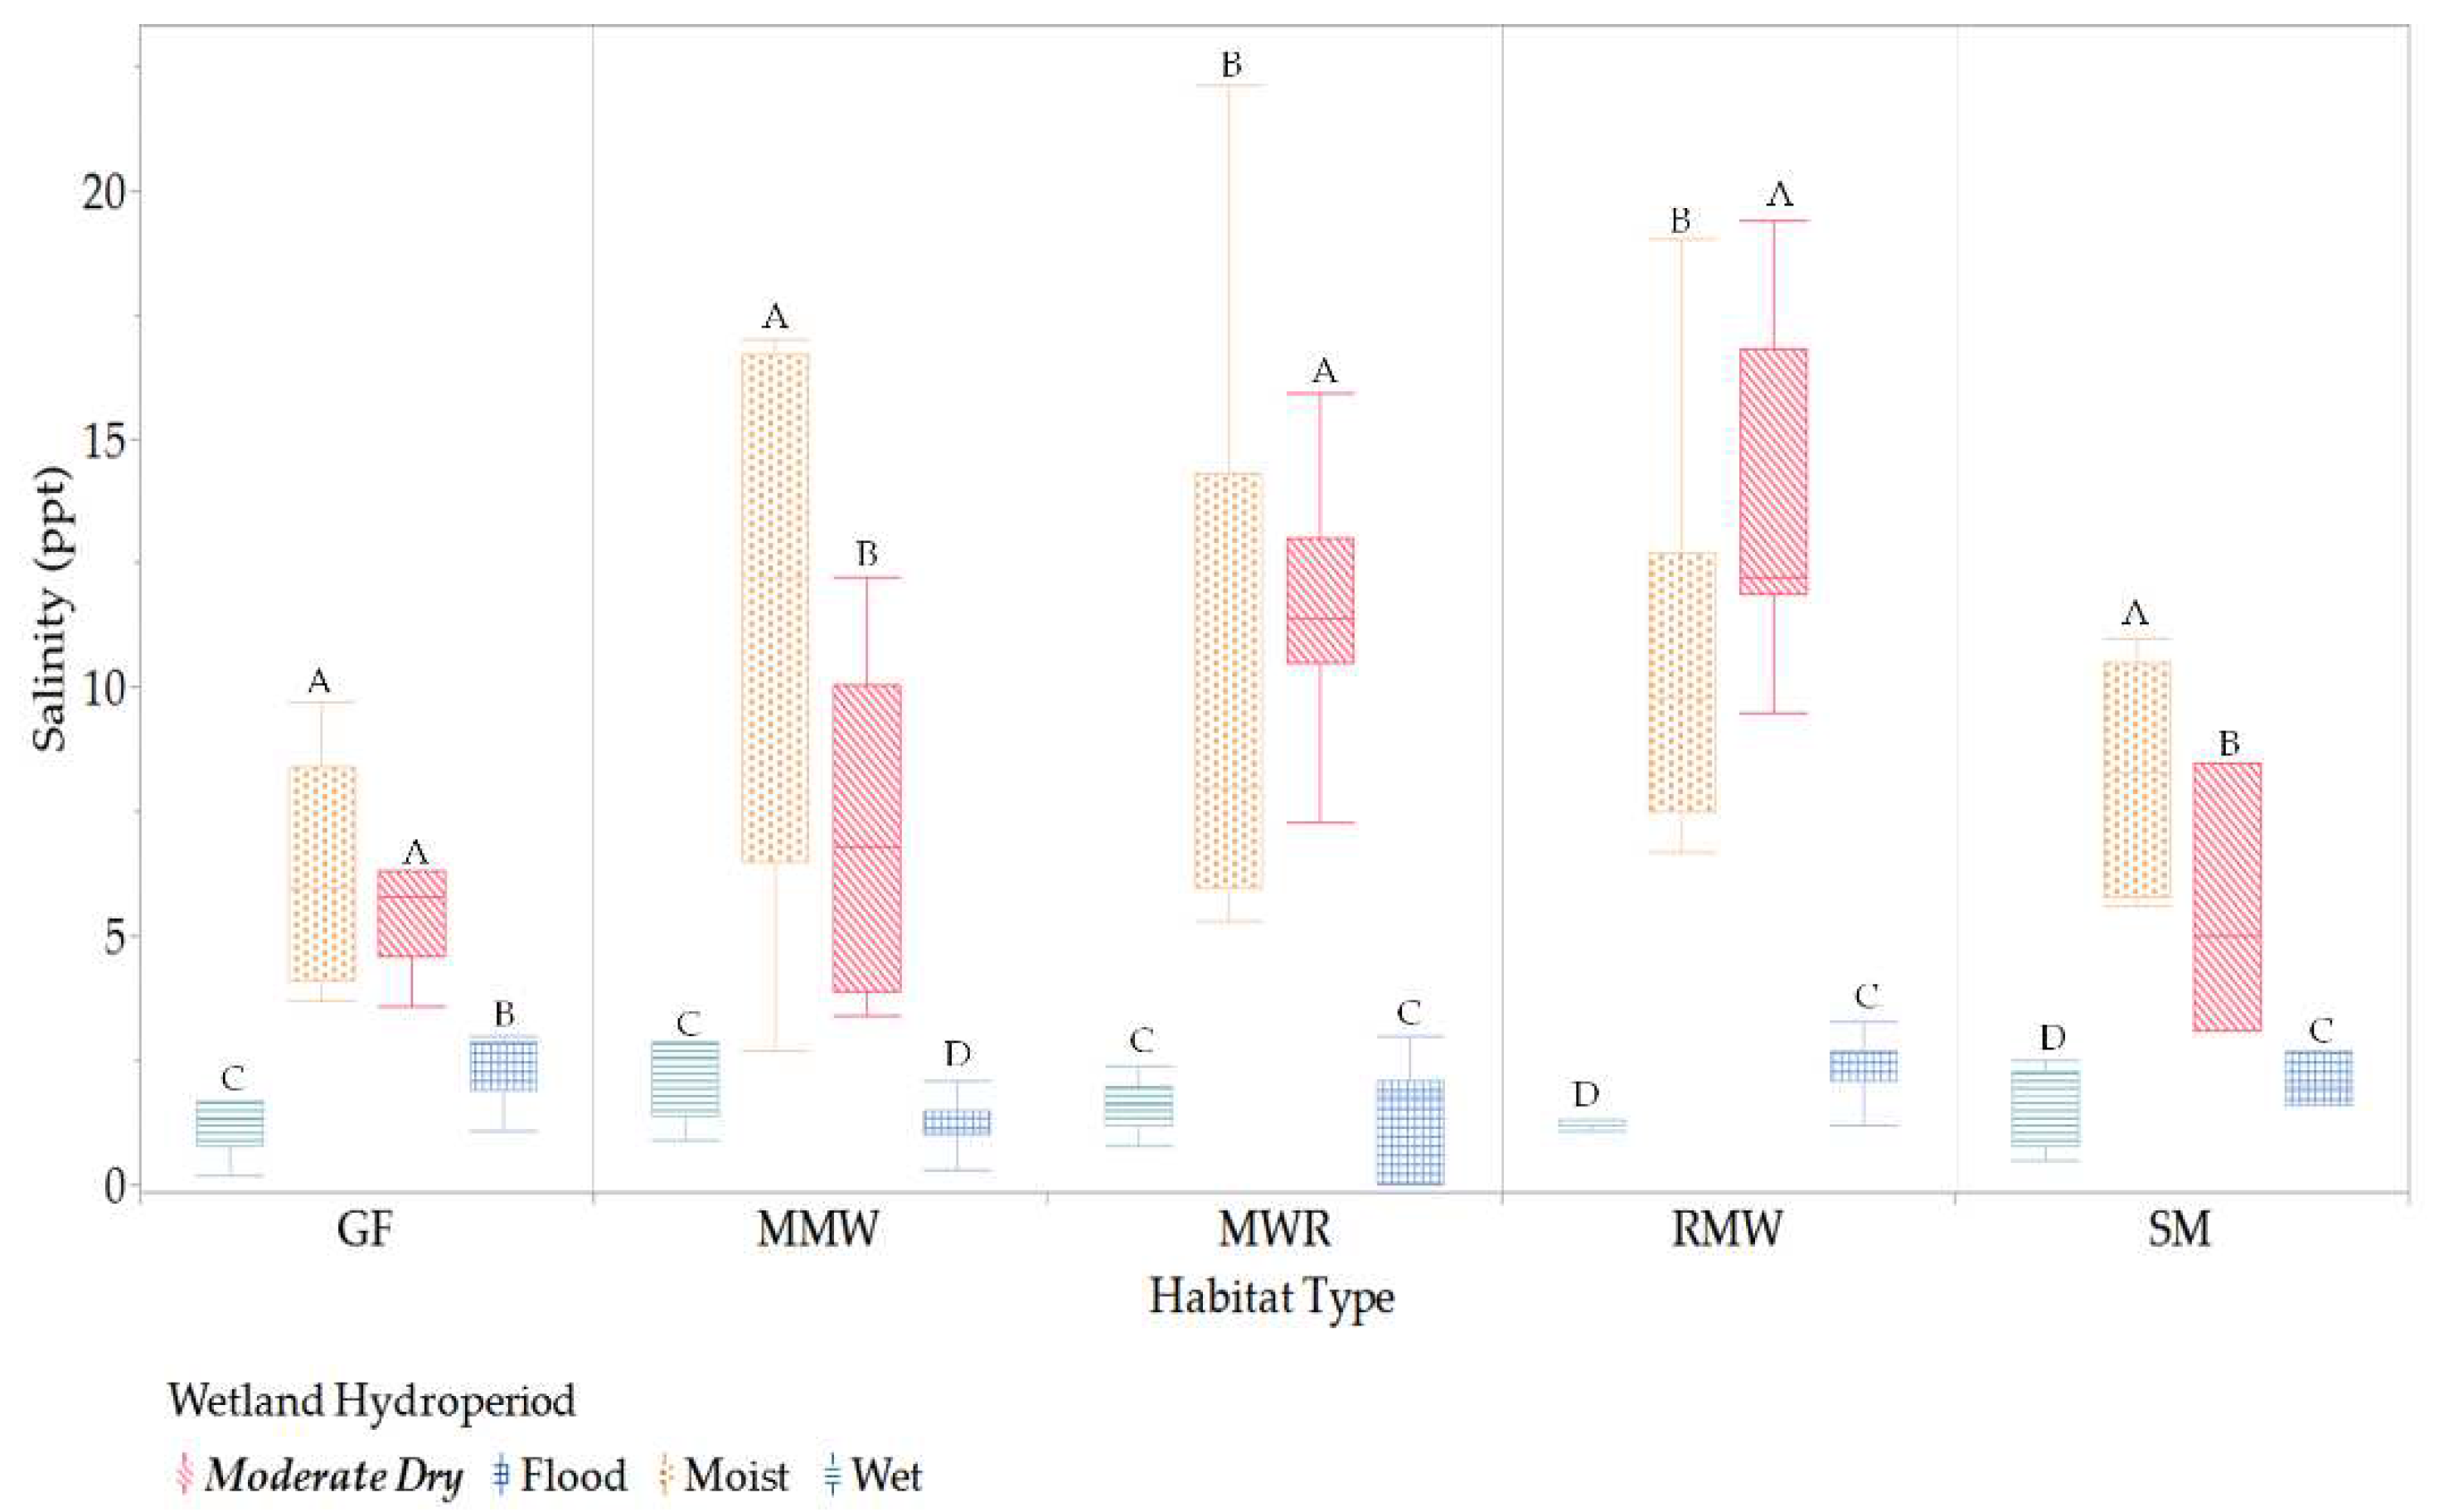
Significant differences of habitats salinity among hydroperiods. Values with different letters indicates means with significant differences (p<.05).
Figure 7.
Significant differences of habitats salinity among hydroperiods. Values with different letters indicates means with significant differences (p<.05).
Figure 8.
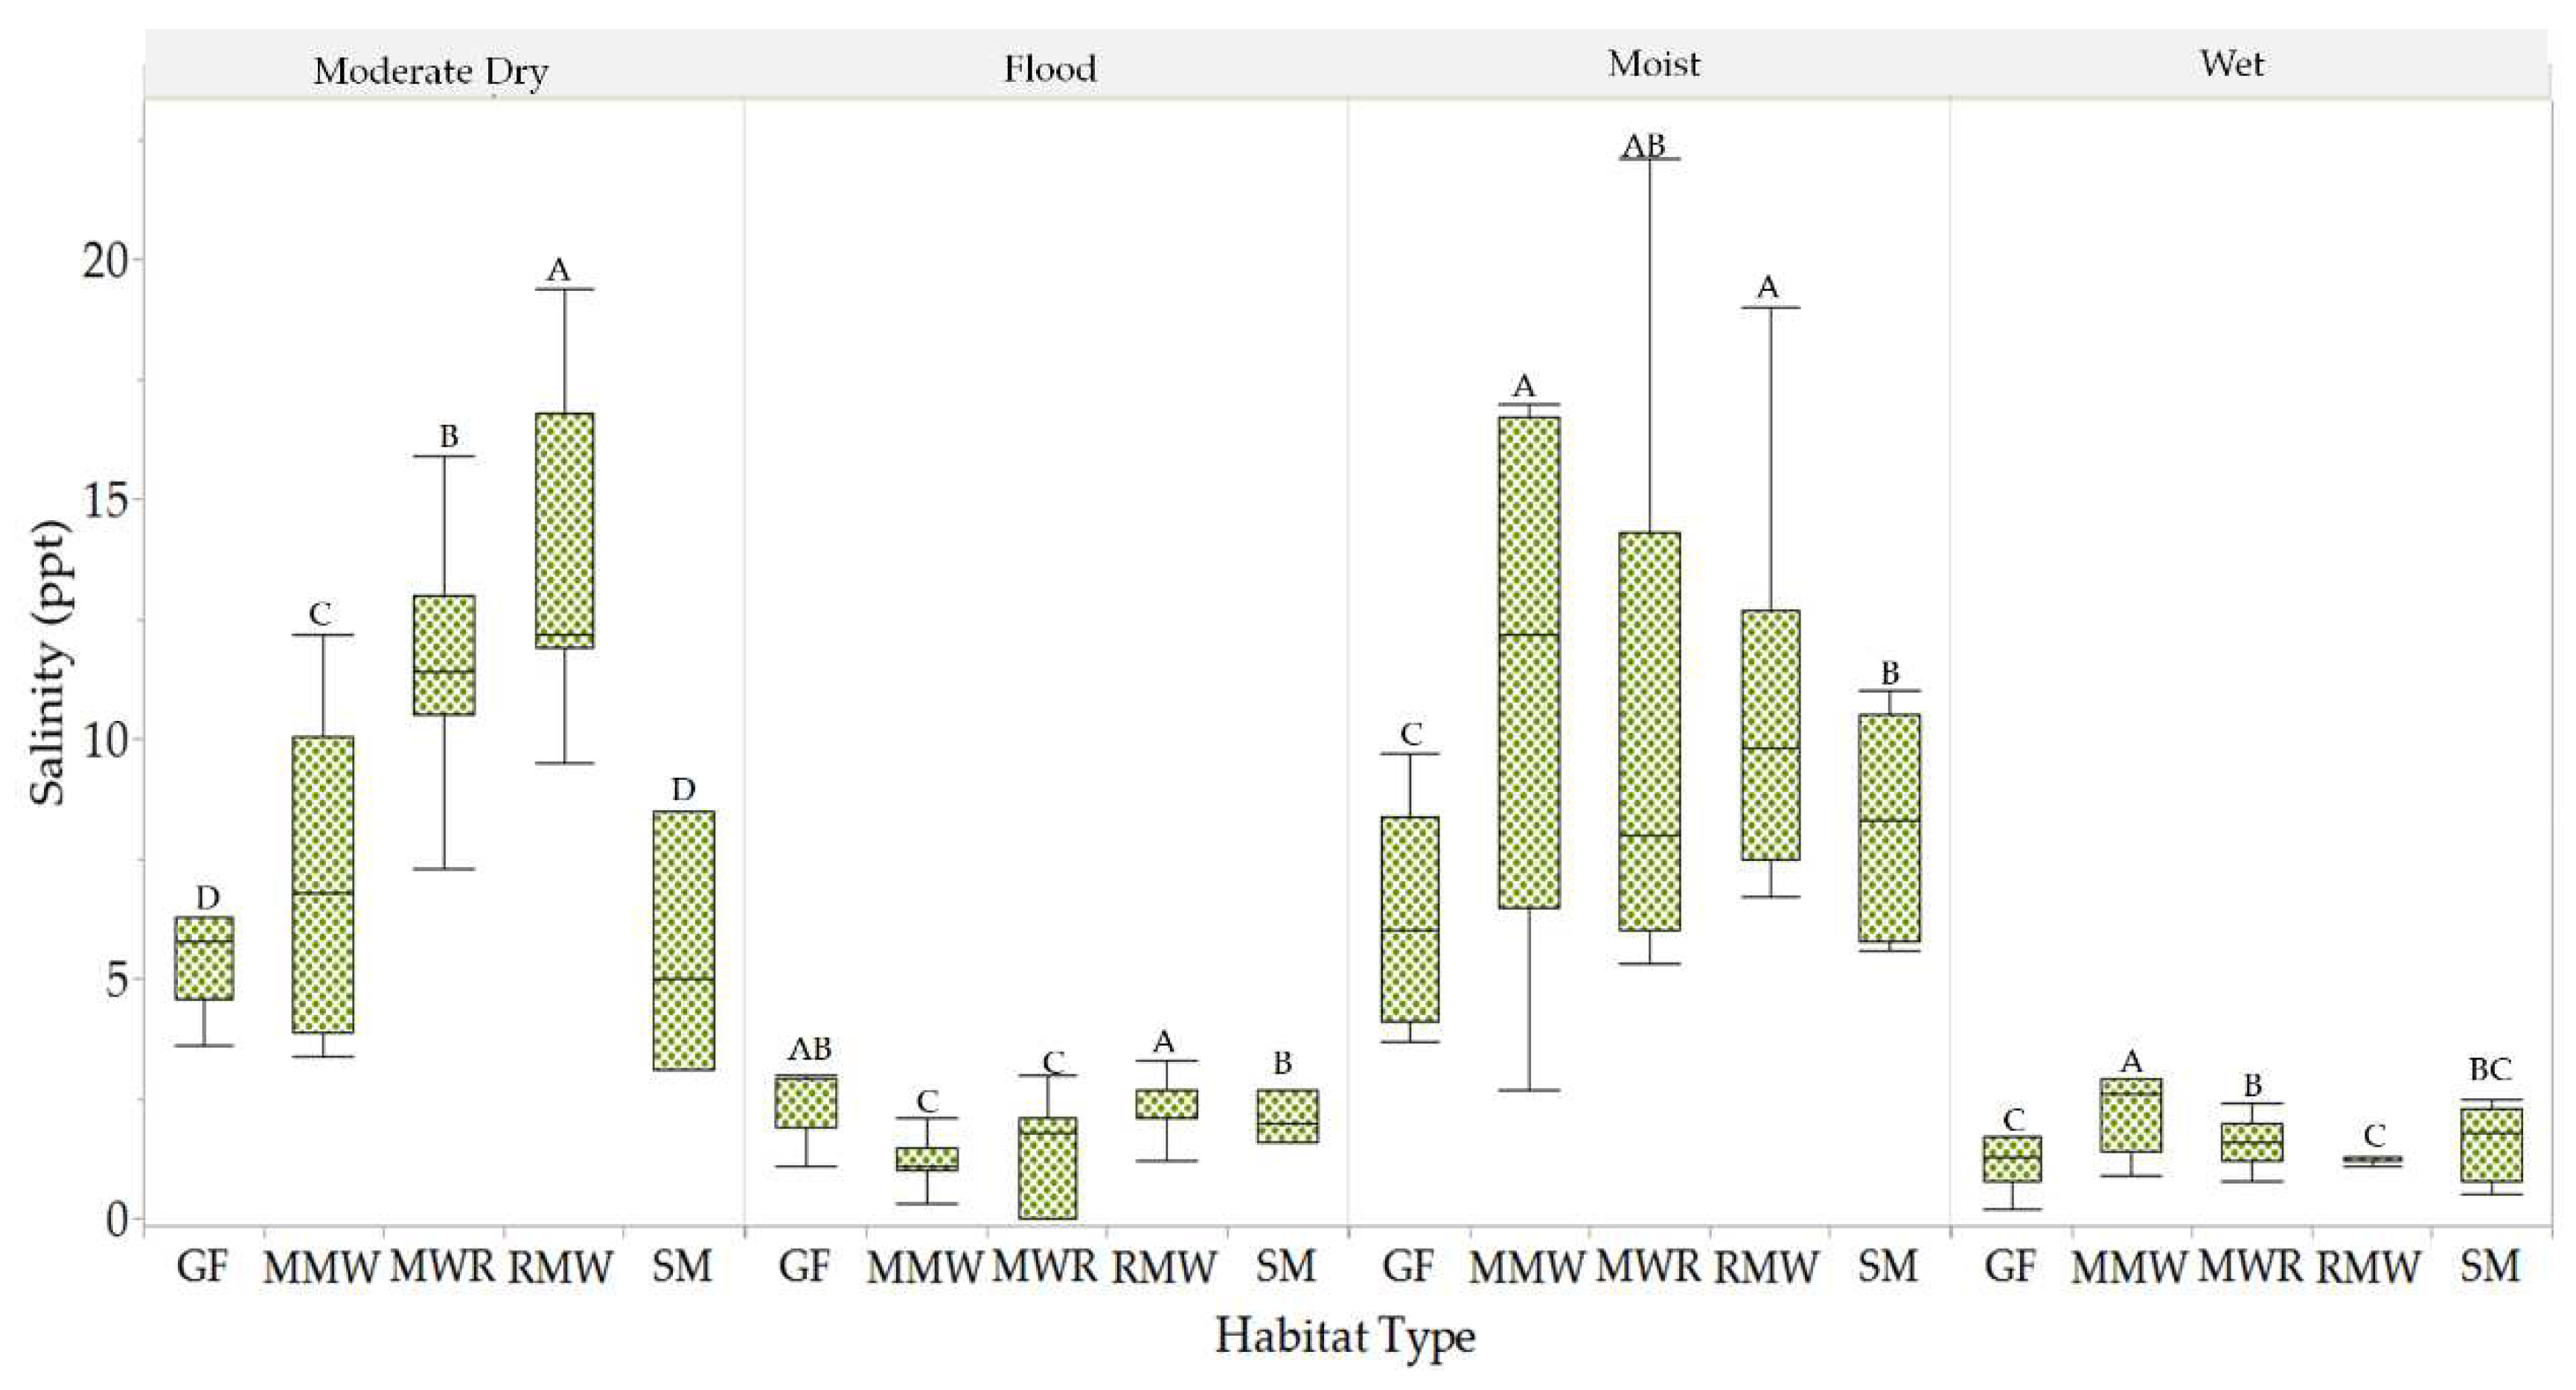
Significant differences between habitats salinity per hydroperiods. Values with different letters indicates means with significant differences (p<.05).
Figure 8.
Significant differences between habitats salinity per hydroperiods. Values with different letters indicates means with significant differences (p<.05).
Figure 9.
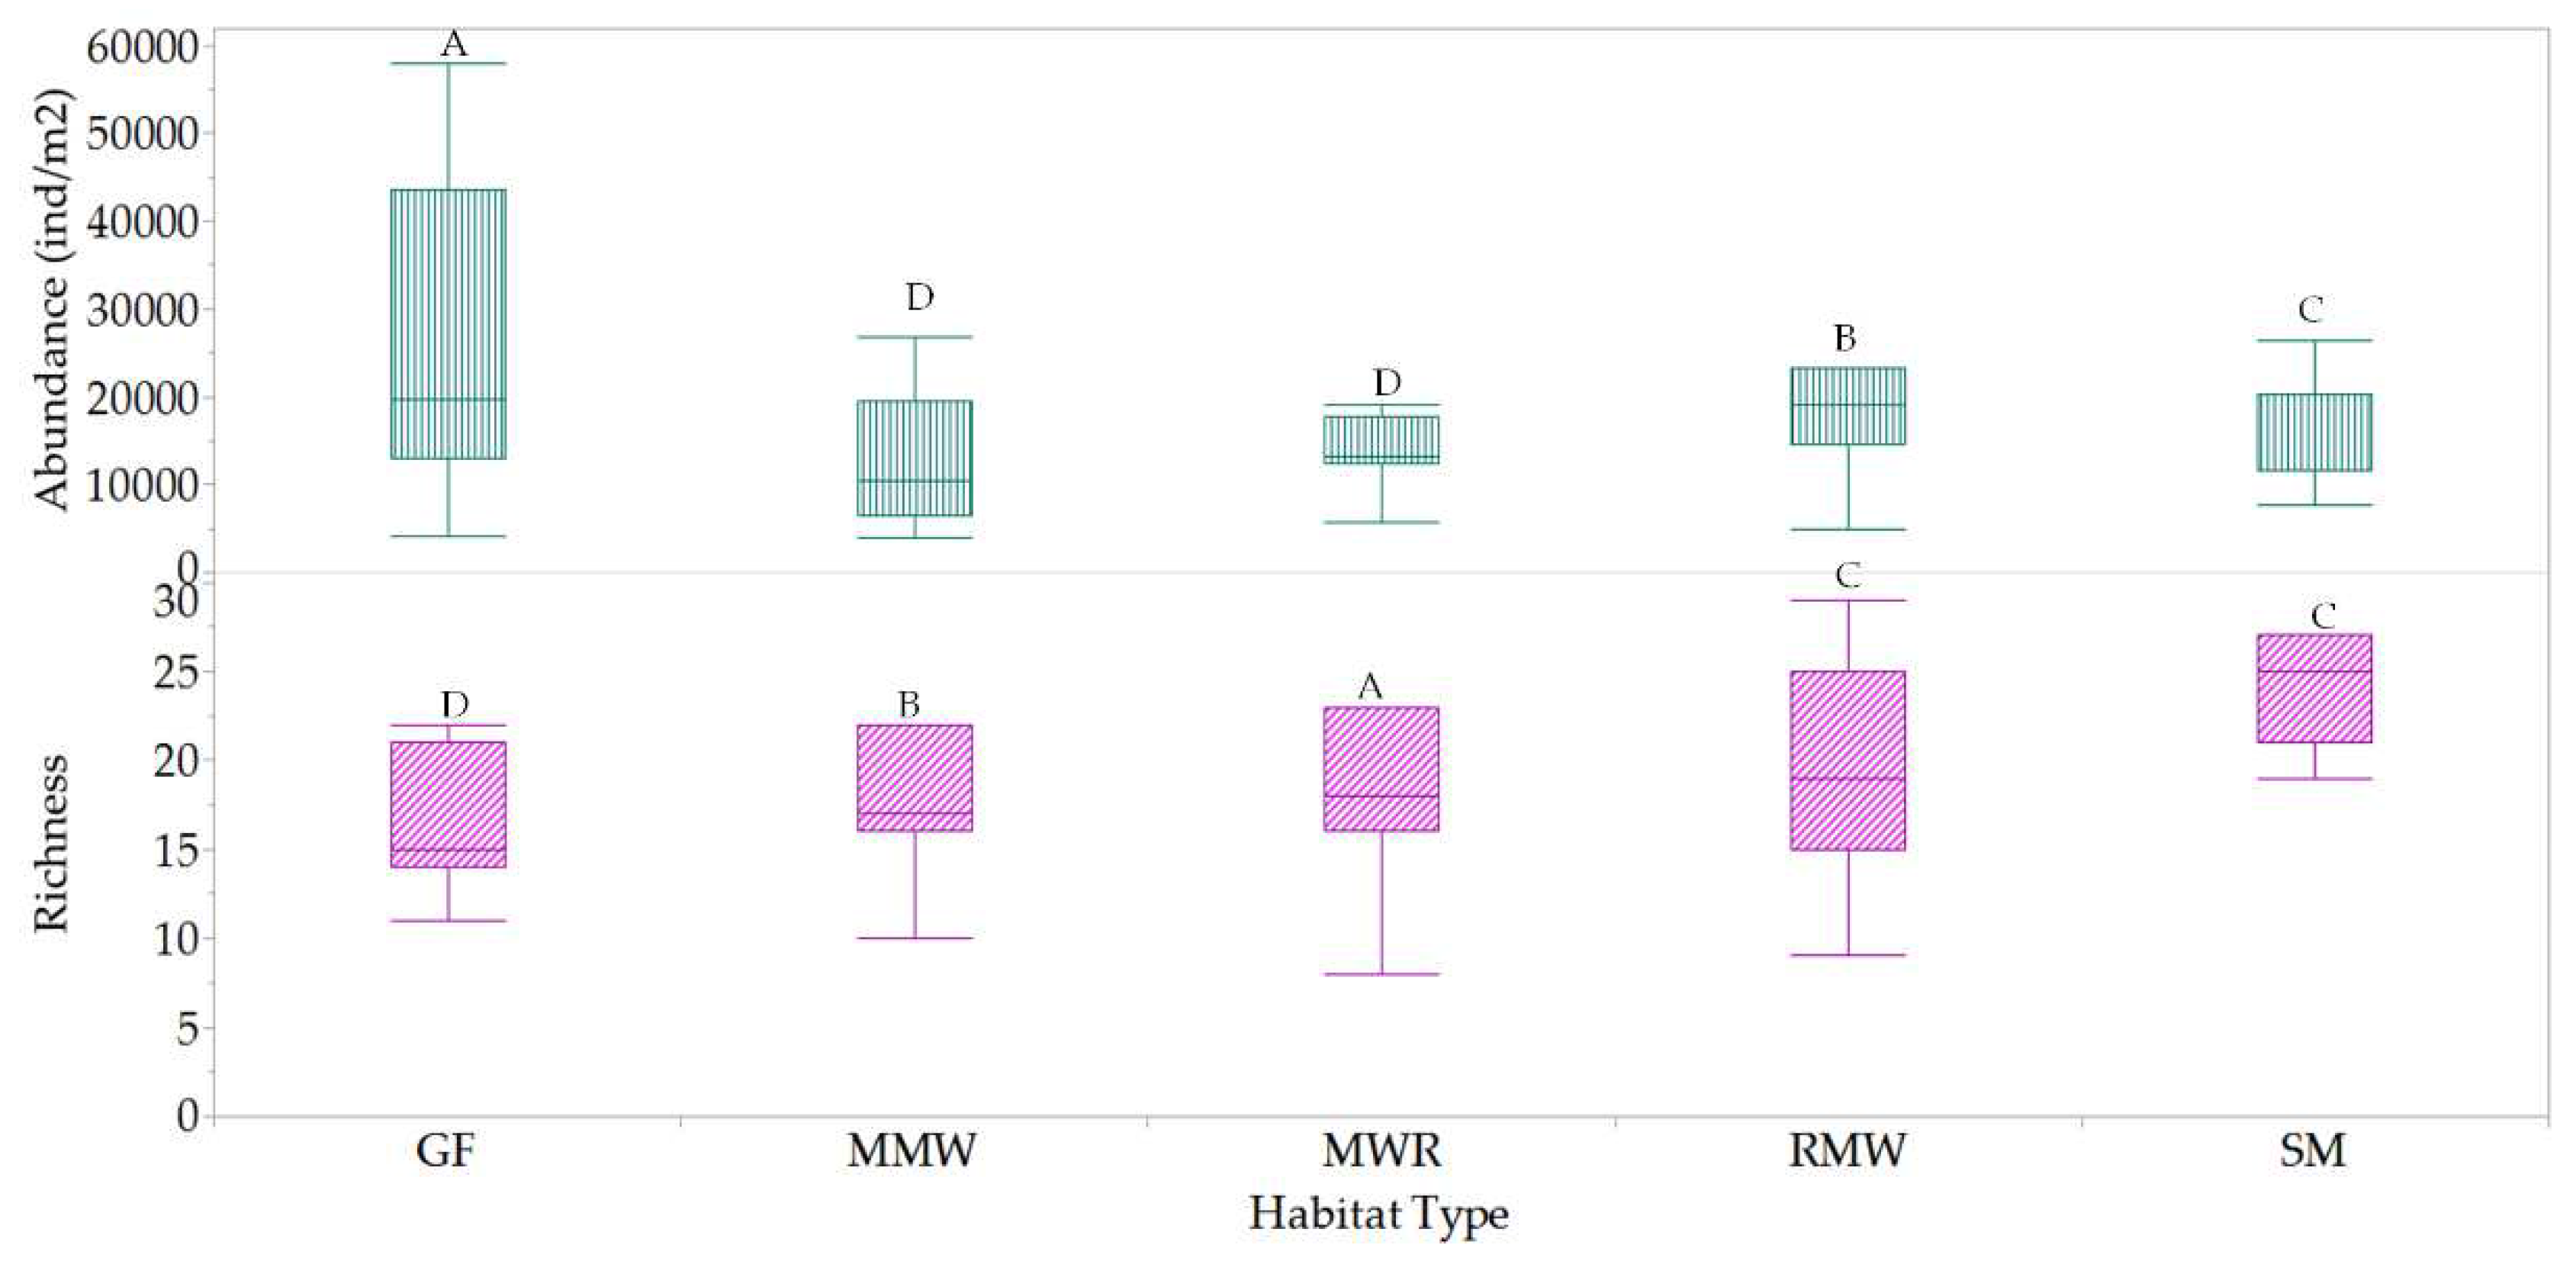
Significant differences in mesofauna richness and abundance between habitats. Values with different letters indicates means with significant differences (p<.05).
Figure 9.
Significant differences in mesofauna richness and abundance between habitats. Values with different letters indicates means with significant differences (p<.05).
Figure 10.
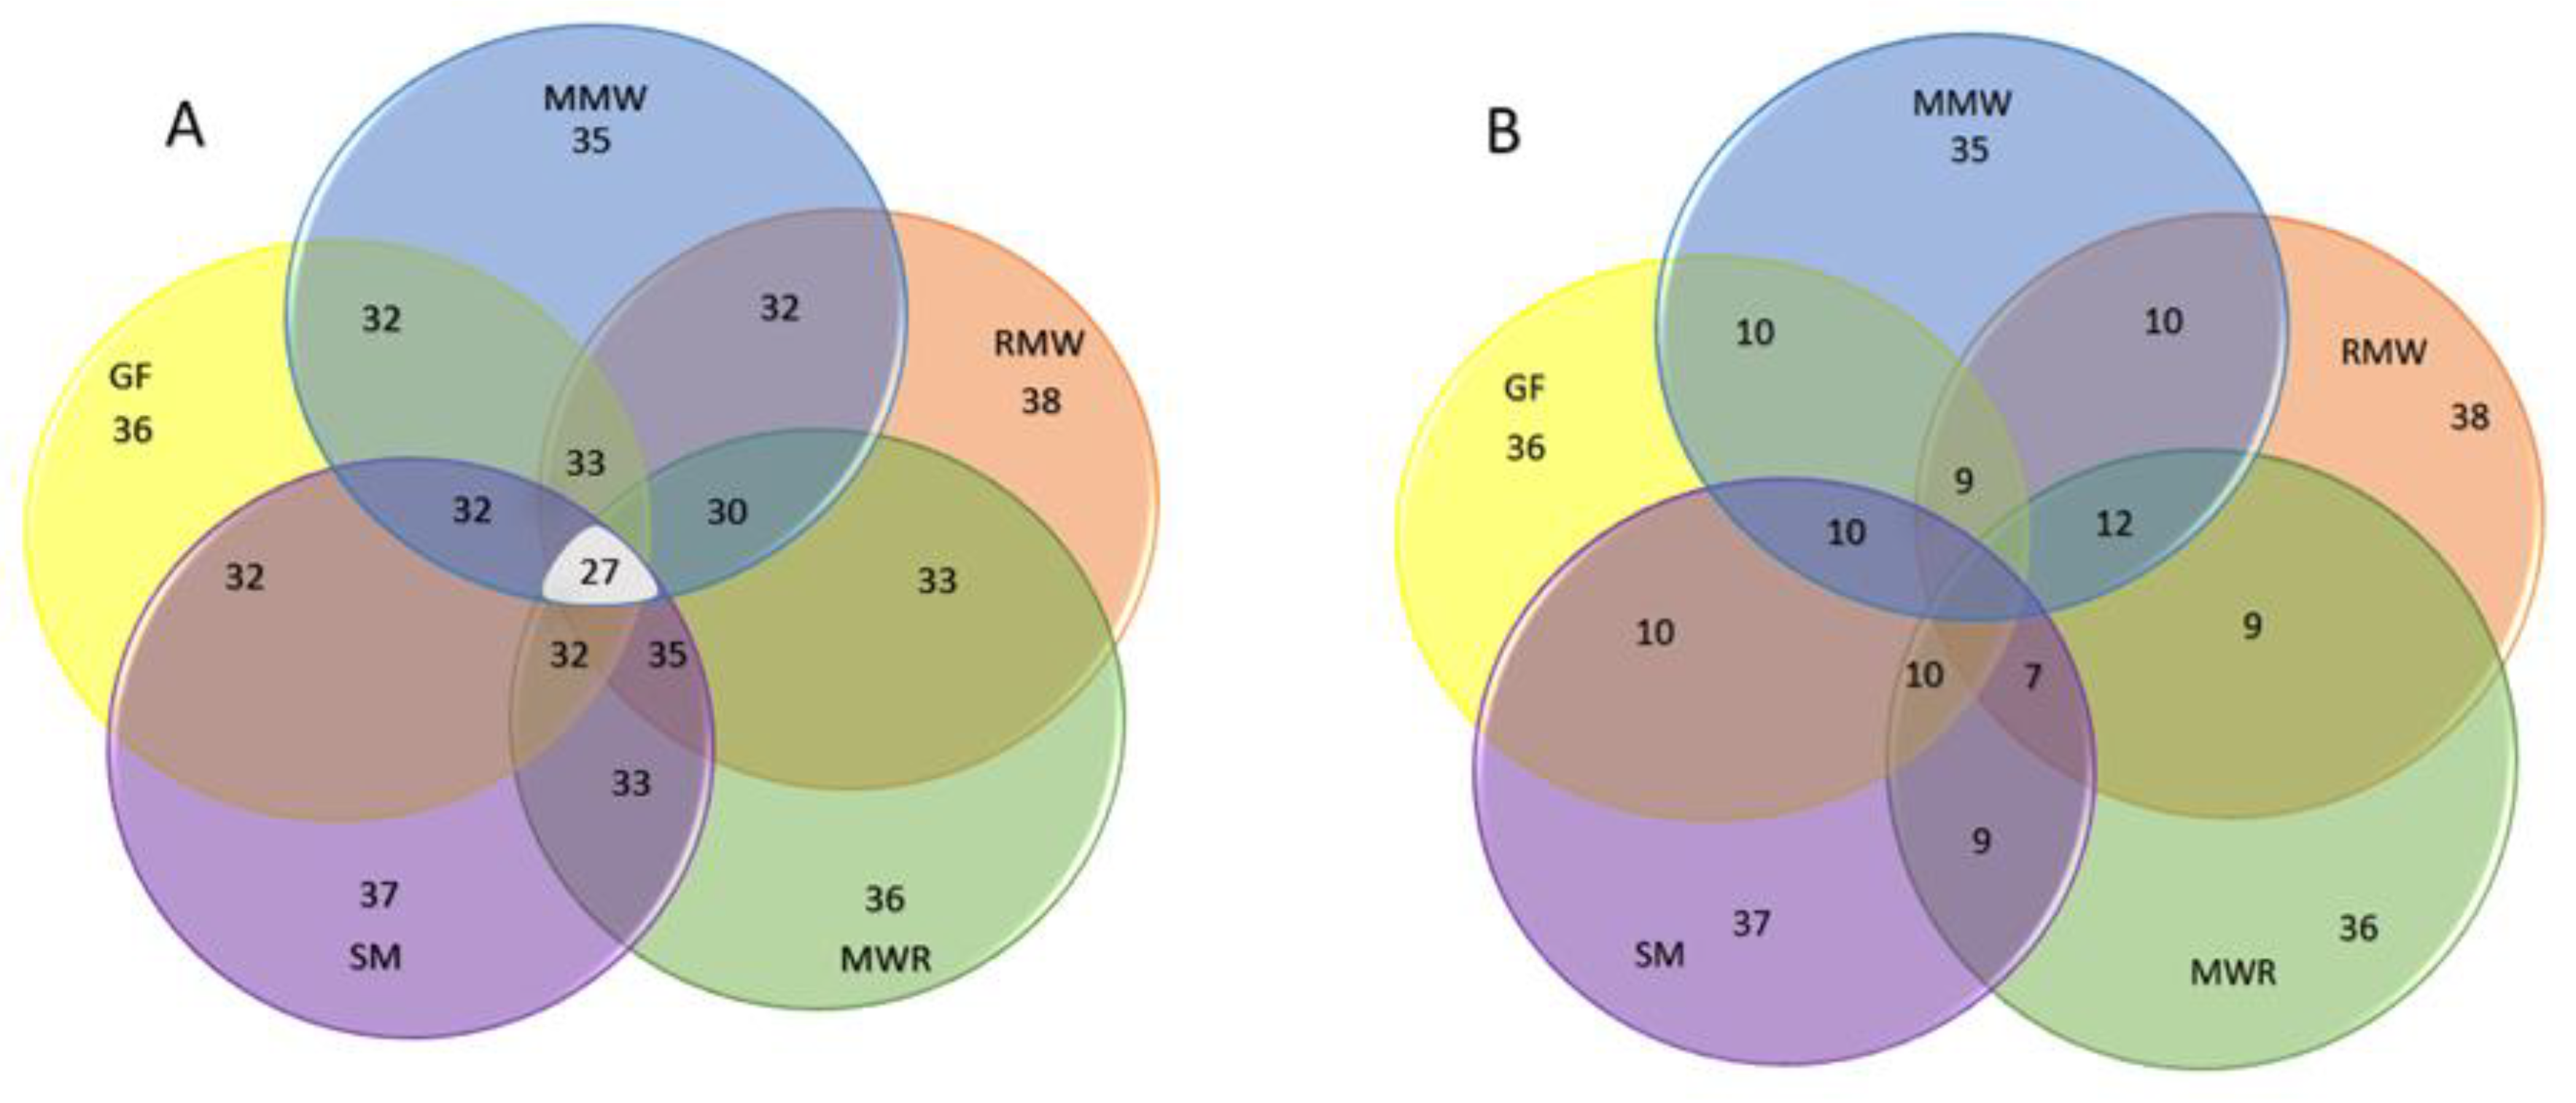
Venn diagram showing the number of A) shared and B) not shared taxa among habitat types.
Figure 10.
Venn diagram showing the number of A) shared and B) not shared taxa among habitat types.
Figure 11.
Mesofauna dominant, common, and rare taxa composition by habitat [
43].
Figure 11.
Mesofauna dominant, common, and rare taxa composition by habitat [
43].
Figure 12.
Statistical differences of mesofauna richness and abundance within habitats among hydroperiods. Values with different letters indicates means with significant differences (p<.05)].
Figure 12.
Statistical differences of mesofauna richness and abundance within habitats among hydroperiods. Values with different letters indicates means with significant differences (p<.05)].
Figure 13.
Statistical differences of mesofauna richness and abundance between habitats among hydroperiods. Values with different letters indicates means with significant differences (p<.05).
Figure 13.
Statistical differences of mesofauna richness and abundance between habitats among hydroperiods. Values with different letters indicates means with significant differences (p<.05).
Figure 14.
Variations of mesofauna taxa among hydroperiods. Green circles indicate taxa absent during the flood period. Yellow circles represent taxa absent during the moist period. Blue circles denote taxa absent during the wet period. Red circles correspond to taxa absent during both flood and moist periods. Pink circles signify taxa absent during both flood and moderate dry periods.
Figure 15.
Statistical differences of mesofauna richness and abundance within habitats among phreatic level categories. Values with different letters indicates means with significant differences (p<.05).
Figure 15.
Statistical differences of mesofauna richness and abundance within habitats among phreatic level categories. Values with different letters indicates means with significant differences (p<.05).
Figure 16.
Statistical differences of mesofauna richness and abundance between habitats among phreatic level categories. Values with different letters indicates means with significant differences (p<.05).
Figure 16.
Statistical differences of mesofauna richness and abundance between habitats among phreatic level categories. Values with different letters indicates means with significant differences (p<.05).
Figure 17.
Distribution and habitat preferences of different mesofauna taxa in various phreatic environments. In this figure, different colored circles represent the presence or absence of various taxa at different phreatic levels: Blue-green circles: Taxa absent in high and slightly moderate phreatic levels. Yellow circles: Taxa exclusively present in slightly moderate and moderate conditions. Dark blue circles: Taxa absent in high phreatic levels, characterized by flooded conditions. Light blue circles: Taxa absent in high and near-surface phreatic levels, typically associated with flood or waterlogged conditions. Orange circles: Taxa absent in both moderate and significantly deep phreatic levels, which are known for drier conditions. Purple circles: Taxa absent in environments with high to significantly deep phreatic levels, indicative of extreme conditions. Grey circles: Taxa absent in near-surface phreatic levels.
Figure 18.
Statistical differences of mesofauna richness and abundance within habitats among salinity conditions. Values with different letters indicates means with significant differences (p<.05).
Figure 18.
Statistical differences of mesofauna richness and abundance within habitats among salinity conditions. Values with different letters indicates means with significant differences (p<.05).
Figure 19.
Statistical differences of habitats mesofauna richness and abundance among salinity conditions. Values with different letters indicates means with significant differences (p<.05).
Figure 19.
Statistical differences of habitats mesofauna richness and abundance among salinity conditions. Values with different letters indicates means with significant differences (p<.05).
Figure 20.
Variations of mesofauna taxa among salinity conditions. Green circles represent taxa: exclusive to oligohaline salinities. Yellow circles indicate taxa tolerant of freshwater and polyhaline conditions. Blue circles correspond to taxa found at freshwater salinities. Red circles are taxa present in polyhaline conditions.
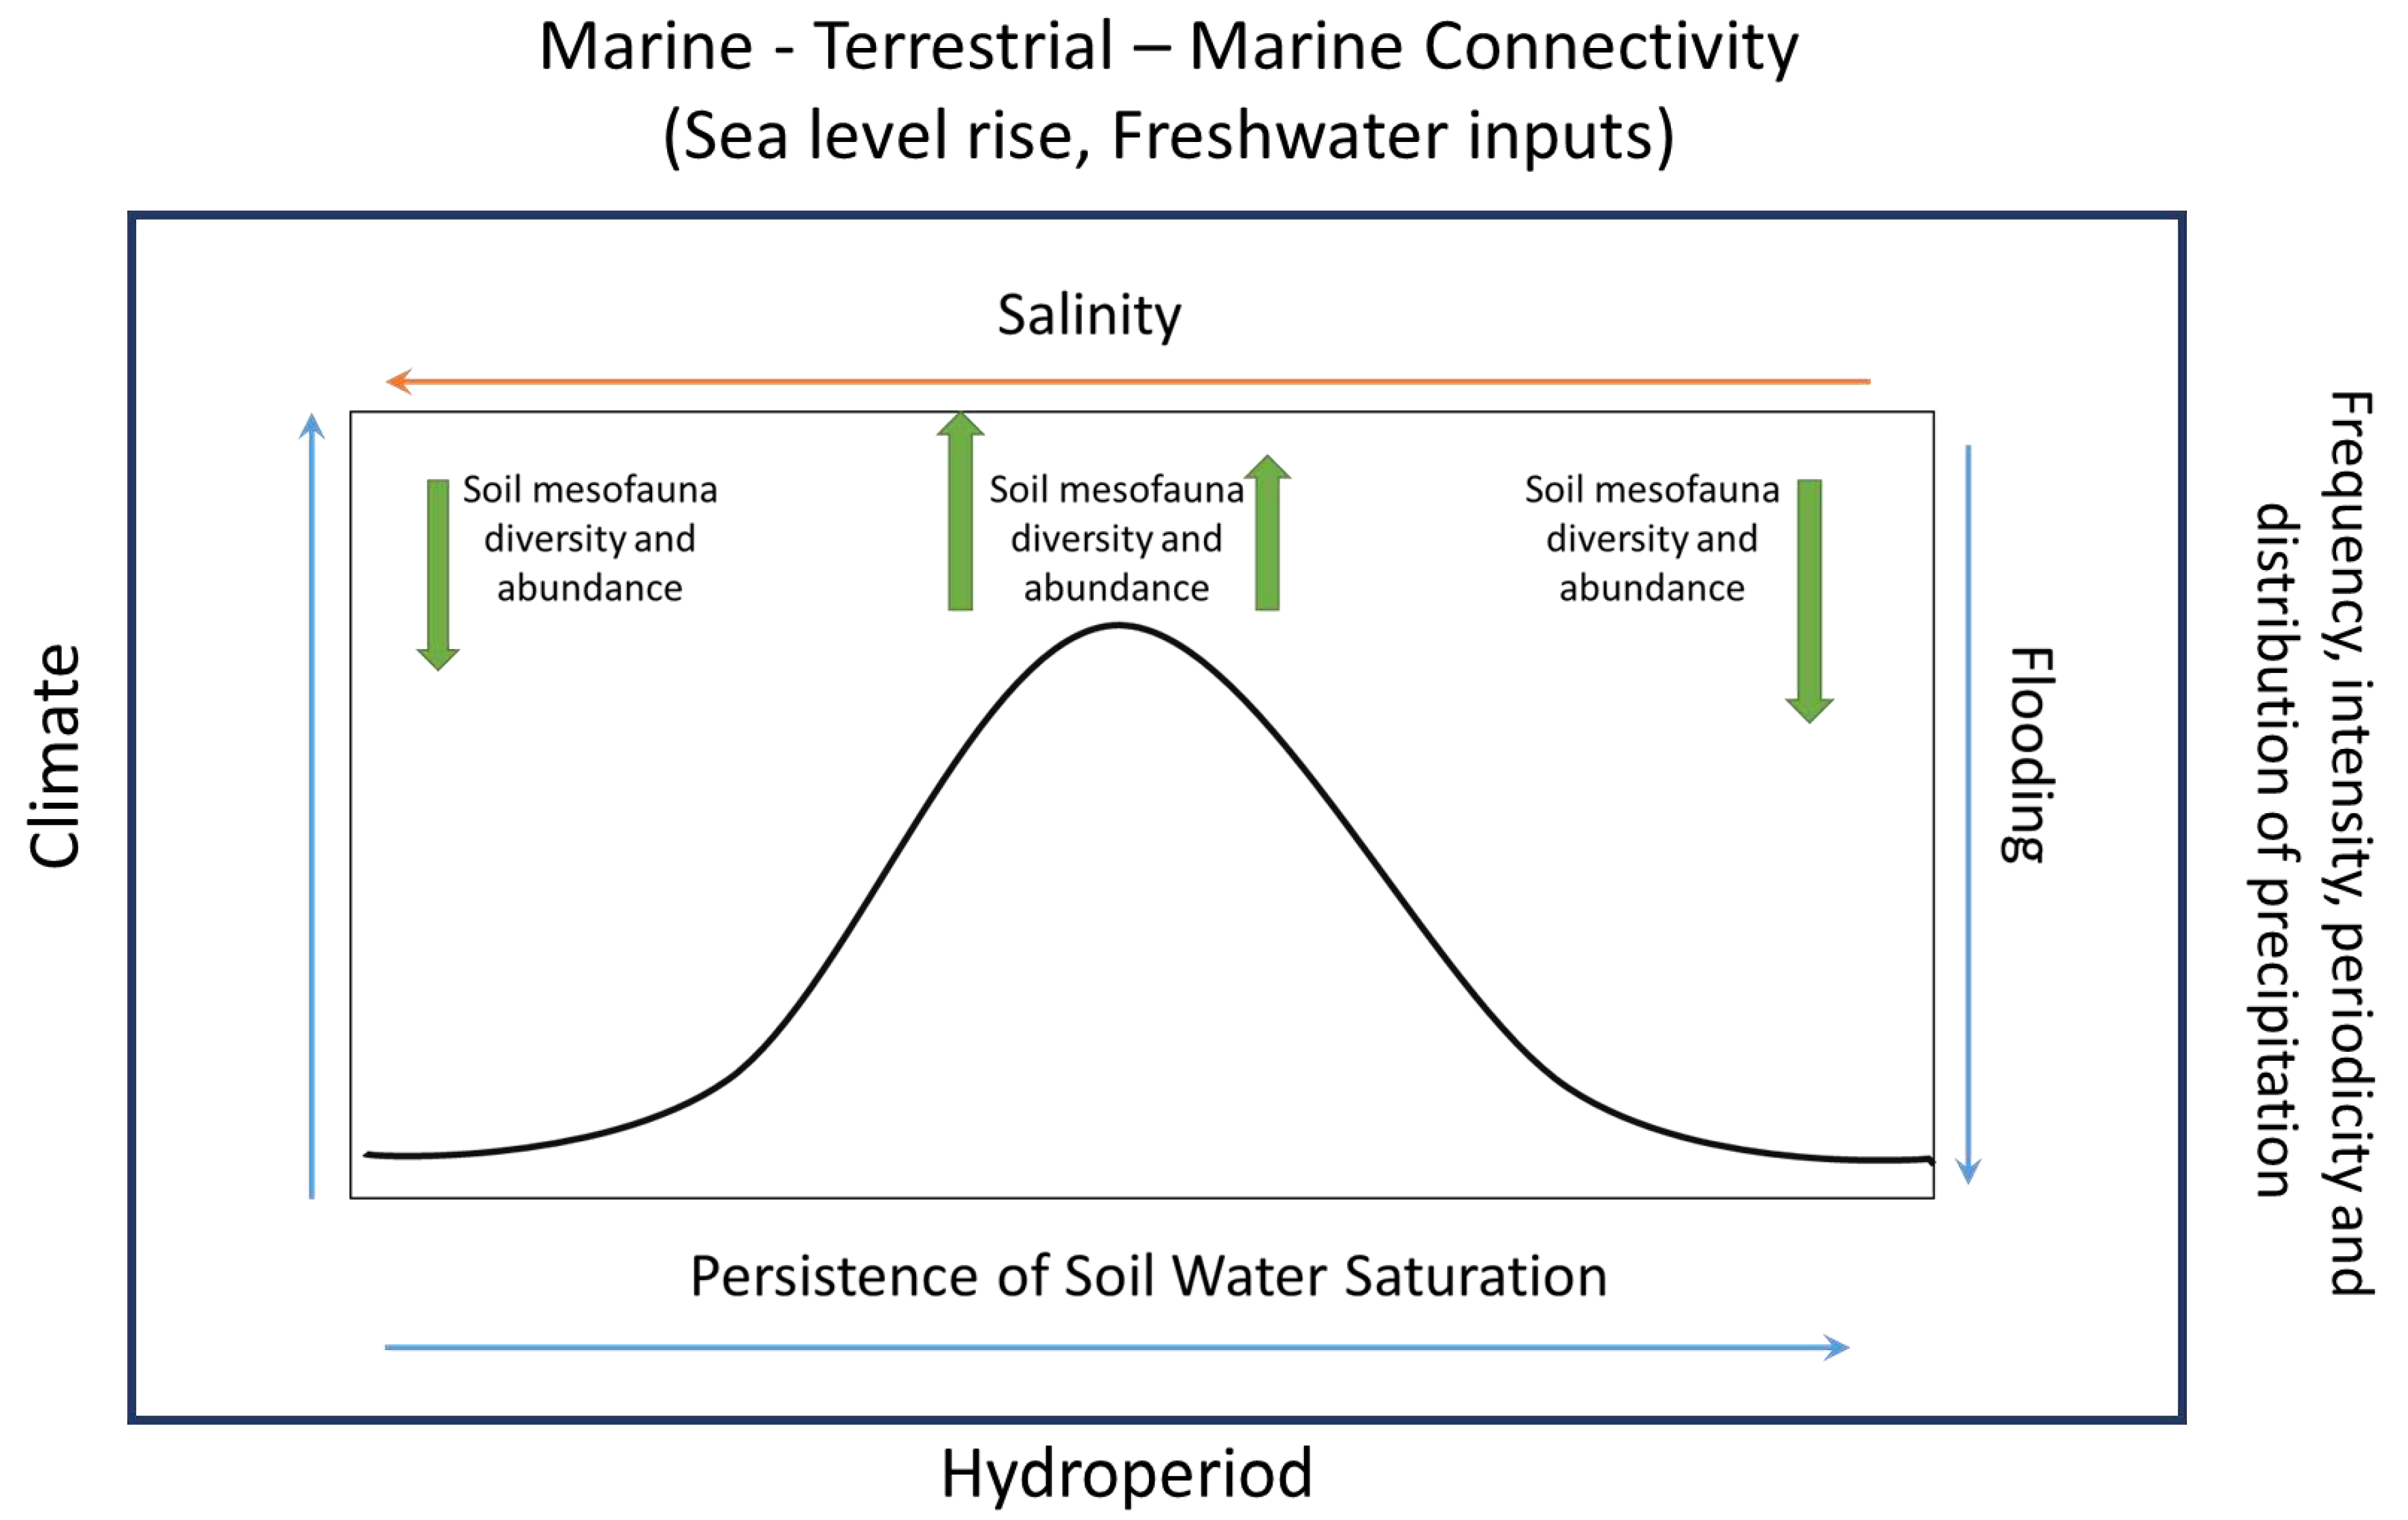
Figure 21.
Schematic diagram of the factors and gradients on wetlands that contribute to soil mesofauna diversity and abundance (Adapted from [
47]).
Figure 21.
Schematic diagram of the factors and gradients on wetlands that contribute to soil mesofauna diversity and abundance (Adapted from [
47]).
Figure 22.
Variations of mesofauna richness and abundance (ind/m2) between habitats among hydroperiod and salinity conditions.
Figure 22.
Variations of mesofauna richness and abundance (ind/m2) between habitats among hydroperiod and salinity conditions.
Figure 23.
Variations of mesofauna taxa among salinity conditions.
Figure 23.
Variations of mesofauna taxa among salinity conditions.
Table 2.
Tide conditions during sampling dates and hours. NOAA 9755371, La Puntilla Station, San Juan, Puerto Rico.
Table 2.
Tide conditions during sampling dates and hours. NOAA 9755371, La Puntilla Station, San Juan, Puerto Rico.
| Hydroperiod |
Sampling Date |
Sampling Time* |
Tide (m) |
Tide description |
| Moderate Dry |
6/18/2020 |
7:00 |
0.22 |
Low |
| 10:00 |
0.32 |
High |
| 6/25/2020 |
7:00 |
0.48 |
High |
| 10:00 |
0.23 |
Low |
| Flood |
10/23/2020 |
7:00 |
0.31 |
High |
| 10:00 |
0.14 |
Low |
| Moist |
3/19/2021 |
7:00 |
0.29 |
High |
| 10:00 |
0.15 |
Low |
| Wet |
6/9/2021 |
7:00 |
0.17 |
Low |
| 10:00 |
0.2 |
High |
Table 3.
Phreatic level (m) (mean ± std) between habitats and hydroperiods. Values with different capital letters indicates means with significant differences (p<.05) between habitats, lowercase letters indicate means with significant differences (p<.05) between hydroperiods.
Table 3.
Phreatic level (m) (mean ± std) between habitats and hydroperiods. Values with different capital letters indicates means with significant differences (p<.05) between habitats, lowercase letters indicate means with significant differences (p<.05) between hydroperiods.
| Habitat |
Hydroperiod Phreatic Level (m) |
| Moderate Dry |
Flood |
Moist |
Wet |
| -0.49±0.06 d |
-0.01±0.07 a |
-0.44±0.12 c |
-0.12±0.03 b |
| GF |
-0.51B
|
-0.05 D
|
-0.36 A
|
-0.12B
|
| MMW |
-0.41A
|
0.11 A
|
-0.43 B
|
-0.07A
|
| MWR |
-0.41A
|
0.09 B
|
-0.36 A
|
0.12B
|
| RMW |
-0.54C
|
-0.03 C
|
-0.64 C
|
-0.17C
|
| SM |
-0.51B
|
-0.05 D
|
-0.36 A
|
-0.12B
|
Table 4.
Spearman’s Rho correlation analysis showing significant correlations between hydroperiods phreatic level and habitat bio-physicochemical factors.
Table 4.
Spearman’s Rho correlation analysis showing significant correlations between hydroperiods phreatic level and habitat bio-physicochemical factors.
| Habitat type |
Phreatic Level by Salinity |
| Spearman ρ |
Prob>|ρ| |
| GFM |
-0.5 |
<.0001 |
| MMW |
-0.8 |
<.0001 |
| MWR |
-0.8 |
<.0001 |
| RMW |
-0.6 |
<.0001 |
| SM |
-0.7 |
<.0001 |
Table 5.
Jaccard index matrix showing similarities between habitat types.
Table 5.
Jaccard index matrix showing similarities between habitat types.
| MMW |
RMW |
MWR |
SM |
GF |
|
| - |
0.78 |
0.73 |
0.80 |
0.82 |
MMW |
| 0.78 |
- |
0.80 |
0.88 |
0.80 |
RMW |
| 0.73 |
0.80 |
- |
0.83 |
0.80 |
MWR |
| 0.80 |
0.88 |
0.83 |
- |
0.78 |
SM |
| 0.82 |
0.80 |
0.80 |
0.78 |
- |
GF |
Table 6.
Spearman’s Rho correlation analysis showing correlations between mesofauna richness index (Menhinick's index) and total abundance with study site physicochemical factors.
Table 6.
Spearman’s Rho correlation analysis showing correlations between mesofauna richness index (Menhinick's index) and total abundance with study site physicochemical factors.
| Variable |
By Variable |
Spearman p |
Prob>|p| |
Richness
|
Phreatic Level |
-0.5 |
<.0001* |
| Salinity (ppt) |
0.3 |
<.0001* |
| Abundance (ind/m2) |
Salinity (ppt) |
-0.5 |
<.0001* |
| Phreatic Level |
0.5 |
<.0001* |
Table 7.
Generalized regression model effect report providing information about the magnitude of the effect of each predictor on mesofauna richness index and total abundance (ind/m2).
Table 7.
Generalized regression model effect report providing information about the magnitude of the effect of each predictor on mesofauna richness index and total abundance (ind/m2).
| Mesofauna richness |
Wald ChiSquare |
Prob > ChiSquare |
Mesofauna total abundance |
Wald ChiSquare |
Prob > ChiSquare |
| Habitat Type |
658 |
<.0001* |
Habitat Type |
568 |
<.0001* |
| Phreatic level |
472 |
<.0001* |
Phreatic level |
260 |
<.0001* |
| Salinity |
57 |
<.0001* |
Salinity |
12 |
0.0005* |
