1. Introduction
A gas turbine's combustion chamber is one of its main components; in this chamber, fuel is burned with air coming from the compressor, its chemical energy is released, and it is converted into thermodynamic energy that can generate power. As a result, the performance of the turbine is directly affected by the combustion chamber [
1,
2,
3,
4,
5]. Fuel is injected into small pipes under inadequate pressure [
6,
7]. There is a variation in the mass flow of fuel within the rods according to their position, and the number of pipes connected to the main channel also plays an important role in determining the mass flow, in large samples, there are usually between 18 and 30 pipes connecting the channel to the rods [
8]. It is an extremely difficult task to design and construct this type of combustion chamber, but their efficiency is higher as the same gas pressure is present in all places and they occupy less space than similar types. This combustion chamber requires a great deal of maintenance [
9]. Combustion processes, turbulence, heat transfer, phase changes, and mass transfer are all factors that affect the fluid flow inside the combustion chamber. Therefore, the flow field inside the chamber must be accurately modeled in order to obtain an accurate and correct understanding of the flow field. In view of the complexity of the flow field, it is only possible to obtain a comprehensive understanding of the flow field using advanced numerical methods in three dimensions [
10]. There are two tubes in this combustion chamber, one inserted inside the other and connected from one side to the other. On the other side of the turbine, you will reach the turbine. This type of engine requires a large amount of fuel input and can be used for a wide range of purposes. Jet engines with a combustion chamber of a particular type require a certain number of input fuels. There is a combustion chamber located between the inner and outer tubes of the reactor. Combustion chambers of this type are used in most turbojets and jet engines and are used in most airplane jet engines nowadays [
11]. The purpose of this study was to determine the optimal geometry of the fuel supply channel of a micro 500W gas turbine by investigating the flow distribution of the fuel supply nozzle. To investigate the effects of channel geometrical deformation and inlet mass rate on the fuel supply nozzle flow distribution, it is essential to conduct a comprehensive numerical simulation. The numerical results obtained from this simulation are validated by comparing them with the experimental results, which are very closely aligned with the experimental results, and the optimal geometry is also determined. In order to estimate the energy consumption of the pump to supply fuel, the pressure drop between the inlet and outlet is measured. The geometry of the fuel supply channel is presented in both square and circular shapes in order to provide uniform flow distribution with the least amount of pressure loss. A circular tube is used to form the flame in this combustion chamber. During operation, the diffuser is on one side of the opening, while the gas guiding blades are on the other side. This annular tube is enclosed by an outer shell, and cool air (which makes up 60 to 75% of compressor air) enters this cylindrical tubing through the holes in the ring tube.
2. Problem formulation
Because in this case, the cross-section is rectangular, the hydraulic diameter is calculated as equation (1):
where
The diameter of the nozzle and
the length of the side of the cross section are square. Also, the average speed can be obtained using equation (3):
Where
is mass flow rate and
is the density of the fluid (ethanol). Equation (4) shows the pressure difference at the inlet and outlet [
12,
13].
where
the static pressure,
Friction coefficient and
will be the length of the channel. Also, the friction coefficient can be calculated as equation (5):
where
Reynolds number and
effective length is obtained from equation (6) [
14,
15]:
This value for the case of a square cross-section is equal to:
And for the circular cross-section equal to:
3. Modeling
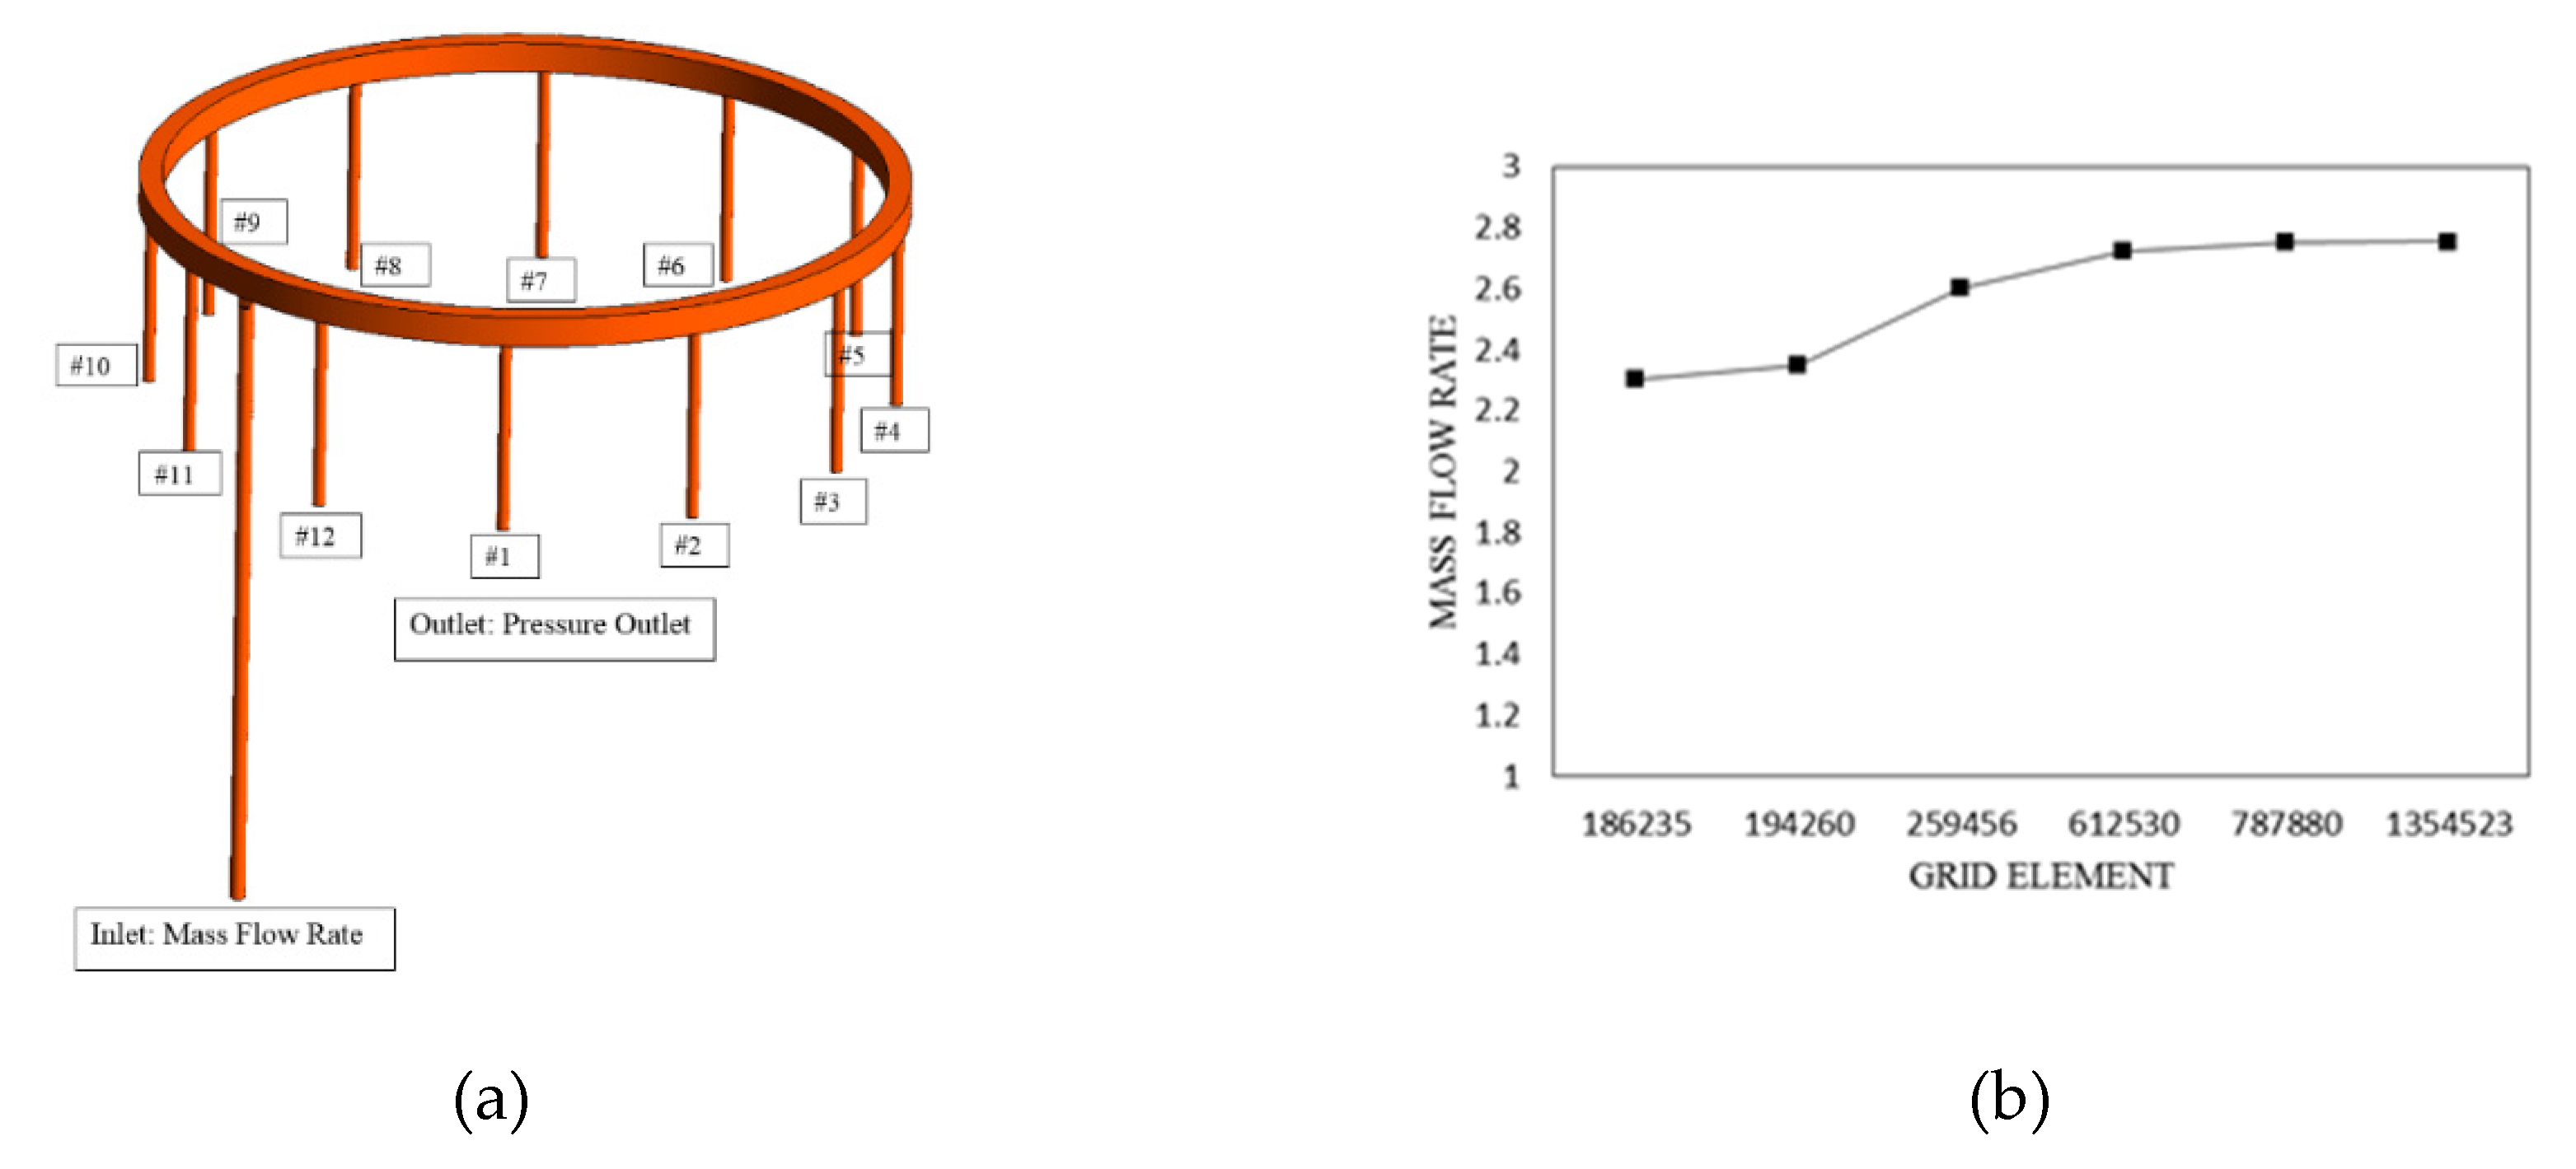
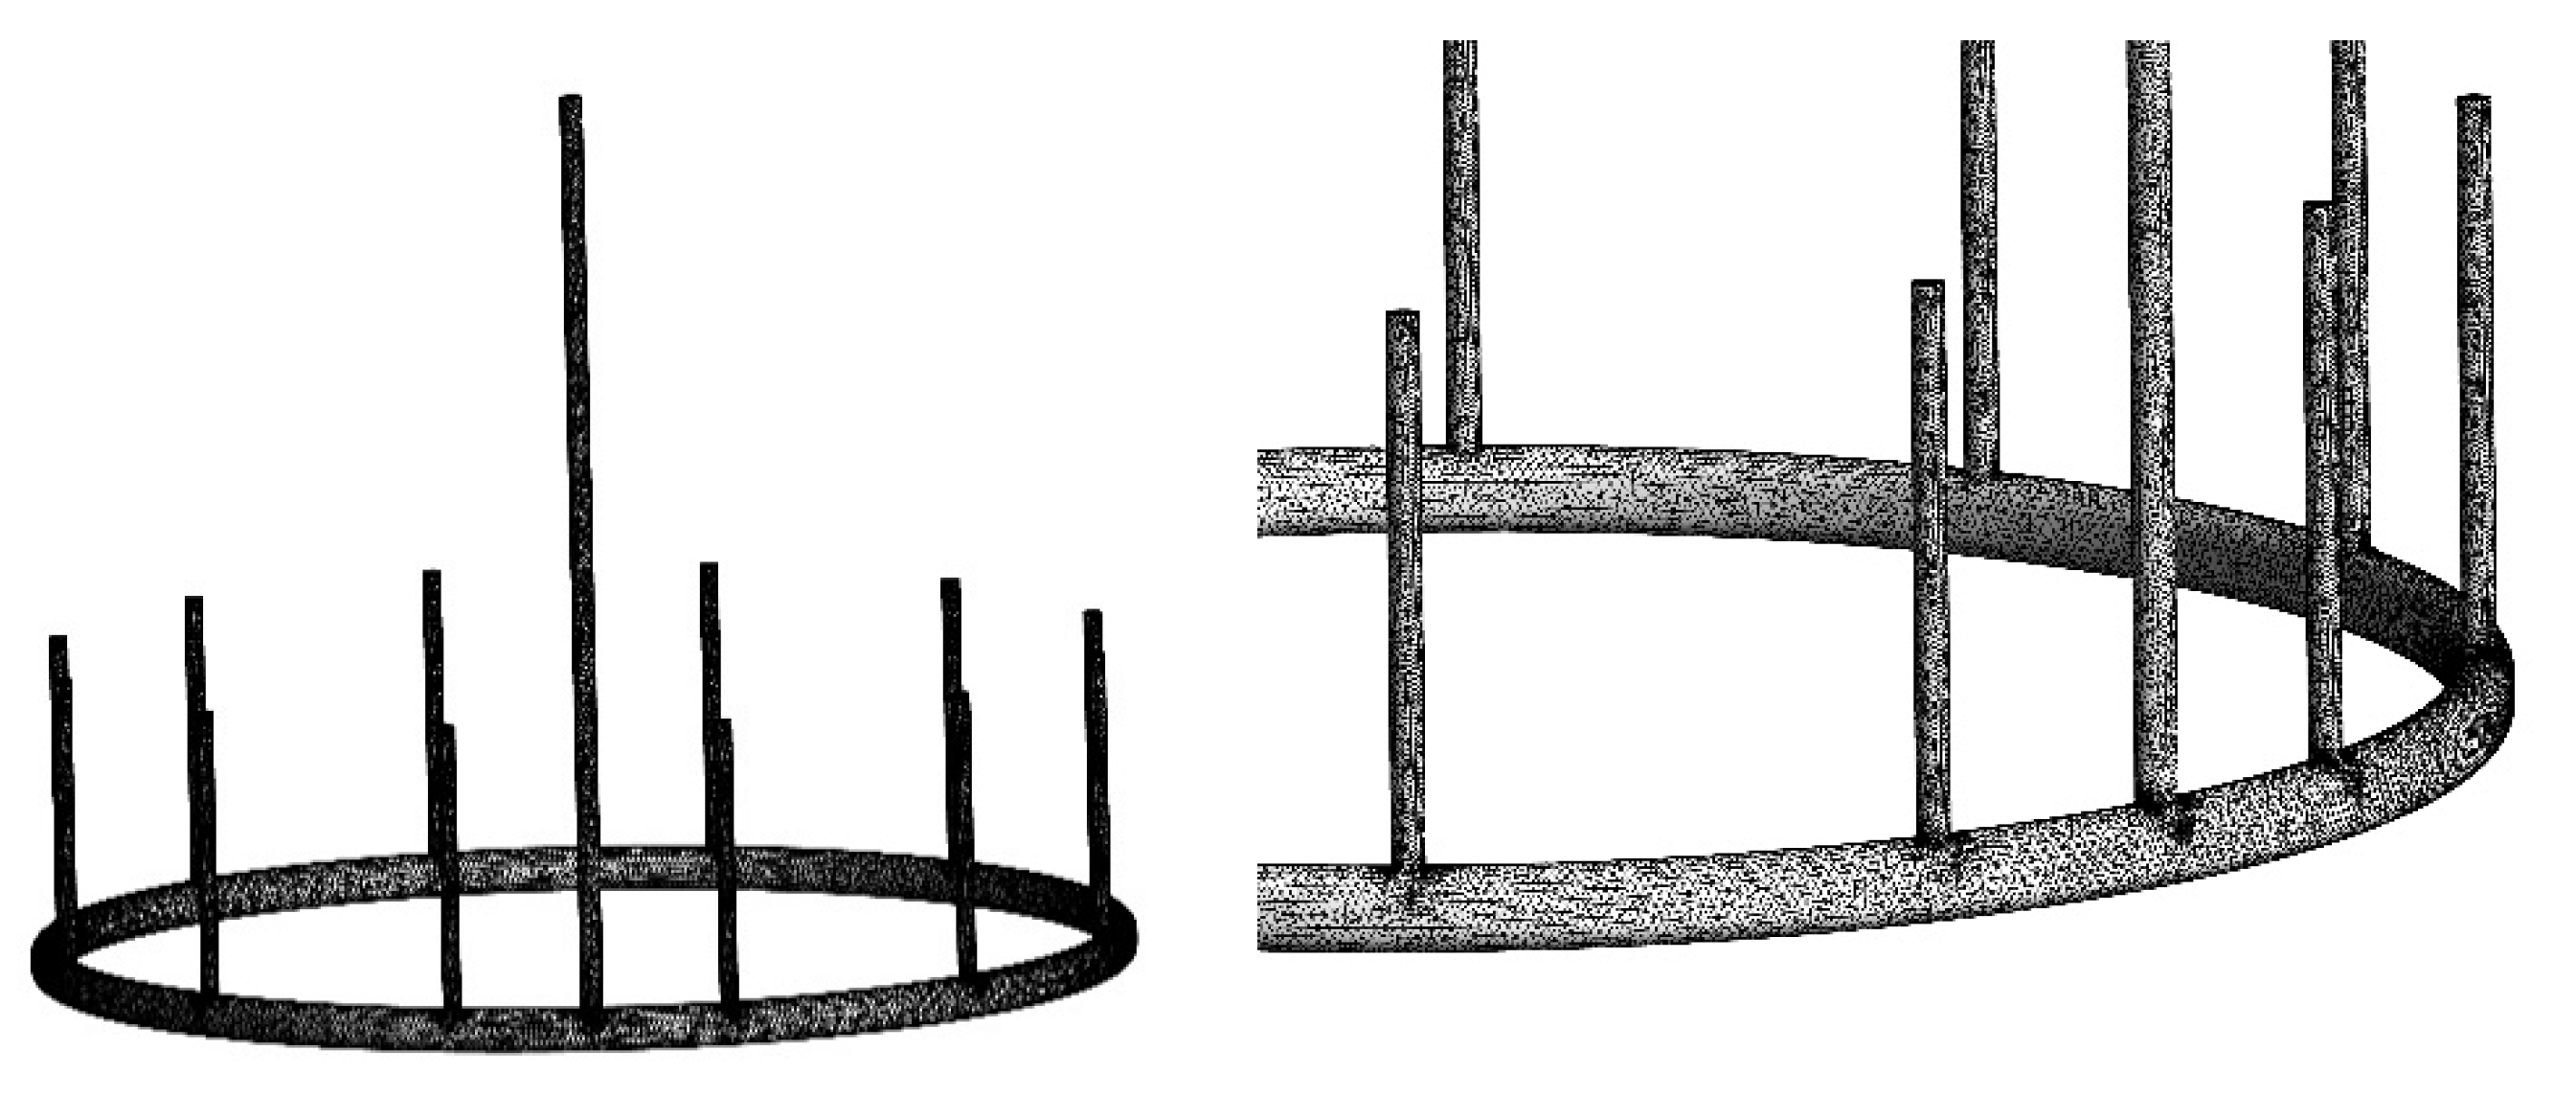
In this article, numerical simulations are performed using ANSYS FLUENT, a software program that is based on the finite volume method. As shown in the figure below, the problem geometry consists of a fuel supply channel with a diameter of 2.257 mm, one inlet pipe, and twelve outlet pipes. An inlet pipe has an inner diameter of 1 mm and a length of 60 mm, while the outlet pipe has an inner diameter of 1 mm and a length of 15 mm. Two types of channels have been investigated in this paper: square channels and circular channels. It is important that both cross-sectional areas are equal to four square millimeters in order to calculate the effects of geometry on the flow rate and other flow parameters. Fuel is not uniformly distributed to each nozzle at the nozzle near the fuel supply line, so the mass flow coming out of the nozzle near the fuel supply line is much higher than the mass flow at the nozzle far from the fuel supply line. It is assumed that the flow is uniform, three-dimensional, and has an inlet flow rate of 30 g/min.
When the resistance to flow is much greater for the nozzles than for the channel, the fuel is distributed equally to each nozzle, indicating that the channel's width should have a much greater cross-sectional area than the nozzles [
16]. A key parameter in fuel flow distribution in a channel is the diameter of each nozzle, and to validate the data, the channel geometry is assumed to be square and the nozzles are drawn in two diameters of 128 and 344 micrometers (
Figure 1 (a)), with the diameter of each nozzle equal to the other in each sample. The lack of liquid flow requires the use of continuity equations and momentum equations, which require continuity assumptions that are violated when the size of the liquid is less than 50 micrometers. ] 7 and 8 [. Due to the simulation sizes exceeding 50 m and the slow flow, numerical simulations are conducted based on Navier-Stokes equations [
17]. The continuity assumptions are still valid during the numerical simulation process. The input and output boundary conditions assume that mass flow rate and atmospheric pressure remain constant and that the grid applied is triangular and its number is 612530. We assume that the external environment is at a constant pressure and we ignore any pressure drop that may occur as a result of changes in the flow direction in the channel and nozzles.
Based on an analysis to equalize the mass rate, six types of calculations have been carried out to model the micro gas turbine illustrated in
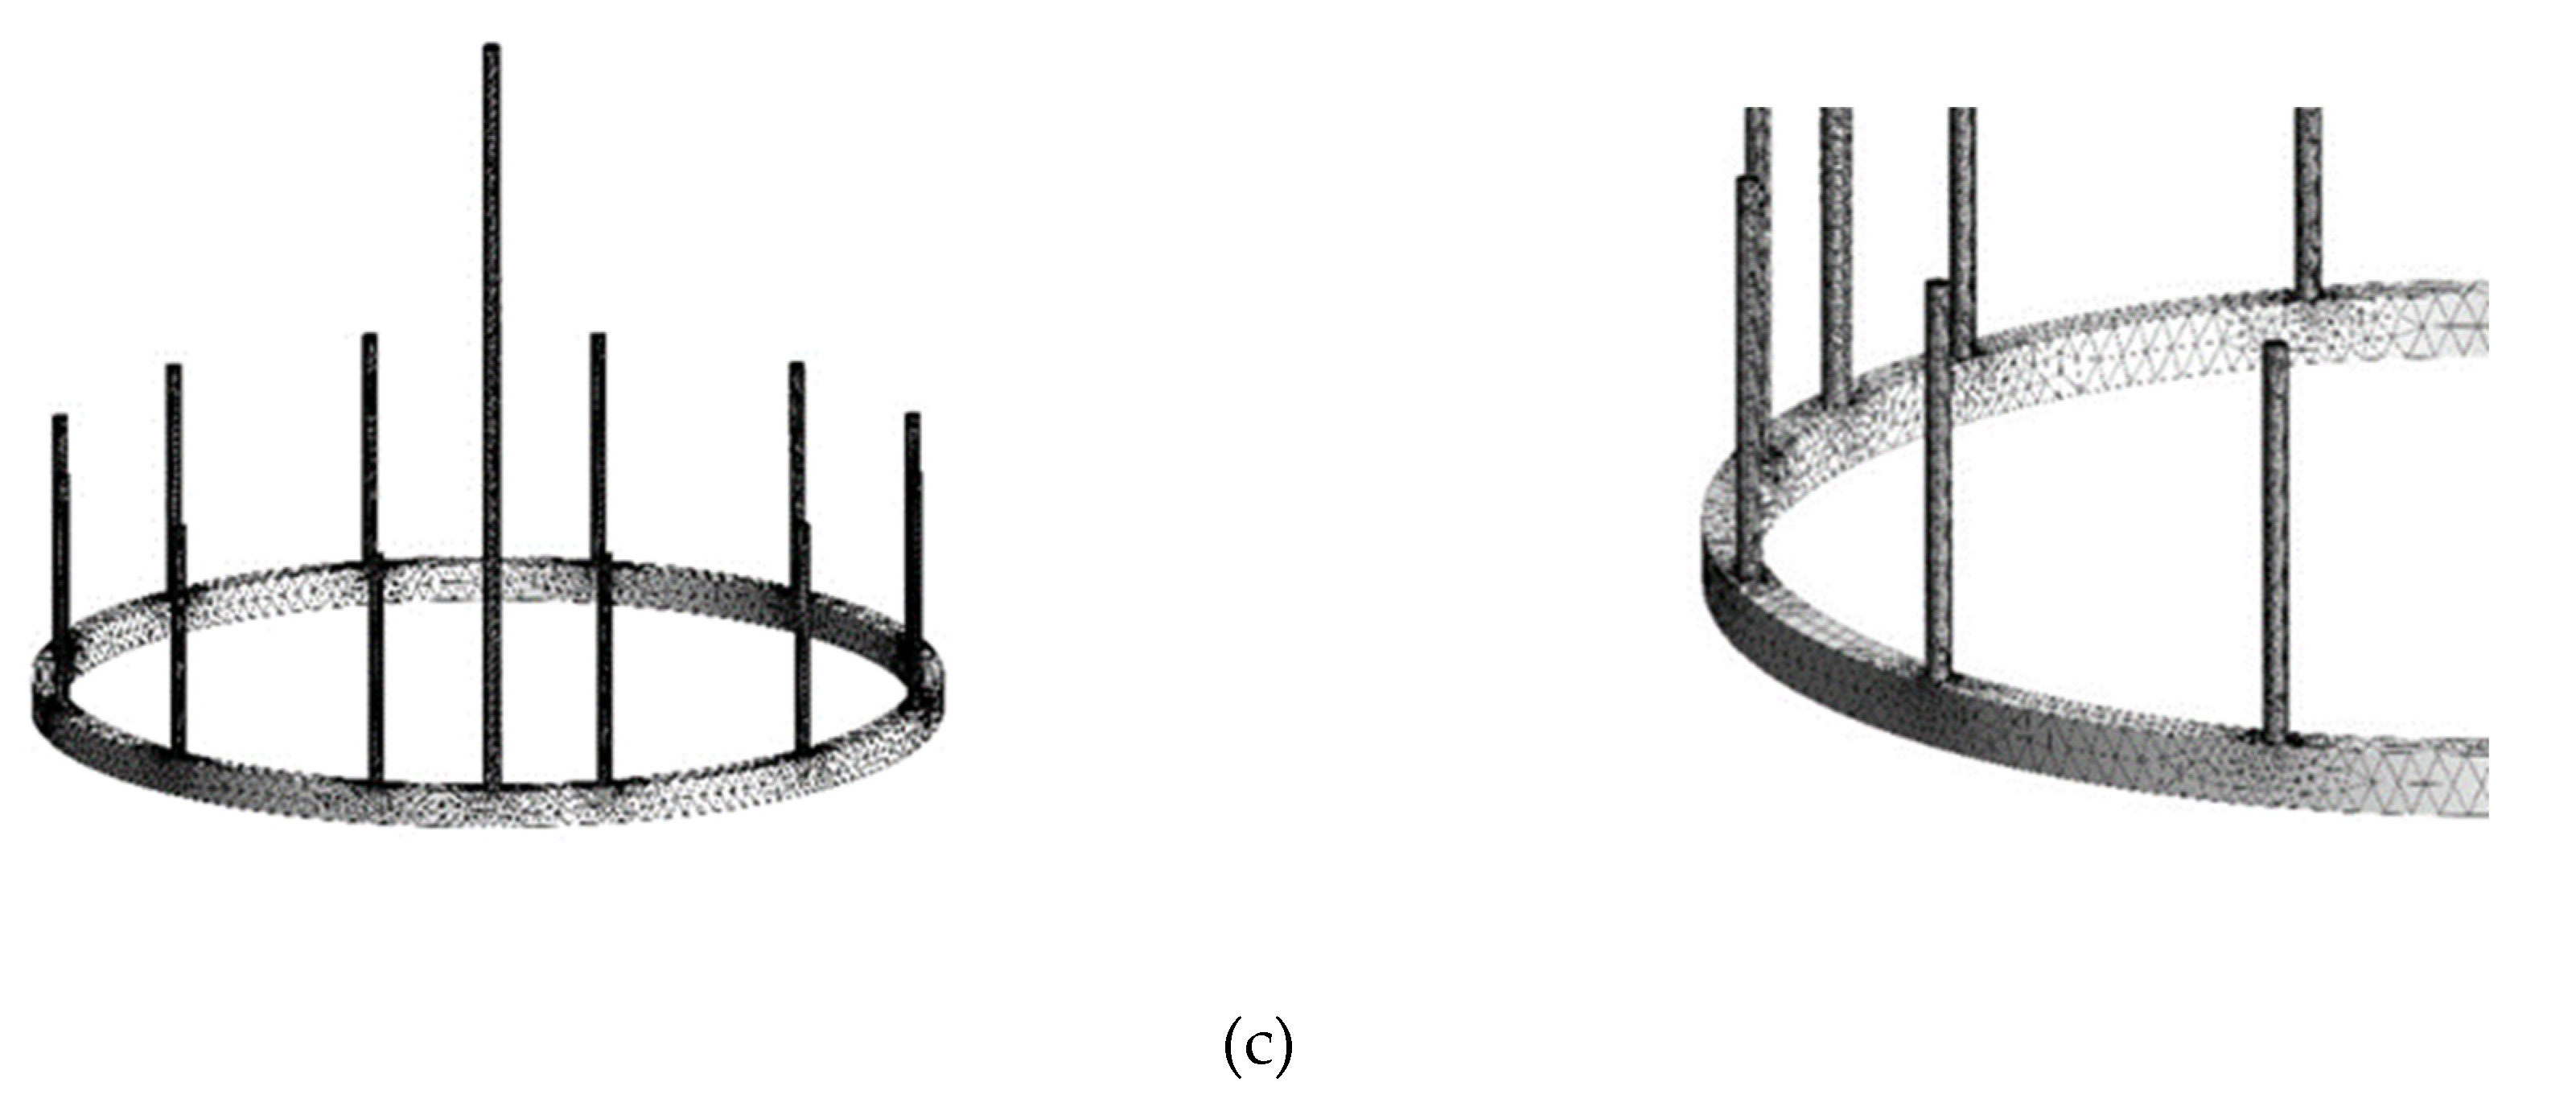
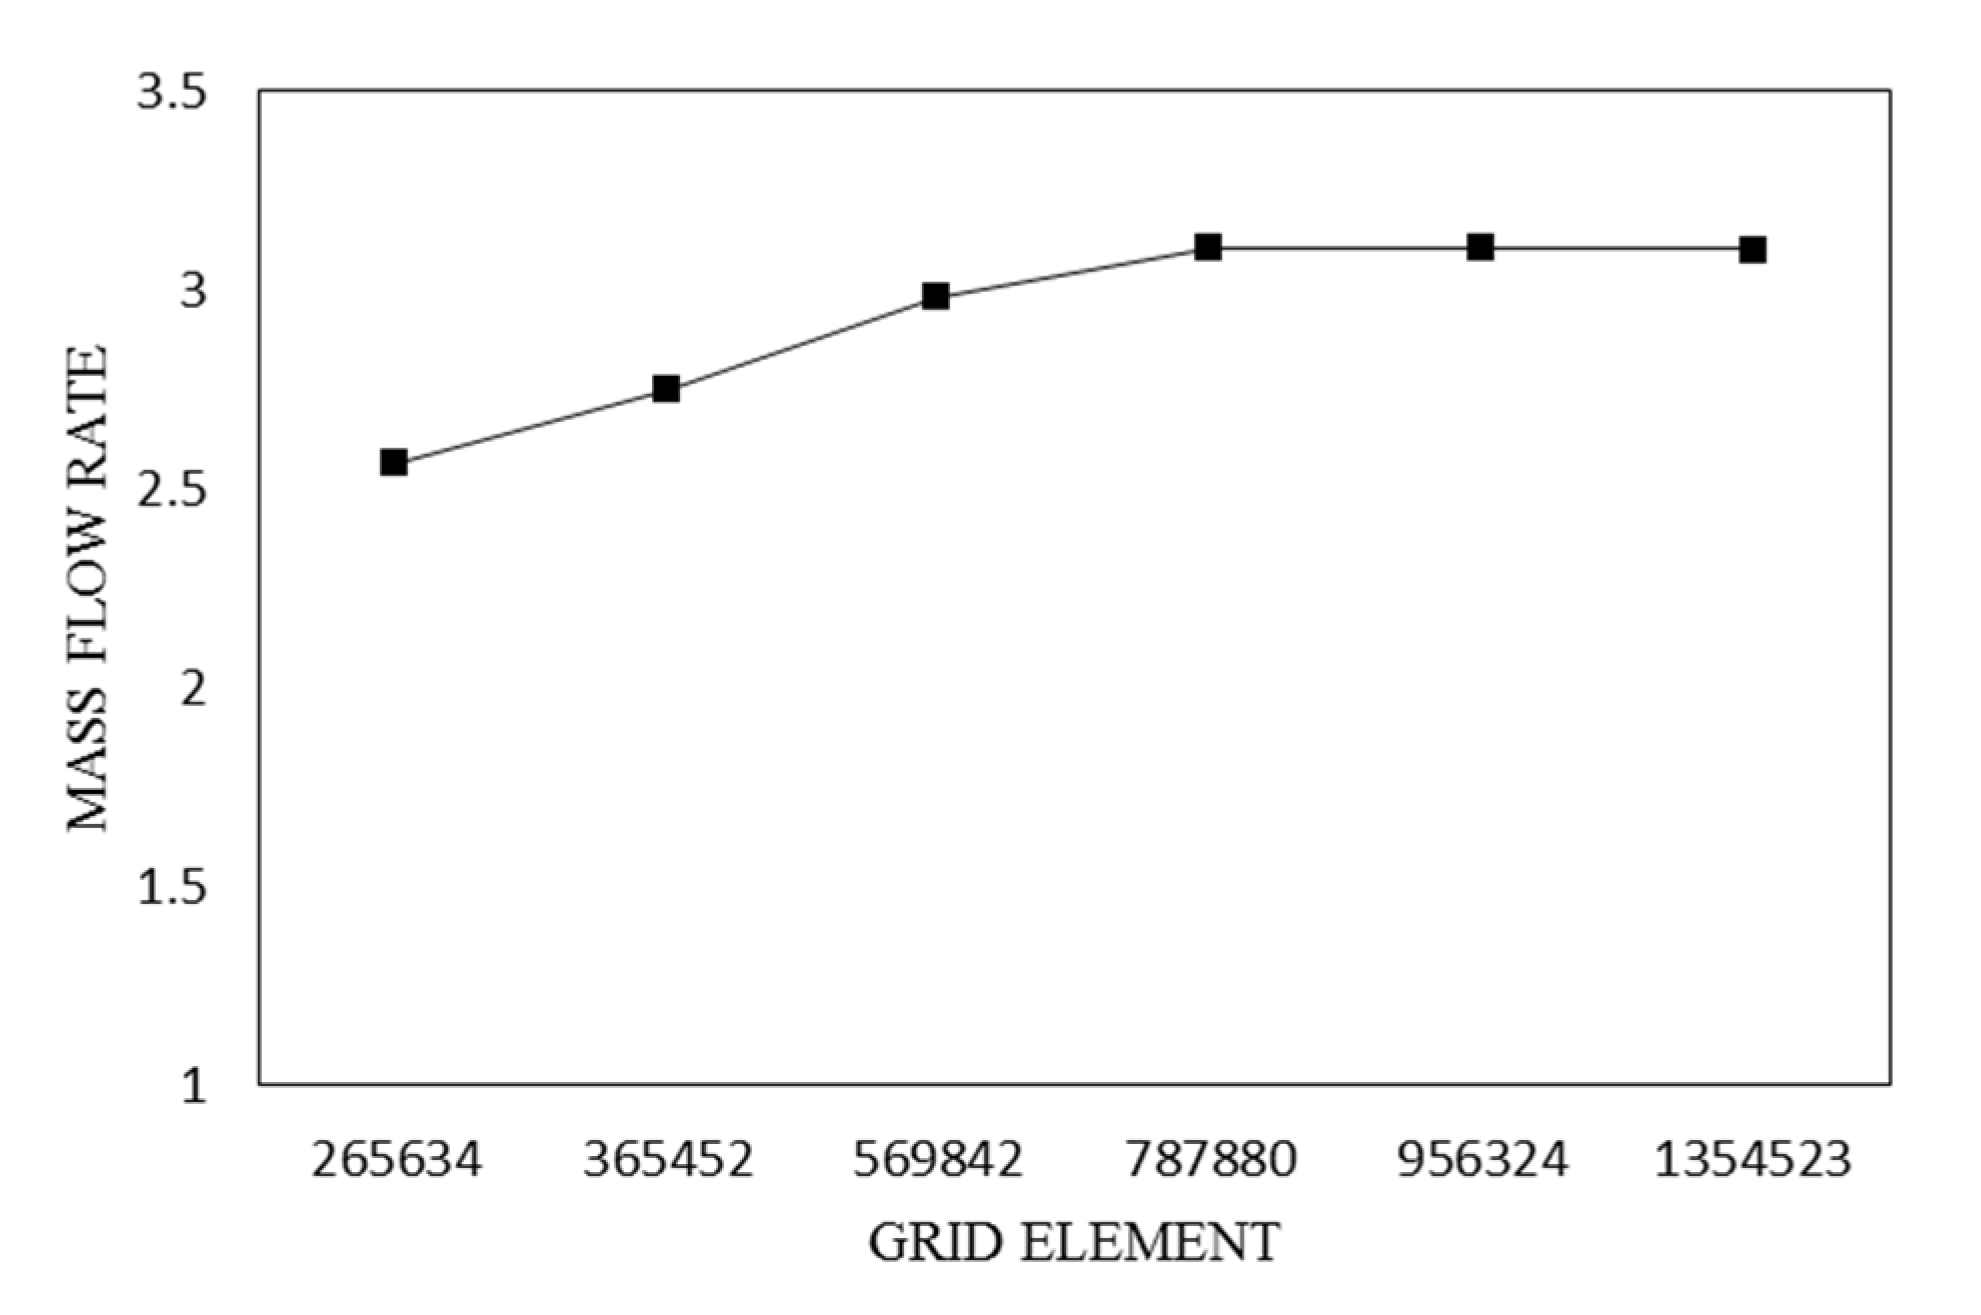
Figure 1. For the final step, the best network has been selected for the assessment of the independence test from the network. The effect of the number of grids on the turbine performance is examined in this model using an unstructured meshing approach with tetrahedral cells. From grid 4 onward, the mass rate ratios have been unchanged based on the results shown in
Figure 1 (b). Because of the weak type of meshing, meshing 1 to 4 differs significantly from the experimental result. According to
Figure 1 (c), the unstructured meshing for channels and nozzles is composed of 612530 cells, with a minimum mesh quality of 0.34.
4. Results
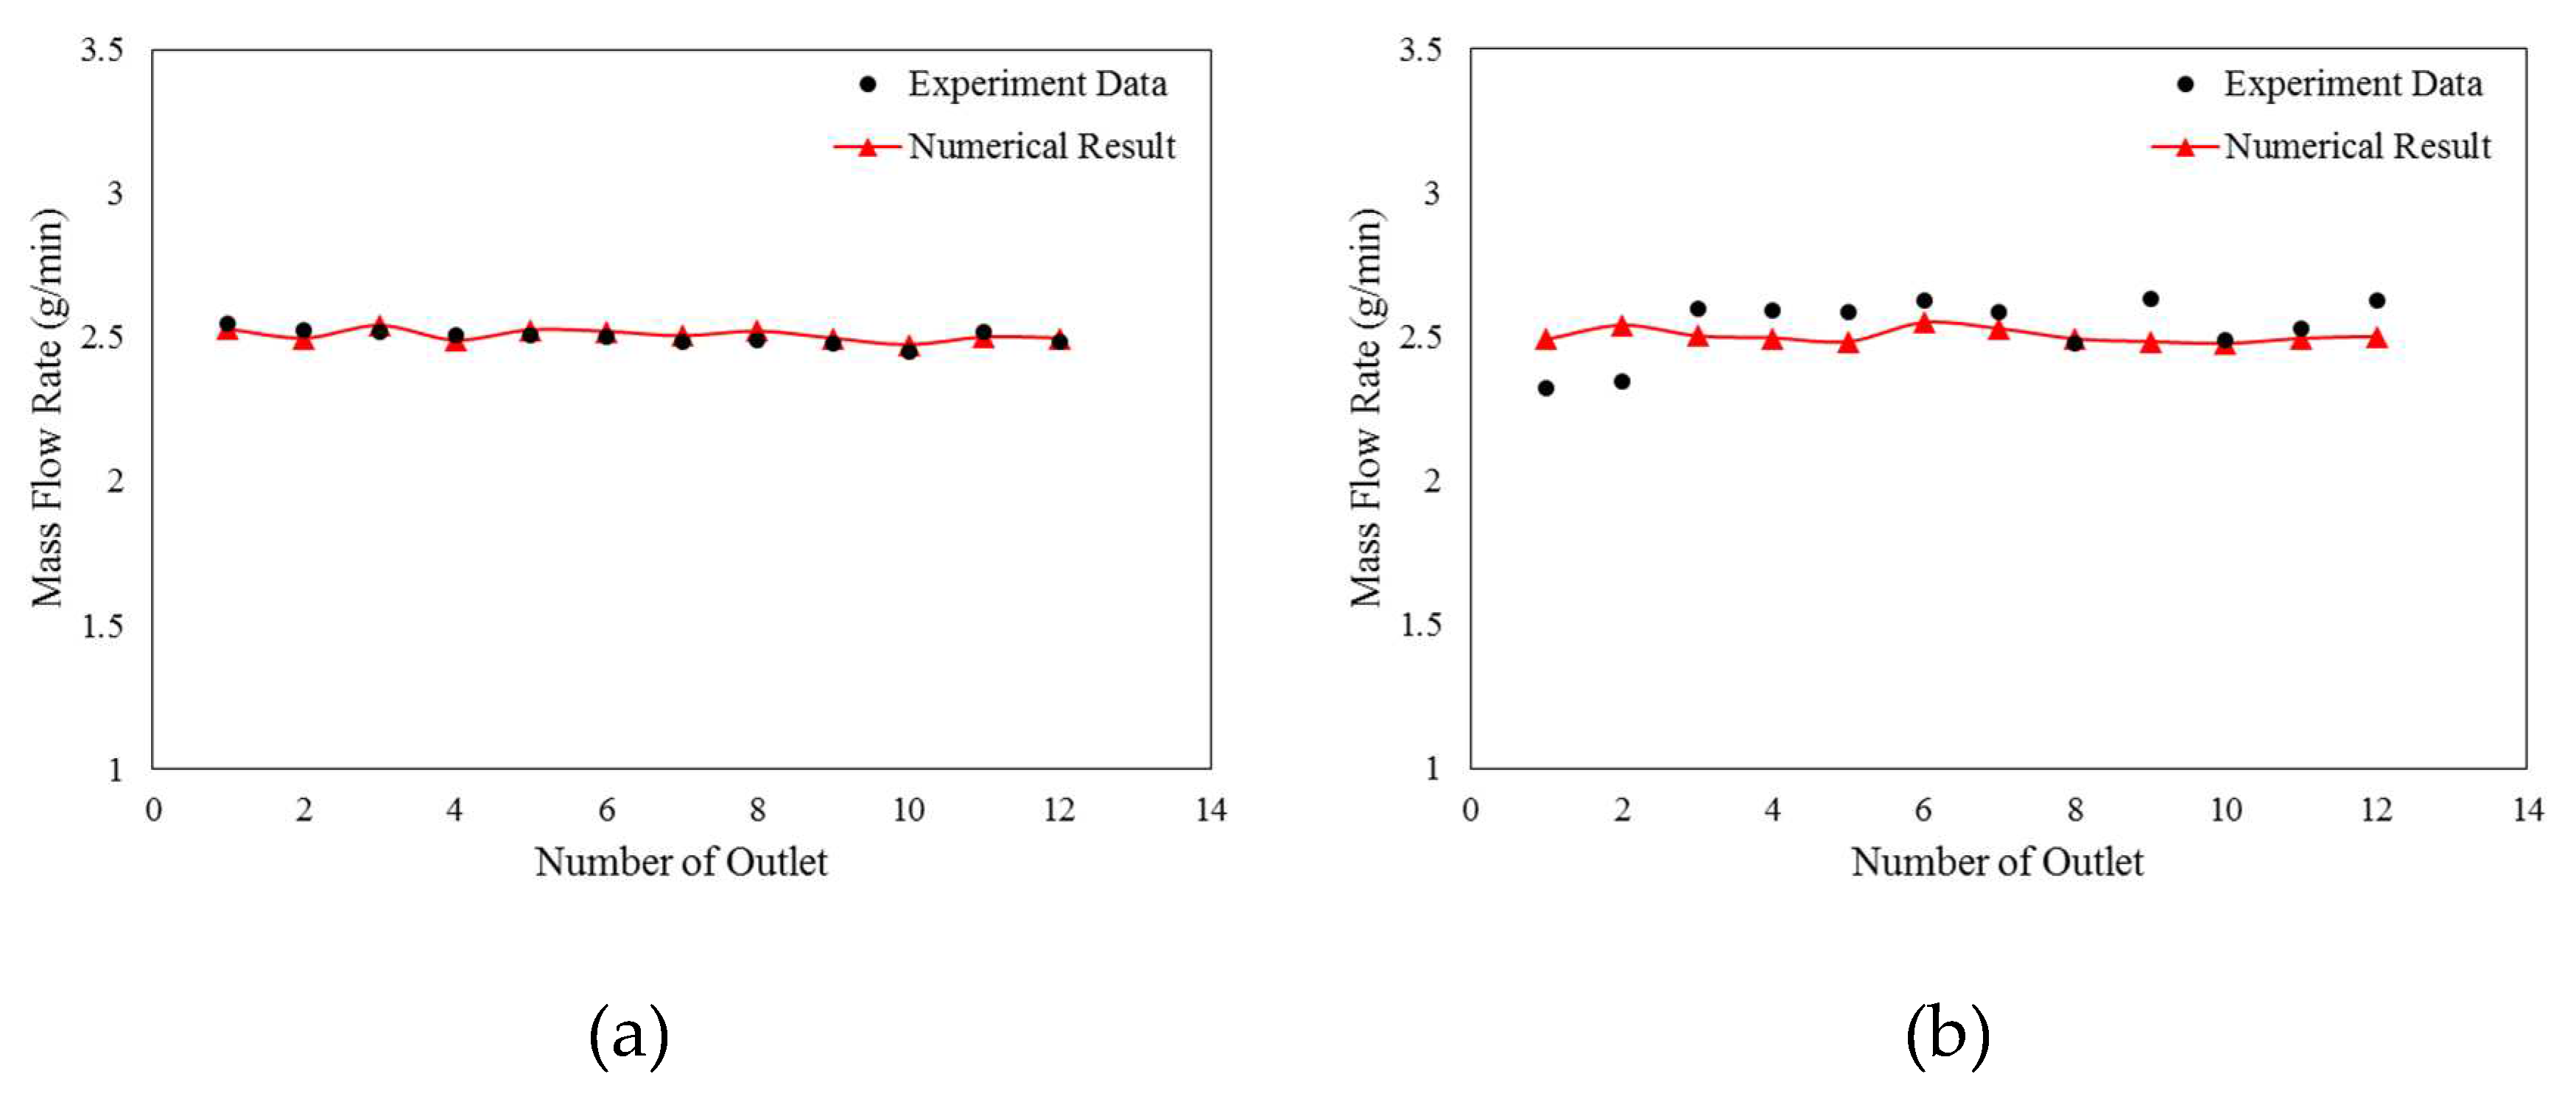
It is believed that changes in pressure and fluid momentum in the channel influence the flow distribution from the channel to the fuel nozzles. In order to solve the problem of flow distribution, it is necessary to determine the pressure in the channel that connects each nozzle. Based on Table (1), values obtained from the square mode were compared with experimental values obtained from a similar sample from the reference article [ 1 ], with a flow rate of 30 g/min and two different nozzle diameters of 128 and 344 micrometers, which were in good agreement. The equalization diagrams in Figures (2) and (3) show an average error of less than 3% between the numerical solution results and experimental results. The numerical solution therefore represents an approximate match of the experimental data with the results of the numerical solution. As it is clear from the graphs in
Figure 2 and
Figure 3, the difference between the experimental results in the case where the nozzle diameter is considered to be larger will be much less than in the case where the nozzle diameter is small.
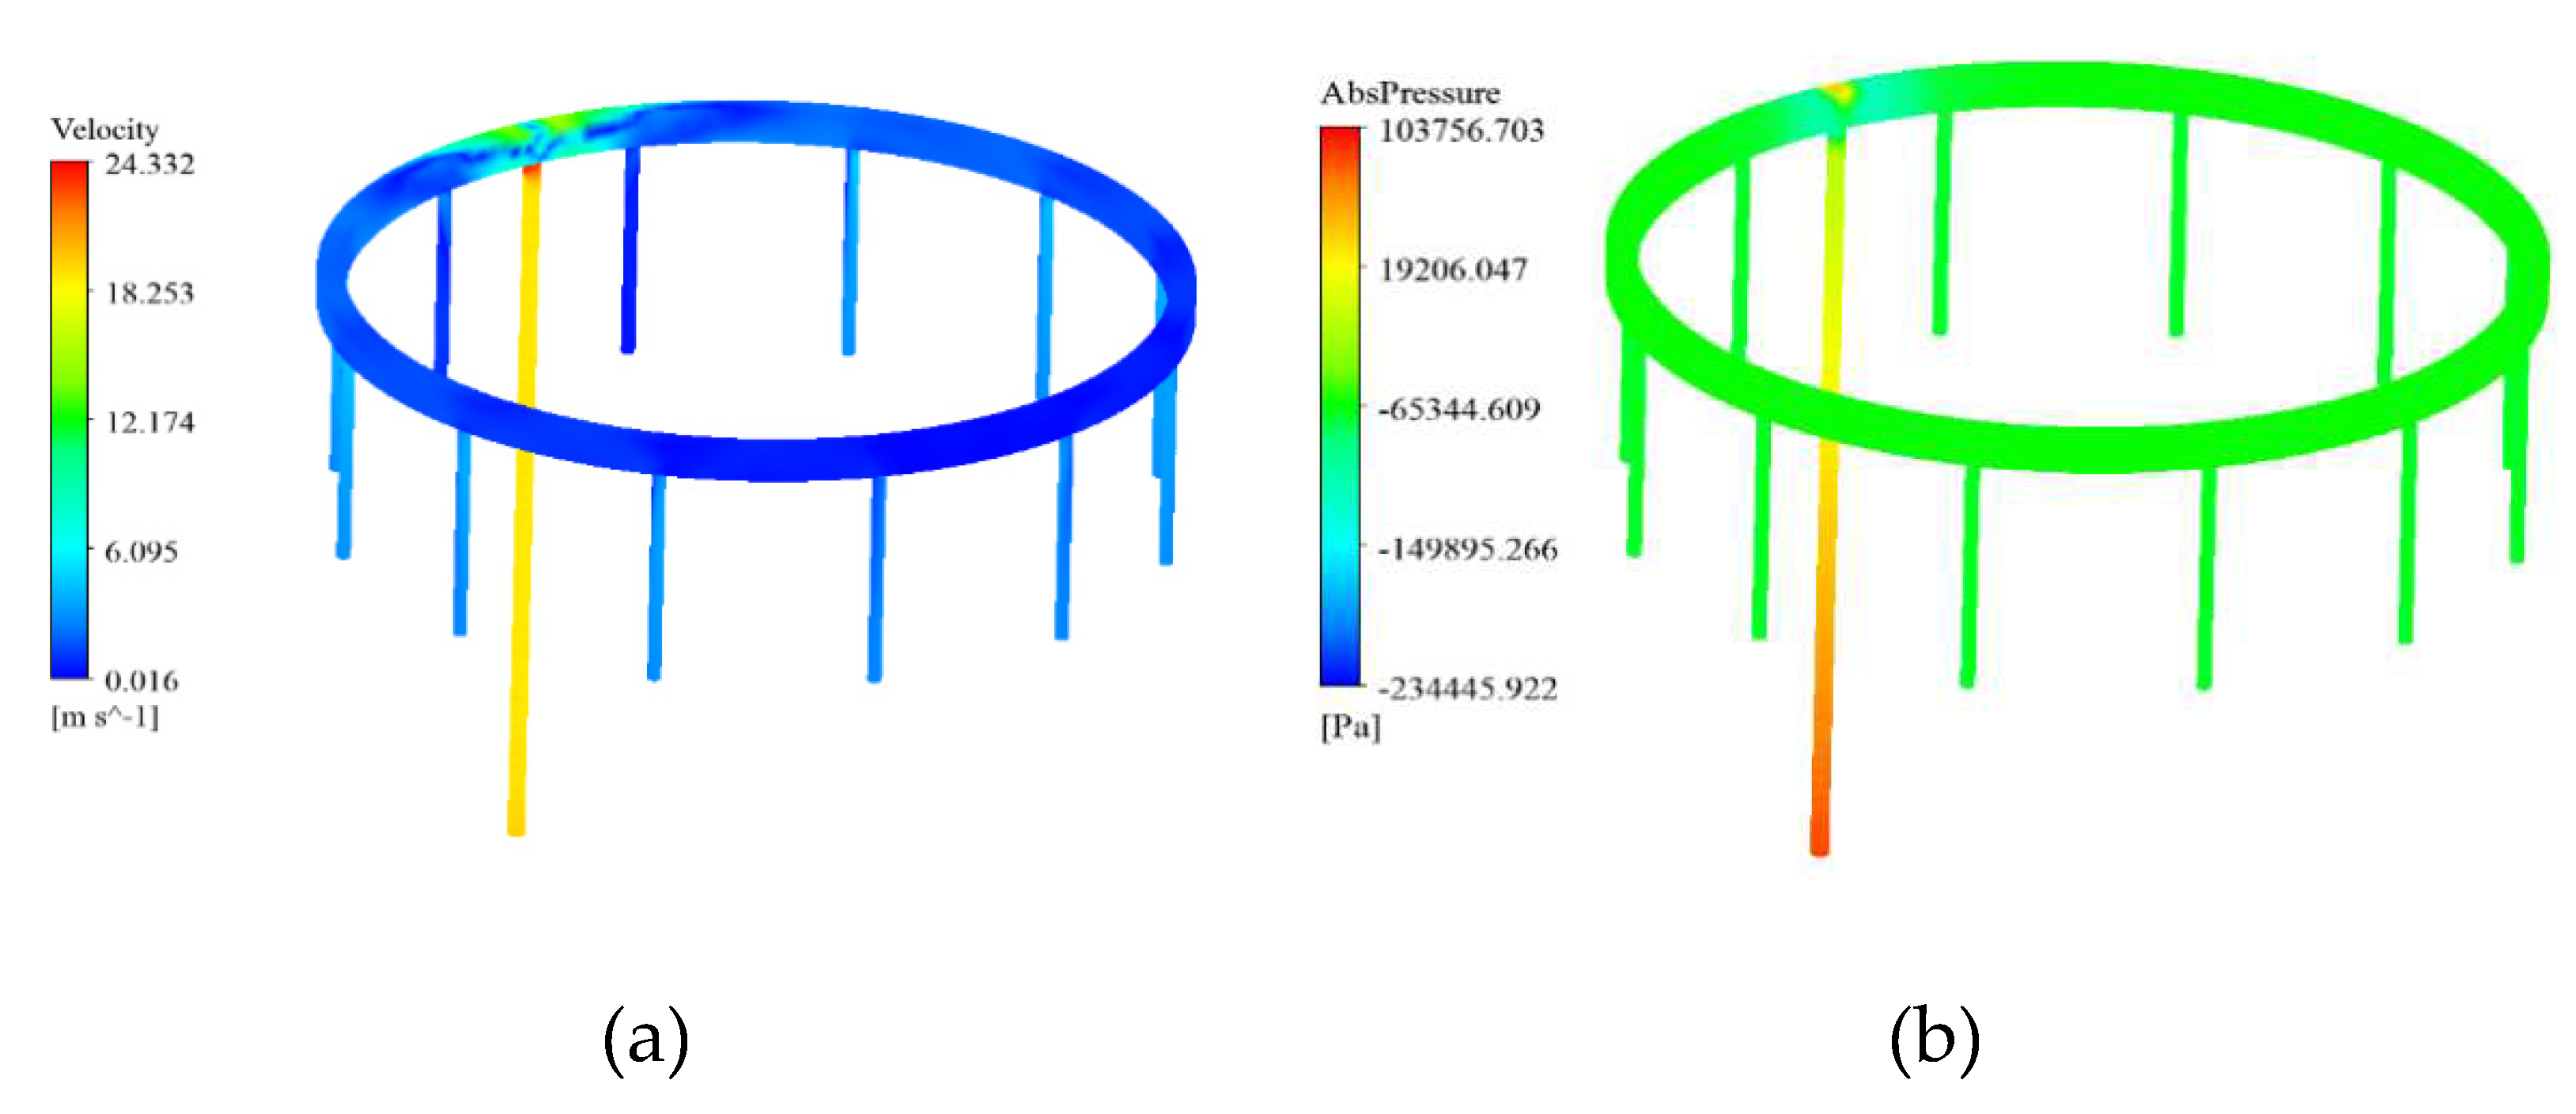
As shown in
Figure 3, the contour of static pressure and speed can be seen. Based on the static pressure contour (
Figure 3), it can be concluded that the pressure at the inlet of the micro gas turbine tubes is significantly higher than the pressure from the inlet to the outlet tube. There will be a slight difference in the distribution of pressure in the outlet pipes, so that the pressure in the outlet pipes closest to the inlet pipe will be higher than in the pipes farther away. It is also evident from the speed contour that this is of great importance. In the inlet pipe, the speed is greater, while it will be very low in the distant pipes.
Table 1.
Numerical simulation results in two different micro gas turbine cases.
Table 1.
Numerical simulation results in two different micro gas turbine cases.
| Case |
Nozzle diameter, (µm) |
Inlet mass flow rate, (g/min) |
Reynolds number |
Simulation type |
| Inlet pipe to the canal |
Channel |
Outlet pipes from the channel |
| 1 |
128 |
30 |
428-42 |
21-214 |
27-278 |
Numerical |
| 2 |
344 |
30 |
428-42 |
21-214 |
10-104 |
Numerical |
The uniformity of the output pressure from the micro gas turbine nozzle is one of the most important aspects of fueling in the combustion chamber. According to the mentioned plan, there was a slight difference in the output pressure, and to resolve this problem, we aimed to equalize the output pressure from 12 pipes so that the fuel could be distributed as efficiently as possible. As a result, instead of using a square cross-section surface, a circular one has been used, and its geometry and grid can be seen in
Figure 3. In
Figure 4, the results of the network independence test are shown to verify the correctness of the network. Grids of this type will be similar to those shown in
Figure 3. In this analysis, 787880 elements will be considered, with a quality of at least 0.31.
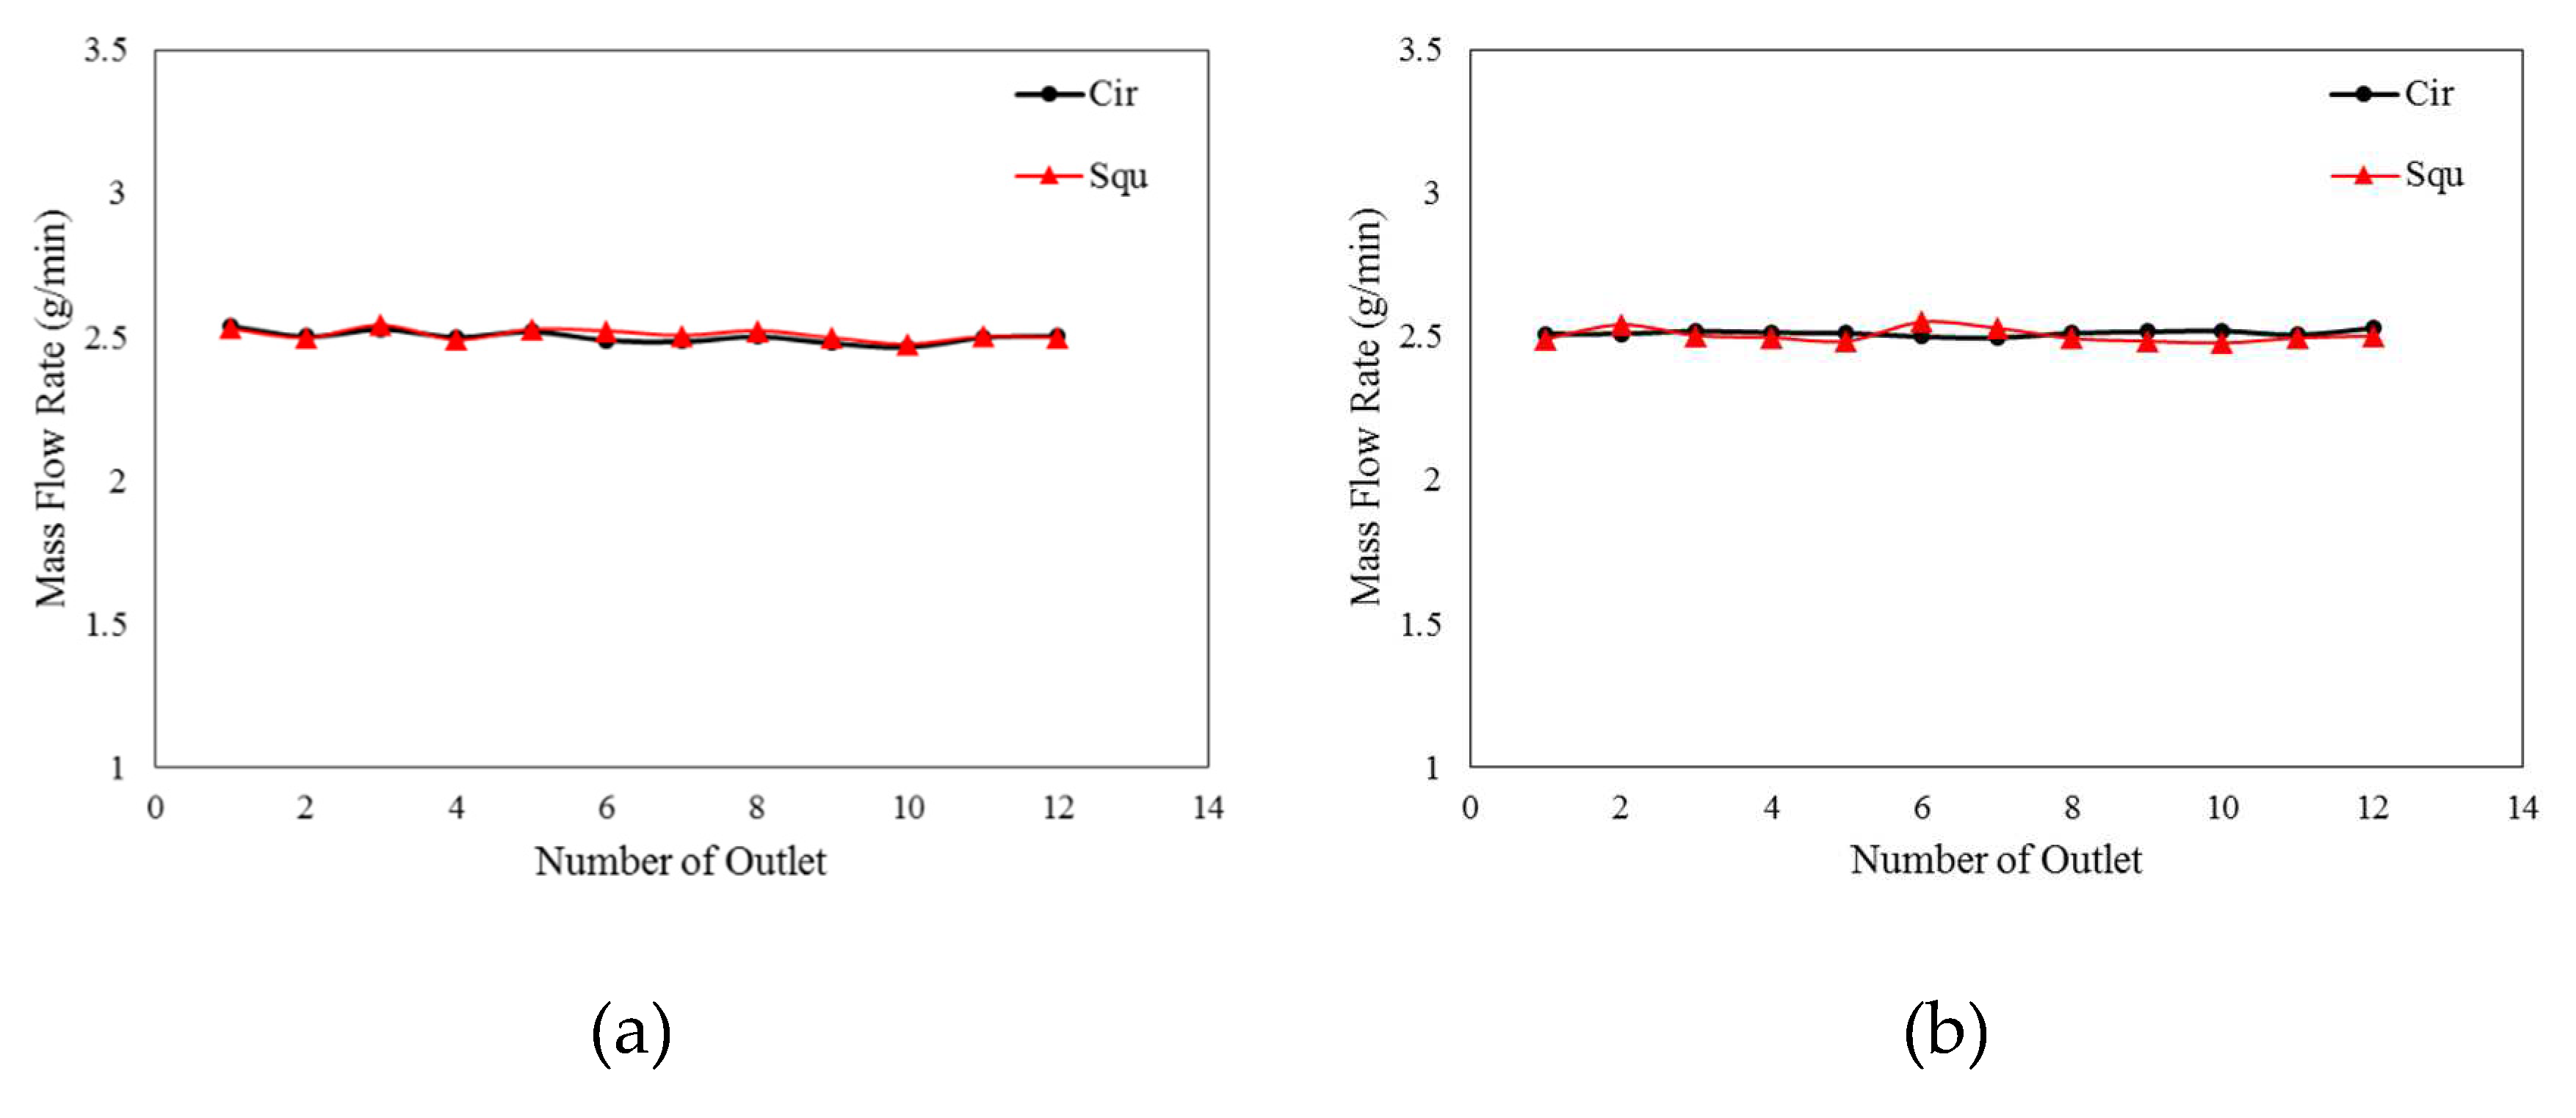
A graph showing the output mass rate from the outlets on the nozzles. A nozzle with a diameter of 128 micrometers is shown in
Figure 6, while a nozzle with a diameter of 344 micrometers is shown in
Figure 6 on the left side. It can be seen that the micro-distribution of mass flow rate at the outlet of the gas turbine nozzle is improved by the circular shape of the nozzle, as compared to the square cross-section. However, this difference is much smaller when the nozzle is 344 micrometers in diameter. In
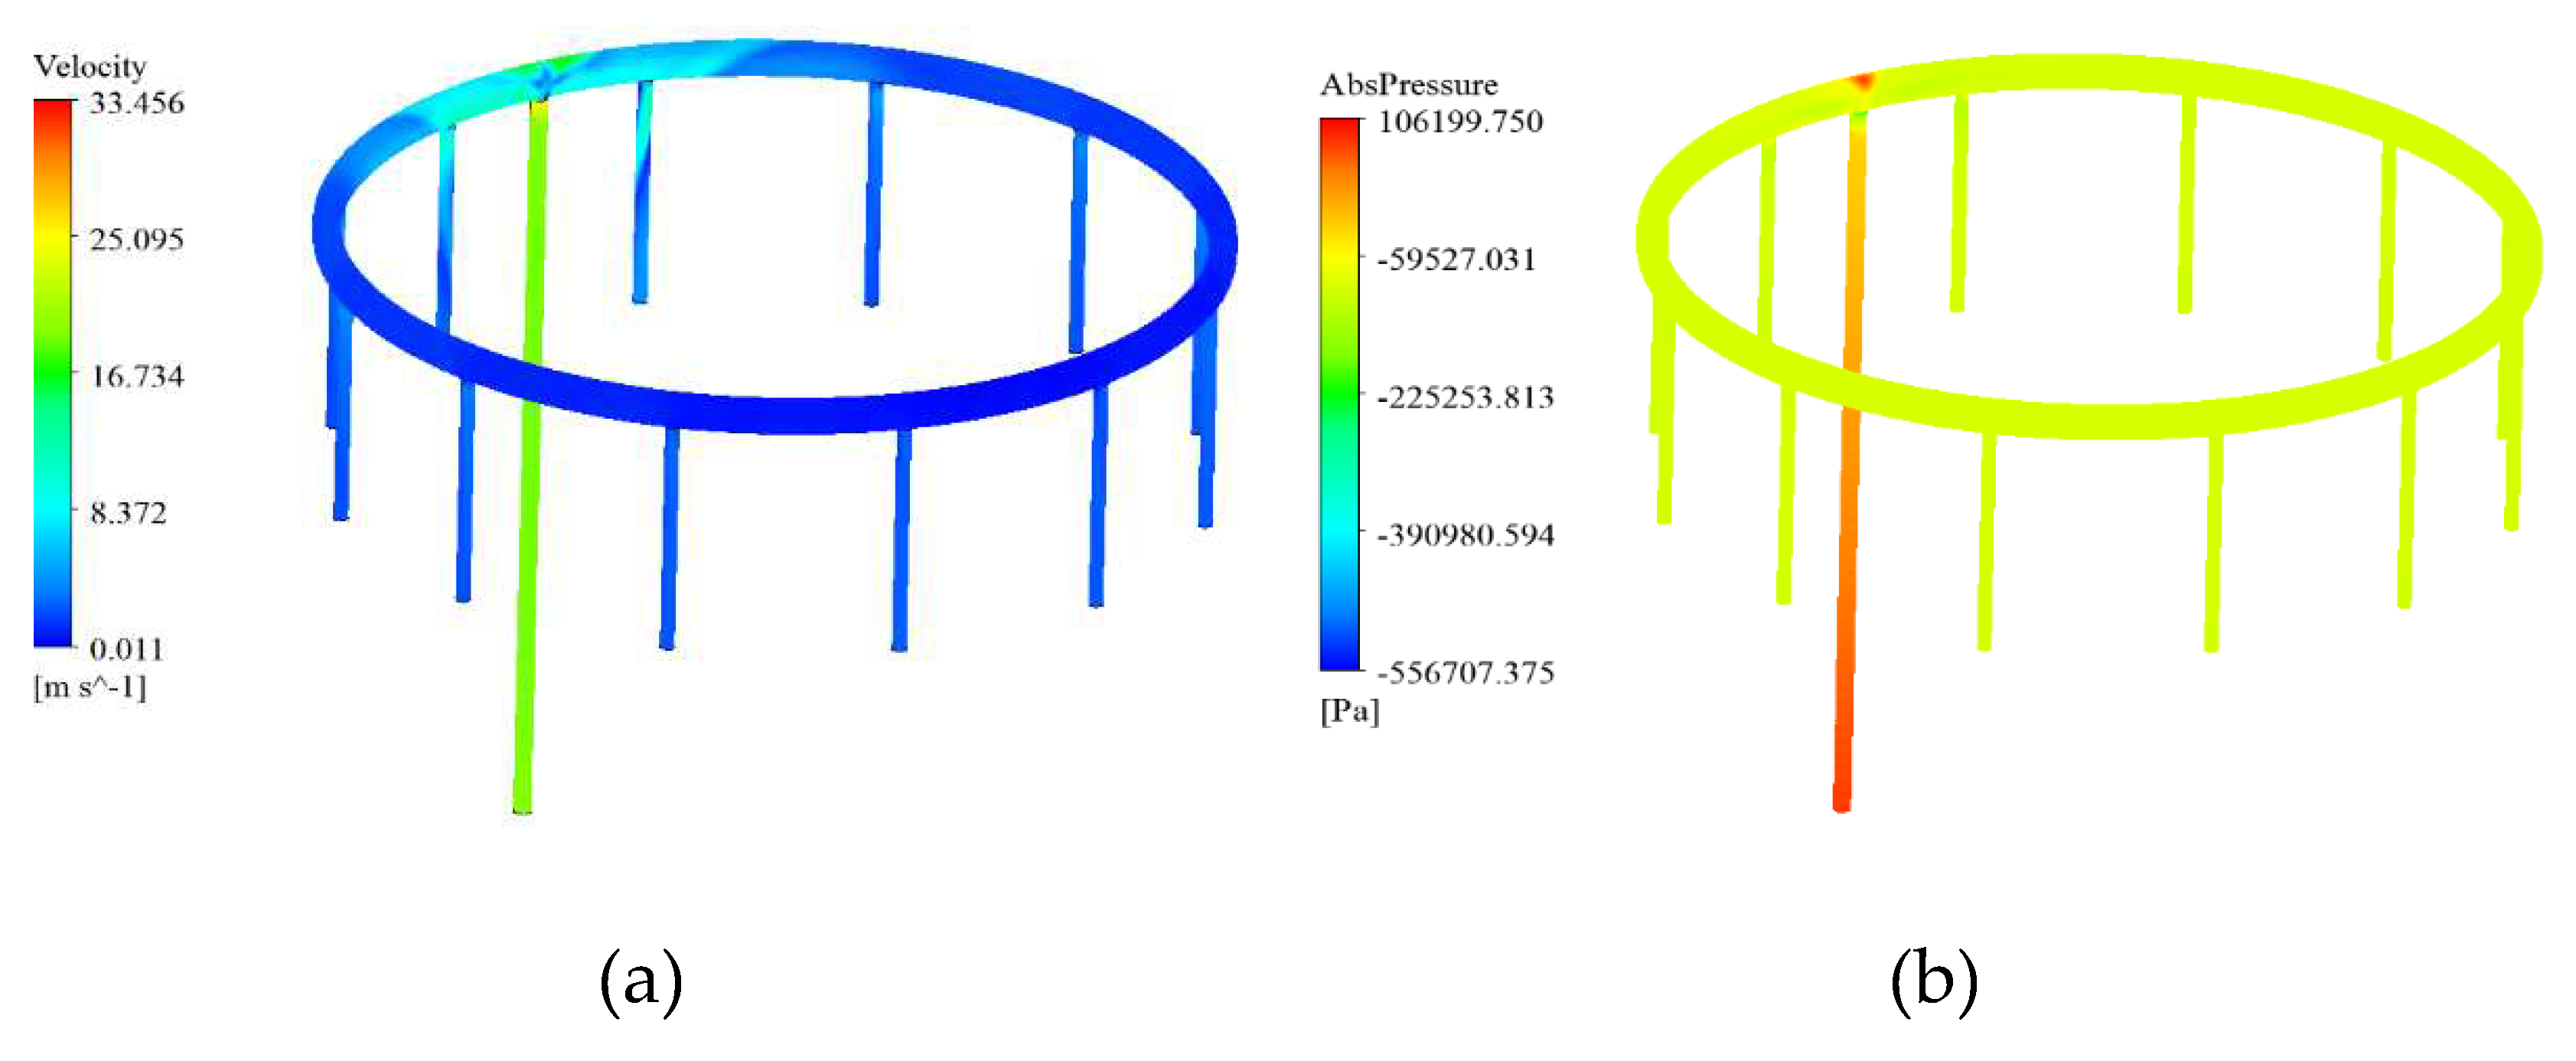
Figure 7, you can also see the contours of pressure and velocity associated with the circular mode. The distribution of pressure in this case is much more uniform than the distribution in
Figure 3, and the pressure ratio at the outlet for all 12 outlet nozzles is very close to that in
Figure 3. The speed contour shown on the left side of Figure (9) demonstrates this result, which is consistent in all cases.
5. Conclusion
The use of computational fluid dynamics can be used to predict fuel supply performance in a micro gas turbine. Additionally, the numerical solution corresponds well with the experimental data, and the results obtained from the numerical solution are accurate. Using simulated samples with circular and square sections, we compare the contours and the numerical results. Accordingly, the difference in speed and pressure drop between the nozzle close to the fuel entry line and the farthest nozzle in the circular sample is less than in the other nozzle. In Micro gas turbines, with annular combustion chambers and circular channels, combustion is more complete and the cost and maintenance requirements are much lower. This is because combustion is more efficient in annular combustion chambers, as the fuel is burned closer to the turbine inlet. Moreover, the circular channels provide a better flow path for the exhaust gases, resulting in less pressure drop.
References
- A. V. Baklanov and S. P. Neumoin, “A technique of gaseous fuel and air mixture quality identification behind the swirl burner of gas turbine engine combustion chamber,” Russ. Aeronaut. 2017 601, vol. 60, no. 1, pp. 90–96, Jun. 2017. [CrossRef]
- O. Karimi, M. K. Koopaee, A. reza Tavakolpour-Saleh, and S. E. Hosseini, “Investigating Overlap Ratio Effect on Performance of a Modified Savonius Wind Turbine: An Experimental Study,” Preprints, Aug. 2023. [CrossRef]
- S. E. Hosseini, O. Karimi, and M. A. AsemanBakhsh, “Experimental Investigation and Multi-objective Optimization of Savonius Wind Turbine Based on modified Non-dominated Sorting Genetic Algorithm-II,” Preprints, Aug. 2023. [CrossRef]
- S. E. Hosseini, O. Karimi, and M. A. AsemanBakhsh, “Multi-objective Optimization of Savonius Wind Turbine,” Aug. 2023. arXiv:arXiv.2308.14648.
- I. I. Enagi, K. A. Al-attab, Z. A. Zainal, and Y. H. Teoh, “Palm biodiesel spray and combustion characteristics in a new micro gas turbine combustion chamber design,” Energy, vol. 254, p. 124335, Sep. 2022. [CrossRef]
- A. Kawahara, P. Y. Chung, and M. Kawaji, “Investigation of two-phase flow pattern, void fraction and pressure drop in a microchannel,” Int. J. Multiph. Flow, vol. 28, no. 9, pp. 1411–1435, Sep. 2002. [CrossRef]
- F. Caresana, “Impact of biodiesel bulk modulus on injection pressure and injection timing. The effect of residual pressure,” Fuel, vol. 90, no. 2, pp. 477–485, Feb. 2011. [CrossRef]
- M. Chmielewski and M. Gieras, “Impact of variable geometry combustor on performance and emissions from miniature gas turbine engine,” J. Energy Inst., vol. 90, no. 2, pp. 257–264, Apr. 2017. [CrossRef]
- A. Džiugys and B. Peters, “An approach to simulate the motion of spherical and non-spherical fuel particles in combustion chambers,” Granul. Matter, vol. 3, no. 4, pp. 231–265, 2001. [CrossRef]
- J. Li and Y. Li, “Micro gas turbine: Developments, applications, and key technologies on components,” Propuls. Power Res., vol. 12, no. 1, pp. 1–43, Mar. 2023. [CrossRef]
- M. Aligoodarz, M. Soleimanitehrani, H. Karrabi, and F. Ehsaniderakhshan, “Numerical simulation of SGT-600 gas turbine combustor, flow characteristics analysis, and sensitivity measurement with respect to the main fuel holes diameter,”, vol. 230, no. 13, pp. 2379–2391, Jan. 2016. [CrossRef]
- J. Zare, S. E. Hosseini, and M. R. Rastan, “Airborne dust-induced performance degradation in NREL phase VI wind turbine: a numerical study,” Int. J. Green Energy, pp. 1–20, Aug. 2023. [CrossRef]
- J. Zare, S. E. Hosseini, and M. R. Rastan, “NREL Phase VI wind turbine in the dusty environment,” arXiv Prepr., Apr. 2023. arXiv:arXiv.2304.06285.
- M. H. Shojaeefard, S. E. Hosseini, and J. Zare, “Numerical simulation and multi-objective optimization of the centrifugal pump inducer,” Modares Mech. Eng., vol. 17, no. 7, pp. 205–216, 2018.
- M. H. Shojaeefard, S. E. Hosseini, and J. Zare, “CFD simulation and Pareto-based multi-objective shape optimization of the centrifugal pump inducer applying GMDH neural network, modified NSGA-II, and TOPSIS,” Struct. Multidiscip. Optim., vol. 60, no. 4, pp. 1509–1525, May 2019. [CrossRef]
- K. H. Do, T. Kim, Y. S. Han, B. Il Choi, and M. Kim, “Investigation on flow distribution of the fuel supply nozzle in the annular combustor of a micro gas turbine,” Energy, vol. 126, pp. 361–373, May 2017. [CrossRef]
- S. E. Hosseini and A. Keshmiri, “Experimental and numerical investigation of different geometrical parameters in a centrifugal blood pump,” Res. Biomed. Eng., vol. 38, no. 5, pp. 423–437, 2022. [CrossRef]
|
Disclaimer/Publisher’s Note: The statements, opinions and data contained in all publications are solely those of the individual author(s) and contributor(s) and not of MDPI and/or the editor(s). MDPI and/or the editor(s) disclaim responsibility for any injury to people or property resulting from any ideas, methods, instructions or products referred to in the content. |
© 2023 by the authors. Licensee MDPI, Basel, Switzerland. This article is an open access article distributed under the terms and conditions of the Creative Commons Attribution (CC BY) license (https://creativecommons.org/licenses/by/4.0/).
