
Submitted:
19 September 2023
Posted:
21 September 2023
You are already at the latest version
Abstract
One of the rapidly developing research areas in the power system is the integration of distributed generation (DG) with the distribution system. The size and location of DG sources had a considerable impact on power system networks. Artificial intelligence (AI) techniques can be used to address multidimensional problems relating to DG size and location in distribution systems. Heuristic optimization offers a reliable and effective method for solving complicated real-world problems. This work focuses on a hybrid approach that combines the two heuristic optimization methods i.e., Particle Swarm Optimization (PSO) and Genetic Algorithm (GA) for the optimal siting and sizing of DG in distribution systems. This hybrid approach combines ideas from GA and PSO and generates individuals in a new generation using both PSO mechanisms and the procedures found in GA. An extensive performance analysis of the IEEE 14 busbar standard test system is conducted to demonstrate the viability of the suggested methodologies. In the designated locations, DG is placed, and the outcomes have been verified. The results indicated that the right placement of DG injection enhances the voltage profile and lowers the distributed system’s power losses. These techniques offer unique methods for determining the location of the DG unit, demonstrating the potential of such a computational techniques to reduce computing time and complexity while simultaneously reducing human errors associated with hit-and-trail methods.
Keywords:
hybrid heuristic approach
; distributed generation
; renewable energy systems
; voltage profile
; power losses
; simulation
; modeling
1. Introduction
The distribution networks are often radial in design, for operational simplicity. Through an associated transmission network, power from centralized generating stations is sent to substations [1]. A substation supplies electrical power to the end consumers through a passive network [2]. The substation serves as the sole point of feeding for radial distribution system (RDS). The power flow in RDS is hence unidirectional. Large voltage drops, poor voltage stability, and substantial power losses are caused by distribution lines with high impedance ratios [3]. In order to increase system reliability and voltage regulation, a number of techniques have recently been put up for enhancing the passiveness of RDS by incorporating power generation sources with minimum range [4]. DG is the terms used to describe such embedded generations in a distribution system. It is anticipated that distributed generation would take on a bigger role in future electrical power networks.
Literature shows a large portion of the upcoming generations that will be operating on lines will be DG. They are expected to make up around 20% of the newly installed generations [5].
Following is a summary of the key factors that are driving force behind DG [6]:
- Small generating locations are simpler to find.
- The newest technology has made plants with capacities ranging from 10 KW to 15 MW possible.
- Because DGs are located nearer to consumers, Transmission and Distribution (T&D) costs can be neglected or minimized.
- Natural gas is available practically everywhere and its prices are predicted to remain steady. It is frequently utilized as fuel in DG stations.
- The installation duration for DG plants are typically shorter, and the risks associated with capital investments are lower.
- DG delivers excellent value since it offers an adjustable way to choose from a variety of cost and reliability combinations.
2. Critical Review of Related Work
There are numerous algorithms and solutions that researchers have developed. The differences relate to the formulation of the problem, the technique, and the assumptions used. Several techniques are described in [7] as analytical approaches, [8] numerical programming, and [9,10] heuristics. Each strategy has pros and cons that depend on the information and system being used. As either an objective function or constraints, distributed generation allocation problems are typically formulated using nonlinear, stochastic, or even fuzzy functions.
Optimum site of the DG injection was addressed by [11]. To determine the ideal place for hosting the DG sources, they created two formulations. The first is a confined optimum power flow based on the market that lowers the price of the DG power produced, and the second is a constrained optimal power flow based on voltage stability that improves the loading factor and the distance to collapse. The Interior Point (IP) approach was used to find the solutions to both formulations. The results of these formulations were utilized to rank the buses for DG injections. They did not address the optimal DG size issue in their work.The authors in [12] offers a technique for optimal distributed generation placement and size in distribution systems, which aims to minimize electrical network losses and provide an adequate level of reliability and voltage profile. During assessing the effects of DG on system reliability, losses, and voltage profile, GA approaches are combined with other methodologies to address the optimization problem. For both single and multiple DG sizing, the optimal DG problem was examined by [13]. To reduce the active power flow in the distribution system, they adopted the GA approach. To overcome the DG sizing problem, the authors in [14] hybridized two approaches. The authors in [15] supposition were that the distribution planner had already designated the candidate’s bus locations for the DG unit to be deployed and investigated the reliability of the power system network. The Ant Lion Optimization method was used by [16] to size the DG and reactive sources inside the distribution system optimally. In order to allocate the distribution static compensator in the radial distribution system optimally, the authors offers a novel method based on a Cuckoo Search Algorithm (CSA) that draws inspiration from biological systems. In the suggested strategy, the Loss Sensitivity Factor (LSF) is used to determine the best places for the DSTATCOM [17]. The newly created CSA is used to replicate the DSTATCOM’s ideal size. The backward/forward sweep technique is used in the suggested method to quickly and effectively calculate load flow. A new approach of DG allocation using hybrid gray wolf optimizer search method was put up by [18] as a tool for for enhancing voltage stability and minimizing power loss.
Some of the literature review are summed up in Table 1. To minimize power losses enhancing voltage stability and to improve voltage profile are the planning objectives taken by different authors. Different solution approaches were proposed by researchers considering site or size as their planning variables. The proposed work in this research paper is then compared in the last row with the existing papers. It is clearly shown that the proposed work is covering all the planing objectives and variables with a single DG unit. This indicates the significant and novelty of the proposed work.
The matrix in Figure 1 makes it easy for researchers to find new combinations that weren’t previously thought of and might produce better solutions and advancements. It also clearly identifies the regions for potential new combinations in hybrid optimization techniques. The matrix also reveals that GA has the greatest proportion, which denotes a high proportion of vastly cited articles that combine GA with other widely used techniques like PSO to address the DGs placement and size issues. The matrix was built using articles that were published during the last decade [25,26,27,28,29,30].
In current scientific literature, most researchers have used single or hybrid algorithms for solving optimization problems relating to DG either by considering size, or location but no approach is present which considers these domains in combination and considering its impact on voltage profile and power losses. None of the researchers in the literature presented the validation of the approach used for the optimization of DG. So, a clear research gap exists in suggesting a new combined approach for the optimization of DG considering these domains. From the literature cited “research question” rises about the optimization of DG. Whether optimized size DG will perform optimally at any location in the distribution network or an optimized location of DG in a distribution network will perform optimally without knowing its optimum size.
The principal goals of this research are as follows:
- This work will formulate the solution for insight issues of size, and location related to DG, and its impact on voltage profile and power losses.
- To Optimize DG unit considering multi-objective functions i.e. voltage profile improvement, and power loss reduction.
- Size of DG is a design criteria problem that has a relevant influence on the distribution system by defining the size of DG without knowing the parameters of the distribution system will have an adverse impact on a distribution network.
- To assess the DG site and size in the distribution network, a novel hybrid GA-PSO method is utilized for the optimum size and location of DG in a distribution network. In this technique, the DG site is identified by GA, and PSO optimizes its size.
- To validate the optimum size and location of the DG unit, its impacts on voltage profile, and power losses.
- To use the solution approach, IEEE 14 bus bar system is modeled and validated for objective functions.
- Comparison of PSO and GA with the proposed hybrid optimization approach.
This research paper is divided into the following sections: problem formulation is discussed in Section 3, flowchart of the proposed novel hybrid GA-PSO is presented in Section 4, simulation result and discussion in Section 5, and a detail comparison analysis of PSO, GA and proposed Hybrid GA-PSO algorithms in Section 6 and conclusion in Section 7 is presented.
3. Problem Formulation
The standard IEEE 14 bus bar test system, as shown in Figure 2, has been considered for research analysis [31]. The IEEE 14 bus bar system is a network of IEEE standards that includes many transformers, load points, circuit breakers, feeders, conductors, generating units, and other components with long and short line parameters. The IEEE 14 bus system was selected as a result of the simple availability of parameters and other data. It consists of five synchronous generators that generate 272.4 MW. There are three transformers with a power rating of 100 MVA. There are 11 loads in the test system totaling 259 MW real power and 73.5 MVAR reactive power. The system consists of 20 branches with a total of 14 buses comprising of 1-Swing bus, 4-Voltage Control Buses, and 9 load buses. The proposed approach is intended to maximize voltage profiling and minimize power losses in a specific IEEE 14 Busbar distribution network in order to optimize technique functionality of the distribution system [31].
3.1. Objective Function
Objective of an optimization task is to maximize or minimize a function. Here, the objective function is expressed mathematically as follows:
In (1) the following notation is employed:
F = Objective Function.
= Real Power Losses of the system in Per Unit.
= Voltage Profile of the system in Per Unit.
K = Penalty Coefficient and it is equal to 0.6.
= Penalty Coefficient and it is equal to 0.32.
= Penalty Coefficient and it is equal to 0.3.
r = Number of branches that is used to fed Bus nr.
NT = Number of total branches.
= Number of total DG units.
nr = Receiving number of Bus (nr = 2, 3,.....,rn).
= Bus rni maximum apparent power.
= Bus rni minimum Voltage.
3.2. Objective Function For Power Losses
The system’s actual power losses are given by , where are real power losses of the ntn-bus distribution system, given by
In (2) the following notation is employed:
ntn = Buses total number in the distribution system.
= Generator active power output at bus nr.
= Demand of active power at bus nr.
= Bus mr Voltage.
= Bus nr Voltage.
= Bus sm and nr admittance.
= Bus mr, Voltage phase angle.
= Bus nr, Voltage phase angle as = ∠.
= phase angle as = ∠.
3.3. Objective Function to Improve Voltage Profile
The objective function for improvement of voltage profile is,
3.4. Constraint on Load Balance
The following equations must be satisfied for every bus:
3.5. Voltage limits
Voltage rises increase in proportion to impedance and power flow. Because distribution network lines have higher resistive elements than other lines, the maximum active power flows have a significant influence on the voltage level. At each bus, the voltage needs to be maintained in a predetermined ranges:
3.6. Technical constraints at the DG
It is essential to limit capacity between the maximum and minimum levels since DG capacity is naturally constrained by the energy supplies available at any given place.
3.7. Network Thermal Limits
Distribution line final thermal limit for the network must not be exceeded:
4. Flowchart of the proposed novel Hybrid GA-PSO
DG optimal site and size problems are formulated as multi-objective constrained optimization issues. In order to address problems with optimal site and size of DG unit, this research work develop a novel Hybrid GA-PSO algorithm. This method of searching is developed for the optimal site and size of the DG unit. There are two parts to this problem. The first is the best place for the DG unit, and the second is the best size. The outcome of the first portion is an integer that either corresponds to the bus number where it is recommended that DGs be installed. An optimization algorithm based on integers is required for this problem. Due to its attractiveness, GA was chosen to play this role. The PSO method optimizes the sizing for DG using the output from the GA solution. PSO can rapidly converge, which is a very desirable quality for a big iterative and time-consuming optimization problem. Figure 3 illustrates the flow chart of the proposed methodology that how the two algorithms interact with one another.
The flowchart in Figure 3 is presented as follows:
- In the initialization step, Make the timer t = 0 and randomly produce “n” chromosomes, which correspond to the “n” initial candidates for the DG’s sitting.
- Using PSO for fitness: Analyze each chromosome and optimal DG size.
- Setup the particle population and modified matrix, as well as the DG, contain size.
- Calculate the improvement in the voltage profile and the total real power losses, which are the objective values.
- Record the objective function as; the minimum value as the current overall global best of the group and the best candidate of the particle.
- Upgrade the position and velocity (V).
- Verify the stop criterion, and if it is met, stop.
- Upgrade the time counter with updating t = t + 1.
-
Repetition of the following processes will result in the creation of a new population of DG sittings.a) Selectionb) Crossoverc) Mutation
- Using PSO for fitness, and updating of time.
- If the stopping criteria meet, stop; otherwise, proceed to time updating.
5. Simulation result and discussion
The suggested techniques for DG’s optimum siting and sizing has been implemented in Python and tested with an IEEE-14 Busbar system. The test findings for the IEEE-14 Busbar distribution systems are provided and discussed in this section.
In this research Python is used as a scripting tool to use for the implementation of algorithms proposed in Figure 3. The optimal output from Python in term of site and size of DG unit were validated in ETAP software considering the voltage profile improvement and power losses reduction of IEEE 14 bus test system.
Four different cases have been examined and then validated in ETAP considering voltage profile improvement and power loss reduction. The four cases include:
- Analysis of objective function without DG unit.
- Analysis of objective function by the implementation of Particle Swarm optimization.
- Analysis of objective function by the implementation of Genetic Algorithm.
- Analysis of objective function by the implementation of Hybrid Algorithm.
5.1. Case-I: Analysis of objective function without DG unit
The IEEE 14 busbar test system, as shown in Figure 4, has been considered for use in order to perform our research analysis on distributed networks. The IEEE 14 busbar test system is modeled in ETAP, and analyze for the objective function. This analysis will serve as a reference case for all later cases. The IEEE 14 busbar system is a network of IEEE standards that includes five synchronous generators that generates 272.4 MW. There are three transformers with a power rating of 100 MVA. There are 11 loads in the test system totaling 259.0 MW real power and 73.50 MVAR reactive power. The system consists of 20 branches with a total of 14 buses comprising of 1-Swing bus, 4-Voltage Control Buses, and 9 load buses. Using the Newton Raphson’s method, the system’s real power losses are 13401.5 kW, while its reactive power losses are 30125.3 kVar.
When the power flow analysis is performed through ETAP voltage levels are described in the following way because they fall into different ranges. If the busbar color is black, it will be in a normal operating state. If the busbar color changed to pink when it was linked to the load point, it would indicate abnormal operating conditions. This condition indicates a little increment or decrement in voltage profile from the normal operating states and may be acceptable. But if the busbar color changes to red when it is linked to the load point, a critical operational state will be indicated. This critical operating state is either above the over-voltage state or below the under-voltage state. This condition is unacceptable and shows an indication of the improvement in the voltage level.
5.1.1. Analysis of Voltage Profile
In this first case, the system analysis will be performed without the additional injection of DG unit into the system. Figure 5 depicts the load flow analysis. Drop in voltage profile from the source to the load is shown in Figure 6 This decrease in voltage level is caused by different factors including line impedance and reactive loads etc.
5.1.2. Analysis of Power Losses
Table 2 and Figure 7 depicts the system’s overall power losses when no additional DG unit is injected into the distribution network. These losses are caused by line impedances and current flow. These losses also include fixed losses that are constant and could not be changed, such as transformer losses. As no additional DG unit is injected, the complete power is delivered by the generators already linked to the test system. Current transfer from these generators to consumer areas via lines results in significant power losses.
5.2. Case-II: Analysis of objective function by the implementation of Particle Swarm Optimization algorithm
The optimal size and location obtained by programing PSO algorithm in Python considering the objective function is shown in Table 3.
Location at busbar “10” with 12 MW size has been found as the optimum place and optimum size respectively for injection of the DG unit. This site is far from the source generators with connected load of 10.707 MVA. Figure 8 depicts the DG units in-cooperation at busbar “10”.
The specifications used for the PSO model are as follows:
- Number of populations taken = 40
- Number of iterations taken = 40
-
Input variable includes the following data of IEEE 14 busbar system: - Bus data- Line data- Transformers data- Connected load data- Connected generators data- Line impedances data
-
Output variables includes the following data: - DG unit best optimal size- DG unit best optimal location- Time taken by this algorithm
5.2.1. Validation in ETAP considering Voltage Profile and Power Losses of the system
In order to validate the optimized solution, ETAP software was employed to analyze the predicted site and DG unit size. Figure 9 depicts the system’s load flow analysis while Figure 10 shows voltage profile at each busbar when DG is optimally injected, as proposed by PSO algorithm. Figure 10 demonstrates an improvement in the voltage profile with respect to base case. A reduction in power losses has also been achieved by the deployment of the method.
Busbar “10”, with DG unit size of 12 MW, was the best solution predicted by PSO that minimizes the objective function. As indicated in Figure 11, overall real power losses in this case were decreased from 13401.5 kW to 5482.9 kW while reactive power losses were reduced from 30125.3 kVAR to 3042.2 kVAR. Table 4. shows a decrease in percent of power losses from the pre-installation case.
5.3. Case-III: Analysis of objective function by the implementation of Genetic Algorithm
The optimum site and size for a DG unit have been determined using a GA that has been programmed and implemented in Python. The objective function has been to improve the voltage profile and minimize the power losses. The best parameters for power generation size and location have been established, as illustrated in Table 5.
Location at busbar “9” with 11.85 MW size has been found as the optimum place and optimum size respectively for injection of the DG unit. This site is far from the source generators with connected load of 33.85 MVA. Figure 12 depicts the DG units in-cooperation at busbar “9”.
The specifications used for the GA model are as follows:
- Number of populations taken = 50
- Number of iterations taken = 60
-
Input variable includes the following data of IEEE 14 busbar system: - Bus data- Line data- Transformers data- Connected load data- Connected generators data- Line impedances data
-
Output variables includes the following data: - DG unit best optimal size- DG unit best optimal location- Time taken by this algorithm
5.3.1. Validation in ETAP considering Voltage Profile and Power Losses of the system
In order to validate the optimized solution, ETAP software was used to analyze the predicted optimum location and DG unit size. Figure 13 depicts the system’s load flow analysis while Figure 14 shows voltage profile at each busbar when DG is optimally injected, as proposed by GA. Figure 14 demonstrates an improvement in the voltage profile with respect to base case. A reduction in power losses has also been achieved by the deployment of the method.
Busbar “9”, with DG unit size of 11.85 MW, was the best solution predicted by GA that minimizes the objective function. As indicated in Figure 15, overall real power losses in this case were decreased from 13401.5 kW to 5624.3 kW while reactive power losses were reduced from 30125.3 kVAR to 3216.5 kVAR. Table 6. shows a decrease in percent of power losses from the pre-installation case.
5.4. Case-IV: Analysis of objective function by the implementation of Hybrid Algorithm
The primary purpose of employing a hybrid algorithm in this research paper is to model the best algorithm for finding the most possible location and size for DG unit in a distribution system, which leads to an improved voltage profile and reduced power losses in the distribution system. The objective of applying the hybrid-based model was to assess the proposed algorithm’s predictive competencies to this extent that it had a reasonable chance of conducting well in terms of picking the optimum location and size of DG for the specified distribution network, as well as to establish its effectiveness and validation of implementation. The specifications used for the proposed hybrid model are as follows:
- Number of populations for GA taken = 30
- Number of populations for PSO taken = 20
- Number of iterations taken = 30
-
Input variable includes the following data of IEEE 14 busbar system:- Bus data- Line data- Transformers data- Connected load data- Connected generators data- Line impedances data
-
Output variables include the following data:- DG unit best optimal size- DG unit best optimal location- Time taken by this algorithm
Python scripting tool was used to program the Hybrid technique. Table 7 shows the desired output variables.
5.4.1. Validation in ETAP considering Voltage Profile and Power Losses of the system
As shown in Figure 16, a 10 MW DG unit was installed at busbar “14” close to load 14 of 15.717 MVA. Figure 16 illustrates the hybrid algorithm’s insertion of a DG unit at the optimum location. The results in Figure 17 demonstrate load flow analysis while Figure 18 shows the profile of voltages at each busbar. An improvement in the voltage profile is clearly shown on each busbar of the system in comparison to the base case where no DG was injected.
It is clear from the load flow analysis that busbar “14”, with 10 MVA size predicted by the hybrid algorithm, is the optimum placement for the DG unit and is validated because the test system’s objective function was further improved. As indicated in Figure 19, overall real power losses, in this case, were decreased from 13401.5 KW to 5056.2 KW while reactive power losses were reduced from 30125.3 KVAR to 1304.7 KVAR. Table 8. shows a decrease in the percent of power losses from the pre-installation case.
6. Comparison Analysis of proposed Novel Hybrid GA-PSO Algorithm with Particle Swarm Optimization and Genetic Algorithm
The voltage profiles for each of the 14 buses shown in Figure 20 and Table 9. This is the comparative analysis of the voltage profile when load flow analysis was performed without DG and when DG is injected according to the prediction of PSO, GA, and Hybrid GA-PSO algorithms. The voltage profile of each busbar is shown. Voltage profile of busbar 1 is 1KV while the other busbars voltage profile ranges between 0.85 KV to 0.94 KV in base case when no DG unit was injected. This disturbance in voltage profile from supply towards the end users is due to high impedance in lines, transformer R/X ratios and reactive nature of lumped loads. It is analyzed from this figure that much better results were received when the Hybrid algorithm was used. The voltage profile on each busbar is uniform and within acceptable limits, while if we look at GA and PSO approach the profile on busbars 6 and 3 more or less exceeded the given limit. While clear improvement is analyzed when DG unit is injected according to the predictions of Hybrid GA-PSO algorithm. The busbars voltage level are quite improved from the base case and other cases respectively. It has been observed that the objective function is further improved. That validates that optimum location has a greater impact on the system and on economical aspects i.e. in terms of DG size reduction.
Similarly Figure 21 and Table 10 indicate that employing a hybrid approach for DG unit sizing and location reduced the power losses to acceptable IEEE levels/standards. The total real power losses when No DG unit is injected are 13402.50 KW while the total reactive power losses are 30125.3 KVAR. These losses also includes the fixed losses that are constant and could not be changed such as line impedances losses, transformer losses, and losses due to reactive loads. It is shown here that the real power losses are improved upto 59% and reactive power losses improved upto 89% from the base case when DG unit was injected according to the prediction of PSO algorithm. Similarly the real power losses are improved upto 58% and reactive power losses improved upto 89% from the base case when DG unit was injected according to the prediction of GA algorithm. While, when overall power losses were compared, much improvement is shown when the hybrid GA-PSO approach was used. The real power losses decreased by up to 62% and the reactive power losses were reduced by up to 95% from the base case. This analysis shows that objective function is much better achieved when a hybrid GA-PSO algorithm was employed. The application of the hybrid strategy is a completely novel method for deciding the site and size of DG units, demonstrating that the use of such artificial intelligence techniques can reduce computational complexities and computation time while also reducing human errors connected to hit-and-trail methods and other metaheuristic approaches.
Furthermost, it is established from the results that the location of the DG unit is far more important than the size of the DG unit. The DG capacity siting (also called location allocation) is an important consideration for economic operations with the lowest investment. DG integration at an optimized location can have a great impact on economical aspects as it will reduce the size of the DG unit.
With this hybrid approach, the search space is minimized and a tight distribution of search results is produced. The GA technique, an integer-based optimization algorithm, is used to conduct the search since the site is denoted by a discrete variable (the bus number, which is given by an integer varying from 1 to 14). The PSO algorithm then uses the result of the GA approach to optimize the DG’s sizing. However, the main drawback of this approach is that it takes more time to implement than if either approach were used independently. This issue is not extremely significant because the combined method is implemented offline. However, compared to the other two, the GA’s running time was quicker, and PSO’s was the slowest. This test was conducted by giving each algorithm the same number of iterations i.e., 40 with a population size of 30 selected for each algorithm. These algorithms were programmed in Python and run-on Intel(R) Core (TM) i5-3340M CPU at 2.70 GHz with 6 GB installed ram. The output result is shown in Table 11.
Figure 22 shows the variance for the objective functions. For the population size selected for each algorithm, the variance is determined. The output variances for PSO and GA are 0.0703 and 2.2014, respectively, whereas it was discovered that the variance for the hybrid technique is 0.0192. The results obtained from GA are a little far from the mean with respect to PSO and Hybrid GA-PSO. This shows that the hybrid method’s output is uniform whereas the others are not. The hybrid technique is shown to be preferable over the other two by having the most suitable variance. This suggests that the hybrid approach is delivering high-quality solutions.
.
7. Conclusions
This work demonstrated the formulation and application of a novel hybridized GA-PSO algorithm to assist in lowering system power losses and enhancing the voltage profile through optimizing the placement and sizing of DG. The IEEE 14-bus test system’s voltage profile was improved and the optimal location and size for the DG unit were found using the hybrid method, which was validated in ETAP. As a result, the objectives of the research work were successfully attained. From the test system application results, it was concluded that the percent power losses reduced using the GA approach were 58.03% active losses and 89.32% reactive losses. The percent power losses reduced using the PSO approach were 59.08% active losses and 89.90% reactive losses. While the percent power losses reduced using the hybrid approach were 62.27% active losses and 95.66% reactive losses. The voltage profile in the case of the hybrid approach was far better than the PSO and GA approaches. However, the computational time or running time of the GA, PSO, and hybrid algorithm for the same number of iterations was 233.976 seconds, 314.766 seconds, and 853.484 seconds respectively. These overall facts and figures recognized the application of this novel hybrid approach to be the best method for optimizing the location and size of DG unit in various power system networks to lower power losses and enhance voltage profiles at the same time.
The electrical engineering field will benefit from this research in the following ways:
- This research formulates a solution for insight problems relating to DG and its effect on voltage profile and power losses in the electrical power network.
- In this study, a novel hybrid GA-PSO algorithm was used to select the location of the DG unit in the distribution network, confirming that using such a computational strategy might reduce human errors related to hit-and-trail approaches as well as computational complexities and time.
- System indices were lowered to acceptable IEEE levels, demonstrating the significant potential of this hybrid method when used in this situation.
Author Contributions
Funding acquisition, N.F.S; Methodology, S.A. & M.M; Project administration, J.K; Validation, M.A.A & S.A.; Software, M.A.A & S.A.; Writing—original draft, M.A.A; Supervision, J.K and N.F.S; Visualization, N.F.S & M.M; Writing—review & editing, J.K. All authors have read and agreed to the published version of the manuscript.
Funding
This work was supported by Princess Nourah bint Abdulrahman University Researchers Supporting Project number (PNURSP2023R66), Princess Nourah bint Abdulrahman University, Riyadh, Saudi Arabia.
Institutional Review Board Statement
Not applicable.
Informed Consent Statement
Not applicable.
Data Availability Statement
All the data have been included in the study.
Acknowledgments
The authors would like to acknowledge the support of Princess Nourah bint Abdulrahman University, Riyadh, Saudi Arabia.
Conflicts of Interest
The authors declare no conflict of interest.
Sample Availability
Not applicable.
Abbreviations
| DG | Distributed Generation |
| QoS | Quality of Services |
| PSo | Particle Swarm Optimization |
| GA | Genetic Algorithm |
| ANSI | American National Standards Institute |
| CVP | Constant Voltage Point |
| WES | Wind Energy System |
| FC | Fuel Cell |
| PEMFC | Polymer Electrolytes Membrane Fuel Cell |
| PAFC | Phosphoric Acid Fuel Cell |
| AFC | Alkaline Fuel Cell |
| SOFC | Solid Oxides Fuel Cell |
| PV | Photovoltaic |
| AC | Alternating Current |
| DC | Direct Current |
| RDS | Renewable Distribution System |
| T&D | Transmission and Distribution |
References
- Abdullah, F.B.; Iqbal, R.; Memon, F.S.; Ahmad, S.; El-Affendi, M.A. Advancing Sustainability in the Power Distribution Industry: An Integrated Framework Analysis. Sustainability 2023, 15, 8149. [Google Scholar] [CrossRef]
- Jamii, J.; Mansouri, M.; Trabelsi, M.; Mimouni, M.F.; Shatanawi, W. Effective artificial neural network-based wind power generation and load demand forecasting for optimum energy management. Frontiers in Energy Research 2022, 10, 898413. [Google Scholar] [CrossRef]
- Padmanaban, S.; Khalili, M.; Nasab, M.A.; Zand, M.; Shamim, A.G.; Khan, B. Determination of power transformers health index using parameters affecting the transformer’s life. IETE Journal of Research 2022, 1–22. [Google Scholar] [CrossRef]
- Georgilakis, P.S.; Hatziargyriou, N.D. A review of power distribution planning in the modern power systems era: Models, methods and future research. Electr. Power Syst. Res 2015, 121, 89–100. [Google Scholar] [CrossRef]
- Hirsch, A.; Parag, Y.; Guerrero, J. Microgrids: A review of technologies, key drivers, and outstanding issues. Renewable and sustainable Energy reviews 2018, 90, 402–411. [Google Scholar] [CrossRef]
- Abdmouleh, Z.; Gastli, A.; Ben-Brahim, L.; Haouari, M.; Al-Emadi, N.A. Review of optimization techniques applied for the integration of distributed generation from renewable energy sources. Renewable Energy 2017, 113, 266–280. [Google Scholar] [CrossRef]
- Khattara, A.; Arif, S. Optimal Placement of Distributed Generation Based PV Source in Electrical Power System for LVSI Improvement Using GA Algorithm. Artif. Intell. Renew. Towards Energy Transit. 2021, 174, 252. [Google Scholar]
- Prettico, G.; Flammini, M.G.; Andreadou, N.; Vitiello, S.; Fulli, G.; Masera, M. Distribution System Operators Observatory 2018—Overview of the Electricity Distribution System in Europe. EUR 29615 EN; Publications Office of the European Union: Luxembourg 2019. [Google Scholar]
- Wang, Z.; Chen, B.; Wang, J.; Kim, J.; Begovic, M.M. Robust Optimization Based Optimal DG Placement in Microgrids. IEEE Trans. Smart Grid 2014, 5, 2173–2182. [Google Scholar] [CrossRef]
- Muhammad Aamir, A.; et al. Optimal Siting of Distributed Generation Unit in Power Distribution System considering Voltage Profile and Power Losses. Hindawi Mathematical Problems in Engineering 2022, 5638407. [Google Scholar]
- Das, C.K.; Bass, O.; Kothapalli, G.; Mahmoud, T.S.; Habibi, D. Overview of energy storage systems in distribution networks: Placement, sizing, operation, and power quality. Renewable and Sustainable Energy Reviews 2018, 91, 1205–1230. [Google Scholar] [CrossRef]
- Papadimitrakis, M.; Giamarelos, N.; Stogiannos, M.; Zois, E.N.; Livanos, N.I.; Alexandridis, A. Metaheuristic search in smart grid: A review with emphasis on planning, scheduling and power flow optimization applications. Renewable and Sustainable Energy Reviews 2021, 145, 111072. [Google Scholar] [CrossRef]
- Abdul Hasib, S.; Mehedi, H.; Sharnali, I.; Khalid, R. Prospective Smart Distribution Substation in Bangladesh: Modeling and Analysis. Sustainability 2021, 13, 10904. [Google Scholar]
- Ehsan, A.; Yang, Q. Optimal integration and planning of renewable distributed generation in the power distribution networks: A review of analytical techniques. Applied Energy 2018, 210, 44–59. [Google Scholar] [CrossRef]
- Sanaullah, A.; Azzam ul, A. Reliability enhancement of electric distribution network using optimal placement of distributed generation. Sustainability 2021, 13, 20. [Google Scholar]
- Ali, E.S.; Elazim, S.M.A.; Abdelaziz, A.Y. Ant Lion Optimization Algorithm for optimal location and sizing of renewable distributed generations. Renewable Energy, 2017, 101, 1311–1324. [Google Scholar] [CrossRef]
- Siam, A.I.; Soliman, N.F.; Algarni, A.D.; El-Samie, A.; Fathi, E.; Sedik, A. Deploying machine learning techniques for human emotion detection. Computational intelligence and neuroscience 2022. [Google Scholar] [CrossRef]
- Kamel, S.; et al. Optimal DG allocation for enhancing voltage stability and minimizing power loss using hybrid gray wolf optimizer. Turkish Journal of Electrical Engineering and Computer Sciences 2019, 27, 2947–2961. [Google Scholar] [CrossRef]
- Sanjay, R.; Jayabarathi, T.; Raghunathan, T.; Ramesh, V.; Mithulananthan, N. Optimal allocation of distributed generation using hybrid grey wolf optimizer. Ieee Access, 2017, 5, 14807–14818. [Google Scholar] [CrossRef]
- Rakesh, R.; VenkataPapana, P.; Keerthi, S. A hybrid algorithm for optimal allocation of DG in radial distribution system. In 2017 IEEE region 10 symposium (TENSYMP) 2017, 1–5. [Google Scholar]
- Yuvaraj, T.; Devabalaji, K.R.; Ravi, K. Optimal allocation of DG in the radial distribution network using bat optimization algorithm. Advances in Power Systems and Energy Management: ETAEERE-2016 2018, 563–569. [Google Scholar]
- Hemeida, M.G.; Ibrahim, A.A.; Mohamed, A.A.A.; Alkhalaf, S.; El-Dine, A.M.B. Optimal allocation of distributed generators DG based Manta Ray Foraging Optimization algorithm (MRFO). Ain Shams Engineering Journal 2021, 12, 609–619. [Google Scholar] [CrossRef]
- George, D.T.; Raj, R.E.; Rajkumar, A.; Mabel, M.C. Optimal sizing of solar-wind based hybrid energy system using modified dragonfly algorithm for an institution. Energy Conversion and Management 2023, 283, 116938. [Google Scholar] [CrossRef]
- Ahmed, M.I.; Kumar, R. Nodal electricity price based optimal size and location of dgs in electrical distribution networks using ANT LION optimization algorithm. Distributed Generation & Alternative Energy Journal 2023, 111–140. [Google Scholar]
- Razavi, S.E.; Rahimi, E.; Javadi, M.S.; Nezhad, A.E.; Lotfi, M.; Shafie-khah, M.; Catalão, J.P. Impact of distributed generation on protection and voltage regulation of distribution systems: A review. Renewable and Sustainable Energy Reviews 2019, 105, 157–167. [Google Scholar] [CrossRef]
- Villena-Ruiz, R.; Honrubia-Escribano, A.; Gómez-Lázaro, E. Solar PV and Wind Power as the Core of the Energy Transition: Joint Integration and Hybridization with Energy Storage Systems. Energies 2023, 16, 2917. [Google Scholar] [CrossRef]
- Shebl, S.; Soliman, N.F.; El-Fishawy, N.A.; Abou-El-Azm, A.E.; Alshebeili, S.A.; Abd El-Samie, F.E. Performance enhancement of power line communication systems with efficient low density parity-check codes, noise removal, equalization, and chaotic interleaving. Digital Signal Processing 2013, 23, 1933–1944. [Google Scholar] [CrossRef]
- Lasabi, O.; Swanson, A.; Jarvis, L.; Aluko, A.; Brown, M. Enhanced Distributed Non-Linear Voltage Regulation and Power Apportion Technique for an Islanded DC Microgrid. Applied Sciences 2023, 13, 8659. [Google Scholar] [CrossRef]
- Alghamdi, A.S. Optimal Power Flow of Hybrid Wind/Solar/Thermal Energy Integrated Power Systems Considering Costs and Emissions via a Novel and Efficient Search Optimization Algorithm. Applied Sciences 2023, 13, 4760. [Google Scholar] [CrossRef]
- Khalesi, N.; Rezaei, N.; Haghifam, M.-R. DG allocation with application of dynamic programming for loss reduction and reliability improvement. Int J Elect Power Energy Syst 2011, 33, 288–95. [Google Scholar] [CrossRef]
- Boudreaux, J.A. Design, simulation, and construction of an IEEE 14-bus power system. Louisiana State University and Agricultural & Mechanical College 2018. [Google Scholar]
Figure 1.
Matrix of previously reported hybrid techniques for solving the Distributed Generation placement and size problem [25,26,27,28,29,30].
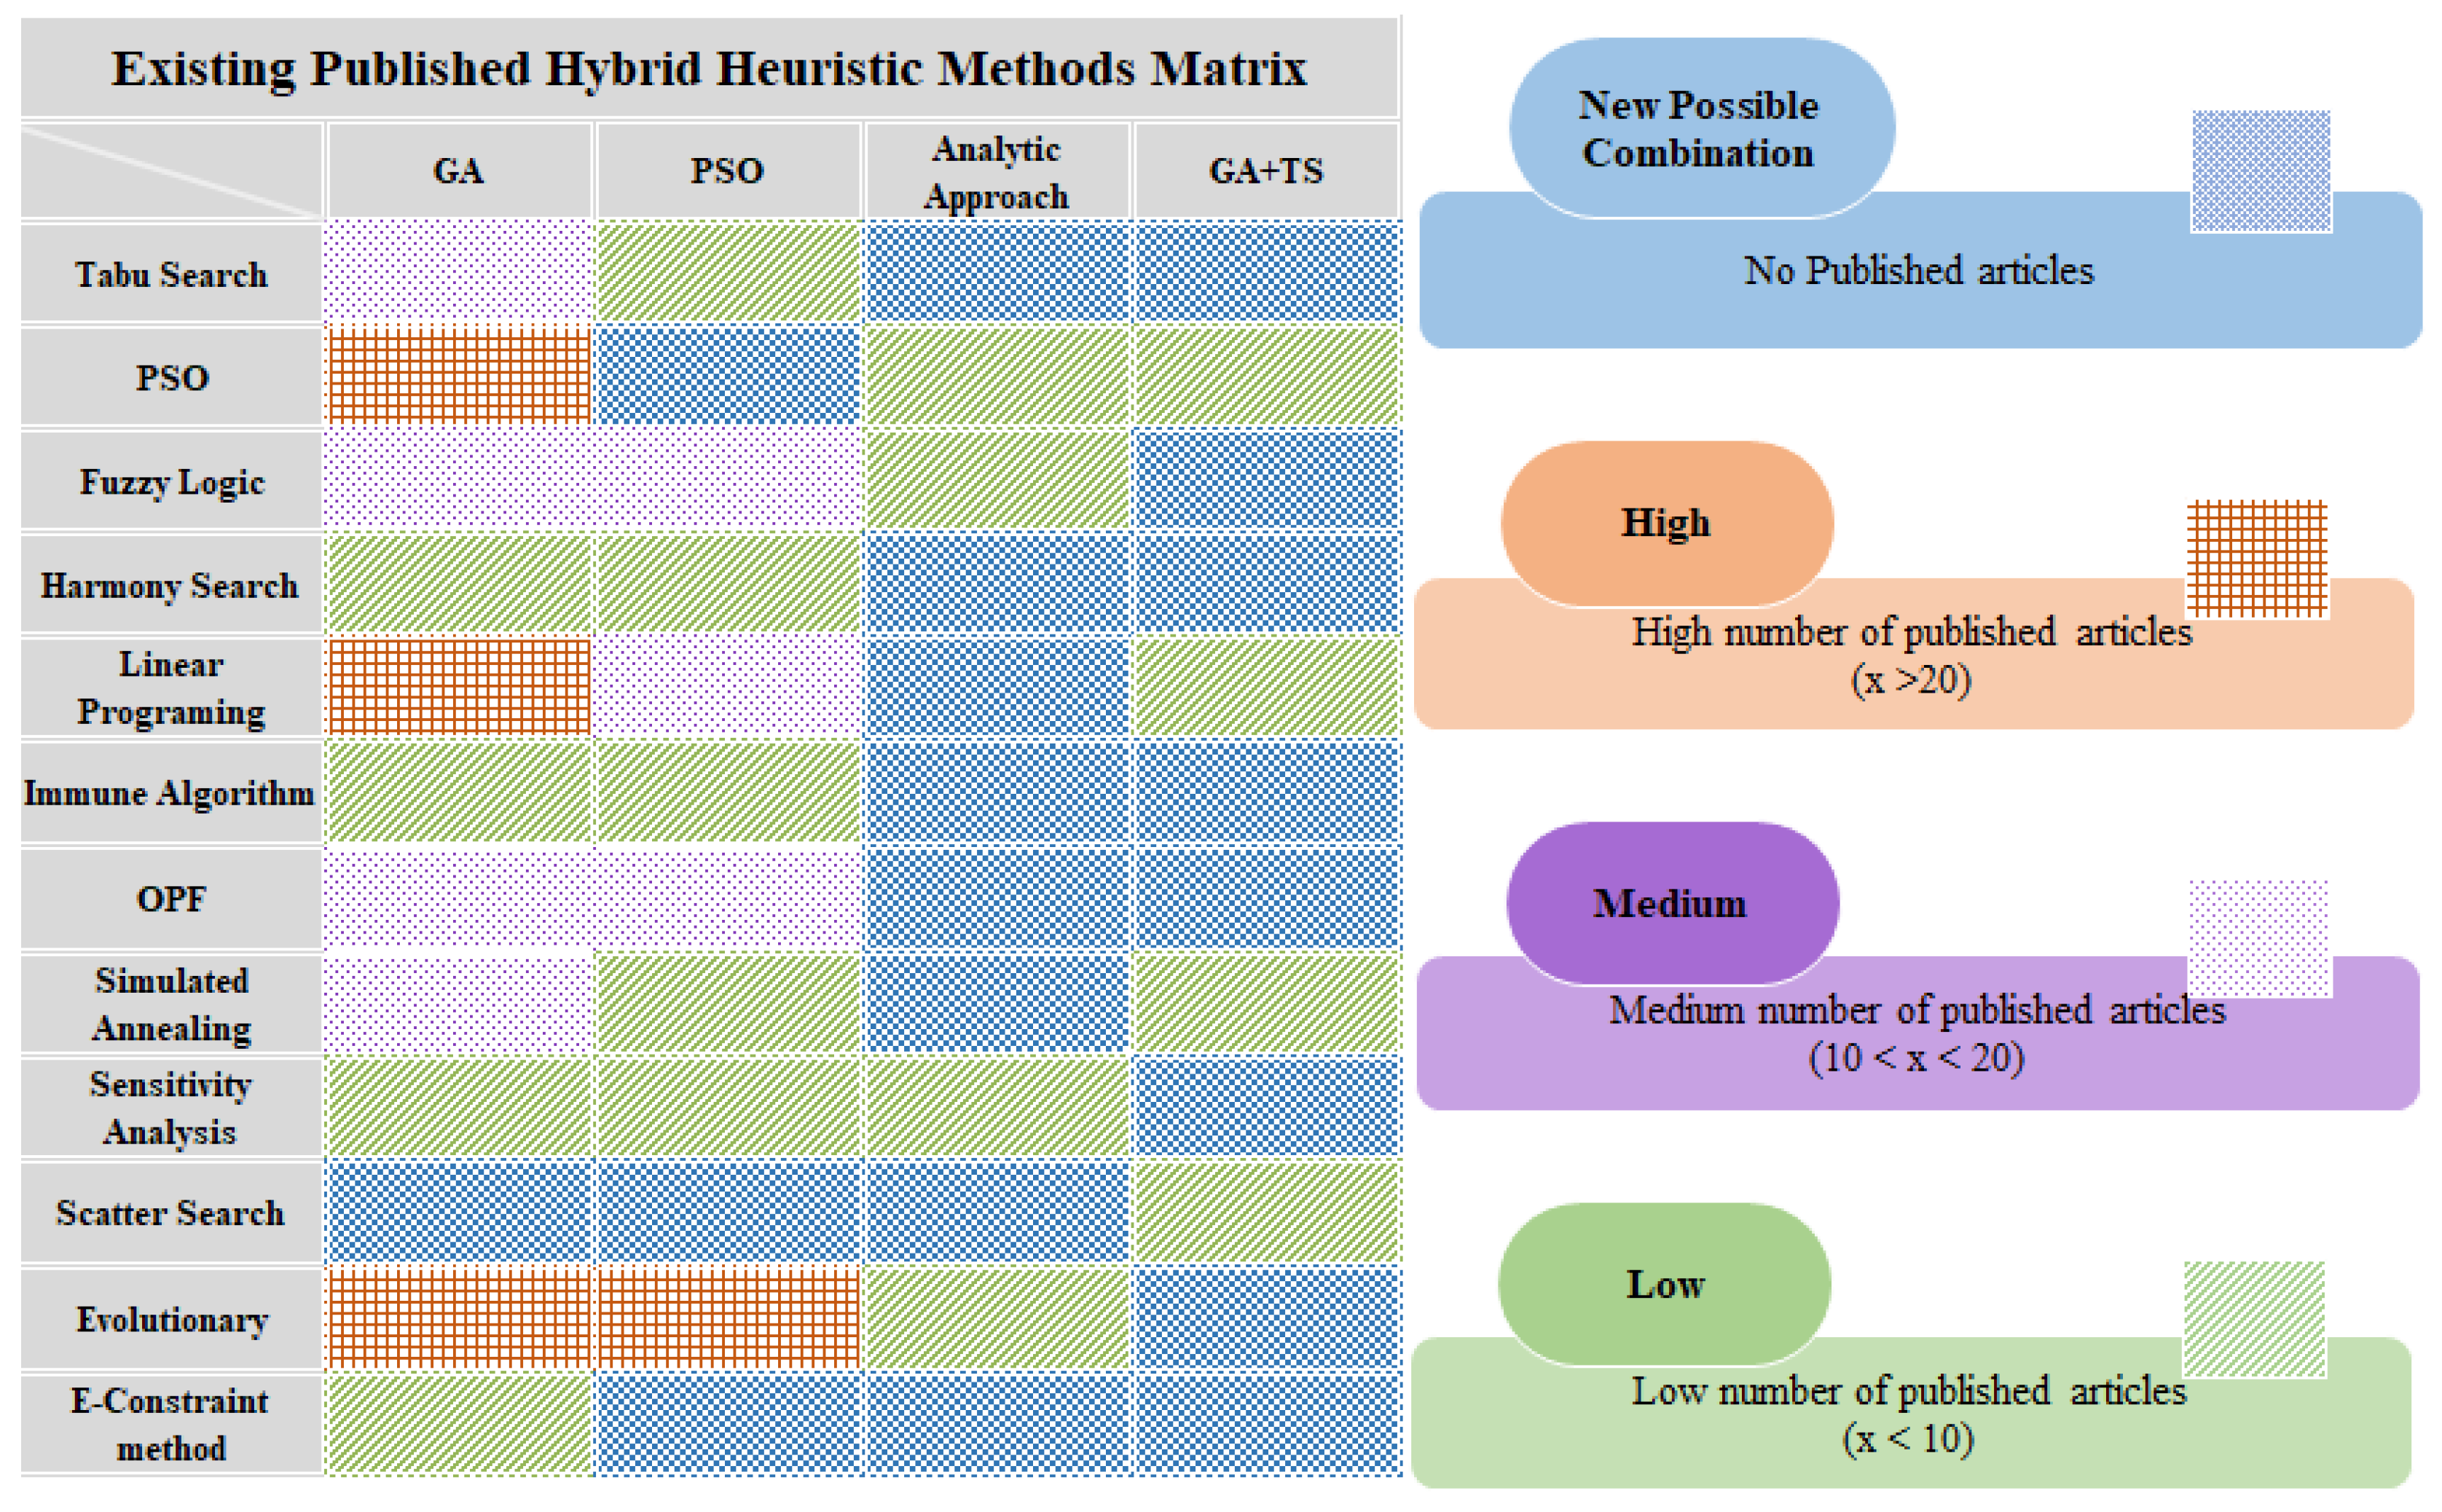
Figure 2.
IEEE 14-busbar single line diagram [31].
Figure 2.
IEEE 14-busbar single line diagram [31].
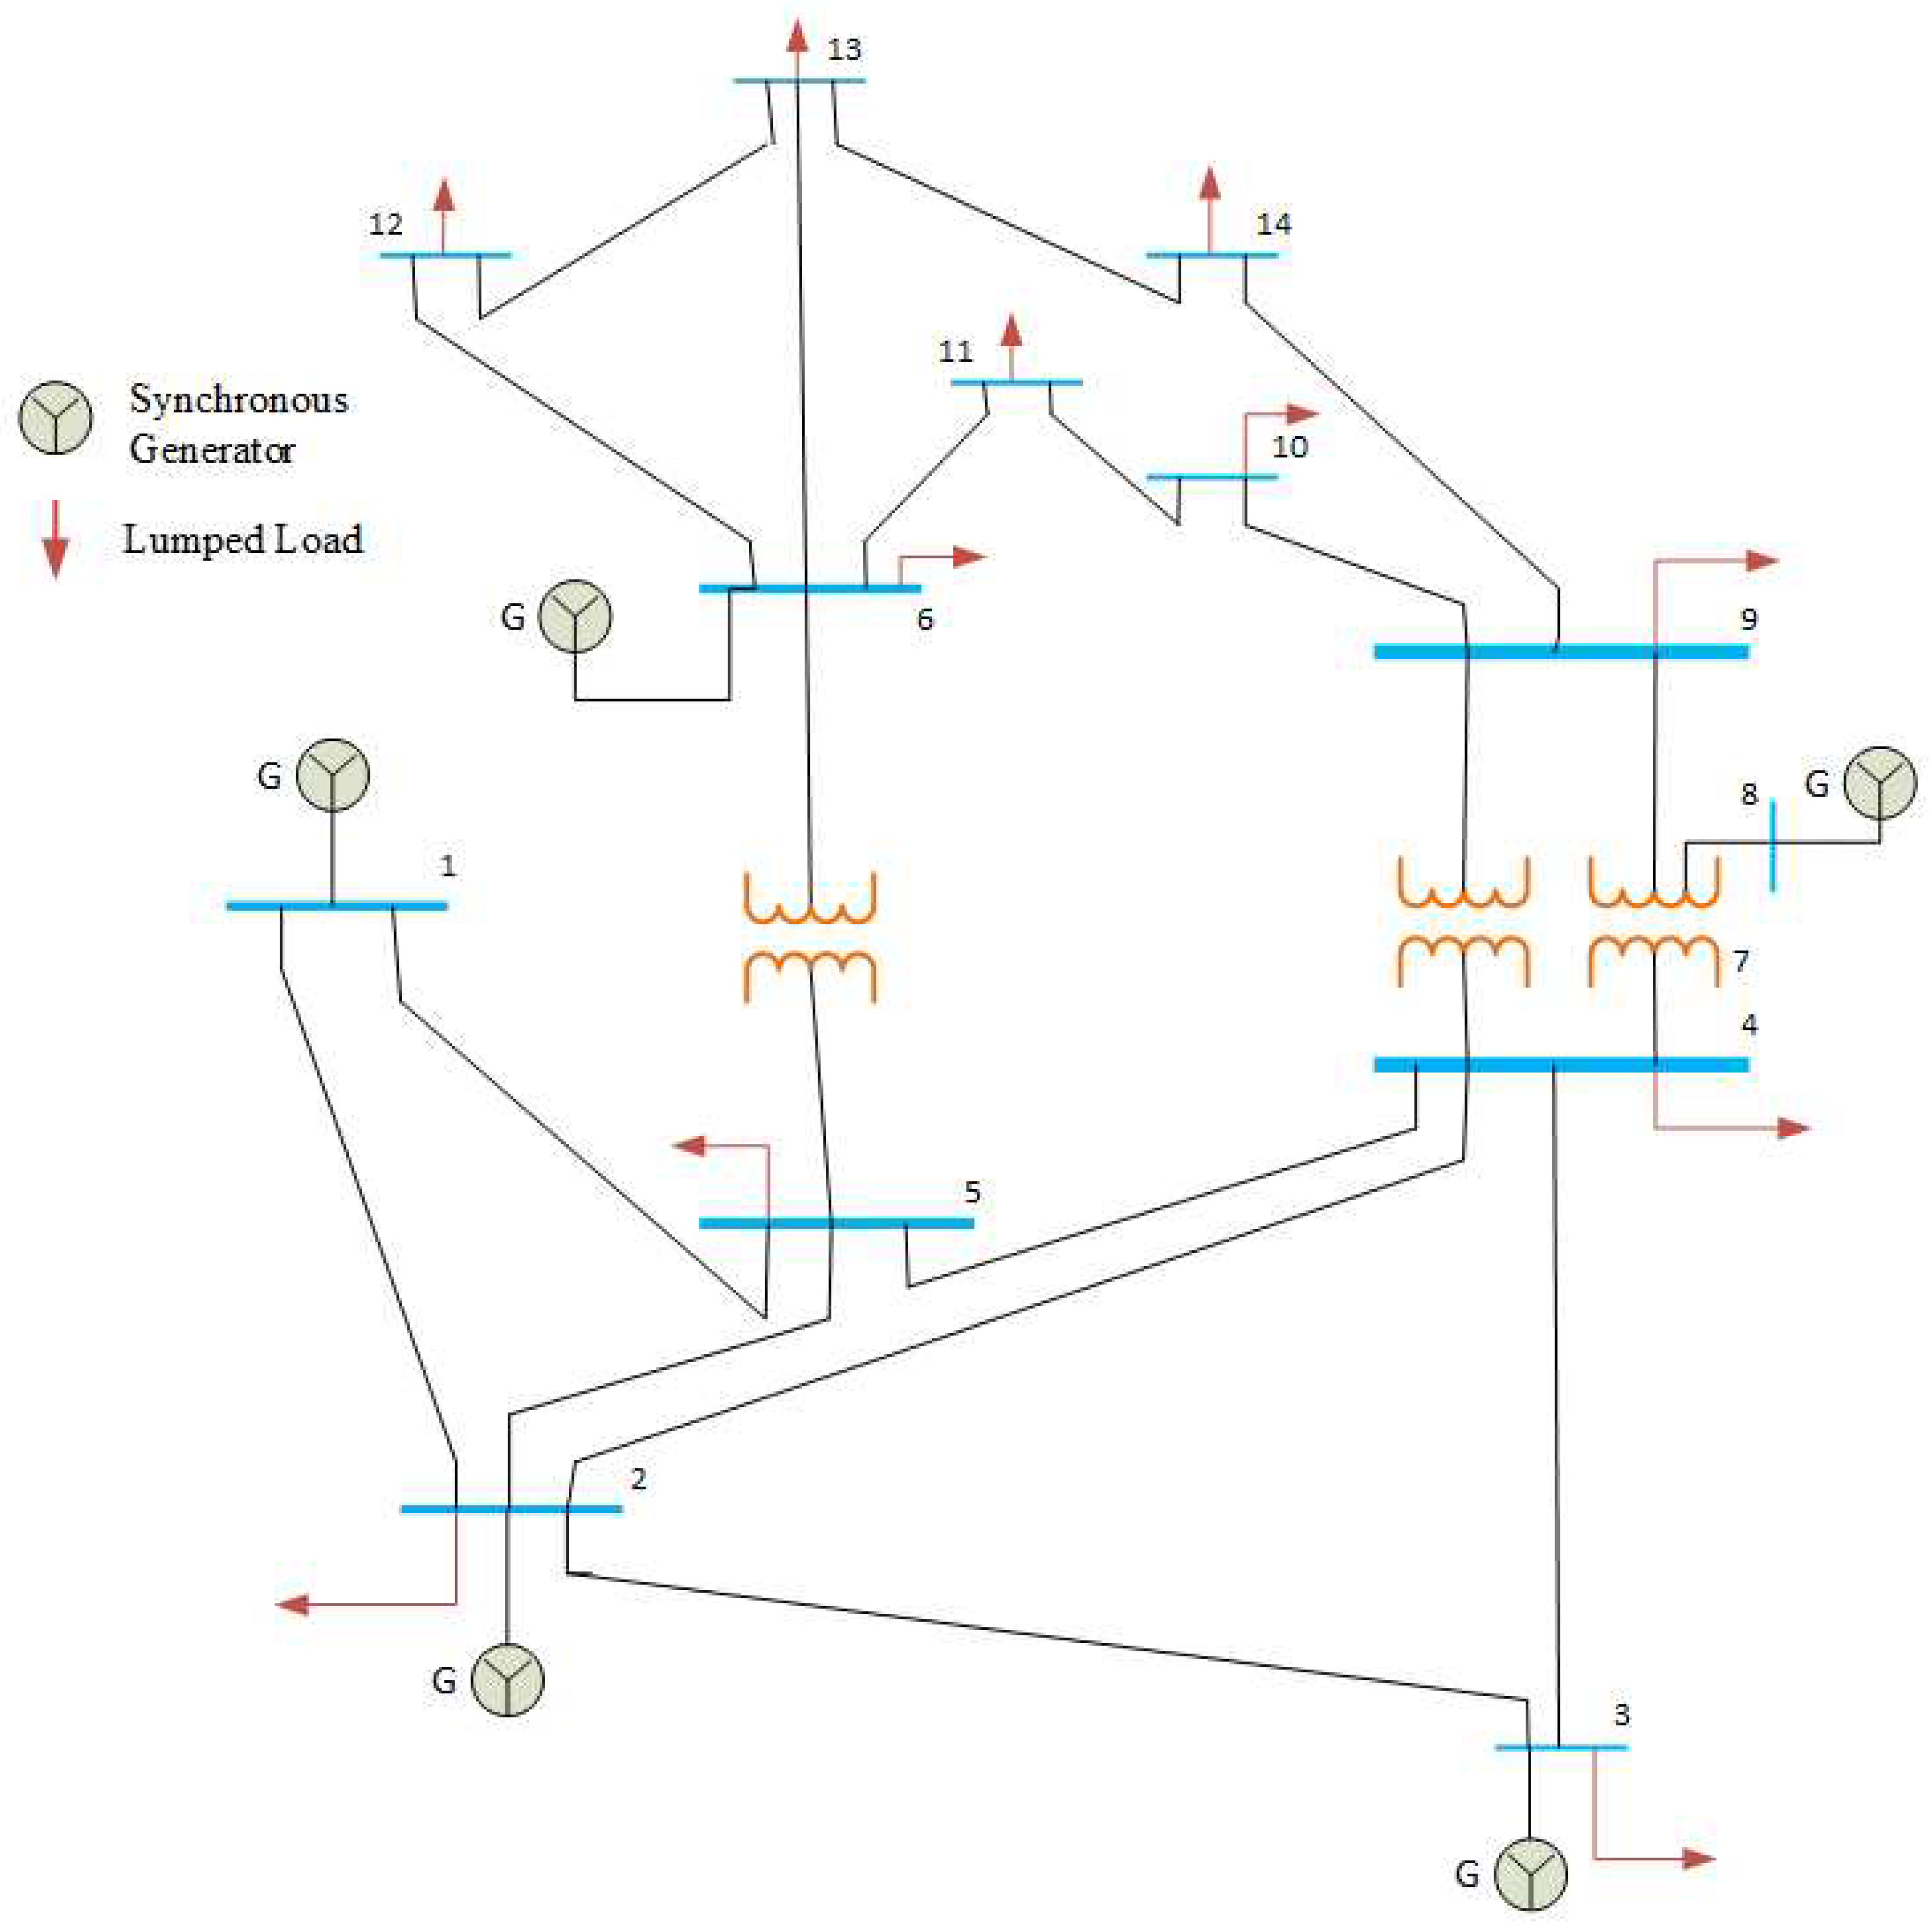
Figure 3.
Flowchart of the Hybrid GA-PSO method for DG optimal placement and sizing.
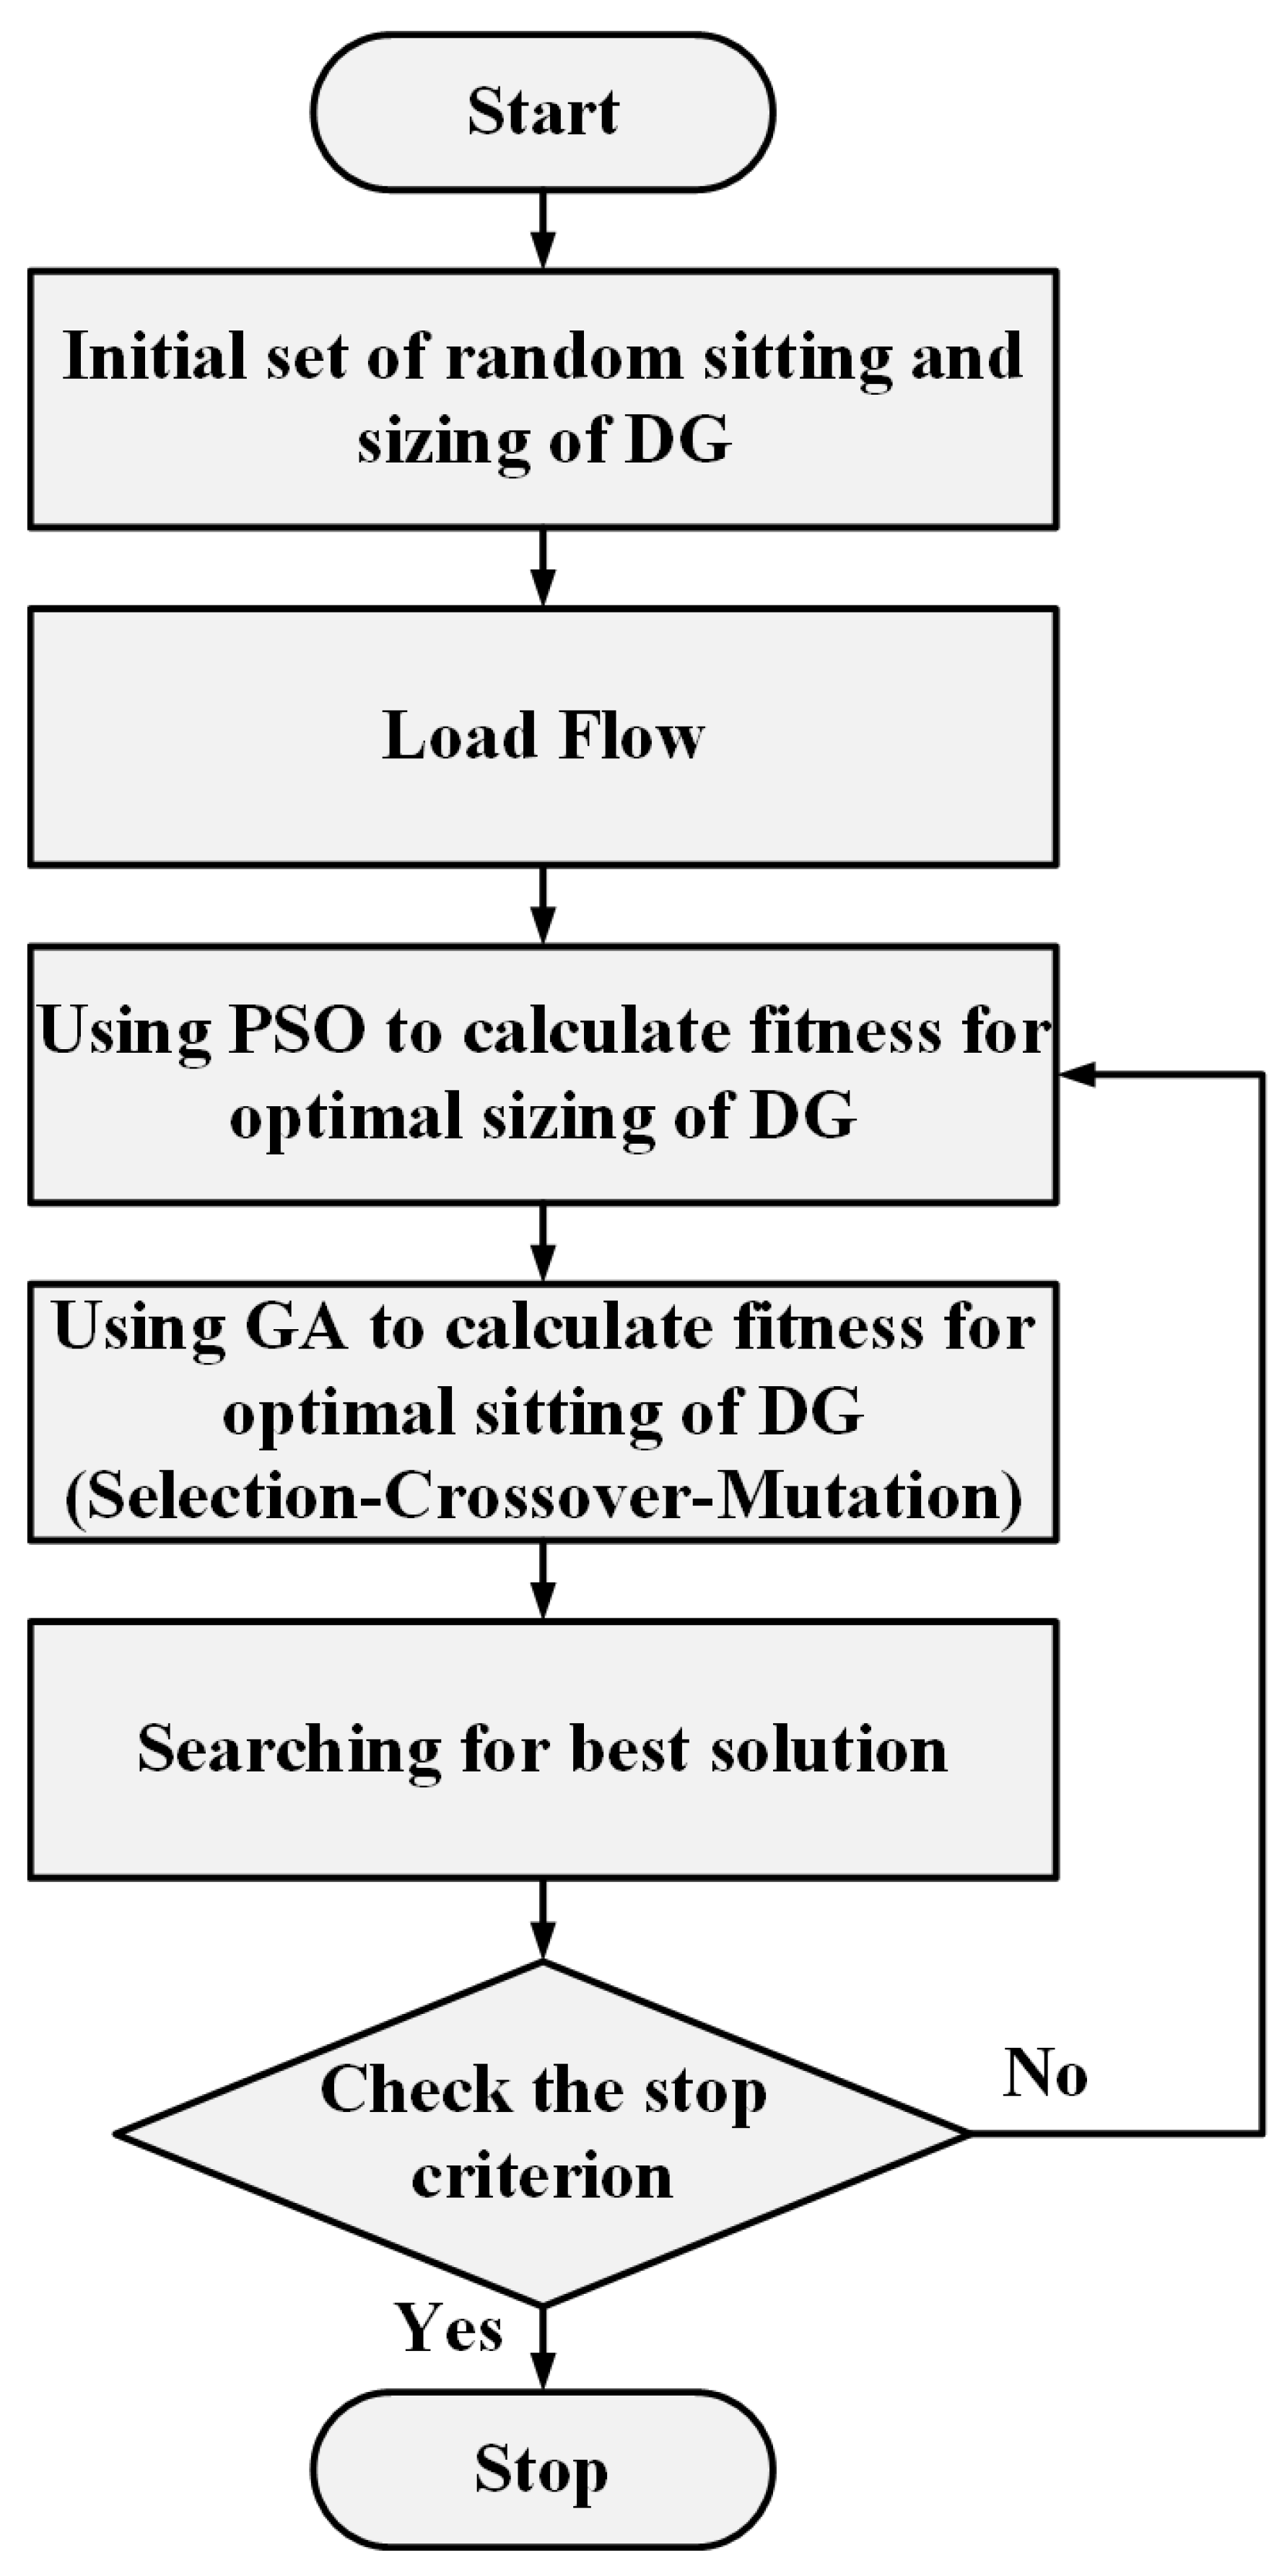
Figure 4.
IEEE 14 Busbar test system circuit diagram [31].
Figure 4.
IEEE 14 Busbar test system circuit diagram [31].
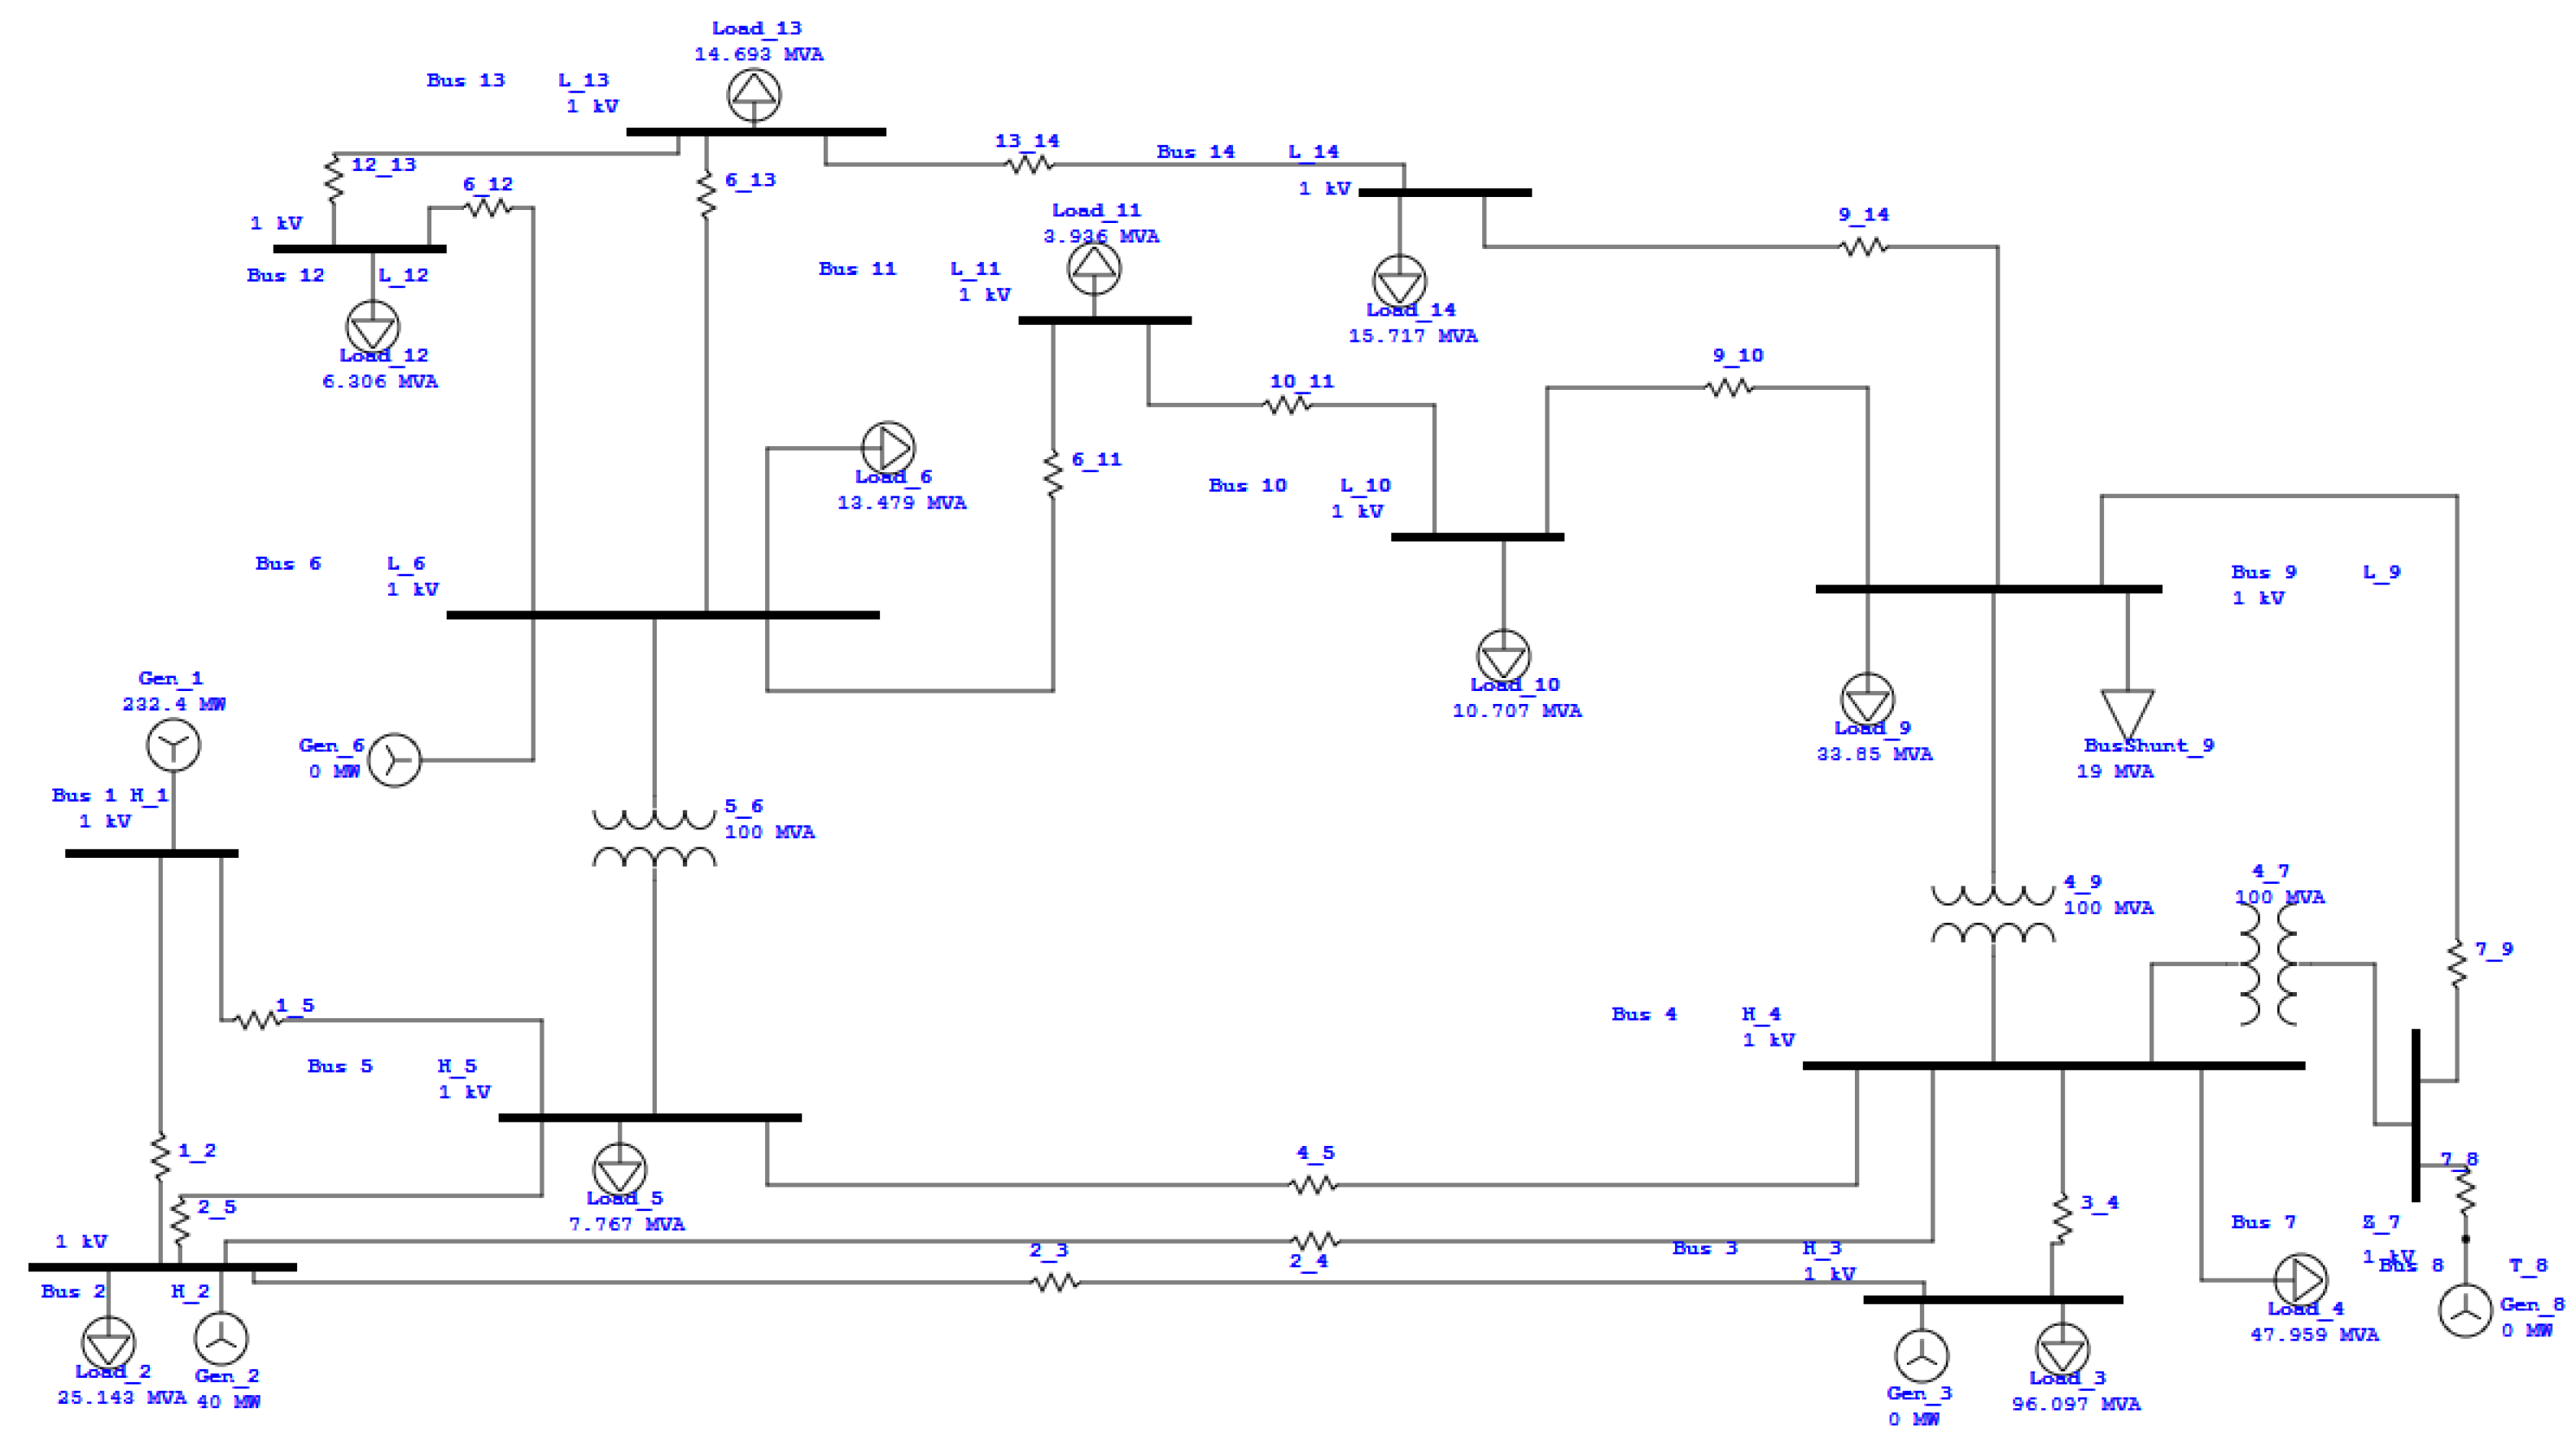
Figure 5.
Load flow analysis of IEEE 14 busbar system when no DG unit injected [31].
Figure 5.
Load flow analysis of IEEE 14 busbar system when no DG unit injected [31].
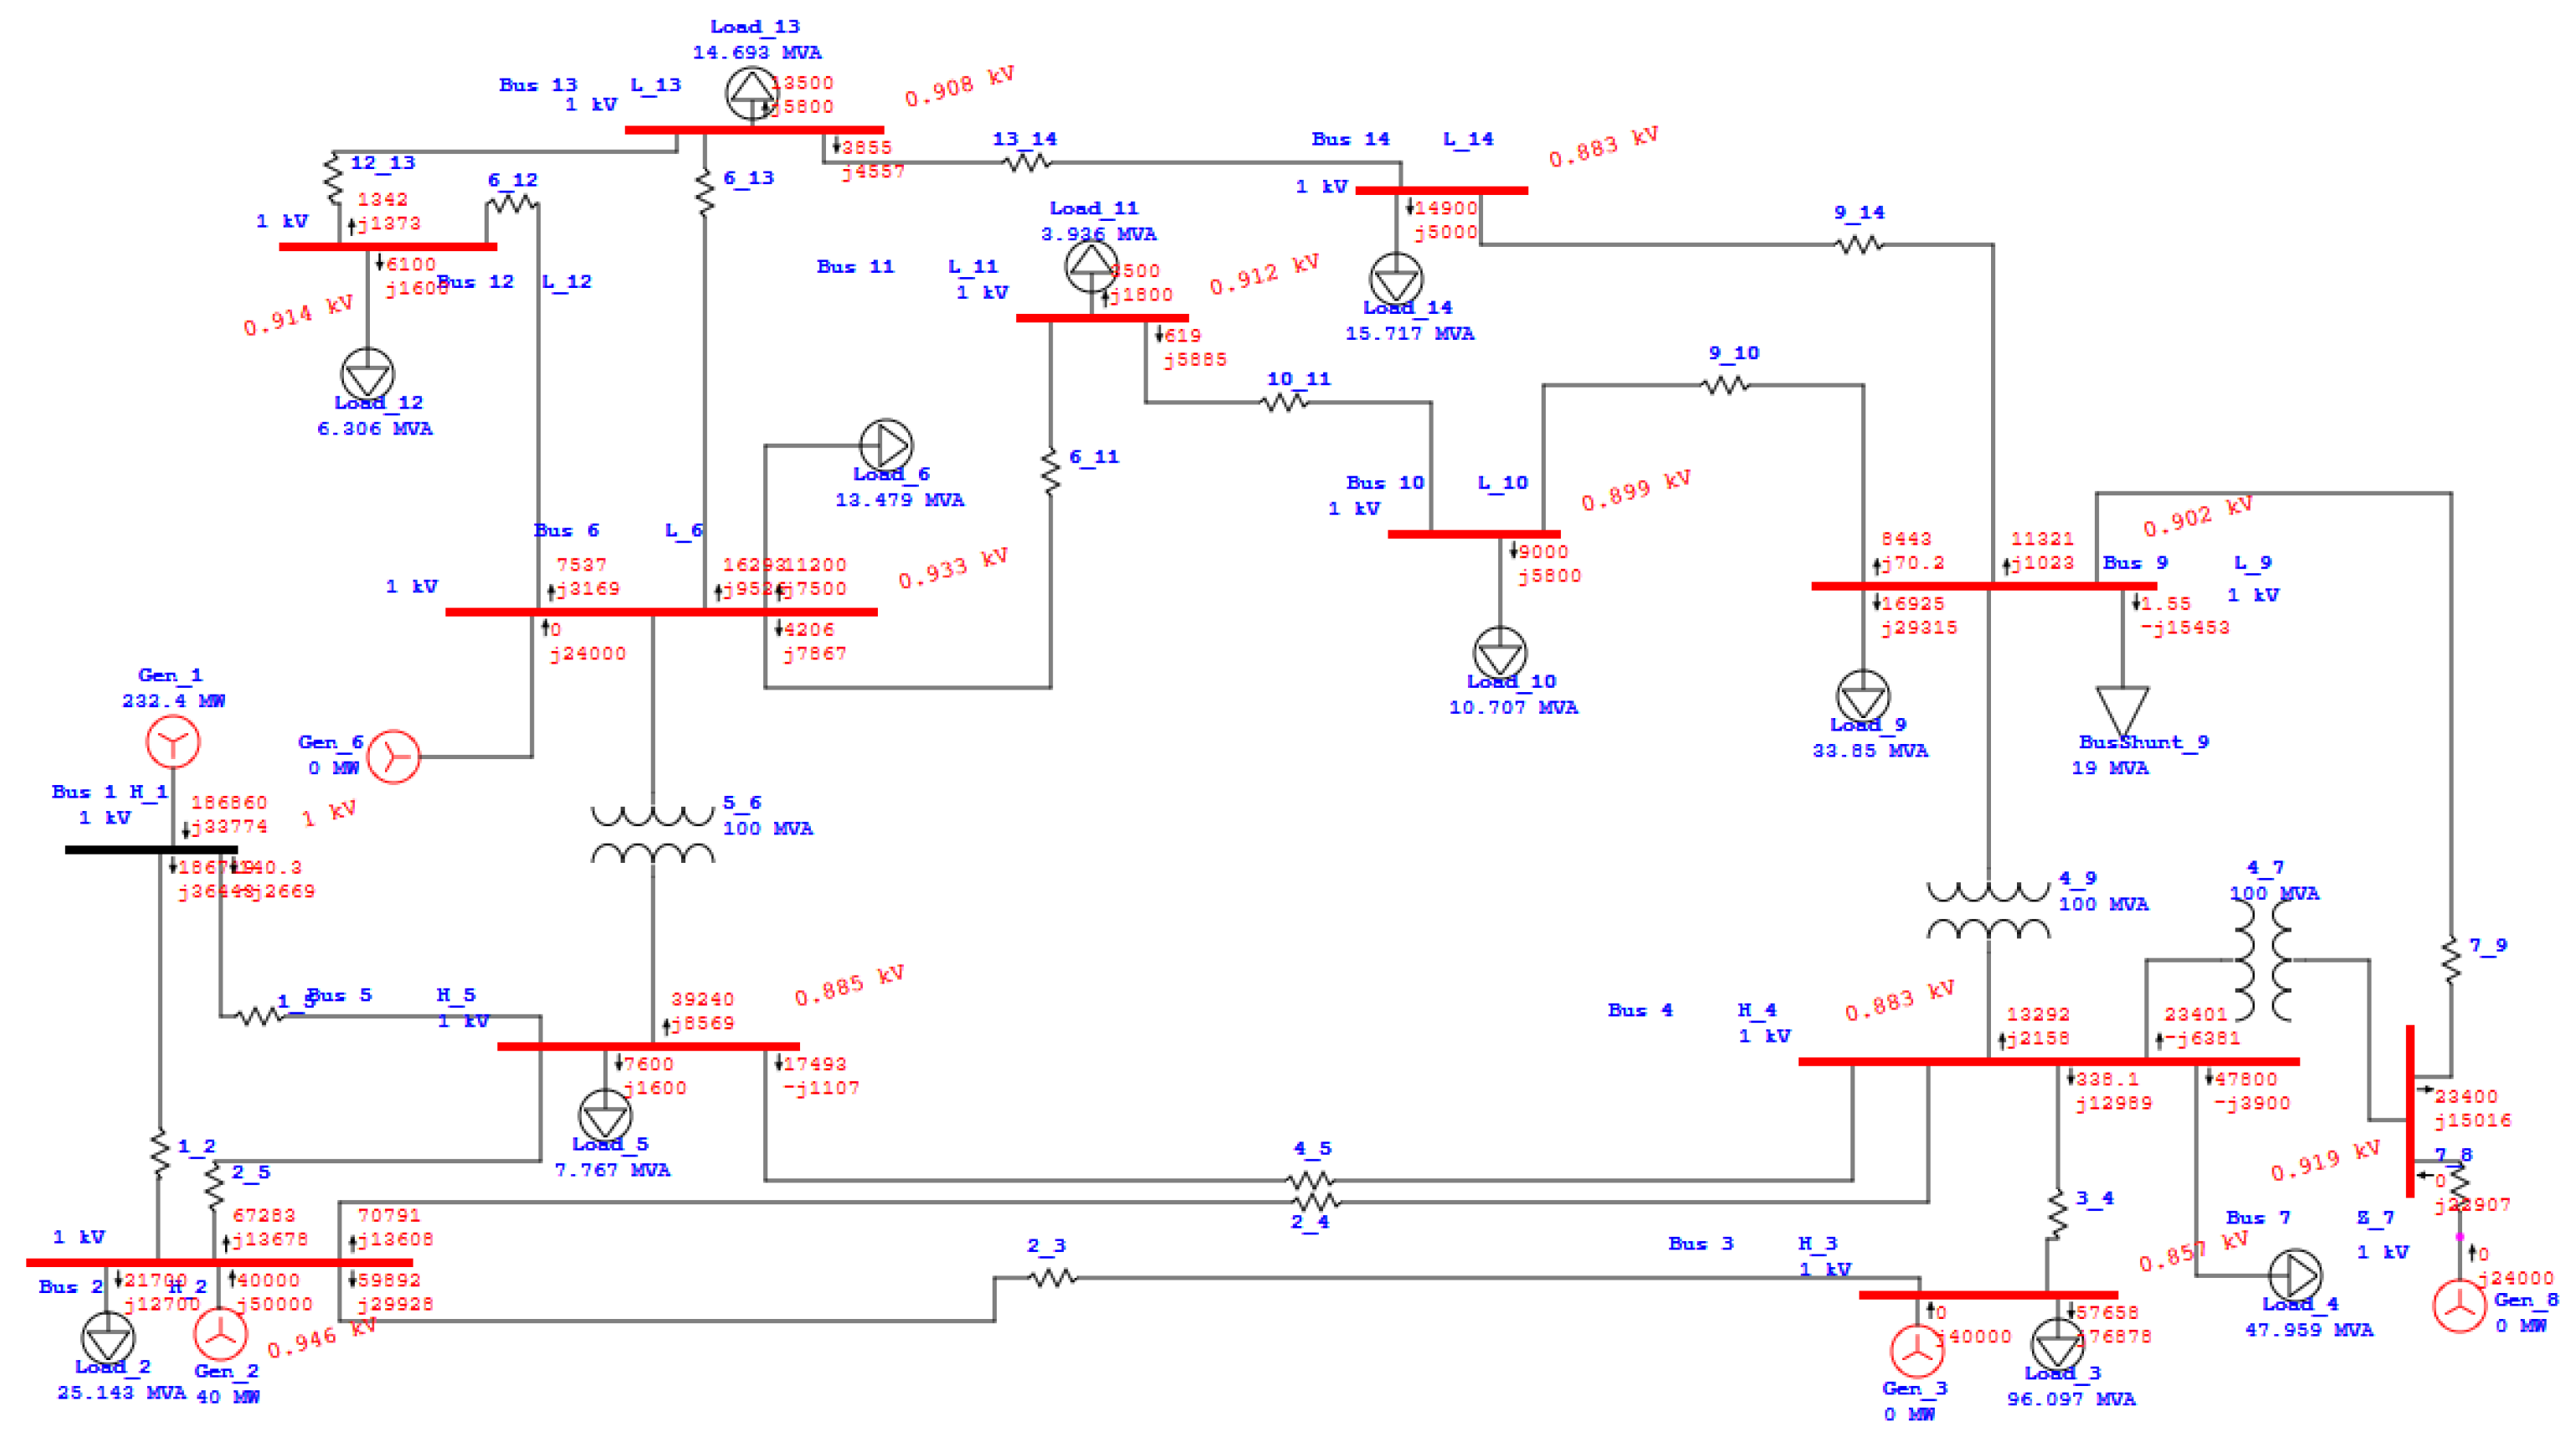
Figure 6.
Voltage Profile of IEEE 14 busbar system when no DG unit injected [31].
Figure 6.
Voltage Profile of IEEE 14 busbar system when no DG unit injected [31].
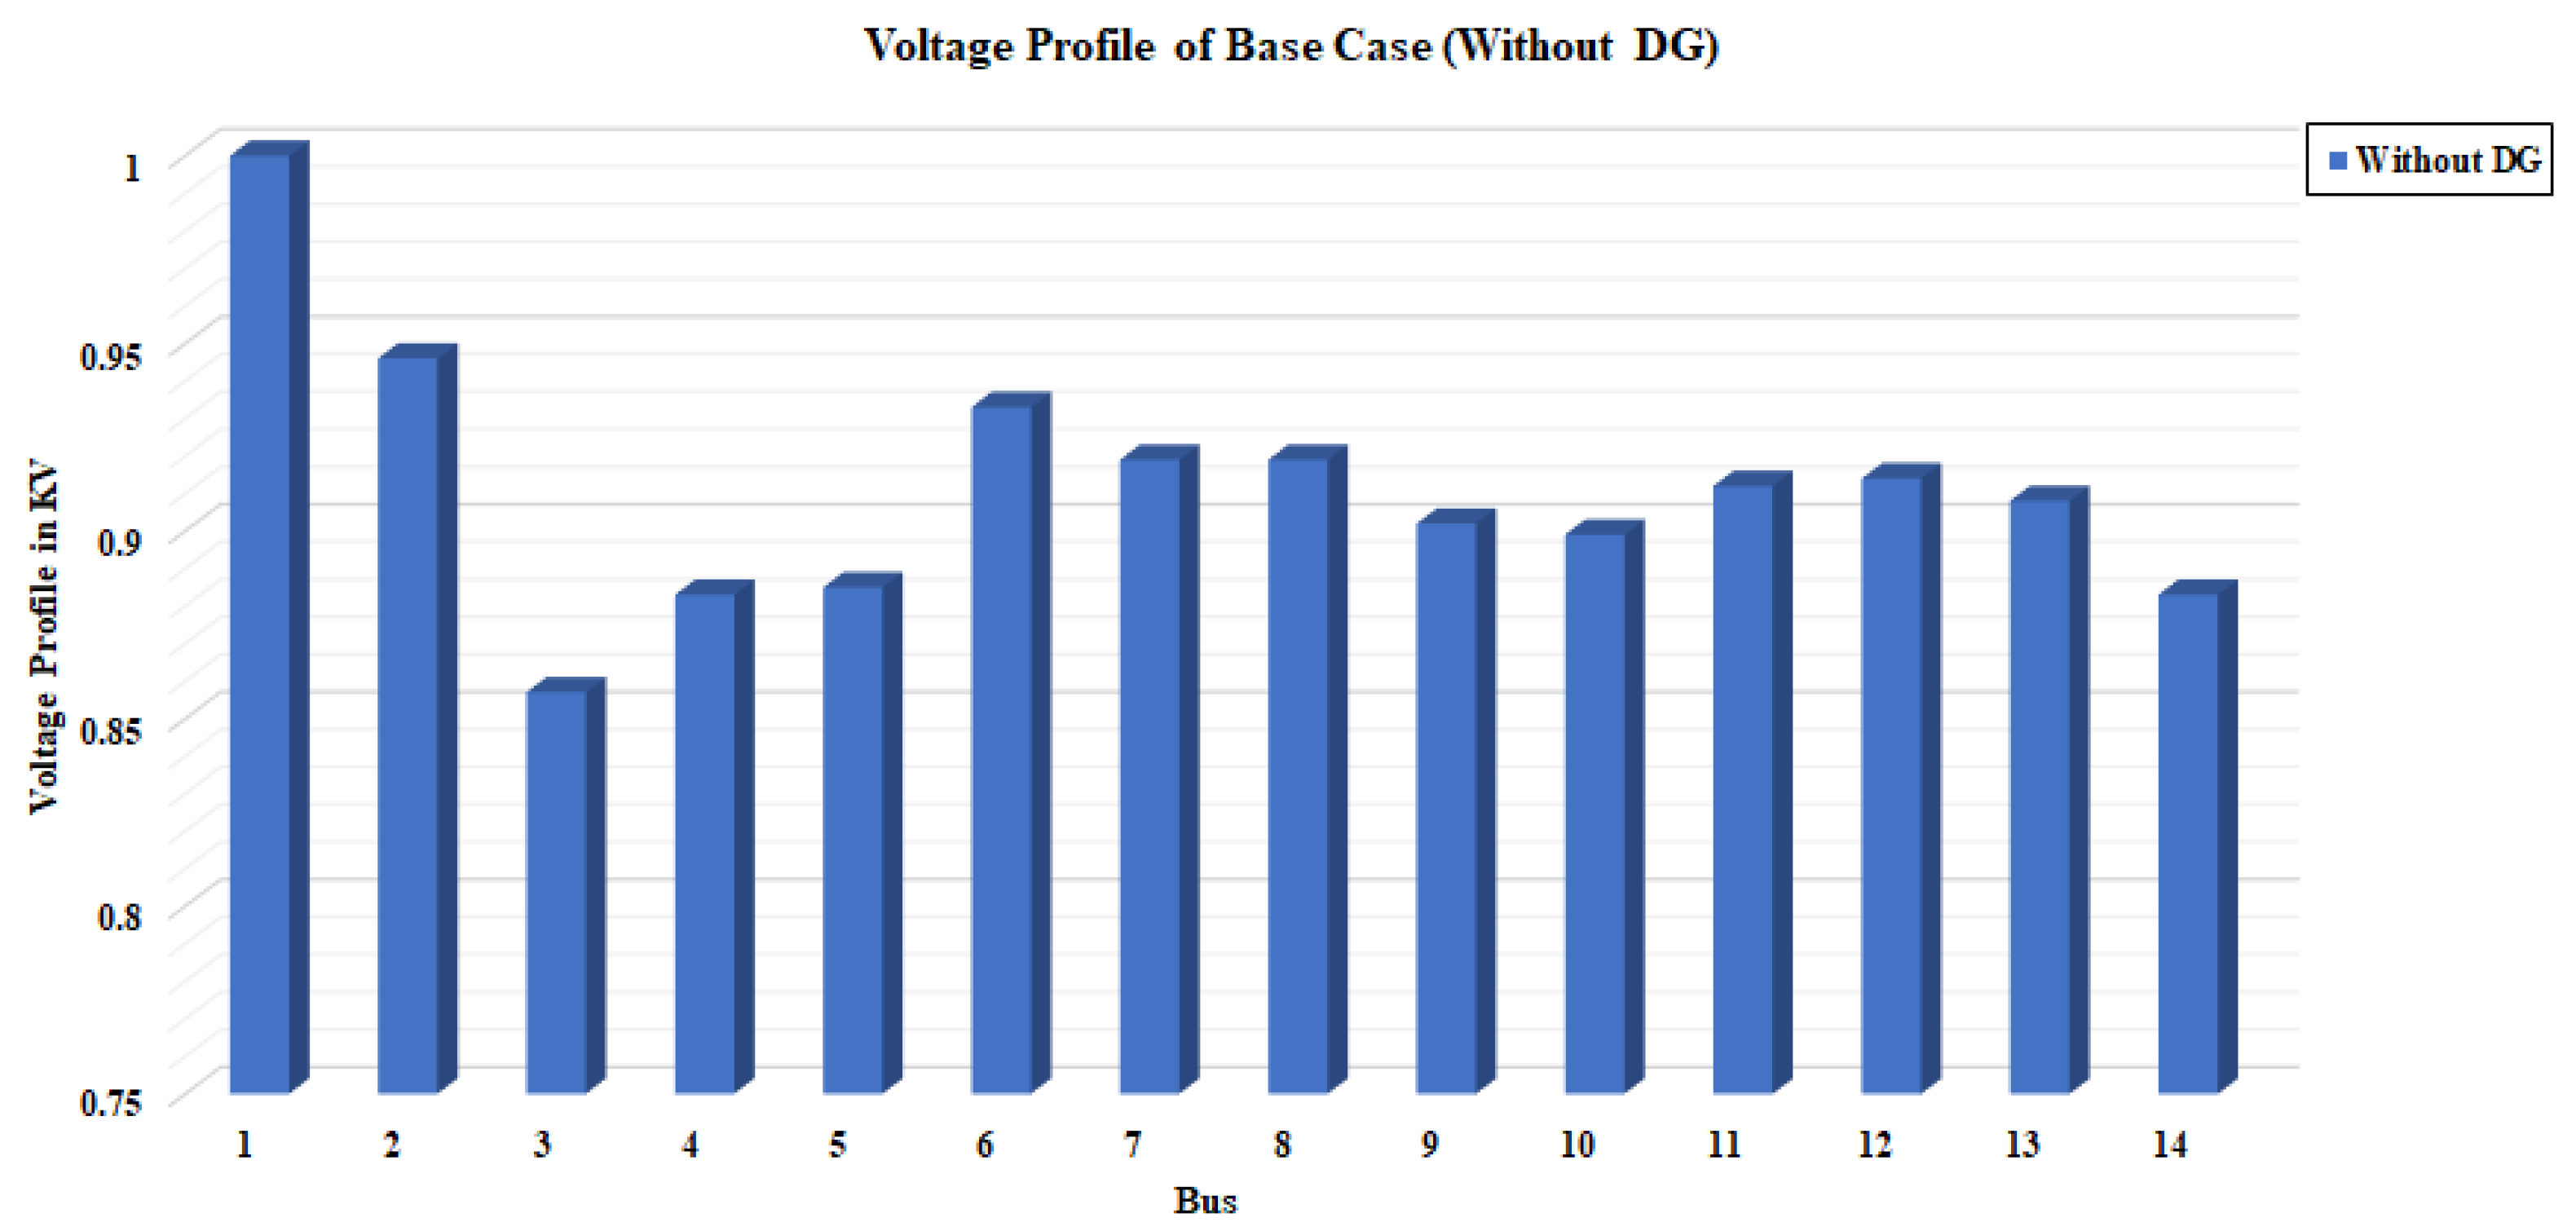
Figure 7.
Power Losses of IEEE 14 busbar system when no DG unit injected [31].
Figure 7.
Power Losses of IEEE 14 busbar system when no DG unit injected [31].
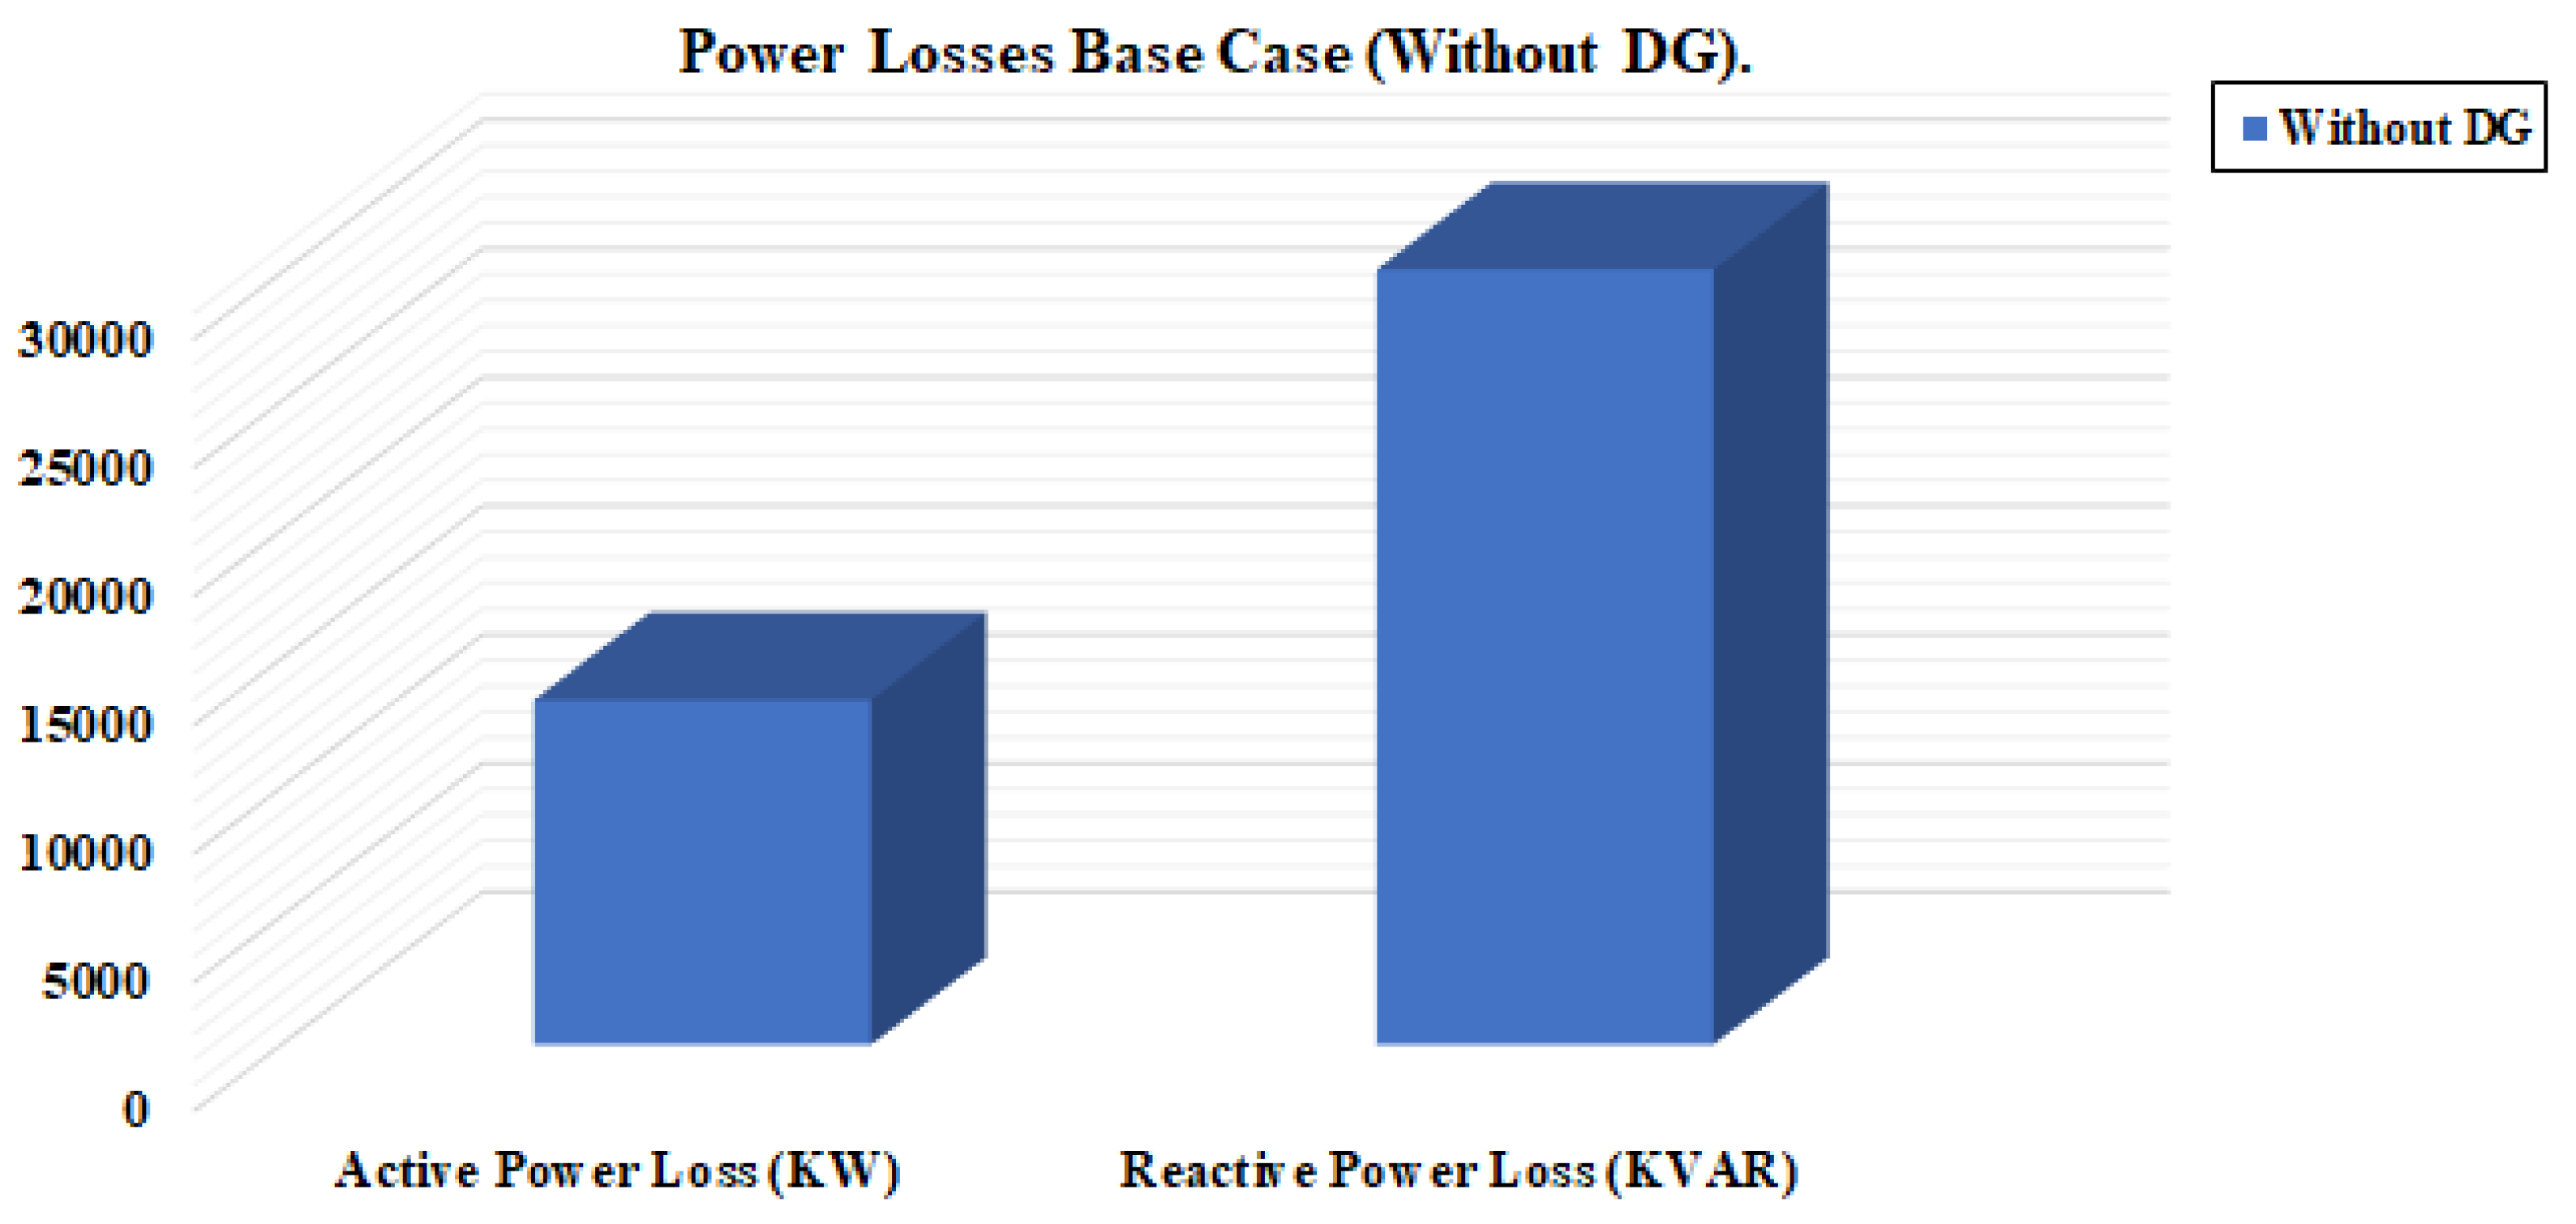
Figure 8.
Optimum site and size of Distributed Generation unit predicted by Particle Swarm Optimization.
Figure 8.
Optimum site and size of Distributed Generation unit predicted by Particle Swarm Optimization.
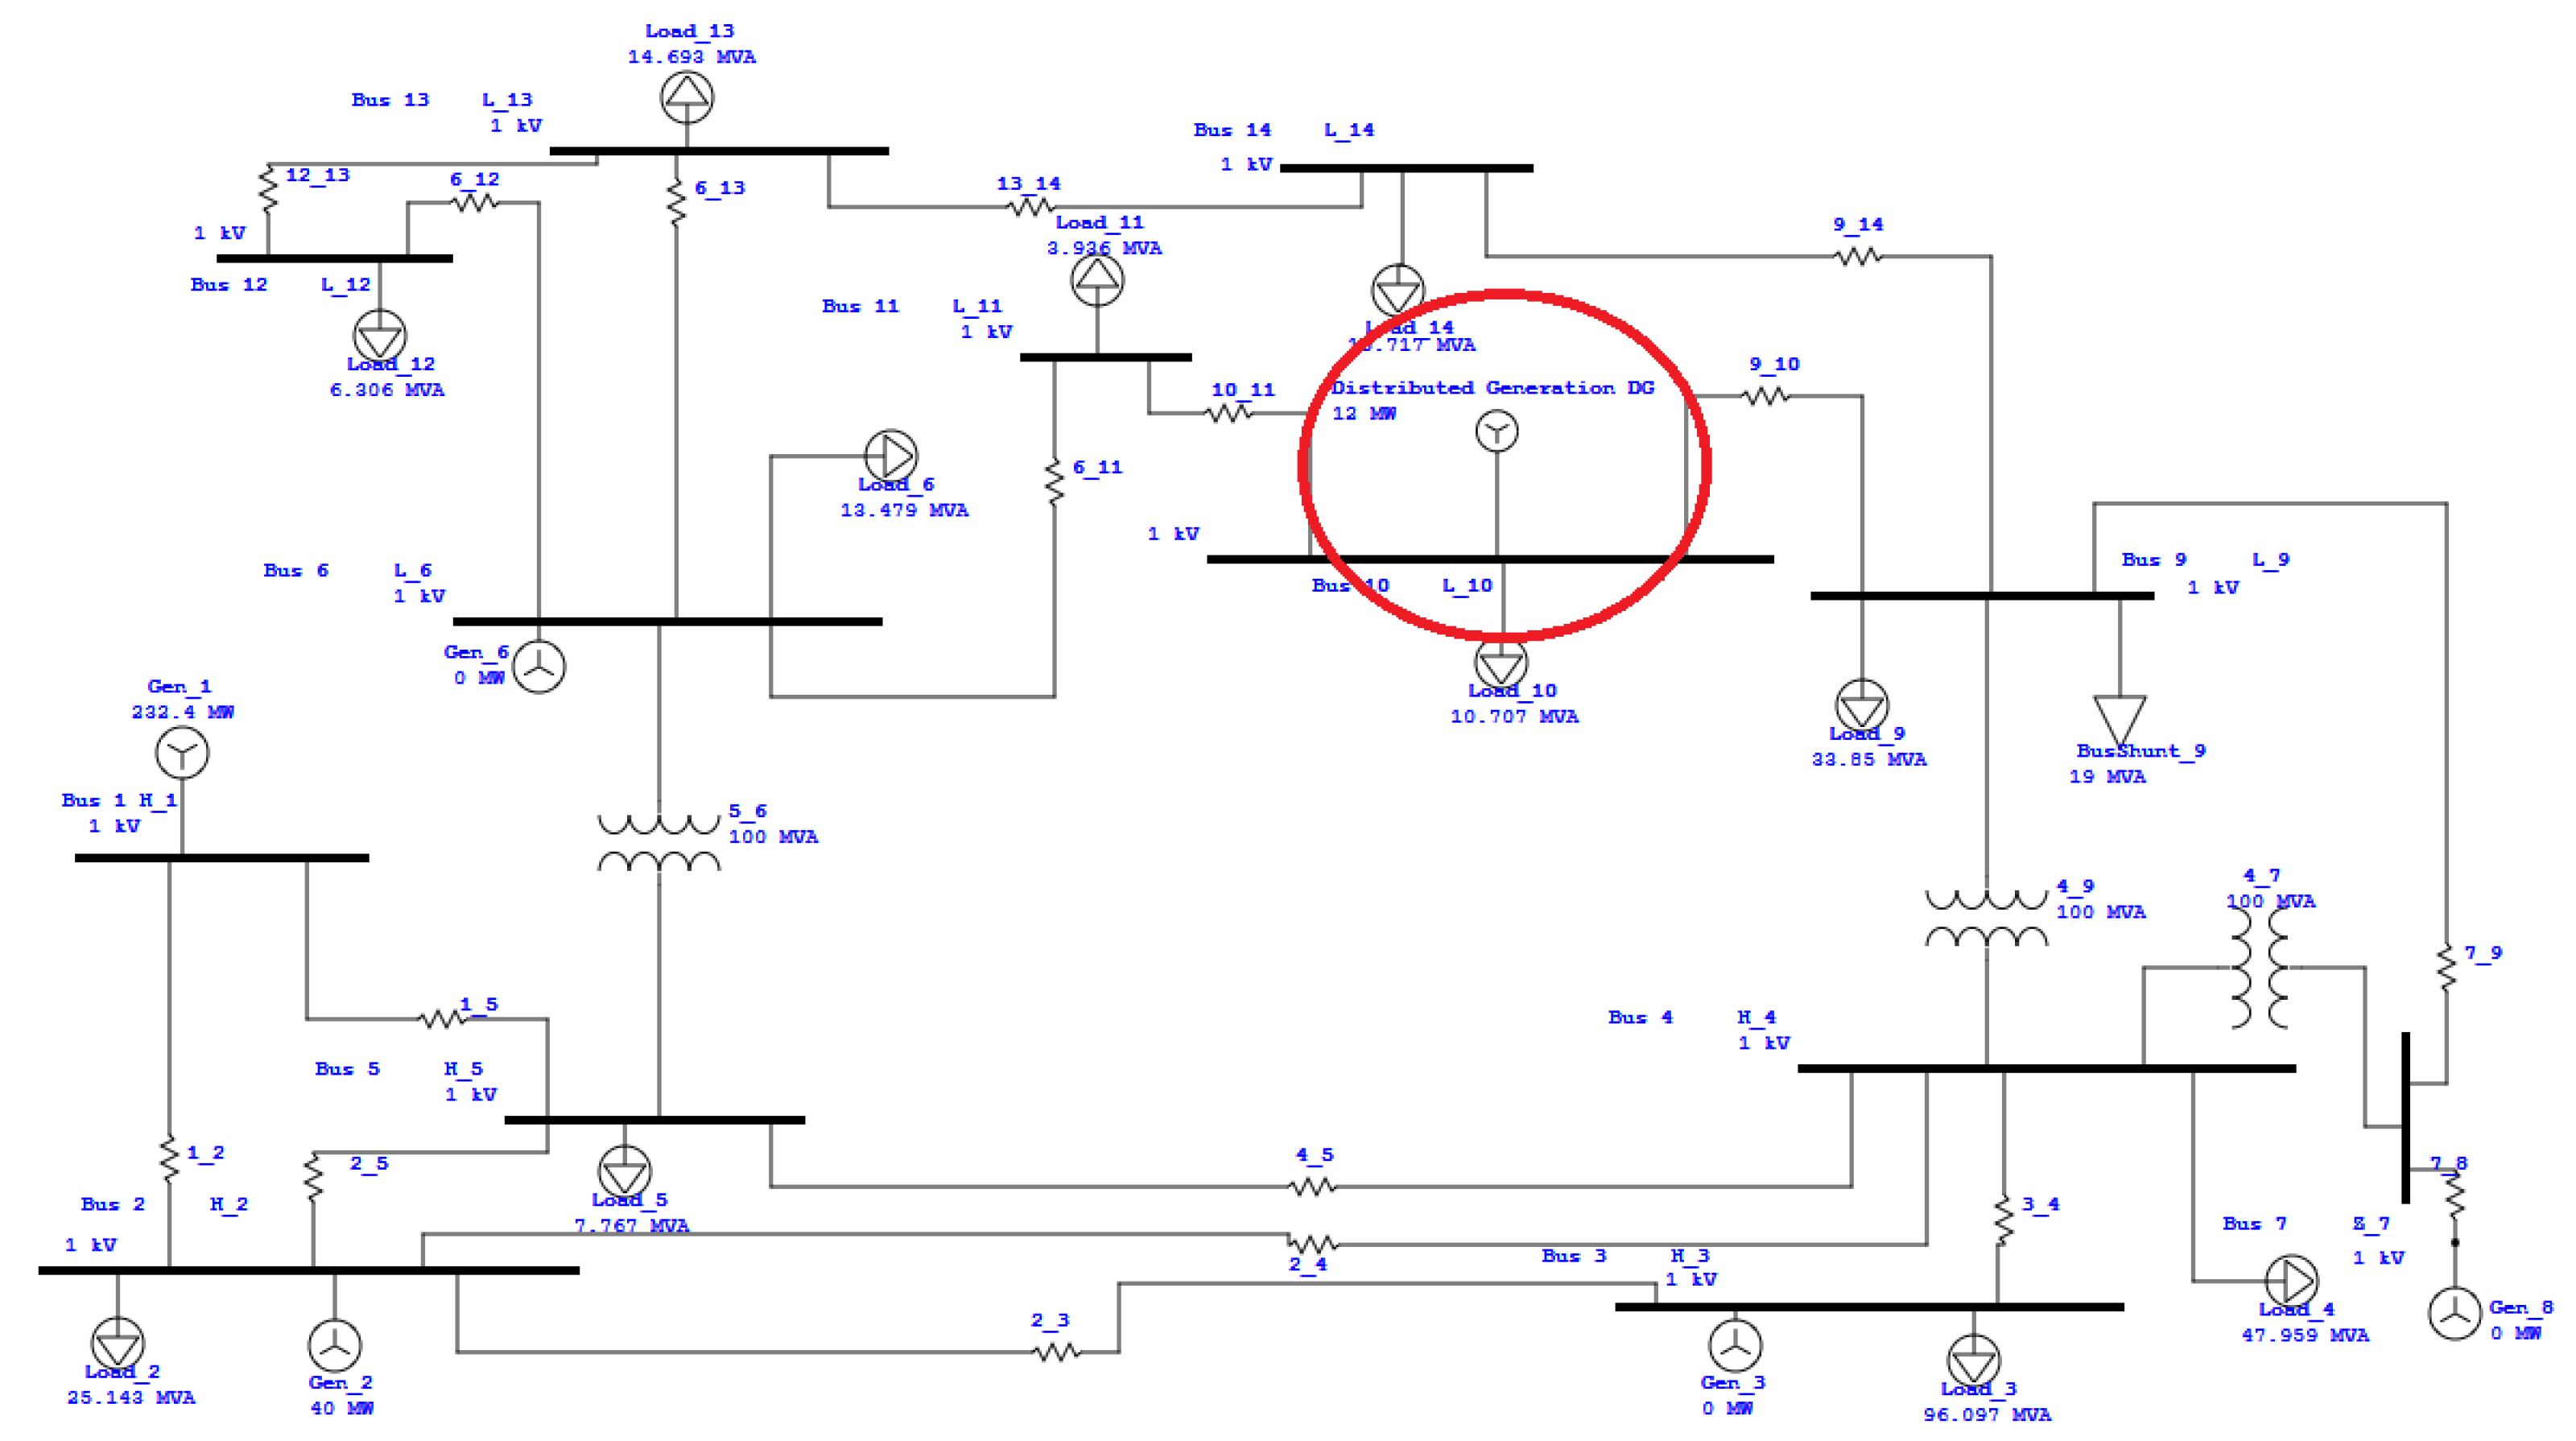
Figure 9.
Test system load flow analysis.
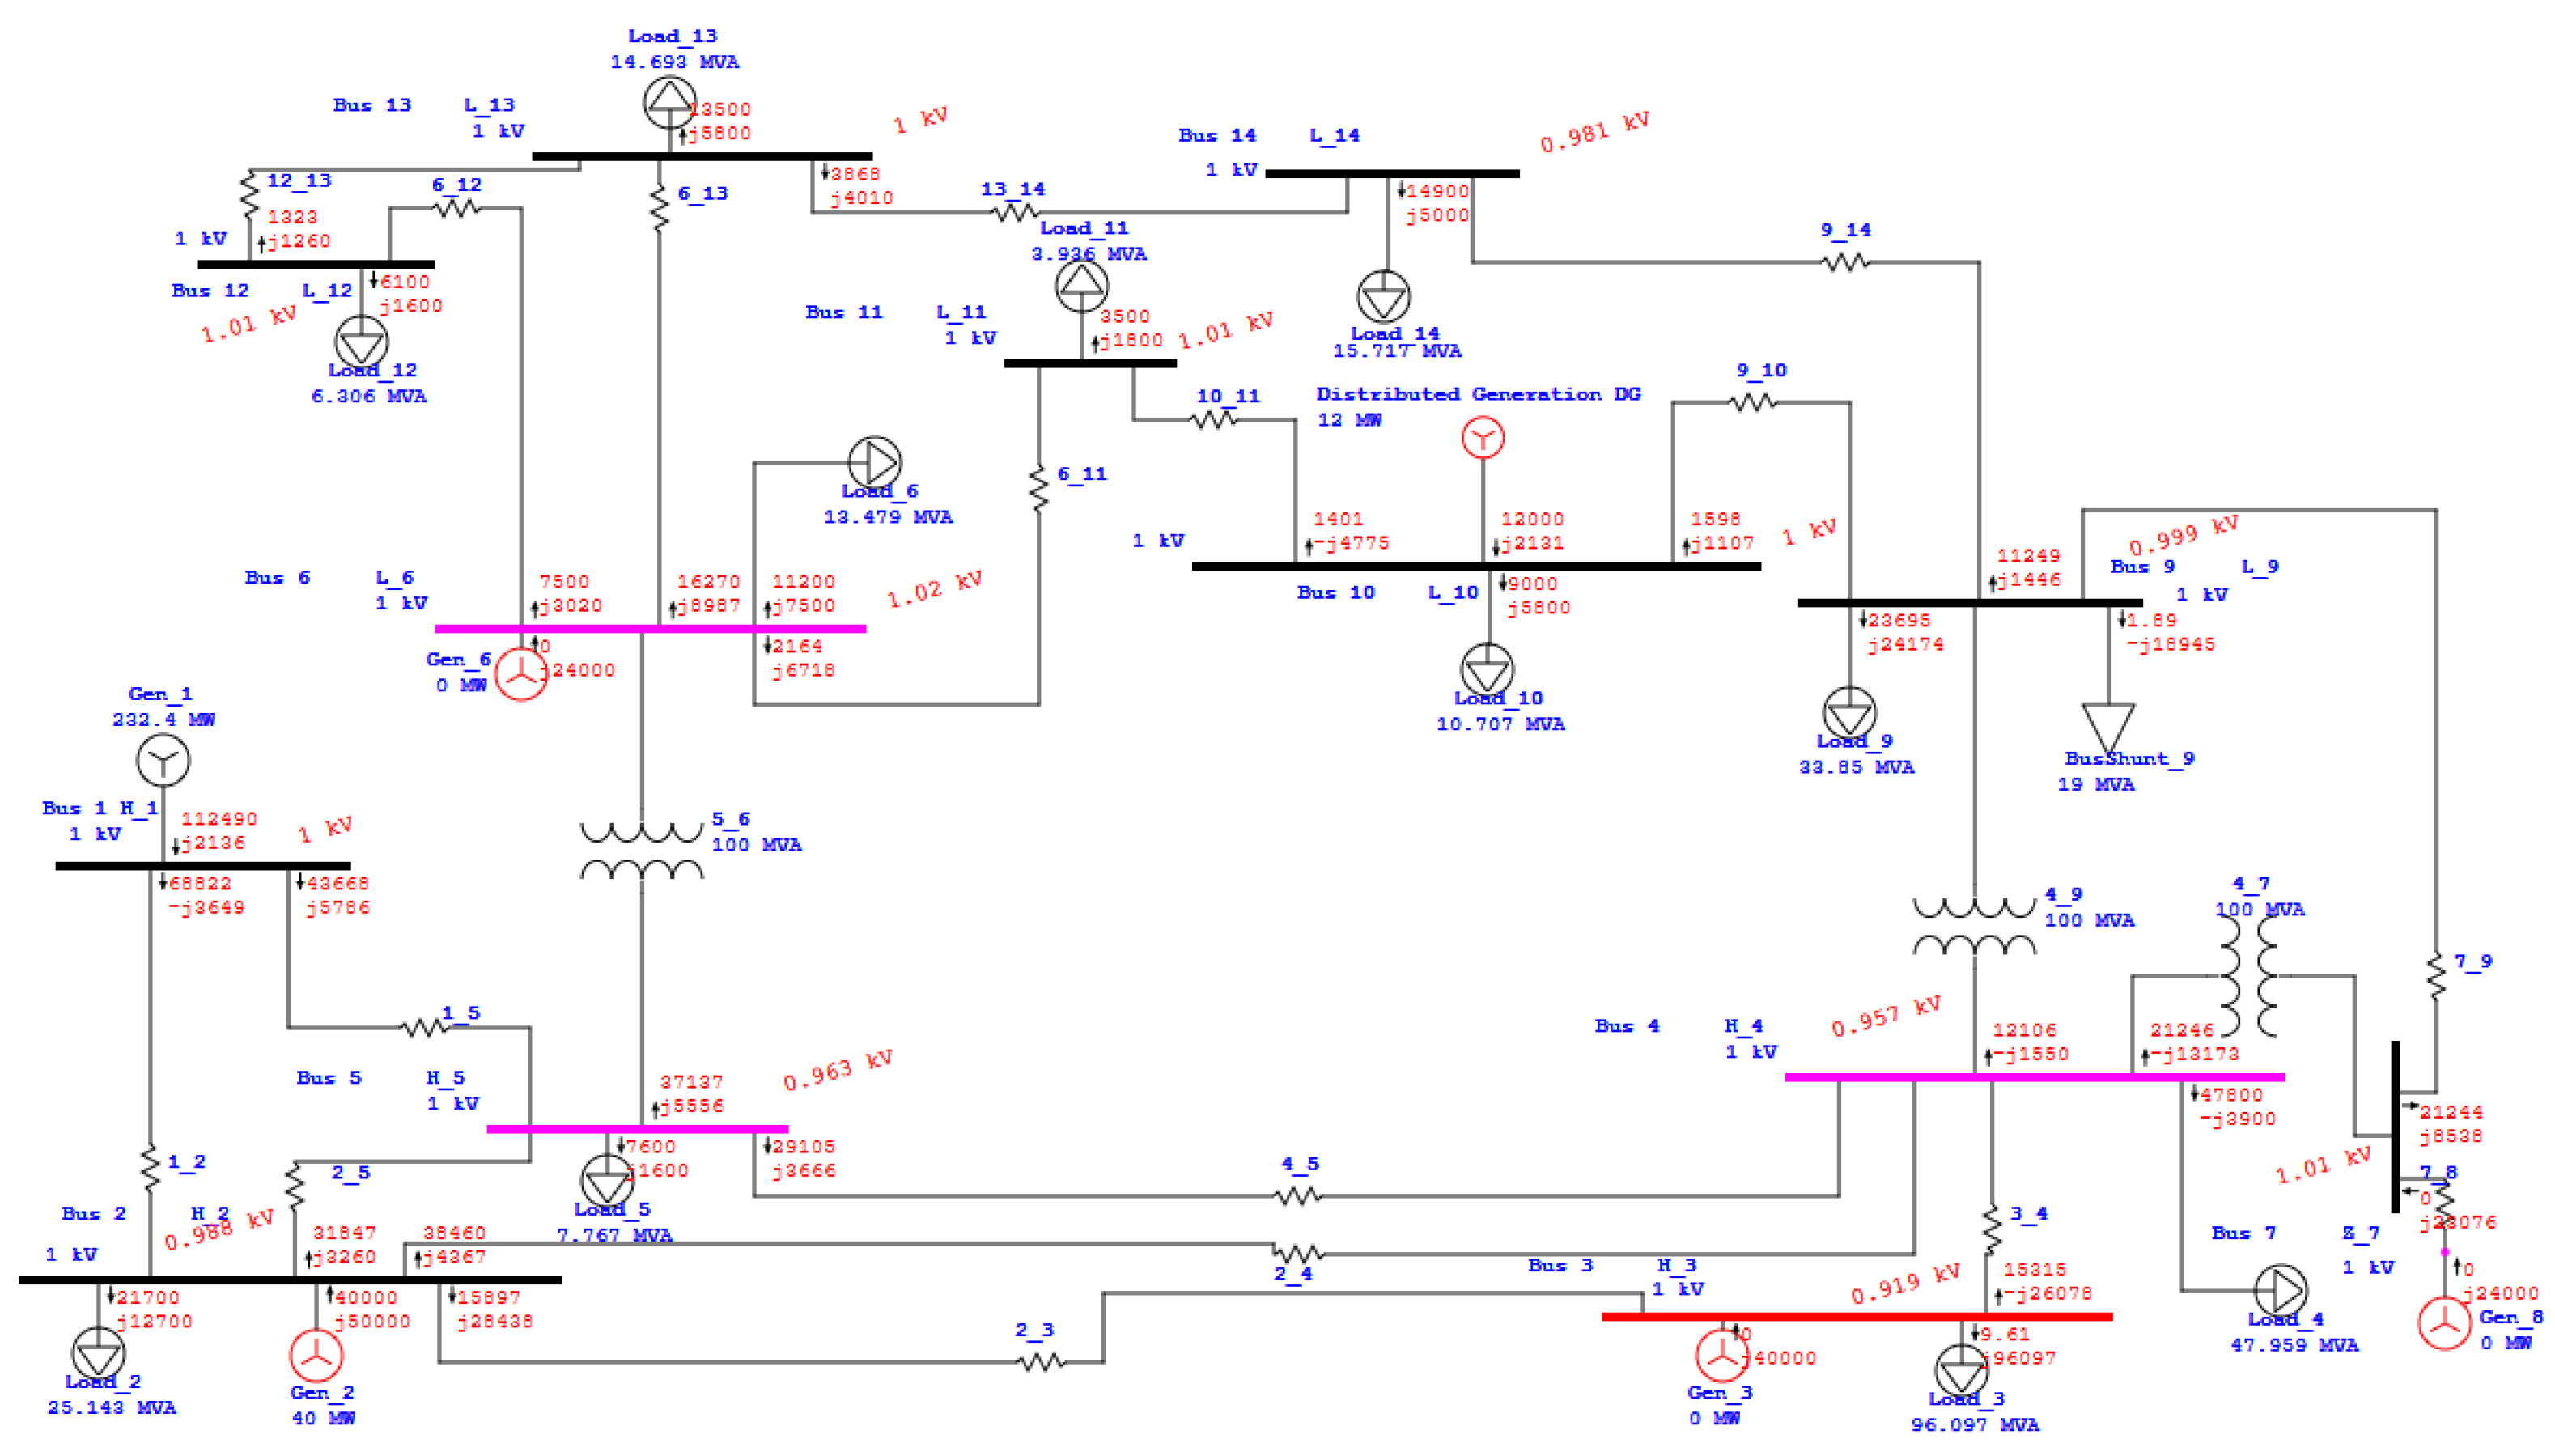
Figure 10.
Voltage Profile of the test system on each busbar with respect to base case.
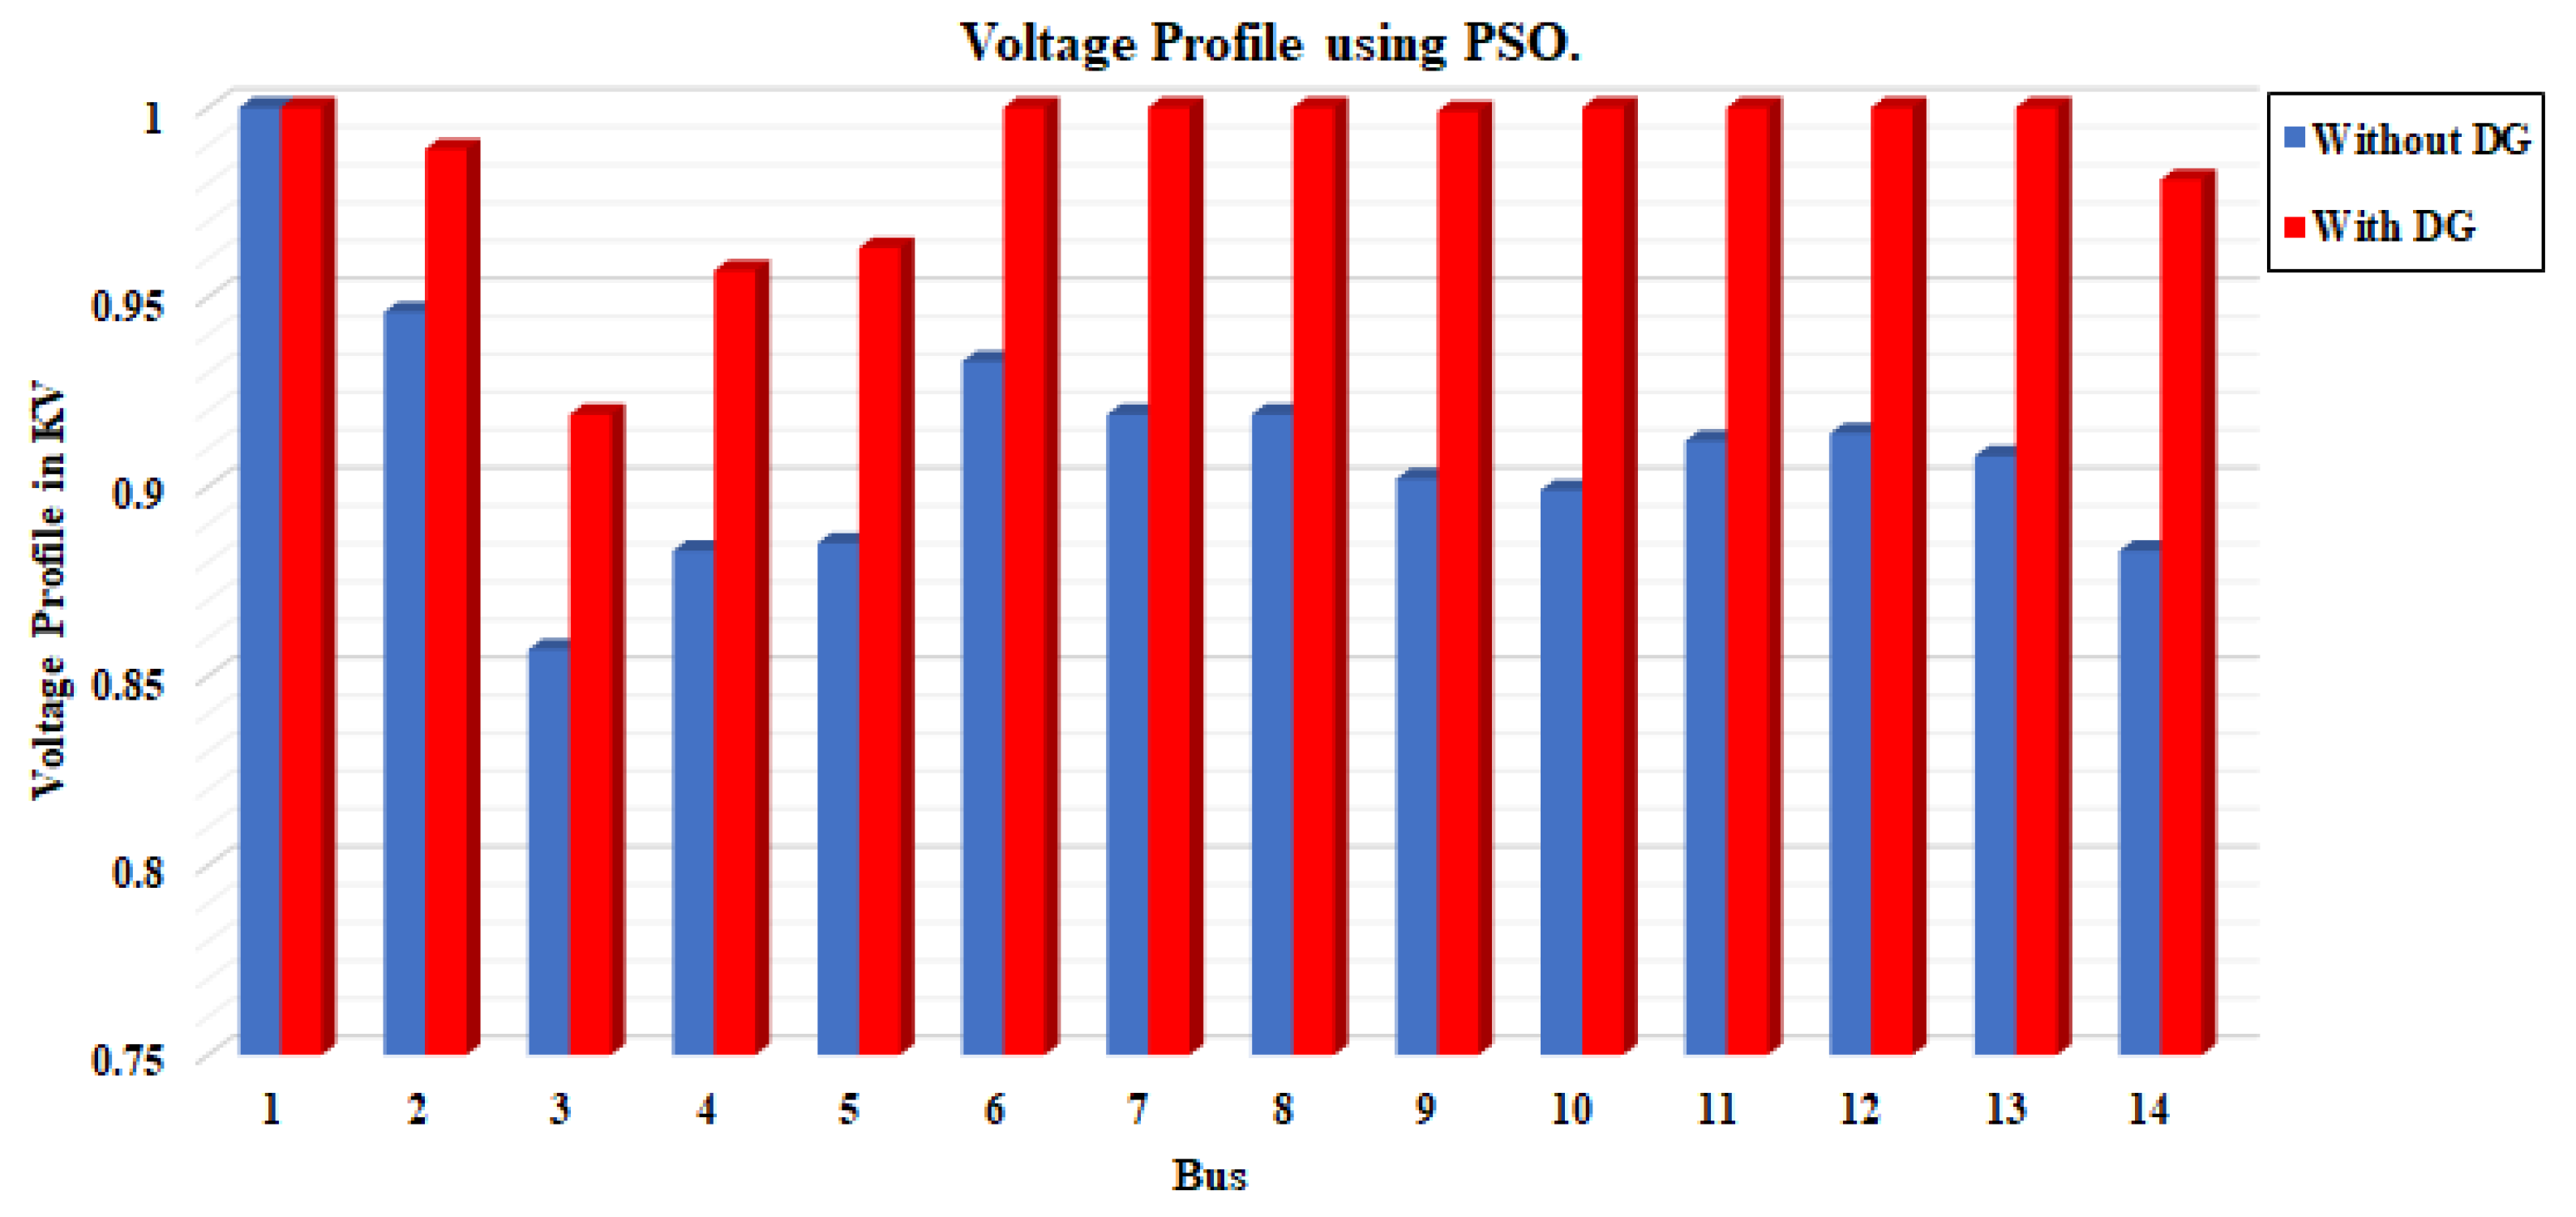
Figure 11.
Power Losses in comparison with base case.
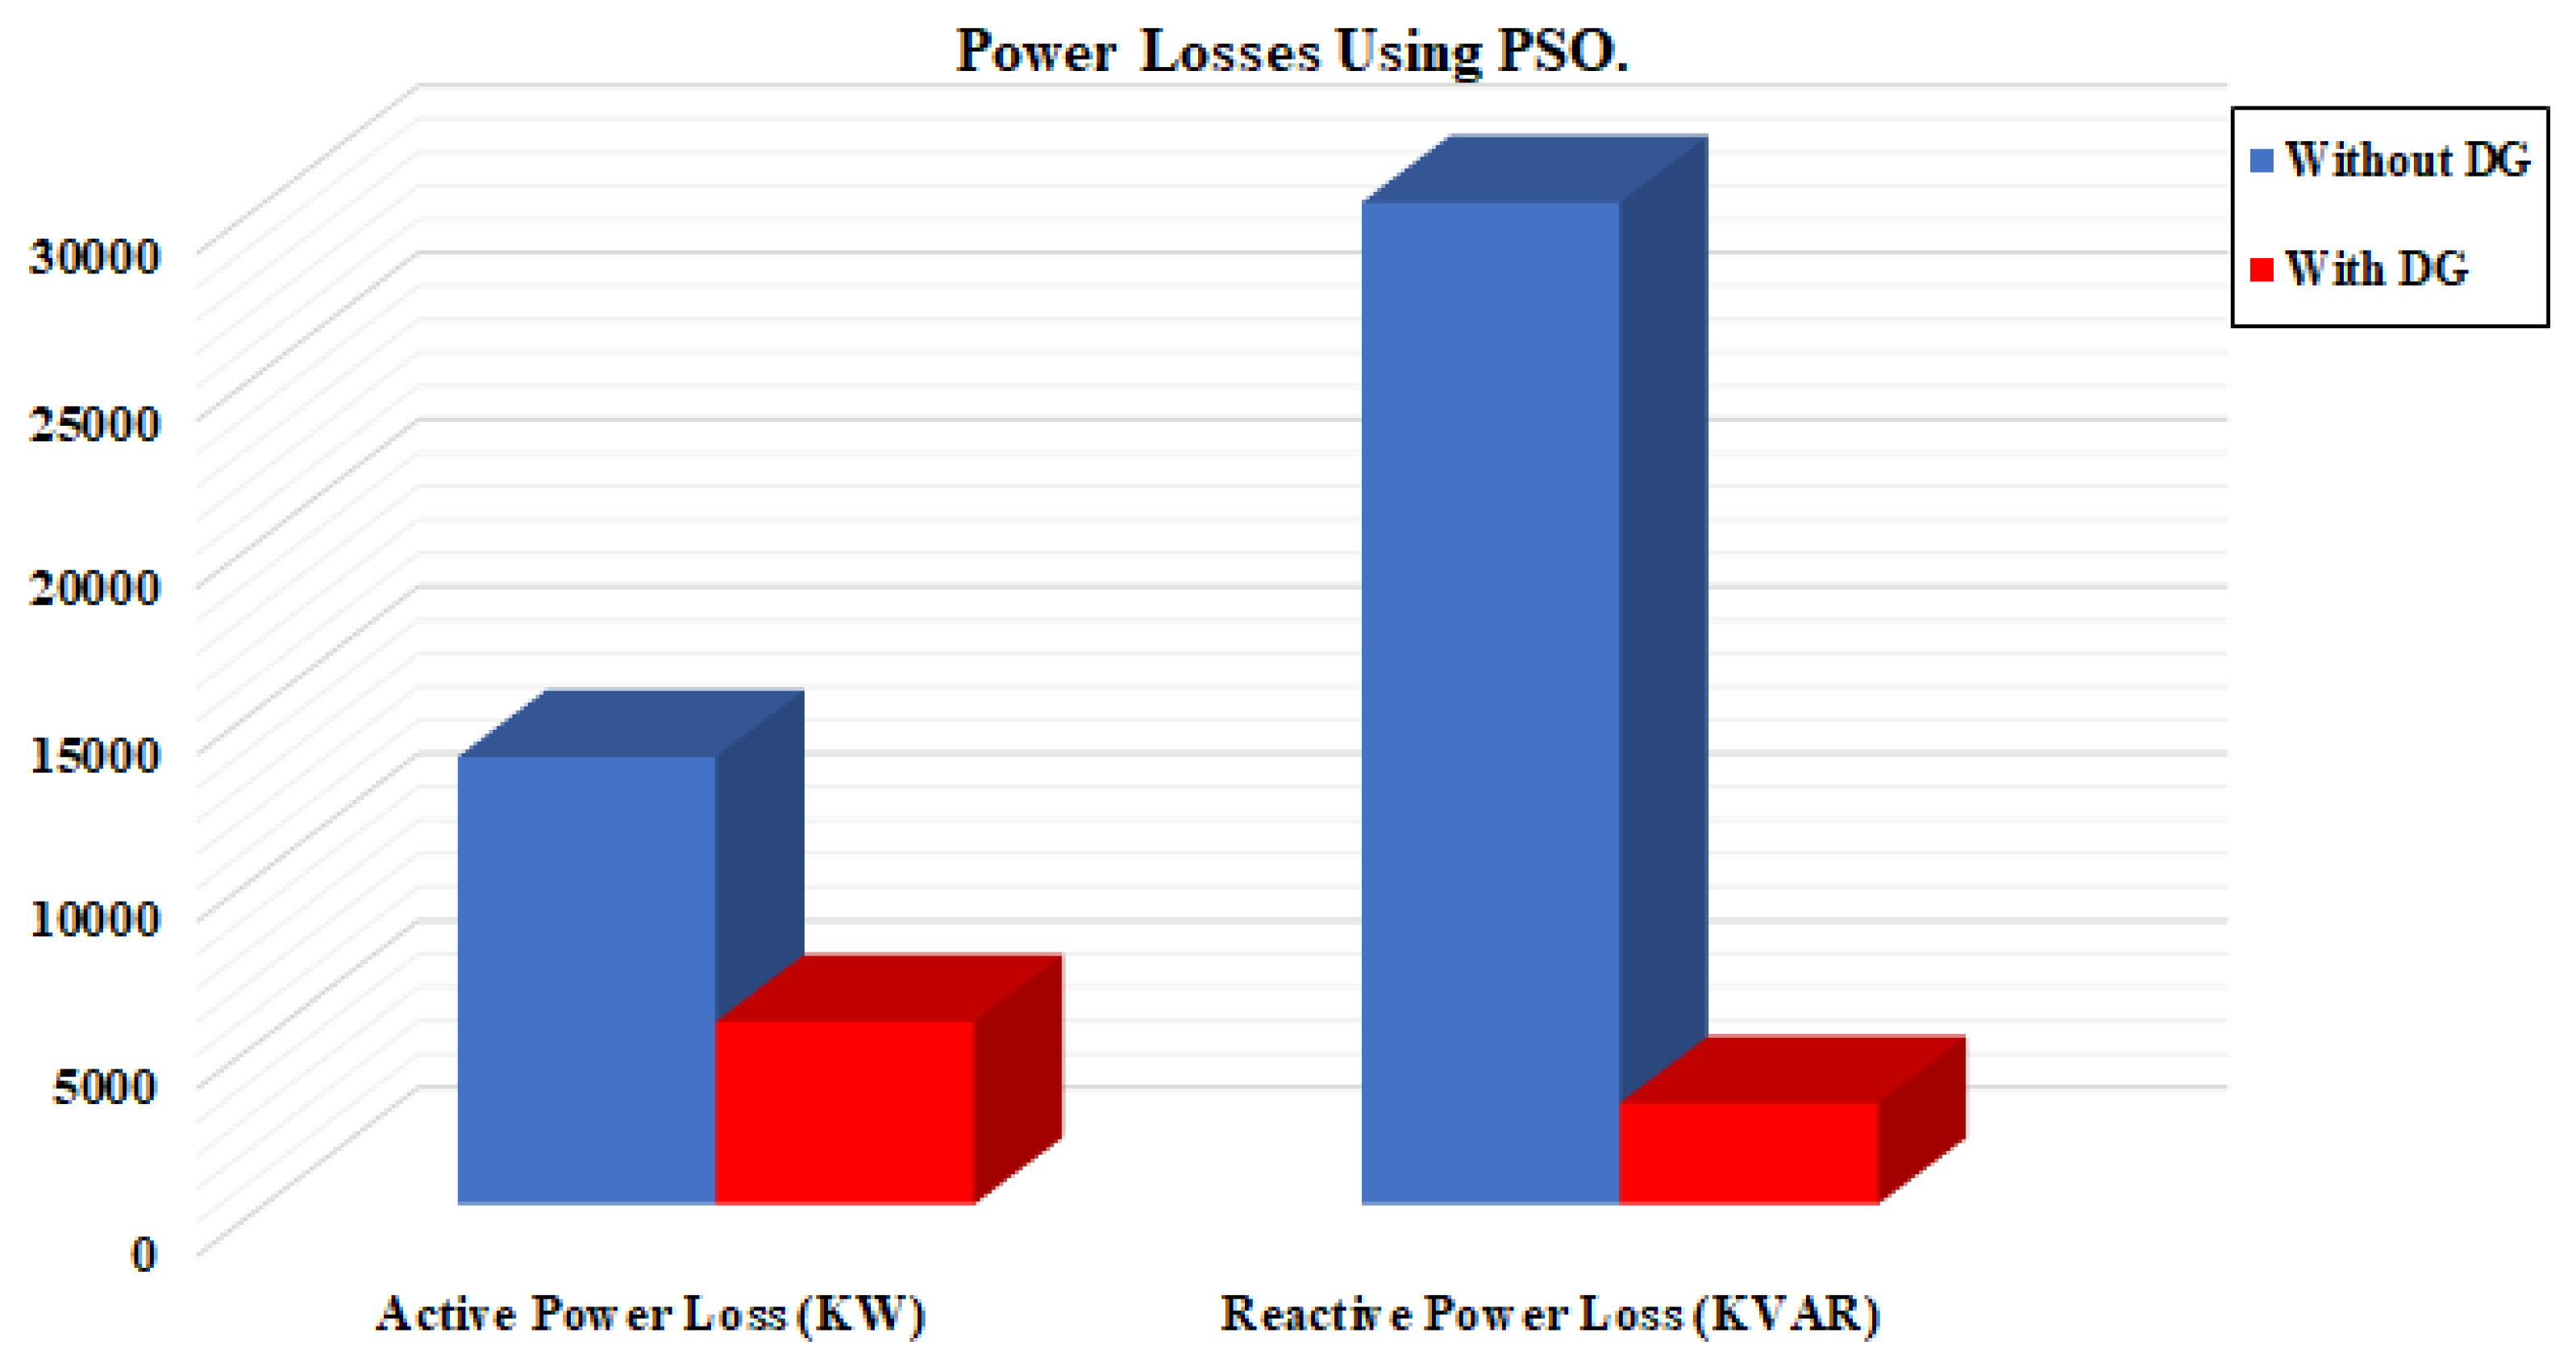
Figure 12.
Optimum site and size of Distributed Generation unit predicted by Genetic Algorithm.
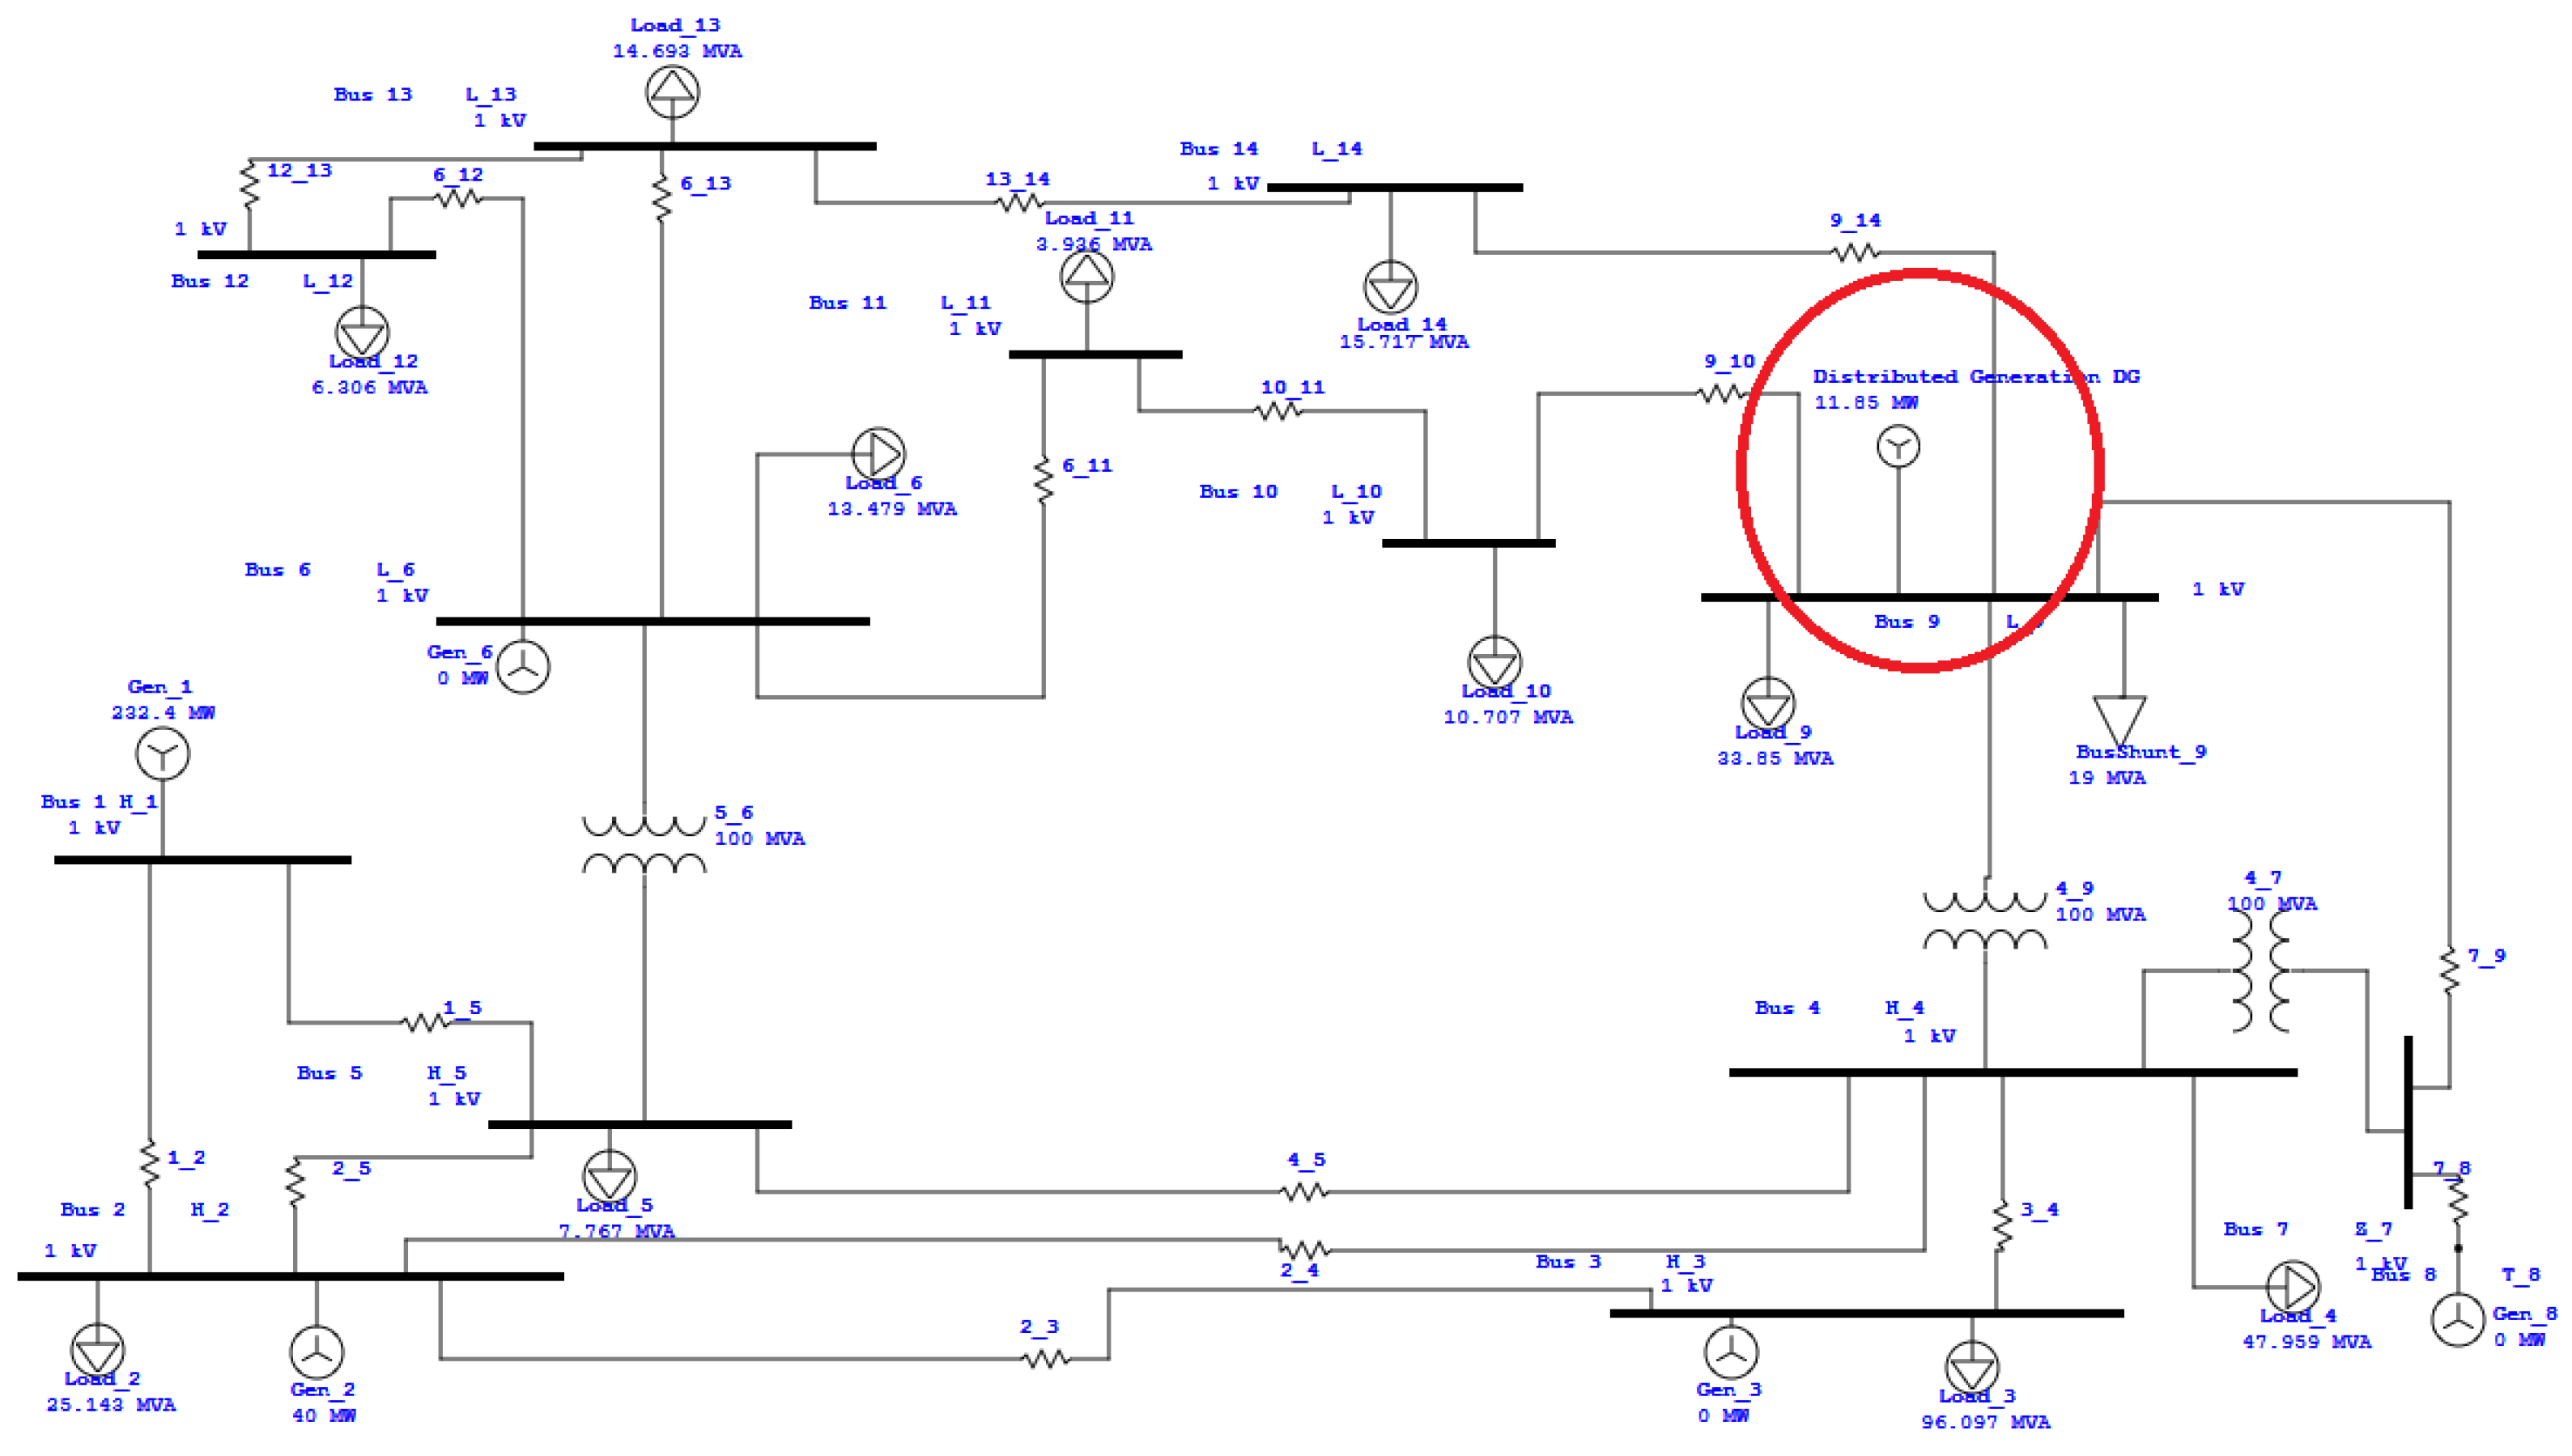
Figure 13.
Test system load flow analysis.
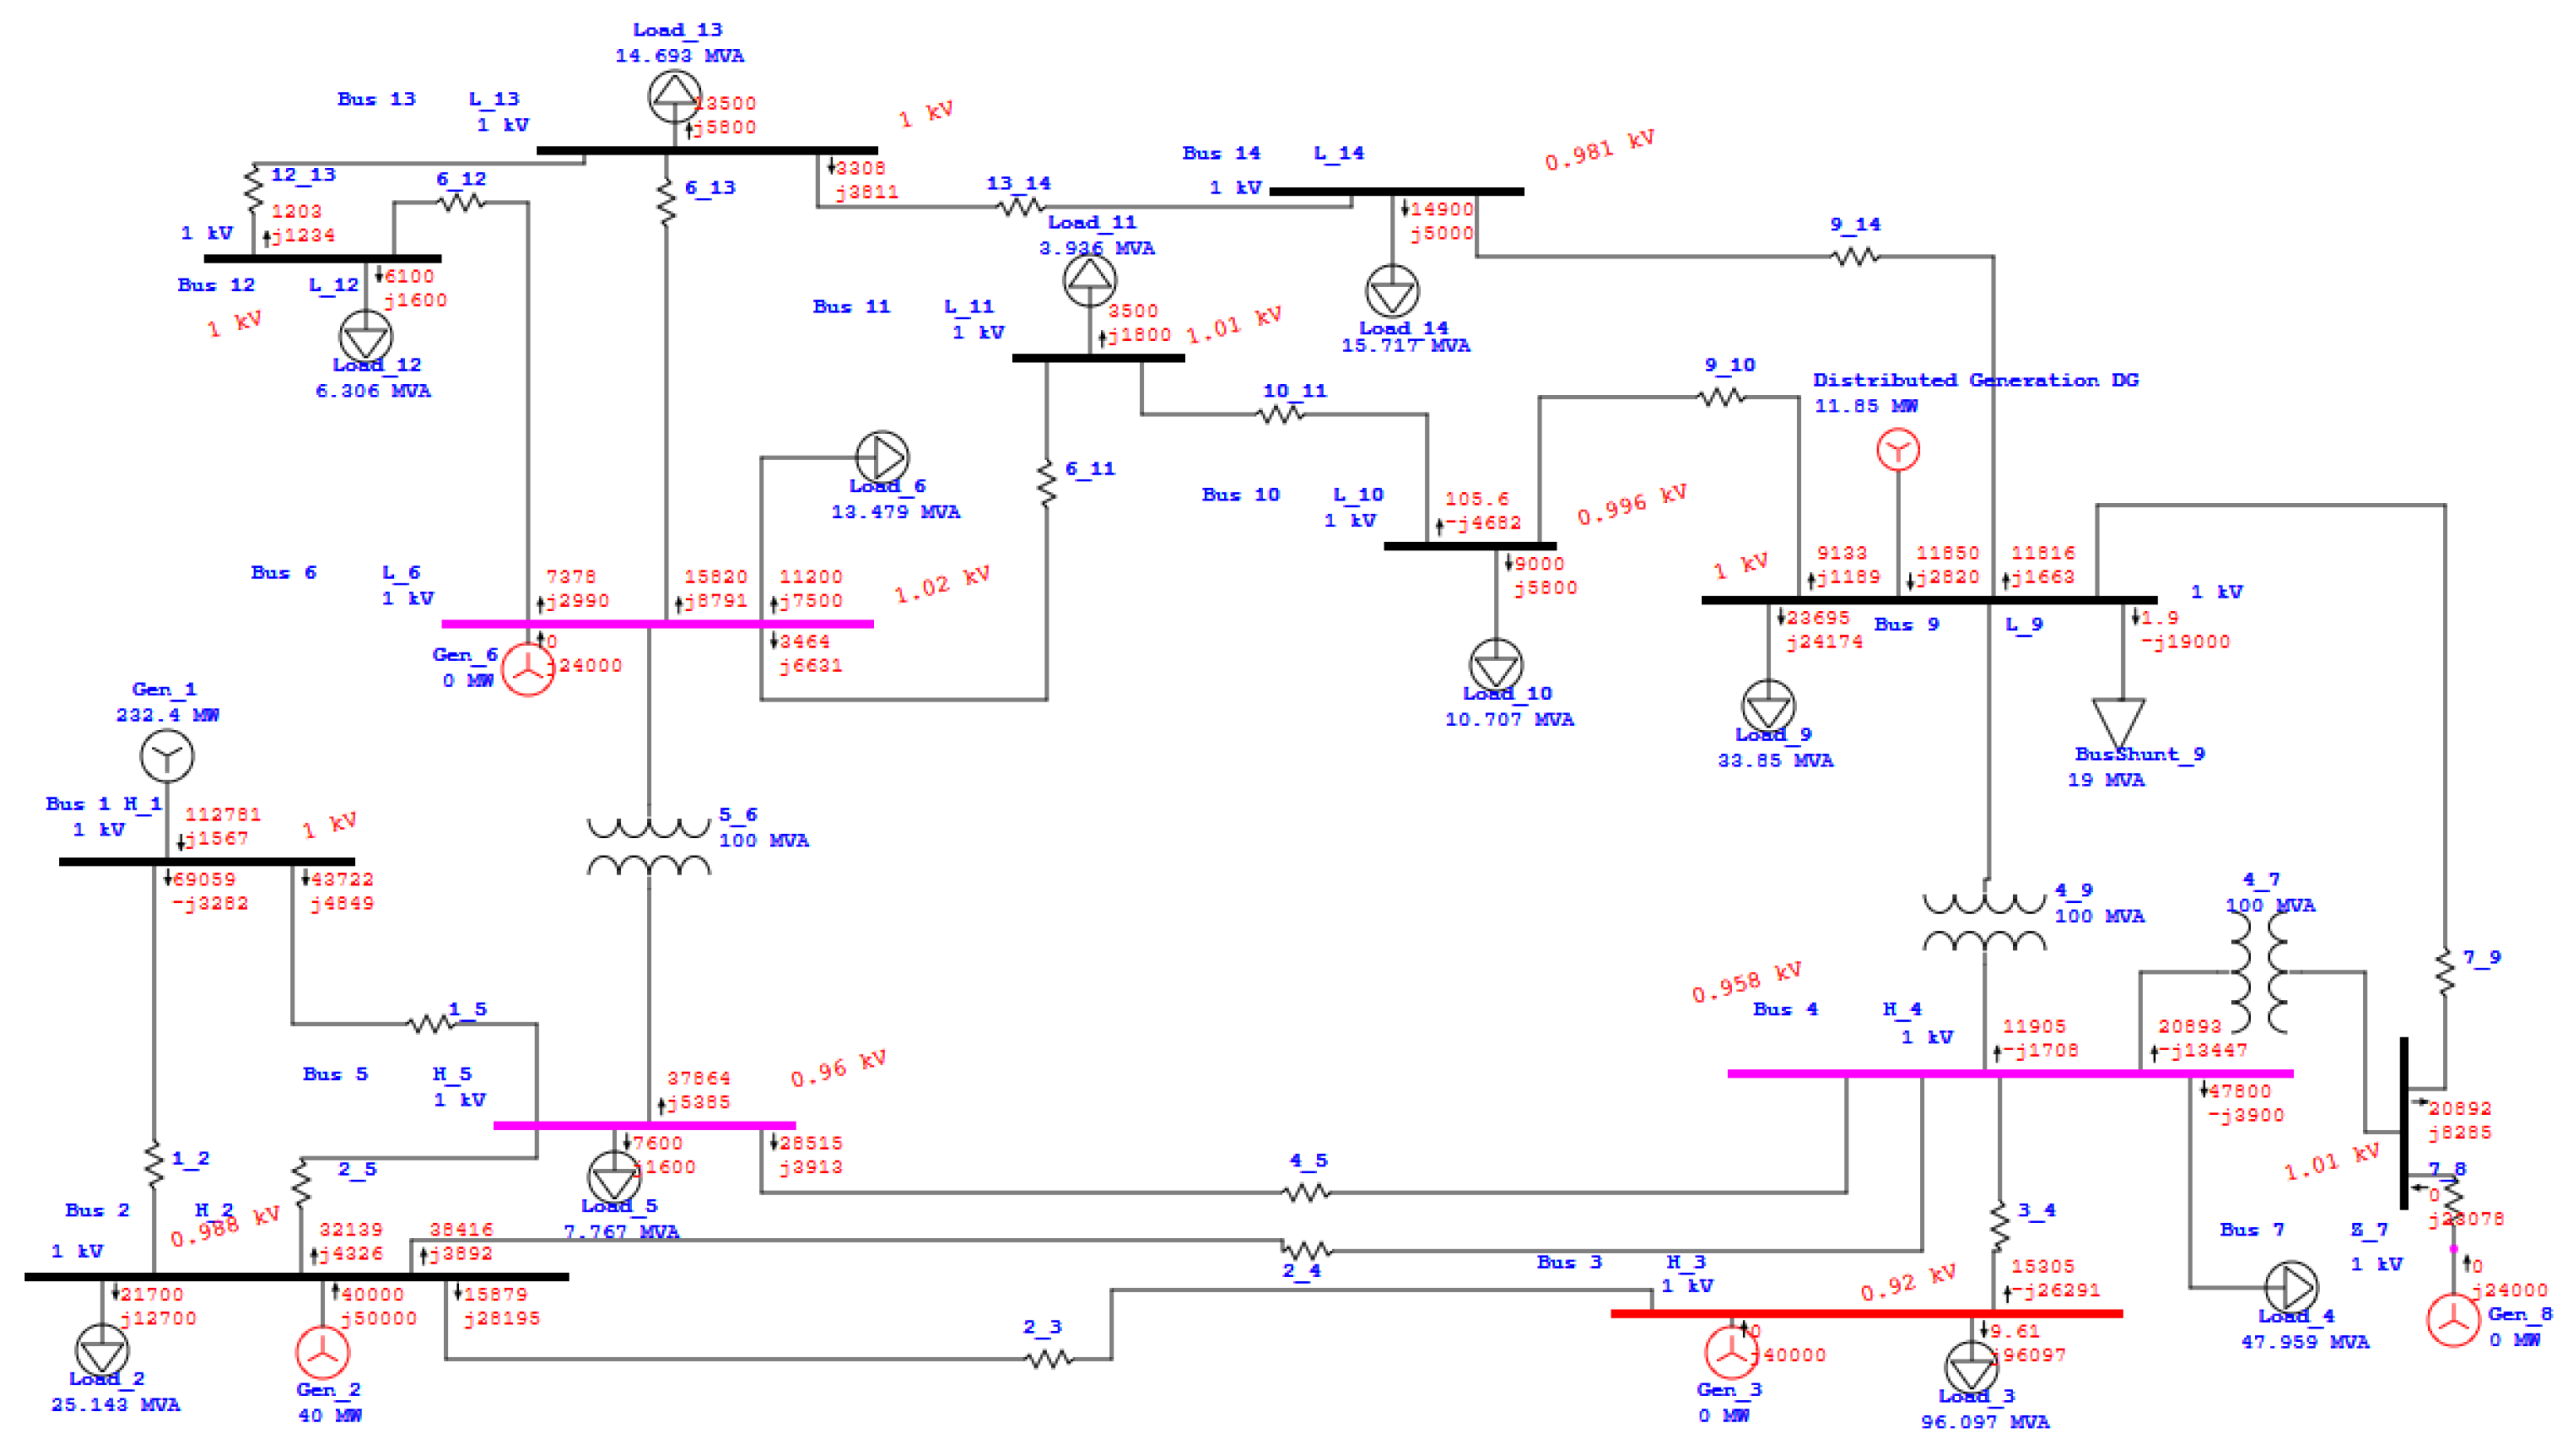
Figure 14.
Voltage Profile of the test system on each busbar with respect to base case.
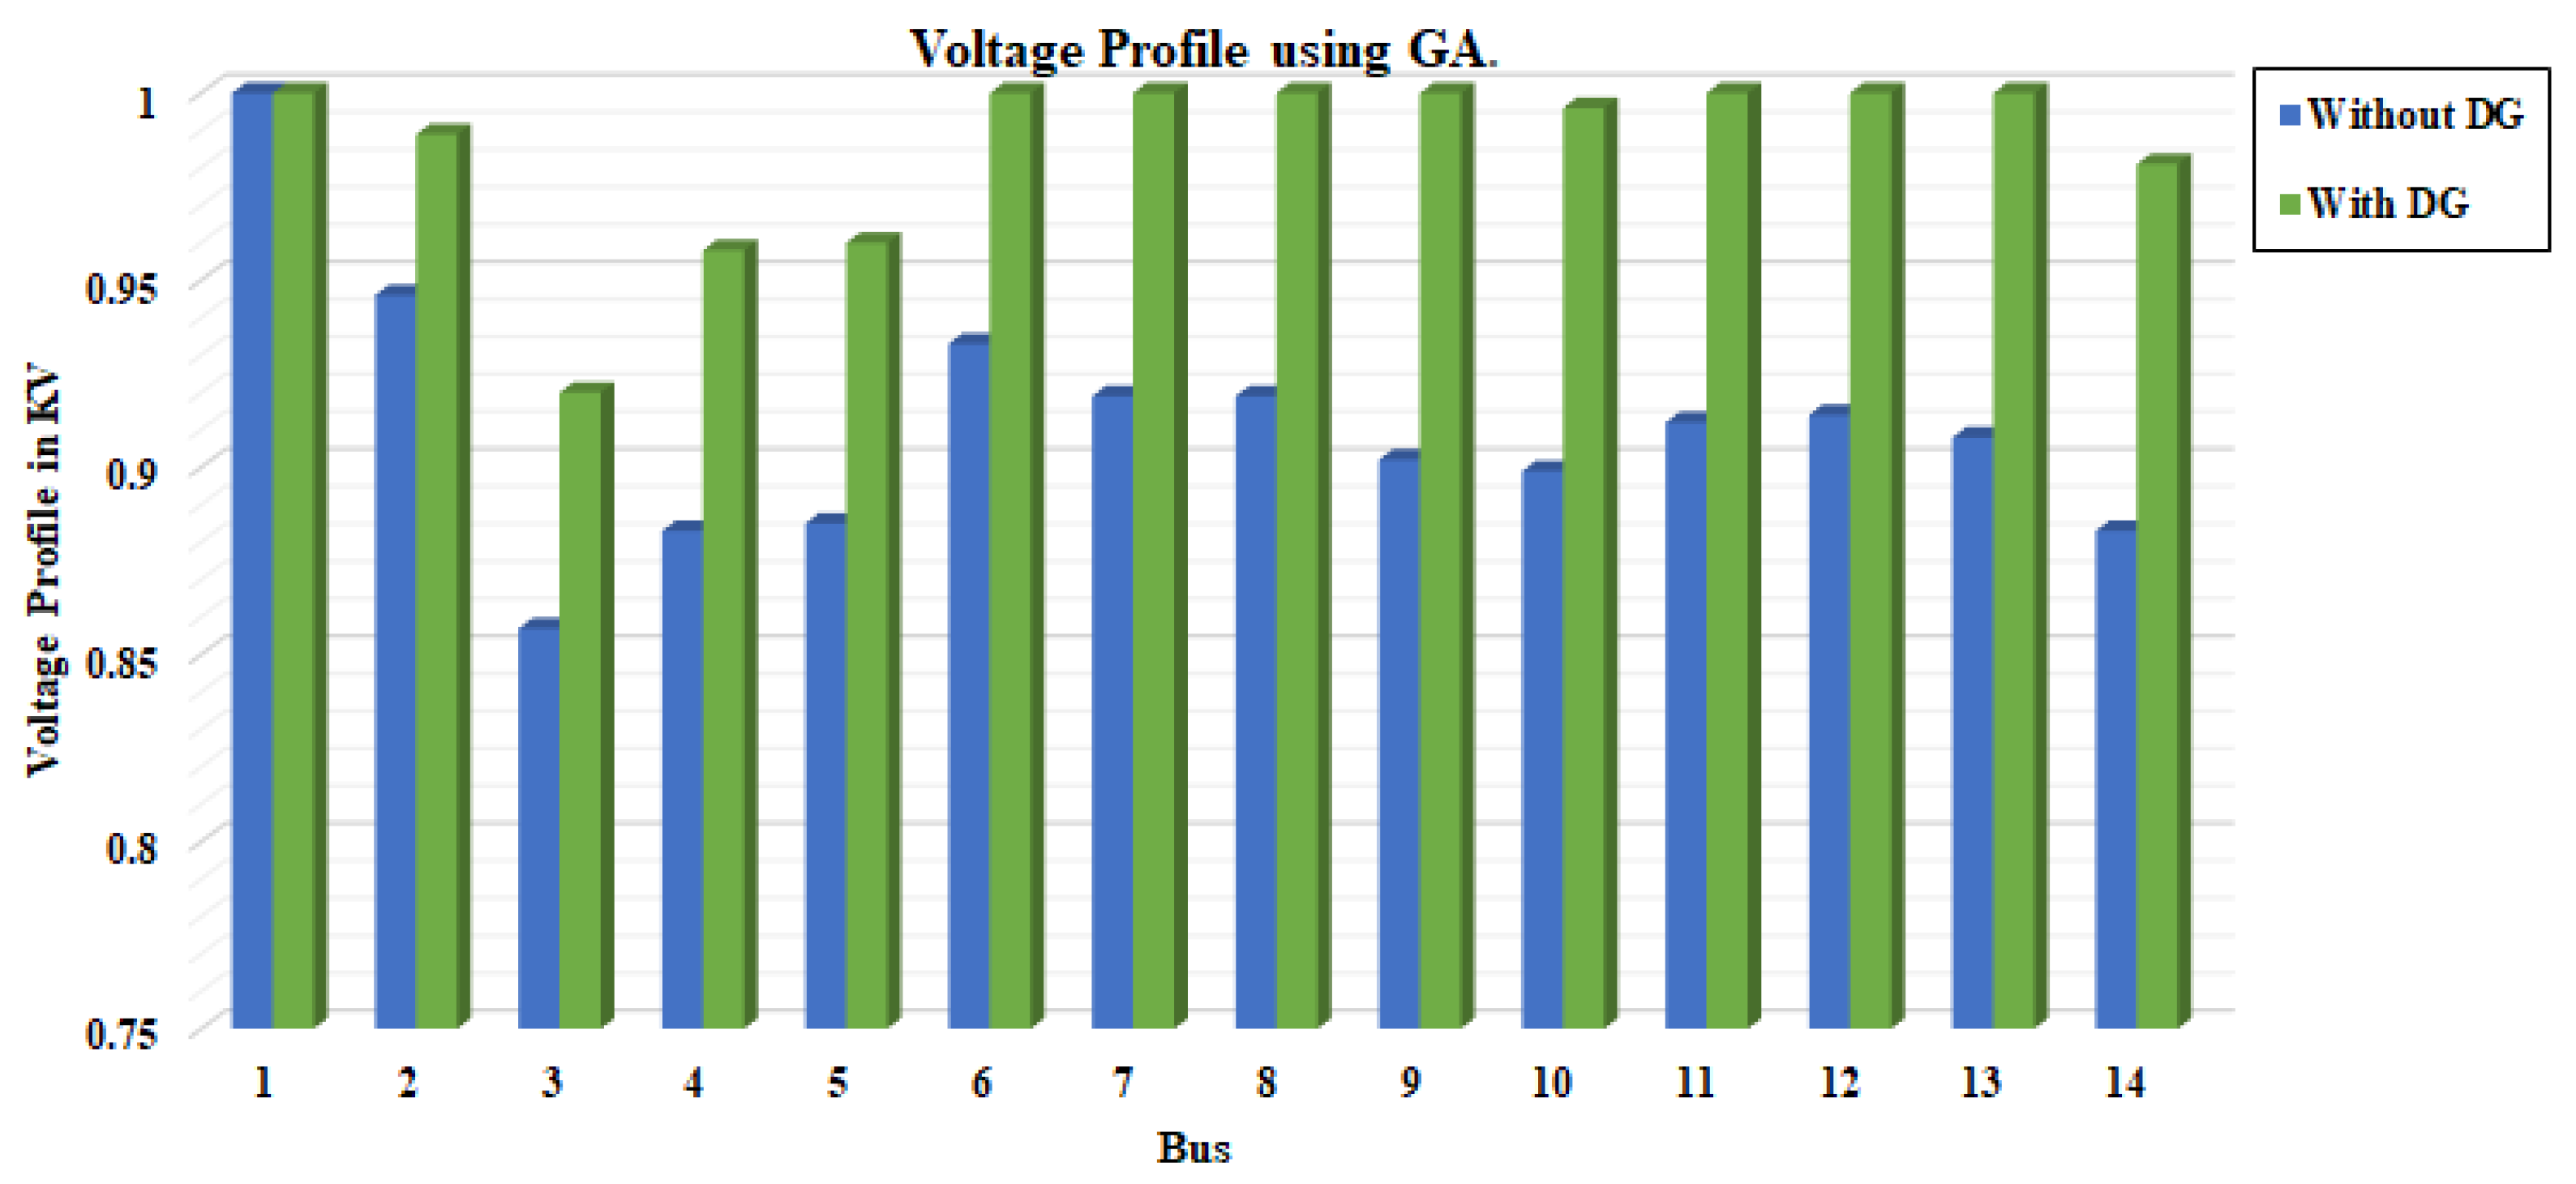
Figure 15.
Power Losses in comparison with base case.
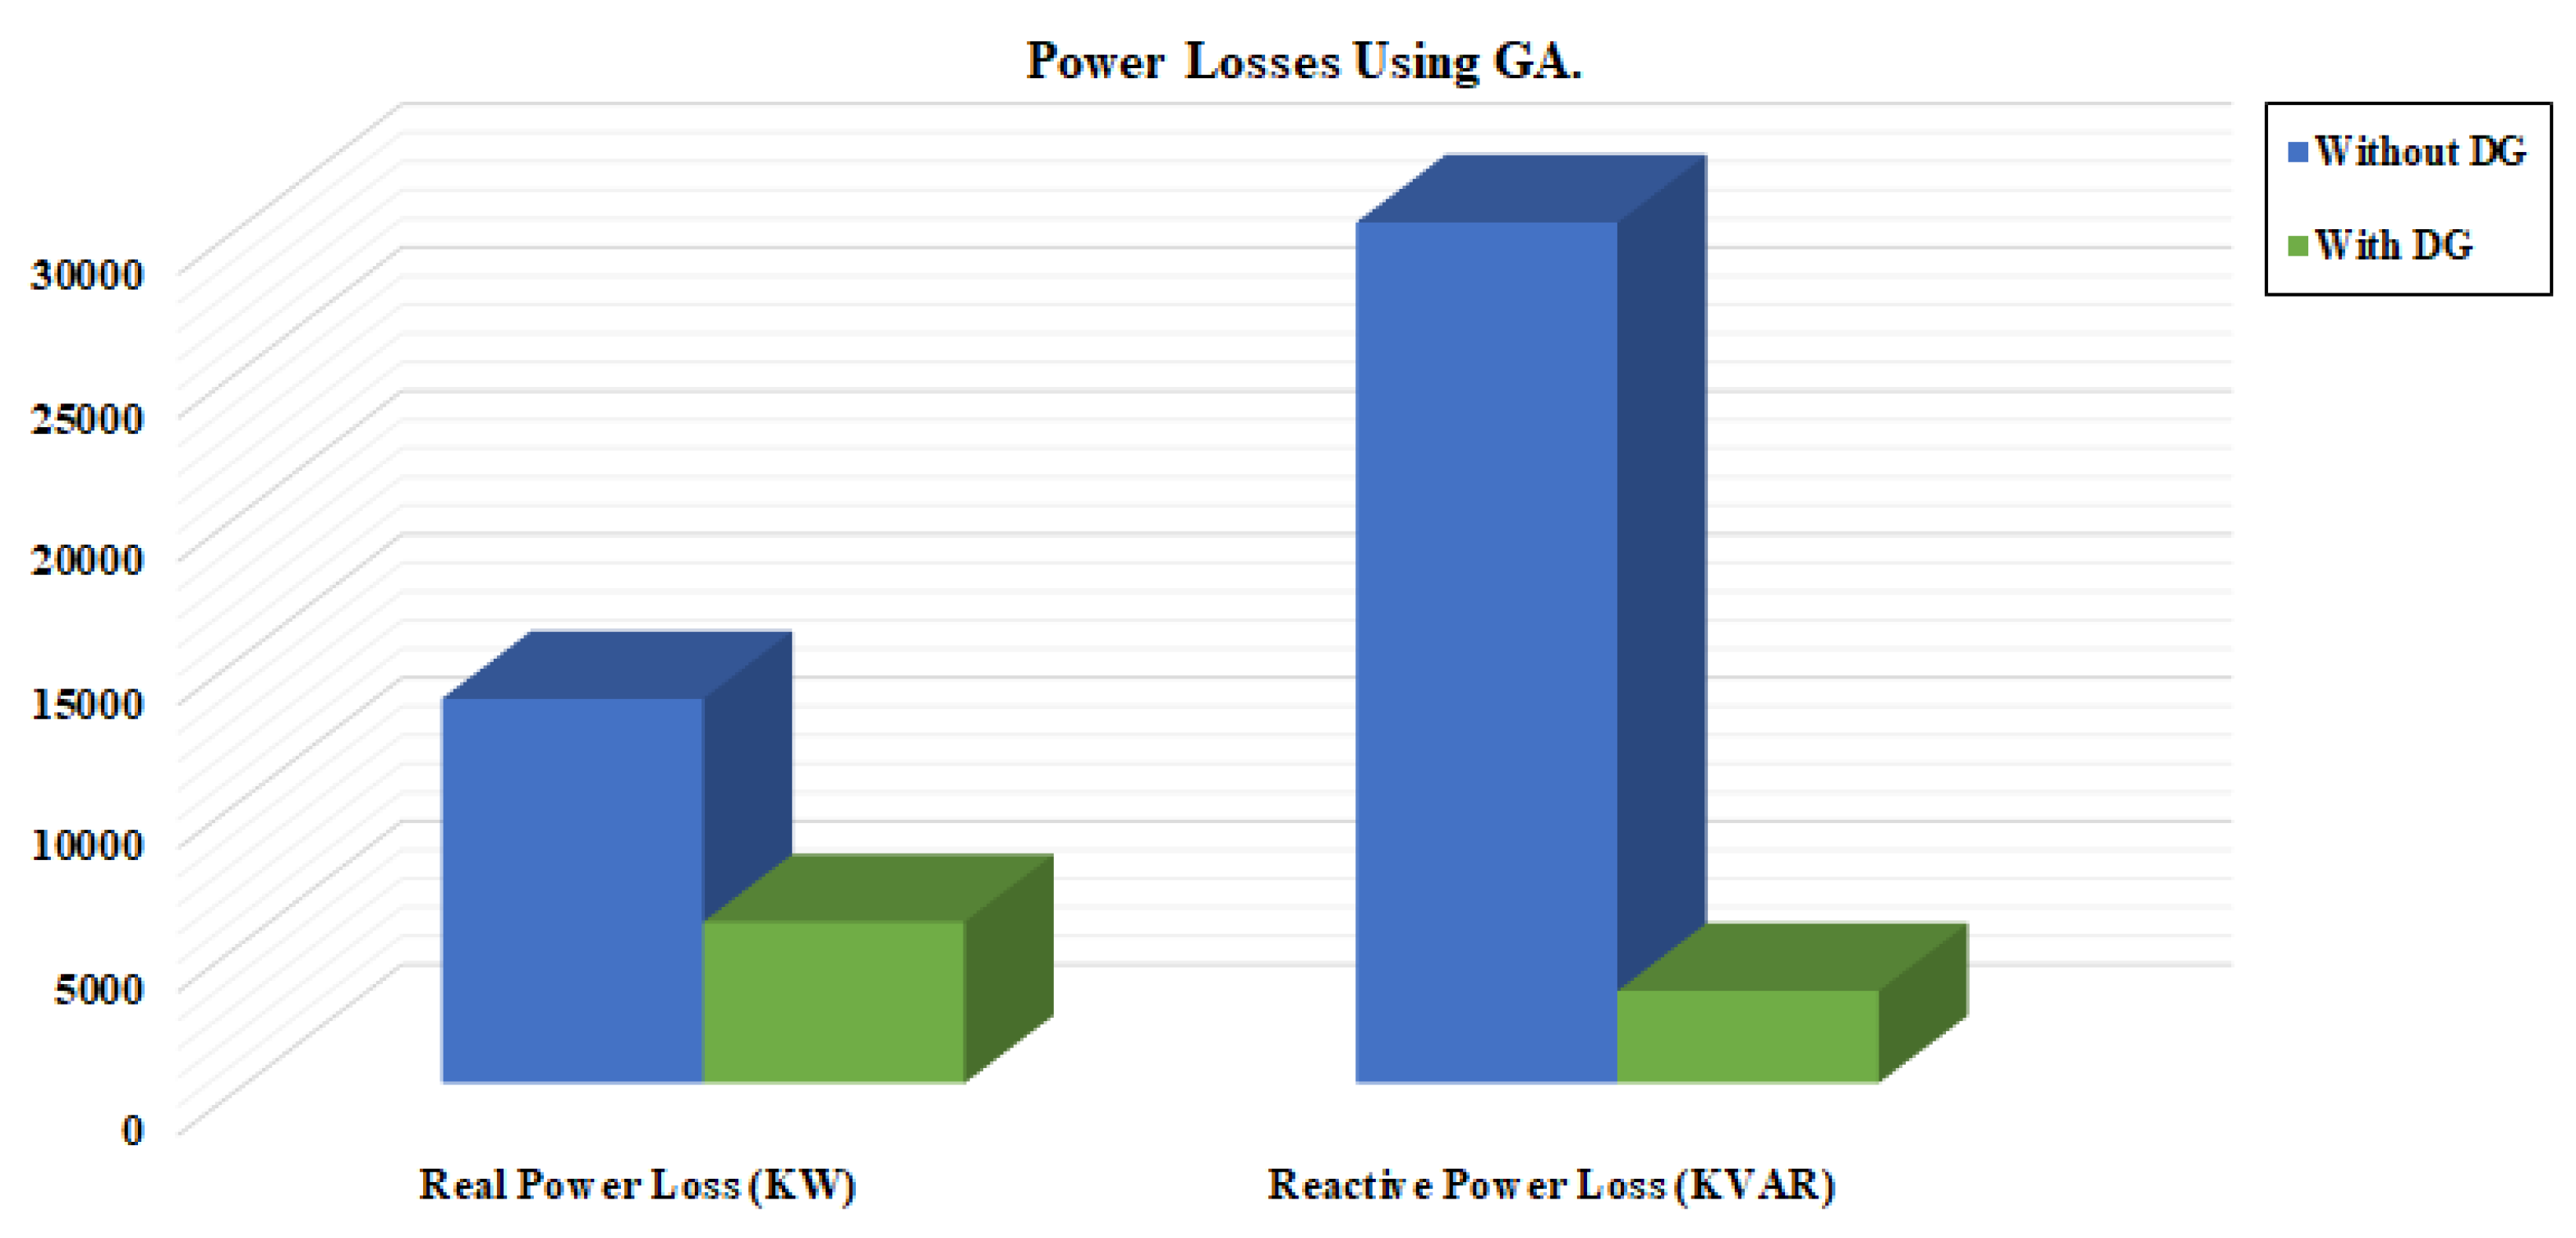
Figure 16.
Optimum site and size of Distributed Generation unit predicted by Hybrid Algorithm.
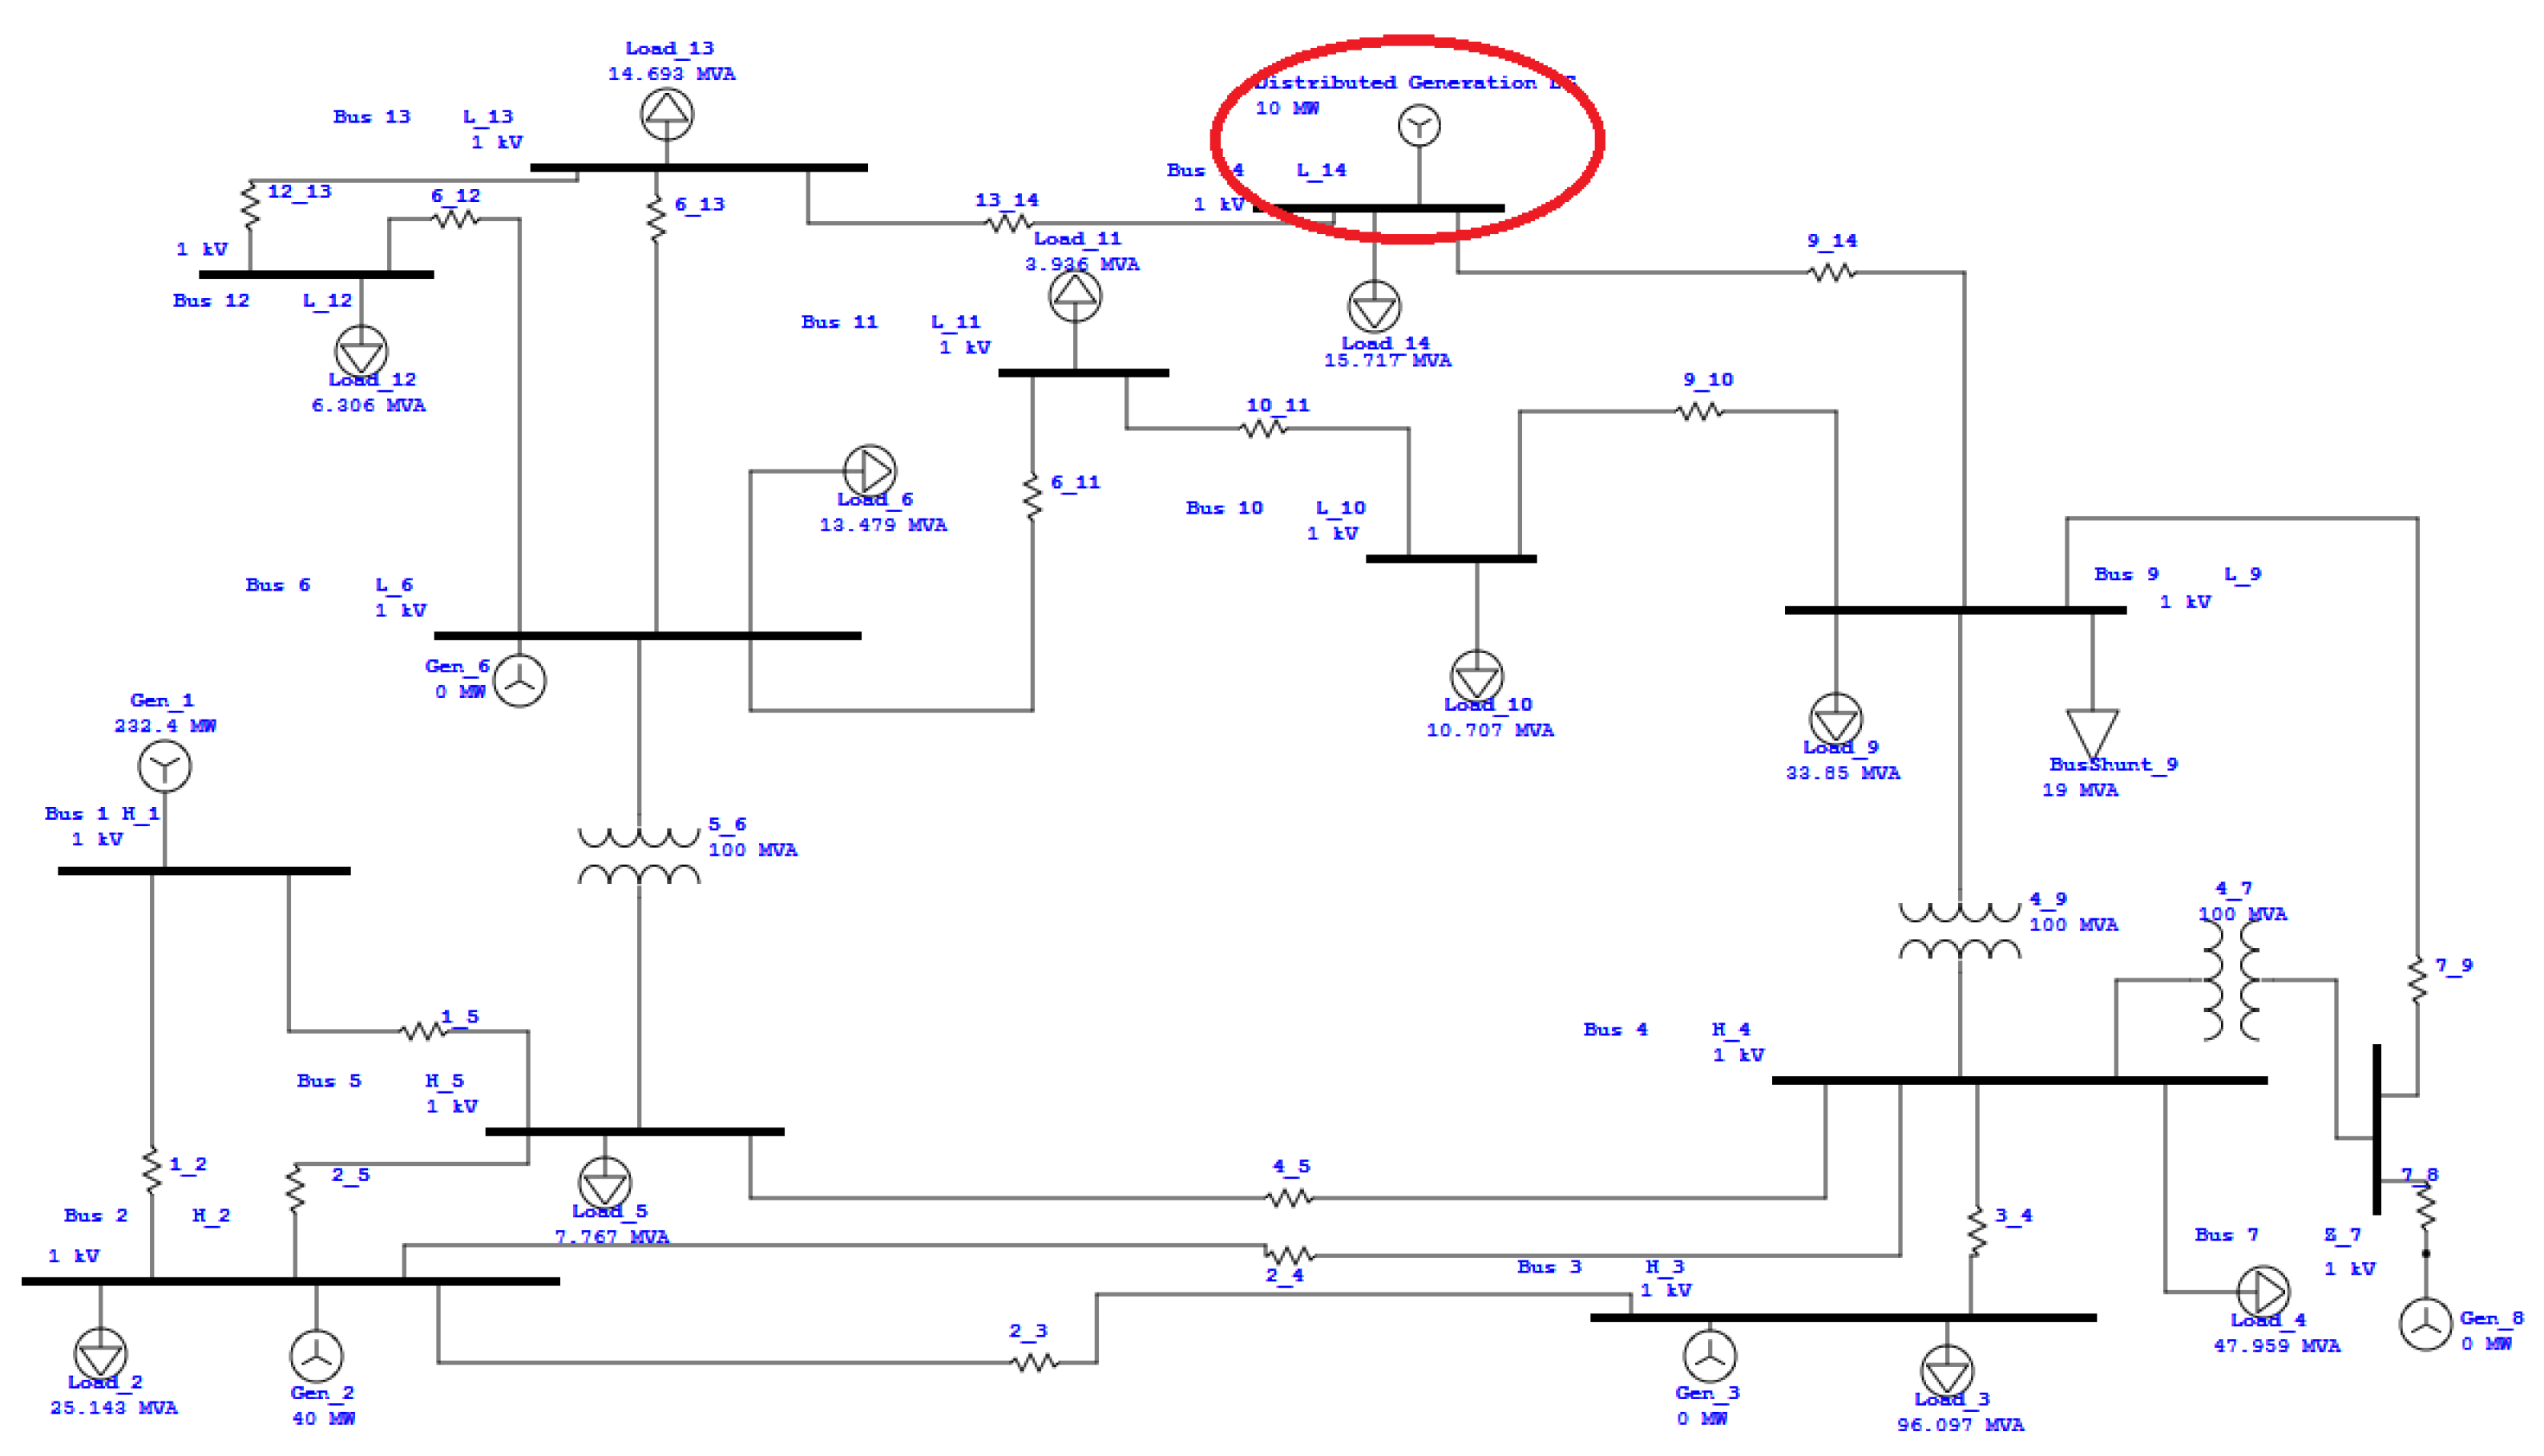
Figure 17.
Test system load flow analysis.
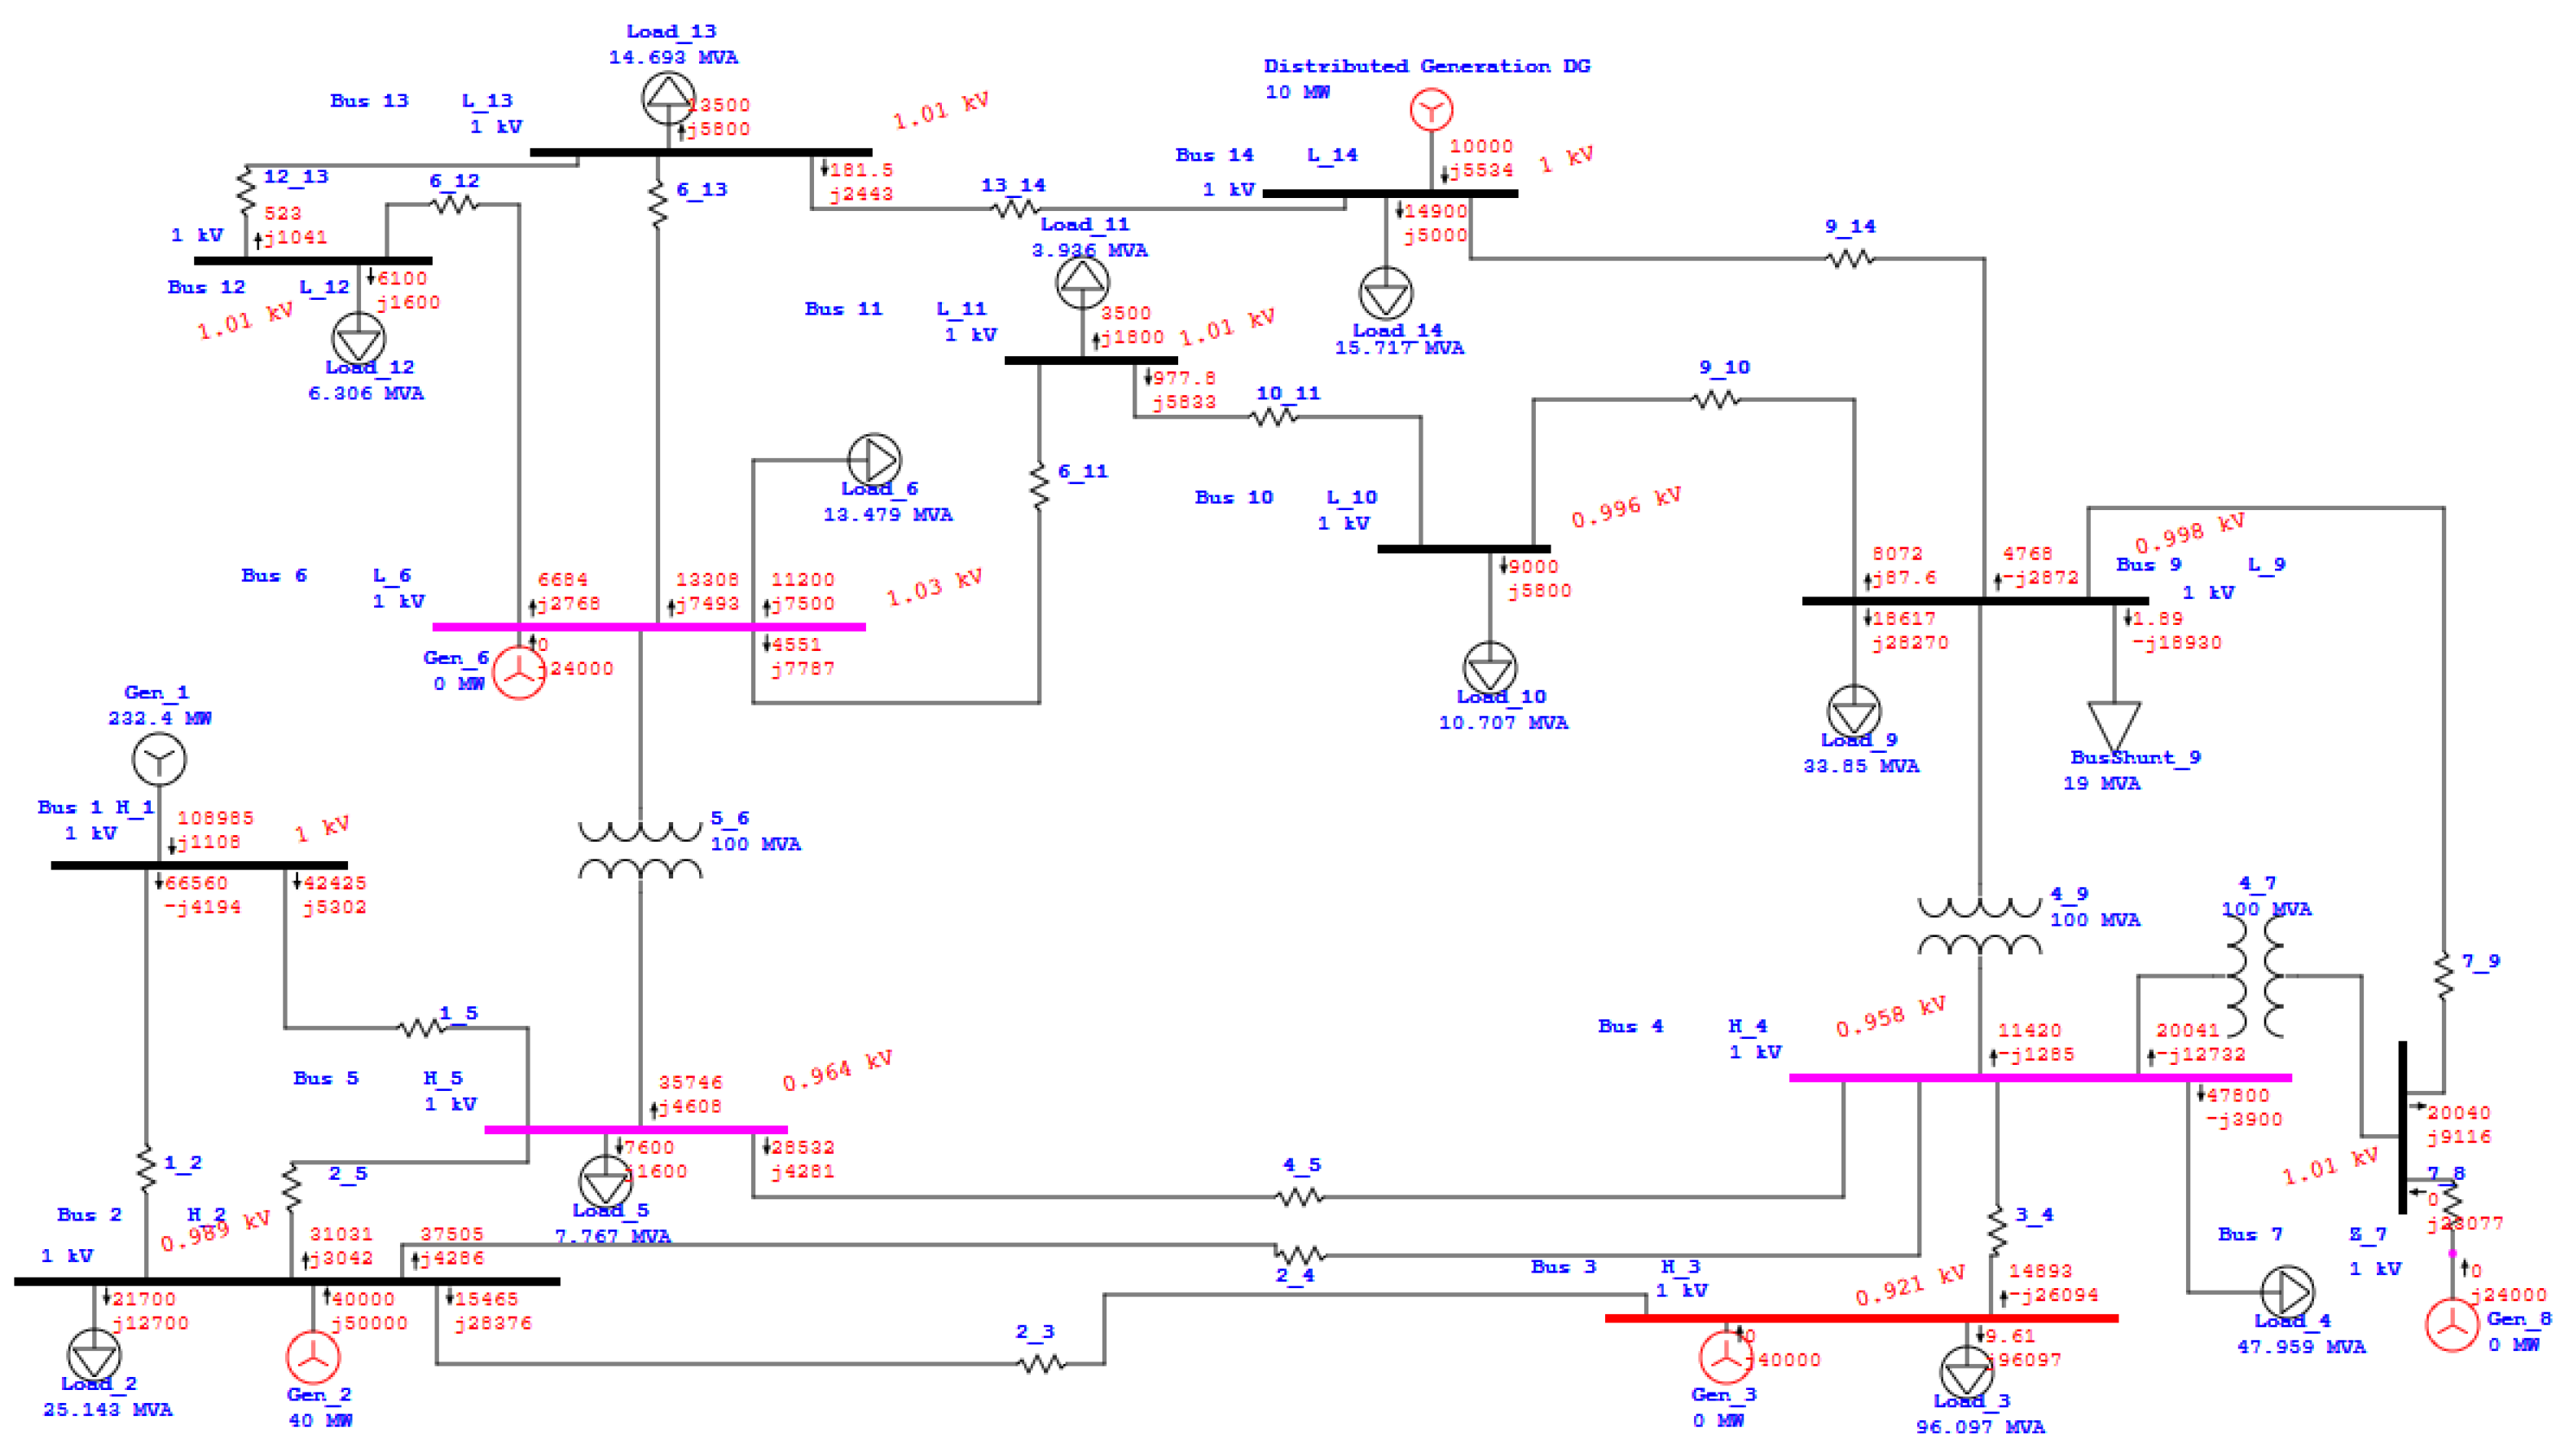
Figure 18.
Voltage Profile of the test system on each busbar with respect to the base case.

Figure 19.
Power Losses in comparison with the base case.
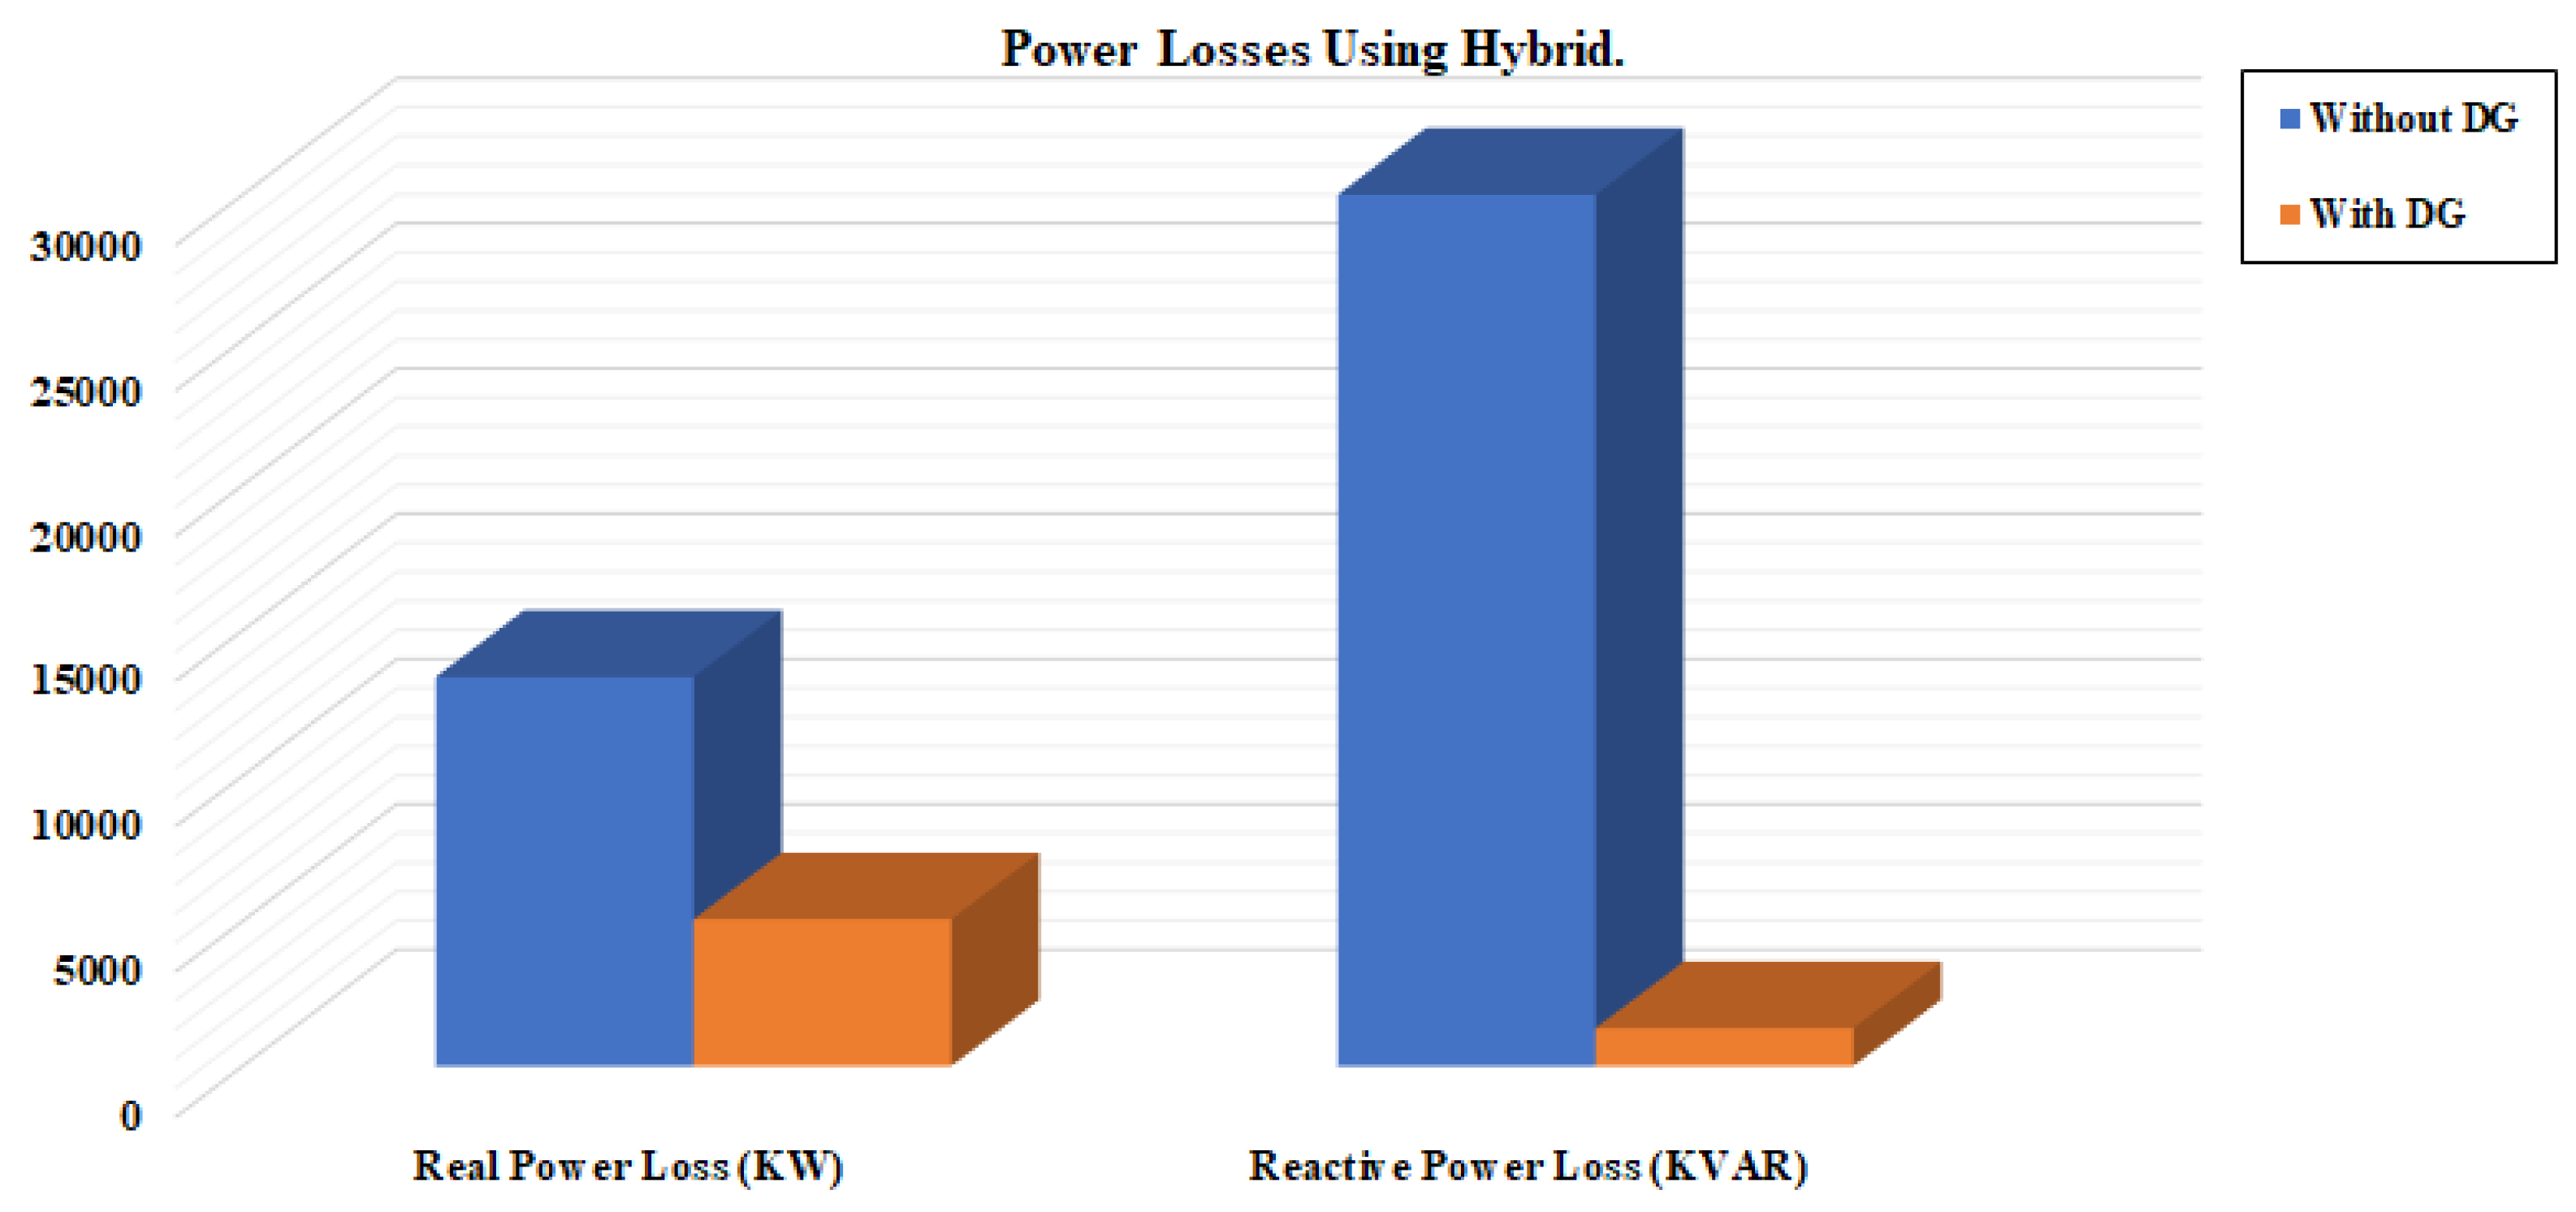
Figure 20.
Voltage Profile comparison analysis of IEEE 14 Busbar test system.
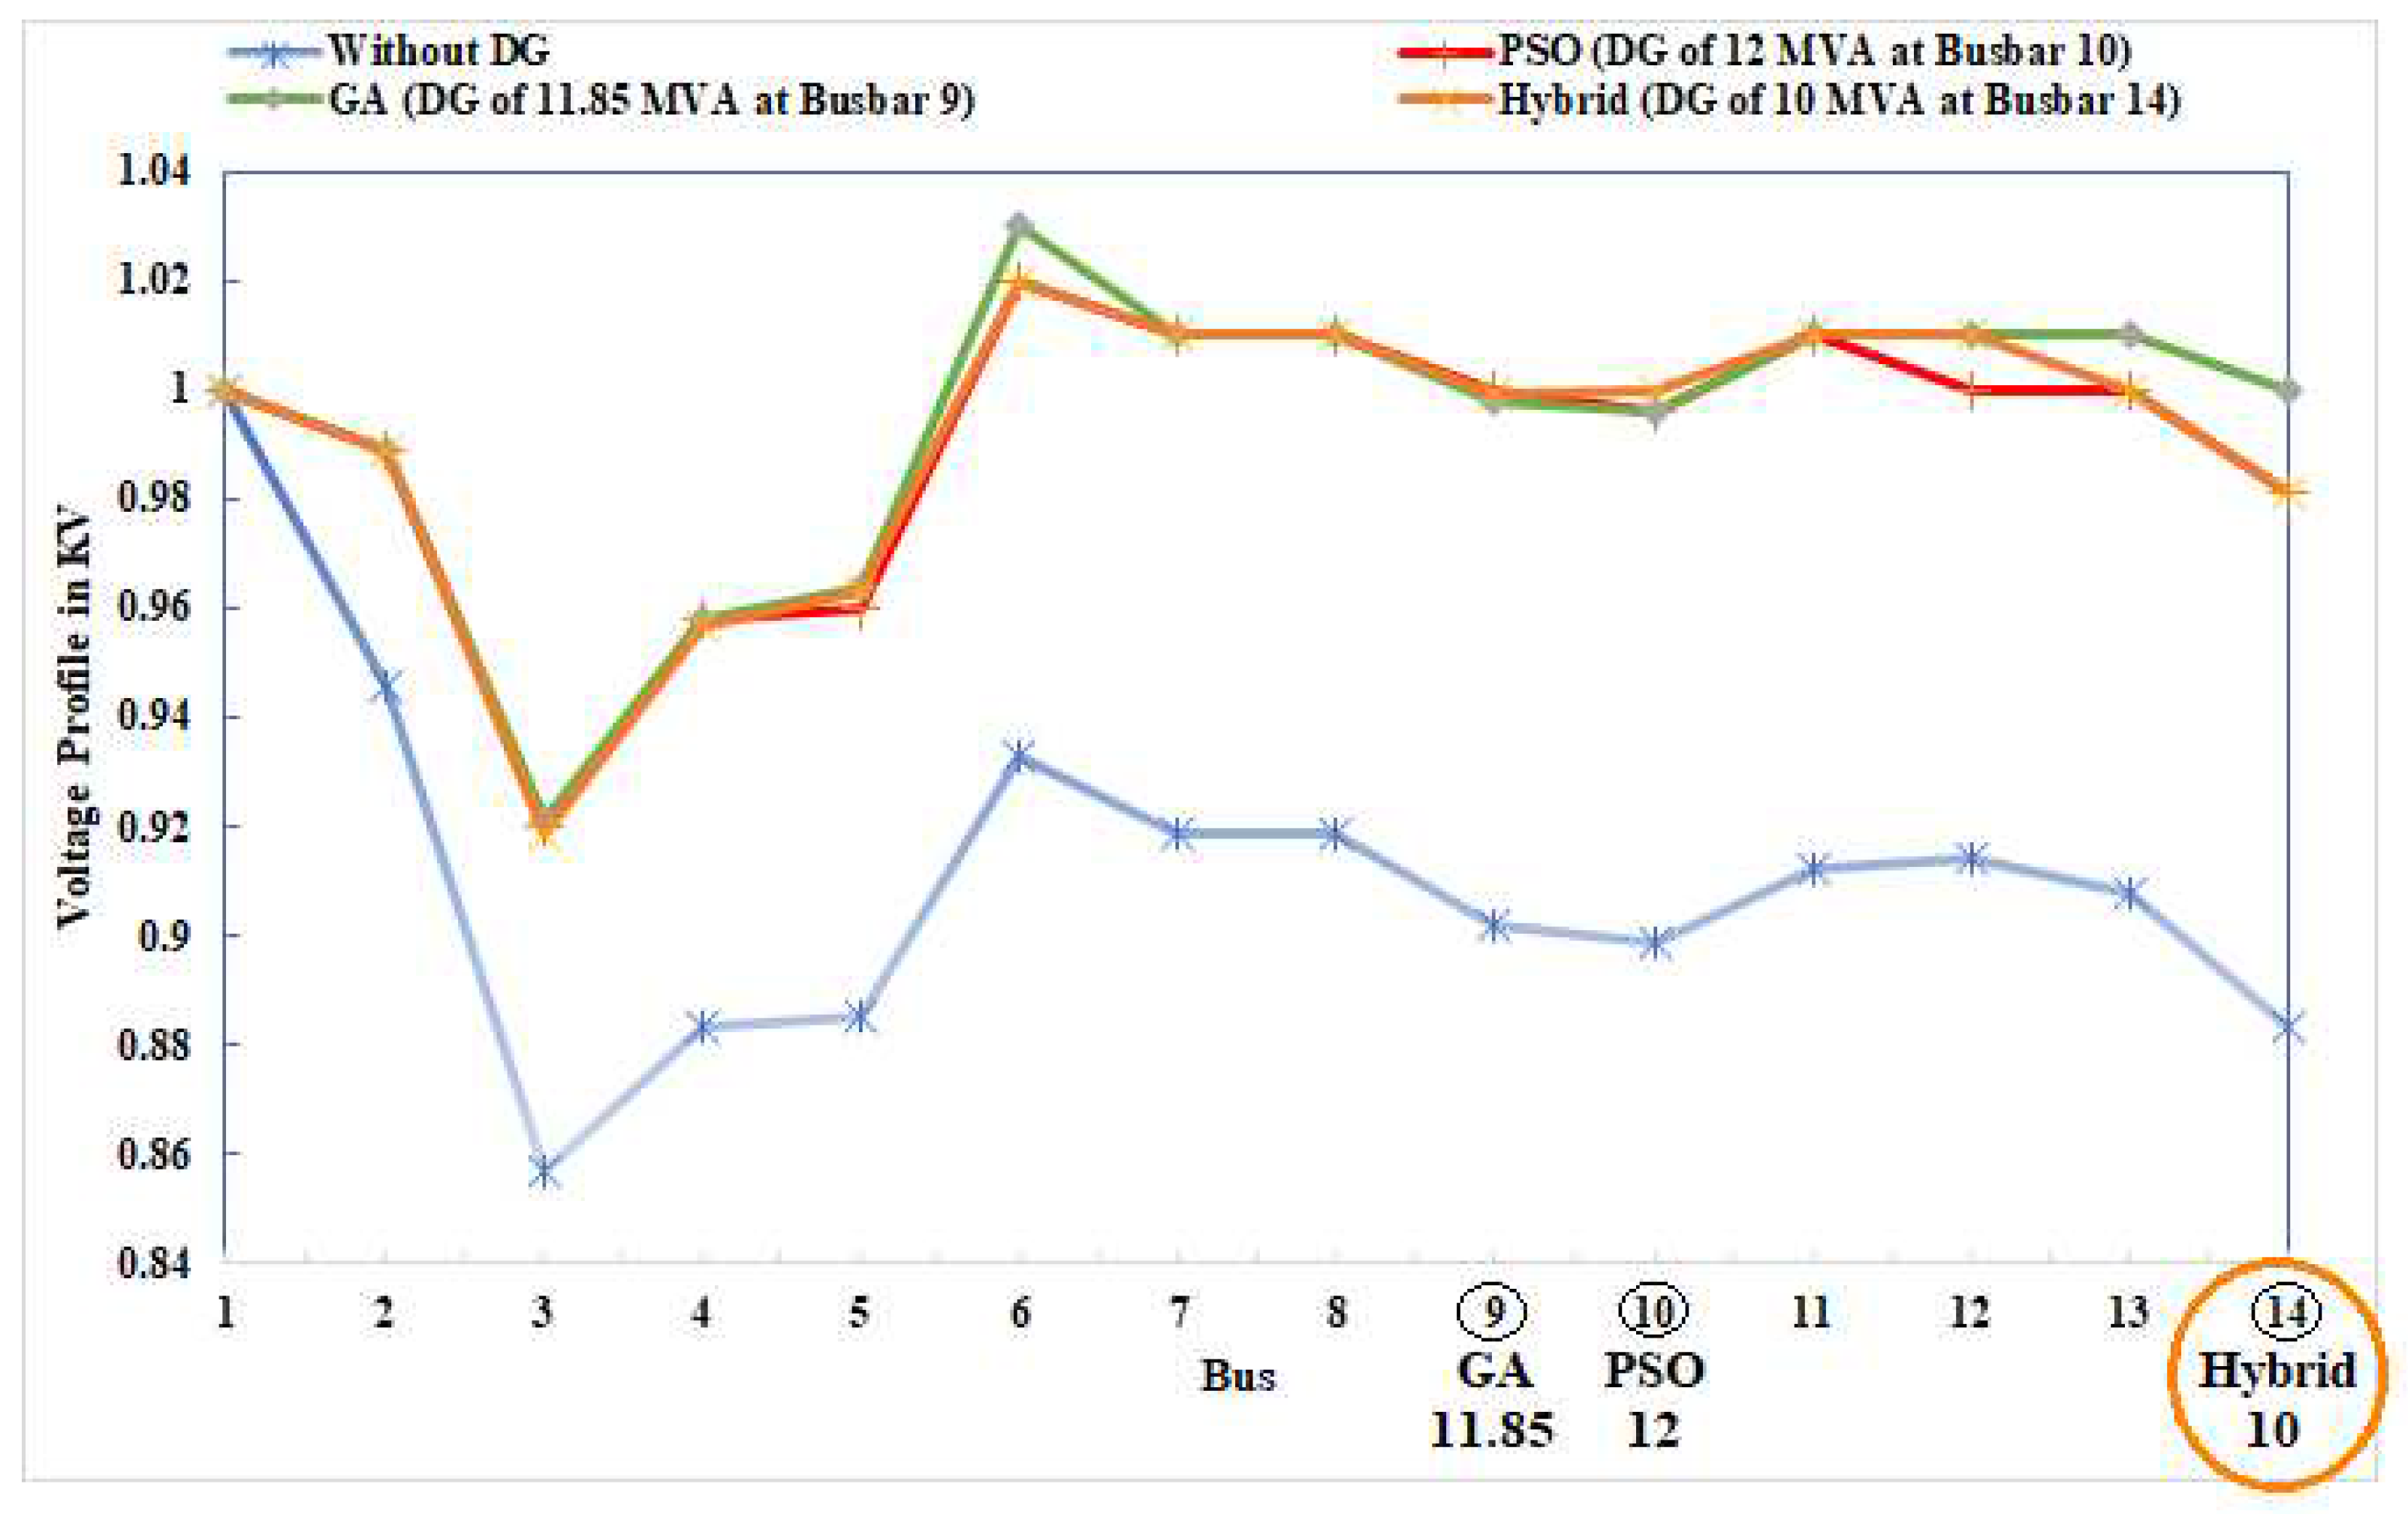
Figure 21.
Power Losses comparison analysis of IEEE 14 busbar test system.
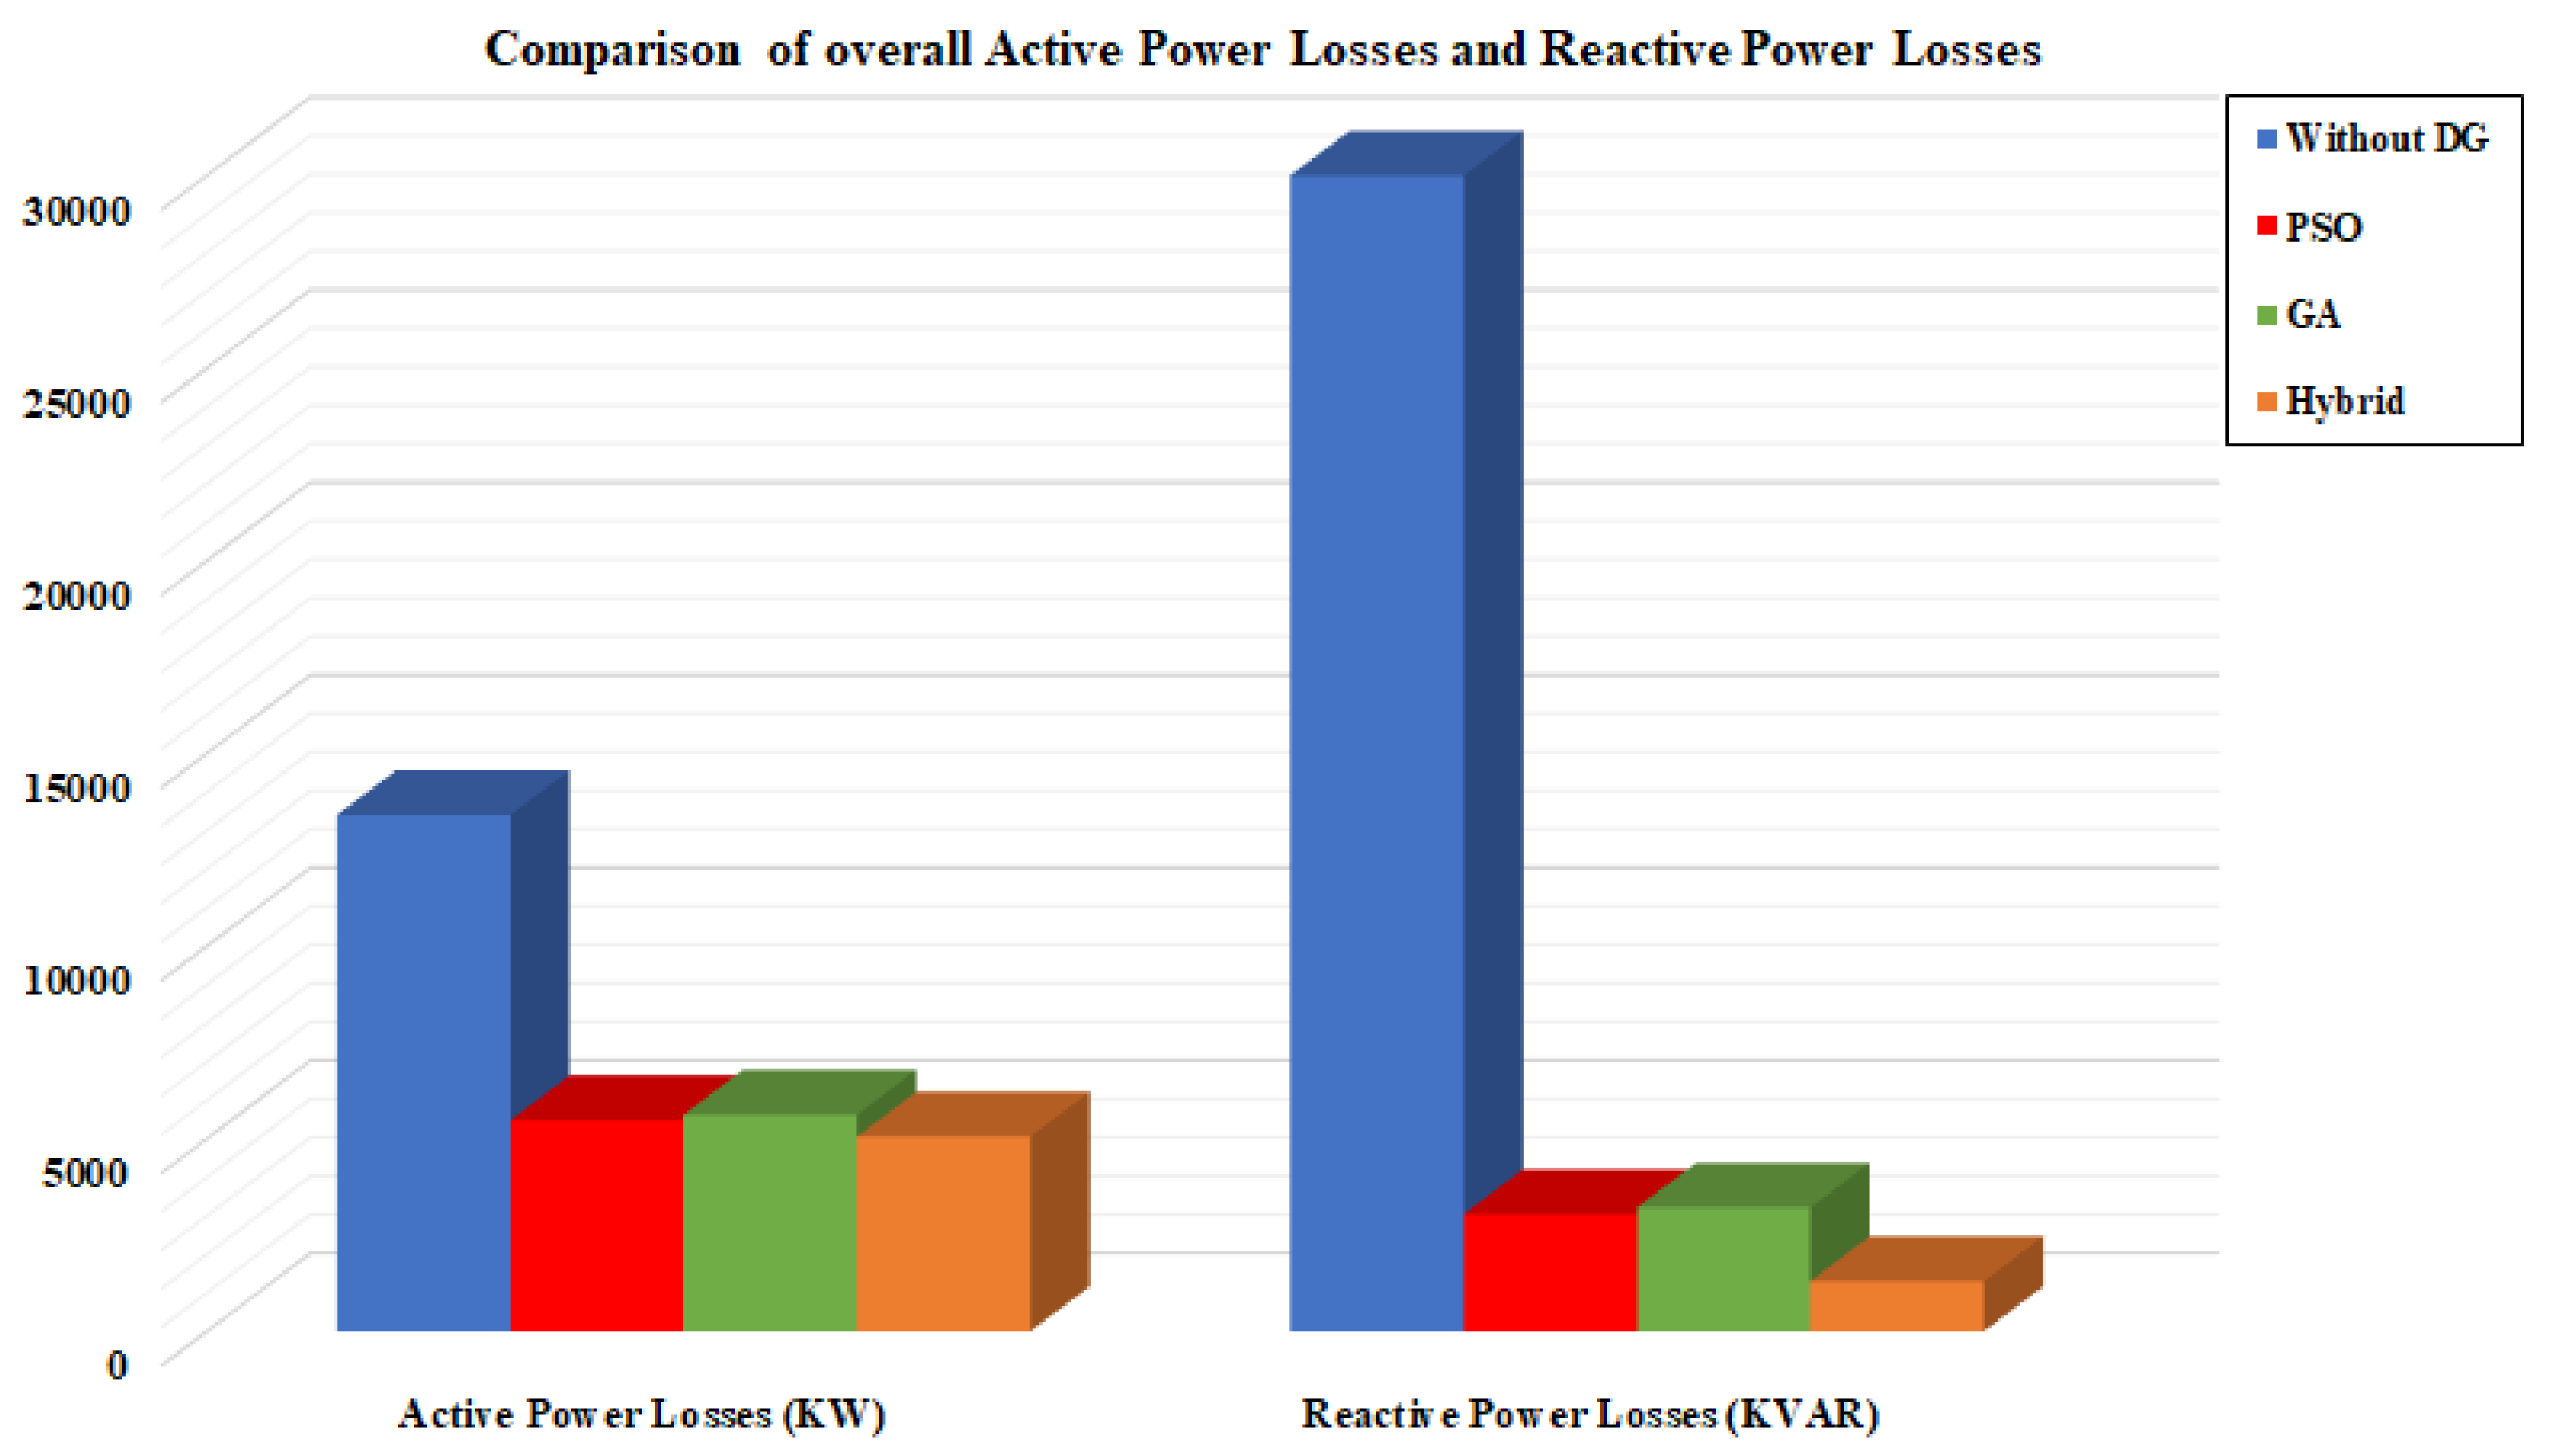
Figure 22.
Variances of objective function.
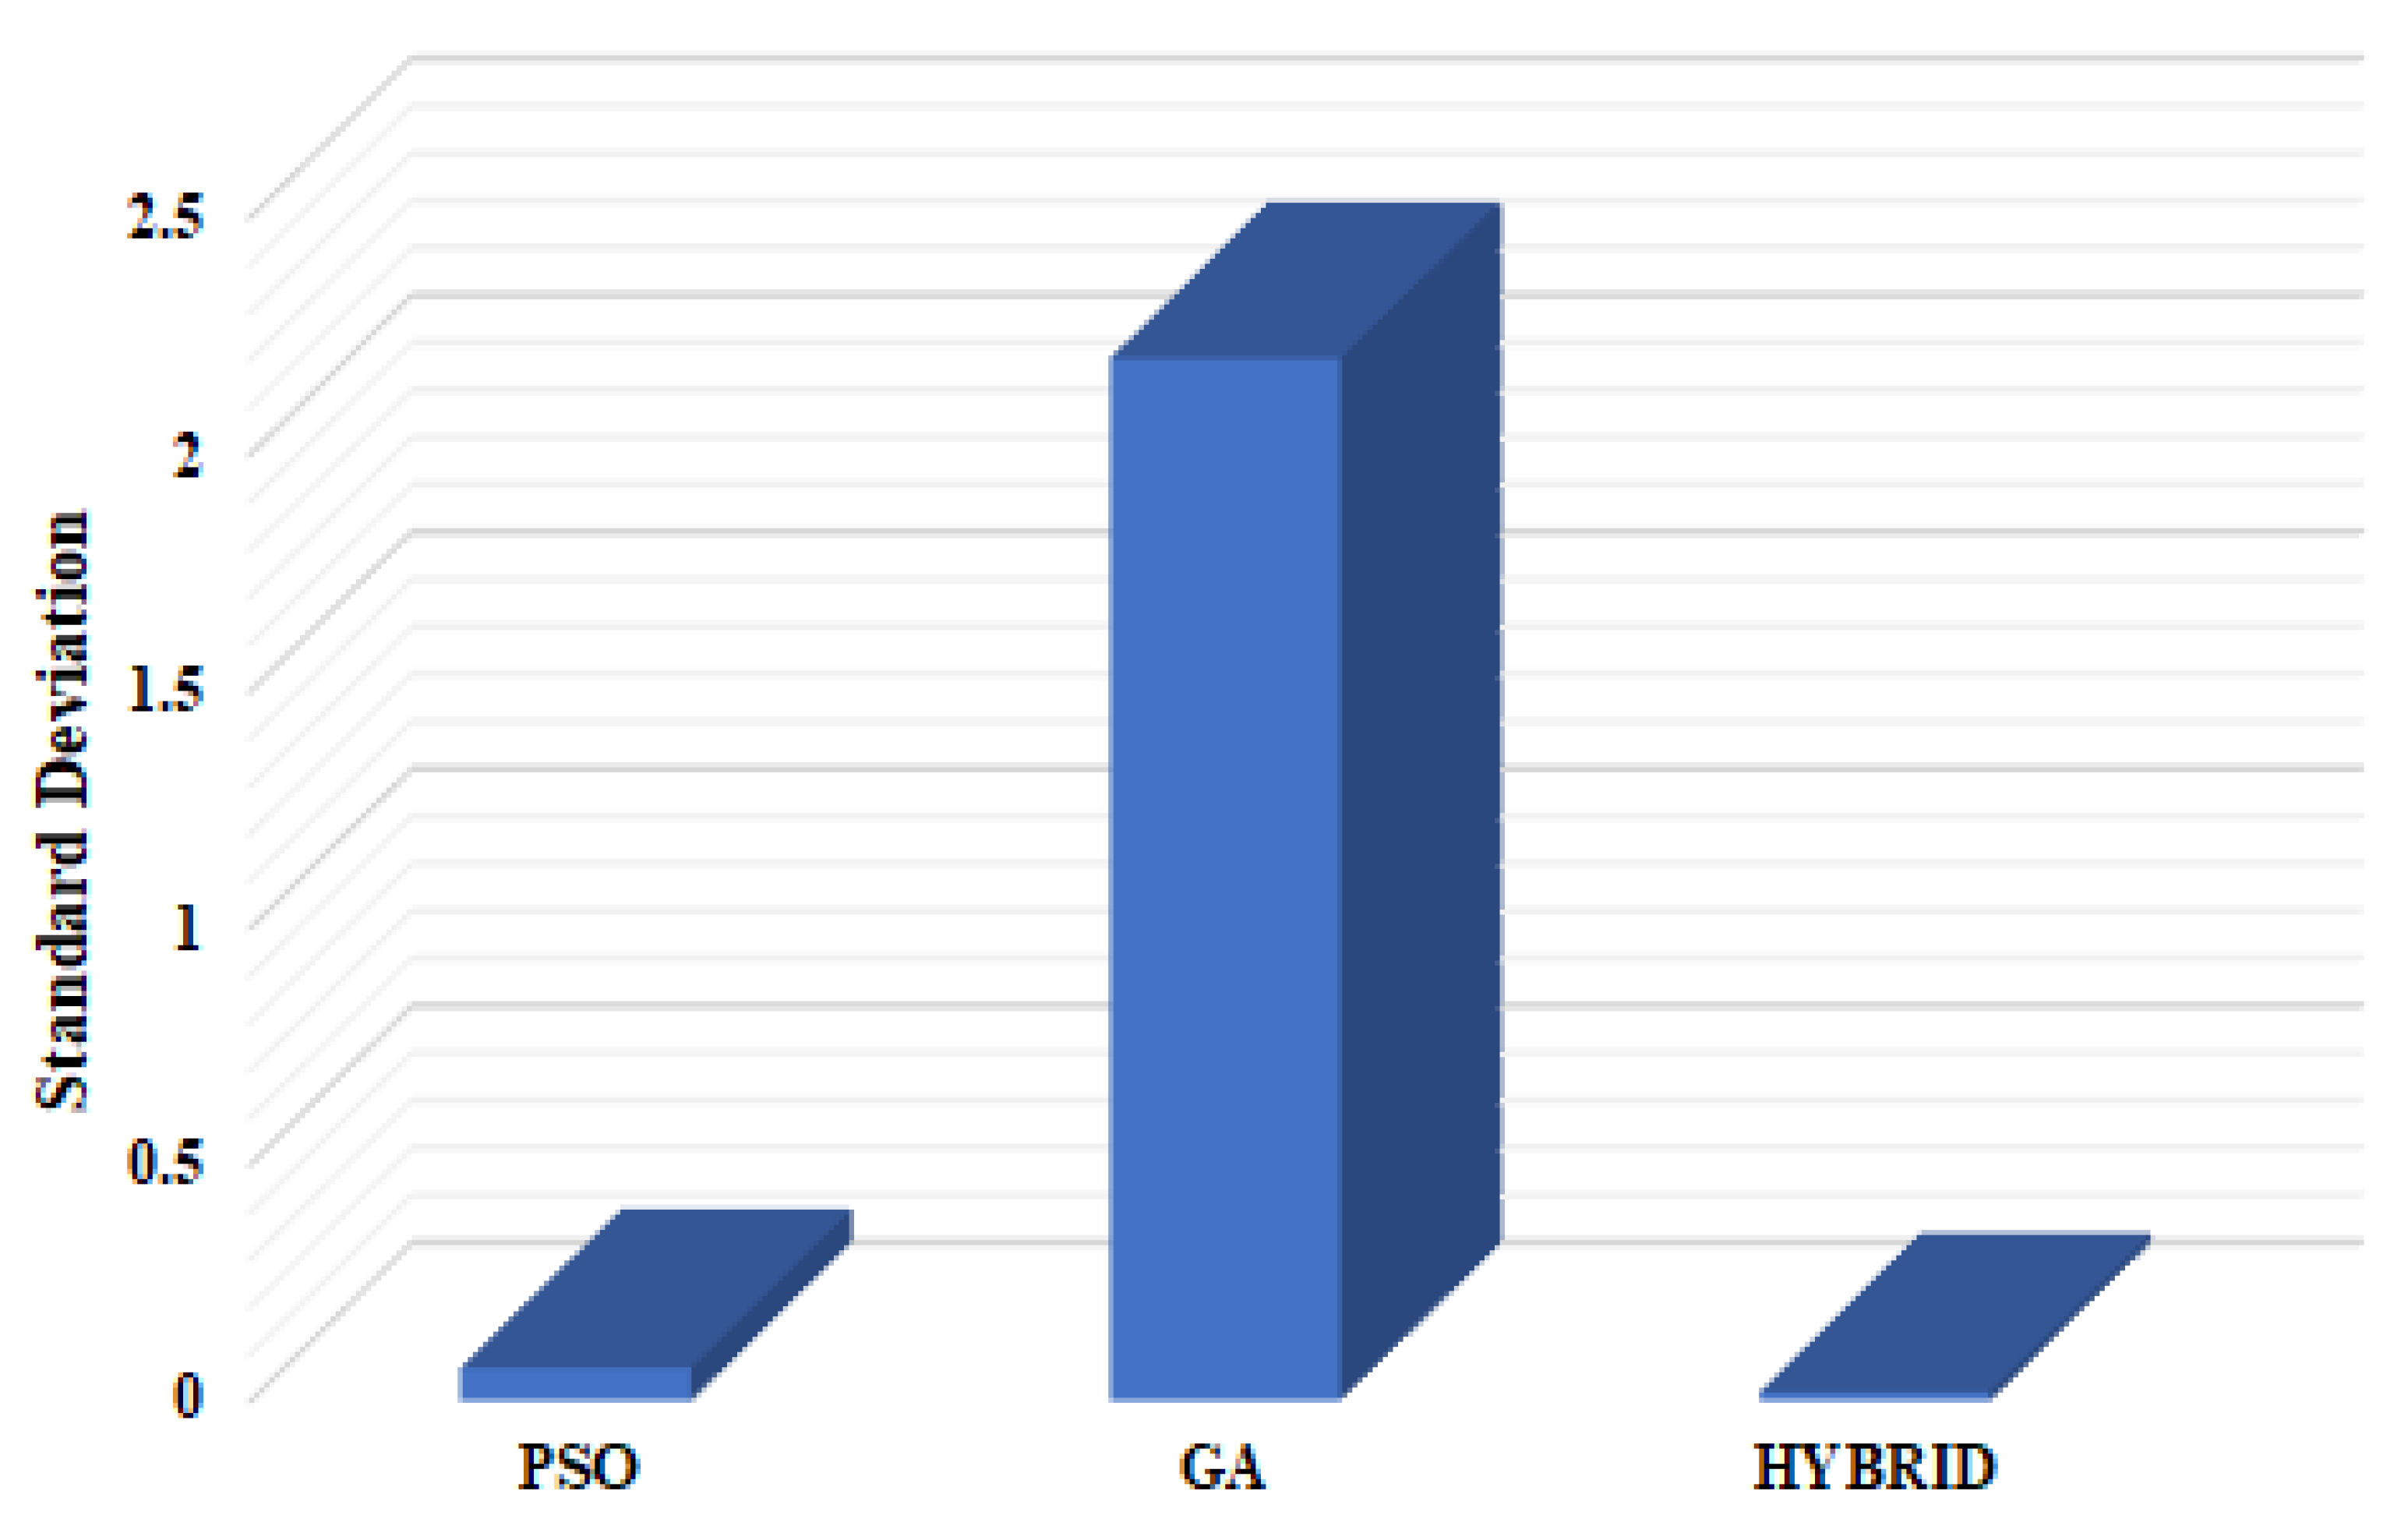

Table 1.
Reviewed Literature: Summary of Optimized allocation of Distributed Generation in power system network.
Table 1.
Reviewed Literature: Summary of Optimized allocation of Distributed Generation in power system network.
| Year [Ref] | Planning Objectives | Problem Formulation | PlanningVariables | Methods | DG Quantity | |||
|---|---|---|---|---|---|---|---|---|
| Minimize Power Losses | Enhance Voltage Stability | Improve Voltage Profile | Site | Size | ||||
| 2017 [19] | ✓ | ✓ | MOF | ✓ | PLI-GA | Multiple | ||
| 2017 [20] | ✓ | MOF | ✓ | HGWO | Multiple | |||
| 2018 [21] | ✓ | MOF | ✓ | BA | Multiple | |||
| 2021 [22] | ✓ | ✓ | MOF | ✓ | MRFO | Multiple | ||
| 2023 [23] | ✓ | ✓ | MOF | ✓ | MDA | Multiple | ||
| 2023 [24] | ✓ | ✓ | MOF | ✓ | MOALO | Multiple | ||
| Proposed Work | MOF | GA-PSO | Single | |||||
Table 2.
Total Power losses of the test system when no DG unit injected [31].
Table 2.
Total Power losses of the test system when no DG unit injected [31].
| S. No | Branch ID | Power Losses | |
|---|---|---|---|
| KW | KVAr | ||
| 1. | 1_2 | 4297.90 | 7272.80 |
| 2. | 1_5 | 2763.20 | 6085.60 |
| 3. | 2_3 | 2323.30 | 5162.40 |
| 4. | 2_4 | 1676.80 | 1470.60 |
| 5. | 2_5 | 903.80 | -927.90 |
| 6. | 3_4 | 373.40 | -362.70 |
| 7. | 4_5 | 514.30 | 1622.30 |
| 8. | 4_7 | 1.70 | 1703.10 |
| 9. | 4_9 | 1.30 | 1304.90 |
| 10. | 5_6 | 4.40 | 4421.30 |
| 11. | 6_11 | 55.40 | 116.10 |
| 12. | 6_12 | 71.80 | 149.50 |
| 13. | 6_13 | 212.10 | 417.80 |
| 14. | 7_8 | 0.00 | 461.10 |
| 15. | 7_9 | 0.00 | 801.90 |
| 16. | 9_10 | 12.90 | 34.10 |
| 17. | 9_14 | 116.10 | 246.90 |
| 18. | 10_11 | 12.60 | 29.50 |
| 19. | 12_13 | 6.30 | 5.70 |
| 20. | 13_14 | 54.10 | 110.20 |
| Total Losses | 13402.50 | 30125.3 | |
Table 3.
Optimum output obtained by implementing PSO algorithm.
| Optimum Site | Optimum Size | Time Taken in Seconds |
|---|---|---|
| Busbar 10 | 12 MW | 413.02 |
Table 4.
% Power losses reduction by using Particle Swarm Optimization.
| Test | Optimum | Optimum Size | Power Losses | % Loss Reduction | |||
|---|---|---|---|---|---|---|---|
| System | Location | MW | MVAR | kW | kVAR | kW | kVAR |
| 14 Busbar | Without DG [31] | – | – | 13401.5 | 30125.3 | 59.08% | 89.90% |
| Bus 10 | 12 | 2.131 | 5482.9 | 3042.2 | |||
Table 5.
Optimum output obtained by implementing Genetic Algorithm.
| Optimum Site | Optimum Size | Time Taken in Seconds |
|---|---|---|
| Busbar 9 | 11.85 MW | 726.82 |
Table 6.
% Power losses reduction by using Genetic Algorithm.
| Test | Optimum | Optimum Size | Power Losses | % Loss Reduction | |||
|---|---|---|---|---|---|---|---|
| System | Location | MW | MVAR | kW | kVAR | kW | kVAR |
| 14 Busbar | Without DG [31] | – | – | 13401.5 | 30125.3 | 58.03% | 89.32% |
| Bus 9 | 11.85 | 2.82 | 5624.3 | 3216.5 | |||
Table 7.
Optimum output obtained by implementing Hybrid Algorithm.
| Optimum Site | Optimum Size | Time Taken in Seconds |
|---|---|---|
| Busbar 14 | 10 MW | 484.12 |
Table 8.
% Power losses reduction by using Hybrid Algorithm.
| Test | Optimum | Optimum Size | Power Losses | % Loss Reduction | |||
|---|---|---|---|---|---|---|---|
| System | Location | MW | MVAR | kW | kVAR | kW | kVAR |
| 14 Busbar | Without DG [31] | – | – | 13401.5 | 30125.3 | 62.27% | 95.66% |
| Bus 14 | 14 | 2.012 | 5056.2 | 1304.7 | |||
Table 9.
Voltage Profile comparison analysis of IEEE 14 Busbar test system.
| Busbar Number | Without DG Unit | PSO | GA | Hybrid |
|---|---|---|---|---|
| Base Case [31] | (DG of 12 MVA | (DG of 11.85 MVA | (DG of 10 MVA | |
| at Busbar 10) | at Busbar 9) | at Busbar 14) | ||
| 1 | 1 | 1 | 1 | 1 |
| 2 | 0.946 | 0.989 | 0.989 | 0.99 |
| 3 | 0.857 | 0.92 | 0.921 | 0.99 |
| 4 | 0.883 | 0.958 | 0.958 | 0.957 |
| 5 | 0.885 | 0.96 | 0.964 | 0.988 |
| 6 | 0.933 | 1.02 | 1.03 | 1 |
| 7 | 0.919 | 1.01 | 1.01 | 1.01 |
| 8 | 0.919 | 1.01 | 1.01 | 1.01 |
| 9 | 0.902 | 1 | 0.998 | 1 |
| 10 | 0.899 | 0.996 | 0.996 | 1 |
| 11 | 0.912 | 1.01 | 1.01 | 1 |
| 12 | 0.914 | 1 | 1.01 | 1.01 |
| 13 | 0.908 | 1 | 1.01 | 1 |
| 14 | 0.883 | 0.981 | 1 | 0.981 |
Table 10.
Power Losses comparison analysis of IEEE 14 busbar test system.
| Cases Taken | Active Power Losses (KW) | Reactive Power Losses (KVAR) |
|---|---|---|
| Without DG [31] | 13401.5 | 30125.3 |
| PSO | 5482.9 | 3042.2 |
| GA | 5624.3 | 3216.5 |
| Novel Hybrid GA-PSO | 5056.2 | 1304.7 |
Table 11.
Comparison analysis of time taken by each algorithm.
| S. No | Algorithm | Time Taken in seconds |
|---|---|---|
| 1. | PSO | 314.766 |
| 2. | GA | 233.976 |
| 3. | Hybrid | 853.484 |
Disclaimer/Publisher’s Note: The statements, opinions and data contained in all publications are solely those of the individual author(s) and contributor(s) and not of MDPI and/or the editor(s). MDPI and/or the editor(s) disclaim responsibility for any injury to people or property resulting from any ideas, methods, instructions or products referred to in the content. |
© 2023 by the authors. Licensee MDPI, Basel, Switzerland. This article is an open access article distributed under the terms and conditions of the Creative Commons Attribution (CC BY) license (http://creativecommons.org/licenses/by/4.0/).
Copyright: This open access article is published under a Creative Commons CC BY 4.0 license, which permit the free download, distribution, and reuse, provided that the author and preprint are cited in any reuse.


