1. Introduction
The spectroscopy detection method served as the foundation for the invention of the Viral Particles Rapid Detection System Using Flashing Ratchet Potential (FRP) [
1,
2]. This system's initial design was investigated theoretically and put to the test experimentally. The resulting system is capable of identifying sub-micron impurity particles in human exhaled air, such as viral particles, and other biological agents. This information is conveyed by the accumulation of electron current, which creates an Electric Current-Spectrum (ECS) characterized by the contents of the exhaled air samples.
The design is based on a beam of free charges traveling across the FRP's electrodes. Low-energy free charges interact with the medium passing through the FRP's electrodes. The free charges are scattered (delayed) by the medium content. As a result of this interaction; the created ECS is characterized in terms of FRP's capacity to drift back the delayed free charges to their original starting positions. By comparing the ECS of two exhale air samples; one filtered down to micro-objects and the other down to nano-objects, this new technology can be utilized to detect the presence of viral and microorganisms’ particles in air samples. The time-escalating ECS difference indicates the existence of such particles. In addition to the assessment of the FRP optimal operating parameters, an experimental evaluation of the FRP's functionality was carried out and interpreted, validating the FRP's promising sensing capabilities, which were repeatedly statistically assessed to ensure the reproducibility of the results.
2. Flashing Ratchet Potential Design
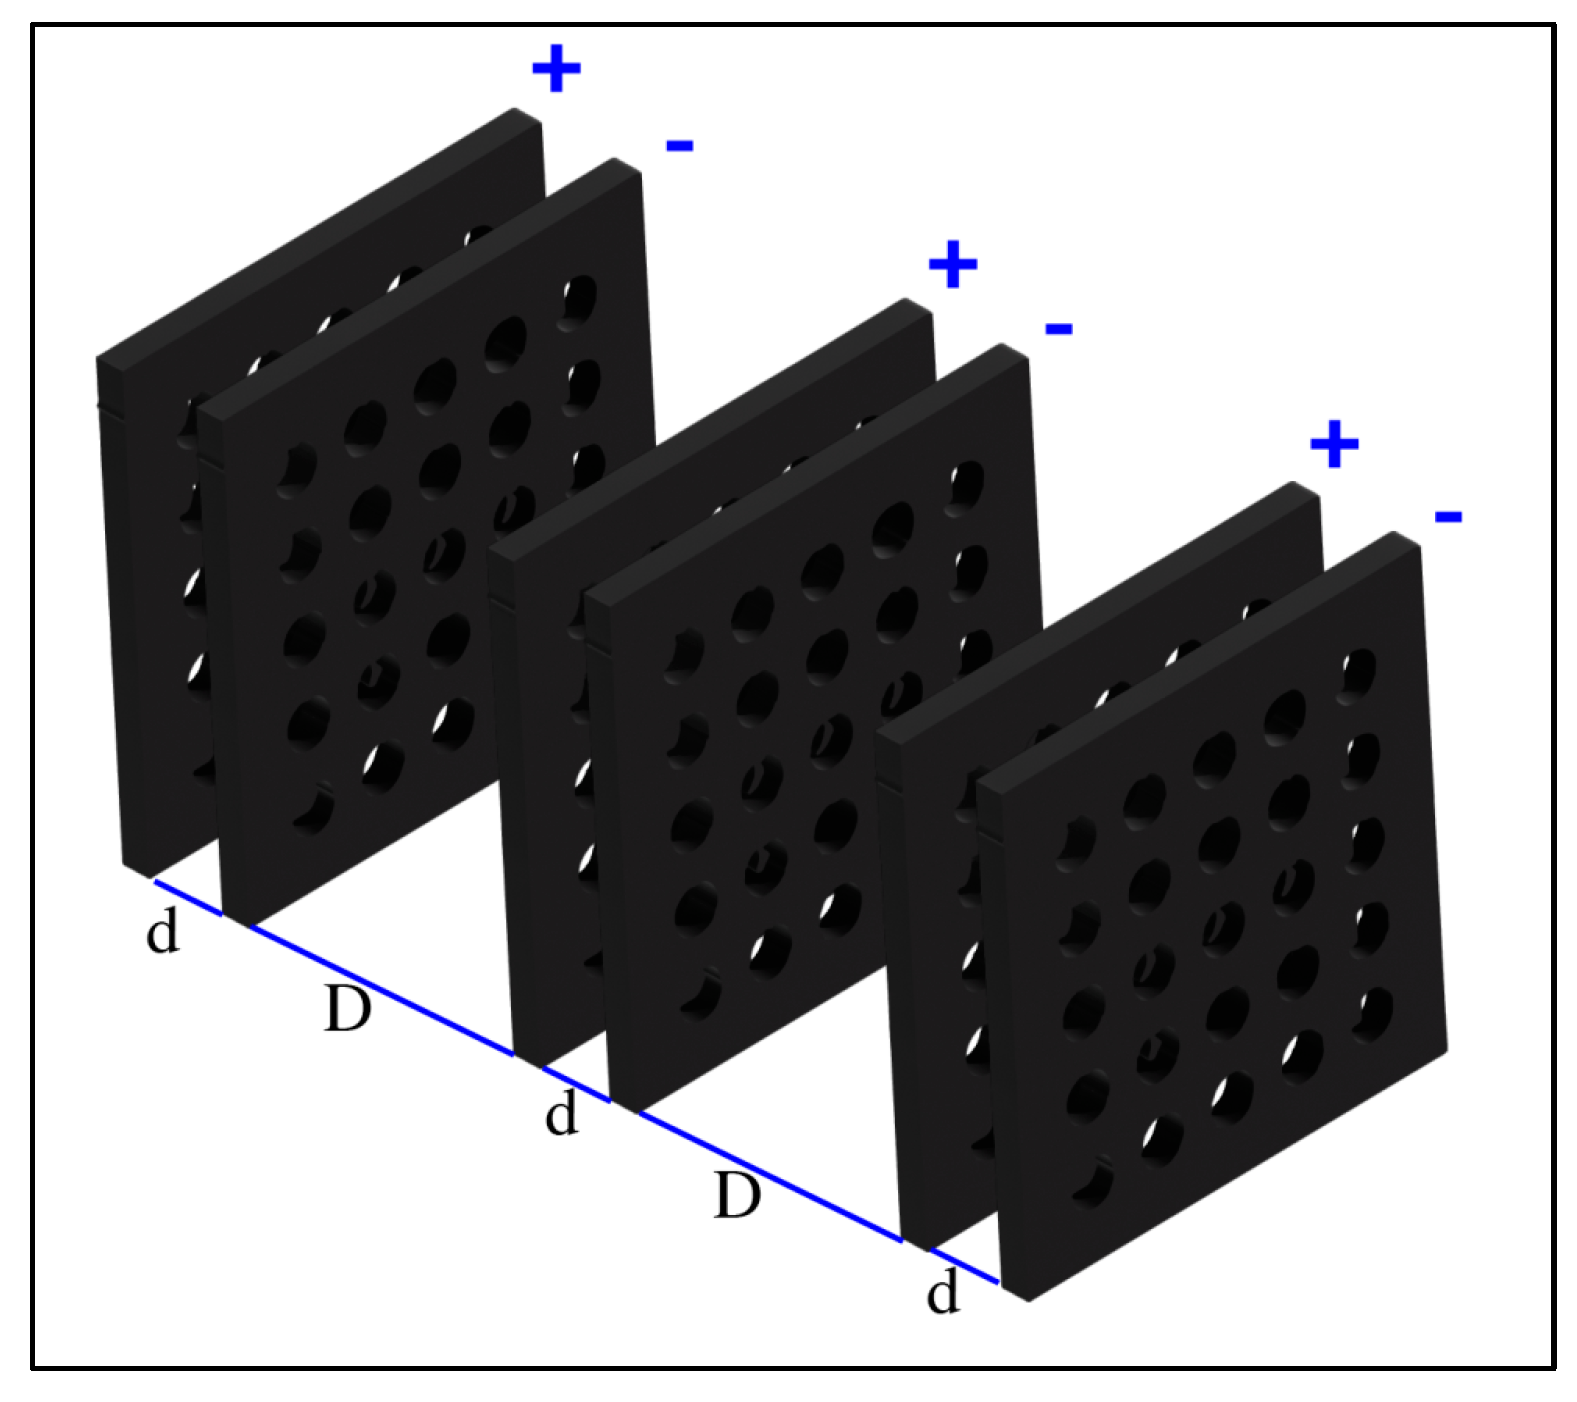
The FRP is an arrangement of positive and negative electrodes fixed in a linear arrangement as shown in
Figure 1. The FRP’s intrinsic core design characterized by Feynman Ratchets [
3] is proposed to extract energy from random Brownian motion of gas particles [
4,
5,
6] as a novel sustainable energy technology. The Ratchet Potential working principle is the directional transport of classical or quantum particles in systems that are dominated by random diffusion [
7]. This directional transport has been gaining much research interest in the utilization of ratchet in applications of sensing [
8], energy harvesting [
9,
10,
11] and separation [
12]. Ratchet Potential was also implemented in many microbiology studies including micro-machine as in the DNA transport and separation [
13], the translocation of proteins across membranes [
12] and bimolecular machine [
11], nanotechnology and nanofluid preconcentration and separation [
14], particles motion against constant bias [
15], Brownian Motors [
16,
17], in addition to infusion and flow control of nanoscale objects in fluids [
18].
The FRP electrodes can be a mesh (grid) of metal and insulated by a coating layer of dielectric material. The electrodes voltage and the spatial arrangement are described as follows [
19]:
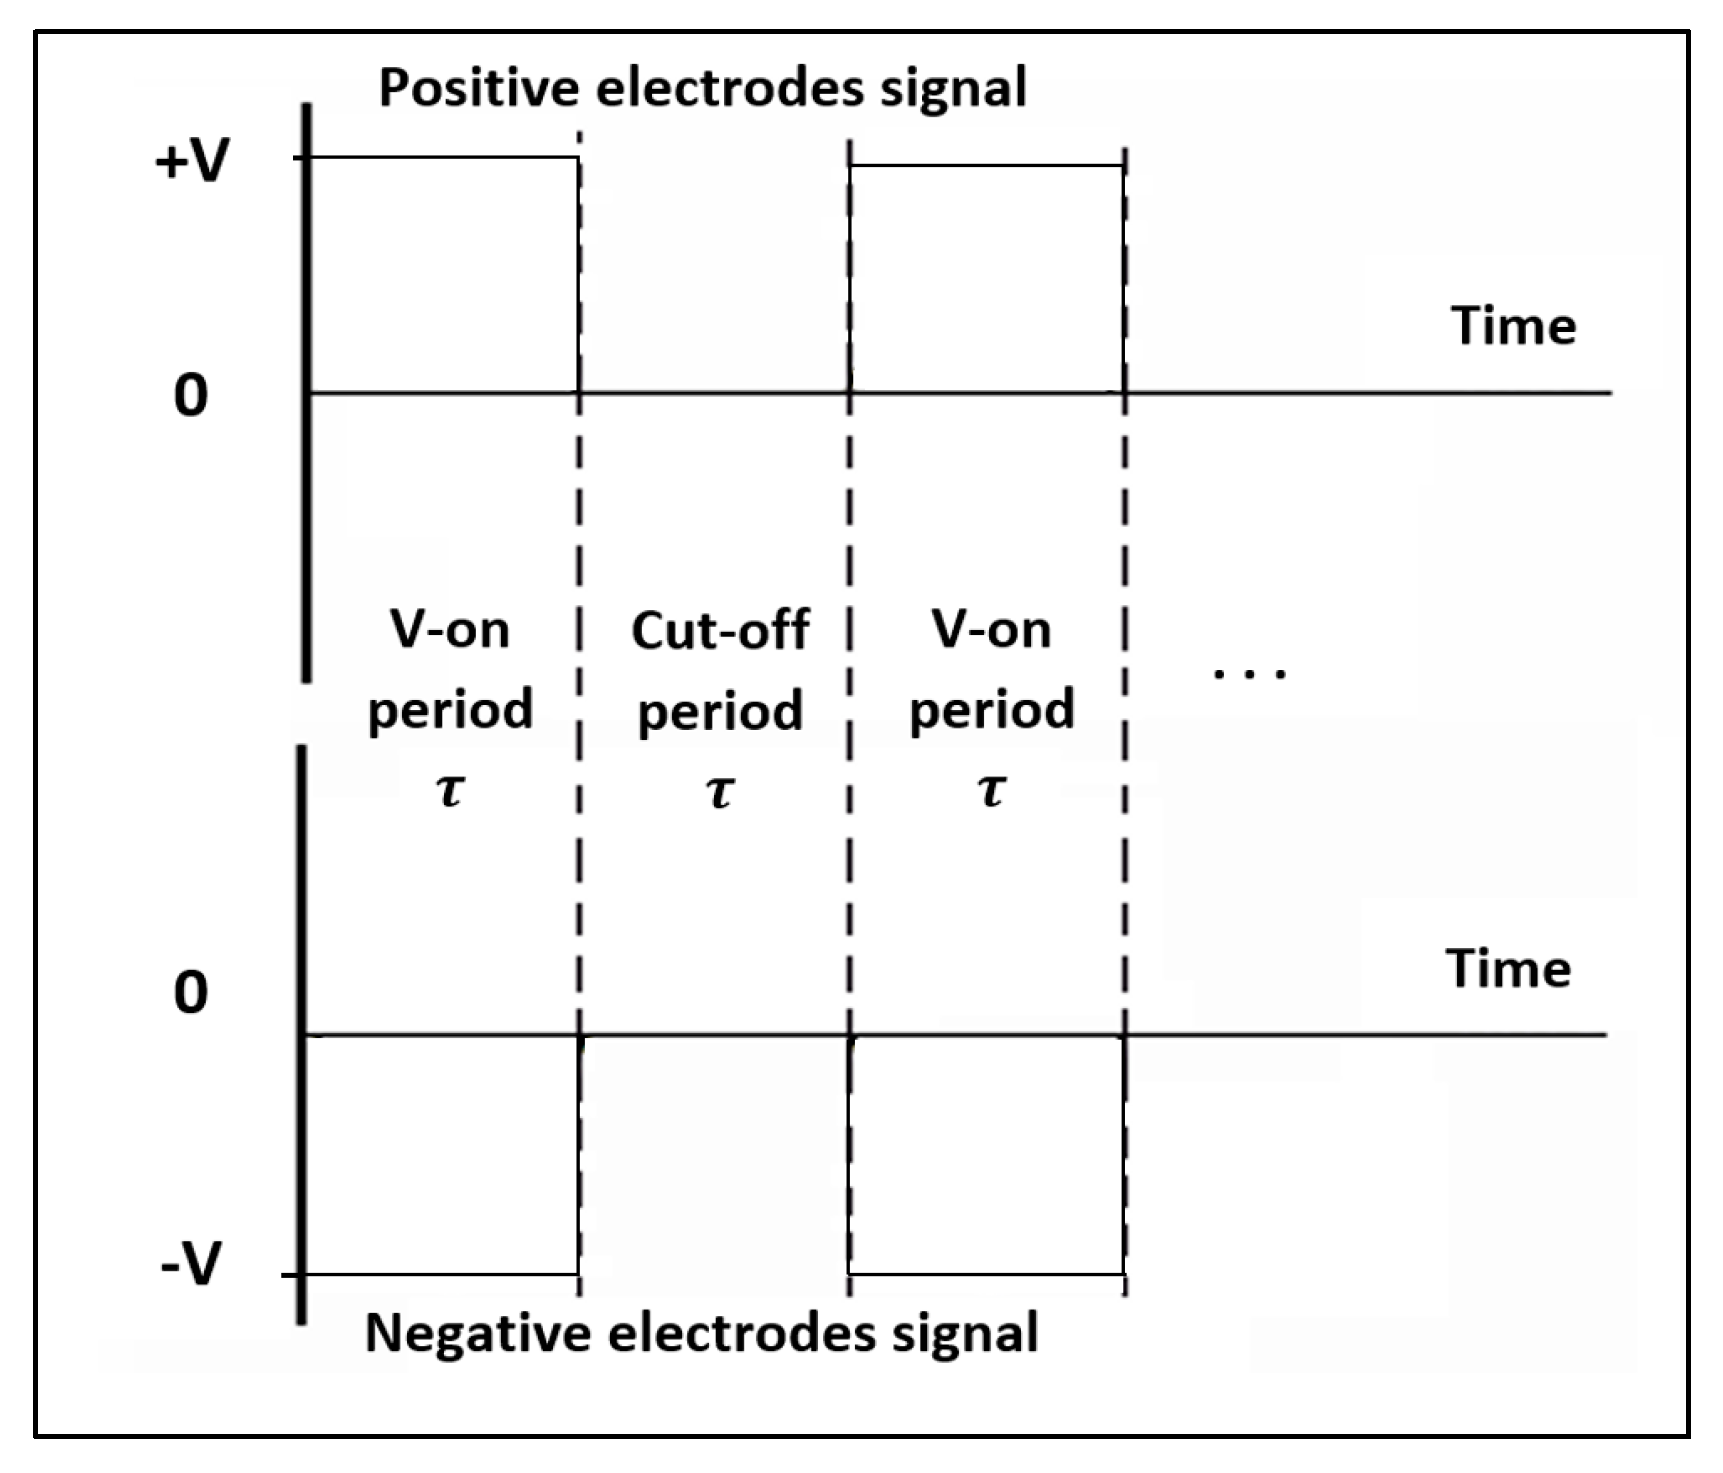
The voltage of the electrodes is arranged in a sequenced setup as “
”, simultaneously flashing in time period (
) between zero voltage and these values in square wave form as shown in
Figure 2.
Electrodes are laid in parallel, with spacing (
) between electrodes with opposite charge signs, and spacing (
) between electrodes with similar charge signs as shown in
Figure 1.
Free charges are transporting between FRP electrodes during the Voltage Cut-On period (τ). These charges can be produced by interaction between air particles (mainly
) and Thermionic Emission electrons [
20].
3. Free charged Particles Transportation Visualized Results
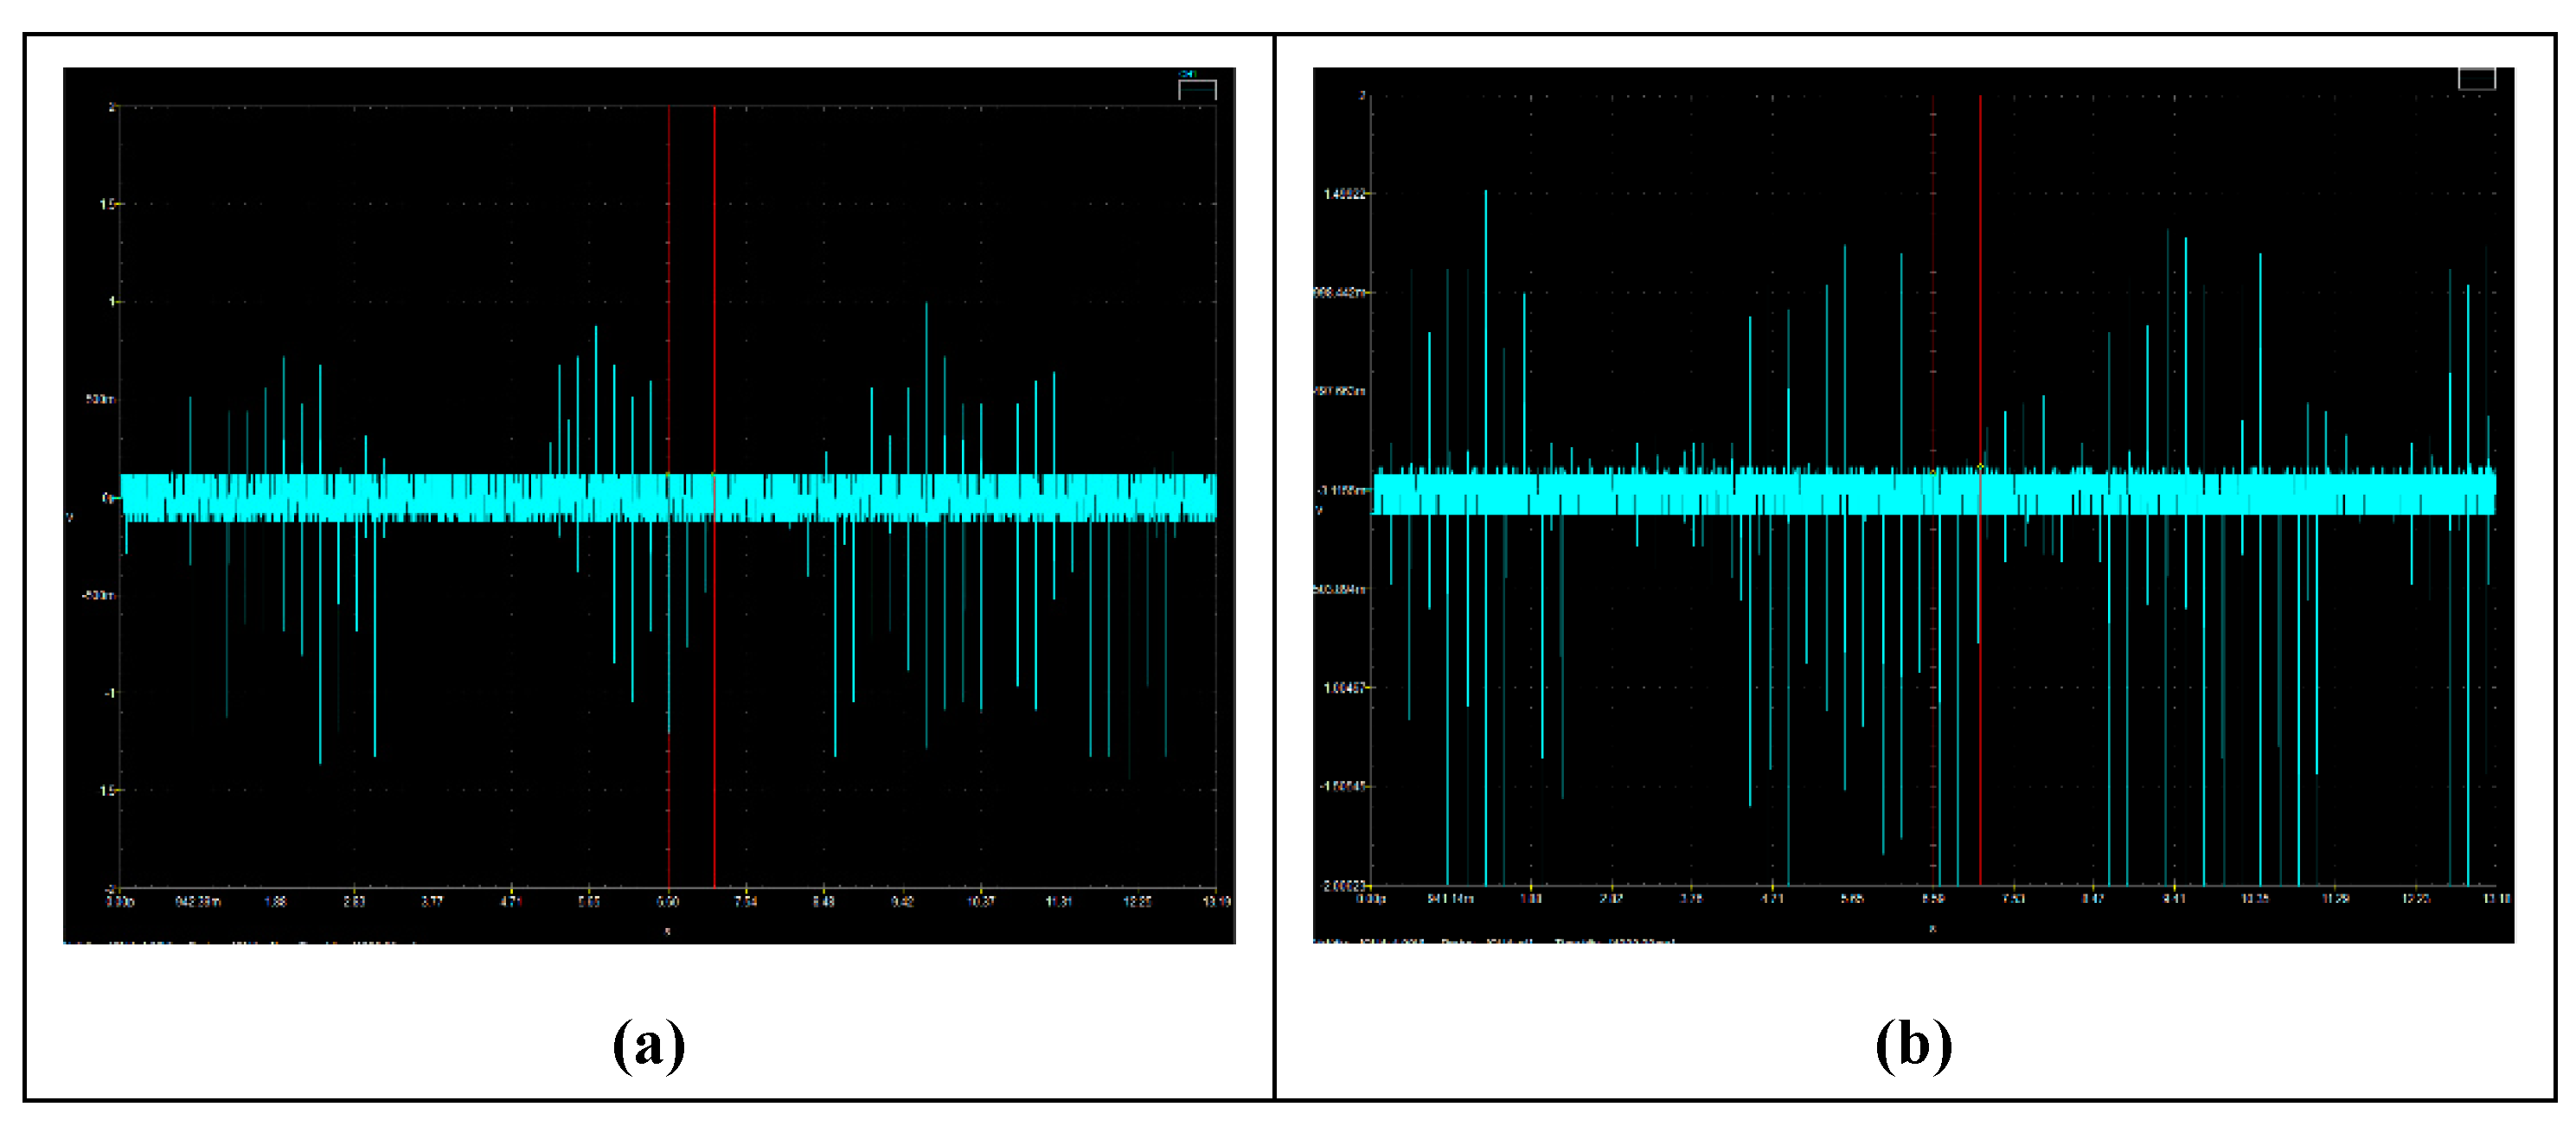
To offer visual confirmation of the transport of free negative particles via the FRP electrodes, a systematic investigation was carried out. The findings, which are depicted in
Figure 3, demonstrate evidence of such transit and the creation of free negative electric pulses across the FRP. The numerous downward instantaneous peaks in
Figure 3b indicate the arrival of free charges at the FRP back-end anode, where they are being released at a frequency of 10 Hz by a high voltage-alternating switch.
The higher downward fluctuation in the negative voltage created by the free negative particles is further supported by the statistics of the FRP back-end anode voltage signals, which show that the Root Mean Square (
) for the FRP back-end anode voltage signal without thermionic electrons is (
) and for that with thermionic electrons is (
). The
at the FRP's back-end anode will reflect the negative maxima pulses as:
Therefore, it is justified for V_RMS to be used as an indicator for the quantity of free negative particles moving through the FRP and arriving at the anode.
4. Investigation of Particles’ Transportation under Flashing Ratchet Potential
In the experimental apparatus, the thermionic free electrons emitted from the cathode was captured and mounted at the vicinity of the high voltage insulated electrode. The supplied high voltage is half rectified square wave first with frequency (
), in which the electron time elapsed in the vicinity of the high voltage electrode is sufficient for the majority of electrons to be captured by ambient air oxygen (
) particles, where at low electron energies, the dominant mechanism of (
) ion formation is three-body electron attachment to
. Then most of charge carriers (free charges) can be assumed as (
), producing (
) as free charged particles in accordance with electron attachment interaction [
21]:
Where electron attachment occurs very quickly, in a few tens of nanoseconds, given that
ion is one of the dominant negative ion species in low-temperature plasmas in oxygen, air and other oxygen containing mixtures [
21].
The average distance travelled (
) by
ions having average energy (
) in a travelling time (
) is given by:
Where (
) is the FRP voltage, (
) is
mass and (
) is the charge of electron. The travelling time (
) is governed by the FRP frequency (
) as:
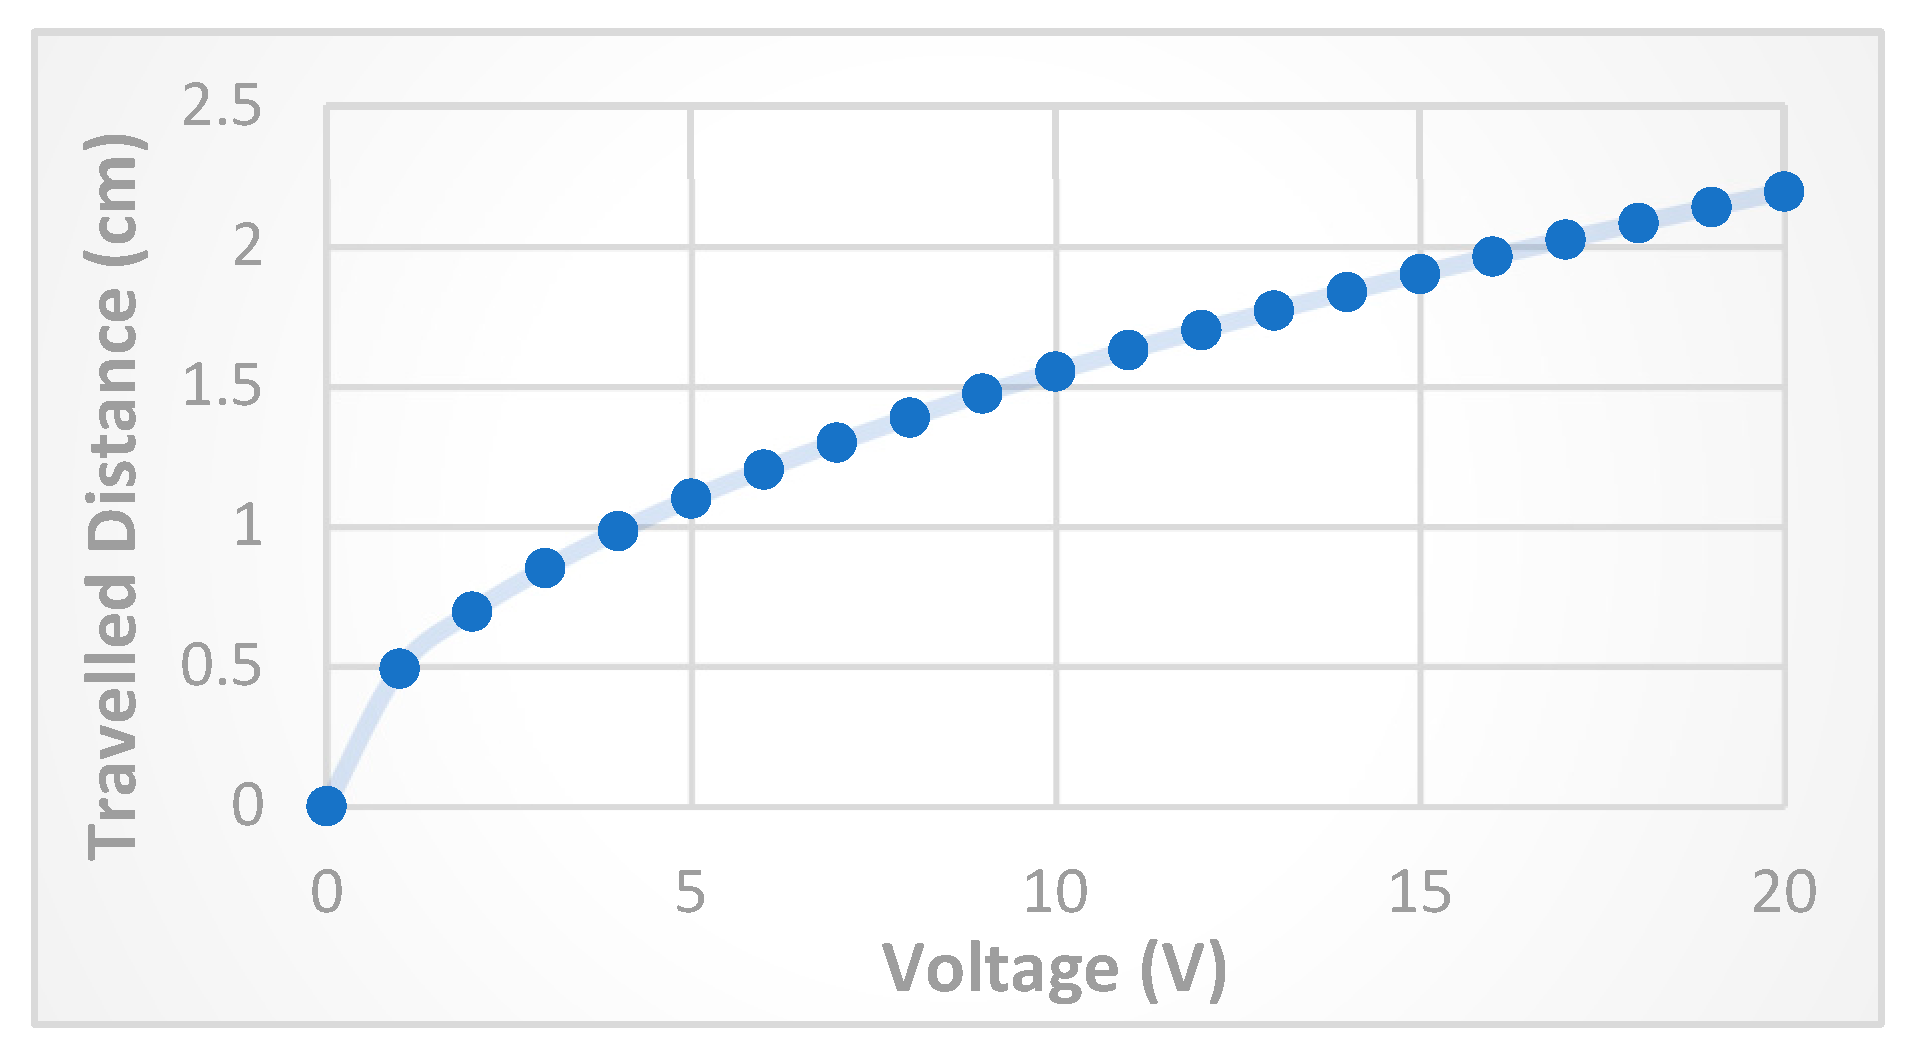
The relation between the average distance travelled and the FRP voltage at constant frequency (500 kHz) is shown in
Figure 4, but for the FRP, the successful transportation is governed by the sequence of distances travelled (
), i.e. (
), then, increasing the voltage will not increase the transported particles simply as given in equation (4). For instance, by fixing the FRP frequency at (500 kHz), and for the
particles to travel (
), the optimum FRP voltage to travel across the first negative electrode should be greater than (
), where increasing the voltage above this value will not increase the number of transported
particles as (
) reaching the back-end anode ultimately. In fact, the number of the transported particles will increase by increasing the average number of
particles acquiring energies greater than (
), taking into consideration that the energies of
particles will be distributed in accordance with the FRP geometrical and operation conditions. On the other hand, continuing to increase the FRP voltage to higher values will increase the number of
particles acquiring energies sufficient to travel a distance large enough to escape from the FRP system from its boundaries. Hence, increasing the FRP voltage above some optimum value will decrease the number of transported
particles reaching the back-end anode.
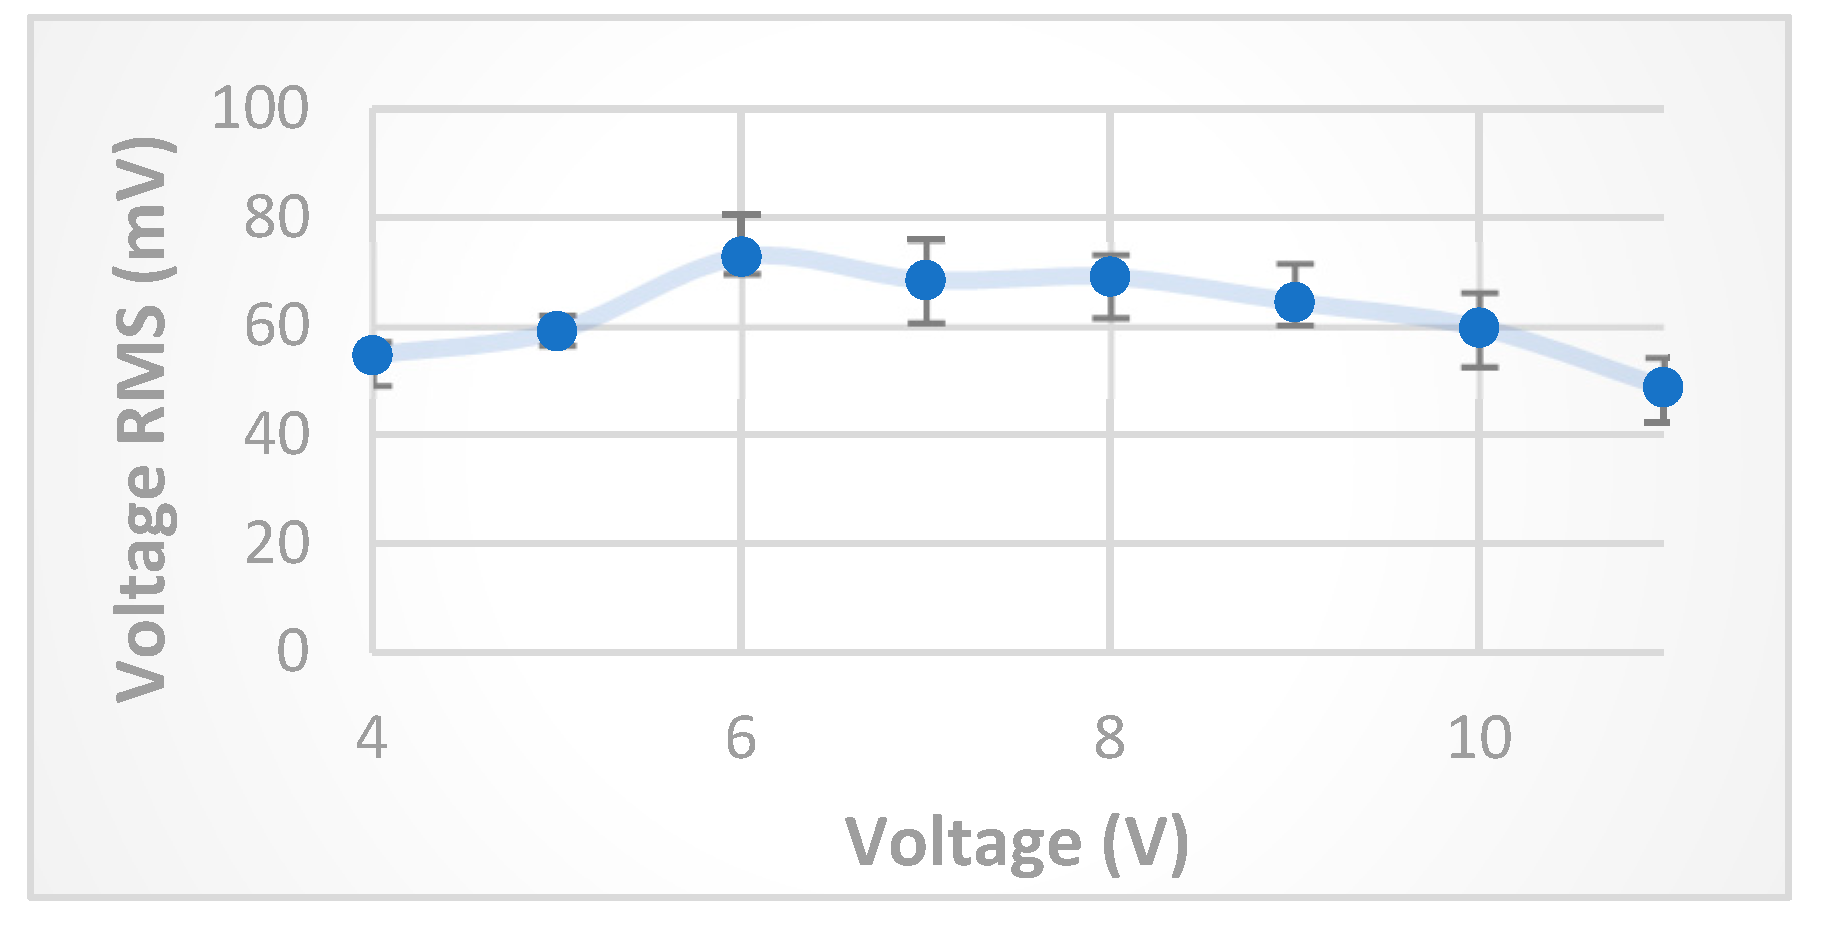
The experimental results shown in
Figure 5 confirm the theoretical calculations and the expected transportation behavior of
particles across the FRP, for voltages below and above the optimum FRP voltage explained earlier. The
was measured for FRP voltage values in the range
V at constant frequency (500 kHz).
The statistical analysis was confirmed experimentally by evaluating the standard deviation (
) for each value of FRP voltage in the range
, and the results are shown in
Figure 6. The statistical analysis also points out the FRP regulating the free particles’ transportation, where the standard deviation is smaller for FRP’s voltages (5 and 6) V, in which the average distance travelled by those free charges with energy in the range (5 ~ 6 eV) is in the range
in accordance to equation (4). Here, the majority of free charges starts moving with energies just sufficient to cross the first FRP negative electrode (
). While for the other values of FRP voltages, the higher value of standard deviation can be explained as:
- -
For low FRP voltage () V, the majority of free charges starts moving with energies insufficient to cross the first FRP negative electrode () in accordance with equation (4). Hence the free charges start to accumulate in the vicinity of positive electrodes, and after some period of time; the distance need to be travelled by some portion of these free charges becomes shorter than (). Accordingly, the becomes time-dependent, which in turn increases the standard deviation.
- -
For high FRP voltage () V, the majority of free charges starts moving with excess energy to cross the first FRP negative electrode (), hence a significant portion of free charges will cross the first FRP negative electrode, as well as some of the negatively charged particles near the boundaries will have sufficient energies to make random escapes, in which the magnitude of the transported free charges will be dependent on the produced thermionic electrons that is time-dependent (room conditions). This also makes the time-dependent, increasing the standard deviation.
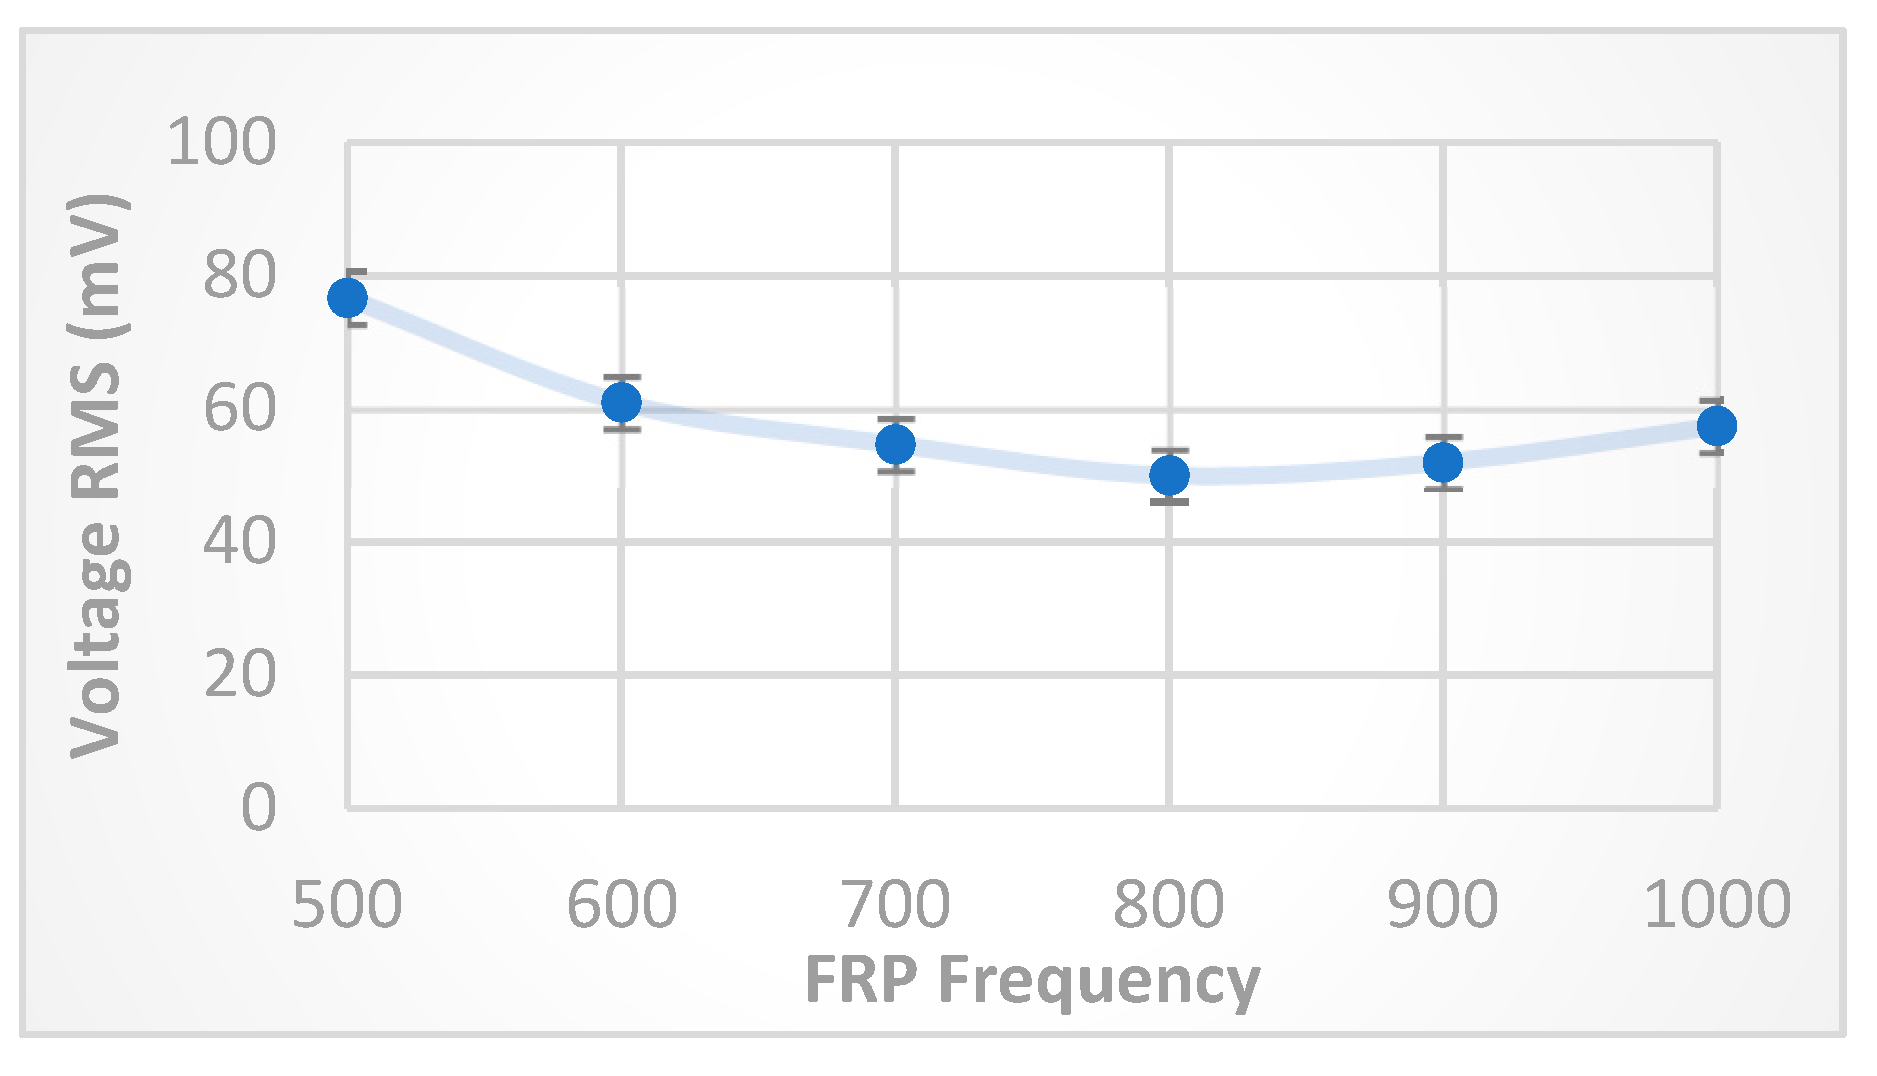
Another experiment was carried out to measure the
behavior at a constant 6 V FRP voltage against changing the FRP frequency in the range (500-1000) kHz. The experimental results shown in
Figure 7 also agree with the theoretical calculations and explanations, as the frequency required to have the free charges with energy 6 eV travelling the distance 1 cm is in the range ~600 kHz. Below this frequency value, i.e., 500 kHz, there will be more time for travelling then making transportation to the next electrode, while increasing the FRP frequency above (600) kHz will decrease the time of traveling, and then decrease the number of transporting free charges to next electrode despite of increasing negative particles’ energies by oscillations, this explains the decreasing trend of the curve for FRP frequency in the range (500-800) kHz, while for greater frequencies (>800) kHz, the negative particles oscillations (i.e. energies) become greater with increasing frequency, and after a while, it will start moving from farther starting points that makes the required traveling distance shorter than (1 cm), then increasing the number of transporting free charges (
).
5. Detection Methodology Examination:
The experiment showed that the anode
value (i.e., transportation of free negative particles) is sensitive to room conditions that changed on hourly basis, mainly due to the existence of free radicals in the room atmosphere. However, the response of anode
to changing FRP voltage and frequency represented in the curves of
Figure 5 and
Figure 7 remained unchanged after repeating the experiment several times, and only small changes in the scale were observed.
According to
Figure 5, the optimum FRP voltage is found to be about
V, and from
Figure 7, and for the purposes of detection of medium impurities, a critical value of FRP frequency need to be selected in order have a significant change of anode
once introducing impurities to the medium between FRP electrodes. Hence, a frequency of 600 kHz will be selected for the examination of detection functionality. The anode
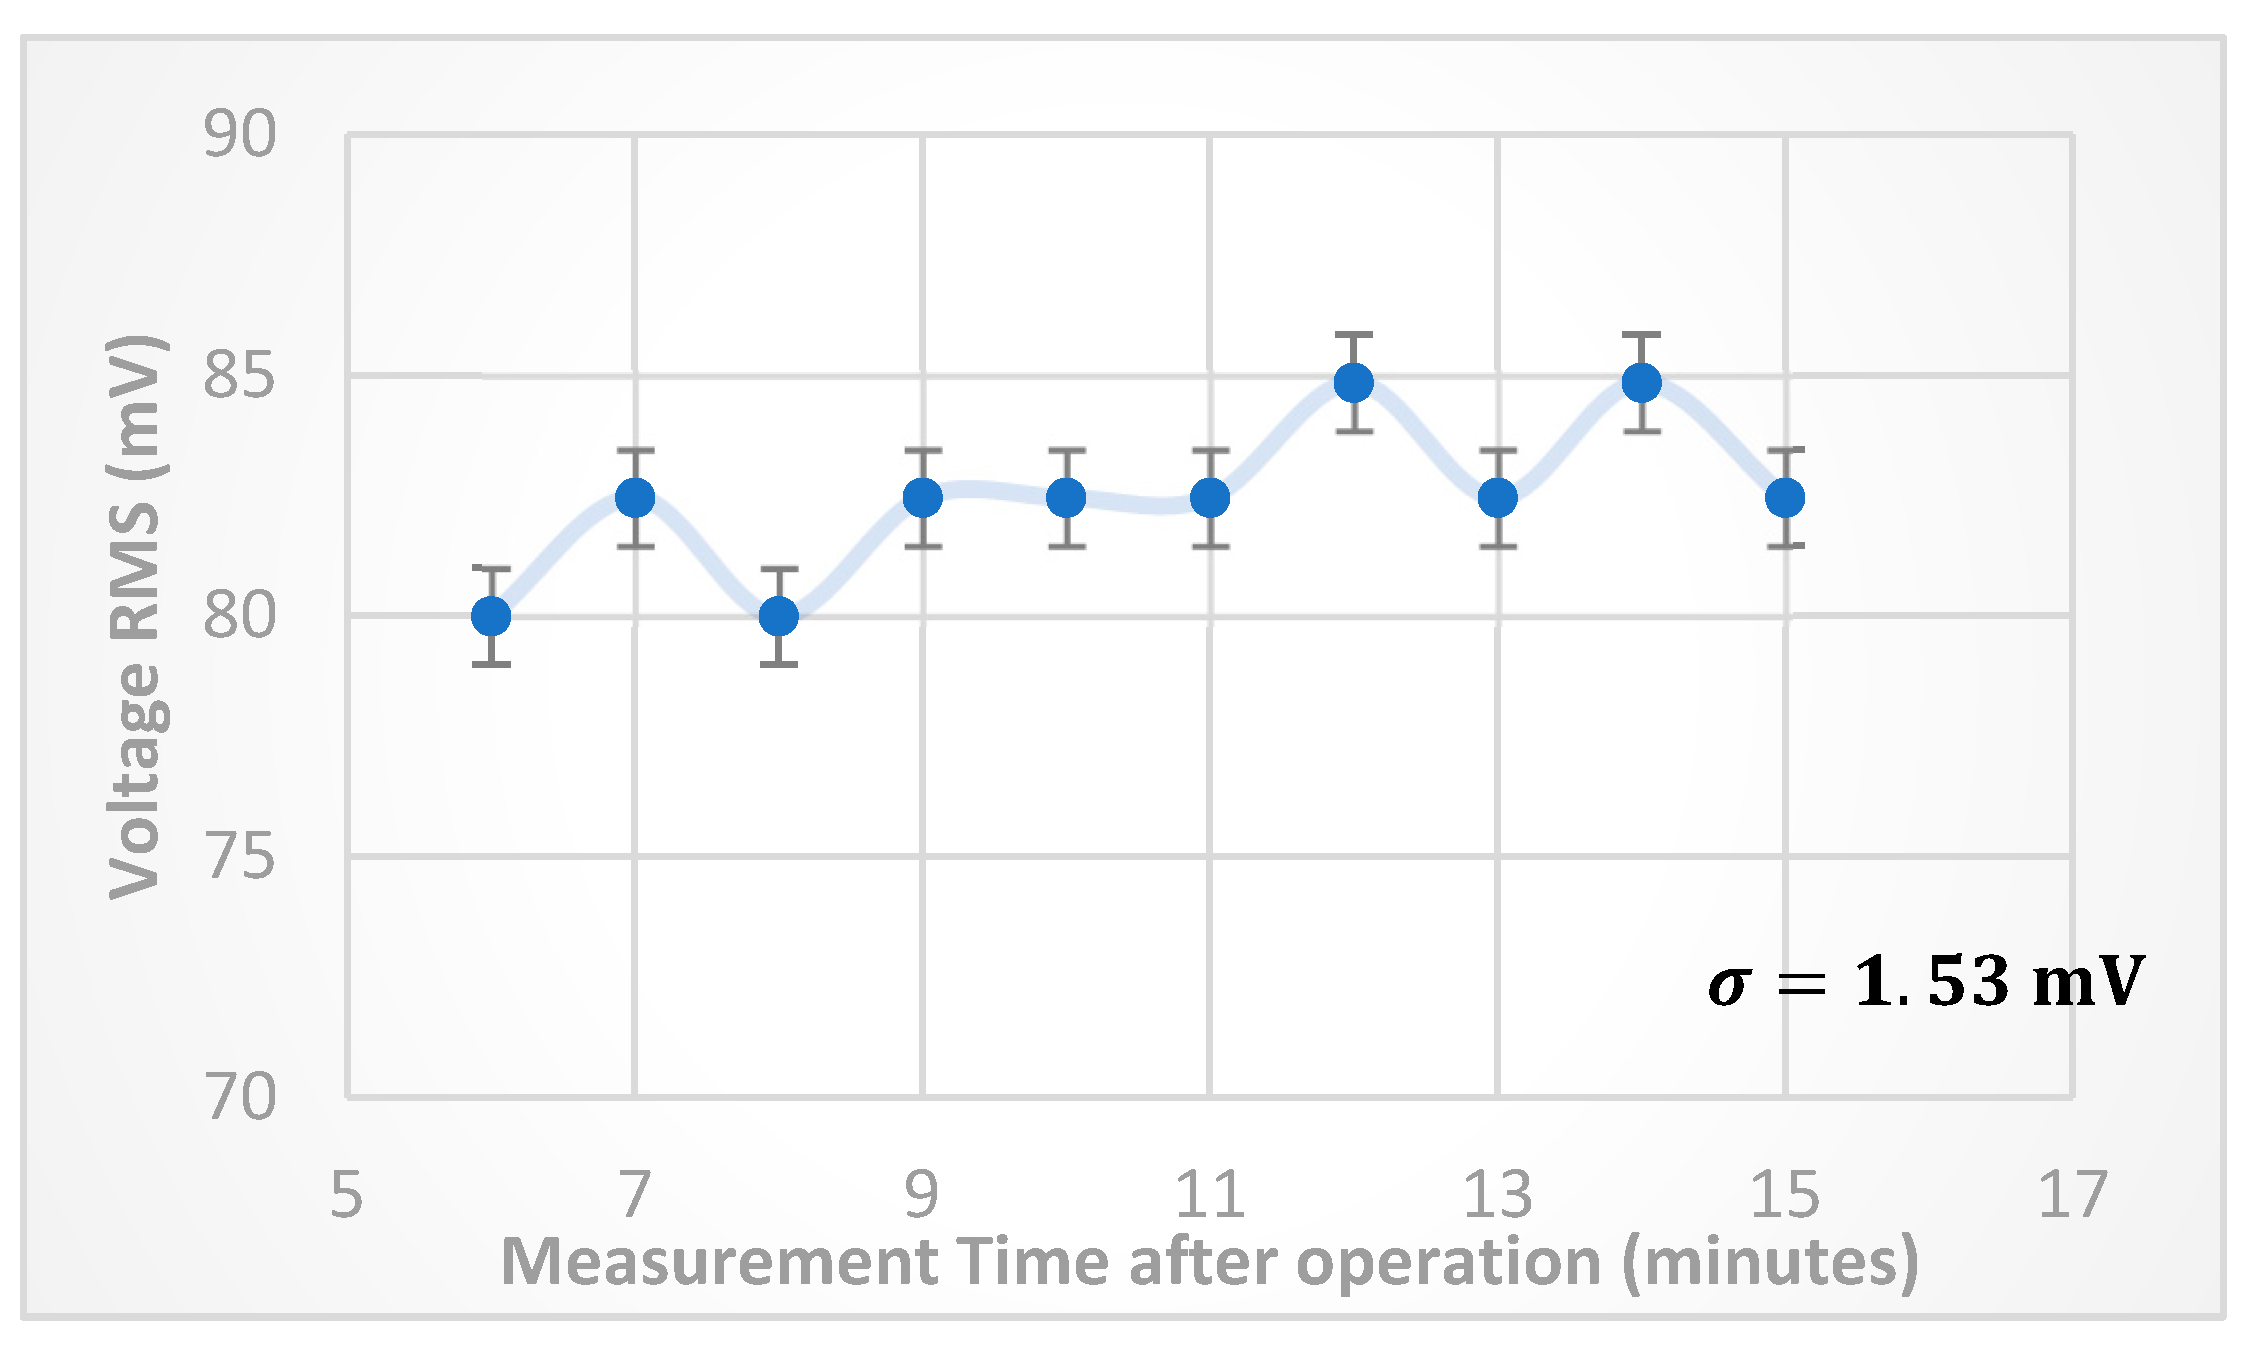
stability at (6 V, 600 kHz) FRP operation parameters was examined by taking 10readings of anode
values with time difference of 60 seconds, after 5 minutes of turning on the experimental setup. The result of this experiment is shown in
Figure 8, where the standard deviation was in the range 1.53 mV, i.e., about (2%) of the average value of anode
.
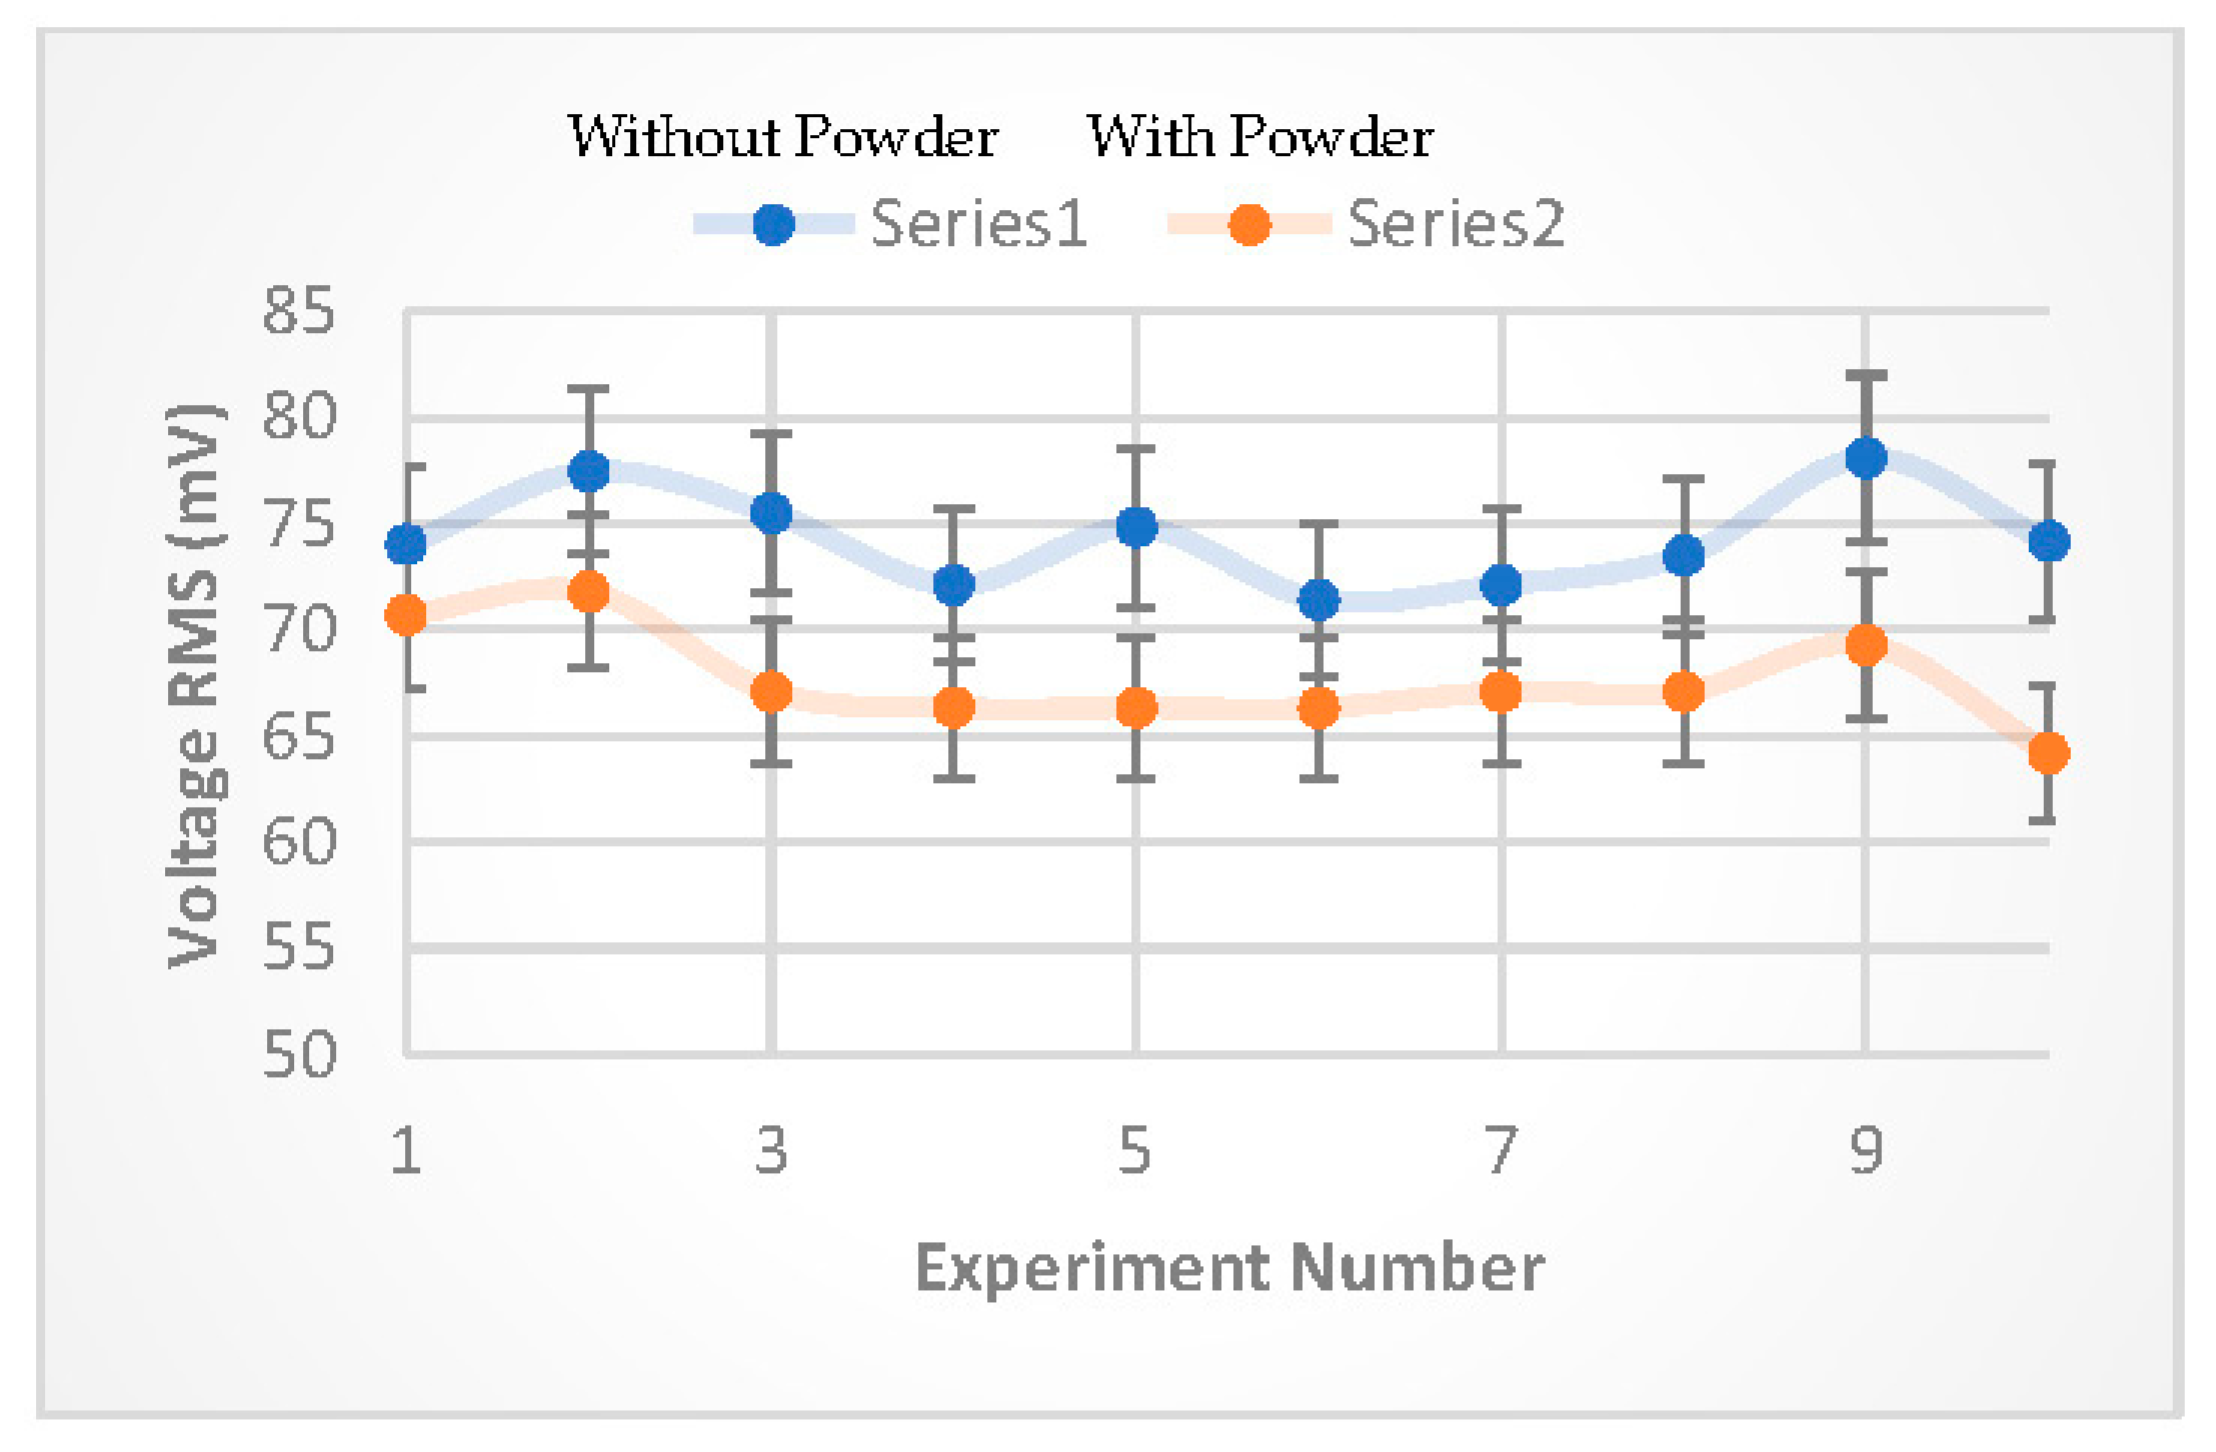
The final experiment examining the detection methodology was conducted using talcum powder (natural clay mineral composed mainly of magnesium, silicon, oxygen and hydrogen). The powder particles have an average grain size of 26.57 μm [
22]. In this experiment, an approximately similar amounts of ~0.1 g of talcum powder was gradually dropped (in ~ 2 seconds intervals) over the FRP electrodes 10 times at (7, 9, 11, …25) minutes after operating the apparatus. The
was measured instantly, and
was measured for comparison purposes (10) times at (6, 8, 10, … 24) minutes also after operating the apparatus. The experimental results shown in
Figure 9 confirmed the detection methodology, where the percentage difference in the measured
for experiment with, and without talcum powder, was found to be in the range (4.5 - 13.4 %).
For smaller particles (size 26.57 μm) such as viral particles (~0.1 μm), the percentage difference will be much less than the measured value, this difference can be amplified (using an electronic amplification module) and accumulated with time to boost any differences (if existed) between the two samples, in which both random and systematic errors decrease with measurement time, as well as the possibility to decrease the Dead-Time intervals by using more advanced electronic measurement module.
6. Sample Preparation and Insertion
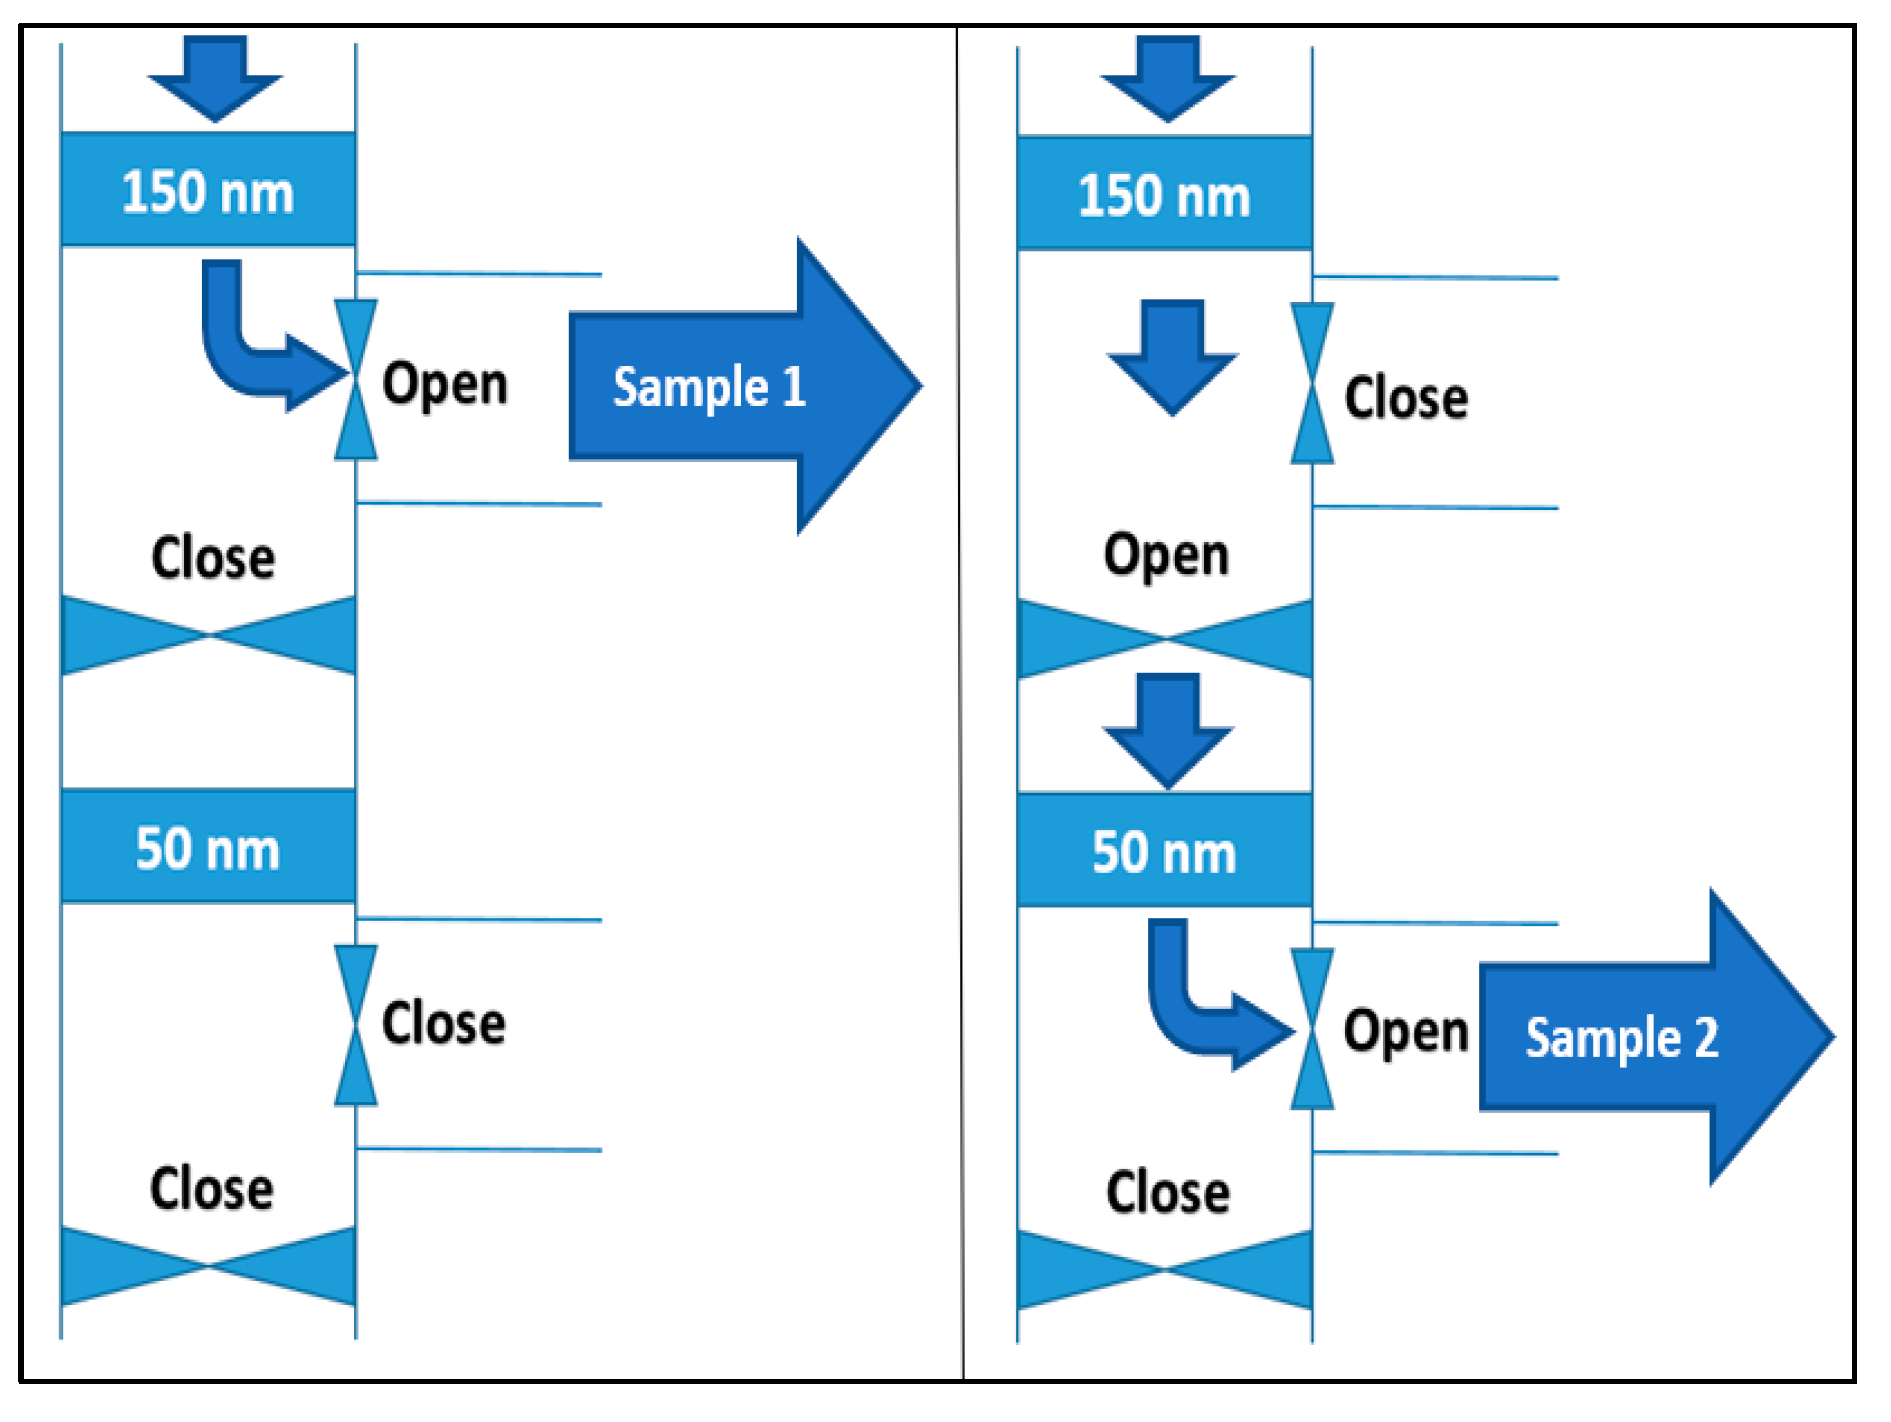
The detection system recognizes the existence of specific sized particles, which can be done by comparing two produced ECS’s of the same sample, the first taken from the sample in the region between the two filters (
and
) as shown in
Figure 10, where potential impurities of viral particles size (
) might exist. The second sample taken from the region after the filter (
) where the probability of viral particles existence is small. Measuring the two samples (with the same operation parameters) will give two ECS’s, and subtraction of the ECS of the first sample from ECS of the second sample will yield one of the following cases:
The ECS subtraction will yield a line fluctuating around zero over time, which means that the two samples are identical. Then there are no impurities with size in the range () existing in the sample (i.e., negative test result).
The ECS subtraction will yield a line that increases over time, which means that the two samples are not identical. Then there are some impurity particles with size in the range () existing in the sample (i.e., positive test result), and the slope of this ECS line reflects the density of such impurities in the samples (number of copies of viral particles).
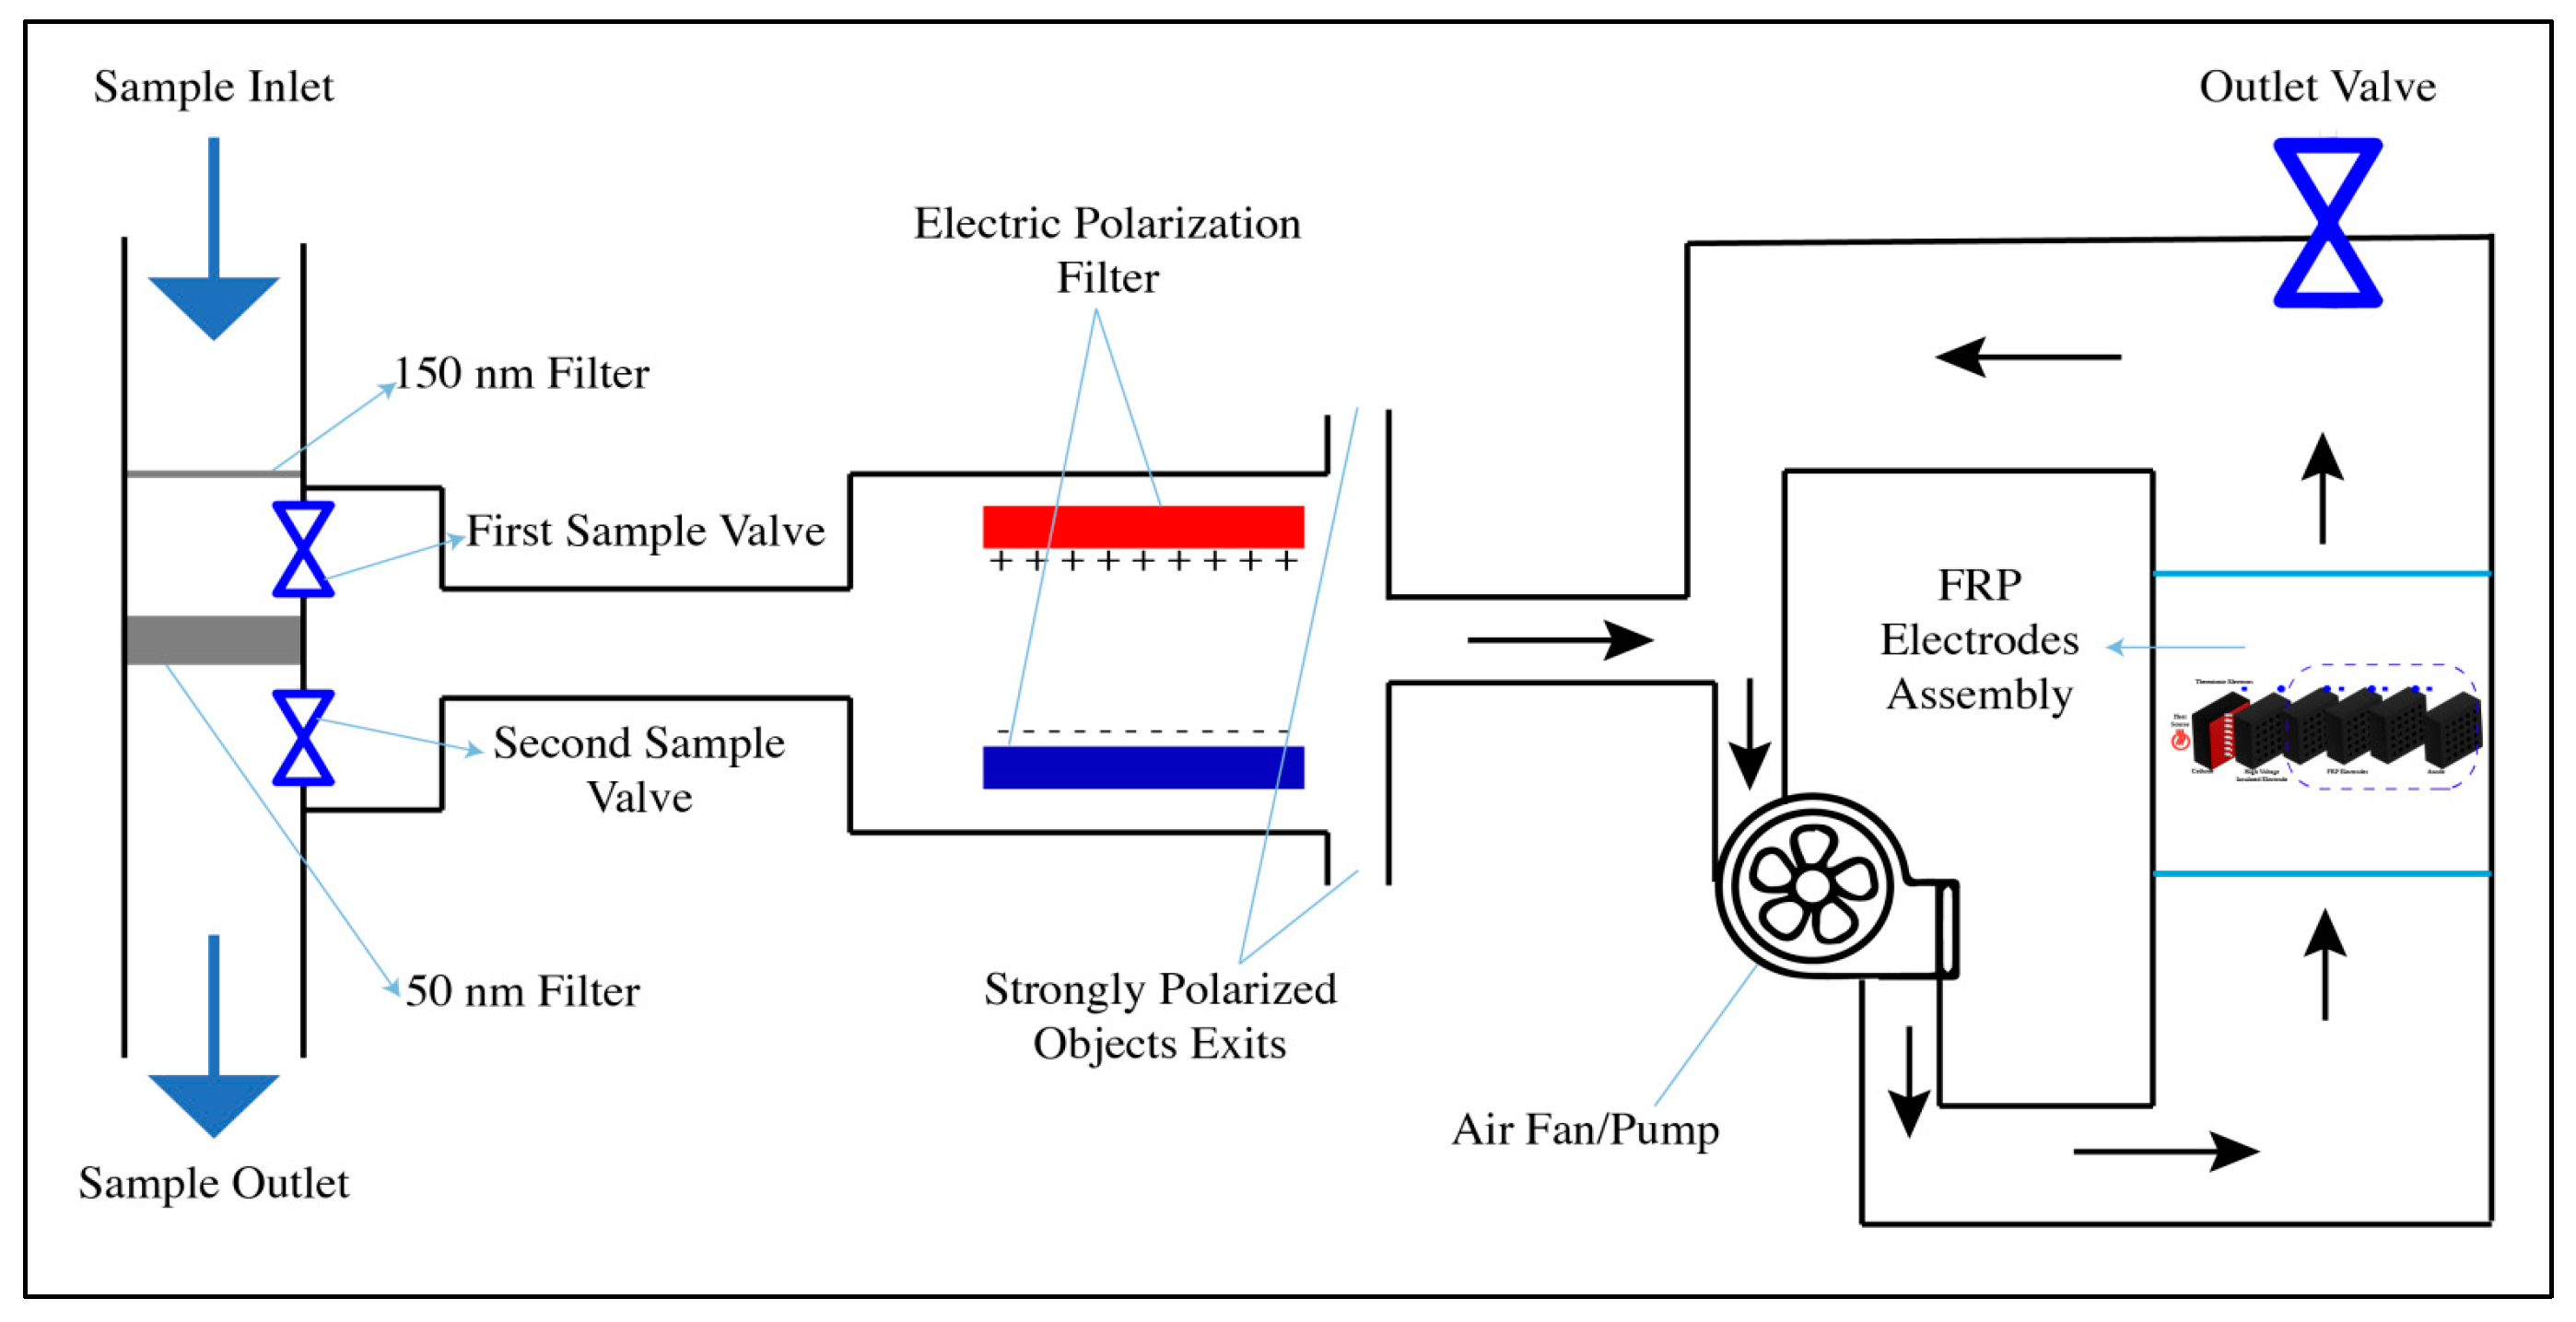
As seen in
Figure 10, the system valves regulate the insertion of the first and second samples. In order to reduce noise in the ECS signals, a sample polarization filter should also be implemented to prevent strongly polarized objects (such as water vapor) from accessing the FRP electrode assembly. Although small weakly polarized objects will have an electrical impact on both the first and second samples' ECS, this effect will be mitigated by subtraction ECSs and lengthening the measurement period.
As a result, this detection system can be utilized as a rapid “Gate” to the Polymerase Chain Reaction (PCR) test. It is worth mentioning that this new detection methodology has no potential false negative results, which necessitates no PCR test after having a “prompt” negative result in this new detection methodology.
There will be other methods to ensure a sufficient number of viral particles entering the detection system, one of these methods includes blender-to-liberate viral particles from aerosol liquid droplets before entering the first filtration system (150 nm filter), and to be derived directly toward the polarization filter without passing the 50 nm filter for the first sample. The second sample to be collected after passing the 50 nm filter, as depicted in the sample preparation mechanism in
Figure 11. Also, the exhaled air is preferred to be collected from enforced coughing that has relatively large amount of liquid from the upper respiratory system.
7. Discussions and Conclusions:
This new detection methodology was designed based on the controlled transportation of charged particles using Flashing Ratchet Potential (FRP) electrodes, and the interaction of the transporting charged particles with samples’ contents. In this research, the existing and controlled transportation of free negatively charged particles (mainly ) through FRP electrodes was ensured at different system operational parameters. In addition, the magnitude of this free current was measured for different samples of impurities crossing in parallel to the FRP electrodes in standardized experimental procedures and conditions, and the effect (shortages in the electric negative voltage pulses forming the current spectrum) of such impurities was measured by counting for voltage root mean square at the FRP back end anode. A proof of concept of this new detection methodology was conducted and showed promising results in detecting small impurities (median diameter of 26.57 μm) of talcum powder. As a conclusion, the detection theory and proof of concept was successfully examined, showing a detection capability (i.e., the sample’s impurity size and density) that can be improved by improving the manufacturing and operational conditions, as well as a detection accuracy that can be increased by increasing analysis duration.
The detection experiment used powder particles with a median diameter of 26.57 . The percentage difference in the measured was in the range (4.5 - 13.4 %), while the theoretical evaluation showed that for viruses; with a rational number of viral particle copies, as well as system geometry and parameters, the percentage difference in the measured can be in the range (0.2 - 0.5 %).
Author Contributions
Conceptualization, Mohammad Bqoor; methodology, Mohammad Bqoor; software, Yazan Al Zain and Lujain Ismail; validation, Yazan Al Zain and Lujain Ismail; formal analysis, Mohammad Bqoor; investigation, Maha Albqoor; resources, Maha Albqoor; data curation, Mohammad Bqoor and Lujain Ismail; writing—original draft preparation, Mohammad Bqoor; writing—review and editing, Yazan Al Zain and Lujain Ismail; visualization, Lujain Ismail; supervision, Mohammad Bqoor; project administration,Yazan Al Zain; All authors have read and agreed to the published version of the manuscript.
Funding
This research received no funding
Conflicts of Interest
The authors declare no conflict of interest.
References
- Liao, K.; Collins, S.; Brus, V.; Mikhnenko, O.; Hu, Y.; Phan, H.; Nguyen, T. Electron ratchets: State of the field and future challenges. ACS Appl. Mater. Interfaces 2019, 11, 1081–1087. [Google Scholar] [CrossRef]
- Lau, B.; Kedem, O.; Schwabacher, J.; Kwasnieski, D.; Weiss, E.A. An introduction to ratchets in chemistry and biology. Mater. Horizons 2017, 4, 310–318. [Google Scholar] [CrossRef]
- Reimann, P. Brownian motors: noisy transport far from equilibrium. Phys. Rep. 2002, 361, 57–265. [Google Scholar] [CrossRef]
- McDermott, D.; Olson Reichhardt, C.; Reichhardt, C. Collective ratchet effects and reversals for active matter particles on quasi-one-dimensional asymmetric substrates. Soft Matter 2016, 12, 8606–8615. [Google Scholar] [CrossRef] [PubMed]
- Roche, B.; Roulleau, P.; Jullien, T.; Jompol, Y.; Farrer, I.; Ritchie, D.; Glattli, D. Harvesting dissipated energy with a mesoscopic ratchet. Nat. Commun. 2015, 6, 6738–6738. [Google Scholar] [CrossRef]
- Wang, Z.; Jia, Z.; He, X. Net motion of a charged macromolecule in a ratchet-slit. Soft Matter 2013, 9, 11107–11112. [Google Scholar] [CrossRef]
- Lau, B.; Kedem, O.; Schwabacher, J.; Kwasnieski, D.; Weiss, E.A. An introduction to ratchets in chemistry and biology. Mater. Horizons 2017, 4, 310–318. [Google Scholar] [CrossRef]
- Lavella, G.; Morfino, R.; Maharbiz, M.M. A synthetic Brownian ratchet architecture for creating tailorable chemomechanical nanomachines. Appl. Phys. Lett. 2012, 101, 013703. [Google Scholar] [CrossRef]
- Pavlyukevich, I.; Li, Y.; Xu, Y.; Chechkin, A. Directed transport induced by spatially modulated Lévy flights. J. Phys. A: Math. Theor. 2015, 48, 495004. [Google Scholar] [CrossRef]
- Liao, K.; Collins, S.; Brus, V.; Mikhnenko, O.; Hu, Y.; Phan, H.; Nguyen, T. Electron ratchets: State of the field and future challenges. ACS Appl. Mater. Interfaces 2019, 11, 1081–1087. [Google Scholar] [CrossRef]
- Bader, J.; Hammond, R.; Henck, S.; Deem, M.; McDermott, G.; Bustillo, J.; Simpson, J.; Mulhern, G.; Rothberg, J. DNA transport by a micromachined Brownian ratchet device. Proc. Natl. Acad. Sci. USA 1999, 96, 13165–13169. [Google Scholar] [CrossRef] [PubMed]
- Depperschmidt, A.; Ketterer, N.; Pfaffelhuber, P. A Brownian ratchet for protein translocation including dissociation of ratcheting sites. J. Math. Biol. 2012, 66, 505–534. [Google Scholar] [CrossRef] [PubMed]
- Zarrin, A.; Sivak, D.A.; Brown, A.I. Breaking time-reversal symmetry for ratchet models of molecular machines. Phys. Rev. E 2019, 99, 062127. [Google Scholar] [CrossRef] [PubMed]
- Mitra, A.; Ignatovich, F.; Novotny, L. Nanofluidic preconcentration and detection of nanoparticles. J. Appl. Phys. 2012, 112, 014304. [Google Scholar] [CrossRef]
- Chen, Q.; Wu, J.-C.; Hu, C.-T.; Ou, Y.-L.; Ai, B.-Q. Transport of interacting self-propelled Brownian particles in a common ratchet potential. Eur. Phys. J. B 2015, 88, 22. [Google Scholar] [CrossRef]
- Li, C.; Chen, H.; Fan, H.; Xie, G.; Zheng, Z. Transport of interacting self-propelled Brownian particles in a common ratchet potential. J. Physa. A. 2018, 11, 161. [Google Scholar]
- Plyukhin, A.V. Intrinsic ratchets: A Hamiltonian approach. Phys. Rev. E 2018, 98, 042130. [Google Scholar] [CrossRef]
- Skaug, M.J.; Schwemmer, C.; Fringes, S.; Rawlings, C.D.; Knoll, A.W. Nanofluidic rocking Brownian motors. Science 2018, 359, 1505–1508. [Google Scholar] [CrossRef]
- M. Bqoor. Ionized Gas Thermoelectric Generator. Thermal Science and Engineering Progress. 100496 (2020).
- McCarthy, P.T.; Reifenberger, R.G.; Fisher, T.S. Thermionic and Photo-Excited Electron Emission for Energy-Conversion Processes. Front. Energy Res. 2014, 2, 54. [Google Scholar] [CrossRef]
- Aleksandrov, N.L.; Anokhin, E.M. Electron detachment from O−2ions in oxygen: the effect of vibrational excitation and the effect of electric field. J. Phys. B: At. Mol. Opt. Phys. 2011, 44, 115202. [Google Scholar] [CrossRef]
- Gilbert, C.R.D.; Furman, B.R.; Feller-Kopman, D.J.; Haouzi, P. Description of Particle Size, Distribution, and Behavior of Talc Preparations Commercially Available Within the United States. J. Bronc- Interv. Pulmonol. 2018, 25, 25–30. [Google Scholar] [CrossRef] [PubMed]
|
Disclaimer/Publisher’s Note: The statements, opinions and data contained in all publications are solely those of the individual author(s) and contributor(s) and not of MDPI and/or the editor(s). MDPI and/or the editor(s) disclaim responsibility for any injury to people or property resulting from any ideas, methods, instructions or products referred to in the content. |
© 2023 by the authors. Licensee MDPI, Basel, Switzerland. This article is an open access article distributed under the terms and conditions of the Creative Commons Attribution (CC BY) license (http://creativecommons.org/licenses/by/4.0/).
