1. Introduction
Human induced rise in atmospheric CO
2 concentration leads to changes in sea water carbonate chemistry including a decrease in seawater pH, a process known as ocean acidification (OA). A large body of evidence is documenting various effects on marine species and ecosystem [
1]. The early life stages of marine invertebrate are especially sensitive to a decrease in seawater pH. These include an increase in larval mortality rate and the percentage of abnormally developing larvae as well as delay in development [
2,
3].
The nudibranch
Aeolidiella glauca (
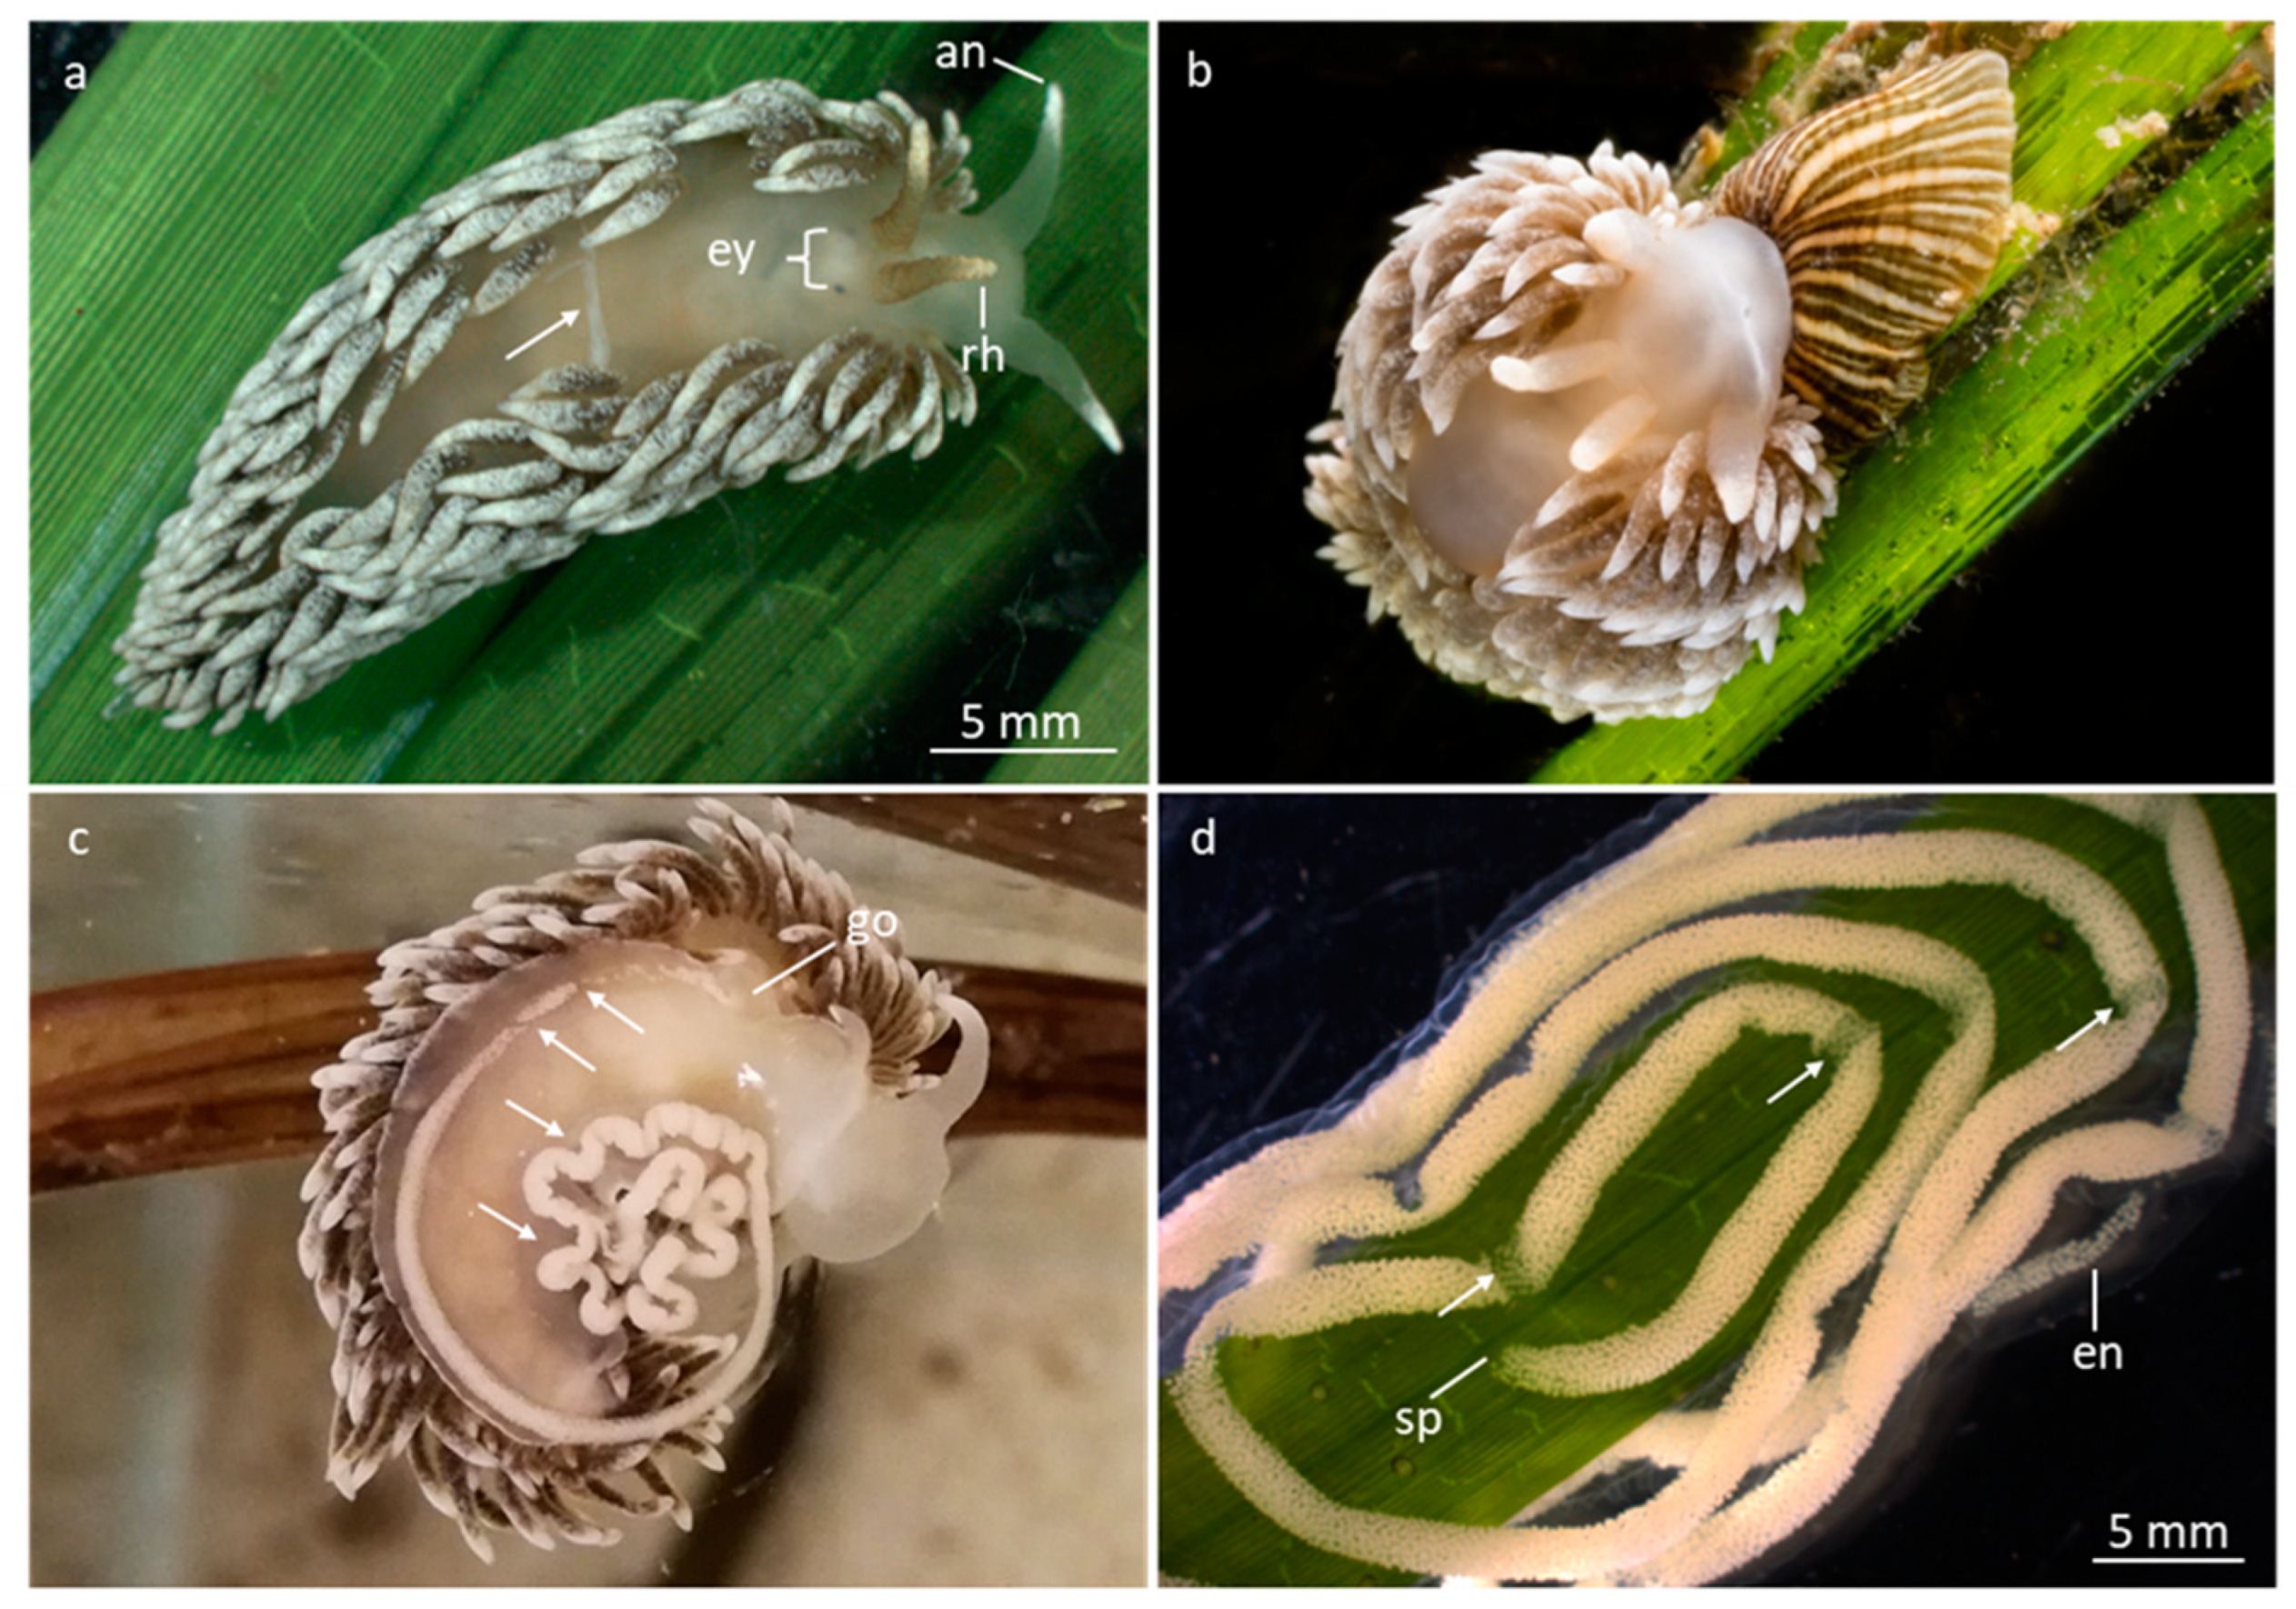
Figure 1a,b) is one of the key organisms living in Zostera marina shallow eelgrass meadows. Along the Swedish West coast, it lays large egg-strings on the eelgrass during summer (
Figure 1c,d). Like all nudibranchs, A. glauca is hermaphrodite with internal fertilization and have functional female and male genitalia simultaneously [
4].
A. glauca does not perform self-fertilization. It cross-fertilizes and transfers sperms via external spermatophores on the partner’s back, from which the sperms migrate to the gonopore of the receiver [
4]. Thereafter, sperms enter the reproductive organs and fertilize the eggs.
From mid-June to early August,
A. glauca preforms multiple matings and can lay several egg-strings. Several matings stimulate the string and egg laying. The egg-strings contained a huge number of eggs, up to 1000 eggs per cm [
4]. The string size and number of fertilized eggs depends on the number of sperms reaching the female reproductive organs [
4]. For example, one mating may not always be sufficient to transfer enough sperms to fertilize all eggs in the egg-string. The receiver animal can also regulate the possibility for the sperms to fertilize the eggs by closing the gonopore. After reproduction
A. glauca dies.
The development of
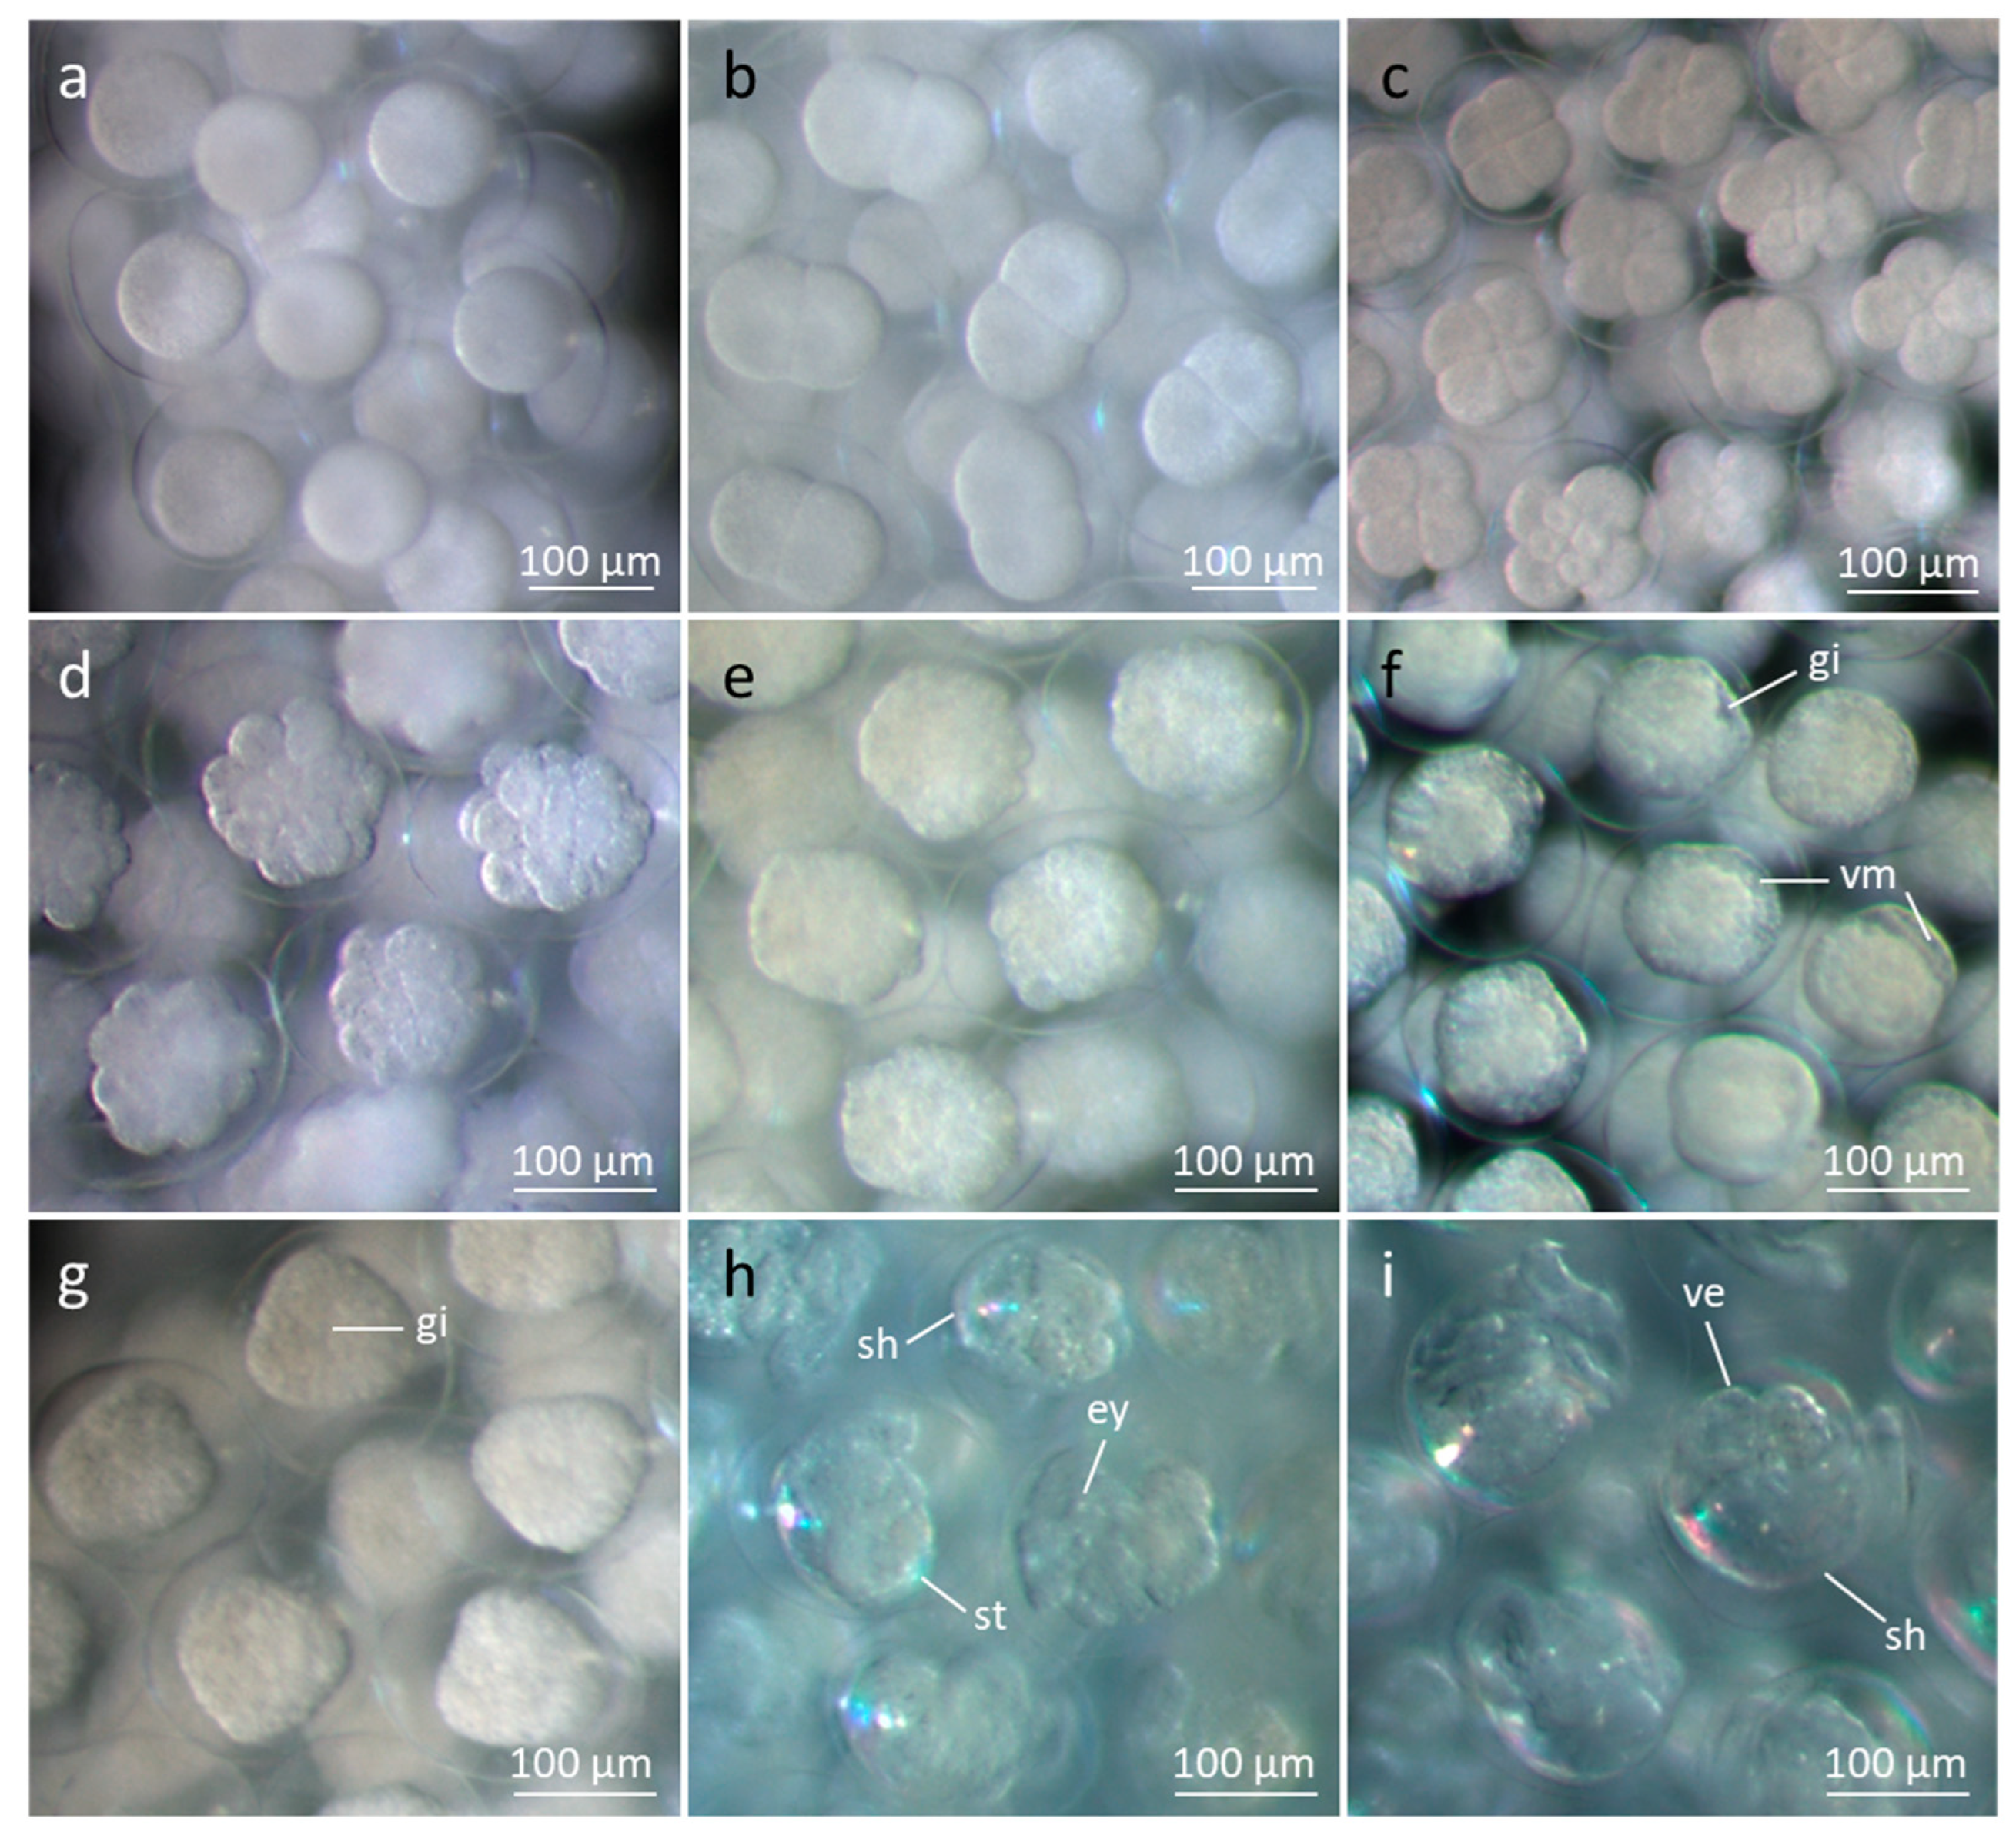
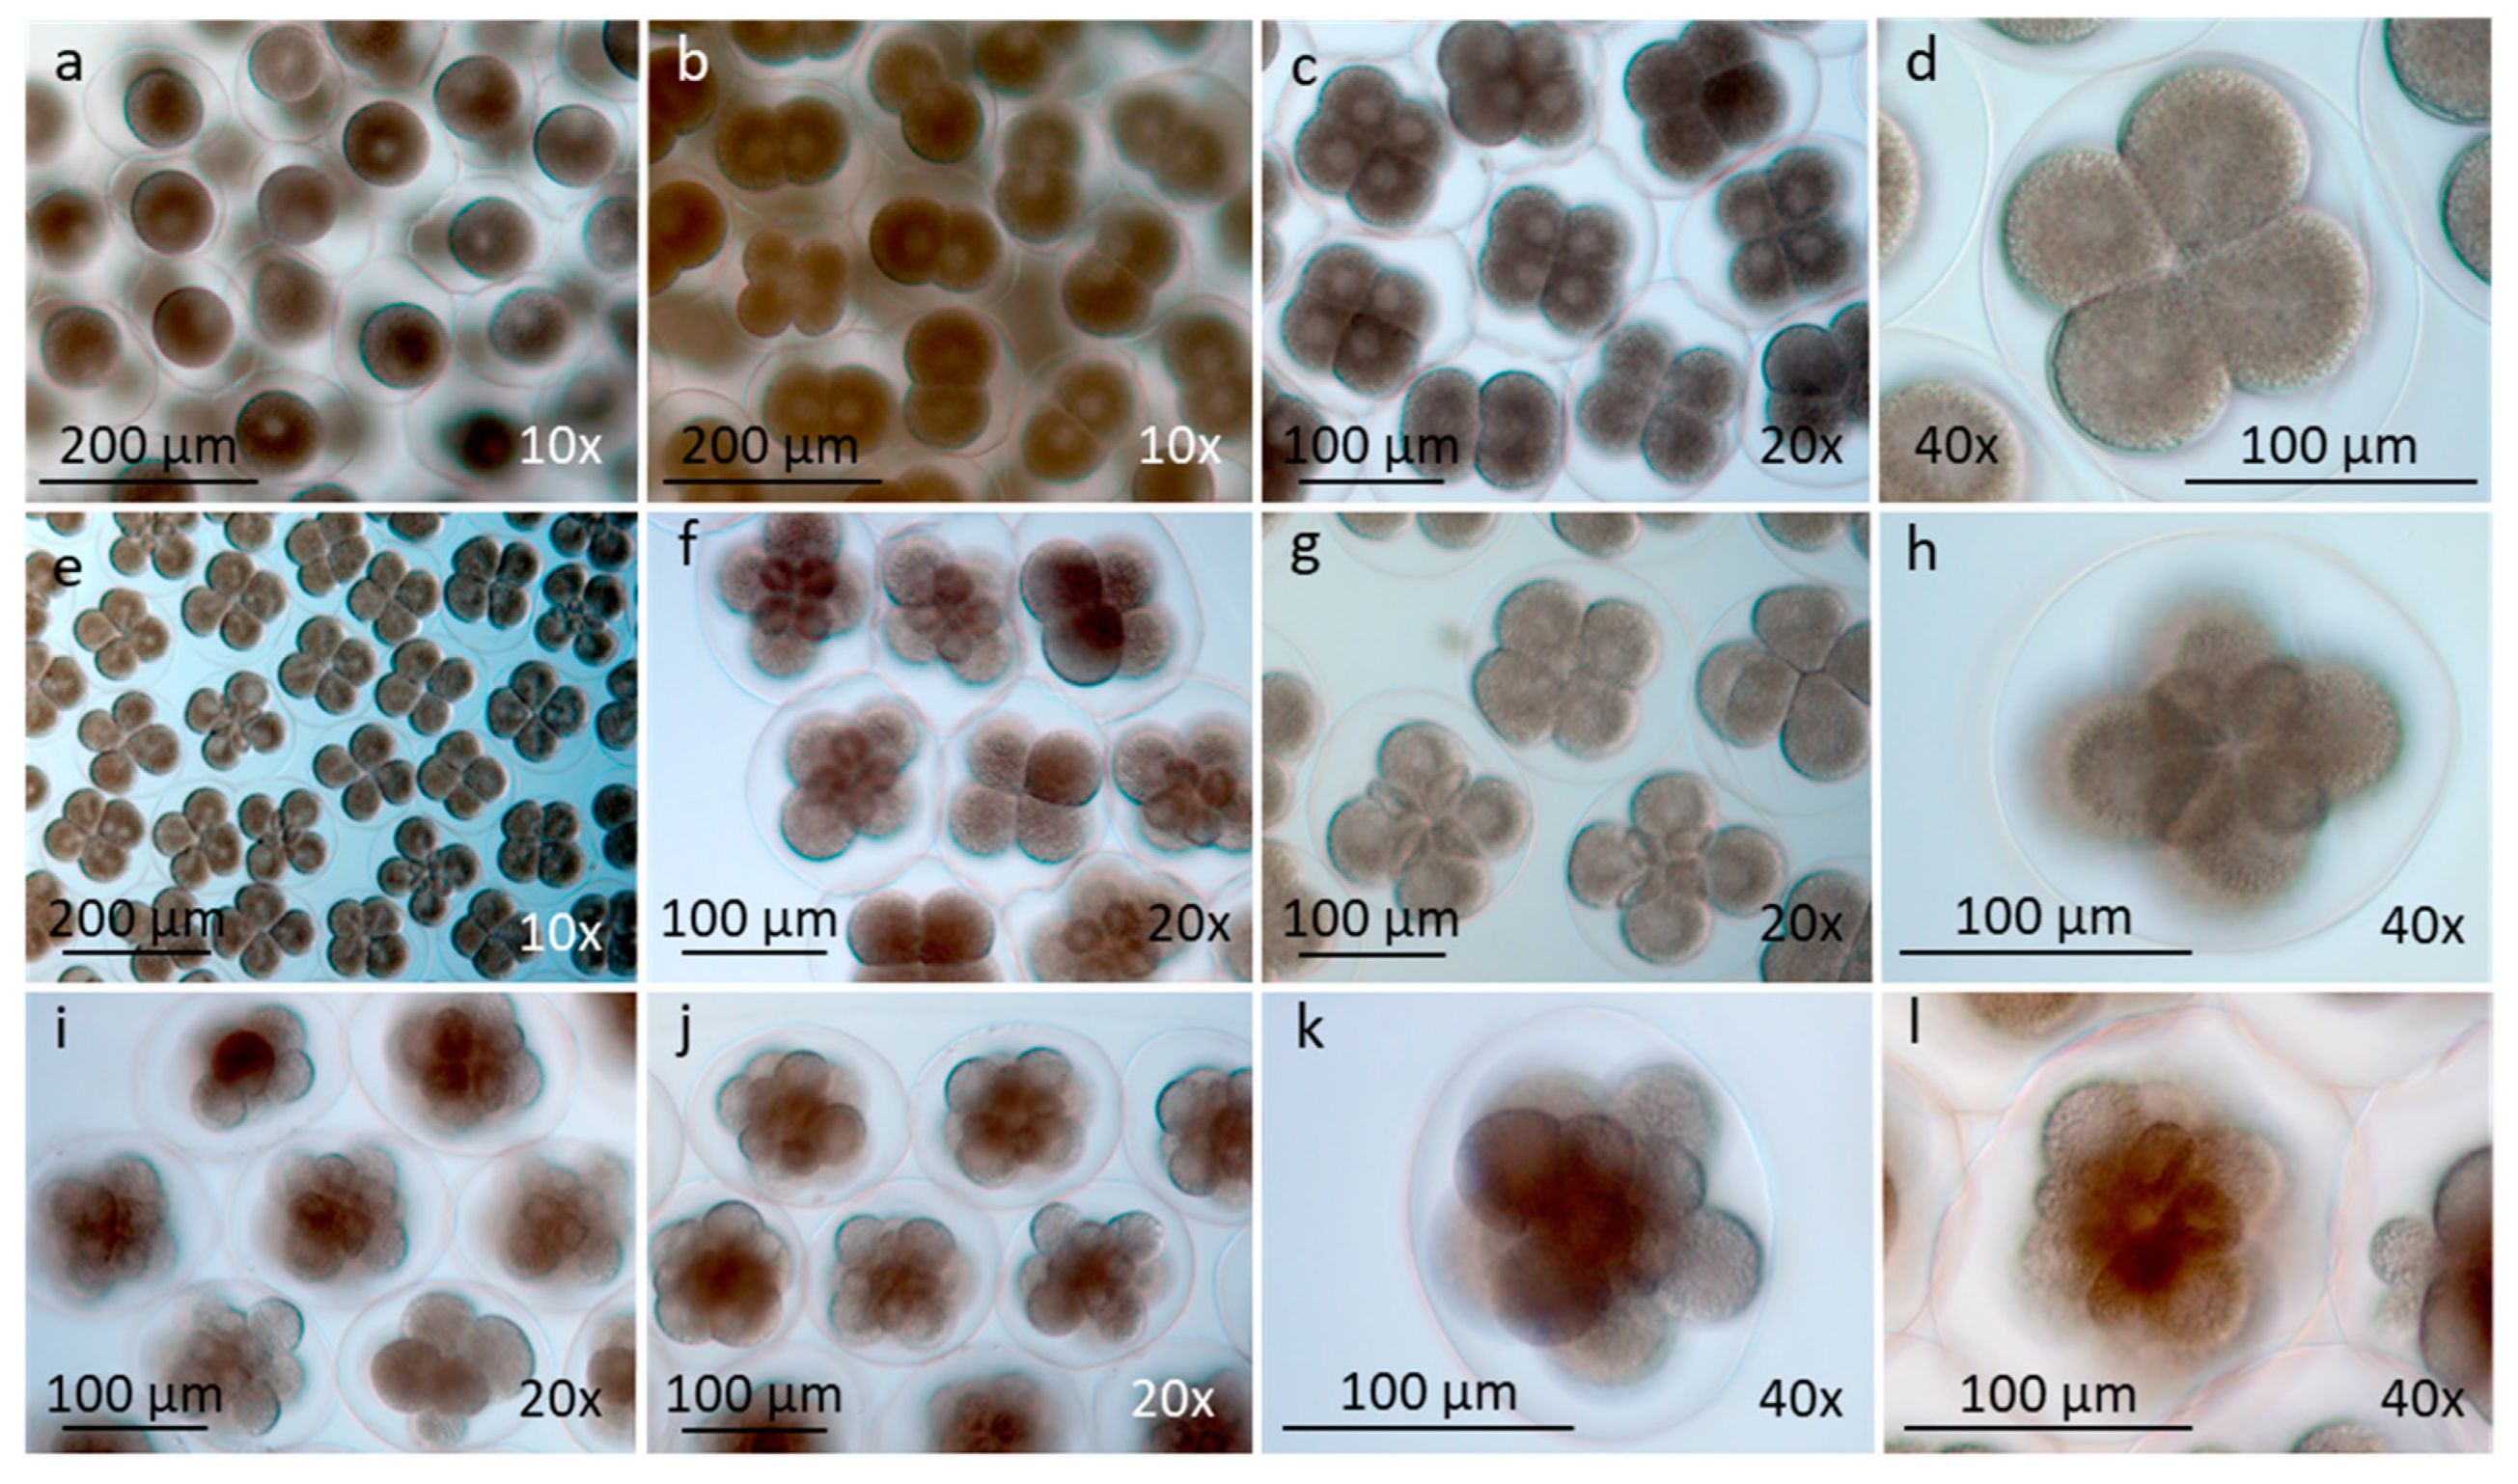
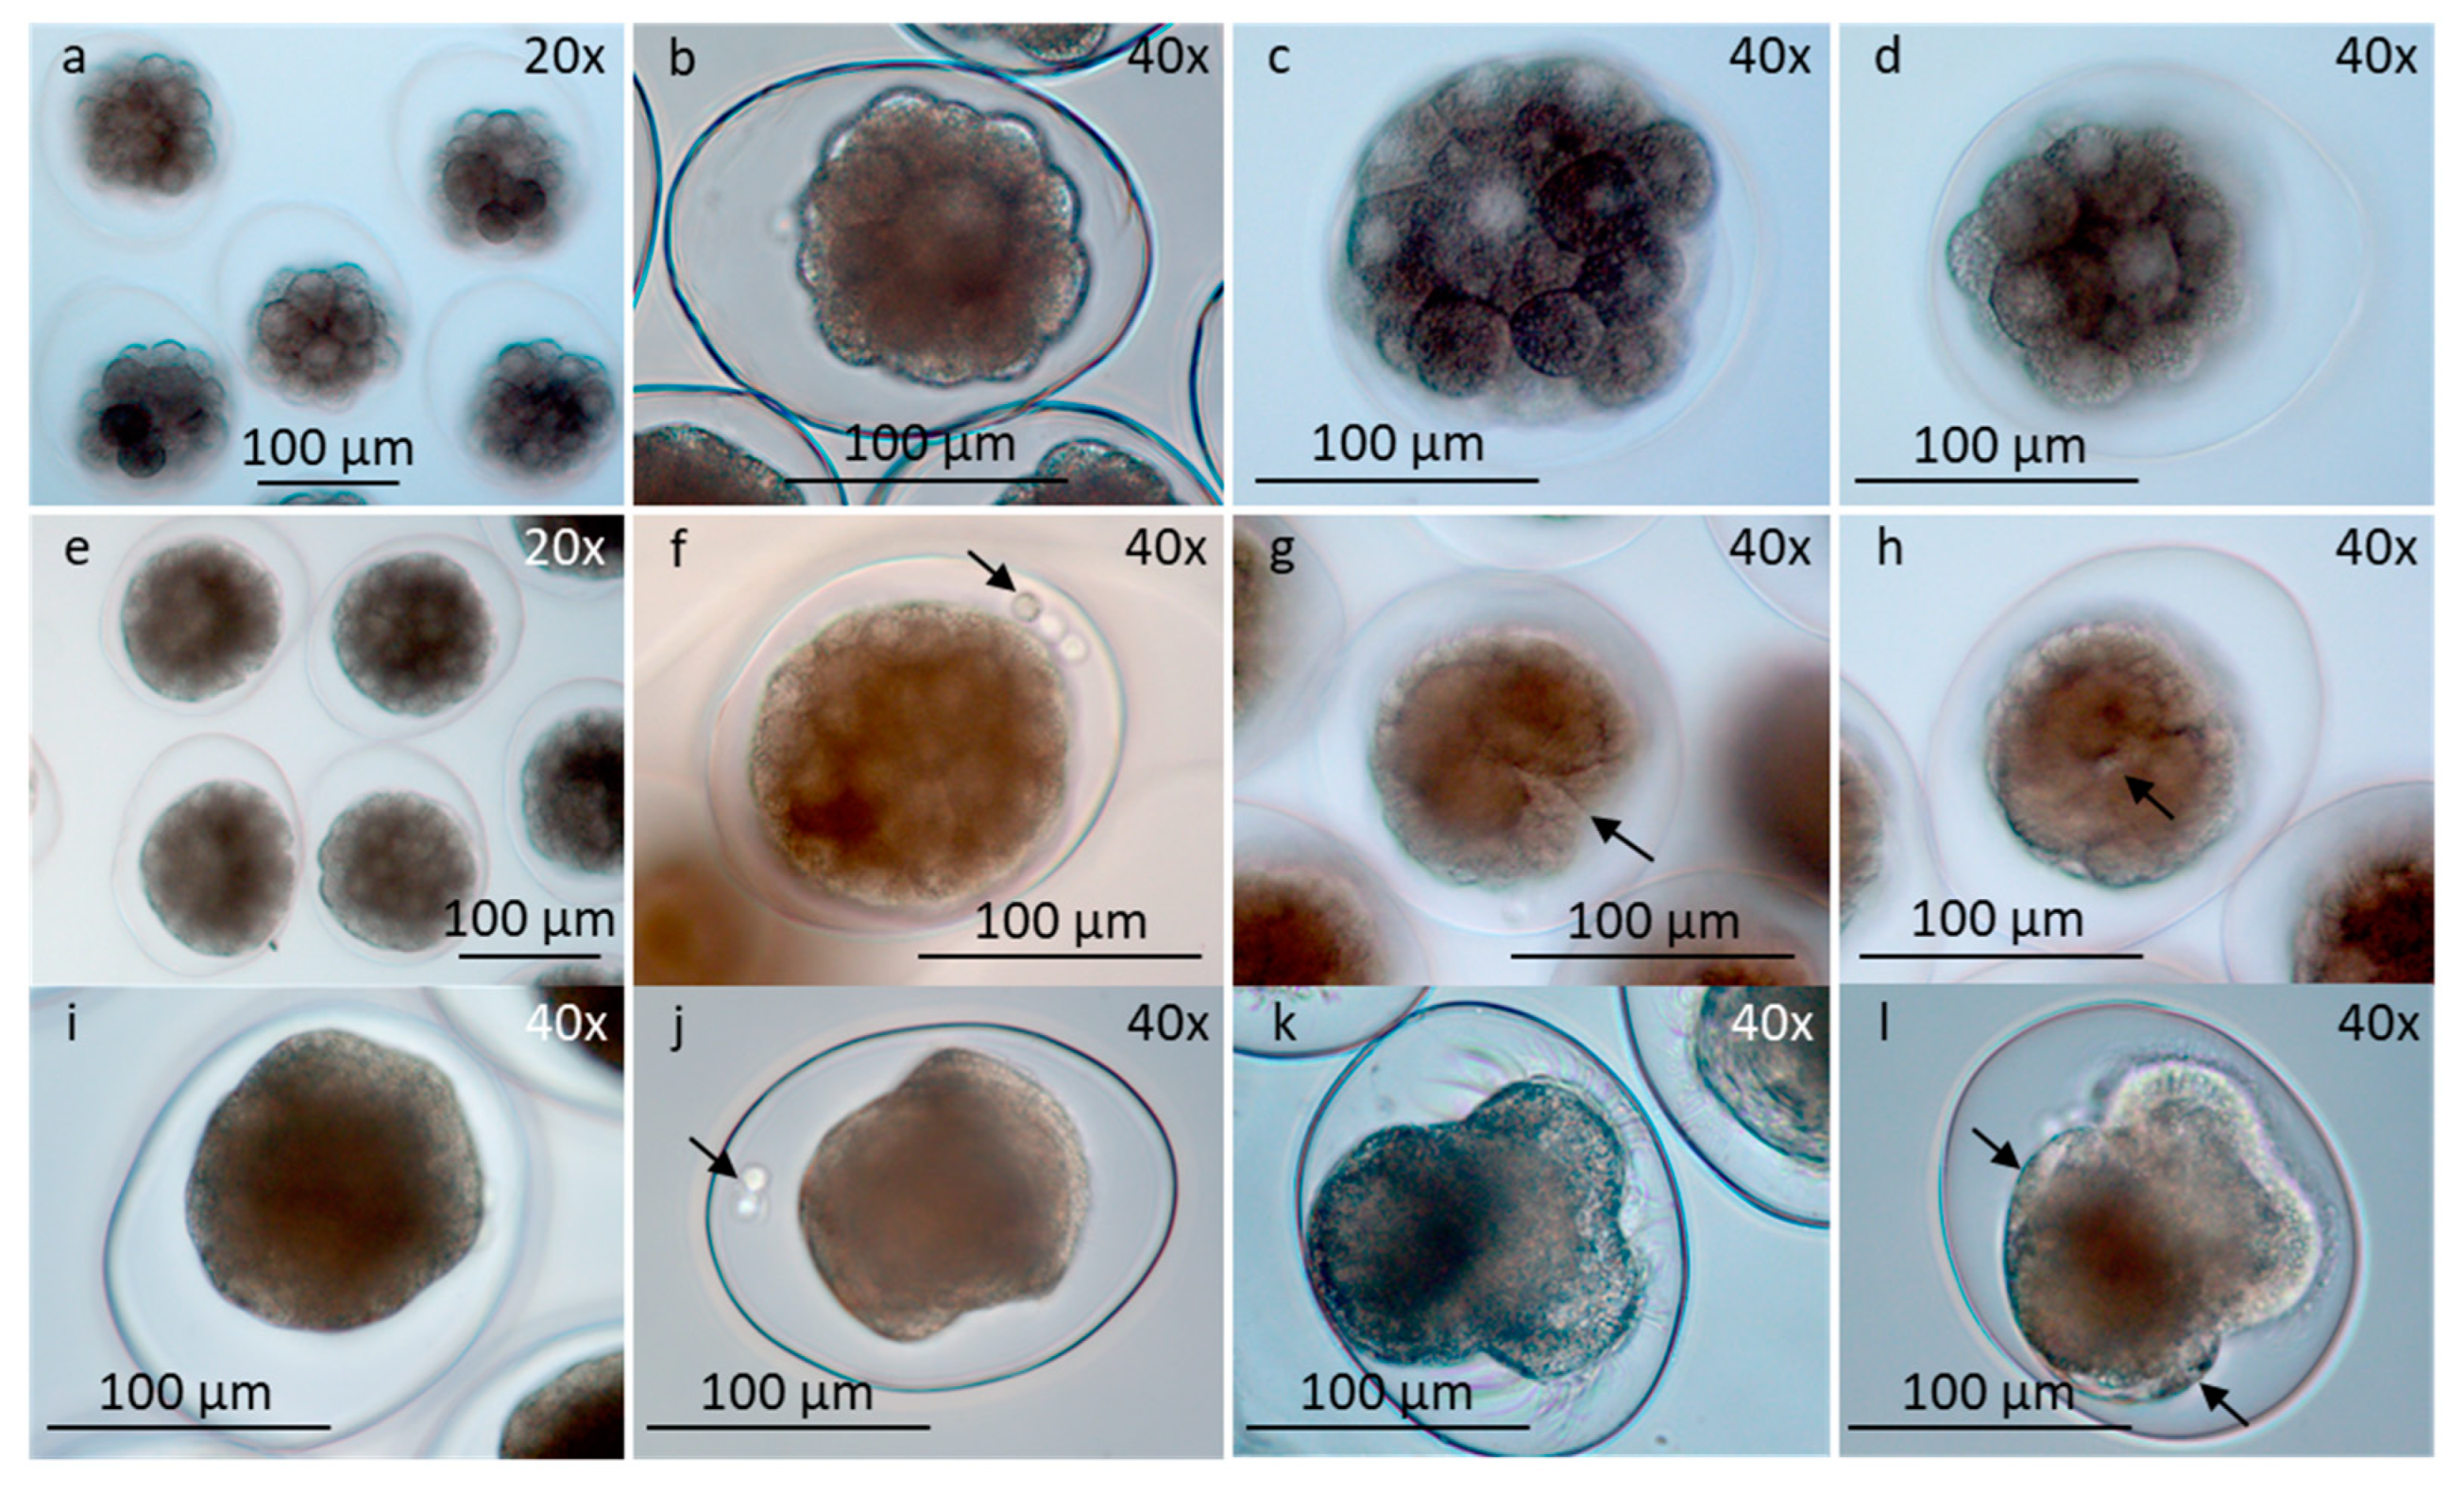
A. glauca is still poorly characterized. Preliminary observations performed in 2019 showed that egg development undergo spiral cleavage including morula, blastula and gastrula, followed by larval development up to free-swimming veliger larvae (
Figure 2,
Figure 3,
Figure 4 and
Figure 5). The whole developing process in aquarium with eelgrass meadow and natural environmental conditions takes around 7 to 8 days.
While the changes in carbonate chemistry associated with ocean acidification are well defined for the open ocean, these are more complex for the coastal environment. Large fluctuations can be observed in regions with high biological activity because of the balance between respiration and calcification (producing CO
2) and photosynthesis (consuming CO
2). For example, in the Gullmars Fjord in Sweden, pH can vary between 8.6 to 7.6 and this variability will shift down to a decrease of 0.4 pH unit by the end of the century [
2]. Recent work demonstrated that species sensitivity to pH is strongly modulated by the extreme of the present range of variability as a consequence of local adaptation [
5,
6]. This hypothesis was tested in the Gullmars Fjord on several species confirming this hypothesis with a threshold of around 7.5 for the green sea urchin
Strongylocentrotus droebachiensis [
2,
7] and around 7.7 for the blue mussel
Mytilus edulis [
3]. Based on this hypothesis, we could hypothesize that
A. glauca development may be tolerant to pH down to 7.6 and that negative effect on the embryo and larval development will be observed under more extreme low pH.
Life-history traits are also modulating species sensitivity to low pH and explain contrasting responses observed between species living in the same environment. Benthic invertebrates have developed a variety of life-history strategies that can be divided into two main strategies: (i) planktotrophy, where a parent invests energy in producing millions of small eggs that will develop into planktotrophic larvae feeding on exogenous sources; and (ii) lecithotrophy, where parents produce comparatively small numbers of large, yolky eggs and lecithotrophic larvae that derive their nutrition from energy stored in the egg itself. The comparison of the two strategies in echinoderms inhabiting the Gullmars Fjord, it was shown that while species with planktotrophic strategy were much more sensitive to low pH, no negative effects were observed in lecithotrophic ones [
8]. Another life-history trait that was proposed to modulate species sensitivity to ocean acidification is the encapsulation of embryos. Based on studies performed on the cephalopod
Sepia officinalis, Melzner et al. [
9] proposed that the idea that encapsulation can lead to physiological adaptation to low pH. While partly protecting from the external environment, encapsulation is exposing the embryos to low pH and low O
2, what can be referred to ontogenetic hypercapnia [
10]. This is a strategy used by many species of molluscs where they lay their eggs in different type of egg mass such as strings, ribbons, capsules, or globose. These species can then be expected to be resilient to low pH well beyond the extremes of the present range of natural variability.
To test this hypothesis, we designed an experiment comparing the impact of two different pH: (i) 8.1, the present average in seawater pH at the sampling site; and, (ii) 7.3, the extreme pH within the natural variability as expected by 2100 and well below the extreme of the present range of variability (tipping point of pH 7.6; [
2]). We followed the developmental rates from 1-cell stage to free swimming A. glauca veliger larvae. A photographic documentation and description of this development was also performed.
4. Discussion
As the development of
A. glauca was poorly characterized, we documented and described the evolution and dynamic of its development from fertilization to the free-swimming larvae. Like all mollusks, the egg cells of the nudibranch
Aeolidiella glauca undergo holoblastic spiral cleavage, a form of embryonic development, which occurs widely within invertebrates such as mollusks, annelids, nemerteans and flatworms [
15]. The first three cleavage stages up to early morula (32 cell stages) went rather fast and were reached after 11-12 hours. The development continued following a classic pattern through late morula, blastula and early gastrula. The growing gastrula stages became rhomboid-shaped. The tiny wobbling movement caused by cilia in the velar region increased with time and cilia continue to grow on the velar region. Rhomboid-shaped gastrulas with velar markings developed into rotating gastrulas. The different gastrula stages including the early none-moving gastrula, the rhomboid-shaped gastrula with increasing ciliary movement, the rotating growing rhomboid–shaped gastrula with no or a tiny piece of shell and early developing stomach and liver regions spanned over a period of approximately 75-80 hours. Approximately 120 hours were needed to grow a rotating veliger larva with a growing large shell and developing internal functional organs and about one more day before hatching and the release of the free-swimming larvae.
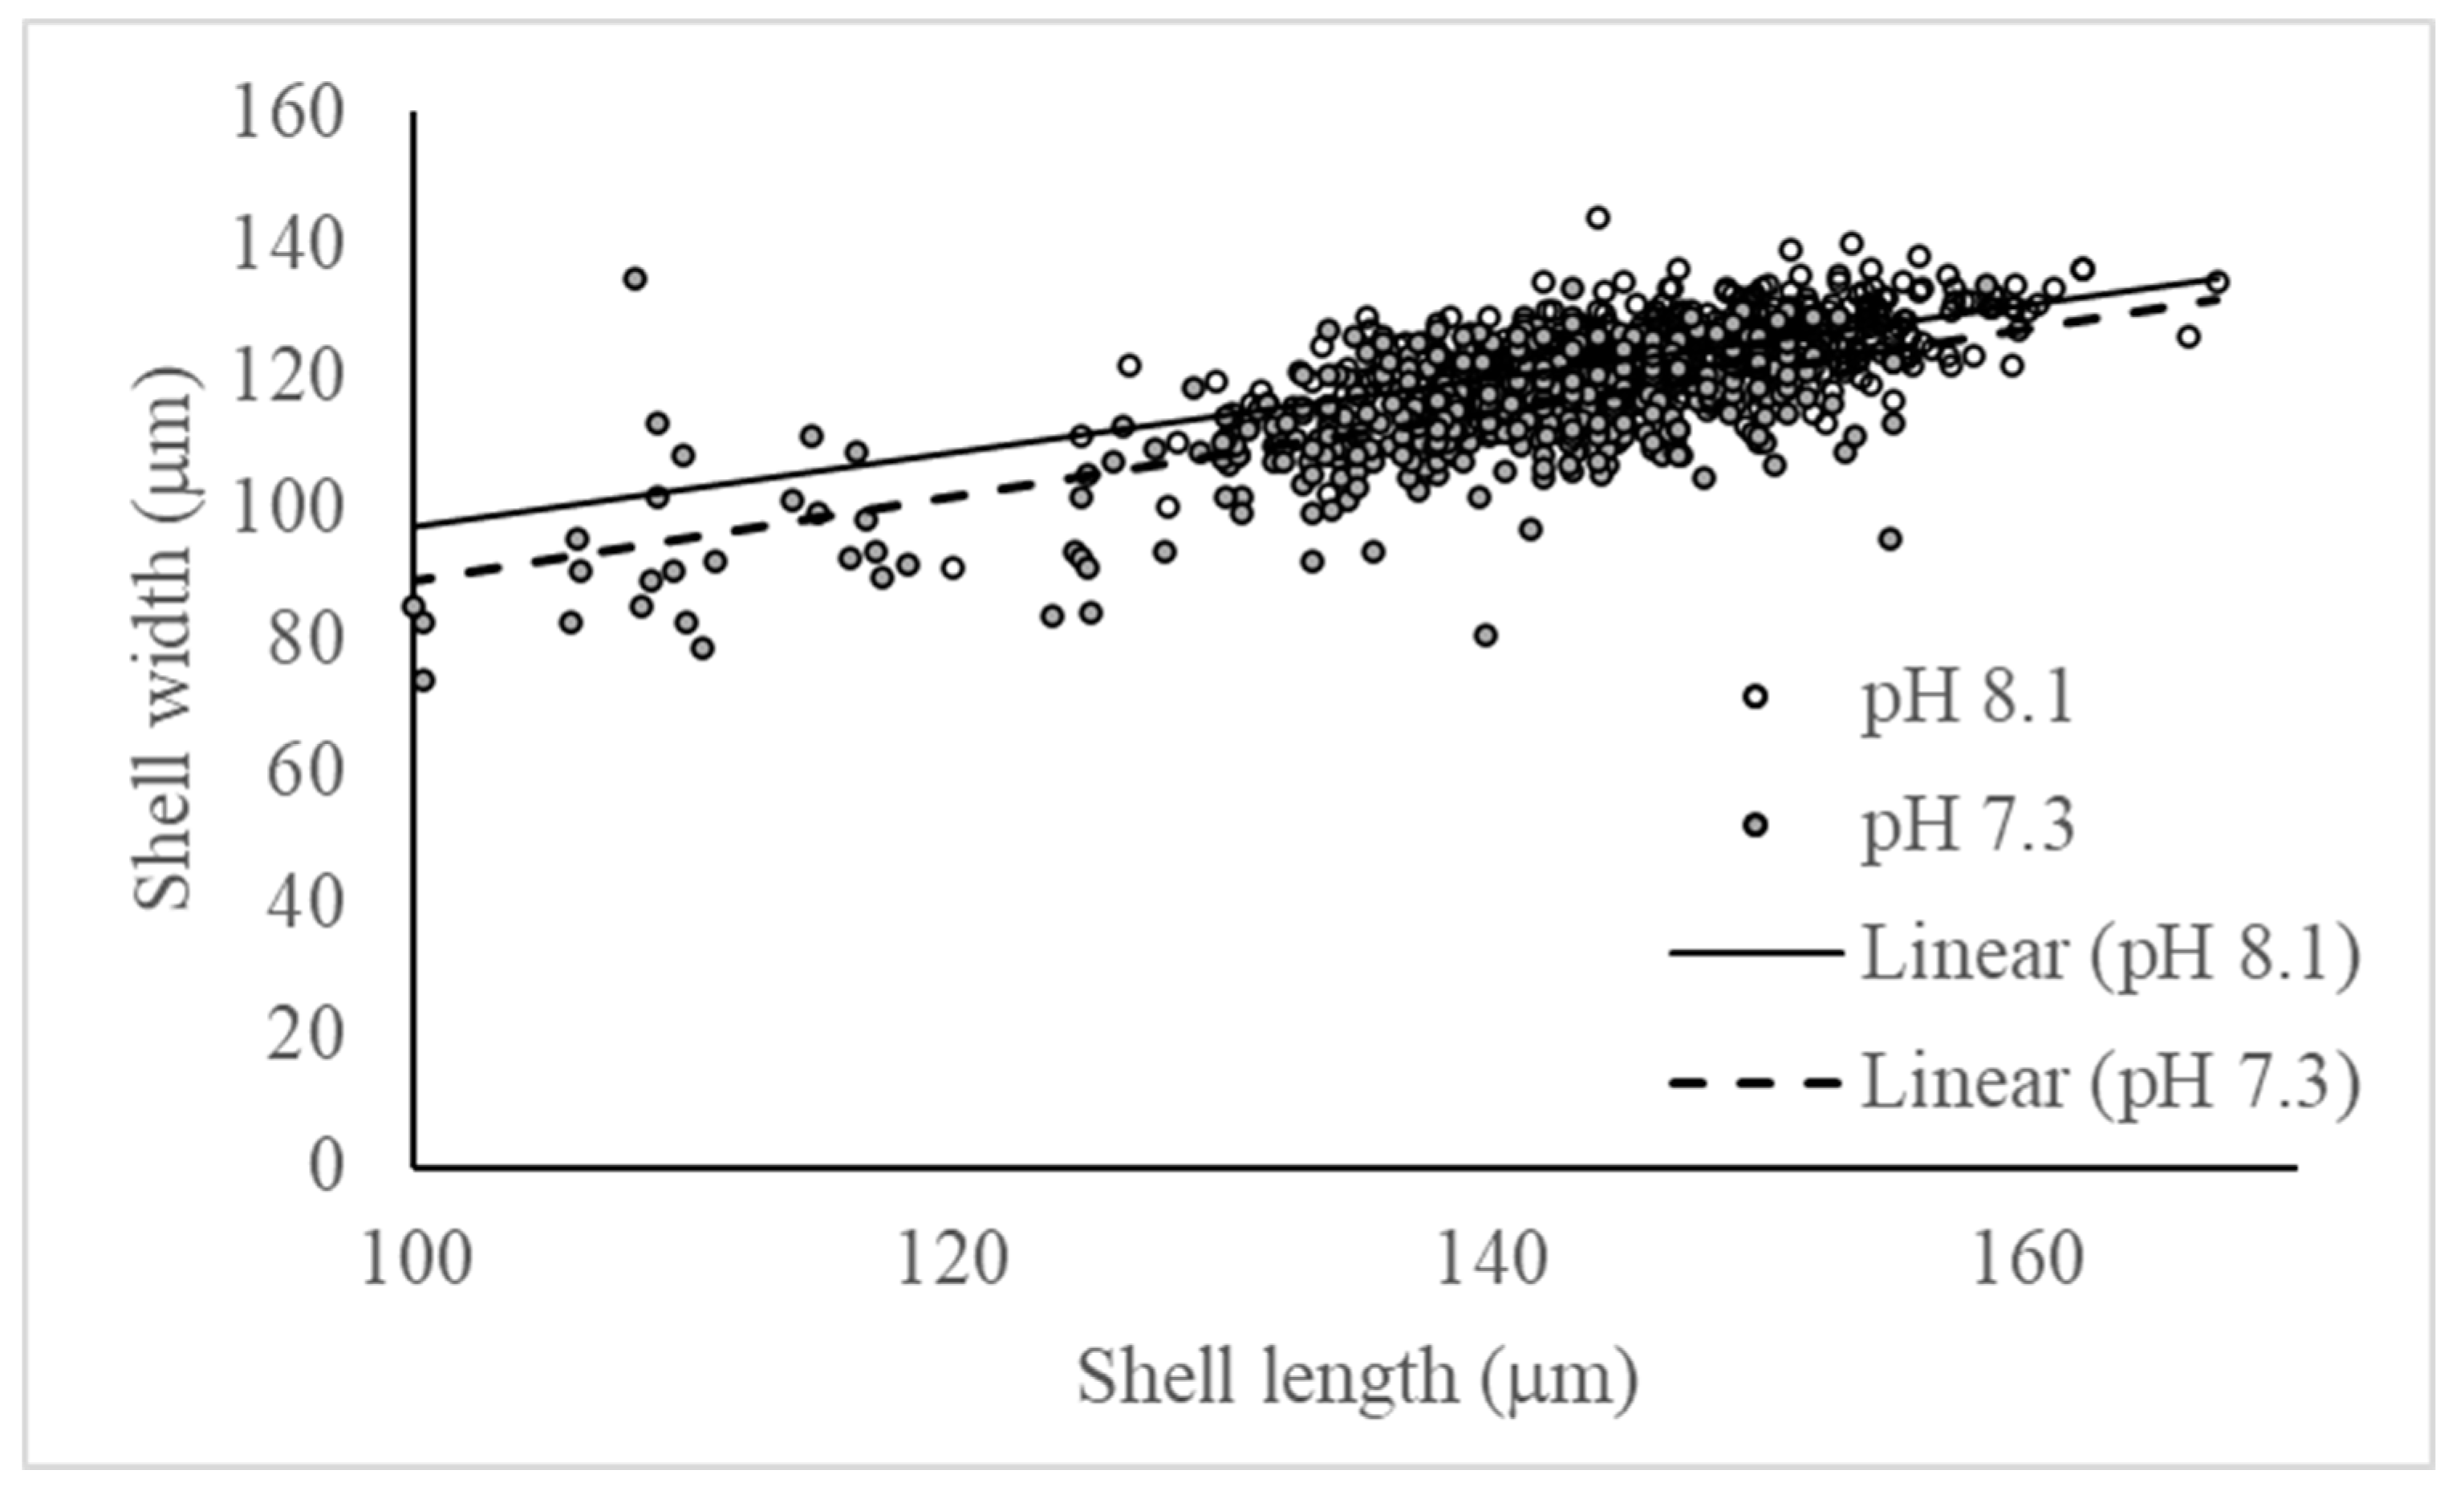
Exposure to pH 7.3, well below the extreme of the present range of variability at the sampling site, had little effect on the early development of A. glauca. The development progression was not affected, and the corrosive water did not prevent the formation and maintenance of the aragonite shell. The only significant effect was a subtle change in shell allometries. Under low pH, the shells were more triangular-shaped and slightly narrower than shells developed under pH 8.0.
The impact of ocean acidification on nudibranch is poorly documented with only 2 articles published so far and only focusing on adult stages. The nudibranch
Corambe stenbergae is a predator of bryozoan. Short exposure to pH as low as 7.1 only had no effect on their consumption rate [
16]. In another study, adults of 5 different species of nudibranch (
Aeolidia papillosa, Cuthono gymnota, Dendronotus frondosus, Onchidoris bilamellata and Flabellina verrucosa) were collected from intertidal and subtidal zones and exposed to pH 7.8 and 7.0. Exposure to low pH did not trigger any stress behavior in any of the tested species and a mild but significant effect on the heart rates was only observed in 2 of the 5 tested species [
17]. Overall, these results also suggest a high tolerance for low pH in adult nudibranch.
Maybe more surprisingly, we show high tolerance to low pH for the planktotrophic veliger larvae of
A. glauca and its aragonite shell, despite growing in corrosive water. Marine calcifiers are generally sensitive to low pH as the extra energy costs associated with acid-base regulation can lead to negative effects on fitness (e.g. [
18]). However, calcifiers are not pieces of calcium carbonate and they can inhabit chemically challenging environments [
19]. For example, dense clusters of the vent mussel
Bathymodiolus brevior were observed at pH values as low as 5.36 [
20]. This is possible in species developing physiological adaptation to buffer or compensate for the environmental challenges associated with low pH (acid-base regulation, e.g. [
18]; compensatory calcification, e.g. [
3]). In
A. glauca, this may be a consequence of ontogenic hypercapnia. Encapsulation is a method to protect and buffer against some chemical changes [
21] but it also exposed the embryos to more extreme environments than their surrounding seawater, including undersaturated low pH waters. These can be amplified under ocean acidification conditions and can drive negative response when the limit of the pH tolerance is reached. The encapsulated embryo of
Littorina obtusata exposed to pH 7.6 has a small decrease in viability, an increased developmental time, decreased heart rate, and changes in the shell morphology [
22].
We hypothesized that as a consequence of ontogenic hypercapnia, the early life-stages of
A. glauca would be tolerant to pH far below the extreme of the present range of the natural variability. The tested low pH (7.3) was 0.3 unit lower than the present extreme of the natural variability (7.6) but did not elicit a strong response beyond some subtle changes in shell morphology. These changes are difficult to interpret as it could be an expression of plasticity as previously observed for other invertebrate larvae exposed to low pH (e.g. [
23]). These results are then in agreement with our hypothesis. While this is the first article documenting the impact of low pH on the early life stage of a nudibranch, some additional support for this hypothesis can be found in the grey literature. Carr & Podolsky [
24] compared 6 different species of nudibranch (
A. papillosa, Diaulula sandigensis, Doris montereyensis, Hermissenda crassicornis, Melibe leonine and,
Triopha catalinae) laying egg mass using different strategies (Strings or ribbons). Similarly to our results, exposure to pH as low as 7.3 only triggered moderate responses such as small differences in shell length, time of hatching or weight of organic or inorganic masses.
In conclusion, available evidence supports the idea that encapsulation of eggs leads to pre-adaptation to low pH environment making nudibranch resilient to near-future ocean acidification.
Figure 1.
Nudibranchs and egg strings. a, d) Stereomicroscopic pictures. b, c) Digital camera picture (no scales). a)
A. glauca on eelgrass showing dorsal cerata, antenna, rhinophores, eyes and an egg-string inside dorsal body (arrow). b)
A. glauca eating the sea anemone
Sagartiogeton viduatus. c)
A. glauca laying an egg-string on aquarium wall. Note gonopore (go), from where the egg-string emerges. The first emerged string-part is broader than the latest emerging part. Arrows show invaginations of the egg-string and fractions of the egg-cells. d) An egg-string attached to eelgrass. Note: starting point (
sp) of the egg-string, narrow part of the egg-string (
en) and attachment sites of the string (arrows). Abbreviations:
an, antenna;
en, egg-string narrow part;
ey, eyes;
go, gonopore;
rh, rhinophore;
sp, starting point of egg-string.
Figure 1b © Eduardo Infantes.
Figure 2.
Stereomicroscopic pictures. Development of egg cells from 1-cell stage to rotating veliger larvae in the egg-string in surface sea water, pH 8.0. a) 1-cell stage. b) 2 cells. c) 4 to 8 cells. Note spiral cleavage in third division. d) Early morula. e) Late morula. f) Blastula to gastrula with markings for velar apparatus. One gastrula in lateral view showing invagination, one rhomboid-shaped larva in bottom left corner. g) Gastrula in ventral/dorsal view with invagination and rhomboid-shaped larvae. h) Early rotating veliger larvae with velar apparatus, small shell, stomach, and eyes. i) Late veliger larvae with velar apparatus, stomach and liver, ready to leave the eggshell and the string. Note the larger size of larvae and shells compared to picture h. Abbreviations: ey, eye; gi, gastrula invagination; sh, shell; st, stomach; ve, velar apparatus; vm, velar marking.
Figure 3.
Development from 1 to 16 cells in egg-strings (LM). Note light nucleus in cells. a) 1 cell. b) 2 to 4 cells. c, d) 4 cells in different developmental stages. e-g) Developing 4 to 8 cells. h) 8 cells (note the spiral cleavage; the 4 smaller cell present in grooves between the 4 larger cells). i, j) Developing 8 to 16 cells. k) 12 cells, approximately. l) 16 cells, approximately.
Figure 4.
Development in egg-strings from early morula to veliger larvae with developed small shell and velar apparatus (LM). a, b) Early morula up to 32 cells. c, d) Late morula up to 64 cells. e, f) Blastula with three polar bodies (f, arrow). g, h) Gastrula with invagination, lateral view (g, arrow) and dorsal view (h, arrow). i, j) Rhomboid shaped embryo with tiny cilia on velar region (i) and rotating (j). Note two polar bodies (arrow). Early developing rotating veliger larvae with ciliated velar apparatus, no shells (k) and small shell (l, arrows).
Figure 5.
Early developed larvae in egg-strings and free-swimming veliger larvae, seen in different views (LM). a-j) Larval development pH 8. a-d) Early developed larvae within eggshell showing velar apparatus, shell, eyes, statocysts, stomach liver and tendon. a) Rotating larvae organized in egg-string. b, c) Front view in different focuses. d) Side view. e-h) Free swimming veliger larvae showing eyes, mouth with tiny cilia and internal organs (e) tendon (f) mouth, stomach and liver (g), liver and canal system to stomach with structure inside (h). i) Larva with focus on stomach with cuboidal epithelia cells and a particle inside, eyes and foot. j) Larvae partly inside shell. Focus on eyes, foot and opercular part of shell. k, l) Development in pH 7.3. Defaulted larvae with velar apparatus, foot and unidentified internal organs as stomach and liver (* k), without shell (k), or small shell (l). m) Larvae completely inside shell. Note opercular part of shell. n) Empty rounded shell seen from below. o) Empty triangular shell seen from below. p) Living larvae in dorsal view inside shell, floating on surface water, measured length and width of shells (white lines). m,n,p) development in pH 8.0; o) development in pH 7.3. Abbreviations: ci, cilia; eg , eggshell; ey, eye; fo, foot; li, liver; lic, liver canal; mo, mouth; op, opercular part of shell; sh, shell; st, stomach; sta, statocyst; sts, structure in stomach; teb, tendon broad; ten, tendon narrow; ve, velar apparatus. Scale bars in all pictures are 100 µm.
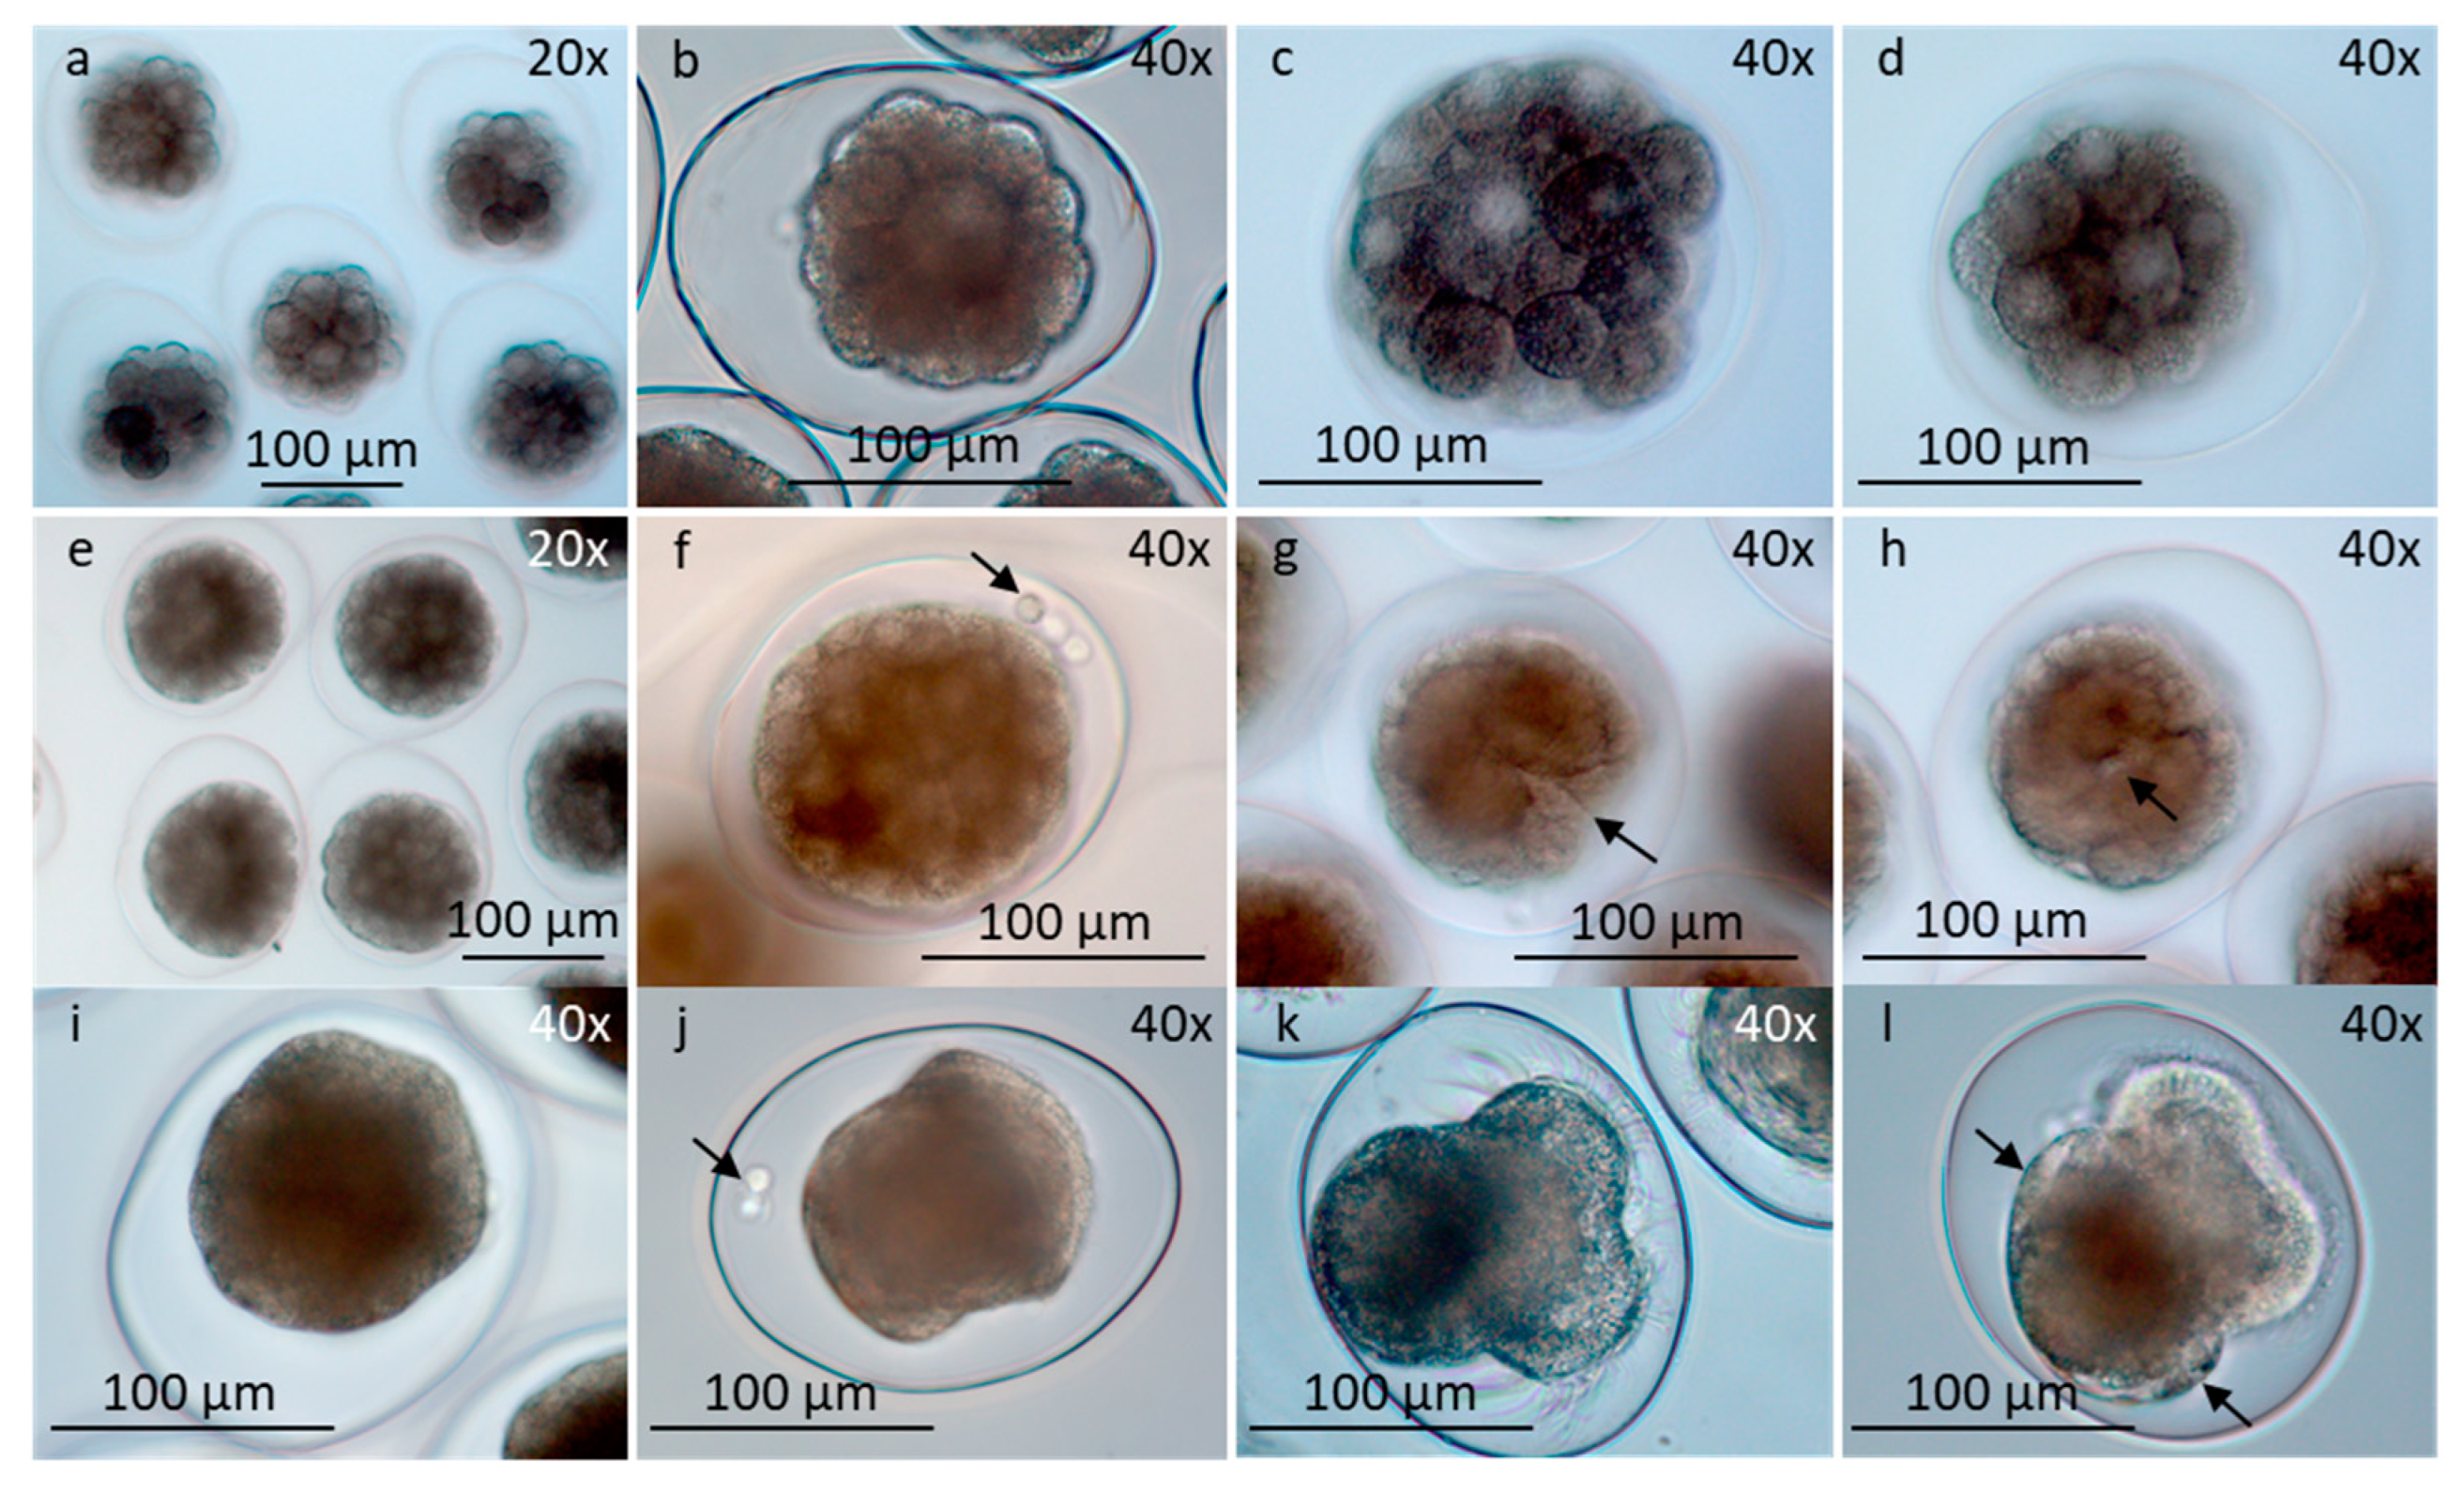
Figure 6.
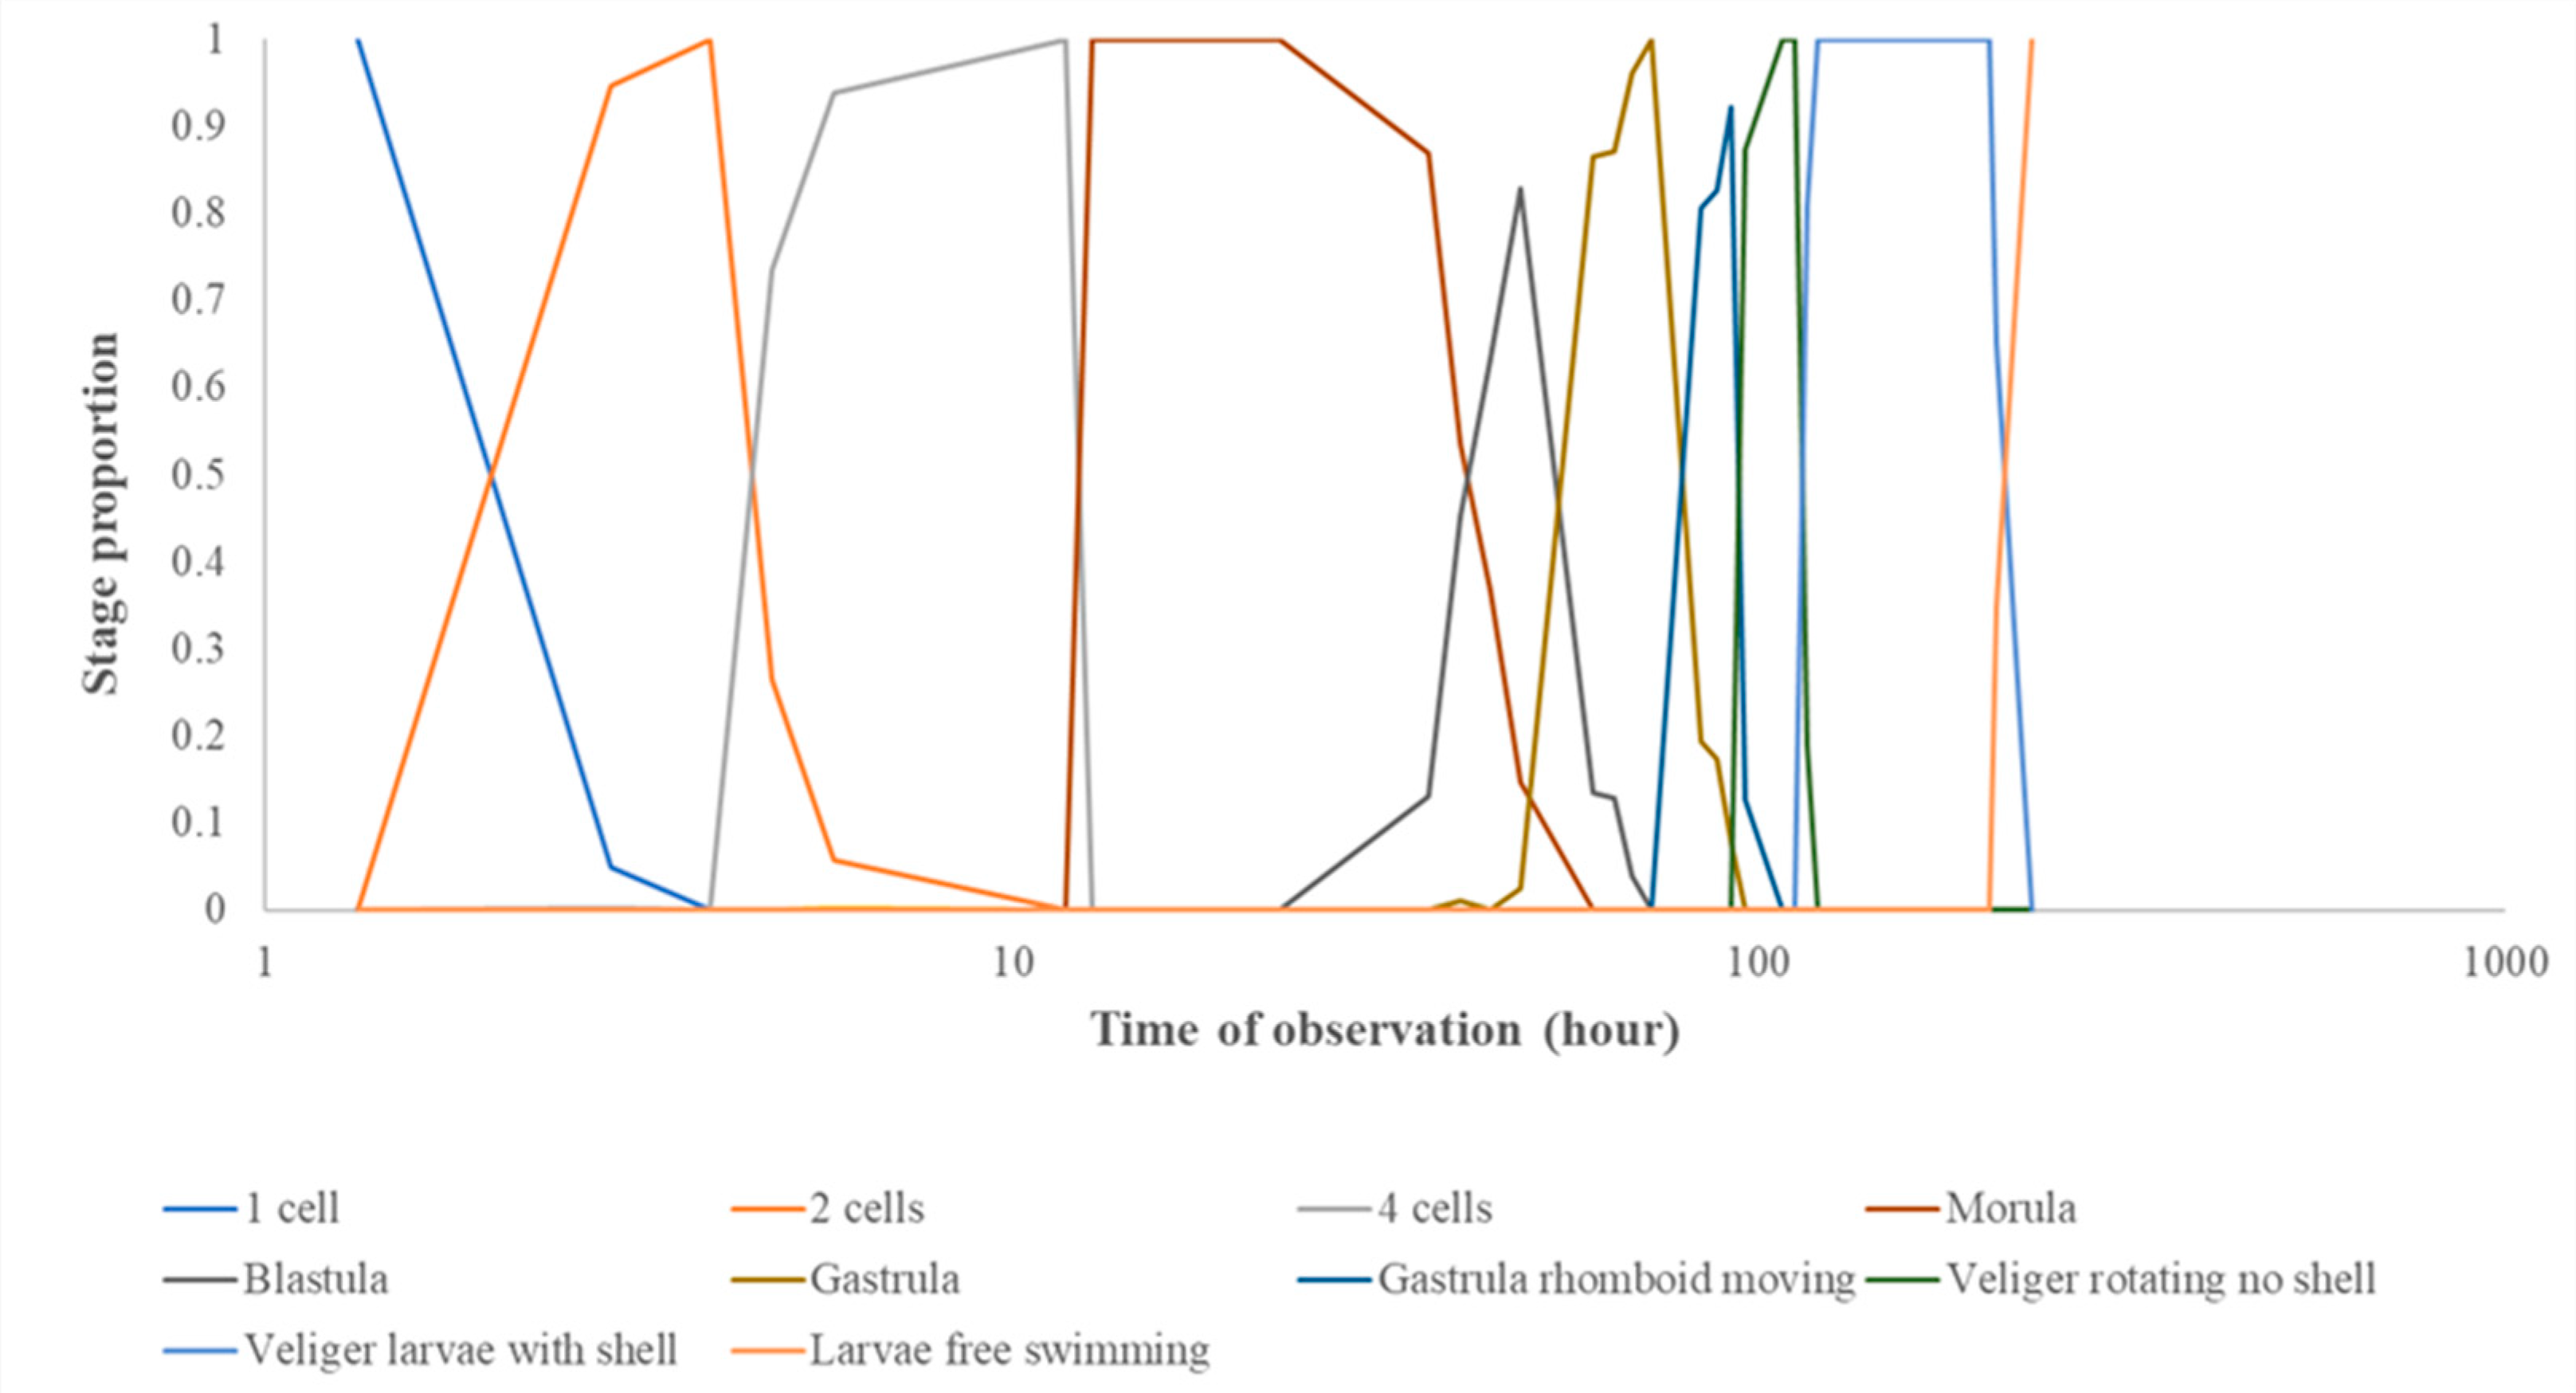
Example of the development progression of Aeolidiella glauca eggs within a string (pH 8.0) over time (presented on the logarithmic scale), from 1 cell (0h) to free swimming veliger larvae (232h).
Figure 6.
Example of the development progression of Aeolidiella glauca eggs within a string (pH 8.0) over time (presented on the logarithmic scale), from 1 cell (0h) to free swimming veliger larvae (232h).
Figure 7.
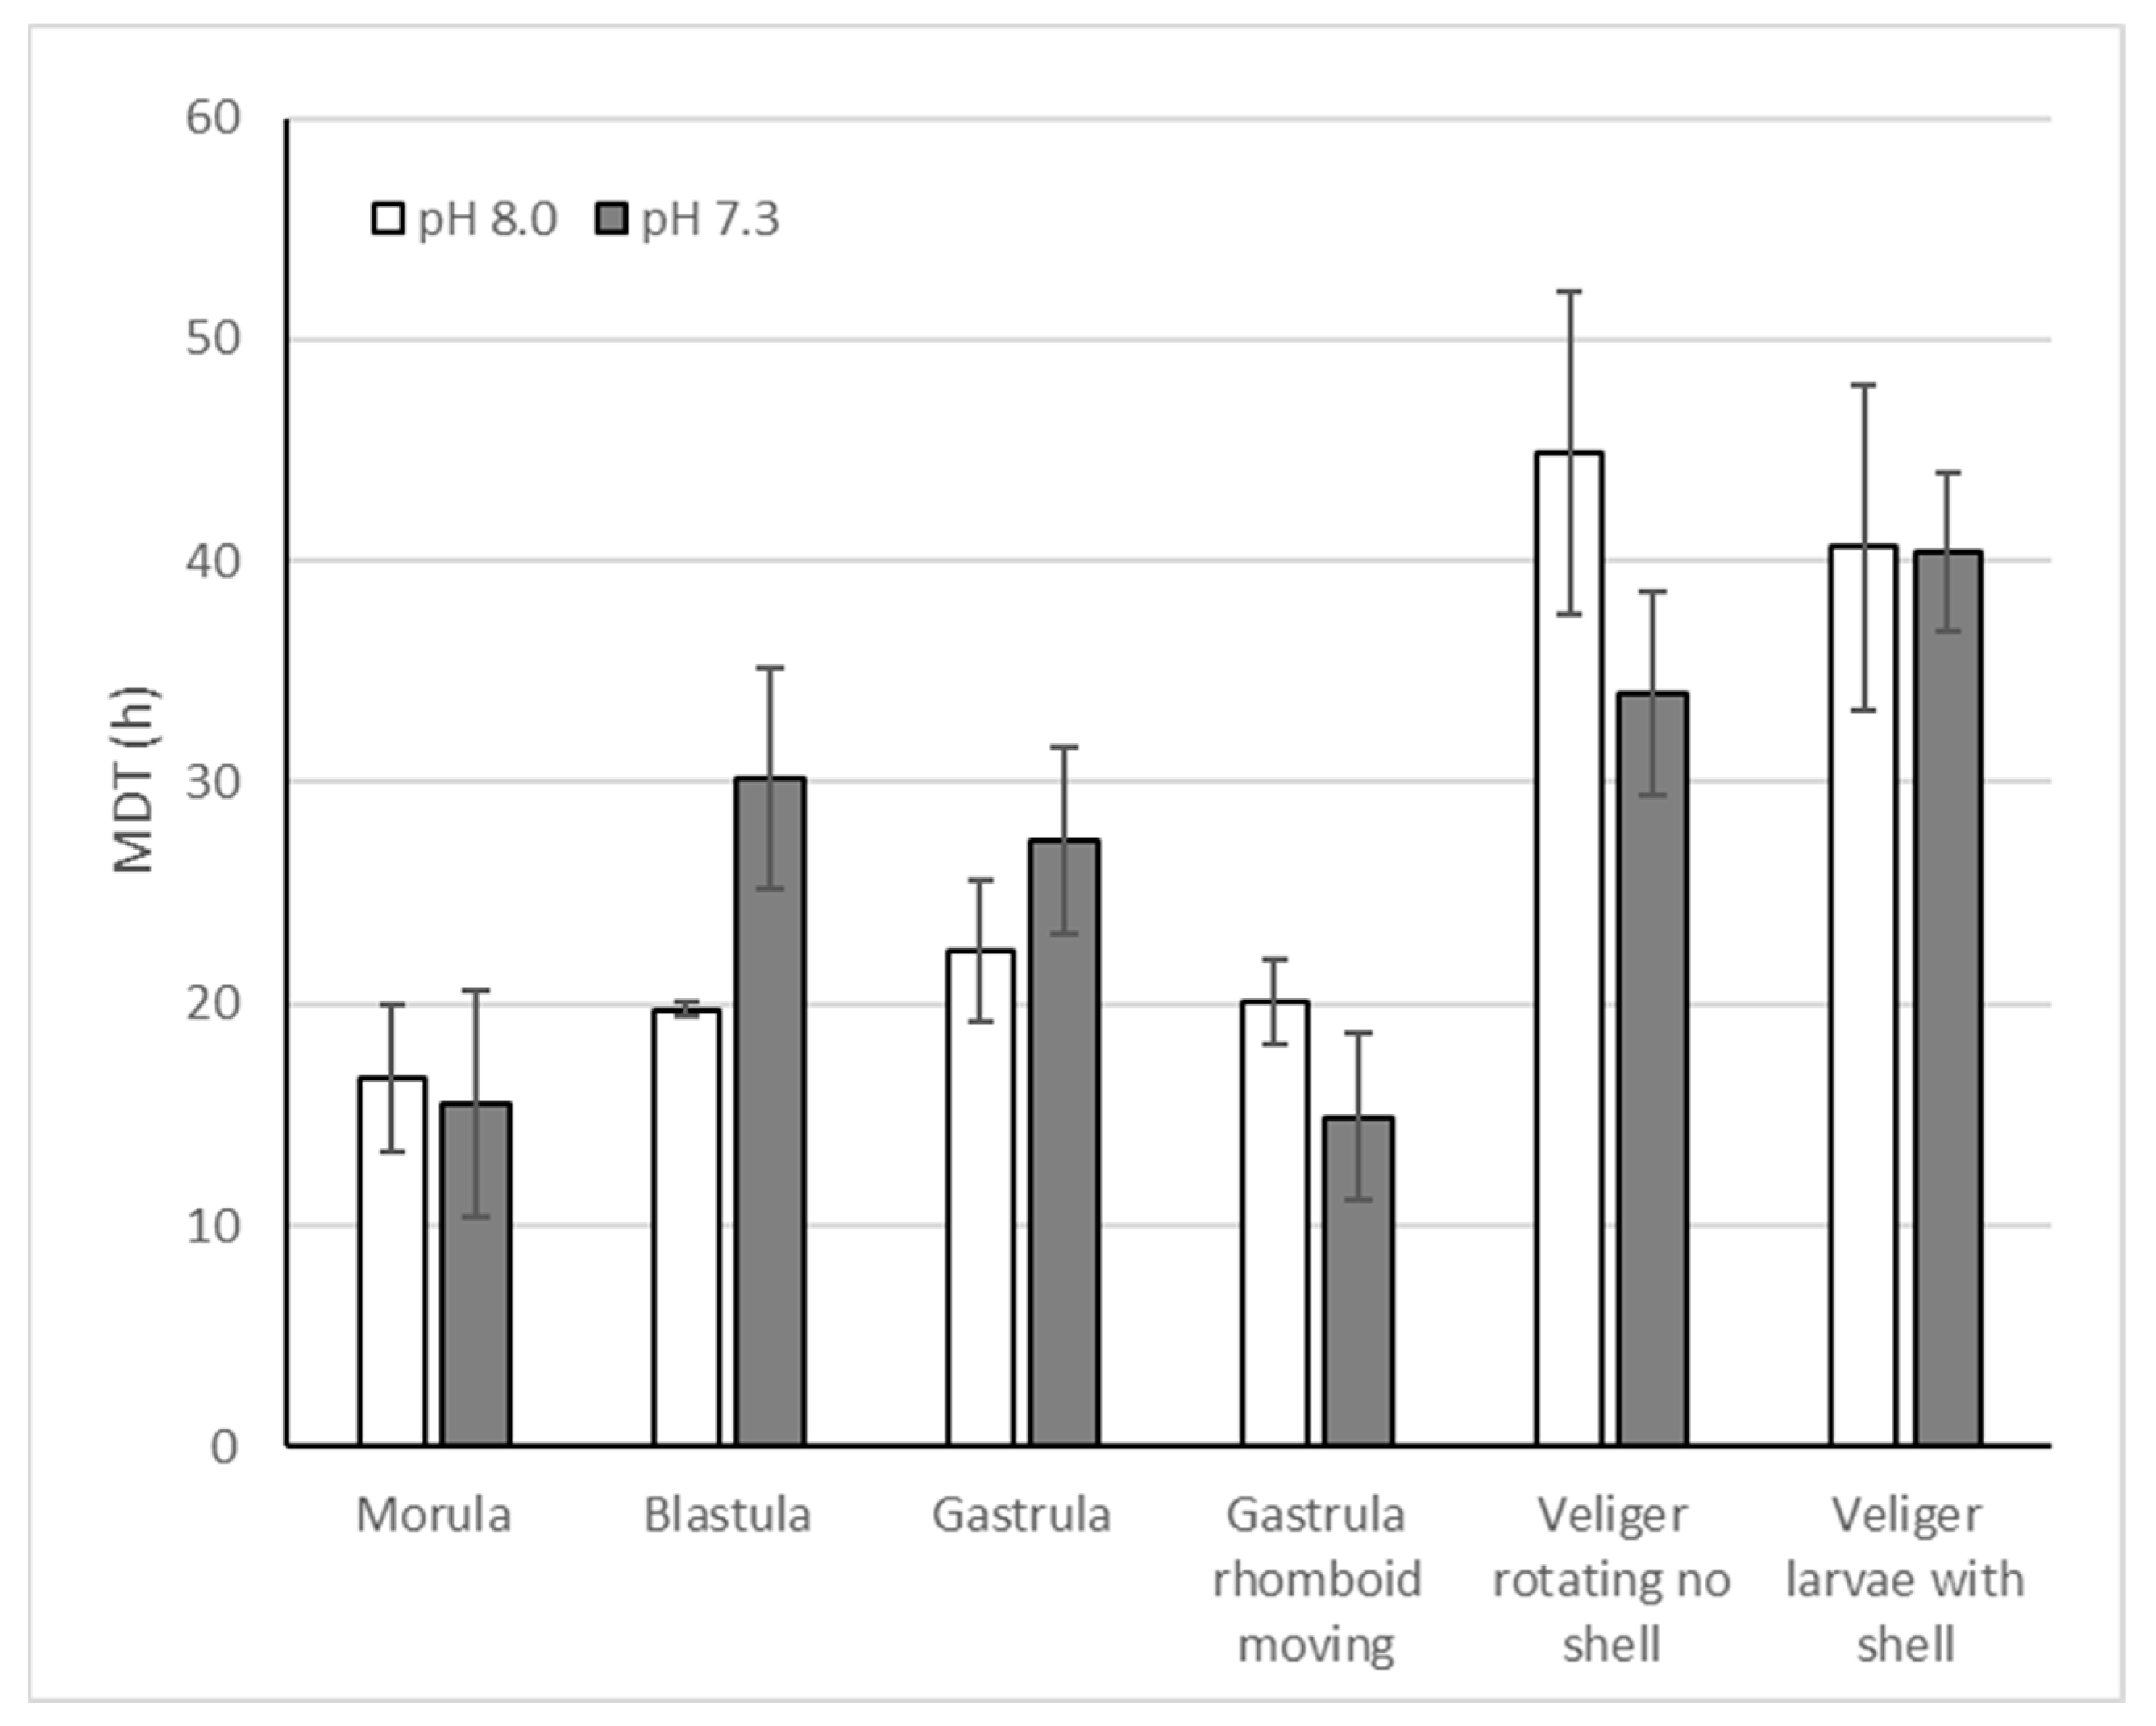
Mean developmental time (MDT in h) for 6 developmental stages from late morula to veliger larvae with shell within egg-string.
Figure 7.
Mean developmental time (MDT in h) for 6 developmental stages from late morula to veliger larvae with shell within egg-string.
Figure 8.
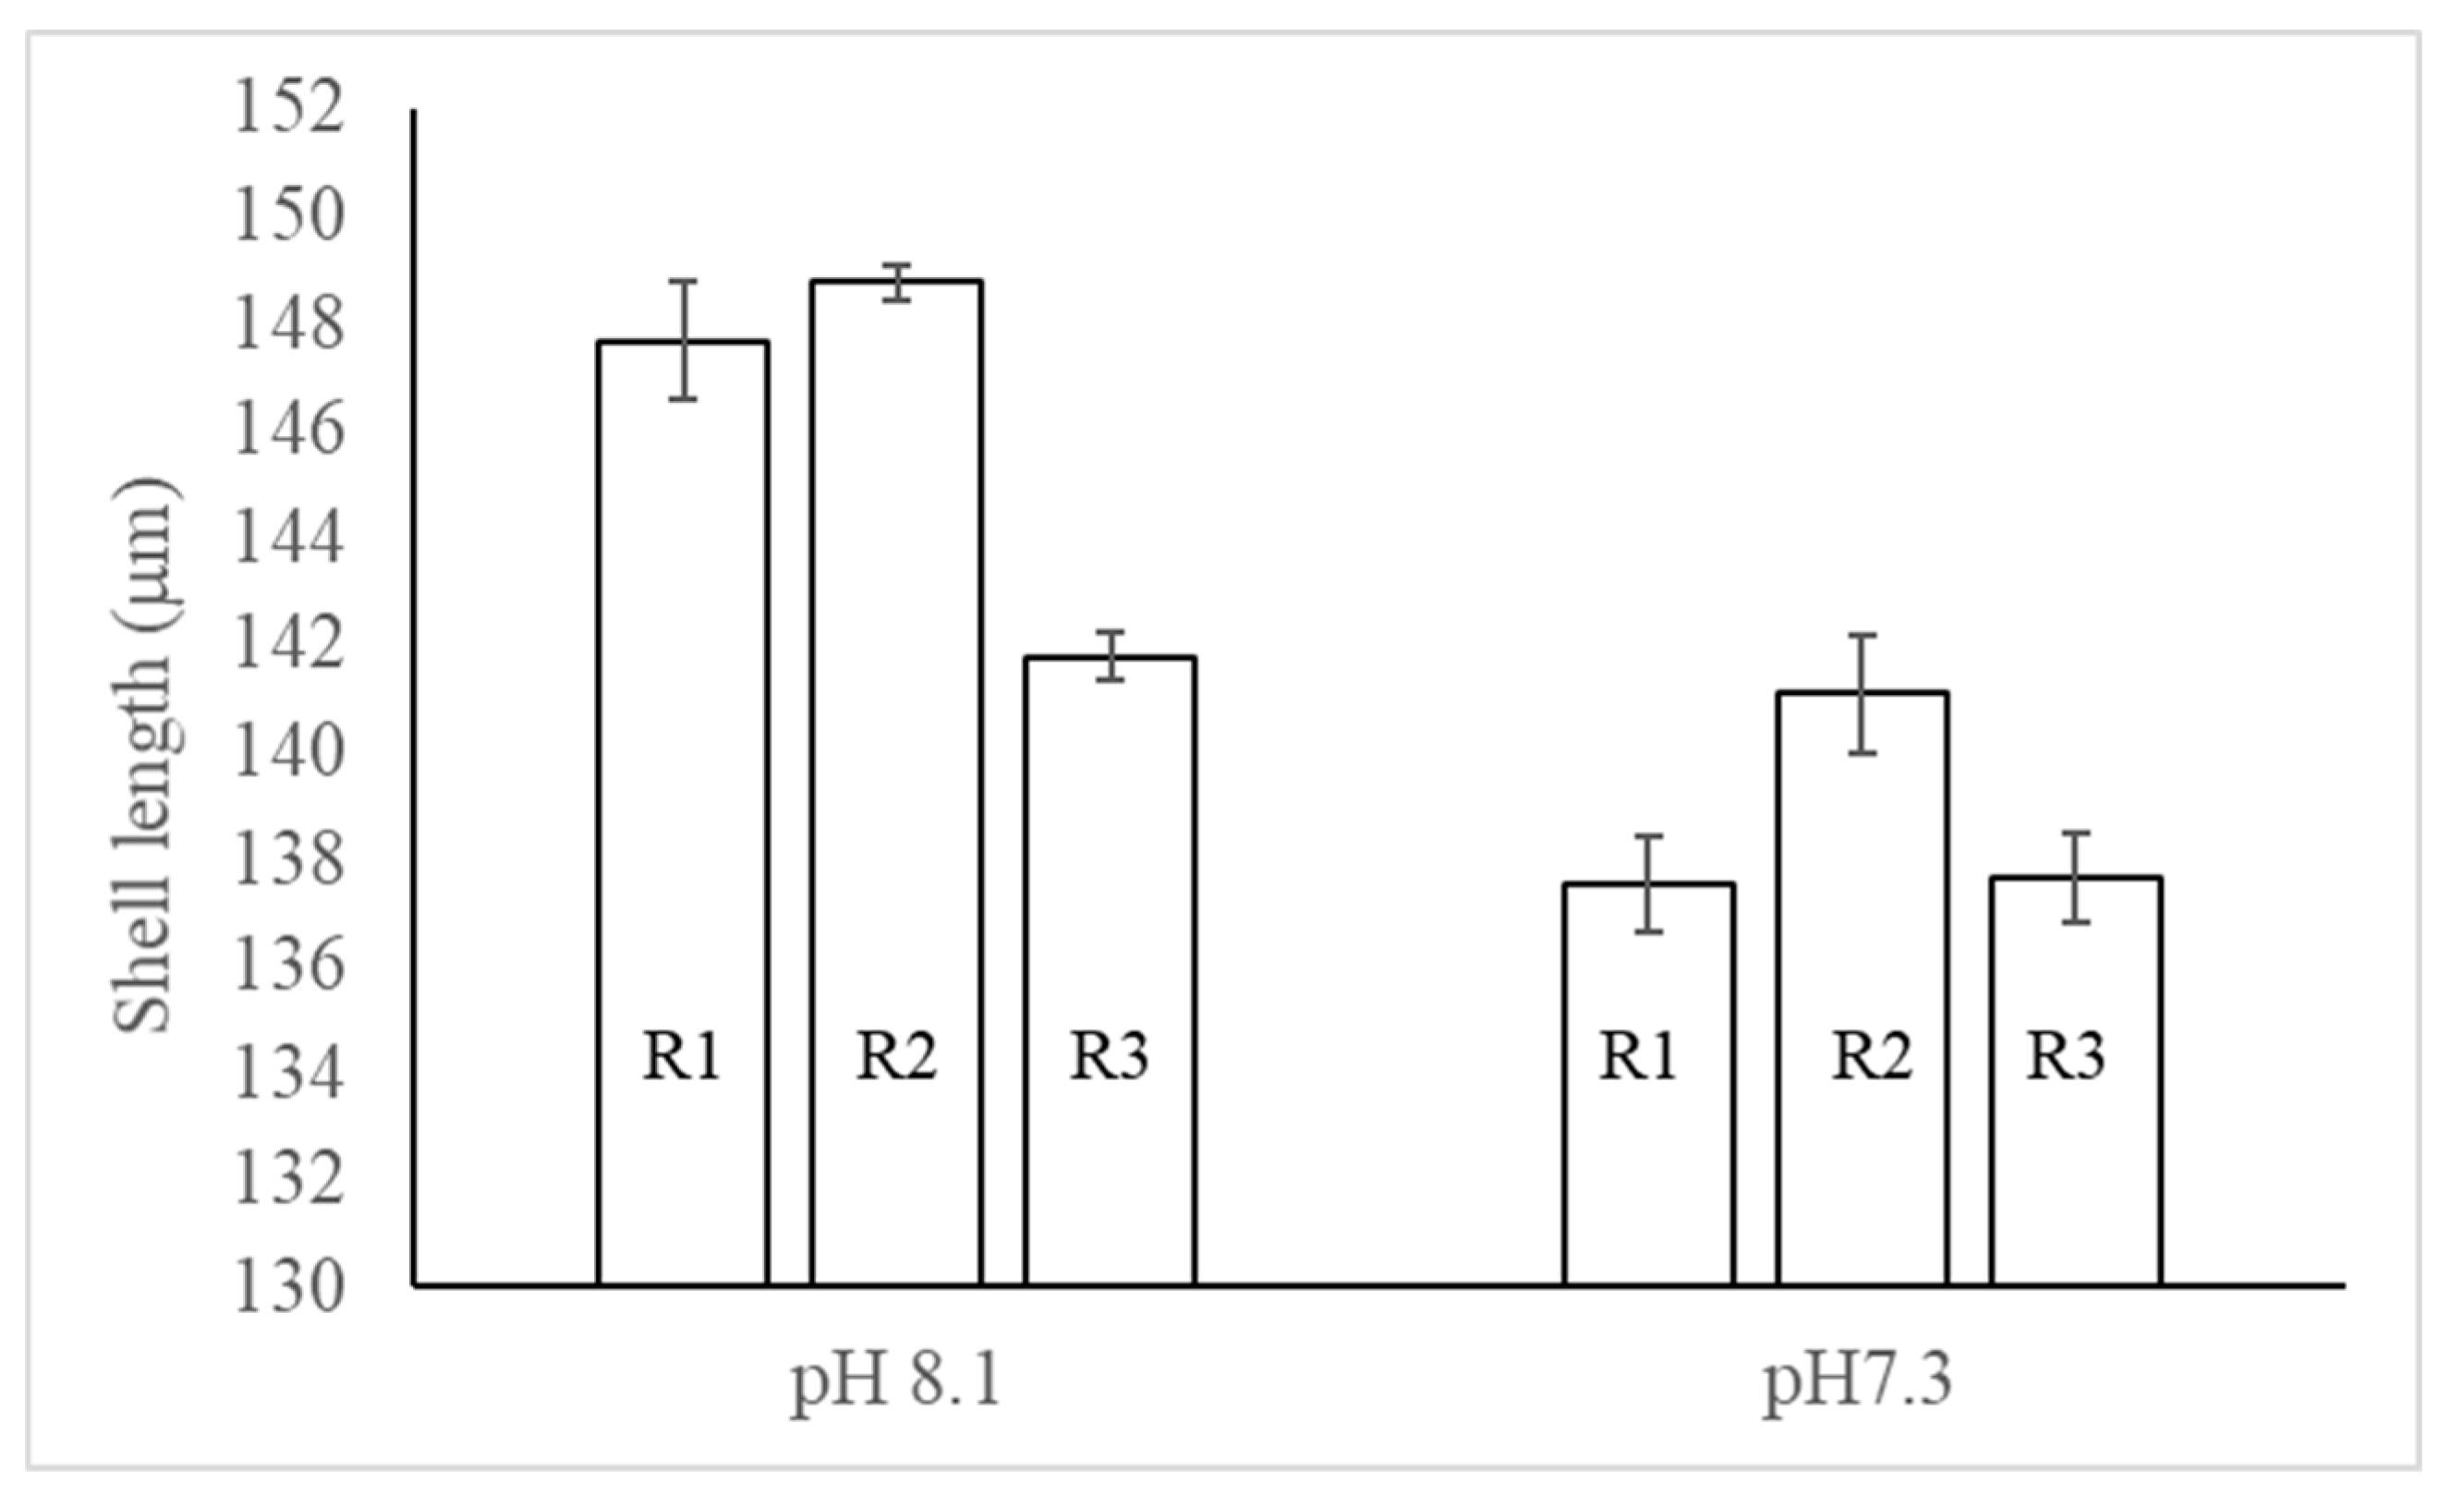
Shell length (in mm) measured within 3 days post-hatching in 6 strings: 3 replicates (R1, R2, R3) and 2 pH (8.1, 7.3).
Figure 8.
Shell length (in mm) measured within 3 days post-hatching in 6 strings: 3 replicates (R1, R2, R3) and 2 pH (8.1, 7.3).
Figure 9.
Significant linear relationship between the larval shell length (in mm) and the larval shell width (in mm) measured within 3 days post-hatching for the 2 tested pH (8.1, 7.3). pH 8.1: F1,510=293.31, p<0.0001; pH 7.3: F1,430=417,35, p<0.0001.
Figure 9.
Significant linear relationship between the larval shell length (in mm) and the larval shell width (in mm) measured within 3 days post-hatching for the 2 tested pH (8.1, 7.3). pH 8.1: F1,510=293.31, p<0.0001; pH 7.3: F1,430=417,35, p<0.0001.
Table 1.
Seawater carbonate chemistry parameters presented as mean ± sem. Seawater pH on the total scale (pHT), temperature (18.1±0.6 °C), salinity (31±1) and total alkalinity (2402±11 mmol kg−1) were used to calculate CO2 partial pressure (pCO2; matm) as well as aragonite (Ωca) and calcite (Ωar) saturation states.
| Target pH |
Measured |
Calculated |
| pHT
|
pCO2 (matm) |
Wca |
War |
| pH 8.0 |
8.07±0.02 |
411±20 |
4.38±0.16 |
2.81±0.10 |
| pH 7.3 |
7.31±0.01 |
2739±21 |
0.88±0.01 |
0.57±0.01 |
Table 2.
ANOVA of Mean Development Time as a function of pH for 6 developmental times.
Table 2.
ANOVA of Mean Development Time as a function of pH for 6 developmental times.
| Stage |
F1,5
|
p |
| Morula |
0.04 |
0.86 |
| Blastula |
4.38 |
0.10 |
| Gastrula |
0.86 |
0.41 |
| Gastrula rhomboid moving |
1.56 |
0.28 |
| Veliger rotating no shell |
1.59 |
0.28 |
| Veliger larvae with shell |
0.01 |
0.98 |
